Embed Size (px)
Citation preview

The Science Education in JapanIts Strengths and Weaknesses
Yasushi OguraSaitama University
At “GSEE/Kyoto Summit: Initiatives that Can Change Science Education”
in Kyoto, October 21, 20131

Contents
1. Backgrounds2. Strengths - Achievement3. Motivation to learn4. Teaching5. STEM education
2
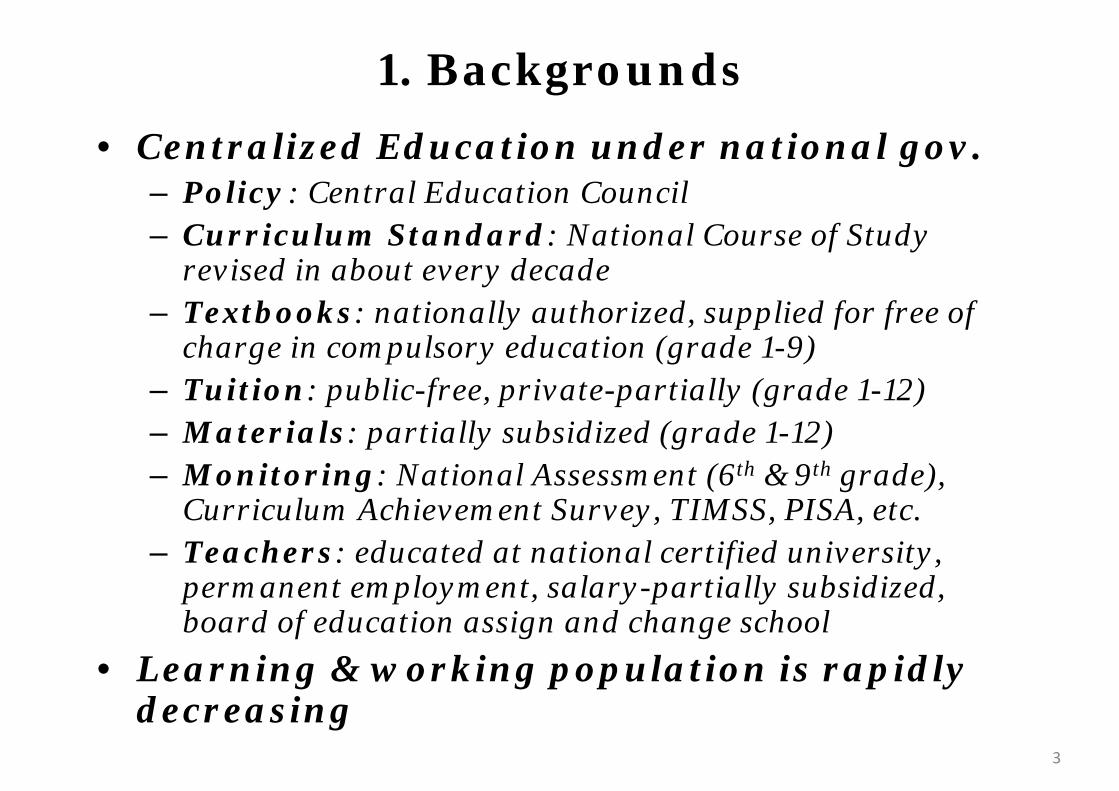
1. Backgrounds• Centralized Education under national gov.
– Policy: Central Education Council– Curriculum Standard: National Course of Study
revised in about every decade– Textbooks: nationally authorized, supplied for free of
charge in compulsory education (grade 1-9)– Tuition: public-free, private-partially (grade 1-12)– Materials: partially subsidized (grade 1-12)– Monitoring: National Assessment (6th & 9th grade),
Curriculum Achievement Survey, TIMSS, PISA, etc. – Teachers: educated at national certified university,
permanent employment, salary-partially subsidized, board of education assign and change school
• Learning & working population is rapidly decreasing
3

4
The size of 65 years and over aged population will not be changed.

5
The size of 65 years and over aged population will not be changed.
The size of 65 years and over aged population will not be changed.
The size of 15 to 64 years “working” population will constantly decrease about 10% per every decade.Society needs more new work force year by year.
The size of 0 to 14 years “learning” population will decrease much faster. Education should become more effective to develop human resources for the society.
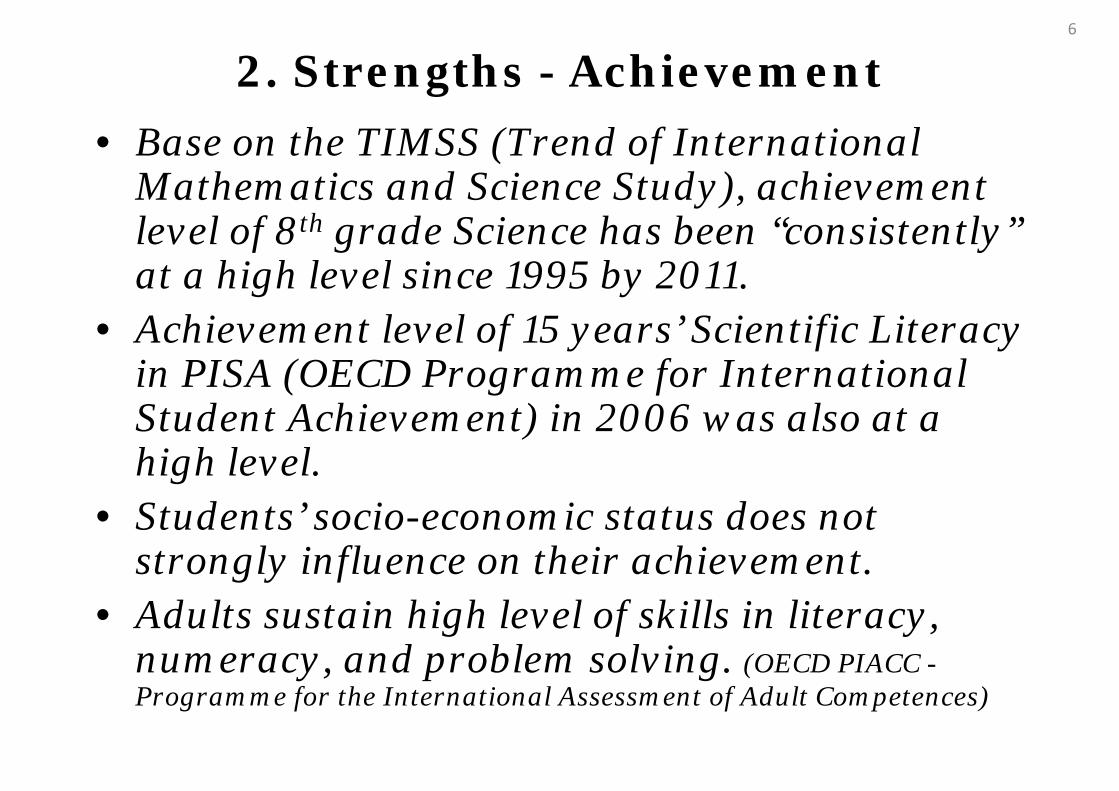
2. Strengths - Achievement• Base on the TIMSS (Trend of International
Mathematics and Science Study), achievement level of 8th grade Science has been “consistently” at a high level since 1995 by 2011.
• Achievement level of 15 years’ Scientific Literacy in PISA (OECD Programme for International Student Achievement) in 2006 was also at a high level.
• Students’ socio-economic status does not strongly influence on their achievement.
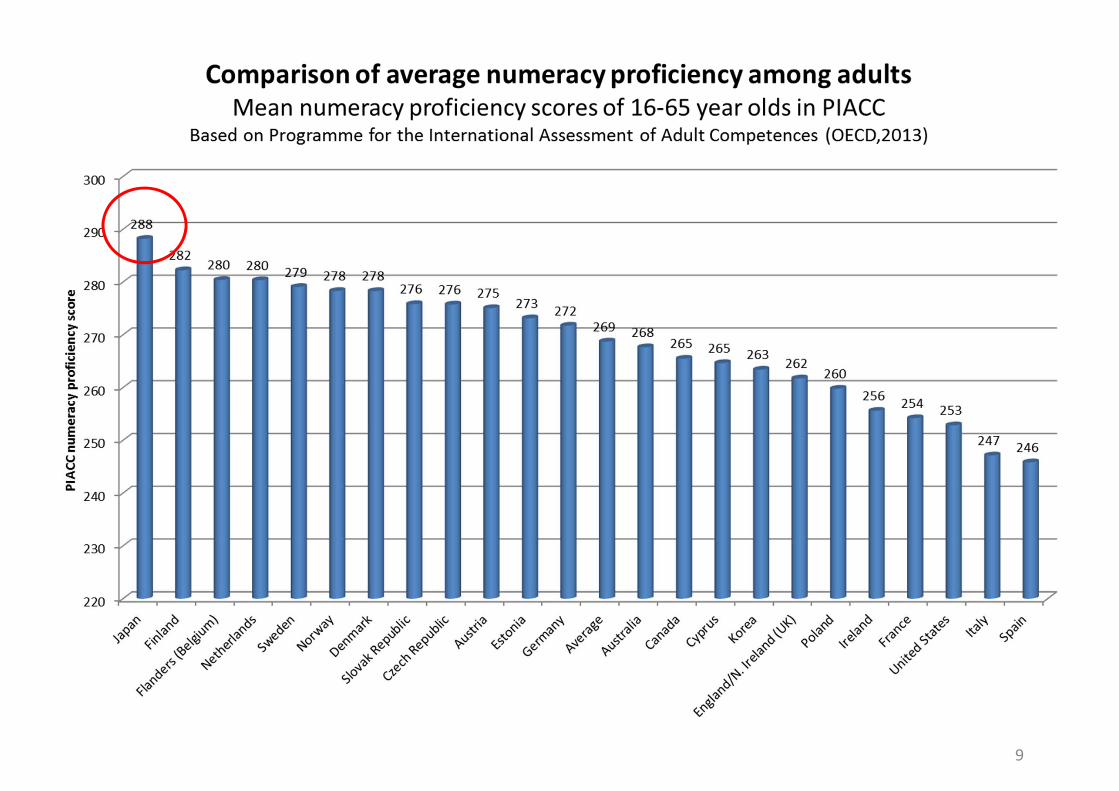
• Adults sustain high level of skills in literacy, numeracy, and problem solving. (OECD PIACC -Programme for the International Assessment of Adult Competences)
6

7
Science Scores in the past TIMSS (8th grade)
Minor problem has been patched so that it won’t become worse. “Controlled stability” exists.

8
Performance in science and the impact of socio-economic backgroundAverage performance of countries on the PISA science scale and the relationship between performance and the index of economic, social and cultural status
Score
Percentage of variance in performance in science explained by the PISA index of economic, social and cultural status (r-squared X 100)
Note: OECD mean used in this figure is the arithmetic average of all OECD countries.Source: OECD PISA 2006 database, Table 4.4a
Strength of the relationship betw eenperformance and socio-economic
background below the OECD averageimpact
Strength of the relationship betw eenperformance and socio-economic
background above the OECD averageimpact
Strength of the relationship betw eenperformance and socio-economic
background not statisticallysignificantly different from the OECD
average impact
Sweden
Portugal
Bulgaria
Czech Republic
Japan
Hong Kong-China
Montenegro
Greece
Chinese Taipei
Thailand
Azerbaijan
Estonia
UruguayChile
Indonesia
Spain
Brazil
Romania
Argentina
Russian Federation
Liechtenstein
Belgium
Lithuania
Austria
Canada
Latvia
New Zealand
Mexico
Jordan
Croatia
Ireland
Colombia
United KingdomAustralia
United States
Finland
Iceland
Tunisia
Israel
Kyrgyzstan
Norway
Slovenia
HungaryMacao-China
Poland
Turkey
Netherlands
Serbia
ItalyLuxembourg
Denmark
Slovak Republic
Korea
France
Switzerland
Germany
300
350
400
450
500
550
600
0102030
Below-average level of student performance in scienceBelow-average impact of socio-economic background
Below-average level of student performance in scienceAbove-average impact of socio-economic background
Above-average level of student performance in scienceAbove-average impact of socio-economic background Above-average level of student performance in science
Below-average impact of socio-economic background
OECD mean
Achievement level of 15 years’ Scientific Literacy in PISA2006 is above average and less socio-economic impact among OECD.
Students’ socio‐economic status does not strongly
influence.
9
3. Motivation to learn
• Science is liked by more Japanese students than other subjects, but
• studying science seems less important than studying other subjects.
• Level of “Instrumental Motivation to Learn Science” is low. Studying science seems useless.
• Level of students’ “Self-efficacy in Science” is low. Using science seems difficult.
10
11
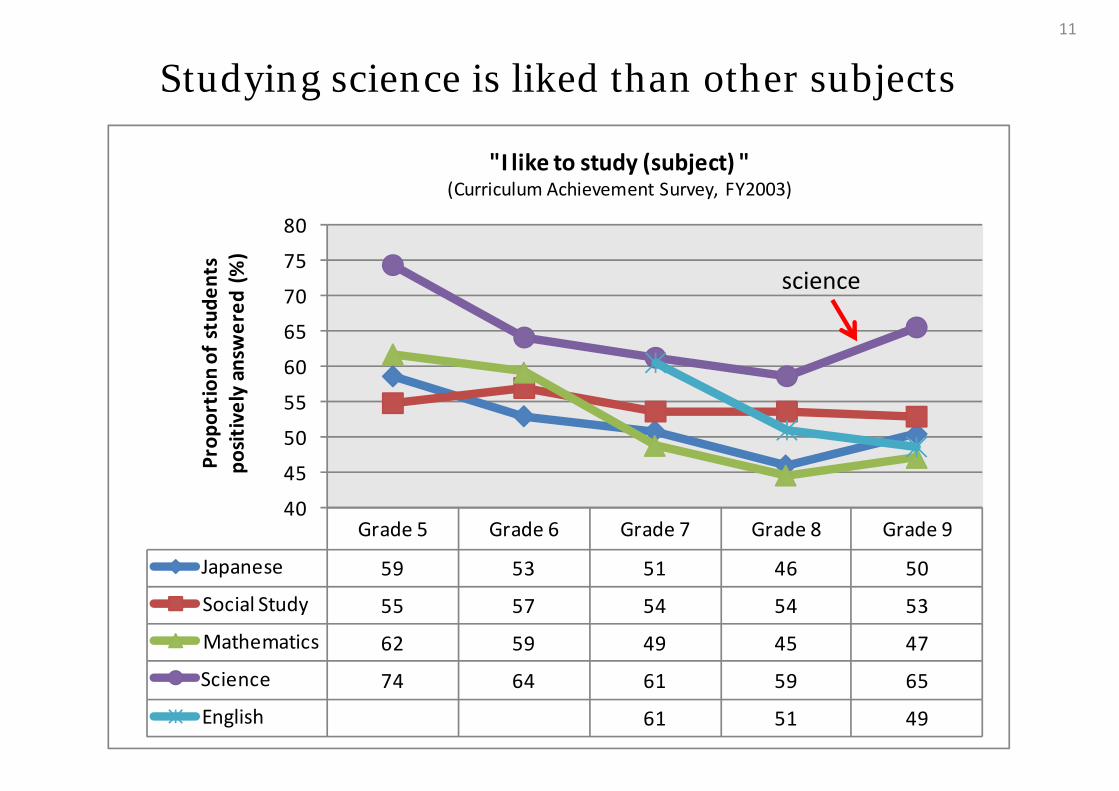
Studying science is liked than other subjects
Grade 5 Grade 6 Grade 7 Grade 8 Grade 9
Japanese 59 53 51 46 50
Social Study 55 57 54 54 53
Mathematics 62 59 49 45 47
Science 74 64 61 59 65
English 61 51 49
40
45
50
55
60
65
70
75
80Prop
ortio
n of stude
nts
positively answ
ered
(%)
"I like to study (subject) " (Curriculum Achievement Survey, FY2003)
science

12
Studying science is less important than other subjects
Grade 5 Grade 6 Grade 7 Grade 8 Grade 9
Japanese 79 79 77 76 79
Social Study 74 73 63 60 69
Mathematics 83 84 77 71 66
Science 68 63 57 54 55
English 79 78 81
50
55
60
65
70
75
80
85
90Prop
ortio
n of stude
nts
positively answ
ered
(%)
"Studying (subject) is important regardless of entrance examination." (Curriculum Achievement Survey, FY2003)
science

13Level of students’ “Instrumental Motivation to Learn Science” is low at 9th grade and drops at 10th grade.
Result of PISA2006 student questions on “Instrumental Motivation to Learn Science”
A) I study school science because I know it is useful for me. B) Making an effort in my school science subject(s) is worth it because this will help me in the work I want to do later on.C) Studying my school science subject(s) is worthwhile for me because what I learn will improve my career prospects.D) I will learn many things in my school science subject(s) that will help me get a job. E) What I learn in my school science subject(s) is important for me because I need this for what I want to study later on.
A B C D EMexico 86 86 85 79 82 84Portugal 84 75 81 76 78 79Turkey 73 80 73 69 79 75United States 77 78 70 70 68 73Canada 75 73 72 69 63 71Poland 73 68 73 66 71 70Italy 76 66 72 63 64 68United Kingdom 75 71 71 65 54 67New Zealand 71 69 68 66 56 66Ireland 73 67 68 67 54 66Greece 70 65 63 58 61 63Australia 69 66 64 62 55 63Spain 66 66 63 62 54 62Iceland 65 62 60 57 64 62Denmark 67 64 61 54 60 61OECD average 67 63 61 56 56 60Hungary 66 69 53 53 55 59Sweden 62 62 63 52 55 59France 67 59 61 48 52 57Germany 66 58 55 50 48 55Norway 60 56 59 48 53 55Luxembourg 61 57 54 49 48 54Slovak Republic 62 55 56 52 43 54Belgium 57 56 55 48 48 53Netherlands 62 54 56 44 46 52Czech Republic 62 50 49 47 52 52Finland 63 53 51 48 43 52Korea 55 57 52 46 45 51Switzerland 60 54 49 41 44 50Japan at 9th grade 51 51 47 43 48 48Austria 55 44 47 38 36 44Japan at 10th grade 42 47 41 39 42 42
CountryPercentage of students agreeing or strongly agreeing with the
following statements average
Studying science seems useless for
Japanese students.
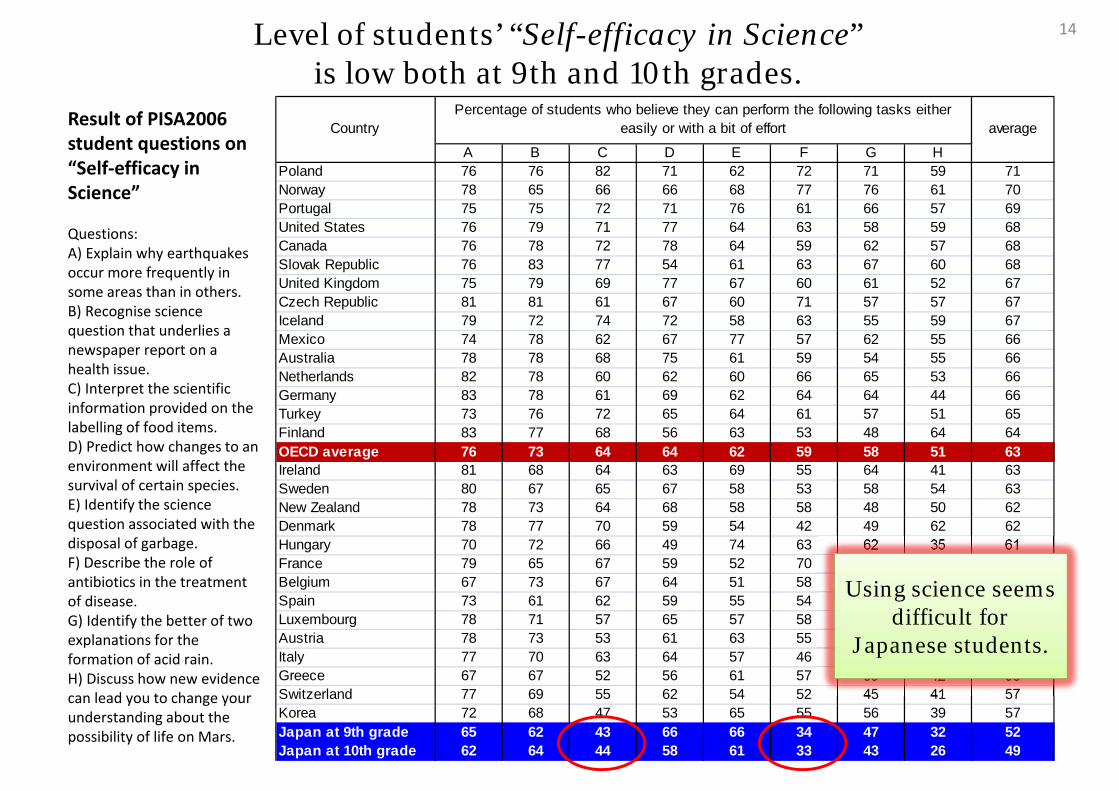
14Level of students’ “Self-efficacy in Science” is low both at 9th and 10th grades.
Result of PISA2006 student questions on “Self‐efficacy in Science”
Questions:A) Explain why earthquakes occur more frequently in some areas than in others.B) Recognise science question that underlies a newspaper report on a health issue.C) Interpret the scientific information provided on the labelling of food items.D) Predict how changes to an environment will affect the survival of certain species.E) Identify the science question associated with the disposal of garbage.F) Describe the role of antibiotics in the treatment of disease.G) Identify the better of two explanations for the formation of acid rain.H) Discuss how new evidence can lead you to change your understanding about the possibility of life on Mars.
A B C D E F G HPoland 76 76 82 71 62 72 71 59 71Norway 78 65 66 66 68 77 76 61 70Portugal 75 75 72 71 76 61 66 57 69United States 76 79 71 77 64 63 58 59 68Canada 76 78 72 78 64 59 62 57 68Slovak Republic 76 83 77 54 61 63 67 60 68United Kingdom 75 79 69 77 67 60 61 52 67Czech Republic 81 81 61 67 60 71 57 57 67Iceland 79 72 74 72 58 63 55 59 67Mexico 74 78 62 67 77 57 62 55 66Australia 78 78 68 75 61 59 54 55 66Netherlands 82 78 60 62 60 66 65 53 66Germany 83 78 61 69 62 64 64 44 66Turkey 73 76 72 65 64 61 57 51 65Finland 83 77 68 56 63 53 48 64 64OECD average 76 73 64 64 62 59 58 51 63Ireland 81 68 64 63 69 55 64 41 63Sweden 80 67 65 67 58 53 58 54 63New Zealand 78 73 64 68 58 58 48 50 62Denmark 78 77 70 59 54 42 49 62 62Hungary 70 72 66 49 74 63 62 35 61France 79 65 67 59 52 70 43 54 61Belgium 67 73 67 64 51 58 57 52 61Spain 73 61 62 59 55 54 61 56 60Luxembourg 78 71 57 65 57 58 49 44 60Austria 78 73 53 61 63 55 58 36 60Italy 77 70 63 64 57 46 56 46 60Greece 67 67 52 56 61 57 59 42 58Switzerland 77 69 55 62 54 52 45 41 57Korea 72 68 47 53 65 55 56 39 57Japan at 9th grade 65 62 43 66 66 34 47 32 52Japan at 10th grade 62 64 44 58 61 33 43 26 49
CountryPercentage of students who believe they can perform the following tasks either
easily or with a bit of effort average
Using science seems difficult for
Japanese students.

4. Teaching
• “Inquiry Based Science Teaching” enhances students’ “General Interest in Learning Science”, however, “Inquiry Based Science Teaching” mostly disappears from the upper secondary education.
• Science lesson is rarely taught in connected with “real life”.
• Teaching science becomes more teacher-centered in upper secondary education.
• Lack of lesson time is the most difficult obstacle for high-school teachers to teach inquiry based science, but much time is used for preparation for entrance examination
15
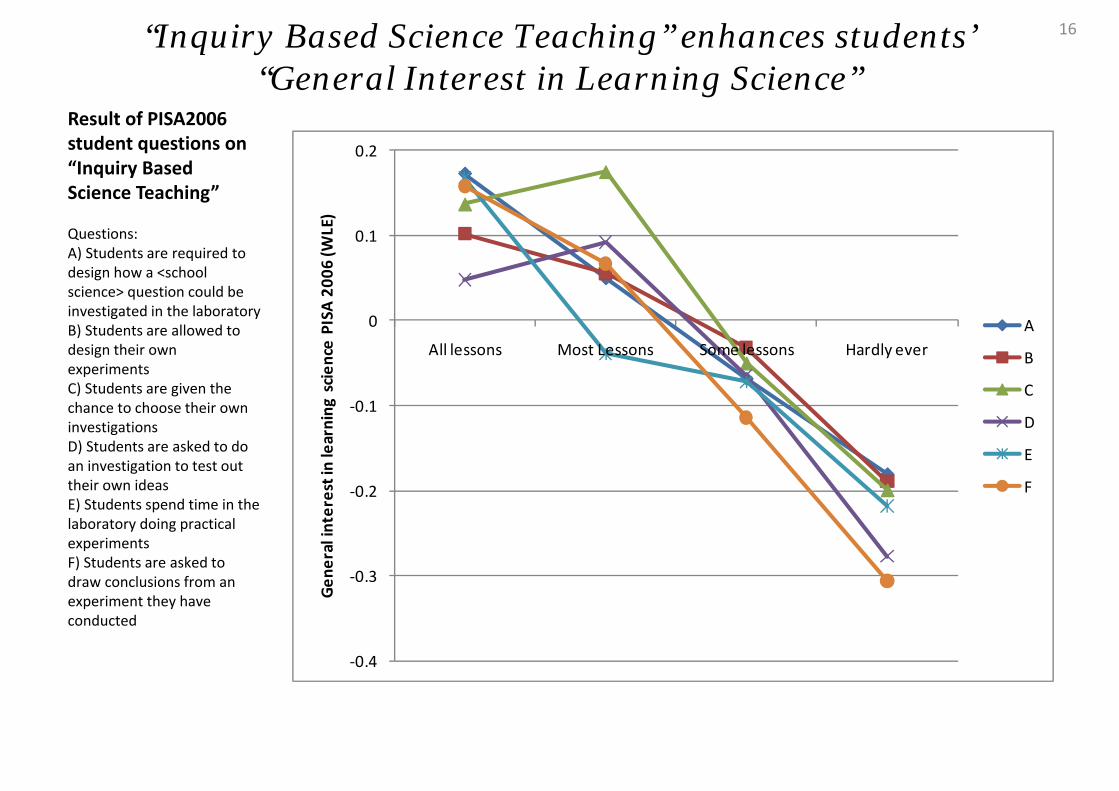
16“Inquiry Based Science Teaching” enhances students’ “General Interest in Learning Science”
Result of PISA2006 student questions on “Inquiry Based Science Teaching”
Questions:A) Students are required to design how a <school science> question could be investigated in the laboratoryB) Students are allowed to design their own experimentsC) Students are given the chance to choose their own investigationsD) Students are asked to do an investigation to test out their own ideasE) Students spend time in the laboratory doing practical experimentsF) Students are asked to draw conclusions from an experiment they have conducted
‐0.4
‐0.3
‐0.2
‐0.1
0
0.1
0.2
All lessons Most Lessons Some lessons Hardly everGe
neral interest in learning
scie
nce PISA
200
6 (W
LE)
A
B
C
D
E
F

17“Inquiry Based Science Teaching” mostly disappears from the upper secondary education
Result of PISA2006 student questions on “Inquiry Based Science Teaching”
Questions:A) Students are required to design how a <school science> question could be investigated in the laboratoryB) Students are allowed to design their own experimentsC) Students are given the chance to choose their own investigationsD) Students are asked to do an investigation to test out their own ideasE) Students spend time in the laboratory doing practical experimentsF) Students are asked to draw conclusions from an experiment they have conducted
A B C D E FTurkey 27 42 45 42 28 53 39Mexico 34 34 34 47 35 60 37United States 45 30 28 38 45 69 35Portugal 25 28 28 36 13 53 29Greece 26 23 33 33 20 53 29Japan at 9th grade 22 17 15 47 32 52 25Canada 33 18 18 29 28 66 25Denmark 51 13 11 14 61 63 22Australia 28 16 16 26 25 65 21United Kingdom 36 14 12 23 27 67 21Switzerland 22 18 17 23 23 61 20OECD average 22 17 16 23 22 51 19France 23 17 16 22 23 68 19Italy 16 16 20 24 17 36 19New Zealand 26 14 12 22 23 58 19Poland 14 16 16 28 8 59 18Germany 25 14 16 19 22 65 18Sweden 21 19 13 18 28 61 18Luxembourg 19 16 16 20 19 49 18Norway 26 13 13 16 24 49 17Slovak Republic 13 18 16 21 12 37 17Netherlands 26 13 12 17 30 51 17Austria 20 12 14 18 16 38 16Ireland 23 10 13 17 35 62 16Spain 14 13 12 20 8 48 15Korea 13 13 12 13 9 26 13Czech Republic 10 13 8 18 9 37 12Japan at 10th grade 9 9 8 22 10 26 12Belgium 11 12 12 14 12 49 12Hungary 8 12 10 17 9 34 12Iceland 15 9 6 12 7 26 10Finland 10 5 7 14 22 55 9
CountryPercentage of students answered "In all lessons" or "In most lessons" with
the following statements average

18Science lesson is rarely taught in connected with “real life”
Result of PISA2006 student questions on “Science Lessons taught in Connected with Real Life”
A) The students are asked to apply a <school science> concept to everyday problemsB) The teacher explains how a <school science> idea can be applied to a number of different phenomenaC) The teacher uses <school science> to help students understand the world outside schoolD) The teacher clearly explains the relevance of <broad science> concepts to our livesE) The teacher uses examples of technological application to show how <school science> is relevant to society
A B C D EUnited States 50 68 58 57 50 57Canada 50 72 53 58 49 56Greece 40 63 54 60 48 53Mexico 43 67 45 57 51 53Portugal 38 61 53 60 49 52Australia 39 66 49 55 41 50New Zealand 38 66 48 51 37 48Denmark 36 73 45 44 37 47Switzerland 30 65 45 49 41 46Turkey 39 56 42 46 45 46Poland 32 69 34 48 39 45United Kingdom 33 59 40 45 33 42Ireland 26 61 45 47 30 42France 32 65 37 43 32 42OECD average 30 59 38 46 34 41Iceland 23 67 36 49 29 41Hungary 20 61 43 49 28 40Sweden 28 62 34 41 32 39Italy 27 50 36 48 32 39Spain 24 56 30 47 36 39Austria 21 56 38 44 33 38Germany 25 57 38 39 31 38Belgium 26 61 33 38 32 38Norway 25 56 37 42 28 38Luxembourg 21 55 34 41 30 36Finland 25 61 31 41 20 36Slovak Republic 21 45 29 54 26 35Czech Republic 23 51 27 43 33 35Netherlands 26 51 25 42 25 34Japan at 9th grade 22 45 25 36 30 32Korea 21 59 18 35 25 32Japan at 10th grade 11 26 12 19 16 17
CountryPercentage of students answered "In all lessons" or "In most
lessons" with the following statements average

19Science teaching at elementary schools dependsmost on observation and experiments
Based on JST & NIER (2009)

20Teaching science becomes “teacher-centered” in upper secondary education
Based on JST & NIER (2009)

21Lack of lesson hours is the most difficult obstacle for high-school teachers to teach inquiry based science
JST & NIER (2009)
5. STEM education• Relatively small percentage of Japanese
students expect science and technology related professional jobs.
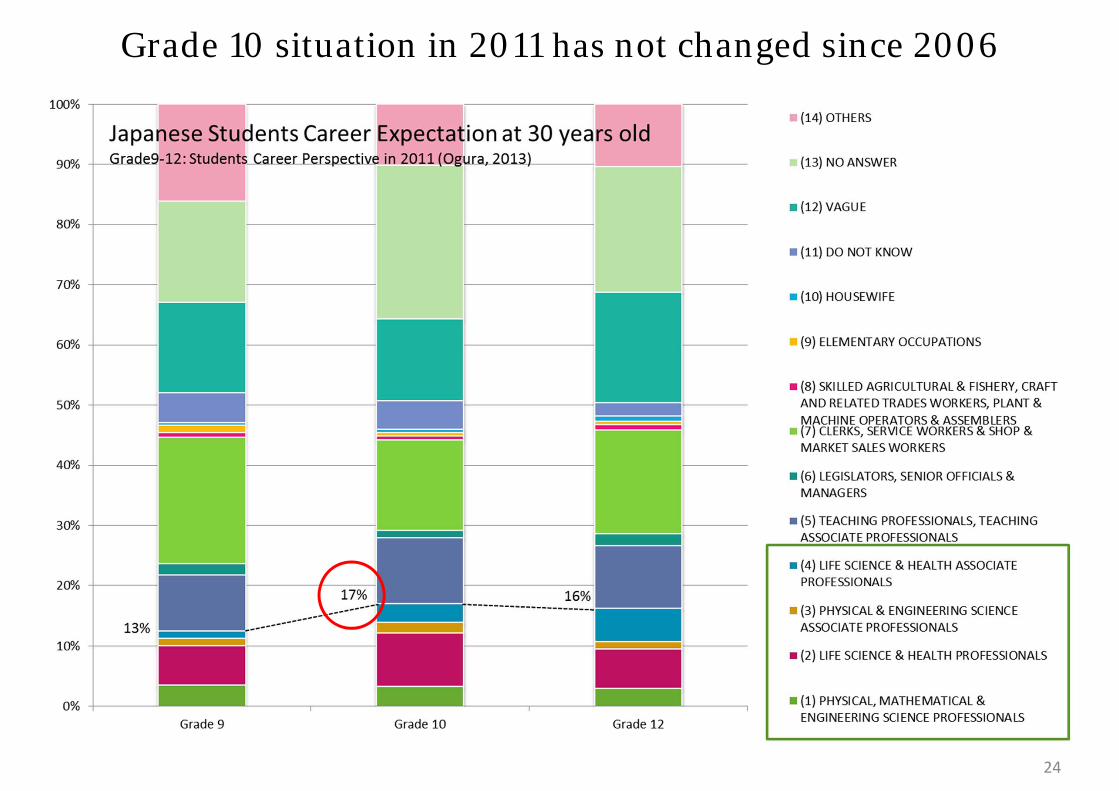
• In spite of various measures to facilitate STEM education, Grade 10 situation in 2011 has not changed since 2006.
22

0.0
5.0
10.0
15.0
20.0
25.0
30.0
35.0
40.0
45.0
50.0 Finland
Macao
‐China
Hungary
Japan
Czech Re
public
Germ
any
Latvia
Israel
Slovak Rep
ublic
Liechten
stein
Austria
Russian Fede
ratio
nKo
rea
Croatia
Estonia
Lithuania
Hong
Kon
g‐Ch
ina
Switzerland
Denm
ark
Romania
Unite
d Kingdo
mSw
eden
Belgium
New Zealand
Netherland
sNo
rway
Luxembo
urg
Bulgaria
Serbia
Turkey
Chinese Taipei
Gree
ceSpain
Australia
Ireland
Argentina
Iceland
France
Poland
Italy
Sloven
iaUruguay
Thailand
Mexico
Tunisia
Canada
Unite
d States
Chile
Brazil
Portugal
Jordan
Colombia
(A) PHYSICAL, MATHEMATICAL & ENGINEERING SCIENCE PROFESSIONALS (B) PHYSICAL & ENGINEERING SCIENCE ASSOCIATE PROFESSIONALS
(C) LIFE SCIENCE & HEALTH PROFESSIONALS (D) LIFE SCIENCE & HEALTH ASSOCIATE PROFESSIONALS
Proportion of students who expect four types of science and technology related professional jobs at 30 years old
Japan develops less proportion of students who expect science and technology related professional jobs
23
Ogura (2009b)
24
Grade 10 situation in 2011 has not changed since 2006
![[PPT]SWOT (Strengths, Weaknesses, Opportunities & …pharmasy.weebly.com/.../0/37303361/swot_analysis_final.pptx · Web viewThe overall evaluation of a company’s strengths, weaknesses,](https://img.pdfslide.us/doc/110x75/5afb31747f8b9ad22090396e/pptswot-strengths-weaknesses-opportunities-viewthe-overall-evaluation-of.jpg)