Embed Size (px)
Citation preview

The Science
Jeff Jeffers
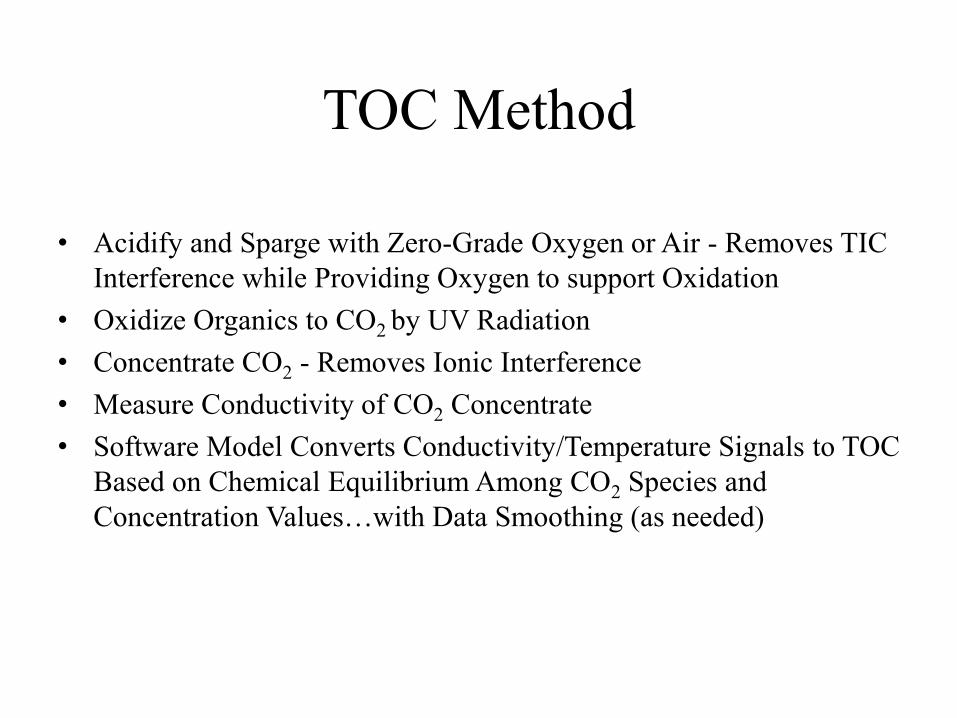
TOC Method
• Acidify and Sparge with Zero-Grade Oxygen or Air - Removes TIC
Interference while Providing Oxygen to support Oxidation
• Oxidize Organics to CO2 by UV Radiation
• Concentrate CO2 - Removes Ionic Interference
• Measure Conductivity of CO2 Concentrate
• Software Model Converts Conductivity/Temperature Signals to TOC
Based on Chemical Equilibrium Among CO2 Species and
Concentration Values…with Data Smoothing (as needed)
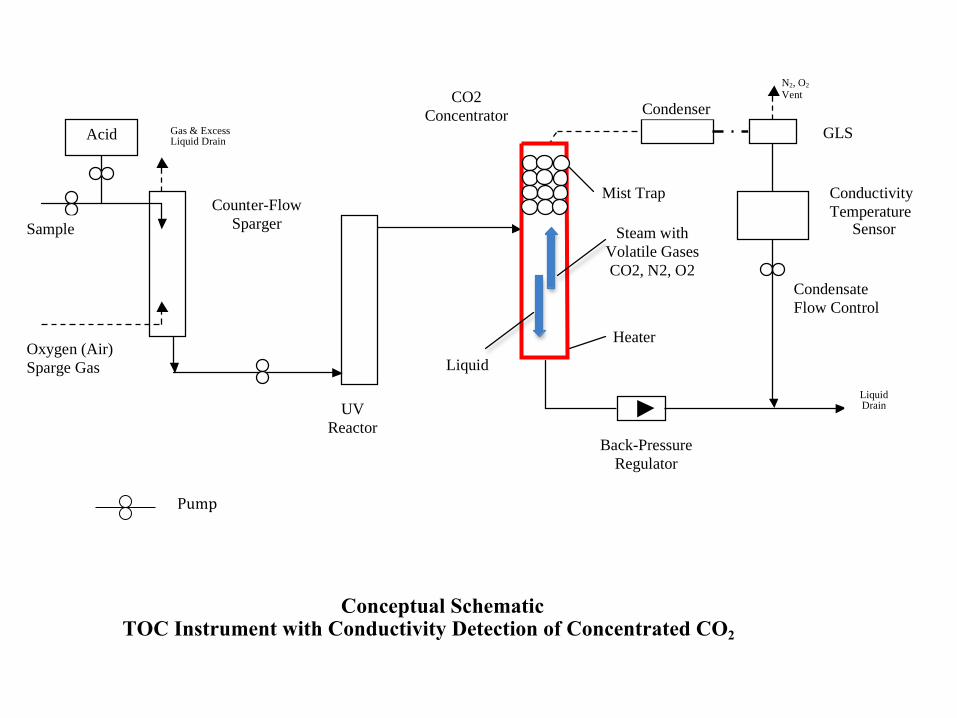
Counter-Flow
Sparger
UV
Reactor
Acid
CO2
Concentrator Condenser
Conductivity
Temperature Sensor
GLS
Back-Pressure
Regulator
Heater
Sample
Oxygen (Air)
Sparge Gas
Conceptual Schematic TOC Instrument with Conductivity Detection of Concentrated CO2
Mist Trap
Gas & Excess Liquid Drain
N2, O2 Vent
Liquid Drain
Condensate
Flow Control
Liquid
Steam with
Volatile Gases
CO2, N2, O2
S
Pump
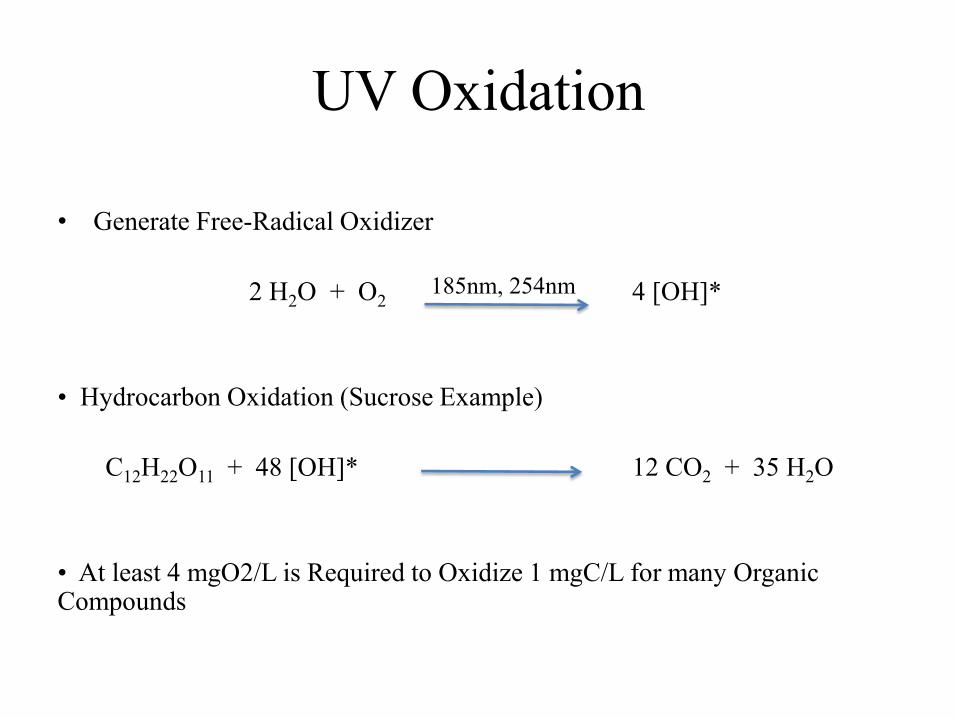
UV Oxidation
• Generate Free-Radical Oxidizer
2 H2O + O2 4 [OH]*
• Hydrocarbon Oxidation (Sucrose Example)
C12H22O11 + 48 [OH]* 12 CO2 + 35 H2O
• At least 4 mgO2/L is Required to Oxidize 1 mgC/L for many Organic Compounds
185nm, 254nm
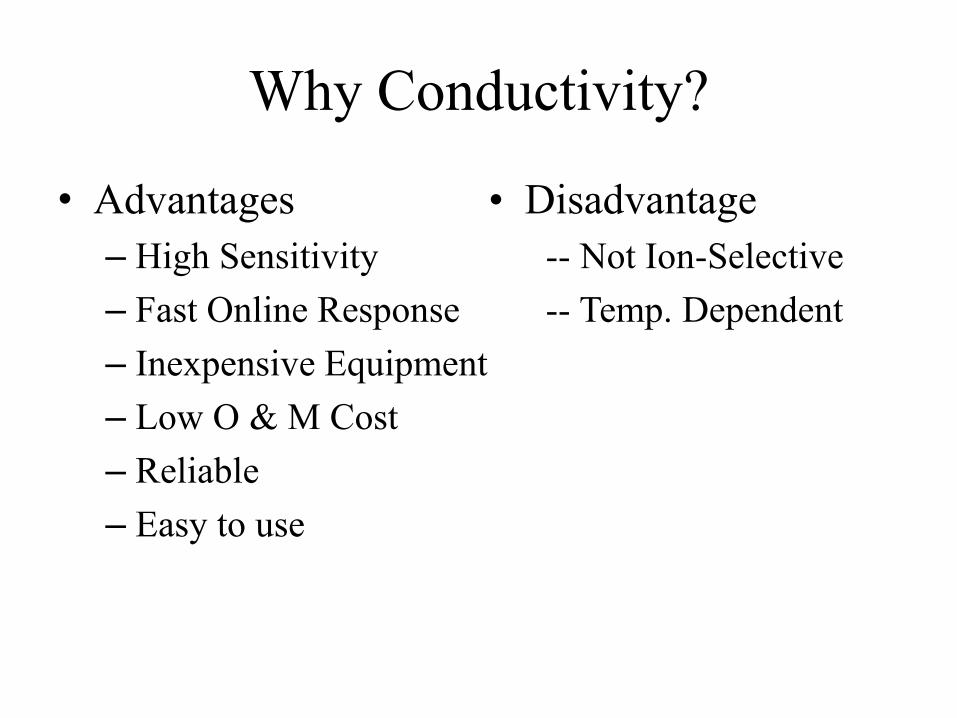
Why Conductivity?
• Advantages • Disadvantage
– High Sensitivity -- Not Ion-Selective
– Fast Online Response -- Temp. Dependent
– Inexpensive Equipment
– Low O & M Cost
– Reliable
– Easy to use
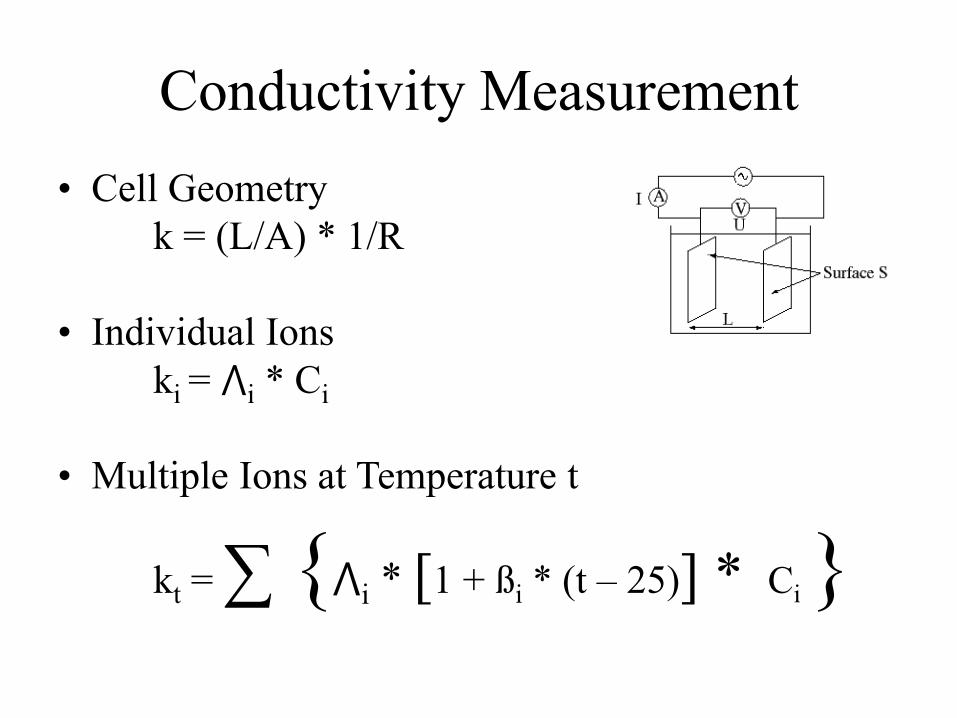
Conductivity Measurement
• Cell Geometry
k = (L/A) * 1/R
• Individual Ions
ki = ⋀i * Ci
• Multiple Ions at Temperature t
kt = ∑ {⋀i * [1 + ßi * (t – 25)] * Ci }
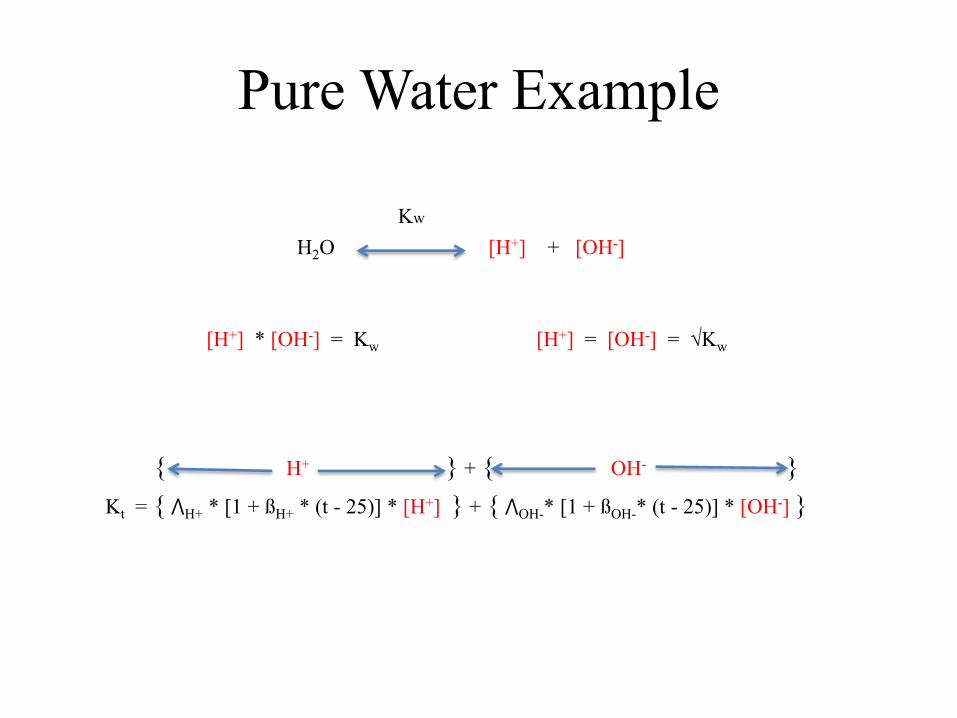
Pure Water Example
Kw
H2O [H+] + [OH-]
[H+] * [OH-] = Kw [H+] = [OH-] = √Kw
{ H+ } + { OH- }
Kt = { ⋀H+ * [1 + ßH+ * (t - 25)] * [H+] } + { ⋀OH-* [1 + ßOH-* (t - 25)] * [OH-] }
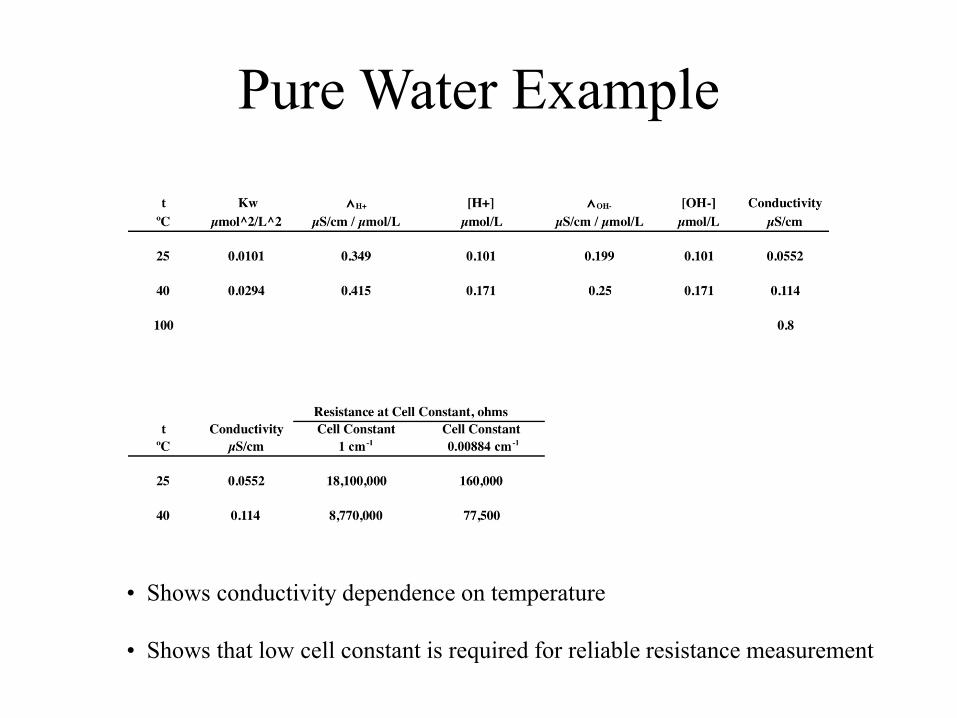
Pure Water Example
• Shows conductivity dependence on temperature
• Shows that low cell constant is required for reliable resistance measurement
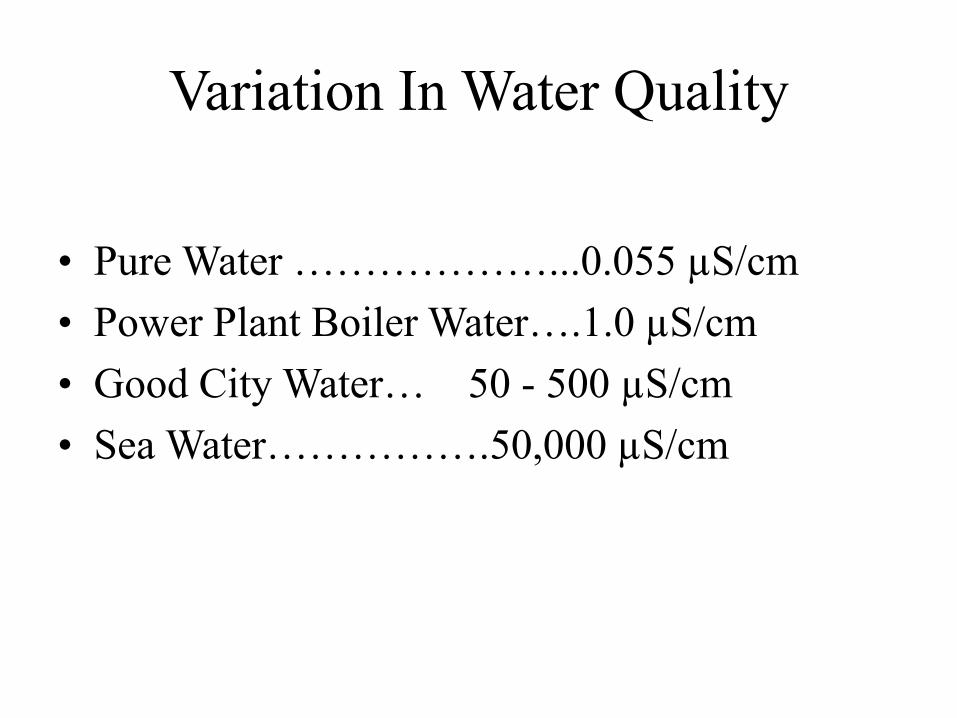
Variation In Water Quality
• Pure Water ………………...0.055 µS/cm
• Power Plant Boiler Water….1.0 µS/cm
• Good City Water… 50 - 500 µS/cm
• Sea Water…………….50,000 µS/cm
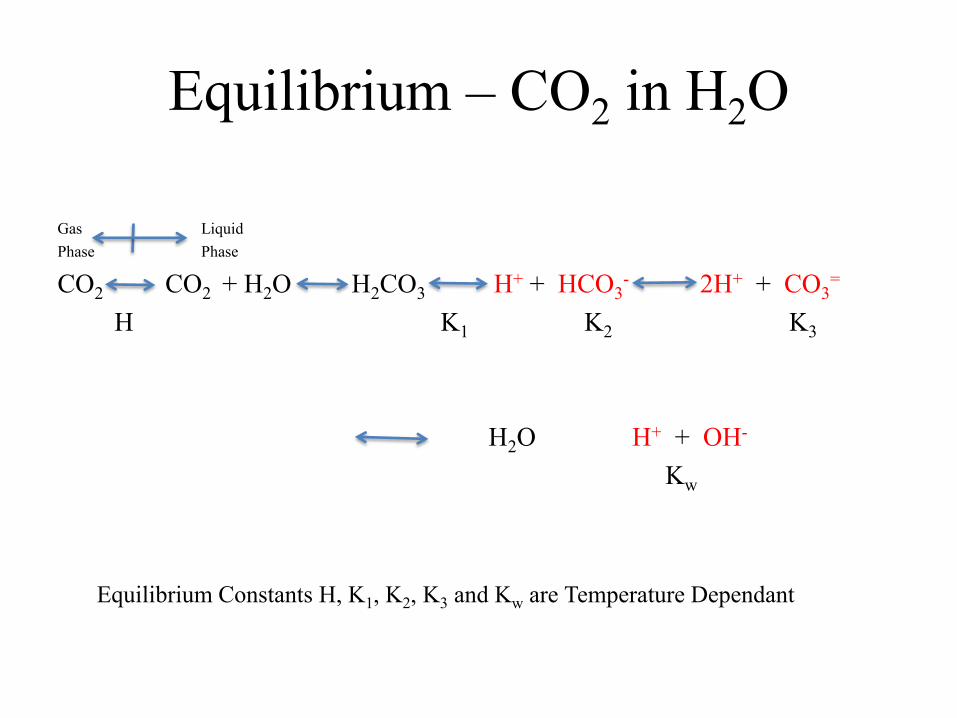
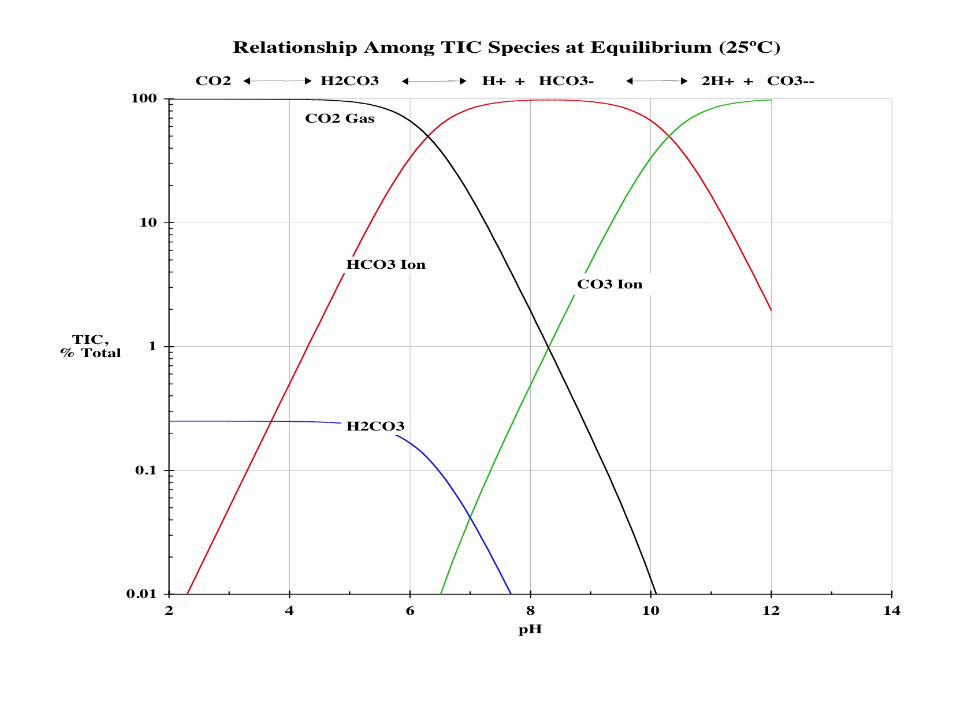
Equilibrium – CO2 in H2O
Gas Liquid
Phase Phase
CO2 CO2 + H2O H2CO3 H+ + HCO3- 2H+ + CO3
=
H K1 K2 K3
H2O H+ + OH-
Kw
Equilibrium Constants H, K1, K2, K3 and Kw are Temperature Dependant
0.0
0.2
0.4
0.6
0.8
1.0
1.2
1.4
1.6
1.8
0 10 20 30 40 50 60 70 80 90 100
Co
nd
uct
ivit
y, µ
S/c
m
Temperature, ºC
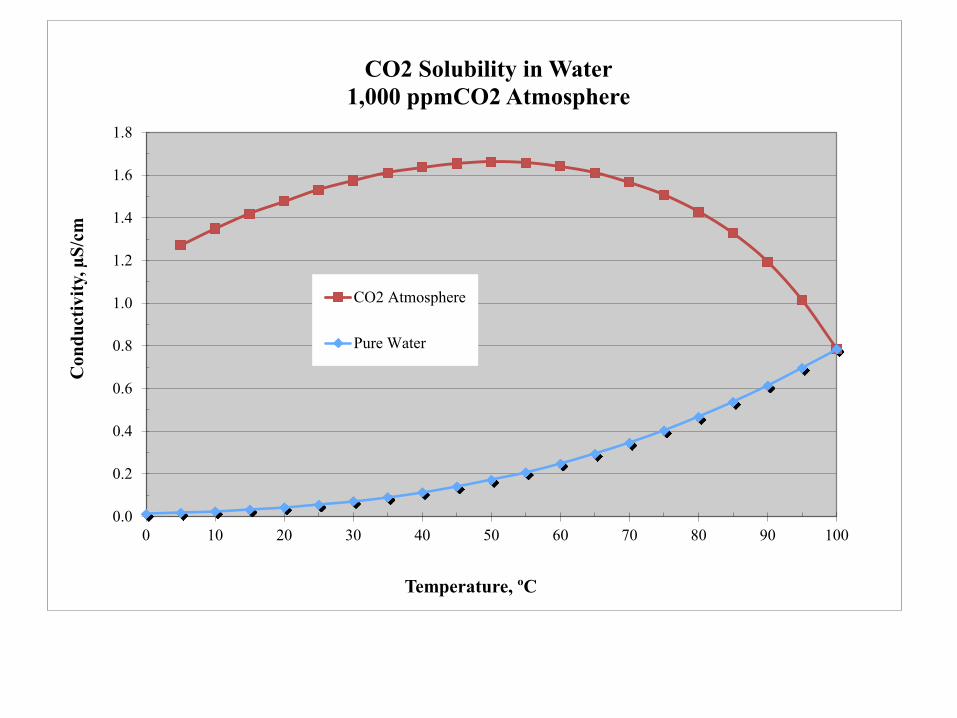
CO2 Solubility in Water
1,000 ppmCO2 Atmosphere
CO2 Atmosphere
Pure Water
0.0
0.5
1.0
1.5
2.0
2.5
3.0
0 500 1000 1500 2000 2500 3000
TIC
, p
pm
C a
nd
Con
du
ctiv
ity, µ
S/c
m
Atmosphere, ppmCO2
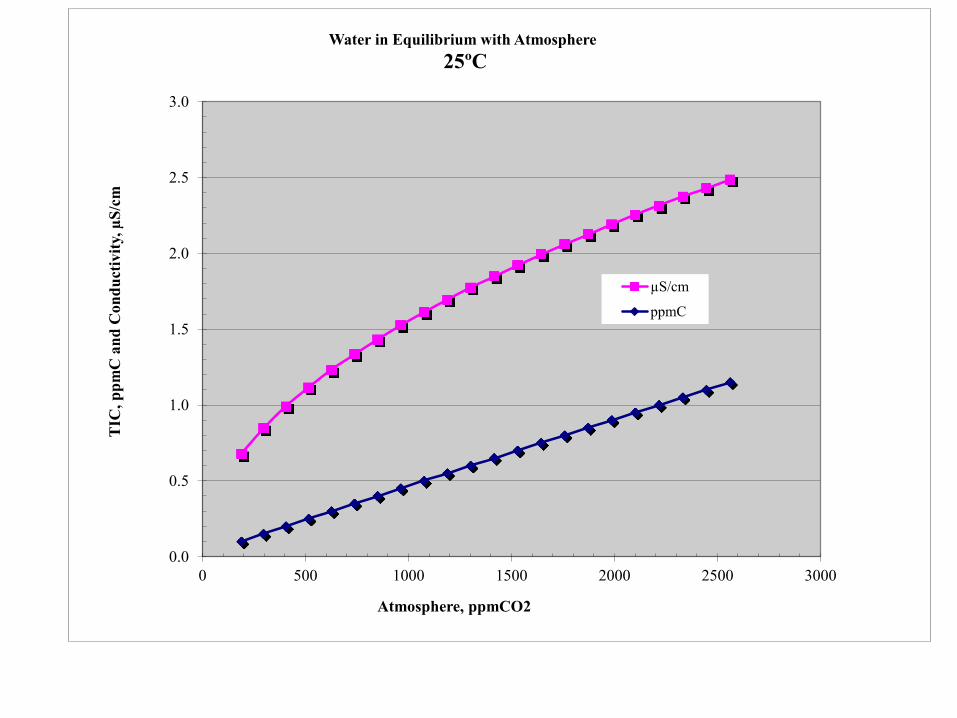
Water in Equilibrium with Atmosphere
25ºC
µS/cm
ppmC
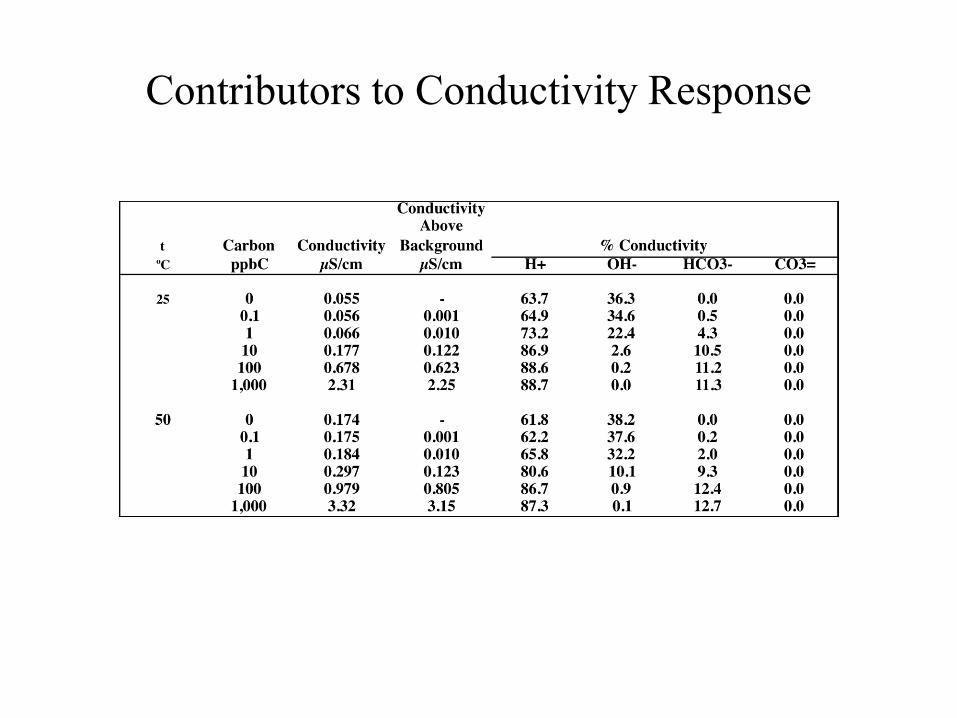
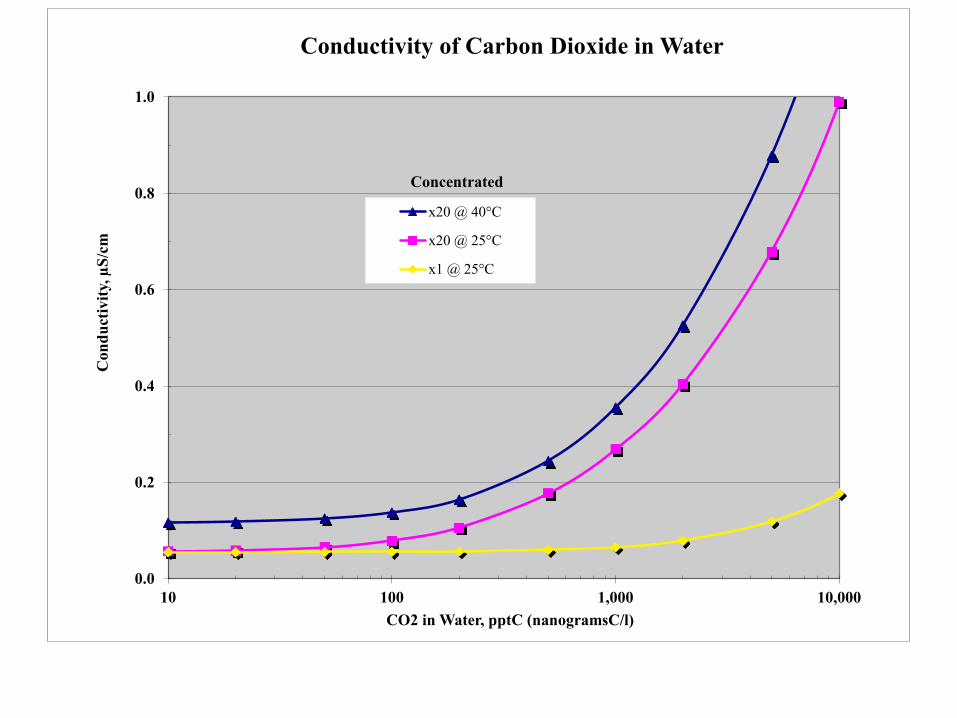
Contributors to Conductivity Response
0.0
0.2
0.4
0.6
0.8
1.0
10 100 1,000 10,000
Con
du
ctiv
ity, µ
S/c
m
CO2 in Water, pptC (nanogramsC/l)
Conductivity of Carbon Dioxide in Water
x20 @ 40°C
x20 @ 25°C
x1 @ 25°C
Concentrated
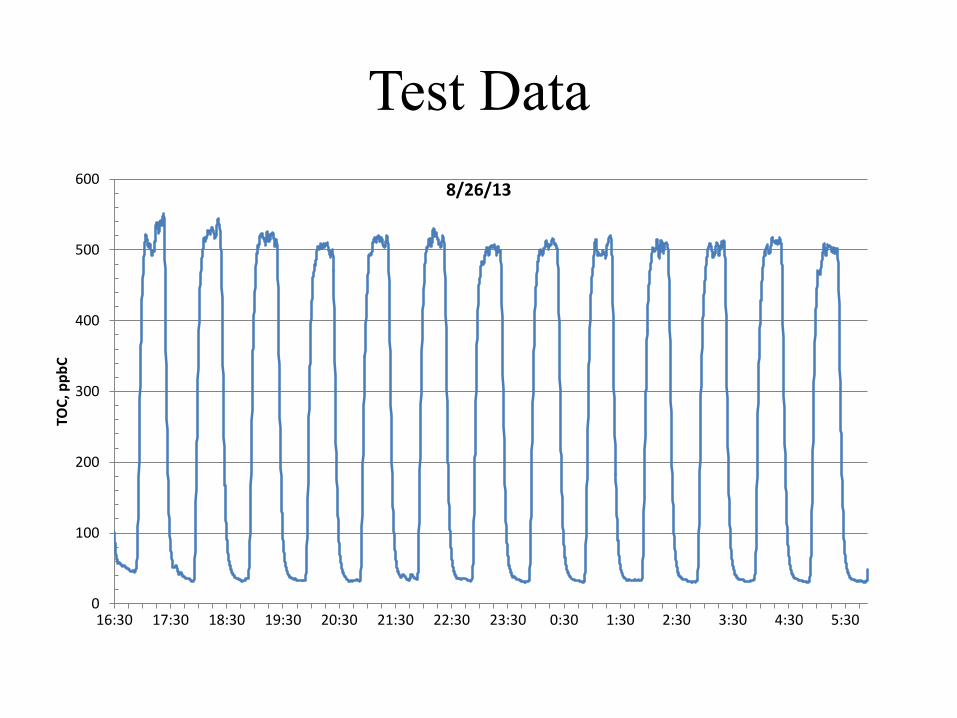
Test Data
0
100
200
300
400
500
600
16:30 17:30 18:30 19:30 20:30 21:30 22:30 23:30 0:30 1:30 2:30 3:30 4:30 5:30
TOC
, pp
bC
8/26/13
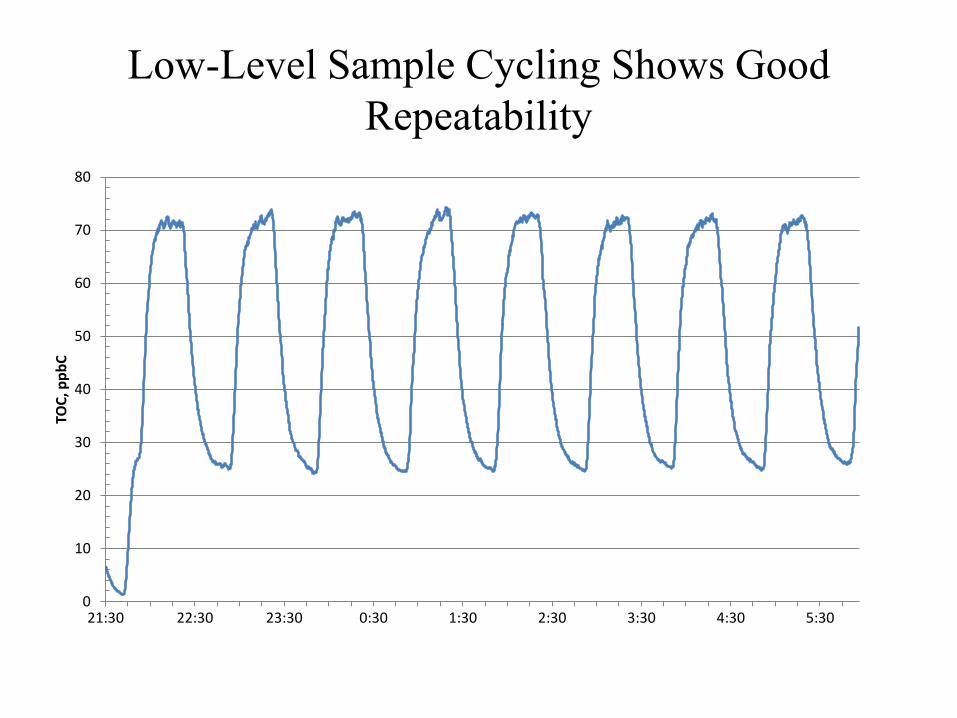
Low-Level Sample Cycling Shows Good
Repeatability
0
10
20
30
40
50
60
70
80
21:30 22:30 23:30 0:30 1:30 2:30 3:30 4:30 5:30
TOC
, pp
bC
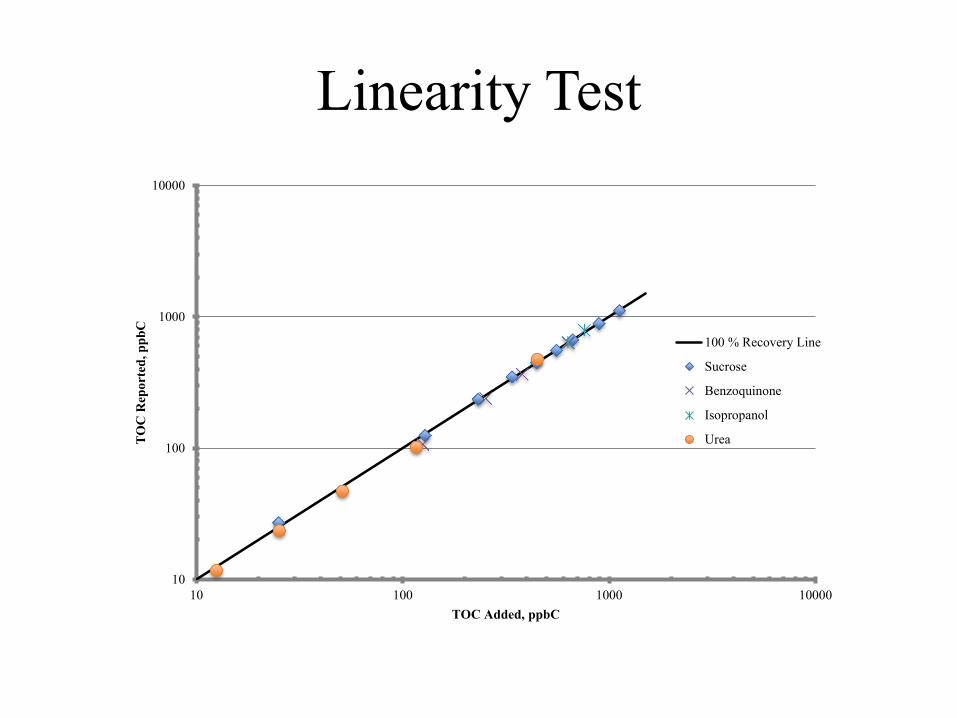
Linearity Test
10
100
1000
10000
10 100 1000 10000
TO
C R
epo
rted
, p
pb
C
TOC Added, ppbC
100 % Recovery Line
Sucrose
Benzoquinone
Isopropanol
Urea
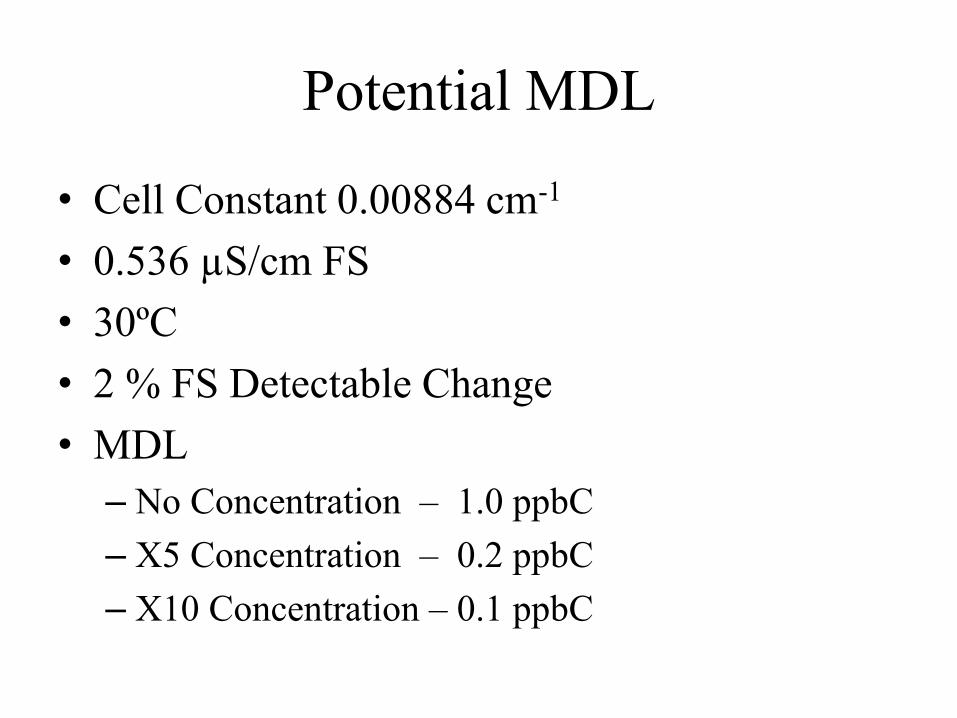
Potential MDL
• Cell Constant 0.00884 cm-1
• 0.536 µS/cm FS
• 30ºC
• 2 % FS Detectable Change
• MDL
– No Concentration – 1.0 ppbC
– X5 Concentration – 0.2 ppbC
– X10 Concentration – 0.1 ppbC
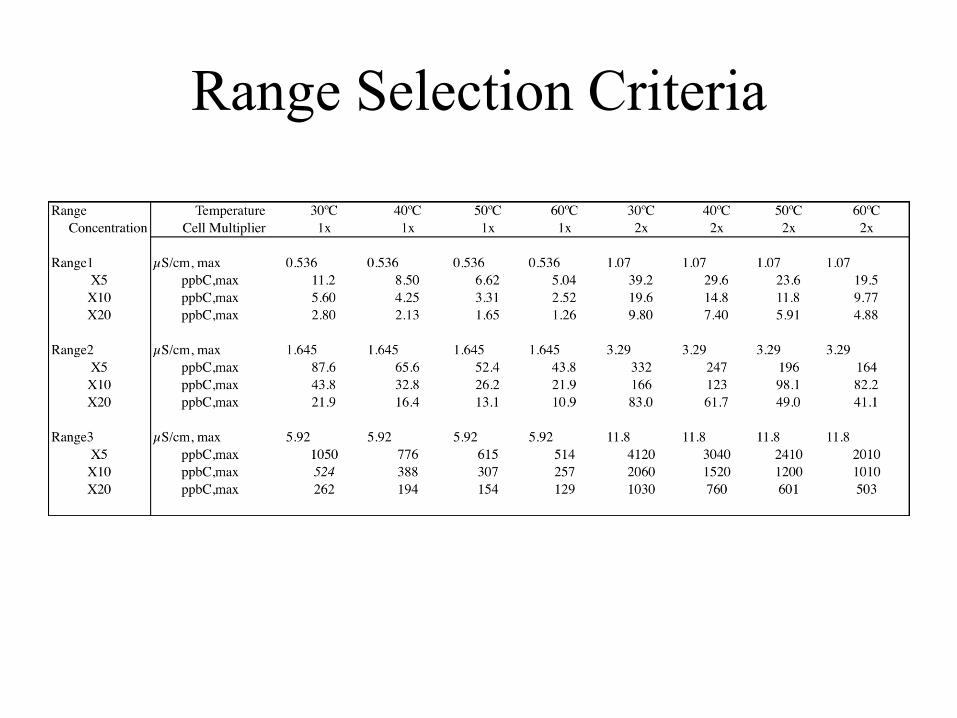
Range Selection Criteria
Calibration / Verification
Water Blank – Determines background TOC subtracted from calibration standard signals.
Calibration – Determines calibration factor applied to compensate for non-ideal TOC recovery.
Calibration Verification – Verifies instrument recovery of Sucrose complies with USP.
System Suitability - Verifies instrument recovery of Benzoquinone complies with USP.
Procedures
• Calibration
– Run Blank (DI used in Cal Standard prep)
– Run Cal Standard
– Record Values of Each After 30 min Stabilization Time
• Calibration Verification (w/Sucrose) & System Suitability (w/Benzoquinone)
– Run Blank (DI Used in Standard prep)
– Run Cal Standard (Sucrose/Benzoquinone)
– Record Values of Each After 30 min Stabilization Time
• Online Sample
– Run Blank (Online Sample with Reactor off)
– Record Value After 30 min Stabilization Time
– Turn Reactor On…Wait 30 min for Stabilization Before Reading Sample
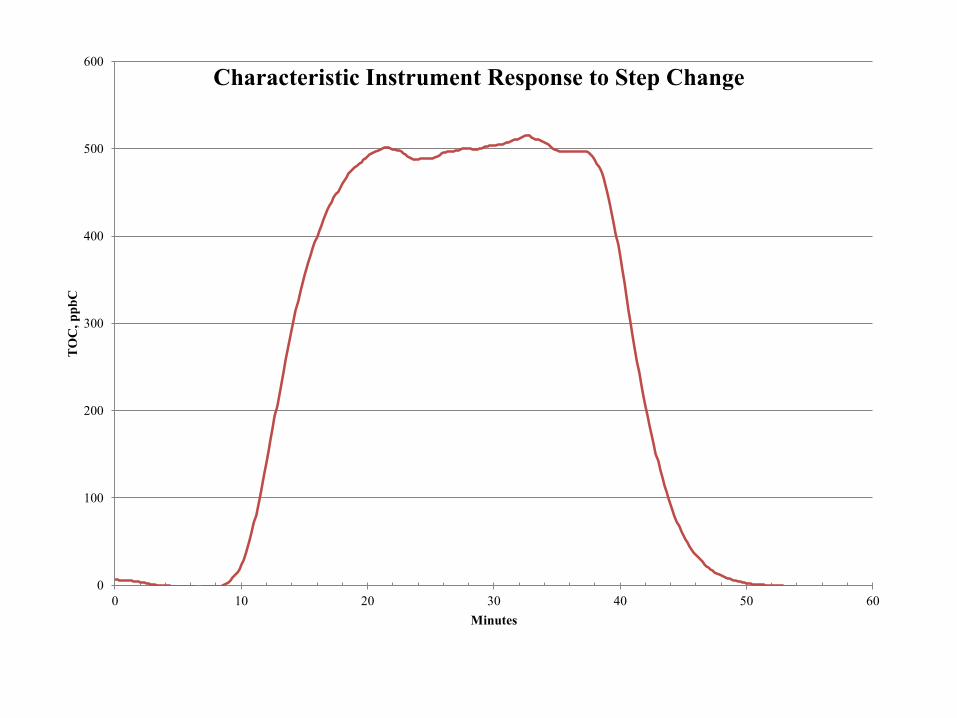
0
100
200
300
400
500
600
0 10 20 30 40 50 60
TO
C,
pp
bC
Minutes
Characteristic Instrument Response to Step Change
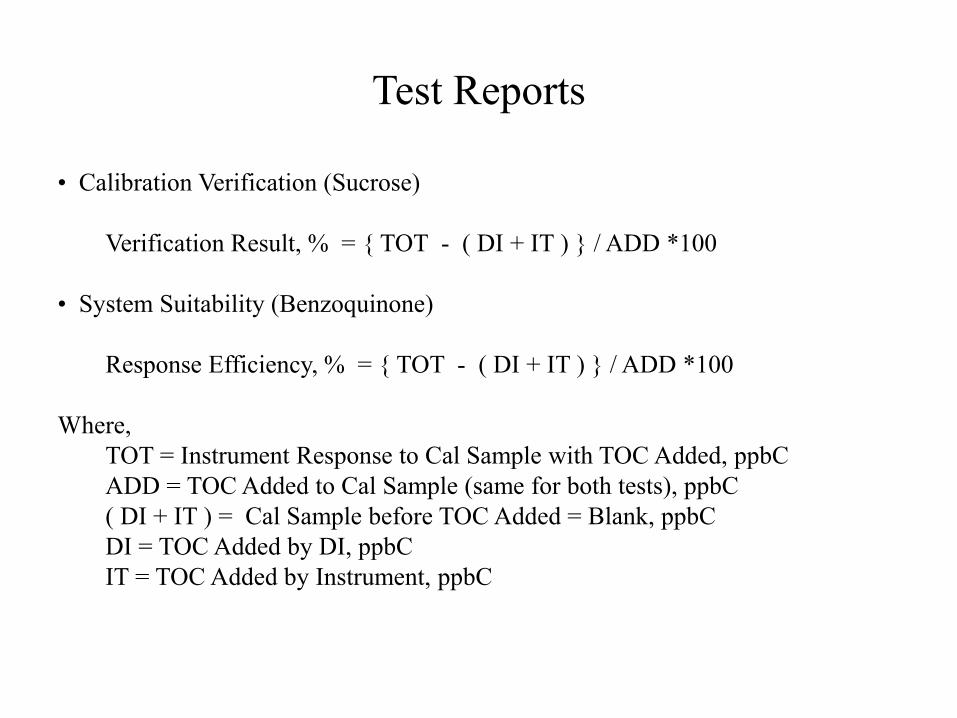
Test Reports
• Calibration Verification (Sucrose)
Verification Result, % = { TOT - ( DI + IT ) } / ADD *100
• System Suitability (Benzoquinone)
Response Efficiency, % = { TOT - ( DI + IT ) } / ADD *100
Where,
TOT = Instrument Response to Cal Sample with TOC Added, ppbC
ADD = TOC Added to Cal Sample (same for both tests), ppbC
( DI + IT ) = Cal Sample before TOC Added = Blank, ppbC
DI = TOC Added by DI, ppbC
IT = TOC Added by Instrument, ppbC
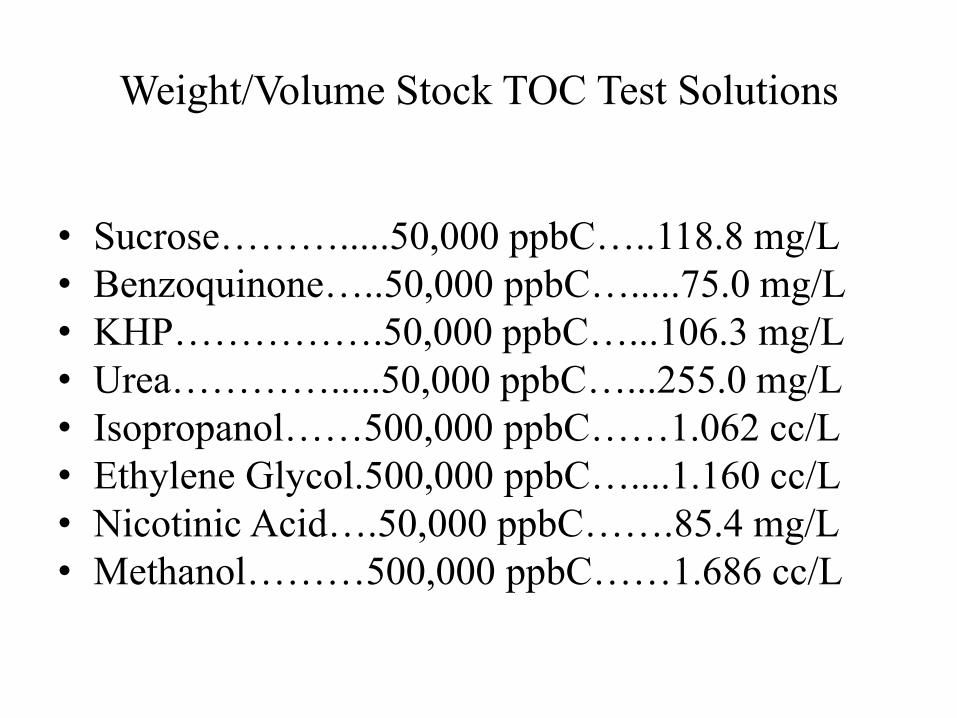
Weight/Volume Stock TOC Test Solutions
• Sucrose……….....50,000 ppbC…..118.8 mg/L
• Benzoquinone…..50,000 ppbC….....75.0 mg/L
• KHP…………….50,000 ppbC…...106.3 mg/L
• Urea………….....50,000 ppbC…...255.0 mg/L
• Isopropanol……500,000 ppbC……1.062 cc/L
• Ethylene Glycol.500,000 ppbC…....1.160 cc/L
• Nicotinic Acid….50,000 ppbC…….85.4 mg/L
• Methanol………500,000 ppbC……1.686 cc/L
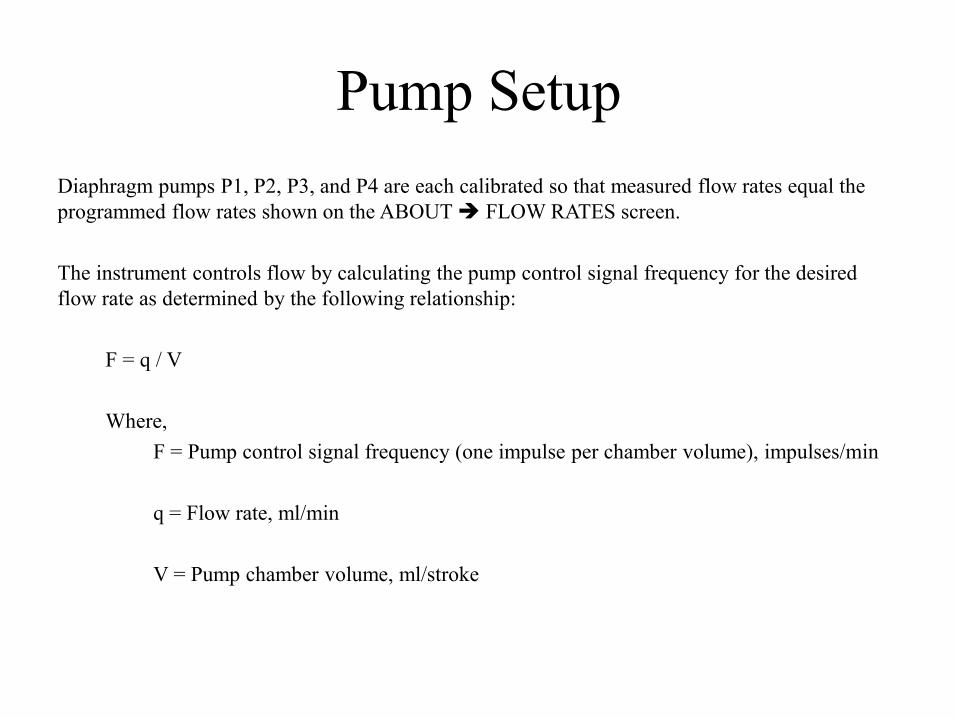
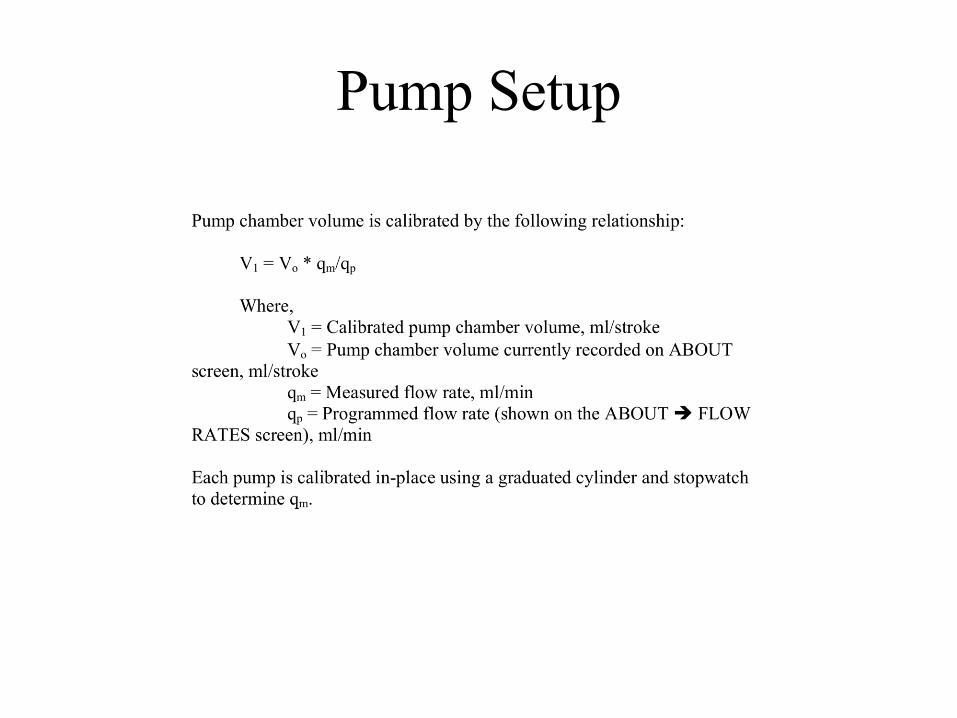
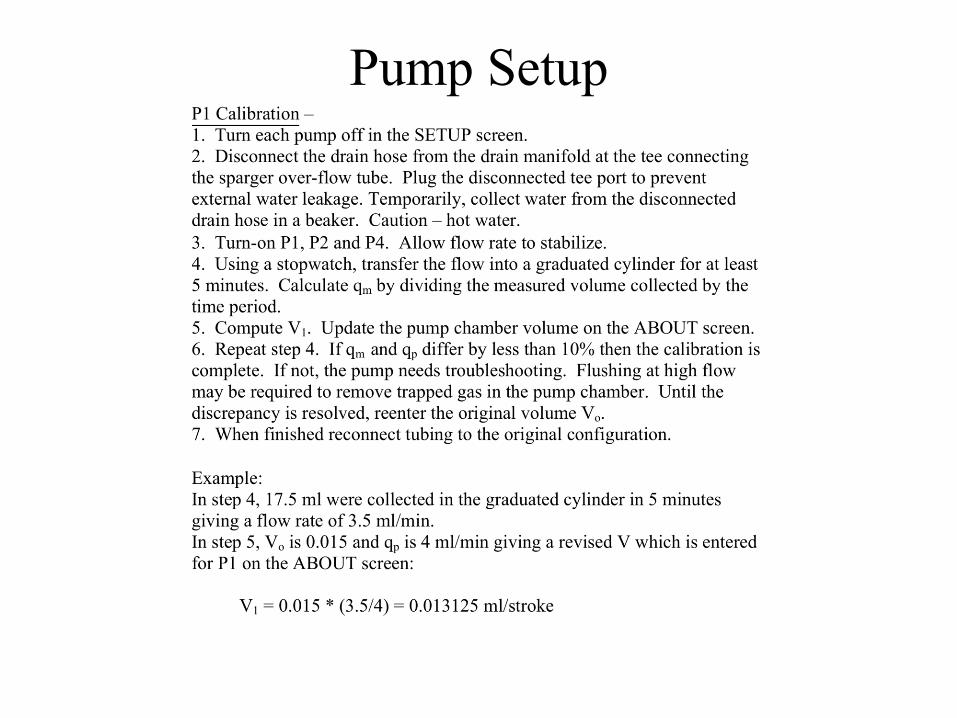
Pump Setup
Diaphragm pumps P1, P2, P3, and P4 are each calibrated so that measured flow rates equal the
programmed flow rates shown on the ABOUT FLOW RATES screen.
The instrument controls flow by calculating the pump control signal frequency for the desired
flow rate as determined by the following relationship:
F = q / V
Where,
F = Pump control signal frequency (one impulse per chamber volume), impulses/min
q = Flow rate, ml/min
V = Pump chamber volume, ml/stroke
Pump Setup
Pump Setup
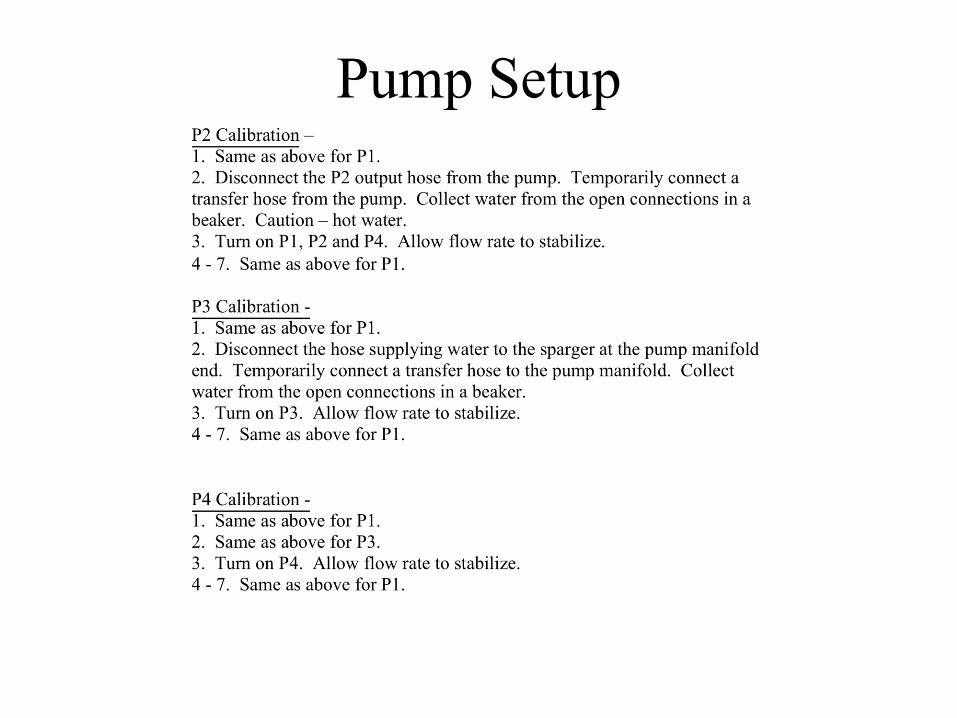
Pump Setup
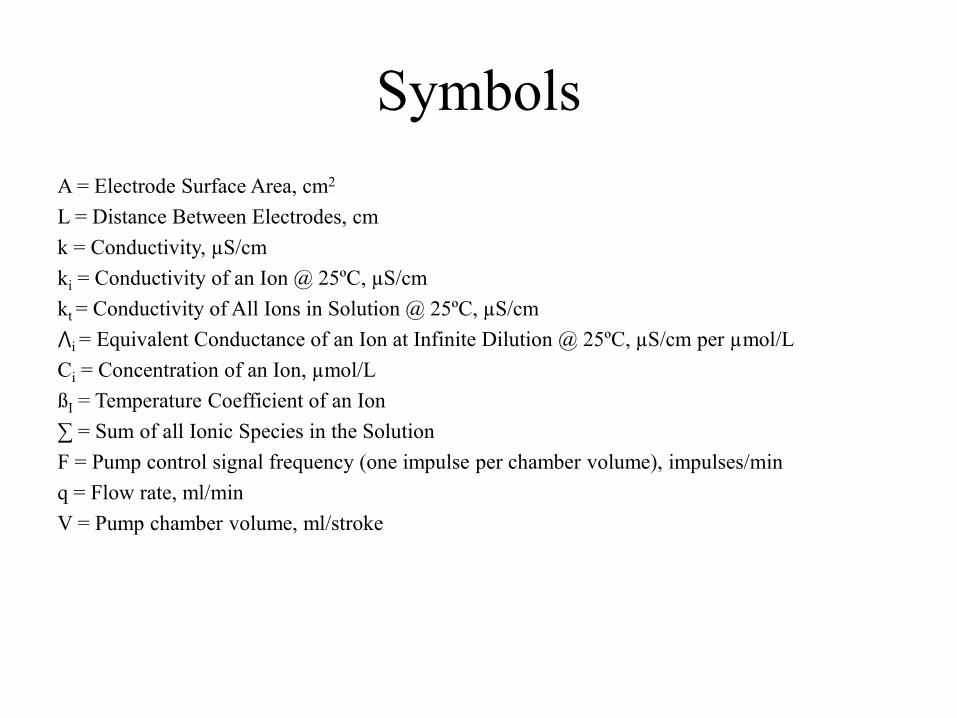
Symbols
A = Electrode Surface Area, cm2
L = Distance Between Electrodes, cm
k = Conductivity, µS/cm
ki = Conductivity of an Ion @ 25ºC, µS/cm
kt = Conductivity of All Ions in Solution @ 25ºC, µS/cm
⋀i = Equivalent Conductance of an Ion at Infinite Dilution @ 25ºC, µS/cm per µmol/L
Ci = Concentration of an Ion, µmol/L
ßI = Temperature Coefficient of an Ion
∑ = Sum of all Ionic Species in the Solution
F = Pump control signal frequency (one impulse per chamber volume), impulses/min
q = Flow rate, ml/min
V = Pump chamber volume, ml/stroke