Embed Size (px)
Citation preview

The Schwab Self-Directed Brokerage Account Indicators
An industry-leading benchmark on retirement plan participant investment activity within self-directed brokerage accounts.
All ParticipantsQuarter Ending 12/31/2019
Page 2 of 10
The Schwab Self-Directed Brokerage Account Indicators
Key Schwab Observations for the Fourth Quarter 2019:Asset Balance Summary
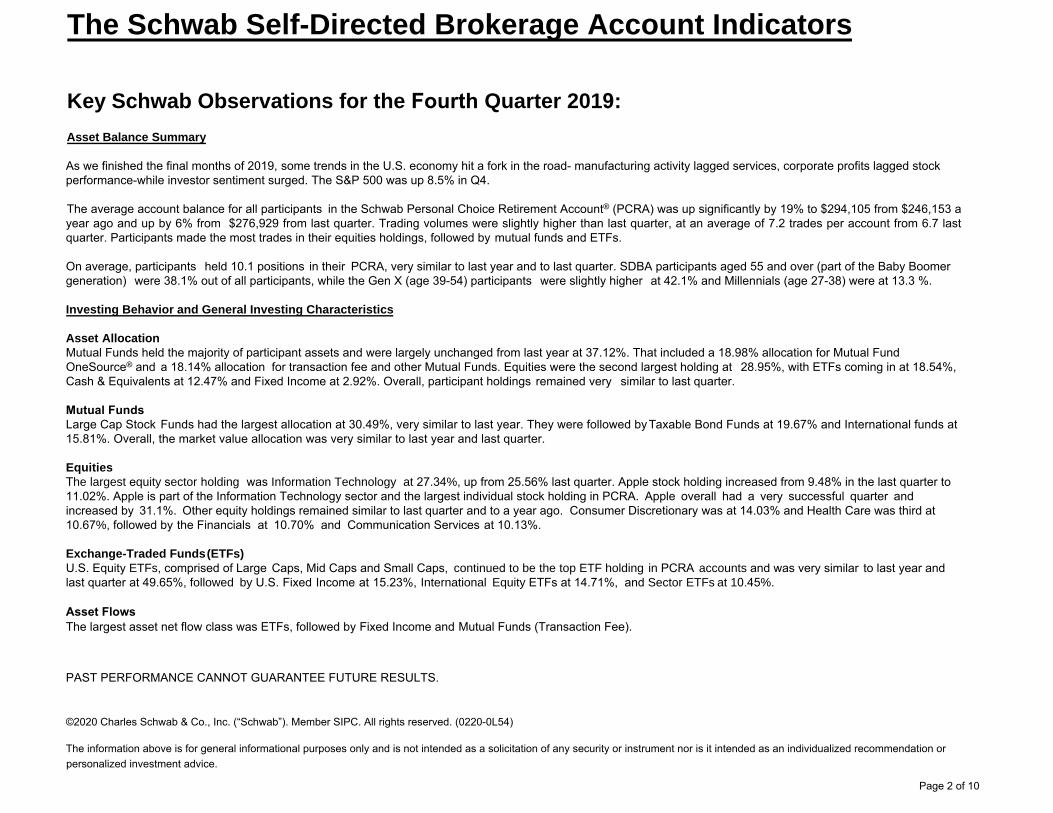
As we finished the final months of 2019, some trends in the U.S. economy hit a fork in the road- manufacturing activity lagged services, corporate profits lagged stock performance-while investor sentiment surged. The S&P 500 was up 8.5% in Q4.
The average account balance for all participants in the Schwab Personal Choice Retirement Account® (PCRA) was up significantly by 19% to $294,105 from $246,153 a year ago and up by 6% from $276,929 from last quarter. Trading volumes were slightly higher than last quarter, at an average of 7.2 trades per account from 6.7 last quarter. Participants made the most trades in their equities holdings, followed by mutual funds and ETFs.
On average, participants held 10.1 positions in their PCRA, very similar to last year and to last quarter. SDBA participants aged 55 and over (part of the Baby Boomer generation) were 38.1% out of all participants, while the Gen X (age 39-54) participants were slightly higher at 42.1% and Millennials (age 27-38) were at 13.3 %.
Investing Behavior and General Investing Characteristics
Asset Allocation Mutual Funds held the majority of participant assets and were largely unchanged from last year at 37.12%. That included a 18.98% allocation for Mutual Fund OneSource® and a 18.14% allocation for transaction fee and other Mutual Funds. Equities were the second largest holding at 28.95%, with ETFs coming in at 18.54%, Cash & Equivalents at 12.47% and Fixed Income at 2.92%. Overall, participant holdings remained very similar to last quarter.
Mutual FundsLarge Cap Stock Funds had the largest allocation at 30.49%, very similar to last year. They were followed by Taxable Bond Funds at 19.67% and International funds at 15.81%. Overall, the market value allocation was very similar to last year and last quarter.
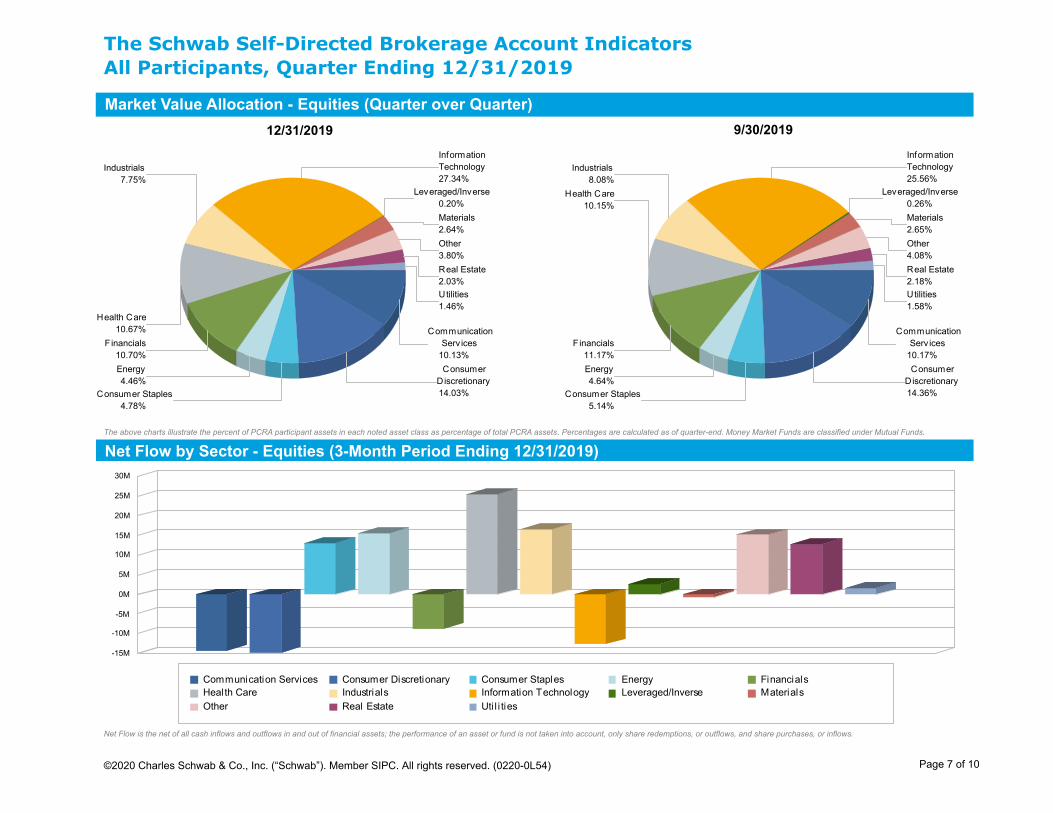
Equities The largest equity sector holding was Information Technology at 27.34%, up from 25.56% last quarter. Apple stock holding increased from 9.48% in the last quarter to 11.02%. Apple is part of the Information Technology sector and the largest individual stock holding in PCRA. Apple overall had a very successful quarter and increased by 31.1%. Other equity holdings remained similar to last quarter and to a year ago. Consumer Discretionary was at 14.03% and Health Care was third at 10.67%, followed by the Financials at 10.70% and Communication Services at 10.13%.
Exchange-Traded Funds (ETFs) U.S. Equity ETFs, comprised of Large Caps, Mid Caps and Small Caps, continued to be the top ETF holding in PCRA accounts and was very similar to last year and last quarter at 49.65%, followed by U.S. Fixed Income at 15.23%, International Equity ETFs at 14.71%, and Sector ETFs at 10.45%.
Asset Flows The largest asset net flow class was ETFs, followed by Fixed Income and Mutual Funds (Transaction Fee).
PAST PERFORMANCE CANNOT GUARANTEE FUTURE RESULTS.
©2020 Charles Schwab & Co., Inc. (“Schwab”). Member SIPC. All rights reserved. (0220-0L54)
The information above is for general informational purposes only and is not intended as a solicitation of any security or instrument nor is it intended as an individualized recommendation or personalized investment advice.

The Schwab Self-Directed Brokerage Account IndicatorsKey Schwab Observations for the Fourth Quarter 2019 (continued):Investing Behavior Across Generations: Millennials, Gen X and Baby Boomers
As expected, the older generation ended the quarter with the largest balance $420,874, which was up from $394,064 last quarter. They were followed by Gen X at$229,713 and finally Millennials at $74,309. All balances were significantly up from last quarter.
All three generations had verysimilar equity holdings, with Apple, Amazon, Berkshire Hathaway, Microsoft and Facebook coming in at the top.
As for the top ETF holdings, they were very similar across generations: Schwab US Broad Market ETF, SPDR, S&P 500 ETF, Vanguard and Schwab International Equity were at the top for all.
The Schwab S&P 500 Index fund was the top Mutual Fund holding, followed by the Schwab Total Stock Market Index fund.
Millennials and Gen X again had the same percentage of mobile trades at 23%, and Baby Boomers came in at 16%. Millennials once again had the highest percentage in cash out of the three generations at 16.03%, very similar to last quarter. The cash holdings for Gen X and Baby Boomers decreased to 12.97% and 11.75% from 13.95% and 12.31% respectively.
Investing Behavior: : Roth vs non-Roth Accounts
The Roth PCRA account holder balance was much lower than the non-Roth PCRA: $72,678 vs $298,786. Gen X once again had the most Roth Accounts as a percentage of accounts in their respective generations-48.6%. Those with Roth accounts also had lower trade volumes: 4.7 vs. 7.3.
While non-Roth account holders' equity holdings were the standard holdings across all accounts such as Apple, Amazon and Berkshire Hathaway, the Roth PCRA accounts continued to hold Glenview Offshore equity at the top followed by Apple and Amazon.
Investing Behavior: Advised vs. non-Advised Accounts
Gen X had the the most PCRA advised accounts at 44.5%, and Baby Boomers were not far behind at 41.8%, while only 10.4% of the Millennials chose to use an advisor. The average participant balance for advised accounts was up to $466,805 from $449,972 last quarter, while non-advised accounts were also up from last quarter at $250,099 from $234,087. Those with advised accounts also had more average trades-10.2 total vs. 6.5 for non-advised accounts. Overall, the trading volume remained very similar to last quarter and to last year.
Those participants who used advisors, displayed a more diversified asset allocation mix and had a lower concentration of assets in particular securities, with Apple being the top one for everyone; advised participants only had 7.36% of their equity assets with Apple, while non-advised participants had 12.03%. Advised participants also had a lower percentage in cash, very similar to last quarter: 3.94% vs.16.52% for non-advised, showing a balanced amount among all the advised investments.
As for ETF holdings, advised participants again had more balance among all the holdings, not having more than 3.9% of any one ETF, with Vanguard being the top one. Advisors preferred DFA US Core Equity Institutional fund as a top fund holding and DFA as a top fund family, with a 19.5% mutual fund asset allocation. Non-advised participants had Schwab S&P 500 Index as the top mutual fund holding and 17.3% of the mutual fund asset allocation went to the Vanguard fund family, followed by Schwab.
PAST PERFORMANCE CANNOT GUARANTEE FUTURE RESULTS.
©2020 Charles Schwab & Co., Inc. (“Schwab”). Member SIPC. All rights reserved. (0220-0L54)
The information above is for general informational purposes only and is not intended as a solicitation of any security or instrument nor is it intended as an individualized recommendation or personalized investment advice. Page 3 of 10

The Schwab Self-Directed Brokerage Account Indicators
All Participants, Quarter Ending 12/31/2019
PCRA Profile Information
Average PCRA Balance
Average Positions/Trades Per Account
Cash Investments 1.0
4.5
1.7
0.2
2.6
0.0
10.1$294,105 Total
Other
Mutual Funds
Fixed Income
ETFs
Equities 3.3
1.5
0.1
2.2
0.2
7.2Male Participants
Female Participants
Average Age 51
76.2%
23.8%
Top 10 Mutual Fund Holdings** % MF Assets
SCHWAB S&P 500 INDEX FD 4.43%
SCHWAB TOTAL STOCK MKT INDEX 2.43%
VANGUARD 500 INDEX FD ADMIRAL SHRS 1.43%
VANGUARD TOTAL STOCK MKT INDEX FD ADMIR 1.32%
PIMCO INCM INST CL 0.99%
DFA US CORE EQTY 2 PORT INSTL 0.92%
SCHWAB INTL INDEX FUND 0.82%
DOUBLELINE TOTAL RETURN BD FD CL I 0.79%
DFA INTL CORE EQTY PORT INSTL 0.75%
SCHWAB US AGGREGATE BOND INDEX FD 0.72%
Top 10 Fund Families % MF Assets
VANGUARD 13.12%
SCHWAB 11.88%
DFA 8.86%
T ROWE PRICE 3.80%
PIMCO FUNDS 3.54%
FIDELITY 2.63%
AMERICAN FUNDS 2.51%
DODGE & COX 1.81%
DOUBLELINE FUNDS 1.74%
JANUS 1.71%
Top 10 Equity Holdings %EQ Assets
APPLE INC 11.02%
AMAZON.COM INC 5.49%
MICROSOFT CORP 2.64%
BERKSHIRE HATHAWAY CLASS 2.38%
FACEBOOK INC CLASS 1.64%
ALPHABET INC. CLASS 1.22%
TESLA INC 1.21%
VISA INC CLASS 1.20%
NVIDIA CORP 1.13%
ALIBABA GROUP HOLDING FSPONSORED ADR 1.10%
Top 10 ETF Holdings %EQ Assets
4.19%VANGUARD TOTAL STOCK MARKET ETF
4.18%SPDR S&P 500 ETF
3.44%SCHWAB US BROAD MARKET ETF
3.12%INVESCO QQQ TRUST
2.70%SCHWAB US LARGE CAP ETF
2.64%VANGUARD S&P 500 ETF
2.39%ISHARES CORE S&P 500 ETF
1.85%SCHWAB INTERNATIONAL EQUITY ETF
1.44%SPDR GOLD SHARES ETF
1.39%SCHWAB US AGGREGATE BONDETF
13.3%
42.1%
38.1%
Positions Trades
n/a
Advised Participants
Self-Directed Participants
Average Advised Balance
Average Self-Directed Balance
$466,805
$250,099
20.3%
79.7%
Account Balances and Types Participant Demographics
Traditional Accounts
Roth Accounts
97.9%
2.1%
**Top 10 Mutual Funds does not include Money Market Funds.
Birth years: *1981-1992, **1965-1980, ***1947-1964
Millennial* (Age 27-38)
Gen X** (Age 39-54)
Baby Boomer*** (Age 55-72)
©2020 Charles Schwab & Co., Inc. (“Schwab”). Member SIPC. All rights reserved. (0220-0L54) Page 4 of 10

The Schwab Self-Directed Brokerage Account Indicators
All Participants, Quarter Ending 12/31/2019
Market Value Allocation - All Assets (Quarter over Quarter)
9/30/2019
17.33%
Mutual Funds
(Transaction Fee)
0.88%
Mutual Funds
(Other)
0.02%
Other
13.19%
Cash
28.15%
Equities
17.83%
ETFs
3.23%
Fixed Income
19.37%
Mutual Funds
(OneSource)
12/31/2019
17.26%
Mutual Funds
(Transaction Fee)
0.88%
Mutual Funds
(Other)
0.01%
Other
12.47%
Cash
28.95%
Equities
18.54%
ETFs
2.92%
Fixed Income
18.98%
Mutual Funds
(OneSource)
The above charts illustrate the percent of PCRA participant assets in each noted asset class as percentage of total PCRA assets. Percentages are calculated as of quarter-end. Money Market Funds are classified under Mutual Funds.
Net Flow - All Non-Cash Assets (3-Month Period Ending 12/31/2019)
-50M
0M
50M
100M
150M
200M
250M
300M
350M
400M
450M
Equities ETFs Fixed IncomeMutual Funds
(OneSource)
Mutual Funds
(Transaction Fee)Mutual Funds (Other)
Other
Net Flow is the net of all cash inflows and outflows in and out of financial assets; the performance of an asset or fund is not taken into account, only share redemptions, or outflows, and share purchases, or inflows.
©2020 Charles Schwab & Co., Inc. (“Schwab”). Member SIPC. All rights reserved. (0220-0L54) Page 5 of 10

The Schwab Self-Directed Brokerage Account Indicators
All Participants, Quarter Ending 12/31/2019
Market Value Allocation - Mutual Funds (Quarter over Quarter)
12/31/2019
6.92%
Specialized Funds
19.67%
Taxable Bond
Funds
0.11%
Tax-Free Bond
Funds
11.09%
Hybrid Funds
15.81%
International
30.49%
Large
Capitalization
Stock Funds
5.81%
Money Market
Fund
0.00%
Other
10.10%
Small
Capitalization
Stock Funds
9/30/2019
6.82%
Specialized Funds
20.80%
Taxable Bond
Funds
0.12%
Tax-Free Bond
Funds
11.11%
Hybrid Funds
15.45%
International
29.85%
Large
Capitalization
Stock Funds
5.76%
Money Market
Fund
0.00%
Other
10.09%
Small
Capitalization
Stock Funds
The above charts illustrate the percent of PCRA participant assets in each noted asset class as percentage of total PCRA assets. Percentages are calculated as of quarter-end. Money Market Funds are classified under Mutual Funds.
Net Flow by Sector - Mutual Funds (3-Month Period Ending 12/31/2019)
-10M
0M
10M
20M
30M
40M
50M
60M
70M
Hybrid Funds InternationalLarge Capital ization
Stock FundsMoney Market Fund Other
Smal l Capi tal ization
Stock Funds
Special ized Funds Taxable Bond Funds Tax-Free Bond Funds
Net Flow is the net of all cash inflows and outflows in and out of financial assets; the performance of an asset or fund is not taken into account, only share redemptions, or outflows, and share purchases, or inflows.
©2020 Charles Schwab & Co., Inc. (“Schwab”). Member SIPC. All rights reserved. (0220-0L54) Page 6 of 10
12/31/2019
27.34%
Information
Technology
0.20%
Leveraged/Inverse
2.64%
Materials
3.80%
Other
2.03%
Real Estate
1.46%
Utilities
10.13%
Communication
Serv ices
14.03%
Consumer
Discretionary
4.78%
Consumer Staples
4.46%
Energy
10.70%
Financials
10.67%
Health Care
7.75%
Industrials
The Schwab Self-Directed Brokerage Account Indicators
All Participants, Quarter Ending 12/31/2019
Market Value Allocation - Equities (Quarter over Quarter)
9/30/2019
25.56%
Information
Technology
0.26%
Leveraged/Inverse
2.65%
Materials
4.08%
Other
2.18%
Real Estate
1.58%
Utilities
10.17%
Communication
Serv ices
14.36%
Consumer
Discretionary
5.14%
Consumer Staples
4.64%
Energy
11.17%
Financials
10.15%
Health Care
8.08%
Industrials
The above charts illustrate the percent of PCRA participant assets in each noted asset class as percentage of total PCRA assets. Percentages are calculated as of quarter-end. Money Market Funds are classified under Mutual Funds.
Net Flow by Sector - Equities (3-Month Period Ending 12/31/2019)
-15M
-10M
-5M
0M
5M
10M
15M
20M
25M
30M
Communication Services Consumer Discretionary Consumer Staples Energy Financials
Health Care Industrials Information Technology Leveraged/Inverse Materials
Other Real Estate Uti l i ties
Net Flow is the net of all cash inflows and outflows in and out of financial assets; the performance of an asset or fund is not taken into account, only share redemptions, or outflows, and share purchases, or inflows.
©2020 Charles Schwab & Co., Inc. (“Schwab”). Member SIPC. All rights reserved. (0220-0L54) Page 7 of 10

12/31/2019 US FI15.23%
0.24%
Asset Allocation
3.03%
Commodity
0.05%
Currency
0.04%
Energy
0.00%
Financials
14.71%
International
Equity
0.41%
International FI
3.98%
Leveraged/Inverse
0.01%
Materials
2.19%
Other10.45%
Sector
49.65%
US Equity
The Schwab Self-Directed Brokerage Account Indicators
All Participants, Quarter Ending 12/31/2019
Market Value Allocation - ETF (Quarter over Quarter)
9/30/2019 US FI14.90%
0.24%
Asset Allocation
3.28%
Commodity
0.06%
Currency
0.05%
Energy
0.00%
Financials
13.67%
International
Equity
0.41%
International FI
4.07%
Leveraged/Inverse
0.01%
Materials
2.62%
Other11.03%
Sector
49.65%
US Equity
The above charts illustrate the percent of PCRA participant assets in each noted asset class as percentage of total PCRA assets. Percentages are calculated as of quarter-end. Money Market Funds are classified under Mutual Funds.
Net Flow by Sector - ETF (3-Month Period Ending 12/31/2019)
-20M
0M
20M
40M
60M
80M
100M
120M
140M
160M
Asset Al location Commodity Currency Energy International Equi ty International FI Leveraged/Inverse
Materials Other Sector US Equity US FI
Net Flow is the net of all cash inflows and outflows in and out of financial assets; the performance of an asset or fund is not taken into account, only share redemptions, or outflows, and share purchases, or inflows.
©2020 Charles Schwab & Co., Inc. (“Schwab”). Member SIPC. All rights reserved. (0220-0L54) Page 8 of 10

The Schwab Self-Directed Brokerage Account Indicators
All Participants, Quarter Ending 12/31/2019
Average Monthly Trades Per Account (3-Month Period Ending 12/31/2019)
0.00
0.20
0.40
0.60
0.80
1.00
1.20
1.40
10/1/2019 11/1/2019 12/1/2019
Equities ETFs Fixed Income Mutual Funds Other
Trading Channel Mix (Month over Month)
0%
10%
20%
30%
40%
50%
60%
70%
80%
90%
100%
10/1/2019 11/1/2019 12/1/2019
25% 26% 27%
0% 0% 0%
19% 20% 20%
1% 1% 1%
55% 53% 52%
Investment Manager Live Representative Mobile Telebroker Web
©2020 Charles Schwab & Co., Inc. (“Schwab”). Member SIPC. All rights reserved. (0220-0L54) Page 9 of 10
The Schwab Self-Directed Brokerage Account Indicators
All Participants, Quarter Ending 12/31/2019
Important Information
Investors in mutual funds and ETFs should consider carefully information contained in the prospectus, including investment objectives, risks, charges, and expenses. You can request a prospectus by calling 800-435-4000. Please read the prospectus carefully before investing. Money Market funds are neither insured nor guaranteed by the Federal Deposit Insurance Corporation or any other government agency. Although the funds see to preserve the value of your investment at $1.00 per share, it is possible to lose money by investing in the fund.
Schwab Personal Choice Retirement Account (PCRA) is offered through Charles Schwab & Co., Inc. (Member SIPC), the registered broker/dealer, which also provides other brokerage and custody services to its customers.
For participants who utilize the Personal Choice Retirement Account (PCRA), the following fees and conditions may apply: Schwab's short term redemption fee of $49.95 will be charged on redemption of funds purchased through Schwab's Mutual Fund OneSource® service (and certain other funds with no transaction fee) and held for 90 days or less. Schwab reserves the right to exempt certain funds from this fee, including Schwab Funds®, which may charge a separate redemption fee, and funds that accommodate short-term trading.
Trades in no-load mutual funds available through Mutual Funds OneSource service (including Schwab Funds) as well as certain other funds, are available without transaction fees when placed through schwab.com or our automated phone channels. Schwab reserves the right to change the funds we make available without transaction fees and to reinstate fees on any funds. Funds are also subject to management fees and expenses.
Figures are based on all PCRA participants with a minimum balance of $5,000 and a maximum balance of $10,000,000 in their PCRA account. All data is for informational purposes only. Schwab does not guarantee the accuracy, timeliness or completeness of the information.
Charles Schwab & Co., Inc., member SIPC, receives remuneration from fund companies for record keeping, shareholder services and other administrative services for shares purchased through its Mutual Fund OneSource service. Schwab also may receive remuneration from transaction fee fund companies for certain administrative services.
The information contained herein is obtained from third-party sources and believed to be reliable, but its accuracy or completeness is not guaranteed.
This report is for informational purposes only and is not a solicitation, or a recommendation that any particular investor should purchase or sell any
particular security.
Diversification and asset allocation in a portfolio cannot assure a profit or protect against a loss in any given market environment.
©2020 Charles Schwab & Co., Inc. (“Schwab”). Member SIPC. All rights reserved. (0220-0L54) Page 10 of 10