Embed Size (px)
Citation preview

THE SCHOOL BOARD OF BROWARD COUNTY, FLORIDA OFFICE OF THE SUPERINTENDENT
JAMES F. NOTTER
SUPERINTENDENT OF SCHOOLS
Telephone: 754-321-2600 Facsimile: 754-321-2701 Signatures on file.
July 14, 2009 TO: School Board Members FROM: Joanne W. Harrison, Ed.D., Deputy Superintendent Educational Programs & Student Support VIA: James F. Notter
Superintendent of Schools SUBJECT: 2008-09 PRELIMINARY SAT/NATIONAL MERIT SCHOLARSHIP
QUALIFYING TEST RESULTS This is the ninth year that Broward has participated in the partnership between the College Board and the Florida Department of Education (FDOE) utilizing the Preliminary SAT/National Merit Scholarship Qualifying Test (PSAT) to identify student readiness for college level work. The report presents data regarding the 2006-07 through 2008-09 administrations of the PSAT for both 10th and 11th grade participants. Results demonstrate that school staff and parents have supported the statewide effort to have all tenth grade students participate in the administration of a preliminary college entrance examination, resulting in significant gains in student participation in the PSAT districtwide, as well as across major ethnic groups. Tenth grade participation has increased by 5 percentage points over the previous year (to 83%), with similar increases noted within each ethnic group. Eleventh grade participants in Broward earned higher mean scores than their peer across the state and the nation. What is the purpose of this report? Broward is committed to providing advanced educational opportunities which provide students with the experience and knowledge needed for success in college-level coursework. School staff members use PSAT/NMSQT results as a source of information to identify students for participation in upper-level course enrollment. Area Directors and Principals take steps to ensure maximum participation, particularly where the schoolwide or ethnic group participation rate falls below 70%. How should staff use these data? Schools will use the data from this report to identify content areas of instructional strength and areas in need of improvement. Additionally, the Research Services Department and school guidance staff will analyze individual student PSAT results and use the College Board AP Potential Report to identify students for participation in high rigor courses. This report is available on the Student Assessment & School Performance Web site at: http://www.broward.k12.fl.us/studentassessment/AssessmentReleases.htm. If you have any questions regarding this report, please contact Paul Houchens, Director, Student Assessment & School Performance at 754-321-4257. JFN/JWH/KB/PWH:tje Attachment cc: Executive Leadership Team Area Directors High School Principals

Research, Evaluation, & Assessment 1 Student Assessment & School Performance
The School Board of Broward County, Florida
AAsssseessssmmeenntt BBrriieeff ©2009, The School Board of Broward County, Florida Number 133 Report from the Office of the Superintendent July 2009
2008-09 PRELIMINARY SAT/
NATIONAL MERIT SCHOLARSHIP QUALIFYING TEST This is the ninth year of Broward’s participation in the ongoing partnership between the College Board and the Florida Department of Education, which was instituted to improve student academic performance and prepare students for a college education or a rewarding career. Beginning in the 2000-01 school year, Florida’s Specific Appropriation 107 allocated $1.6 million statewide for administration of a preliminary college entrance examination to all tenth grade students. Broward County Public Schools (BCPS), after a review of available preliminary college entrance examinations, selected the College Board’s Preliminary SAT/National Merit Scholarship Qualifying Test (PSAT/NMSQT) for administration to tenth grade students. As directed by the State, student participation in districtwide PSAT/NMSQT testing is voluntary. College Board mails each examinee a PSAT/NMSQT Student Score Report in December or January, which provides a skills assessment that students can use to identify their levels of proficiency in each of the reasoning skill areas and then work on improvement before entering college or taking the SAT. The Score Report also contains interpretive and college planning information. The PSAT/NMSQT scale of 20 to 80 corresponds to the SAT scale of 200 to 800. Each student receives three scores (Critical Reading, Mathematics, and Writing Skills) as well as estimated scores on the SAT I: Reasoning Test (Critical Reading and Mathematics) and the SAT II: Writing Test. In December, all students who took the PSAT/NMSQT receive free access to:
• My College QuickStart, a personalized online college planning kit based on their test results, and
• answers and explanations for every question on the PSAT/NMSQT (College Board, 2007).
In the Spring of each year, College Board provides additional reports and materials to each school participating in PSAT/NMSQT testing. The PSAT/NMSQT Summary of Answers includes three different ways for school staff to analyze their students’ performance. College Board indicates that the Summary of Answers keeps the focus on the students’ skills, not their scores. Each participating school also receives reports to assist in identifying academically promising students to participate in Advanced Placement (AP) courses. According to College Board, studies have shown that student performance on the PSAT/NMSQT can be useful in identifying students who may be successful in AP courses. However, these reports are not intended to be the sole criteria for selection of students to enter an AP course, nor are they to be used to deny
Research, Evaluation, & Assessment 2 Student Assessment & School Performance
student access to these high-rigor courses. The reports should be used in conjunction with the following to identify students who can potentially benefit from, and be successful in, AP courses:
• Upper-Level Course Enrollment Indicator (Available in the TERMS database) • Self-nomination • Teacher recommendations • Previous coursework • Grades in relevant previous courses • Discussions with students and their parents • Scores on other standardized tests
As indicated in the PSAT/NMSQT Summary of Answers, students who take the test are assumed to be planning to continue their education beyond high school. Comparisons of performance on the PSAT/NMSQT relate these students to the national group of college-bound students, a self-selected group of greater academic ability, rather than all high school students.
Test Description The PSAT/NMSQT measures critical reading and mathematical reasoning abilities, as well as writing skills that are important to success in college-level scholarship. The test focuses on students’ ability to reason with facts and concepts, rather than the ability to recall and recite information, while assessing knowledge and skills that students develop through course work in English, mathematics, science, social studies, foreign languages, and fine arts, as well as through experiences outside the classroom. By taking the PSAT/NMSQT in grade 10, students gain experience with the format and content of the SAT. The examination is intended to present an opportunity for students to practice for the SAT by providing questions similar to those on that assessment. By taking the PSAT/NMSQT prior to the SAT, students become cognizant of the skills tested on the SAT and other college entrance examinations. In addition, test results provide high school guidance counselors with data that help identify students who are ready or need additional assistance in order to enroll and be successful in AP and other college preparatory courses. Resources such as the Web-based AP Potential are also available to allow guidance counselors to generate rosters of students who are likely to score a 3 or better on a given AP examination. Based on research that shows strong correlations between PSAT/NMSQT scores and AP examination results, AP Potential is designed to help students increase access to AP courses and to ensure that no student who has the chance of succeeding in AP is overlooked (College Board, 2007). The PSAT/NMSQT is also a qualifying examination for scholarship and recognition programs including the National Merit Scholarship Program, National Achievement Scholarship Program for outstanding Black students, and the National Hispanic Scholar Recognition Program. Of the more than one million National Merit Scholarship Corporation (NMSC) program entrants, about 55,000 students will have earned 2008-09 PSAT/NMSQT scores high enough to qualify for recognition. These students are notified of their standing through their high schools in September. Students who qualify to continue in the competitions for scholarships to be offered

Research, Evaluation, & Assessment 3 Student Assessment & School Performance
in 2010 then must meet academic and other requirements specified by NMSC in order to be considered for awards (National Merit Scholarship Corporation, 2009). The State of Florida supports participation in the PSAT/NMSQT by providing the test to tenth grade public school students at no cost. As a result, a larger proportion of Broward County high school sophomores than juniors take the assessment each October. Nearly all students nationwide who take the test indicate they plan to attend college. The PSAT/NMSQT gives students the opportunity to participate in the Student Search Service used by colleges to contact students directly with information about their programs and offerings. Although the Florida Legislature does not require grade 10 students to participate in PSAT/NMSQT administration, Broward’s schools encourage all students to participate. Two dates in October are specified by The College Board for PSAT/NMSQT administration each year. Schools may elect either the Wednesday or Saturday scheduled test dates to administer the test. Broward schools only administer the test on the Wednesday test date, which is a regular school day, thereby facilitating higher participation among students.
Method The Broward County data summarized herein were extracted from the District’s Data Warehouse after PSAT/NMSQT scores were linked with demographic and enrollment records. If more than one score was reported for a student, only the most recent result was included for analysis. All reported counts are unduplicated. The Broward data include results for both sophomores and juniors who took the PSAT/NMSQT during the school year. Results for the state and the nation reflect only graduating seniors as reported by the College Board. Because of this difference in student groups reported, Broward’s data are reported separately for sophomores and juniors.
Results Note must be made regarding special educational initiatives in Florida. Only a small number of states have initiatives that provide for student participation in testing such as PSAT/NMSQT at no cost to students. Therefore, comparisons between Broward and national results must be made with caution, as the majority of states do not fund PSAT/NMSQT testing. This difference in policy and funding unbalances comparisons with nationwide results as students who must pay to participate in grade 10 are likely to be more academically motivated than many students who take the exam free of charge. Participation Rates The test results included in this report are for students who participated in the PSAT/NMSQT administration over the past three years. As displayed in Table 1 (following page), despite a decrease in grade 10 student enrollment, the number and percent of participants increased in 2008-09

Research, Evaluation, & Assessment 4 Student Assessment & School Performance
Table 1 Broward Enrollment/PSAT/NMSQT Participation 2006-07 through 2008-09
Year Enrollment Annual % Change Participants Annual %
Change Participation
Rate Grade 10
2006-07 20,269 -3% 15,295 +<1% 75% 2007-08 20,091 -<1% 15,658 +2% 78% 2008-09 20,211 +<1% 16,821 +5% 83%
Grade 11 2006-07 18,312 -2% 4,414 +5% 24% 2007-08 18,516 +1% 4,403 -<1% 24% 2008-09 18,609 +<1% 4,591 +<1% 25% Table 2 summarizes participation rates disaggregated by the three largest ethnic groups represented in the District. Examination of the table reveals that the number of tenth grade Black students enrolled remained increased in 2008-09 from the previous year, while the number of Black students participating increased by six percent. The number of White students enrolled and the number of participants declined in 2008-09; however, the percent of White student participation still represents an increase of four percentage points. Tenth grade Hispanic students registered an increase in both enrollment and participation from the previous year. Among eleventh grade students, the number of Black students enrolled decreased slightly while the number and percent of participants has increased slightly. Among White students, enrollment decreased from the previous year, while the percent of participants remained stable. Grade 11 Hispanic student enrollment and participation both increased in 2008-09. Table 2 Broward Enrollment/PSAT/NMSQT Participation by Ethnicity 2005-06 through 2007-08
Black Hispanic White Year n
Enroll. n
Part. %
Part. n
Enroll. n
Part. %
Part. n
Enroll. n
Part. %
Part. Grade 10
2006-07 7,583 5,239 69% 5,010 3,816 76% 6,655 5,392 81% 2007-08 7,590 5,388 71% 4,943 3,910 79% 6,342 5,290 83% 2008-09 7,780 6,026 77% 5,172 4,413 85% 6,025 5,268 87%
Grade 11 2006-07 6,568 1,136 17% 4,428 898 20% 6,389 2,032 32% 2007-08 6,908 1,132 16% 4,520 948 21% 6,114 1,930 32% 2008-09 6,886 1,194 17% 4,623 1,045 23% 5,925 1,867 32% Performance
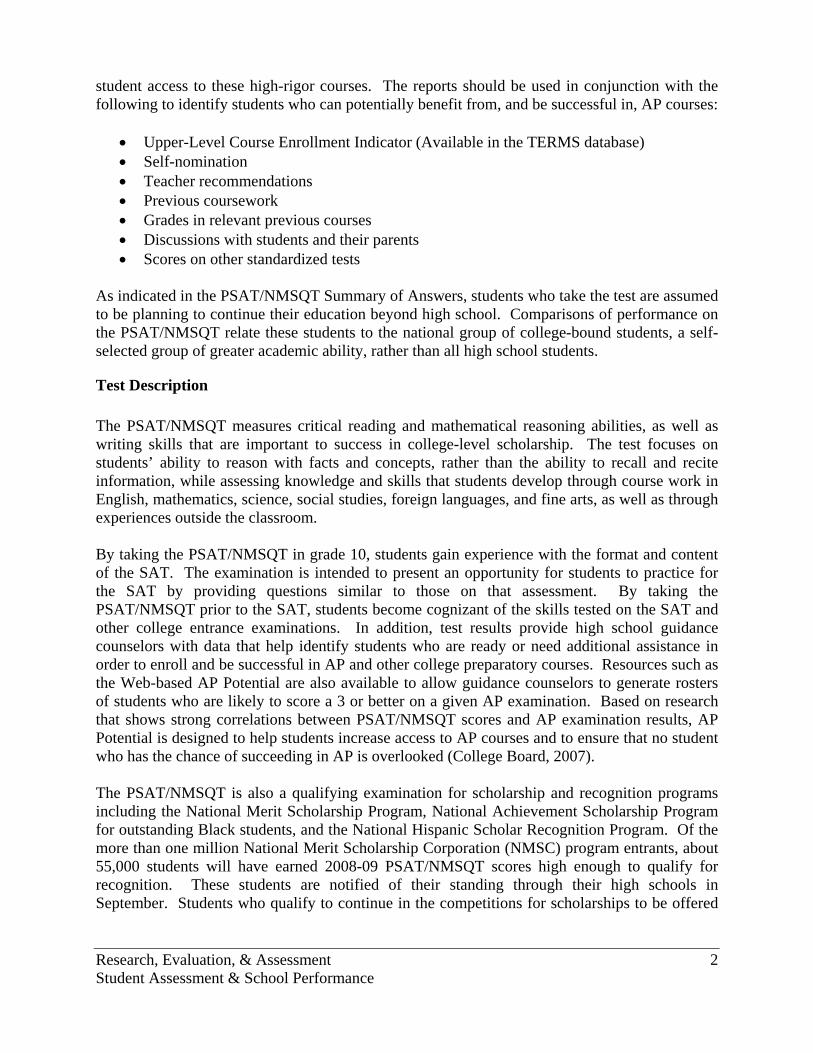
Table 3 summarizes three years of National, Florida, and Broward scores. The College Board reports national and state mean scale scores for college-bound students. Broward’s grade 10 scores registered slight increases in Critical Reading, Mathematics, and Writing over the previous year. Broward’s grade 10 scores range near to scores across the state, but lag scores across the nation. Performance results are stronger at grade 11, with Broward students surpassing the mean scores of their peers across the state and nation in all three subject areas.
Research, Evaluation, & Assessment 5 Student Assessment & School Performance
Table 3 Nation, Florida and Broward PSAT Mean Scores 2006-07 through 2008-09
Critical Reading Mathematics Writing 2006-07 2007-08 2008-09 2006-07 2007-08 2008-09 2006-07 2007-08 2008-09
Grade 10 Nation 42.6 41.8 41.6 43.5 43.1 44.0 40.8 41.2 41.0 Florida 40.4 39.6 40.0 41.3 41.1 42.1 37.8 38.5 38.8 Broward 40.0 39.5 39.6 41.8 41.9 42.0 37.5 38.3 38.4
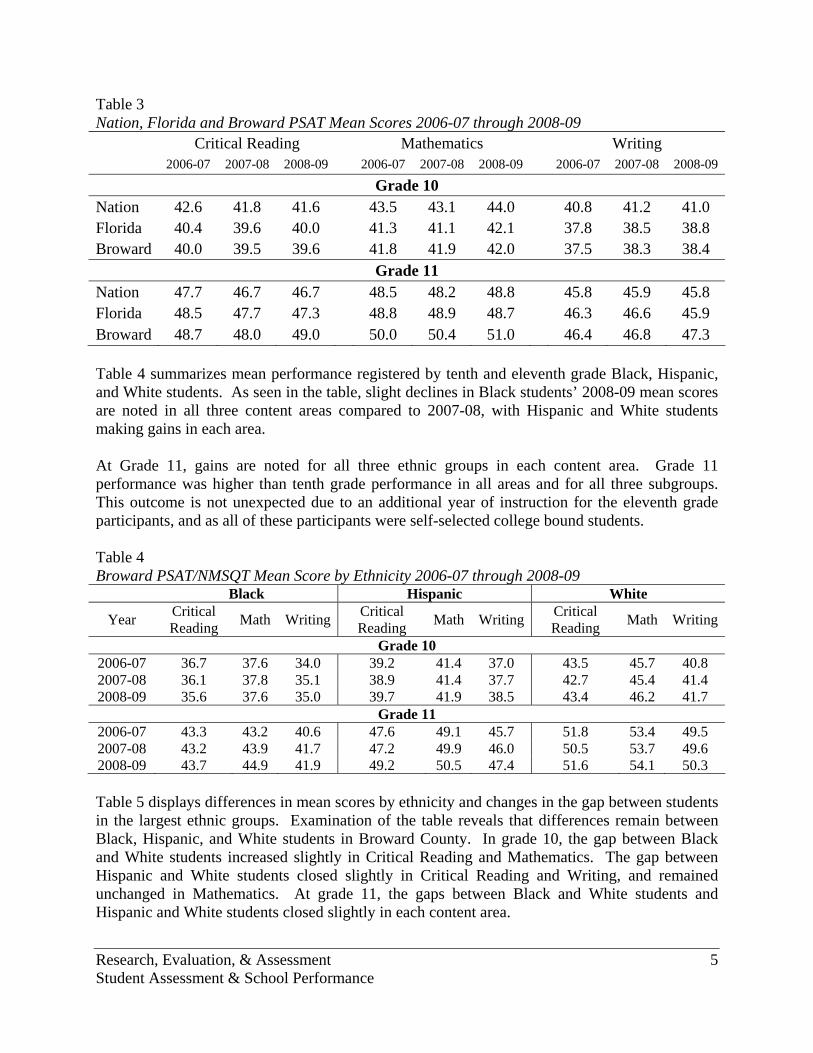
Grade 11 Nation 47.7 46.7 46.7 48.5 48.2 48.8 45.8 45.9 45.8 Florida 48.5 47.7 47.3 48.8 48.9 48.7 46.3 46.6 45.9 Broward 48.7 48.0 49.0 50.0 50.4 51.0 46.4 46.8 47.3 Table 4 summarizes mean performance registered by tenth and eleventh grade Black, Hispanic, and White students. As seen in the table, slight declines in Black students’ 2008-09 mean scores are noted in all three content areas compared to 2007-08, with Hispanic and White students making gains in each area. At Grade 11, gains are noted for all three ethnic groups in each content area. Grade 11 performance was higher than tenth grade performance in all areas and for all three subgroups. This outcome is not unexpected due to an additional year of instruction for the eleventh grade participants, and as all of these participants were self-selected college bound students. Table 4 Broward PSAT/NMSQT Mean Score by Ethnicity 2006-07 through 2008-09 Black Hispanic White
Year Critical Reading Math Writing Critical
Reading Math Writing Critical Reading Math Writing
Grade 10 2006-07 36.7 37.6 34.0 39.2 41.4 37.0 43.5 45.7 40.8 2007-08 36.1 37.8 35.1 38.9 41.4 37.7 42.7 45.4 41.4 2008-09 35.6 37.6 35.0 39.7 41.9 38.5 43.4 46.2 41.7
Grade 11 2006-07 43.3 43.2 40.6 47.6 49.1 45.7 51.8 53.4 49.5 2007-08 43.2 43.9 41.7 47.2 49.9 46.0 50.5 53.7 49.6 2008-09 43.7 44.9 41.9 49.2 50.5 47.4 51.6 54.1 50.3 Table 5 displays differences in mean scores by ethnicity and changes in the gap between students in the largest ethnic groups. Examination of the table reveals that differences remain between Black, Hispanic, and White students in Broward County. In grade 10, the gap between Black and White students increased slightly in Critical Reading and Mathematics. The gap between Hispanic and White students closed slightly in Critical Reading and Writing, and remained unchanged in Mathematics. At grade 11, the gaps between Black and White students and Hispanic and White students closed slightly in each content area.

Research, Evaluation, & Assessment 6 Student Assessment & School Performance
Table 5 Differences in Broward PSAT/NMSQT Mean Scale Scores by Race, 2006-07 through 2008-09
2006-07 2007-08 2008-09 Change in Gap Grade 10
Critical Reading Black 36.7 36.1 35.6 Black/White Gap 6.8 6.6 7.8 1.0 White 43.5 42.7 43.4 Hispanic/White Gap 4.3 3.8 3.7 -0.6 Hispanic 39.2 38.9 39.7 Mathematics Black 37.6 37.8 37.6 Black/White Gap 8.1 7.6 8.6 0.5 White 45.7 45.4 46.2 Hispanic/White Gap 4.3 4.0 4.3 0.0 Hispanic 41.4 41.4 41.9 Writing Black 34.0 35.1 35.0 Black/White Gap 6.8 6.3 6.7 -0.1 White 40.8 41.4 41.7 Hispanic/White Gap 3.8 3.7 3.2 -0.6 Hispanic 37.0 37.7 38.5
Grade 11 Critical Reading Black 43.3 43.2 43.7 Black/White Gap 8.5 7.3 7.9 -0.6 White 51.8 50.5 51.6 Hispanic/White Gap 4.2 3.3 2.4 -1.8 Hispanic 47.6 47.2 49.2 Mathematics Black 43.2 43.9 44.9 Black/White Gap 10.2 9.8 9.2 -1.0 White 53.4 53.7 54.1 Hispanic/White Gap 4.3 3.8 3.6 -0.7 Hispanic 49.1 49.9 50.5 Writing Black 40.6 41.7 41.9 Black/White Gap 8.9 7.9 8.4 -0.5 White 49.5 49.6 50.3 Hispanic/White Gap 3.8 3.6 2.9 -0.9 Hispanic 45.7 46.0 47.4
Research, Evaluation, & Assessment 7 Student Assessment & School Performance
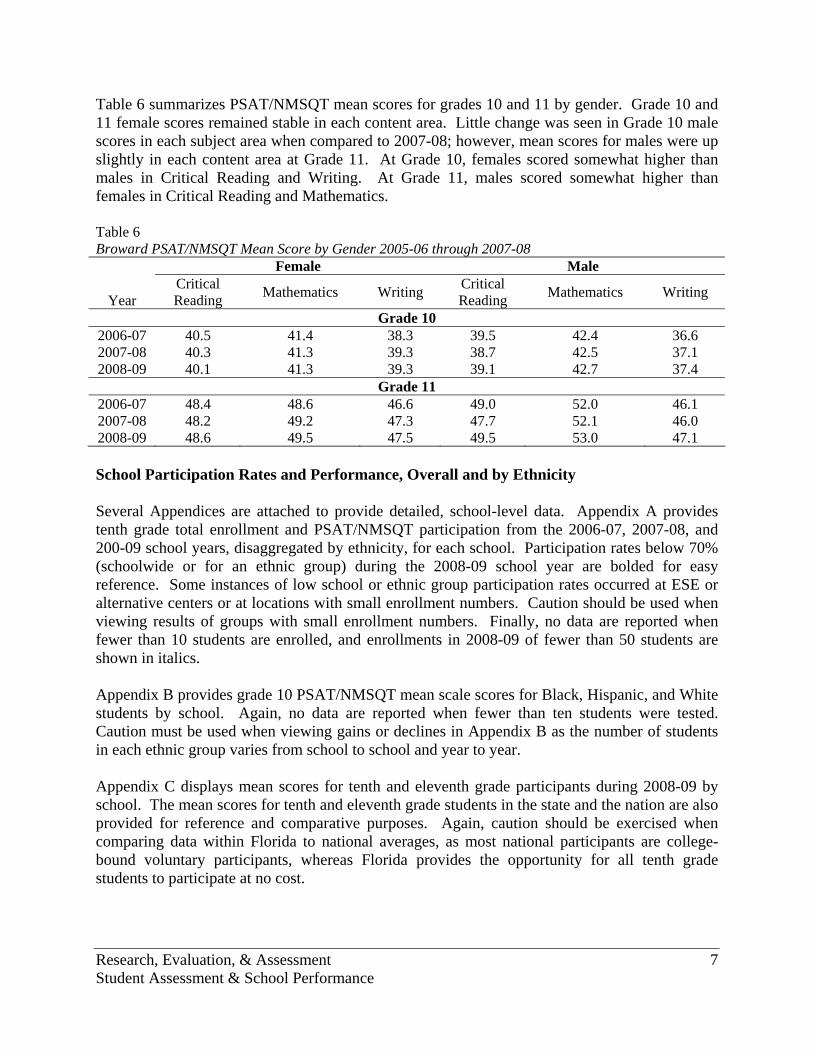
Table 6 summarizes PSAT/NMSQT mean scores for grades 10 and 11 by gender. Grade 10 and 11 female scores remained stable in each content area. Little change was seen in Grade 10 male scores in each subject area when compared to 2007-08; however, mean scores for males were up slightly in each content area at Grade 11. At Grade 10, females scored somewhat higher than males in Critical Reading and Writing. At Grade 11, males scored somewhat higher than females in Critical Reading and Mathematics. Table 6 Broward PSAT/NMSQT Mean Score by Gender 2005-06 through 2007-08
Female Male
Year Critical Reading Mathematics Writing Critical
Reading Mathematics Writing
Grade 10 2006-07 40.5 41.4 38.3 39.5 42.4 36.6 2007-08 40.3 41.3 39.3 38.7 42.5 37.1 2008-09 40.1 41.3 39.3 39.1 42.7 37.4
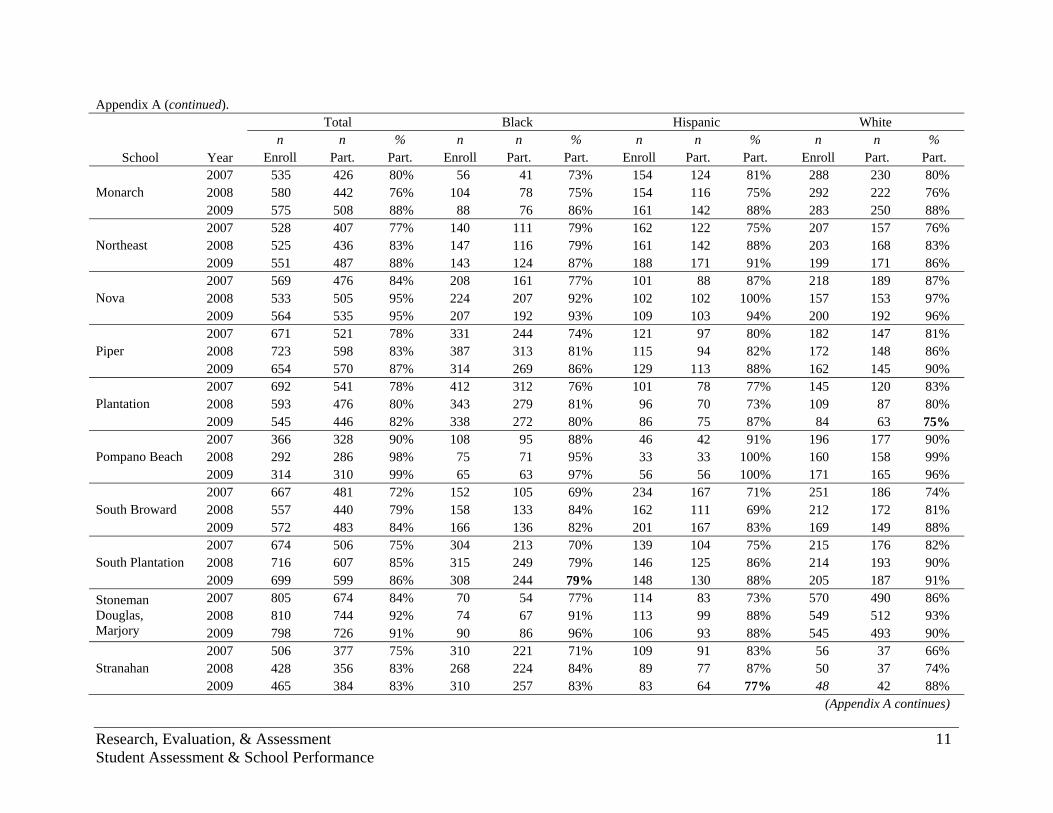
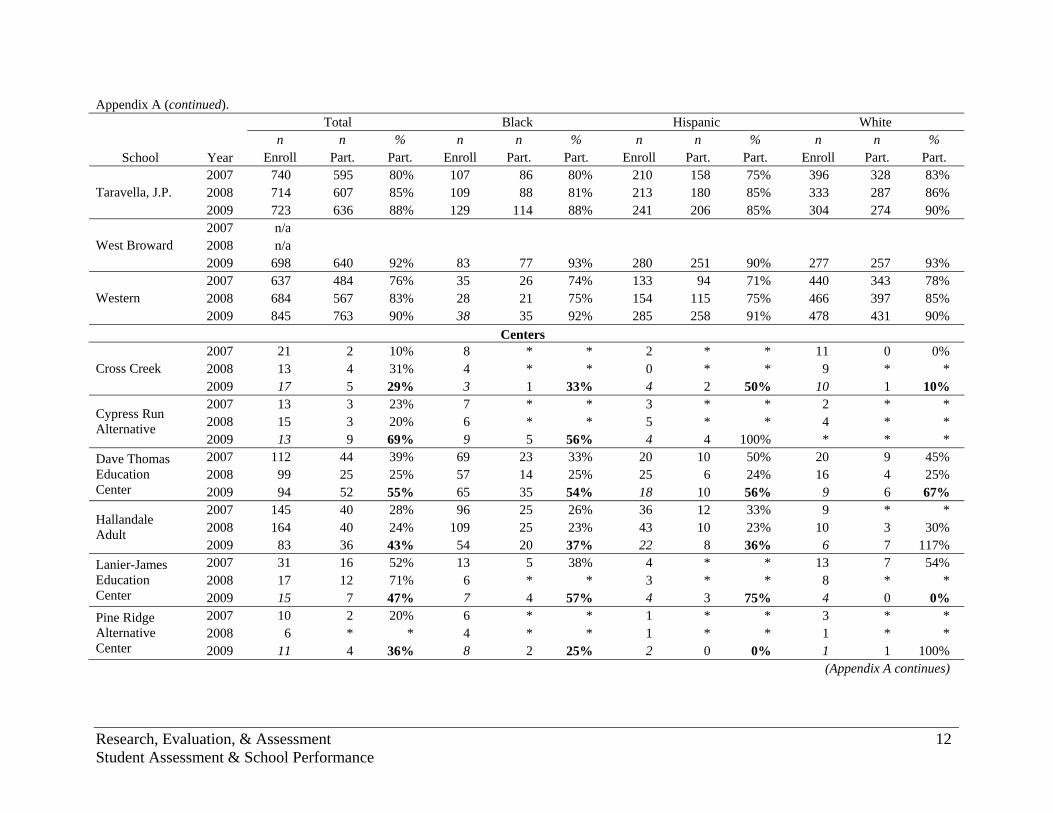
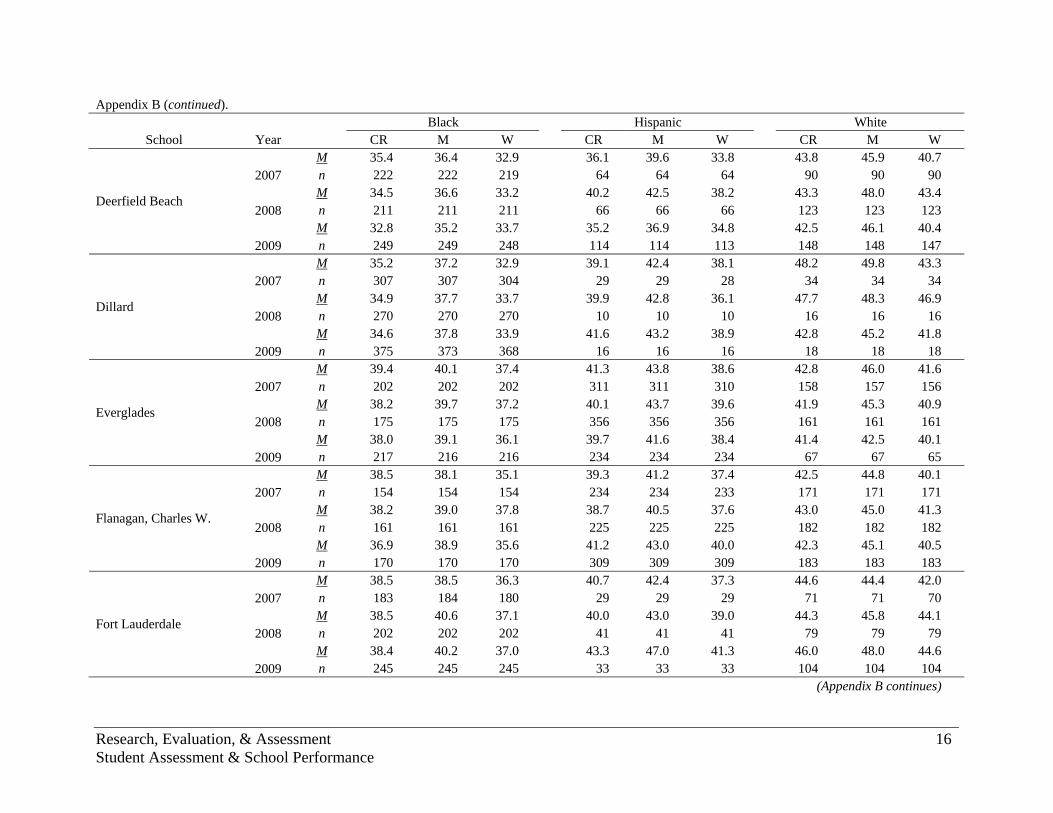
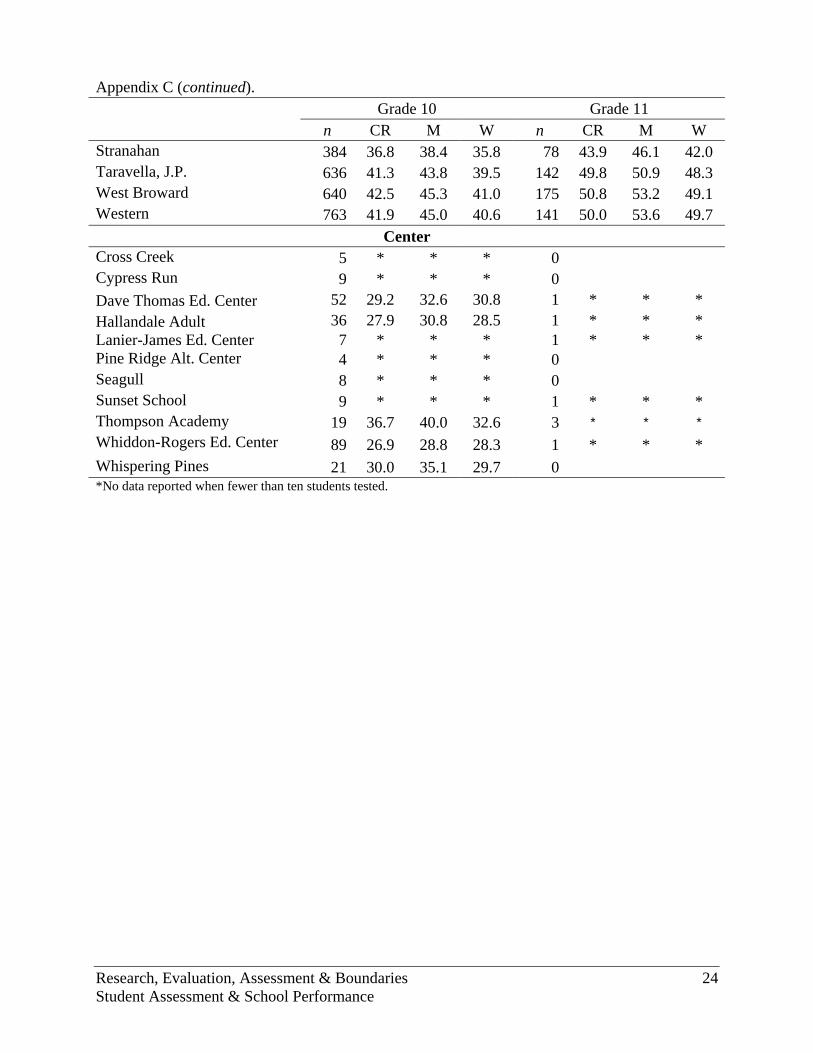
Grade 11 2006-07 48.4 48.6 46.6 49.0 52.0 46.1 2007-08 48.2 49.2 47.3 47.7 52.1 46.0 2008-09 48.6 49.5 47.5 49.5 53.0 47.1 School Participation Rates and Performance, Overall and by Ethnicity Several Appendices are attached to provide detailed, school-level data. Appendix A provides tenth grade total enrollment and PSAT/NMSQT participation from the 2006-07, 2007-08, and 200-09 school years, disaggregated by ethnicity, for each school. Participation rates below 70% (schoolwide or for an ethnic group) during the 2008-09 school year are bolded for easy reference. Some instances of low school or ethnic group participation rates occurred at ESE or alternative centers or at locations with small enrollment numbers. Caution should be used when viewing results of groups with small enrollment numbers. Finally, no data are reported when fewer than 10 students are enrolled, and enrollments in 2008-09 of fewer than 50 students are shown in italics. Appendix B provides grade 10 PSAT/NMSQT mean scale scores for Black, Hispanic, and White students by school. Again, no data are reported when fewer than ten students were tested. Caution must be used when viewing gains or declines in Appendix B as the number of students in each ethnic group varies from school to school and year to year. Appendix C displays mean scores for tenth and eleventh grade participants during 2008-09 by school. The mean scores for tenth and eleventh grade students in the state and the nation are also provided for reference and comparative purposes. Again, caution should be exercised when comparing data within Florida to national averages, as most national participants are college-bound voluntary participants, whereas Florida provides the opportunity for all tenth grade students to participate at no cost.
Research, Evaluation, & Assessment 8 Student Assessment & School Performance
Ongoing Action What is the purpose of this report? Broward is committed to providing advanced educational opportunities which provide students with the experience and knowledge needed for success in college-level coursework. School staff members use PSAT/NMSQT results as a source of information to identify students for participation in upper-level course enrollment. Area Directors and Principals take steps to advocate increased participation, particularly where the schoolwide or ethnic group participation rate falls below 70%. How should staff use these data? Schools will use the data from this report to identify content areas of instructional strength and areas in need of improvement. Additionally, the Research Services Department and school guidance staff will analyze individual student PSAT results and use the College Board AP Potential Report to identify students for participation in high rigor courses.
References
College Board (2007). 2007-08 Official Educator Guide to the PSAT. Retrieved April 4, 2008, from
http://www.collegeboard.com/prod_downloads/counselors/psat/07_official_educator_guide.pdf
College Board (2009). PSAT/NMSQT 2008 State Summary Reports. Retrieved May 1, 2009,
from http://professionals.collegeboard.com/data-reports-research/psat/cb-jr-soph National Merit Scholarship Corporation (2008). National Merit Scholarship Program.
Retrieved April 12, 2008, from http://www.nationalmerit.org/nmsp.php Prepared by Thomas J. Eastwood, Database Researcher III, Student Assessment & School Performance
The School Board of Broward County, Florida Maureen S. Dinnen, Chair
Jennifer Leonard Gottlieb, Vice Chair Robin Bartleman
Beverly A. Gallagher Phyllis C. Hope
Stephanie Arma Kraft, Esq. Ann Murray
Robert D. Parks, Ed.D. Benjamin J. Williams
James F. Notter, Superintendent of Schools
The School Board of Broward County, Florida prohibits any policy or procedure that results in discrimination on
the basis of age, color, disability, gender, national origin, marital status, race, religion, or sexual orientation.

Research, Evaluation, & Assessment 9 Student Assessment & School Performance
Appendix A The School Board of Broward County PSAT/NMSQT Recap Report
Grade 10 School Enrollment and PSAT/NMSQT Participation by Ethnicity 2006-07 through 2008-09
Total Black Hispanic White n n % N n % n n % n n %
School Year Enroll Part. Part. Enroll Part. Part. Enroll Part. Part. Enroll Part. Part. 2007 141 121 86% 53 45 85% 38 32 84% 45 40 89% 2008 135 131 96% 43 43 100% 35 33 94% 47 46 98% Atlantic
Technical High 2009 149 146 98% 48 47 98% 35 34 97% 55 54 98% 2007 573 386 67% 491 342 70% 51 25 49% 22 12 55% 2008 505 410 81% 421 344 82% 46 34 74% 19 15 79% Blanche Ely 2009 502 388 77% 415 329 79% 55 36 65% 19 13 68% 2007 679 437 64% 600 380 63% 41 26 63% 17 12 71% 2008 546 409 75% 493 370 75% 23 17 74% 9 * * Boyd Anderson 2009 623 446 72% 566 397 70% 29 24 83% 8 6 75% 2007 50 17 34% 1 * * 14 7 50% 35 10 29% 2008 53 8 15% 6 * * 14 1 7% 32 5 16% Broward Virtual 2009 85 20 24% 13 1 8% 15 4 27% 38 10 26% 2007 666 476 71% 398 283 71% 130 87 67% 109 84 77% 2008 631 442 70% 384 258 67% 119 96 81% 95 64 67% Coconut Creek 2009 587 494 84% 379 318 84% 108 96 89% 77 59 77% 2007 608 515 85% 28 21 75% 117 92 79% 429 373 87% 2008 566 512 90% 28 26 93% 85 66 78% 405 373 92% Cooper City 2009 596 543 91% 23 18 78% 130 117 90% 398 363 91% 2007 631 497 79% 149 102 68% 139 106 76% 298 271 91% 2008 595 489 82% 134 98 74% 149 111 74% 256 228 89% Coral Glades 2009 605 497 82% 122 97 80% 155 121 78% 267 226 85% 2007 610 485 80% 175 136 78% 125 99 79% 267 216 81% 2008 551 482 87% 149 123 83% 138 117 85% 216 198 92% Coral Springs 2009 627 559 89% 193 170 88% 152 137 90% 234 208 89% 2007 1,421 1,222 86% 72 56 78% 636 540 85% 641 558 87% 2008 1,388 1,258 91% 63 55 87% 598 535 89% 643 585 91% Cypress Bay 2009 880 837 95% 46 40 87% 397 376 95% 383 367 96%
(Appendix A continues)

Research, Evaluation, & Assessment 10 Student Assessment & School Performance
Appendix A (continued). Total Black Hispanic White
n n % n n % n n % n n % School Year Enroll Part. Part. Enroll Part. Part. Enroll Part. Part. Enroll Part. Part.
2007 577 401 69% 313 222 71% 105 64 61% 131 90 69% 2008 546 433 79% 273 211 77% 90 66 73% 148 123 83% Deerfield Beach 2009 666 548 82% 309 249 81% 139 114 82% 179 148 83% 2007 524 375 72% 443 307 69% 34 29 85% 39 34 87% 2008 383 303 79% 342 270 79% 12 10 83% 19 16 84% Dillard 2009 488 414 85% 447 375 84% 16 16 100% 19 18 95% 2007 950 732 77% 270 202 75% 411 311 76% 191 158 83% 2008 898 752 84% 214 175 82% 432 356 82% 184 161 88% Everglades 2009 721 583 81% 264 217 82% 296 234 79% 86 67 78% 2007 777 628 81% 187 154 82% 301 234 78% 212 171 81% 2008 754 629 83% 192 161 84% 279 225 81% 217 182 84% Flanagan,
Charles W. 2009 813 733 90% 195 170 87% 344 309 90% 201 183 91% 2007 365 293 80% 223 184 83% 35 29 83% 96 71 74% 2008 399 336 84% 244 202 83% 49 41 84% 91 79 87% Fort Lauderdale 2009 469 395 84% 294 245 83% 43 33 77% 117 104 89% 2007 402 279 69% 254 173 68% 113 78 69% 31 26 84% 2008 363 286 79% 227 179 79% 99 75 76% 29 25 86% Hallandale 2009 377 310 82% 237 196 83% 106 90 85% 29 20 69% 2007 583 446 77% 115 80 70% 192 153 80% 250 197 79% 2008 554 436 79% 114 87 76% 202 161 80% 215 168 78% Hollywood Hills 2009 509 370 73% 117 79 68% 168 126 75% 195 143 73% 2007 643 471 73% 173 126 73% 275 197 72% 153 122 80% 2008 623 471 76% 160 122 76% 273 198 73% 145 113 78% McArthur 2009 567 455 80% 149 124 83% 266 218 82% 116 83 72% 2007 150 130 87% 26 20 77% 48 40 83% 67 62 93% 2008 151 146 97% 22 22 100% 61 60 98% 59 56 95%
William T. McFatter Technical 2009 140 137 98% 29 26 90% 51 50 98% 53 53 100%
2007 848 597 70% 579 396 68% 174 129 74% 47 33 70% 2008 868 666 77% 630 475 75% 156 128 82% 32 21 66% Miramar 2009 760 650 86% 555 472 85% 140 117 84% 25 21 84%
(Appendix A continues)
Research, Evaluation, & Assessment 11 Student Assessment & School Performance
Appendix A (continued). Total Black Hispanic White
n n % n n % n n % n n % School Year Enroll Part. Part. Enroll Part. Part. Enroll Part. Part. Enroll Part. Part.
2007 535 426 80% 56 41 73% 154 124 81% 288 230 80% 2008 580 442 76% 104 78 75% 154 116 75% 292 222 76% Monarch 2009 575 508 88% 88 76 86% 161 142 88% 283 250 88% 2007 528 407 77% 140 111 79% 162 122 75% 207 157 76% 2008 525 436 83% 147 116 79% 161 142 88% 203 168 83% Northeast 2009 551 487 88% 143 124 87% 188 171 91% 199 171 86% 2007 569 476 84% 208 161 77% 101 88 87% 218 189 87% 2008 533 505 95% 224 207 92% 102 102 100% 157 153 97% Nova 2009 564 535 95% 207 192 93% 109 103 94% 200 192 96% 2007 671 521 78% 331 244 74% 121 97 80% 182 147 81% 2008 723 598 83% 387 313 81% 115 94 82% 172 148 86% Piper 2009 654 570 87% 314 269 86% 129 113 88% 162 145 90% 2007 692 541 78% 412 312 76% 101 78 77% 145 120 83% 2008 593 476 80% 343 279 81% 96 70 73% 109 87 80% Plantation 2009 545 446 82% 338 272 80% 86 75 87% 84 63 75% 2007 366 328 90% 108 95 88% 46 42 91% 196 177 90% 2008 292 286 98% 75 71 95% 33 33 100% 160 158 99% Pompano Beach 2009 314 310 99% 65 63 97% 56 56 100% 171 165 96% 2007 667 481 72% 152 105 69% 234 167 71% 251 186 74% 2008 557 440 79% 158 133 84% 162 111 69% 212 172 81% South Broward 2009 572 483 84% 166 136 82% 201 167 83% 169 149 88% 2007 674 506 75% 304 213 70% 139 104 75% 215 176 82% 2008 716 607 85% 315 249 79% 146 125 86% 214 193 90% South Plantation 2009 699 599 86% 308 244 79% 148 130 88% 205 187 91% 2007 805 674 84% 70 54 77% 114 83 73% 570 490 86% 2008 810 744 92% 74 67 91% 113 99 88% 549 512 93%
Stoneman Douglas, Marjory 2009 798 726 91% 90 86 96% 106 93 88% 545 493 90%
2007 506 377 75% 310 221 71% 109 91 83% 56 37 66% 2008 428 356 83% 268 224 84% 89 77 87% 50 37 74% Stranahan 2009 465 384 83% 310 257 83% 83 64 77% 48 42 88%
(Appendix A continues)
Research, Evaluation, & Assessment 12 Student Assessment & School Performance
Appendix A (continued). Total Black Hispanic White
n n % n n % n n % n n % School Year Enroll Part. Part. Enroll Part. Part. Enroll Part. Part. Enroll Part. Part.
2007 740 595 80% 107 86 80% 210 158 75% 396 328 83% 2008 714 607 85% 109 88 81% 213 180 85% 333 287 86% Taravella, J.P. 2009 723 636 88% 129 114 88% 241 206 85% 304 274 90% 2007 n/a 2008 n/a West Broward 2009 698 640 92% 83 77 93% 280 251 90% 277 257 93% 2007 637 484 76% 35 26 74% 133 94 71% 440 343 78% 2008 684 567 83% 28 21 75% 154 115 75% 466 397 85% Western 2009 845 763 90% 38 35 92% 285 258 91% 478 431 90%
Centers 2007 21 2 10% 8 * * 2 * * 11 0 0% 2008 13 4 31% 4 * * 0 * * 9 * * Cross Creek 2009 17 5 29% 3 1 33% 4 2 50% 10 1 10% 2007 13 3 23% 7 * * 3 * * 2 * * 2008 15 3 20% 6 * * 5 * * 4 * * Cypress Run
Alternative 2009 13 9 69% 9 5 56% 4 4 100% * * * 2007 112 44 39% 69 23 33% 20 10 50% 20 9 45% 2008 99 25 25% 57 14 25% 25 6 24% 16 4 25%
Dave Thomas Education Center 2009 94 52 55% 65 35 54% 18 10 56% 9 6 67%
2007 145 40 28% 96 25 26% 36 12 33% 9 * * 2008 164 40 24% 109 25 23% 43 10 23% 10 3 30% Hallandale
Adult 2009 83 36 43% 54 20 37% 22 8 36% 6 7 117% 2007 31 16 52% 13 5 38% 4 * * 13 7 54% 2008 17 12 71% 6 * * 3 * * 8 * *
Lanier-James Education Center 2009 15 7 47% 7 4 57% 4 3 75% 4 0 0%
2007 10 2 20% 6 * * 1 * * 3 * * 2008 6 * * 4 * * 1 * * 1 * *
Pine Ridge Alternative Center 2009 11 4 36% 8 2 25% 2 0 0% 1 1 100% (Appendix A continues)

Research, Evaluation, & Assessment 13 Student Assessment & School Performance
Appendix A (continued). Total Black Hispanic White
n n % n n % n n % n n % School Year Enroll Part. Part. Enroll Part. Part. Enroll Part. Part. Enroll Part. Part.
2007 63 0 0% 50 0 0% 5 * * 6 * * 2008 51 6 12% 44 5 11% 5 * * 0 * * Seagull 2009 37 8 22% 30 6 20% 3 0 0% 1 1 100% 2007 27 0 0% 15 0 0% 3 * * 9 * * 2008 29 1 3% 18 0 0% 3 * * 8 * * Sunset School 2009 22 9 41% 13 4 31% 1 1 100% 8 4 50% 2007 153 47 31% 143 46 32% 5 * * 4 * * 2008 145 39 27% 136 38 28% 5 * * 3 * *
Whiddon-Rogers Education Center 2009 165 89 54% 156 85 54% 5 1 20% 2 2 100%
2007 22 12 55% 7 * * 5 * * 10 5 50% 2008 15 11 73% 6 * * 2 * * 7 * * Whispering
Pines 2009 26 21 81% 8 8 100% 7 6 86% 10 6 60%
*No data reported when fewer than 10 students enrolled. Enrollments with fewer than 50 students during the 2008-09 school year are italicized. Schools with less than 70% participation (schoolwide or for an ethnic group) during the 2008-09 school year are bolded for easy reference.

Research, Evaluation, & Assessment 14 Student Assessment & School Performance
Appendix B The School Board of Broward County PSAT/NMSQT Recap Report
PSAT/NMSQT Grade 10 School Mean Scale Score (M) and Number of Participants (n) for Critical Reading (CR), Mathematics (M), and Writing (W) by Ethnicity 2006-07 through 2008-09
Black Hispanic White School Year CR M W CR M W CR M W
M 42.6 44.3 39.6 43.4 47.1 39.4 46.7 48.0 43.2 2007 n 45 45 45 32 32 32 40 40 40
M 44.6 43.6 42.4 43.7 47.4 41.8 44.9 48.7 40.5 2008 n 43 43 43 33 33 33 46 46 46
M 46.4 45.5 43.2 44.9 47.1 42.9 47.2 47.9 43.7
Atlantic Technical Center
2009 n 47 47 47 34 34 34 54 54 54 M 36.3 37.7 33.8 34.8 39.8 33.4 39.8 41.7 34.1
2007 n 342 342 342 25 25 25 12 12 11 M 36.4 38.8 35.6 32.3 34.1 31.1 38.5 39.1 38.1
2008 n 344 344 344 34 34 34 15 15 15 M 34.8 37.2 34.4 31.4 33.9 31.3 39.9 41.3 33.4
Blanche Ely
2009 n 329 329 327 36 36 35 13 13 13 M 35.5 36.9 32.7 40.6 43.8 39.0 49.9 53.2 47.2
2007 n 380 379 376 26 26 26 12 12 12 M 34.1 37.0 34.3 40.1 45.9 40.2 * * *
2008 n 370 370 370 17 17 17 3 3 3 M 33.7 35.5 33.6 32.2 34.5 34.6 * * *
Boyd Anderson
2009 n 397 397 395 24 24 24 6 6 6 M * * * 49.9 46.1 42.6
2007 n 0 0 0 7 7 7 10 10 10 M * * * * * *
2008 n 0 0 0 1 1 1 5 5 5 M * * * * * * 45.6 47.2 44.5
Broward Virtual
2009 n 1 1 1 4 4 4 10 10 10 (Appendix B continues)

Research, Evaluation, & Assessment 15 Student Assessment & School Performance
Appendix B (continued). Black Hispanic White
School Year CR M W CR M W CR M W M 34.6 35.3 32.3 34.3 35.1 32.2 38.9 39.4 34.5
2007 n 282 283 277 87 87 87 84 84 84 M 33.3 34.2 32.6 32.9 35.3 32.7 36.8 42.0 33.9
2008 n 258 258 258 96 96 96 64 64 64 M 31.1 34.3 31.8 33.8 36.4 33.3 38.3 41.3 37.0
Coconut Creek
2009 n 318 318 313 96 96 94 59 58 58 M 36.7 42.8 38.5 43.1 45.9 40.0 44.2 47.8 42.6
2007 n 21 21 21 92 92 92 373 372 373 M 40.6 41.7 38.7 42.5 45.8 42.0 42.9 46.7 42.0
2008 n 26 26 26 66 66 66 373 373 373 M 37.6 36.5 38.8 43.3 45.2 41.3 44.4 47.0 42.8
Cooper City
2009 n 18 18 17 117 117 116 363 363 362 M 37.8 38.4 35.7 39.0 41.3 36.7 43.4 45.2 40.8
2007 n 102 102 102 106 106 106 251 251 251 M 36.8 37.6 34.8 39.8 40.7 38.1 44.1 45.9 41.3
2008 n 98 98 98 111 111 111 228 228 228 M 35.8 36.8 35.4 37.7 40.4 37.5 44.3 46.5 41.9
Coral Glades
2009 n 97 97 97 121 121 120 226 226 226 M 36.1 38.0 33.8 38.8 40.3 36.5 44.5 47.2 41.5
2007 n 136 135 134 99 99 98 216 216 216 M 35.3 37.0 33.2 38.2 39.6 35.4 42.3 44.8 39.5
2008 n 123 123 123 117 117 117 198 198 198 M 36.1 37.9 36.0 37.4 40.0 36.2 43.0 45.8 41.6
Coral Springs
2009 n 170 168 168 137 137 134 208 208 208 M 40.4 41.5 37.4 42.5 45.5 40.2 44.7 48.0 42.3
2007 n 56 56 56 540 540 539 558 558 555 M 44.8 45.6 43.7 42.2 45.9 40.9 45.5 49.1 43.7
2008 n 55 55 55 535 535 535 535 535 535 M 44.1 46.6 43.3 44.5 47.5 42.4 47.6 50.9 45.3
Cypress Bay
2009 n 40 40 40 376 376 376 367 367 367 (Appendix B continues)
Research, Evaluation, & Assessment 16 Student Assessment & School Performance
Appendix B (continued). Black Hispanic White
School Year CR M W CR M W CR M W M 35.4 36.4 32.9 36.1 39.6 33.8 43.8 45.9 40.7
2007 n 222 222 219 64 64 64 90 90 90 M 34.5 36.6 33.2 40.2 42.5 38.2 43.3 48.0 43.4
2008 n 211 211 211 66 66 66 123 123 123 M 32.8 35.2 33.7 35.2 36.9 34.8 42.5 46.1 40.4
Deerfield Beach
2009 n 249 249 248 114 114 113 148 148 147 M 35.2 37.2 32.9 39.1 42.4 38.1 48.2 49.8 43.3
2007 n 307 307 304 29 29 28 34 34 34 M 34.9 37.7 33.7 39.9 42.8 36.1 47.7 48.3 46.9
2008 n 270 270 270 10 10 10 16 16 16 M 34.6 37.8 33.9 41.6 43.2 38.9 42.8 45.2 41.8
Dillard
2009 n 375 373 368 16 16 16 18 18 18 M 39.4 40.1 37.4 41.3 43.8 38.6 42.8 46.0 41.6
2007 n 202 202 202 311 311 310 158 157 156 M 38.2 39.7 37.2 40.1 43.7 39.6 41.9 45.3 40.9
2008 n 175 175 175 356 356 356 161 161 161 M 38.0 39.1 36.1 39.7 41.6 38.4 41.4 42.5 40.1
Everglades
2009 n 217 216 216 234 234 234 67 67 65 M 38.5 38.1 35.1 39.3 41.2 37.4 42.5 44.8 40.1
2007 n 154 154 154 234 234 233 171 171 171 M 38.2 39.0 37.8 38.7 40.5 37.6 43.0 45.0 41.3
2008 n 161 161 161 225 225 225 182 182 182 M 36.9 38.9 35.6 41.2 43.0 40.0 42.3 45.1 40.5
Flanagan, Charles W.
2009 n 170 170 170 309 309 309 183 183 183 M 38.5 38.5 36.3 40.7 42.4 37.3 44.6 44.4 42.0
2007 n 183 184 180 29 29 29 71 71 70 M 38.5 40.6 37.1 40.0 43.0 39.0 44.3 45.8 44.1
2008 n 202 202 202 41 41 41 79 79 79 M 38.4 40.2 37.0 43.3 47.0 41.3 46.0 48.0 44.6
Fort Lauderdale
2009 n 245 245 245 33 33 33 104 104 104 (Appendix B continues)

Research, Evaluation, & Assessment 17 Student Assessment & School Performance
Appendix B (continued). Black Hispanic White
School Year CR M W CR M W CR M W M 34.7 35.2 31.9 35.1 36.7 33.7 40.3 40.2 34.9
2007 n 173 173 169 78 78 75 26 26 26 M 35.5 36.9 37.8 38.5 39.4 37.4 39.0 36.8 38.1
2008 n 179 179 179 75 75 75 25 25 25 M 34.4 35.3 34.2 37.0 38.1 37.2 39.4 41.4 39.8
Hallandale
2009 n 196 196 194 90 89 89 20 20 20 M 35.6 35.9 32.1 35.8 37.5 34.0 38.3 40.0 35.7
2007 n 80 80 78 153 152 151 197 196 195 M 32.8 35.2 32.5 35.3 37.4 32.6 37.8 40.7 38.0
2008 n 87 87 87 161 161 161 168 168 168 M 32.2 34.2 32.4 36.8 38.2 36.7 38.2 41.5 36.5
Hollywood Hills
2009 n 79 79 77 126 125 125 143 143 143 M 34.6 36.7 32.4 36.4 38.4 34.5 40.4 43.2 39.2
2007 n 126 126 126 197 197 195 122 122 122 M 34.2 35.7 33.2 35.6 38.0 34.8 37.7 41.3 36.0
2008 n 122 122 122 198 198 198 113 113 113 M 35.4 37.2 34.7 37.5 39.6 36.0 39.7 43.1 38.4
McArthur
2009 n 124 124 124 218 218 216 83 83 83 M 44.1 43.5 39.6 44.3 46.1 39.5 47.6 49.9 43.3
2007 n 20 20 20 40 40 40 62 62 62 M 45.6 46.3 42.7 47.1 49.0 44.3 45.3 47.1 44.5
2008 n 22 22 22 60 60 60 56 56 56 M 45.6 44.3 41.6 46.2 46.9 42.8 47.3 49.0 44.6
William T. McFatter Technical
2009 n 26 26 26 50 50 50 55 55 55 M 36.2 37.2 33.4 36.8 40.1 35.2 42.4 44.9 40.1
2007 n 396 396 385 129 128 126 33 33 32 M 35.6 37.7 34.3 36.8 39.1 35.2 39.9 43.4 38.8
2008 n 475 475 475 128 128 128 21 21 21 M 36.2 38.7 34.9 39.2 41.1 36.8 46.9 47.0 43.4
Miramar
2009 n 472 472 472 117 117 117 21 21 21 (Appendix B continues)

Research, Evaluation, & Assessment 18 Student Assessment & School Performance
Appendix B (continued). Black Hispanic White
School Year CR M W CR M W CR M W M 37.4 37.7 34.4 38.4 40.0 35.9 41.1 43.6 38.1
2007 n 41 41 41 124 124 124 230 229 229 M 36.8 37.5 35.7 38.2 42.6 37.1 40.4 43.4 39.3
2008 n 78 78 78 116 116 116 222 222 222 M 36.9 37.9 36.3 37.8 41.9 38.0 39.3 42.9 38.6
Monarch
2009 n 76 76 76 142 142 141 250 249 249 M 38.0 38.1 34.0 37.2 39.9 35.6 40.9 43.0 38.7
2007 n 111 110 110 122 121 121 157 157 156 M 36.6 39.4 33.8 36.3 38.2 34.3 38.8 41.1 36.7
2008 n 116 116 116 142 142 142 168 168 168 M 36.3 38.4 35.9 37.7 39.4 36.3 40.1 42.2 38.1
Northeast
2009 n 124 124 124 171 171 170 171 170 167 M 40.0 40.9 37.0 40.9 42.3 39.1 44.6 47.1 41.8
2007 n 161 161 161 88 88 88 189 188 188 M 39.9 41.6 38.7 38.8 41.3 37.7 44.6 46.0 41.8
2008 n 207 207 207 102 102 102 153 153 153 M 40.3 41.2 38.4 40.5 43.0 39.5 46.4 48.7 44.6
Nova
2009 n 192 192 192 103 103 103 192 192 192 M 36.0 37.2 33.5 36.9 39.3 34.2 42.3 44.7 38.1
2007 n 244 244 242 97 97 96 147 147 146 M 34.6 37.0 34.4 35.8 38.4 35.7 38.8 42.1 39.0
2008 n 313 313 313 94 94 94 148 148 148 M 35.7 38.1 35.1 38.3 41.4 37.2 39.6 43.0 37.7
Piper
2009 n 268 268 268 113 113 112 145 145 144 M 36.3 36.7 33.4 37.0 37.7 35.3 42.6 44.3 39.5
2007 n 312 312 311 78 77 78 120 120 120 M 35.3 36.6 34.6 35.6 38.8 35.1 39.9 42.7 39.9
2008 n 279 279 279 70 70 70 87 87 87 M 34.4 36.0 34.4 35.7 38.6 35.4 39.5 41.8 36.8
Plantation
2009 n 270 270 270 75 75 75 63 63 63 (Appendix B continues)

Research, Evaluation, & Assessment 19 Student Assessment & School Performance
Appendix B (continued). Black Hispanic White
School Year CR M W CR M W CR M W M 45.9 46.5 43.2 46.2 48.5 44.3 47.4 48.7 45.2
2007 n 95 95 95 42 42 42 177 177 177 M 45.7 45.7 44.4 47.1 50.8 48.6 46.0 48.1 46.2
2008 n 71 71 71 33 33 33 158 158 158 M 46.2 47.6 42.3 47.2 49.6 44.9 48.6 41.3 46.3
Pompano Beach
2009 n 63 63 63 58 58 58 165 165 165 M 33.1 34.7 30.6 37.1 37.4 33.9 42.0 42.8 39.4
2007 n 105 105 102 167 167 165 186 186 186 M 33.3 34.6 32.0 35.6 37.5 34.7 40.6 42.7 39.5
2008 n 133 133 133 111 111 111 172 172 172 M 32.7 34.8 33.1 35.1 37.2 36.3 42.0 42.9 40.6
South Broward
2009 n 136 135 134 167 166 162 149 147 146 M 36.2 37.4 33.5 40.8 42.1 38.4 44.0 45.9 41.7
2007 n 213 213 213 104 104 103 176 176 176 M 35.6 37.4 33.8 37.9 40.0 35.7 43.7 45.3 42.2
2008 n 249 249 249 125 125 125 193 193 193 M 35.8 37.4 34.4 38.1 41.6 37.4 43.8 47.3 41.4
South Plantation
2009 n 244 244 244 130 130 130 187 187 187 M 41.6 41.0 36.8 43.4 45.2 41.0 45.7 48.6 43.1
2007 n 54 54 53 83 83 83 490 488 487 M 41.0 40.7 39.9 43.7 44.9 41.2 45.6 47.7 44.2
2008 n 67 67 67 99 99 99 512 512 512 M 38.5 40.3 36.5 45.6 46.4 44.2 45.3 47.9 43.6
Stoneman Douglas, Marjory
2009 n 86 86 85 93 93 93 493 493 493 M 37.8 38.0 34.5 34.6 38.3 33.4 41.3 41.8 40.5
2007 n 221 221 221 91 91 89 37 36 36 M 36.2 37.6 35.7 36.5 36.6 34.9 41.6 41.9 38.6
2008 n 224 224 224 77 77 77 37 37 37 M 36.4 37.5 35.3 35.8 37.3 35.4 38.1 41.1 37.4
Stranahan
2009 n 257 257 255 64 64 63 42 42 41 (Appendix B continues)

Research, Evaluation, & Assessment 20 Student Assessment & School Performance
Appendix B (continued). Black Hispanic White
School Year CR M W CR M W CR M W M 38.3 38.3 34.5 37.3 39.9 36.2 43.5 45.9 40.7
2007 n 86 86 86 158 157 156 328 328 325 M 36.8 38.0 35.8 38.2 40.7 37.4 42.4 45.4 41.5
2008 n 88 88 88 180 180 180 287 287 287 M 38.6 39.5 36.7 40.0 42.2 38.5 43.0 46.4 41.3
Taravella, J.P.
2009 n 114 114 113 206 206 206 274 274 274 M
2007 n M
2008 n M 38.5 41.3 38.5 41.9 44.8 40.4 43.7 46.5 42.0
West Broward
2009 n 77 77 76 251 250 250 257 257 256 M 37.7 38.0 34.7 40.2 41.4 37.8 43.8 44.4 40.6
2007 n 26 26 26 94 94 93 343 343 339 M 38.2 41.8 37.4 38.2 41.2 37.4 42.2 45.5 40.9
2008 n 21 21 21 115 115 115 397 397 397 M 42.0 43.0 40.5 39.5 41.9 38.5 43.4 46.7 41.8
Western
2009 n 35 35 35 258 257 256 431 428 423 Centers
M * * * * * * 2007 n 1 1 1 1 1 1 0 0 0
M * * * 2008 n 0 0 0 0 0 0 4 4 4
M * * * * * * * * *
Cross Creek
2009 n 1 1 0 2 2 1 1 1 1 M * * *
2007 n 2 2 2 0 0 0 0 0 0 M * * * * * *
2008 n 2 2 2 0 0 0 1 1 1 M * * * * * *
Cypress Run Alternative
2009 n 5 5 4 4 3 3 0 0 0 (Appendix B continues)

Research, Evaluation, & Assessment 21 Student Assessment & School Performance
Appendix B (continued). Black Hispanic White
School Year CR M W CR M W CR M W M 32.1 32.3 27.3 32.4 30.5 * * * *
2007 n 23 21 17 10 10 6 9 9 9 M 29.1 32.1 30.1 * * * * * *
2008 n 14 14 14 6 6 6 4 4 4 M 27.8 31.9 29.6 32.0 32.8 30.5 * * *
Dave Thomas Education Center
2009 n 35 35 34 10 10 10 6 6 6 M 29.6 31.8 27.6 31.5 30.2 30.9 * * *
2007 n 25 24 23 12 12 10 3 2 2 M 28.9 28.2 28.1 35.0 34.4 30.7 * * *
2008 n 25 25 25 10 10 10 3 3 3 M 28.5 30.3 28.6 * * * * * *
Hallandale Adult
2009 n 20 19 17 8 8 7 7 7 6 M * * * * * * * * *
2007 n 5 5 5 3 3 3 7 7 6 M * * * * * * * * *
2008 n 4 4 4 2 2 2 6 6 6 M * * * * * *
Lanier-James Education Center
2009 n 4 4 4 3 3 3 0 0 0 M * * * * * *
2007 n 1 1 1 0 0 0 1 1 1 M * * *
2008 n 1 1 1 0 0 0 0 0 0 M * * * * * *
Pine Ridge Alternative Center
2009 n 2 2 2 0 0 0 2 2 2 M
2007 n 0 0 0 0 0 0 0 0 0 M * * * * * *
2008 n 5 5 5 1 1 1 0 0 0 M * * * * * *
Seagull
2009 n 6 6 6 0 0 0 1 1 1 (Appendix B continues)

Research, Evaluation, & Assessment 22 Student Assessment & School Performance
Appendix B (continued). Black Hispanic White
School Year CR M W CR M W CR M W M
2007 n 0 0 0 0 0 0 0 0 0 M * * * * * *
2008 n 0 0 0 1 1 1 5 5 5 M
The Quest Center
2009 n 0 0 0 0 0 0 0 0 0 M
2007 n 0 0 0 0 0 0 0 0 0 M * * * * * *
2008 n 0 0 0 3 3 3 8 8 8 M * * * * * * * * *
Sunset School
2009 n 4 4 3 1 1 1 4 4 4 M 29.2 30.1 28.4 * * *
2007 n 46 44 42 0 0 0 1 1 1 M 26.8 28.8 27.4 * * * * * *
2008 n 38 38 38 5 5 5 3 3 3 M 26.4 28.6 28.4 * * * * * *
Whiddon-Rogers Education Center
2009 n 85 85 83 1 1 1 2 2 2 M * * * * * * * * *
2007 n 3 3 1 4 4 2 5 4 4 M * * * * * * * * *
2008 n 6 6 6 2 2 2 7 7 7 M * * * * * * * * *
Whispering Pines
2009 n 8 8 7 6 6 6 6 5 5 *No data reported when fewer than 10 students participated.

Research, Evaluation, Assessment & Boundaries 23 Student Assessment & School Performance
Appendix C The School Board of Broward County PSAT/NMSQT Recap Report
Broward Grade 10 and 11 Total PSAT/NMSQT Participation and Mean Scores for Critical Reading (CR), Mathematics (M), and Writing (W), 2008-09
Grade 10 Grade 11 n CR M W n CR M W
Nation 41.6 44.0 41.0 46.7 48.8 45.8 Florida 40.0 42.1 38.8 47.3 48.7 45.9 Broward 39.6 42.0 38.4 49.0 51.0 47.3
School Atlantic Technical 146 46.3 46.7 43.1 98 47.8 50.6 44.9 Blanche Ely 385 35.0 37.4 34.4 51 46.9 48.9 46.0 Boyd Anderson 446 34.3 36.1 34.2 77 43.8 46.2 41.7 Broward Virtual 20 47.3 47.4 46.1 17 50.1 46.9 47.9 Coconut Creek 494 32.7 35.7 32.8 9 * * * College Academy at BCC 0 169 57.8 60.7 57.6 Cooper City 543 44.1 46.4 42.5 266 51.8 54.9 50.3 Coral Glades 497 40.7 43.1 39.3 139 49.1 49.5 46.8 Coral Springs 559 39.6 41.8 38.4 202 48.1 48.7 45.1 Cypress Bay 837 46.1 49.4 43.9 330 52.2 56.4 51.4 Deerfield Beach 548 37.1 39.7 36.6 92 54.2 59.0 51.6 Dillard 414 35.2 38.3 34.5 44 45.7 48.4 42.2 Everglades 583 39.5 41.3 37.8 101 47.8 49.1 45.4 Flanagan, Charles W. 733 40.6 42.8 39.1 121 52.6 54.2 51.4 Fort Lauderdale 395 40.8 43.0 39.4 115 49.0 50.5 46.2 Hallandale 310 35.7 36.6 3.5 45 42.9 43.4 40.6 Hollywood Hills 370 36.3 38.8 35.7 39 51.4 52.5 49.5 McArthur 455 37.3 39.7 36.2 58 44.6 44.9 41.5 William T. McFatter Technical
137 46.5 47.3 43.2 140 49.5 49.9 46.3
Miramar 650 37.5 40.0 35.9 46 49.7 52.9 47.7 Monarch 508 38.6 42.0 38.0 109 48.4 49.4 46.3 Northeast 487 38.2 40.2 36.9 16 44.4 42.8 41.8 Nova 535 43.0 44.9 41.2 257 48.0 49.5 46.7 Piper 570 37.7 40.4 36.5 215 43.0 44.1 40.3 Plantation 446 35.7 37.7 35.2 185 42.1 44.1 40.0 Pompano Beach 310 47.8 50.3 45.3 194 51.4 52.0 50.4 South Broward 483 36.7 48.5 36.8 83 47.6 48.9 46.1 South Plantation 599 39.3 41.8 37.6 168 48.7 50.3 47.5 Stoneman Douglas, Marjory 726 44.6 47.0 42.9 293 53.2 55.8 52.6 (Appendix C continues)
Research, Evaluation, Assessment & Boundaries 24 Student Assessment & School Performance
Appendix C (continued). Grade 10 Grade 11 n CR M W n CR M W
Stranahan 384 36.8 38.4 35.8 78 43.9 46.1 42.0 Taravella, J.P. 636 41.3 43.8 39.5 142 49.8 50.9 48.3 West Broward 640 42.5 45.3 41.0 175 50.8 53.2 49.1 Western 763 41.9 45.0 40.6 141 50.0 53.6 49.7
Center Cross Creek 5 * * * 0 Cypress Run 9 * * * 0 Dave Thomas Ed. Center 52 29.2 32.6 30.8 1 * * * Hallandale Adult 36 27.9 30.8 28.5 1 * * * Lanier-James Ed. Center 7 * * * 1 * * * Pine Ridge Alt. Center 4 * * * 0 Seagull 8 * * * 0 Sunset School 9 * * * 1 * * * Thompson Academy 19 36.7 40.0 32.6 3 * * * Whiddon-Rogers Ed. Center 89 26.9 28.8 28.3 1 * * * Whispering Pines 21 30.0 35.1 29.7 0 *No data reported when fewer than ten students tested.