Embed Size (px)
Citation preview
Mapping Social Cohesion The Scanlon Foundation surveys 2015
Professor Andrew Markus
Professor Andrew Markus
Mapping Social Cohesion The Scanlon Foundation surveys 2017
Mapping Social Cohesion The Australia@2015 survey
Professor Andrew Markus
Mapping Social Cohesion The Scanlon Foundation surveys 2015
Professor Andrew Markus
Professor Andrew Markus
• S
CAN
LON FOUNDATION
•
S U R V E Y S
10YEARS
Copies of this report can be accessed and downloaded atscanlonfoundation.org.au/research/surveys/and monash.edu/mapping-population
ISBN: 978-0-9945960-5-5Published 2017
This work is copyright. Apart from any use permitted under the Copywrite ACT 1968, no part of it may be reproduced by any process without written permission from the publisher.Requests and inquiries converning reproduction rights should be directed to the publisher:
ACJC, Faculty of ArtsMonash UniversityBuilding S, Level 9, Caulfield Campus900 Dandenong RoadCaulfield EastVictoria 3145Australia
CONTENTS
EXECUTIVE SUMMARY ..................................................................................................................... 1
SCOPE AND METHODOLOGY ........................................................................................................... 6
WEIGHTING OF SURVEY RESULTS .................................................................................................... 7
MODE EFFECT AND ONLINE PANELS ................................................................................................ 8
POPULATION GROWTH .................................................................................................................. 10
COUNTRY OF BIRTH ........................................................................................................................ 13
ETHNIC DIVERSITY .......................................................................................................................... 15
WHAT IS SOCIAL COHESION? ......................................................................................................... 23
THE SCANLON‐MONASH INDEX (SMI) OF SOCIAL COHESION ....................................................... 24
COMPONENTS OF THE SCANLON‐MONASH INDEX ....................................................................... 26
RANKING OF ISSUES ....................................................................................................................... 33
DEMOCRACY .................................................................................................................................. 36
IMMIGRATION ................................................................................................................................ 46
SELECTING IMMIGRANTS ............................................................................................................... 54
EXPERIENCE OF DISCRIMINATION ................................................................................................. 59
TRUST AND VOLUNTARY WORK..................................................................................................... 62
MULTICULTURALISM ...................................................................................................................... 64
GENERATIONS ................................................................................................................................ 68
REGIONS ......................................................................................................................................... 73
POLITICAL IDENTIFICATION ............................................................................................................ 81
BALANCE OF AUSTRALIAN OPINION .............................................................................................. 88
ACKNOWLEDGEMENTS .................................................................................................................. 91
CREDITS .......................................................................................................................................... 91

Mapping Social Cohesion 2017: National Report 1
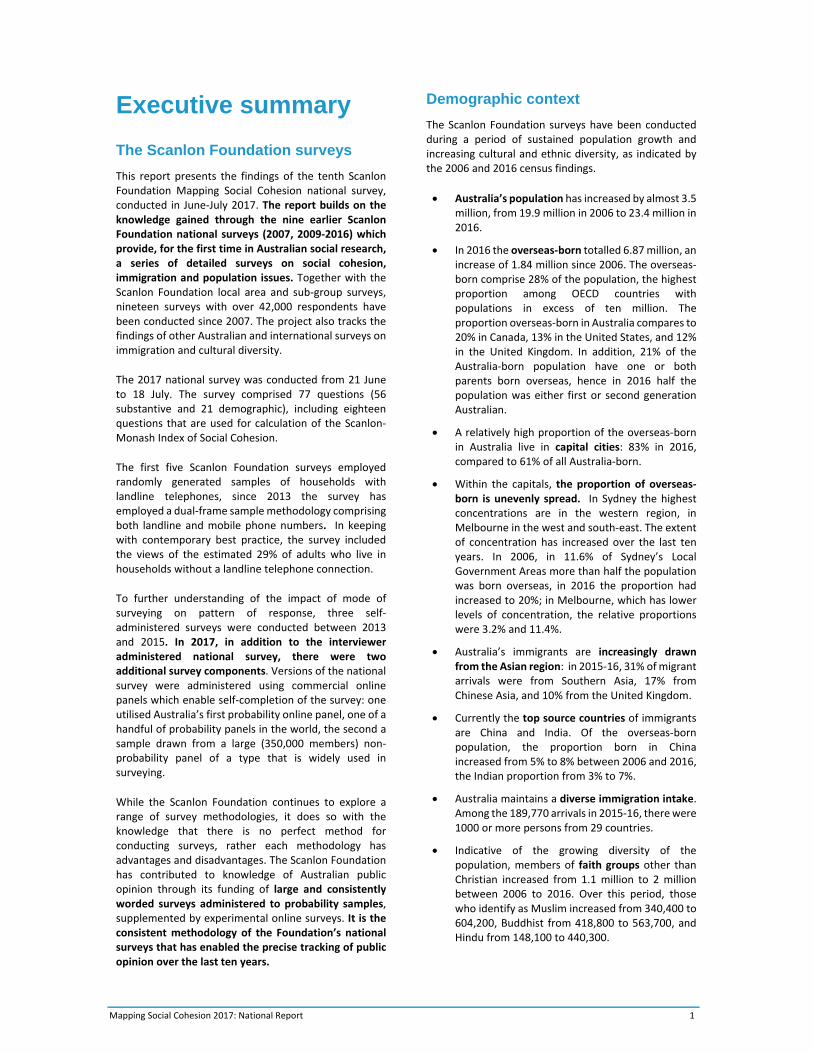
Executive summary
The Scanlon Foundation surveys
This report presents the findings of the tenth Scanlon Foundation Mapping Social Cohesion national survey, conducted in June‐July 2017. The report builds on the knowledge gained through the nine earlier Scanlon Foundation national surveys (2007, 2009‐2016) which provide, for the first time in Australian social research, a series of detailed surveys on social cohesion, immigration and population issues. Together with the Scanlon Foundation local area and sub‐group surveys, nineteen surveys with over 42,000 respondents have been conducted since 2007. The project also tracks the findings of other Australian and international surveys on immigration and cultural diversity.
The 2017 national survey was conducted from 21 June to 18 July. The survey comprised 77 questions (56 substantive and 21 demographic), including eighteen questions that are used for calculation of the Scanlon‐Monash Index of Social Cohesion.
The first five Scanlon Foundation surveys employed randomly generated samples of households with landline telephones, since 2013 the survey has employed a dual‐frame sample methodology comprising both landline and mobile phone numbers. In keeping with contemporary best practice, the survey included the views of the estimated 29% of adults who live in households without a landline telephone connection.
To further understanding of the impact of mode of surveying on pattern of response, three self‐administered surveys were conducted between 2013 and 2015. In 2017, in addition to the interviewer administered national survey, there were two additional survey components. Versions of the national survey were administered using commercial online panels which enable self‐completion of the survey: one utilised Australia’s first probability online panel, one of a handful of probability panels in the world, the second a sample drawn from a large (350,000 members) non‐probability panel of a type that is widely used in surveying.
While the Scanlon Foundation continues to explore a range of survey methodologies, it does so with the knowledge that there is no perfect method for conducting surveys, rather each methodology has advantages and disadvantages. The Scanlon Foundation has contributed to knowledge of Australian public opinion through its funding of large and consistently worded surveys administered to probability samples, supplemented by experimental online surveys. It is the consistent methodology of the Foundation’s national surveys that has enabled the precise tracking of public opinion over the last ten years.
Demographic context
The Scanlon Foundation surveys have been conducted during a period of sustained population growth and increasing cultural and ethnic diversity, as indicated by the 2006 and 2016 census findings.
Australia’s population has increased by almost 3.5 million, from 19.9 million in 2006 to 23.4 million in 2016.
In 2016 the overseas‐born totalled 6.87 million, an increase of 1.84 million since 2006. The overseas‐born comprise 28% of the population, the highest proportion among OECD countries with populations in excess of ten million. The proportion overseas‐born in Australia compares to 20% in Canada, 13% in the United States, and 12% in the United Kingdom. In addition, 21% of the Australia‐born population have one or both parents born overseas, hence in 2016 half the population was either first or second generation Australian.
A relatively high proportion of the overseas‐born in Australia live in capital cities: 83% in 2016, compared to 61% of all Australia‐born.
Within the capitals, the proportion of overseas‐born is unevenly spread. In Sydney the highest concentrations are in the western region, in Melbourne in the west and south‐east. The extent of concentration has increased over the last ten years. In 2006, in 11.6% of Sydney’s Local Government Areas more than half the population was born overseas, in 2016 the proportion had increased to 20%; in Melbourne, which has lower levels of concentration, the relative proportions were 3.2% and 11.4%.
Australia’s immigrants are increasingly drawn from the Asian region: in 2015‐16, 31% of migrant arrivals were from Southern Asia, 17% from Chinese Asia, and 10% from the United Kingdom.
Currently the top source countries of immigrants are China and India. Of the overseas‐born population, the proportion born in China increased from 5% to 8% between 2006 and 2016, the Indian proportion from 3% to 7%.
Australia maintains a diverse immigration intake. Among the 189,770 arrivals in 2015‐16, there were 1000 or more persons from 29 countries.
Indicative of the growing diversity of the population, members of faith groups other than Christian increased from 1.1 million to 2 million between 2006 to 2016. Over this period, those who identify as Muslim increased from 340,400 to 604,200, Buddhist from 418,800 to 563,700, and Hindu from 148,100 to 440,300.
2 Mapping Social Cohesion 2017: National Report
Indicators of stability
Despite the magnitude of demographic change, the Scanlon Foundation surveys find consistency in the level of acceptance of immigration and cultural diversity – and a large measure of stability across key indicators of social cohesion, although a significant qualification is made in the following discussion.
Analysis of attitudes to immigration since the mid‐1980s indicates that it is an issue on which there was considerable volatility of opinion in past years. During the recession of the early 1990s a large majority (over 70% at its peak) supported a reduction in immigration. This contrasts with the findings of surveys since 2000, with most indicating that support has become the majority viewpoint.
The Scanlon Foundation surveys adopt a form of wording employed in surveys for over fifty years, asking respondents for their view of ‘the number of immigrants accepted into Australia’, with three response options, ‘too high,’ ‘about right’ and ‘too low.’ In 2007, 36% indicated ‘too high’, 53% ‘about right’ or ‘too low’, and 11% did not know or declined to answer; the result in 2017 is almost identical – 37% indicate ‘too high,’ 56% ‘about right’ or ‘too low,’ and 7% did not know or declined to answer.
In addition to the Scanlon Foundation surveys, the same or similarly worded question has been asked in five probability based surveys in 2016 and 2017; these include both interviewer and self‐administered questionnaires, and all seven have found support for a reduction in the immigration intake to be a minority position, in the range 35%‐42%.
Additional questions on immigration and cultural diversity in the Scanlon Foundation surveys have obtained a large measure of positive response.
In the 2017 survey, 63% agree or strongly agree that ‘accepting immigrants from many different countries makes Australia stronger’, 30% ‘disagree’ or ‘strongly disagree.’
Asked if in the selection of immigrants ‘it should be possible’ to reject applicants ‘purely on the basis of their race or ethnicity,’ or ‘their religion,’ 74%‐80% disagree, only a small minority, in the range 16%‐20%, agree.
Between 2013 and 2017 the Scanlon Foundation surveys have asked for response to the proposition that ‘multiculturalism has been good for Australia?’ Agreement has been consistently in the range 83%‐86%, disagreement between 10%‐12%. In the self‐completion Life in Australia survey conducted in 2017, a lower level of agreement was obtained, but it was still at 75%, with a low 15% indicating disagreement.
The Scanlon Foundation survey questions on a range of social cohesion indicators have consistently obtained a high level of positive response. Thus questions concerned with sense of belonging, identification with Australia, and life satisfaction, obtain positive response from more than 85% of respondents.
When asked ‘To what extent do you have a sense of belonging in Australia?’, 96% of respondents in 2007 and 92% in 2017 indicated to a ‘great’ or ‘moderate’ extent.
In response to a question on level of happiness over the last year, 89% in 2007 and 86% in 2017 indicated that they had been ‘very happy’ or ‘happy.’
Asked for their level of satisfaction with their ‘present financial situation,’ 73% in 2007 and 72% in 2017 indicated that they were ‘very satisfied’ or ‘satisfied.’
Patterns of change
While there is much evidence of continuing positive outlook, the ten years of surveying also provide evidence of change – and of increasing concerns among a minority of respondents.
Insight into changing perspectives is provided by response to the first question in the survey, which asks respondents to identify ‘the most important problem facing Australia today.’
The constant element has been concern over the economy, by a large margin the top ranked issue. There has, however, been a fall in attention to economic issues, from 36% of respondents in 2012 to 26% in 2017. The poor quality of government has been the second ranked issue, although again selected by a declining proportion, from a high of 15% to 10% in 2017.
Three issues have recorded substantial change. Concerns for the environment and climate change peaked in 2011 and subsequently declined, asylum seekers and boat arrivals were indicated by 12% of respondents in 2012‐13, and by just 2% in 2017. Concern sparked by terrorism and national security increased from less than 1% in 2014 to 10% the following year and has remained a top five ranked issue.
Mapping Social Cohesion 2017: National Report 3
There has also been increasing concern over immigration and population growth, but at a low level, indicated by an average of 3% of respondents between 2012‐15, 6% in 2017.
There is less indication of volatility of opinion in the systematic approach provided by the Scanlon‐Monash Index (SMI) of Social Cohesion.
The SMI aggregates response to 18 questions and was designed to show sensitivity to strong level response; thus in assessing response, ‘strong agreement’ (or ‘strong disagreement’) is weighted at double the score for ‘agreement’ (or ‘disagreement’). It measures response within five domains of social cohesion: belonging, worth, social justice, political participation, and acceptance/ rejection.
Over the course of the surveys, the SMI has declined from the baseline 100 in 2007 to 88.5 in 2017, which is equal to the lowest point across the surveys. Decline has not, however, been consistent across the ten years: by a large margin, the largest falls were in 2010 and 2013, with little variation in four of the last five years.
In 2017 the lowest Index scores are in the domains of social justice and acceptance/ rejection.
Indicative of change within the domain of social justice, in 2007 81% of respondents agreed with the proposition that Australia is a land of economic opportunity where hard work is rewarded, in 2017 a lower 75%
In 2007, 11% expected that their lives in three or four years would be worse, 19% in 2017.
Indicative of rejection, reported experience of discrimination ‘because of your skin colour, ethnic origin or religion’ has more than doubled, from 9% in 2007 to 20% in 2017.
A number of other questions have found increased negative response over time. One important aspect concerns perceived failures of Australian democracy and low level of trust in government.
Those indicating trust in the federal government ‘to do the right thing for the Australian people’ fell from 39% in 2007 to 29% in 2017.
In response to the proposition ‘I am able to have a real say on issues that are important to me in my local area,’ 70% of respondents indicated agreement when the question was first asked in 2011, 62% in 2017.
Regarding sense of personal safety, when respondents were asked if they were worried about becoming a victim of crime in their local area, 25% were worried in 2009, 35% in 2017.
A second perspective
The Scanlon Foundation surveys were begun with the knowledge that historically, immigration has been central to Australia’s economic and social development, a contribution that was unlikely to diminish in the foreseeable future. The surveys sought to provide evidence to address the critical question of Australia’s ability to sustain the migration and social cohesion success of the post‐war decades. Aspects of the 2017 findings bring into question the ability to maintain success.
One perspective on the ten years of Scanlon Foundation surveying rests on evidence of a large measure of stability, the absence of a major shift in mood – although across a number of indicators there has been an increase of 5‐10 percentage points in the proportion indicating negative views.
There is, however, the possibility to develop a second interpretation of the survey and demographic data presented in this report. This second perspective indicates that the Australia of 2017 is less resilient than the Australia of ten years earlier, less able to deal with economic and other crises that may eventuate in coming years.
First, there is an increasing geographical concentration of the overseas‐born populations, as indicated by the census analysis reported here. This increased concentration, particularly in Sydney and Melbourne, questions whether past patterns of integration are continuing, or whether new norms are being established whose consequences need to be better understood.
Second, the relatively high level of negative feeling towards Muslims is a factor that enters into evaluation of future risk. Questions in the Life in Australia survey conducted for the Scanlon Foundation indicate that 41% of respondents are negative towards Muslims, compared to 6% towards Buddhists. Focus group discussions undertaken for the Scanlon Foundation’s Australia@2015, and other projects, indicates that this negativity is in part fed by the reality – and the heightened perception – of radical rejectionism of Australia’s secular democratic values and institutions within segments of the Muslim population, which in 2016 was the largest of the non‐Christian faith groups.
Third, a closer examination of the ten years of Scanlon Foundation surveys indicate a potential weakness of interpretation based on aggregated data, in which the two levels of positive (‘strongly agree’ and ‘disagree’) or negative (‘strongly disagree’ and ‘disagree’) response are treated as one. The risk is that deteriorating results at the ‘strongly’ held level may be masked by such aggregation.
4 Mapping Social Cohesion 2017: National Report
This is indicated in response to a number of questions. Thus:
‘To what extent do you have a sense of belonging in Australia?’ Aggregated positive (‘great extent’ and ‘some extent’) was 96% in 2007, 92% in 2017; ‘To a great extent’ was 77% in 2007, 67% in 2017
‘Taking all things into consideration, would you say that over the last year you have been …happy’ Aggregated positive (‘very happy and ‘somewhat happy) was 89% in 2007, 85% in 2017; ‘Very happy’ was 34% in 2007, 26% in 2017
‘In three or four years, do you think that your life in Australia will be …’ Aggregated positive (‘much improved’ and ‘somewhat improved’) as 49% in 2007, 45% in 2017; ‘Much improved’ was 24% in 2007, 18% in 2017
‘Accepting immigrants from many different countries makes Australia stronger.’ Aggregated negative (‘Strongly disagree’ and ‘disagree’) was 26% in 2007, 30% in 2017; ‘Strongly disagree’ was 8% in 2007, 13% in 2017
Fourth, the failures of Australian democracy and the weakening of institutional trust may be of greater consequence than acknowledged by a narrow focus on recent survey findings. The comparison discussed in this report contrasts the upward trajectory of opinion in Canada with stagnant or negative trends in Australia. The 2017 Pew Research Centre survey conducted in both Canada and Australia found that 30% of Canadians were dissatisfied with the working of their democracy, 41% of Australians. Trust in the national government was at 67% in Canada, 48% in Australia.
A fifth factor is the decrease in electoral appeal of the major political parties, and the increased appeal of populist politics in Australia, in common with a number of western democracies. Voting patterns indicate that in 2016 support for minor parties and independents in the election for the House of Representatives was at 23%. While it has varied over time, this was the highest recorded, up from 15% in 2007; it was at 7% in 1983.
In 2007 Pauline Hanson’s One Nation was a historical memory, in 2017 a growing political force with representation in the Australian Senate and growing support at the state level, despite its failures in its earlier incarnation.
Potential to magnify discontent
Just as the impact of immigration is magnified through settlement concentrations in regions of the major cities, so the views of discontented minorities can be magnified by concentrations within sub‐groups of the population and regions, with impact through the political process.
Sub‐group analysis presented in this report highlights the extent of differentiation when attitudes are considered by self‐reported financial situation and level of education, age, and region of residence. Sub‐group analysis requires disaggregation of the sample, which increases the margin of possible error; for this reason, the aggregated data for the last three Scanlon Foundation national surveys, 2015‐17, is considered. This provides a sample comprising more than 5,000 respondents.
With reference to financial situation, trust in the federal government was indicated by an average of 29% across the survey, but a much lower 13% of those ‘struggling to pay bills’ or ‘poor,’ 23% ‘just getting along,’ and an above average 42% among ‘prosperous’ or ‘very comfortable.’
Support for major change or replacement of Australia’s system of government was at 41% across the survey, but at 68% among those ‘struggling to pay bills’ or ‘poor’, 46% ‘just getting along’, and 27% ‘prosperous’ or ‘very comfortable.’
Agreement with assistance by government to ethnic minorities for cultural maintenance was at 34% across the survey, a lower 21% aged 75 or over, 29% aged 45‐54, and at 62% aged 18‐24.
The value to Australia of ‘immigrants from many different countries’ was seen in positive terms by 63% across the survey, by 51% aged 75 or over, 63% aged 45‐54, and at 79% aged 18‐24.
When considered by geographical location, a diverse immigration intake was seen positively by 45% in remote areas, 62% outer regional, and 69% of residents in major cities.
The current immigration intake was seen as ‘too high’ by 37% of respondents across the survey, 55% of residents in remote areas, 43% outer regional, and 32% in major cities.
Mapping Social Cohesion 2017: National Report 5
Analysis presented in the final section of this report concludes that between 11%‐13% of the population is strongly negative regarding immigration and cultural diversity, a larger proportion, between 15%‐20% are strongly positive, while the majority, close to 65%, are in the middle ground, open to persuasion. In sub‐groups the middle ground can shrink, the strongly held positions increase. This is indicated by attitudes held among supporters of some political parties.
Within the mainstream, the supporters of the Liberal, National and Labor parties, there is recognition of problems, but radical change does not gain majority endorsement. Close to one third (29% Liberal, 36% Labor) agree that the system of government ‘needs major change’ or ‘should be replaced.’ A smaller, but not insubstantial, minority (19% Liberal, 25% Labor) agree that ‘having a strong leader who does not have to bother with parliament’ would be good for Australia.
A majority within the mainstream support the current immigration program, with 39% Liberal and 36% Labour indicating that the intake is ‘too high.’ Just 14% Liberal and 10% Labor supporters disagree with the view that ‘multiculturalism has been good for Australia.’
A larger proportion of Greens supporters reject the idea that strong autocratic leadership would be a good way of government and indicate higher levels of support for immigration and multiculturalism – although they also indicate higher levels of dissatisfaction with the failures of current government, with failure to address issues of social justice, and failure to give higher priority to environment and climate change, which for Greens supporters ranks as the ‘most important problem facing Australia today.’
In contrast with the mainstream, One Nation attracts a heightened level of discontented supporters. 37% of One Nation supporters consider that ‘having a strong leader who does not have to bother with parliament’ would be a ‘very good’ or ‘fairly good’ way of government. 63% have ‘no trust’ in political parties. 80% agree that Australia’s system of government ‘should be replaced’ or ‘needs major change’, Close to one‐third (35%) are ‘very pessimistic’ about Australia’s future, compared to 10% or less of supporters of the other three major political parties.
On immigration policy, 86% of One Nation supporters consider the intake to be ‘too high’, 82% disagree with the benefit to Australia of immigration ‘from many different countries,’ 60% agree with a selection process that provides scope for rejection based on religion. For One Nation supporters, immigration and population growth represent ‘the most important problem facing Australia.’
A reference point
The importance of the Scanlon Foundation surveys is highlighted in this discussion of the trend and segmentation of Australian opinion. The surveys provide a reference point to understand pattern and extent of change, of the views held within the mainstream and within minorities. They make possible the testing of claims about public opinion, for example the extent of support for multiculturalism. The surveys of the Scanlon Foundation and other organisations, based on probability samples, provide for understanding of Australia at a time of change and uncertainty.
6 Mapping Social Cohesion 2017: National Report
SCOPE AND METHODOLOGY
The 2017 Scanlon Foundation national survey is the tenth in the series, following the benchmark survey in 2007 and annual surveys since 2009.
The first five surveys sampled households with landline telephones. Since 2013 the survey has employed a dual‐frame sample methodology comprising both randomly generated landline telephone numbers and randomly generated mobile phone numbers. This means that, in‐line with contemporary best practice, the survey included the views of the estimated 29% of adults who live in households without a landline telephone connection on which to make and receive calls (the so‐called mobile phone‐only population). The sample blend used for the 2017 survey was 55% landline numbers and 45% mobile phone numbers. This blend yielded 307 interviews with the mobile phone‐only population (20% of the sample).
The 2007‐2012 surveys employed a national sample of 2,000 respondents; the 2014‐2017 survey samples were 1,500. The larger sample in the early years of the surveys was designed to enable analysis of sub‐groups. Given that the 2007‐2017 national surveys provide a database reference of 17,280 respondents, a 1,500 sample is adequate for interpretation of current trends within a number of sub‐groups. In 2017, to enable analysis of regional trends, Multicultural Affairs Queensland provided funding to increase the Queensland sample from an expected 270 to 1000. The sample base of the Scanlon Foundation national surveys is expected to yield a maximum sampling error of ±2.5 percentage points 19 times out of 20. For sub‐groups analysed, the margin of sampling error is larger.
There are three dimensions to the 2017 Scanlon Foundation social cohesion research program. The national survey, employing the Random Digital Dialling methodology of the Scanlon Foundation surveys described above; and two online surveys undertaken to explore the impact of mode of surveying administration and sample generation.
In 2017, versions of the national survey were administered using probability and non‐probability commercial online panels. The probability sample employed the Life in Australia (LinA) panel established by the Social Research Centre and achieved 2,290 completed surveys.
The LinA sample was obtained with 71% of surveys completed online and 29% by telephone, with telephone respondents included to ensure that the sample was representative of the population, given that not all have computer access, or are willing to complete a survey online.
The non‐probability sample employed the Online Research Unit (ORU) panel, which has over 350,000 members and achieved the targeted 400 (actual 412) completions: a nationally representative sample (203) employing screening questions relating to age, location and gender, and a boost (209) to obtain the views of One Nation supporters, employing additional screening questions relating to citizenship and intended vote.
The 2017 national survey employed the questionnaire structure common to the 2007‐2016 surveys, including the eighteen questions required for calculation of the Scanlon‐Monash Index of Social Cohesion. Each year there has been minor variation in the survey instrument. The 2017 national survey included additional questions on institutional trust, immigrant selection, contact across ethnic groups, politics, and sense of wellbeing. A number of these questions were asked in earlier surveys, but not in 2016. Thirteen questions were excluded from the 2017 survey, including questions on asylum seekers, refugees, immigrant categories, and experience of discrimination.
As in past years, the Scanlon Foundation national survey was administered by the Social Research Centre. Interviews were conducted by telephone (Computer Assisted Telephone Interviewing). Landline respondents were selected using the ‘next birthday’ method, for the mobile component the person answering. In addition to English, respondents had the option of completing the survey in one of the six most commonly spoken community languages: Vietnamese, Chinese (Cantonese and Mandarin), Italian, Greek and Arabic.
The 2017 national survey was conducted from 21 June to 18 July. It comprised 77 questions (56 substantive and 21 demographic) and took on average 18.4 minutes to complete by landline and 18.1 by mobile. The response rate for the national survey was 45%, compared to 50% in 2016.
The online surveys employed abbreviated versions of the national survey. The LinA survey was conducted from 3 to 23 July and comprised seven key questions related to immigration and cultural diversity and twelve demographic questions. The response rate was 74%. Panel members were offered an incentive of the value of $10, paid by gift voucher, deposit into a PayPal account or charitable donation.
Mapping Social Cohesion 2017: National Report 7
The ORU survey was conducted from 5 to 14 July and comprised 41 substantive and 20 demographic questions, designed to allow for completion in ten minutes. Panel members were offered an incentive of $1.50 for completing the survey.
Full technical details of surveying procedure and the questionnaire is provided in the methodological report, available for download on the Mapping Australia’s Population internet site.1
WEIGHTING OF SURVEY RESULTS
Survey data are weighted to adjust for the chance of being sampled in the survey and to bring the achieved respondent profile into line with Australian Bureau of Statistics (ABS) demographic indicators.
Raking techniques (also known as Rim weighting or iterative Proportional Fitting) were used to weight the data. The population benchmarks included in the weighting solution are: geographic location, gender, age by education, country of birth, and telephone status.
A two‐stage weighting procedure was utilised, in part to provide for the use of dual‐frame sampling. This involved calculating:
A design weight to adjust for the varying chances of selection of sample members; and
A post‐stratification weight used to align the data
with known population parameters.
Where possible, target proportions were taken from the Australian Bureau of Statistics June 2016 Estimated Resident Population counts. The following variables were weighted: state, gender, age (18–34, 35–44, 45–54, 55 plus) by education (university degree, no university degree), country of birth (Australia/ overseas English‐speaking country [Canada, Ireland, New Zealand, South Africa, the United Kingdom, and the United States], overseas non‐English speaking country), and telephone status (landline only, dual‐user, mobile phone only).
The LinA survey was weighted using the following variables in the regression model: gender, state/part of state, age/education, country of birth, telephone status, internet usage and frequency, number of adults in the household, number of landlines in the household, and number of mobile phones owned by the respondent.
The non‐probability survey was not weighted, on the recommendation of the Social Research Centre. It is the experience of the SRC (and internationally) that standard demographic weights for non‐probability surveys can take estimates further away from the truth of the population being investigated. Screening questions and quotas were, however, applied to ensure appropriate gender balance (achieved profile 49.5% male, 50.5% female), location (e.g. NSW 31%, target 32%, Victoria 23%, target 25%), although younger age groups were under‐represented (aged 18‐34 21%, target 31%; aged 65 or over 23%, target 20%).
1 See Mapping Australia’s Population at http://www.monash.edu/mapping‐population
8 Mapping Social Cohesion 2017: National Report
MODE EFFECT AND ONLINE PANELS
The use of interviewers in telephone surveying has the potential to lead to what is known as ‘social desirability bias’ (SDB). SDB refers to the tendency of respondents to give answers they believe are more socially desirable than responses that reflect their true feelings. This form of bias is of particular importance in questions that deal with socially sensitive or controversial issues, such as perception of minorities or government programs which provide assistance to sub‐groups.
An online questionnaire completed in privacy on a computer, or an anonymous printed questionnaire returned by mail, can provide conditions under which a respondent feels greater freedom to disclose opinions on sensitive topics. A 2010 report prepared for the American Association for Public Opinion Research (AAPOR) noted that ‘… respondents may be more honest and accurate when reporting confidentially on a computer.’ A prominent American researcher, Humphrey Taylor, observes that ‘where there is a “socially desirable” answer, substantially more people in our online surveys give the “socially undesirable” response. We believe that this is because online respondents give more truthful responses.’ Similarly, Roger Tourangeau and his co‐authors of The Science of Web Surveys report that a review of research ‘demonstrates that survey respondents consistently underreport a broad range of socially undesirable behaviours and over report an equally broad range of
socially desirable behaviours.’2
A second advantage of self‐completion is conceptualised in terms of ‘cognitive load’, referring in part to the scope to administer more complex questions in internet (or printed) surveys. This arises because respondents can control the pace at which they proceed through the questionnaire. Some research indicates that telephone based interviewing leads to a higher proportion of end point responses along a scale (for example, ‘strongly agree’ or ‘strongly disagree’), or a higher proportion of agreement with the most recently mentioned response option (known as the ‘recency’), compared to a higher proportion of mid‐point responses in online questionnaires.3
Given these potential gains from online surveying, together with substantially lower cost and completion in less time, why is not all surveying conducted utilising internet technology?
The answer is that typically it is not possible to establish that commercial panels are representative of the population. If all members of a population had computer access and their computer addresses were centrally listed, as in a telephone directory, then it would be possible to conduct internet random samples, but until recently that has not been the case. Internet surveying in Australia has been limited to using samples drawn from nonprobability opt‐in panels of survey volunteers maintained by commercial providers.
A further problem relates to what is termed ‘coverage error’ in internet surveys: there is a proportion of the population that does not use the internet, while others have internet access but will not complete surveys online. This causes problems for representing the views of some segments of the population, such as those over the age of 65, where those who are proficient in internet use may be very different from those within the same group who are not.4 Levels of education, computer literacy, and English language competence are additional issues.
With nonprobability commercial panels it is not possible to establish that the panel members, no matter the size of panel, are representative of the population; thus a specific personality type (for example, those with more negative social views) may be attracted to join a panel, either by opting in or accepting an invitation to participate; further, the younger and better educated are likely to be over‐represented.5
Detailed demographic information may be collected from those who join a panel and this information can be used to weight the survey results, so that in demographic terms the respondent profile matches the population, but it is much more difficult or impossible to scientifically weight attitudinal attributes.
2 AAPOR; Taylor The Polling Report, 2007; Roger Tourangeau Frederick Conrad and Mick Couper, The Science of Web Surveys, Oxford University Press, 2013, p. 133 3 Tourangeau, pp. 8, 146, 147, 150 4 Pew Research Centre, ‘Coverage Error in Internet Surveys: Who Web‐Only Surveys Miss and How That Affects Results’, 2015 5 AAPOR:35, pp. 129, 132
Mapping Social Cohesion 2017: National Report 9
In 2008 the AAPOR established a task force to ‘review the current empirical findings related to opt‐in panels utilized for data collection.’ Its report, released in March 2010, stated:
Computer administration yields more reports of socially undesirable attitudes and behaviours than oral interviewing, but no evidence that directly demonstrates that the computer reports are more accurate.6
The AAPOR task force also concluded that ‘researchers should avoid nonprobability online panels when one of the research objectives is to accurately estimate population values.’7
A more recent study, The Science of Web Surveys (2013), authored by Roger Tourangeau, Frederick Conrad and Mick Couper and published by Oxford University Press, reached a similar conclusion, although one that was not as strongly worded:
If the goal of the survey is to generalize to a known population start with a probability sample ….Probability samples seem to represent the population from which they were drawn more closely than self‐selected samples do.8
In the view of the authors, further research is required to establish the reason for differences in results by mode of administration.
Probability samples used in telephone surveying ensure that all members of a population (aged 18 or over) have an equal chance of being contacted to participate in a survey. A problem which arises in contemporary surveying is the low proportion (at times less than 20%) of respondents who accept the invitation to participate and hence bring into question the representative character of the sample.
In the Scanlon Foundation surveys the participation rate has been consistently high. As part of the measures taken to maximise response, after the sample is drawn letters explaining objectives of the survey are sent to potential respondents on Monash University letterhead. Potential respondents are also informed that the survey is being conducted by university researchers, not market researchers, with oversight by the University Ethics Committee. As noted above, In the 2017 Scanlon Foundation survey the response rate was 45%.
Informed by the potential limitations of internet surveying employing interviewer administered questionnaires, the Scanlon Foundation surveys began to experiment with parallel online surveys using available nonprobability commercial panels. These surveys were conducted at the same time as the telephone based survey. Prior to 2017, three online surveys were conducted, of recent arrivals (2013) and third/plus generation Australians (2014). In 2015 an opt in survey available in 20 languages was conducted online; with the active promotion by a broad range of community organisations and SBS radio, the survey was completed by some 10,548 respondents and its results were evaluated in the context of the probability samples obtained by the Scanlon Foundation national surveys and earlier non‐probability panel surveys.
In 2017, the Scanlon Foundation took advantage of the availability of Australia’s first online probability panel to further extend understanding of the impact of mode of surveying on the reliability of survey findings.
The Life in Australia Panel, established in 2016 by the Social Research Centre, is one of a handful of probability based panels in the world. Its members were randomly recruited via their telephones, both landline and mobile, and provided with an incentive of $20 to join the panel. To ensure representativeness, the panel includes individuals who do not have internet access or who indicate that they are unwilling to complete surveys online; they participate by telephone.
In addition to the Scanlon Foundation national survey administered by telephone, the Life in Australia panel was utilised to provide comparative data for seven key questions relating to immigration and cultural diversity. In addition, a nonprobability panel was employed to provide comparative data for 41 questions included in the national survey. It provided data from a nationally representative panel and from a sub‐group comprising One Nation supporters. Findings are presented in relevant sections of this report.
There is, however, no perfect method for conducting of surveys. One advantage of interviewer administration over self‐completion is the capacity to respond to doubts over question meaning that may occur to a respondent; level of literacy plays a role in self‐completion surveys. The ordering and visual placement of response options can also influence patterns of response. A major contribution of the Scanlon Foundation national surveys has been the use of consistent question wording and question order in probability samples conducted over ten years to establish the trend of Australian public opinion.
6 AAPOR, p. 34 7 AAPOR, p. 4 8 Tourangeau, p. 168
10 Mapping Social Cohesion 2017: National Report
POPULATION GROWTH
Australia has experienced above average population growth over the last decade.
Whereas annual population growth averaged 1.4% between 1970‐2010, between 2006‐2009 annual growth averaged above 1.7, with a peak of 2.1% in 2008‐09. Since then annual growth has been in the range 1.4%‐1.8%, with an estimated 1.6% in the year to December 2016.
Population growth is uneven across Australia. For the year to December 2016, Victoria’s population grew by 2.4% (1.9% in the year to December 2015), ACT 1.7% (1.4%), New South Wales 1.5% (1.4%), Queensland 1.5% (1.3%), Western Australia 0.7% (1.2%), South Australia 0.6% (0.7%), Tasmania 0.6% (0.4%), and Northern Territory 0.3% (0.3%).
At the 2016 census Australia’s resident population was 23,401,892, an increase of 3,546,605 (17.9%) over the population of 19,855,287 at the 2006 census.
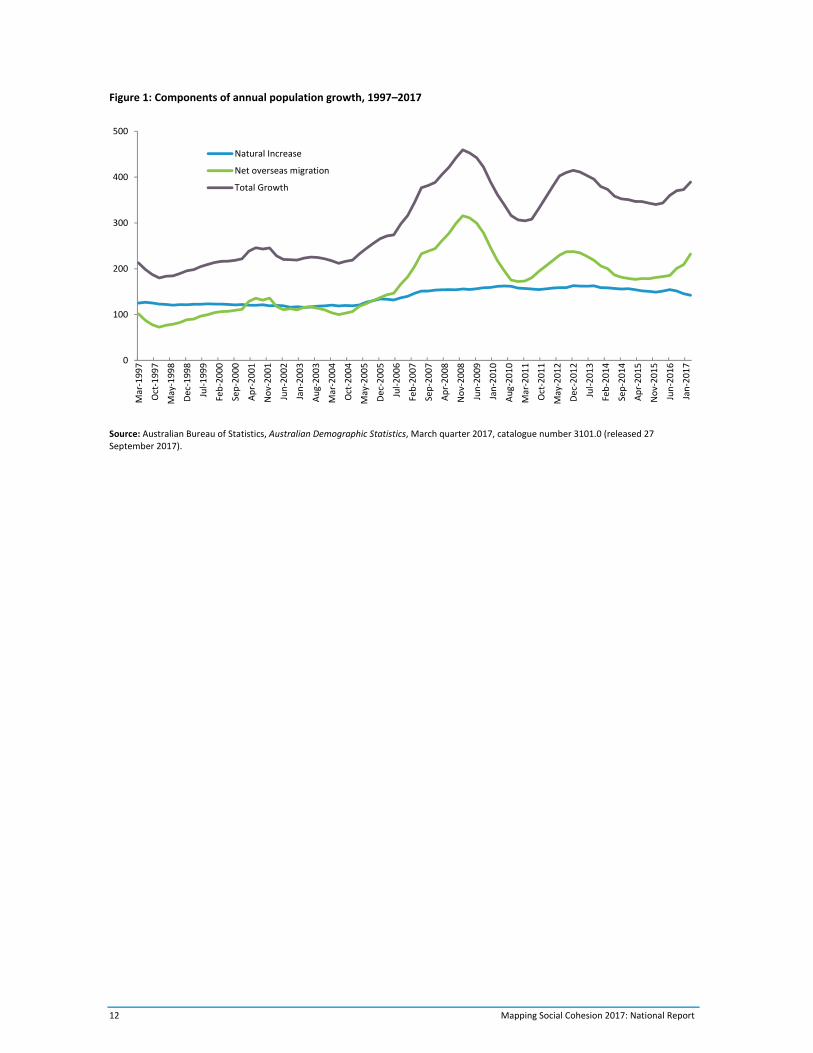
There are two components of population growth: natural increase and net overseas migration (NOM), which represents the net gain of immigrants arriving less emigrants departing. Between 1975 and 2005 natural increase accounted for 58% of population growth. Since 2006, net overseas migration has been the major component. NOM accounted for 56% of growth in the year to December 2016.9
Within the permanent immigration program, the main categories are Skill, Family and Humanitarian. Of these, Skill is the largest category, in recent years more than double the Family category. The program outcome for 2016‐17 was 123,567 Skill stream places and 56,220 Family. The latest figures for the Humanitarian program (2015‐16) indicate 17,555 places.
Changes in Australian immigration policy since the early 1990s have provided enhanced opportunities for entry on long‐stay visas – providing for long‐term but temporary residence, with the option to apply for permanent residence while in Australia. In recent years the numbers entering on long‐term visas, primarily comprising overseas students, 457 business visa holders, and working holiday makers, have exceeded permanent entrants, a marked change from the previous emphasis on permanent immigration.
New Zealand passport holders are an additional category of entrants. New Zealand citizens are able to live in Australia indefinitely and to work and study, provided they have no criminal convictions or health problems. But since 2001 those entering on the basis of their citizenship do not gain access to a number of welfare and educational entitlements, including student loans. To gain full entitlement, New Zealand citizens need to apply for and be accepted for a permanent visa under the migration program, or for those arriving between 2001 and 2016 meet an income threshold of $53,900 per annum over a five‐year period.
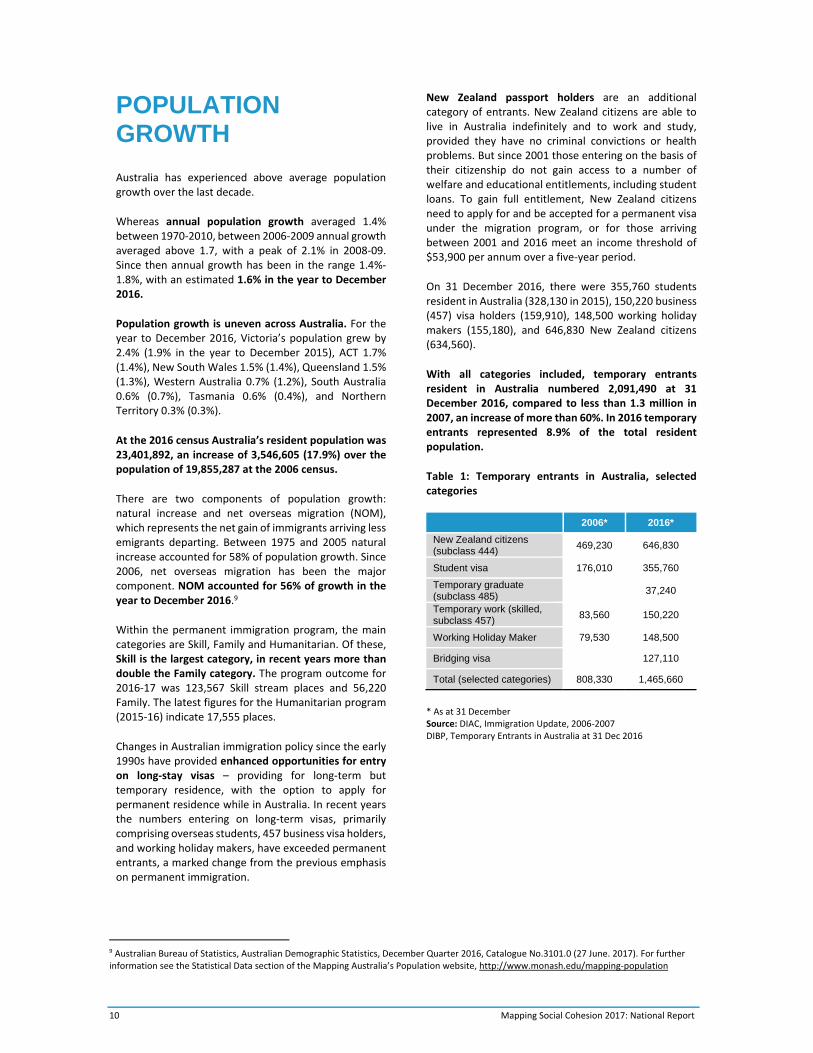
On 31 December 2016, there were 355,760 students resident in Australia (328,130 in 2015), 150,220 business (457) visa holders (159,910), 148,500 working holiday makers (155,180), and 646,830 New Zealand citizens (634,560).
With all categories included, temporary entrants resident in Australia numbered 2,091,490 at 31 December 2016, compared to less than 1.3 million in 2007, an increase of more than 60%. In 2016 temporary entrants represented 8.9% of the total resident population.
Table 1: Temporary entrants in Australia, selected categories
2006* 2016*
New Zealand citizens (subclass 444)
469,230 646,830
Student visa 176,010 355,760
Temporary graduate (subclass 485)
37,240
Temporary work (skilled, subclass 457)
83,560 150,220
Working Holiday Maker 79,530 148,500
Bridging visa 127,110
Total (selected categories) 808,330 1,465,660
* As at 31 December Source: DIAC, Immigration Update, 2006‐2007 DIBP, Temporary Entrants in Australia at 31 Dec 2016
9 Australian Bureau of Statistics, Australian Demographic Statistics, December Quarter 2016, Catalogue No.3101.0 (27 June. 2017). For further information see the Statistical Data section of the Mapping Australia’s Population website, http://www.monash.edu/mapping‐population
Mapping Social Cohesion 2017: National Report 11
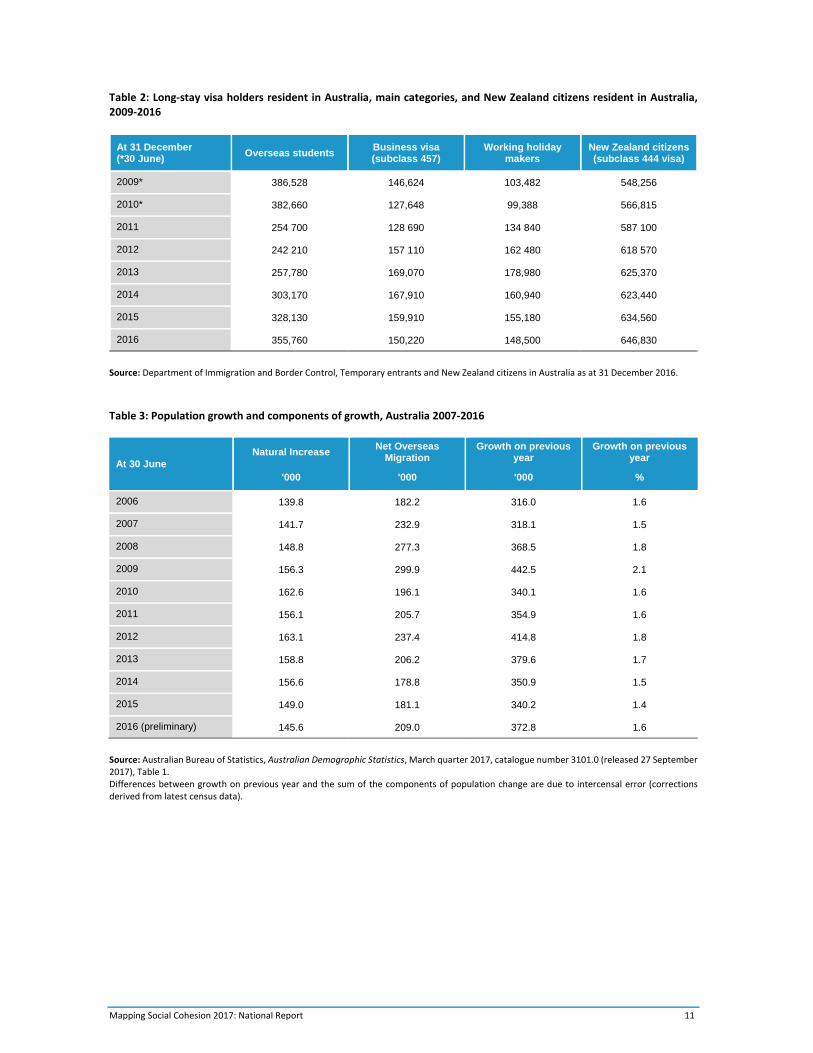
Table 2: Long‐stay visa holders resident in Australia, main categories, and New Zealand citizens resident in Australia, 2009‐2016
At 31 December (*30 June)
Overseas students Business visa (subclass 457)
Working holiday makers
New Zealand citizens (subclass 444 visa)
2009* 386,528 146,624 103,482 548,256
2010* 382,660 127,648 99,388 566,815
2011 254 700 128 690 134 840 587 100
2012 242 210 157 110 162 480 618 570
2013 257,780 169,070 178,980 625,370
2014 303,170 167,910 160,940 623,440
2015 328,130 159,910 155,180 634,560
2016 355,760 150,220 148,500 646,830
Source: Department of Immigration and Border Control, Temporary entrants and New Zealand citizens in Australia as at 31 December 2016.
Table 3: Population growth and components of growth, Australia 2007‐2016
At 30 June Natural Increase
Net Overseas Migration
Growth on previous year
Growth on previous year
'000 '000 '000 %
2006 139.8 182.2 316.0 1.6
2007 141.7 232.9 318.1 1.5
2008 148.8 277.3 368.5 1.8
2009 156.3 299.9 442.5 2.1
2010 162.6 196.1 340.1 1.6
2011 156.1 205.7 354.9 1.6
2012 163.1 237.4 414.8 1.8
2013 158.8 206.2 379.6 1.7
2014 156.6 178.8 350.9 1.5
2015 149.0 181.1 340.2 1.4
2016 (preliminary) 145.6 209.0 372.8 1.6
Source: Australian Bureau of Statistics, Australian Demographic Statistics, March quarter 2017, catalogue number 3101.0 (released 27 September 2017), Table 1. Differences between growth on previous year and the sum of the components of population change are due to intercensal error (corrections derived from latest census data).
12 Mapping Social Cohesion 2017: National Report
Figure 1: Components of annual population growth, 1997–2017
Source: Australian Bureau of Statistics, Australian Demographic Statistics, March quarter 2017, catalogue number 3101.0 (released 27 September 2017).
0
100
200
300
400
500Mar‐1997
Oct‐1997
May‐1998
Dec‐1998
Jul‐1999
Feb‐2000
Sep‐2000
Apr‐2001
Nov‐2001
Jun‐2002
Jan‐2003
Aug‐2003
Mar‐2004
Oct‐2004
May‐2005
Dec‐2005
Jul‐2006
Feb‐2007
Sep‐2007
Apr‐2008
Nov‐2008
Jun‐2009
Jan‐2010
Aug‐2010
Mar‐2011
Oct‐2011
May‐2012
Dec‐2012
Jul‐2013
Feb‐2014
Sep‐2014
Apr‐2015
Nov‐2015
Jun‐ 2016
Jan‐2017
Natural Increase
Net overseas migration
Total Growth
Mapping Social Cohesion 2017: National Report 13
COUNTRY OF BIRTH
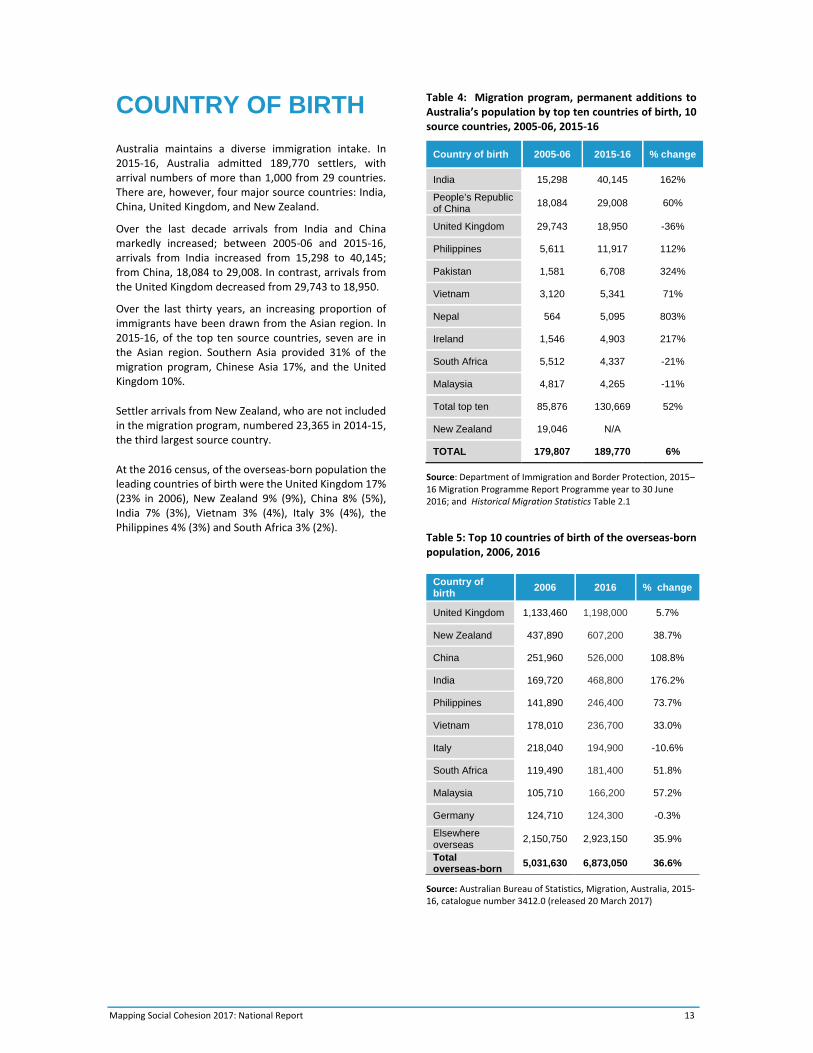
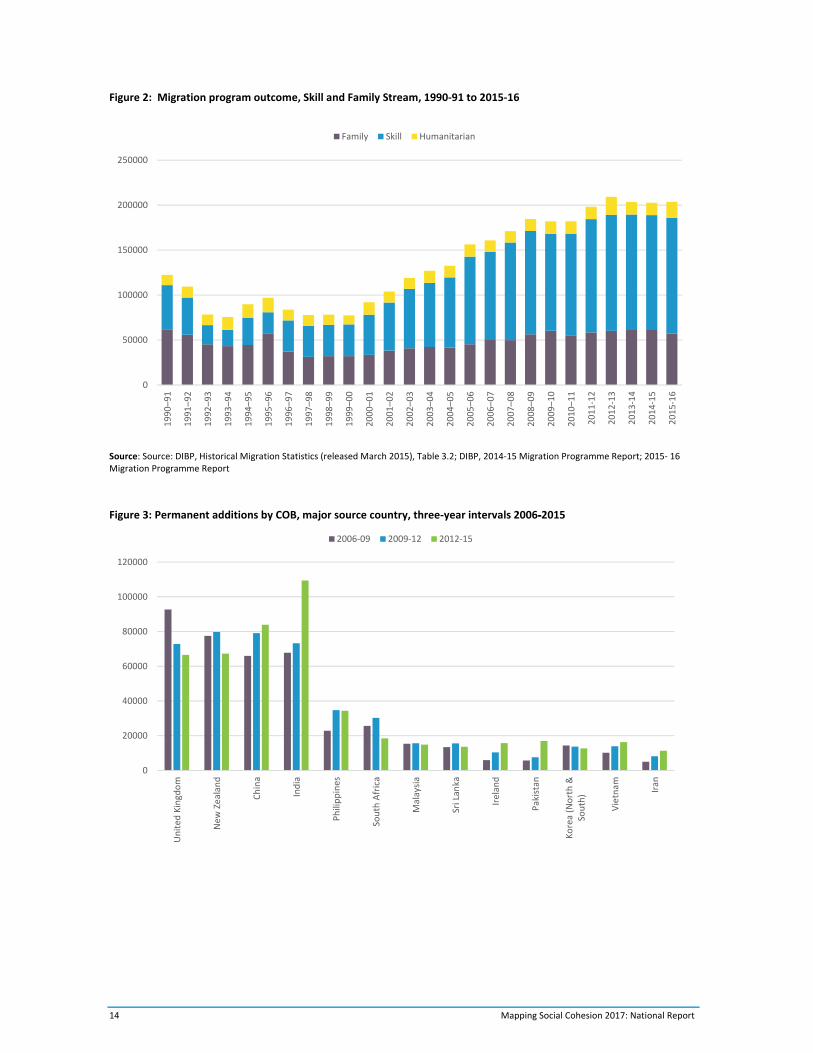
Australia maintains a diverse immigration intake. In 2015‐16, Australia admitted 189,770 settlers, with arrival numbers of more than 1,000 from 29 countries. There are, however, four major source countries: India, China, United Kingdom, and New Zealand.
Over the last decade arrivals from India and China markedly increased; between 2005‐06 and 2015‐16, arrivals from India increased from 15,298 to 40,145; from China, 18,084 to 29,008. In contrast, arrivals from the United Kingdom decreased from 29,743 to 18,950.
Over the last thirty years, an increasing proportion of immigrants have been drawn from the Asian region. In 2015‐16, of the top ten source countries, seven are in the Asian region. Southern Asia provided 31% of the migration program, Chinese Asia 17%, and the United Kingdom 10%.
Settler arrivals from New Zealand, who are not included in the migration program, numbered 23,365 in 2014‐15, the third largest source country.
At the 2016 census, of the overseas‐born population the leading countries of birth were the United Kingdom 17% (23% in 2006), New Zealand 9% (9%), China 8% (5%), India 7% (3%), Vietnam 3% (4%), Italy 3% (4%), the Philippines 4% (3%) and South Africa 3% (2%).
Table 4: Migration program, permanent additions to Australia’s population by top ten countries of birth, 10 source countries, 2005‐06, 2015‐16
Country of birth 2005-06 2015-16 % change
India 15,298 40,145 162%
People’s Republic of China
18,084 29,008 60%
United Kingdom 29,743 18,950 -36%
Philippines 5,611 11,917 112%
Pakistan 1,581 6,708 324%
Vietnam 3,120 5,341 71%
Nepal 564 5,095 803%
Ireland 1,546 4,903 217%
South Africa 5,512 4,337 -21%
Malaysia 4,817 4,265 -11%
Total top ten 85,876 130,669 52%
New Zealand 19,046 N/A
TOTAL 179,807 189,770 6%
Source: Department of Immigration and Border Protection, 2015–16 Migration Programme Report Programme year to 30 June 2016; and Historical Migration Statistics Table 2.1
Table 5: Top 10 countries of birth of the overseas‐born population, 2006, 2016
Country of birth
2006 2016 % change
United Kingdom 1,133,460 1,198,000 5.7%
New Zealand 437,890 607,200 38.7%
China 251,960 526,000 108.8%
India 169,720 468,800 176.2%
Philippines 141,890 246,400 73.7%
Vietnam 178,010 236,700 33.0%
Italy 218,040 194,900 -10.6%
South Africa 119,490 181,400 51.8%
Malaysia 105,710 166,200 57.2%
Germany 124,710 124,300 -0.3%
Elsewhere overseas
2,150,750 2,923,150 35.9%
Total overseas-born
5,031,630 6,873,050 36.6%
Source: Australian Bureau of Statistics, Migration, Australia, 2015‐16, catalogue number 3412.0 (released 20 March 2017)
14 Mapping Social Cohesion 2017: National Report
Figure 2: Migration program outcome, Skill and Family Stream, 1990‐91 to 2015‐16
Source: Source: DIBP, Historical Migration Statistics (released March 2015), Table 3.2; DIBP, 2014‐15 Migration Programme Report; 2015‐ 16 Migration Programme Report
Figure 3: Permanent additions by COB, major source country, three‐year intervals 2006‐2015
0
50000
100000
150000
200000
2500001990–91
1991–92
1992–93
1993–94
1994–95
1995–96
1996–97
1997–98
1998–99
1999–00
2000–01
2001–02
2002–03
2003–04
2004–05
2005–06
2006–07
2007–08
2008–09
2009–10
2010–11
2011‐12
2012‐13
2013‐14
2014‐15
2015‐16
Family Skill Humanitarian
0
20000
40000
60000
80000
100000
120000
United
Kingdom
New
Zealand
China
India
Philippines
South Africa
Malaysia
Sri Lanka
Ireland
Pakistan
Korea (North &
South)
Vietnam Iran
2006‐09 2009‐12 2012‐15
Mapping Social Cohesion 2017: National Report 15
ETHNIC DIVERSITY
The 2016 census indicates that 28% of the Australian population was born overseas, the highest proportion since the late nineteenth century. A further 21% of those born in Australia had at least one overseas‐born parent.
There has been a gradual increase in the proportion born overseas, from 23% in 2001 to 25% in 2006, and 27% in 2011. Since 2006, in the context of a growing population, the number born overseas has increased by 1,841,420 persons, from 5,031,630 million in 2006 to 6,873,050 million in 2016.
The 28% overseas‐born ranks Australia first within the OECD among nations with populations over ten million. It compares with 20% overseas‐born in Canada, 13% in Germany, 13% in the United States, 12% in the United Kingdom, and 12% in France. The average for the OECD is 12%.
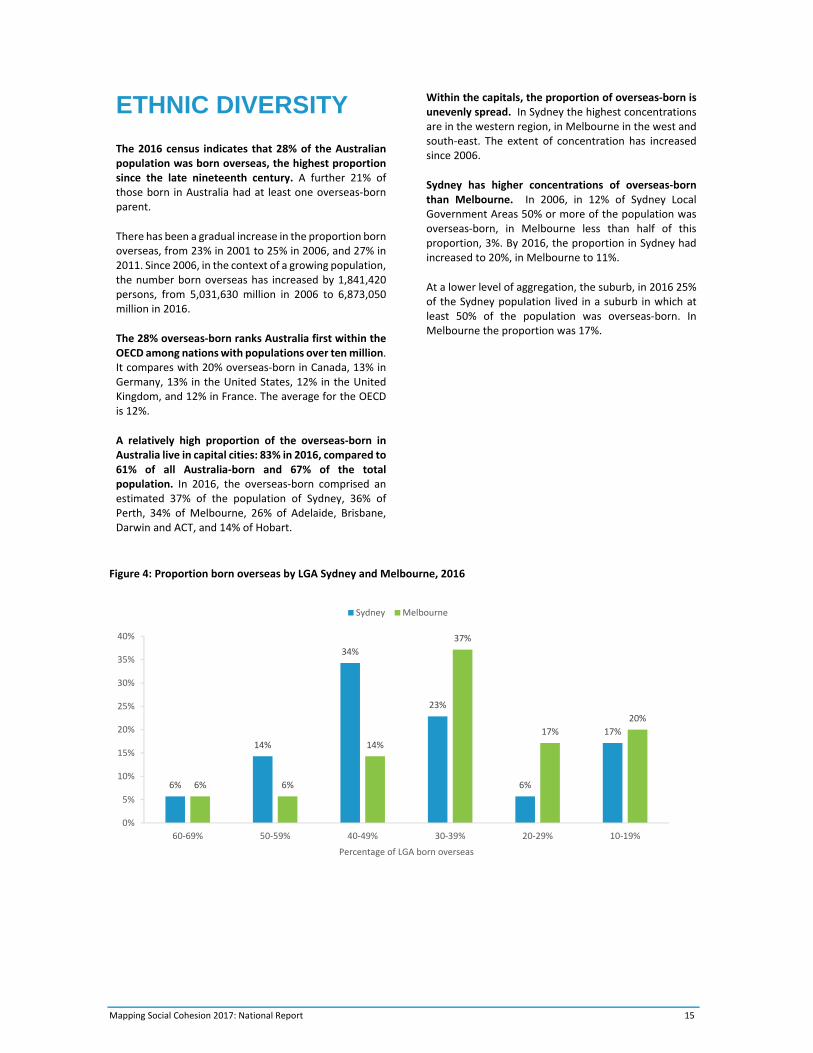
A relatively high proportion of the overseas‐born in Australia live in capital cities: 83% in 2016, compared to 61% of all Australia‐born and 67% of the total population. In 2016, the overseas‐born comprised an estimated 37% of the population of Sydney, 36% of Perth, 34% of Melbourne, 26% of Adelaide, Brisbane, Darwin and ACT, and 14% of Hobart.
Within the capitals, the proportion of overseas‐born is unevenly spread. In Sydney the highest concentrations are in the western region, in Melbourne in the west and south‐east. The extent of concentration has increased since 2006.
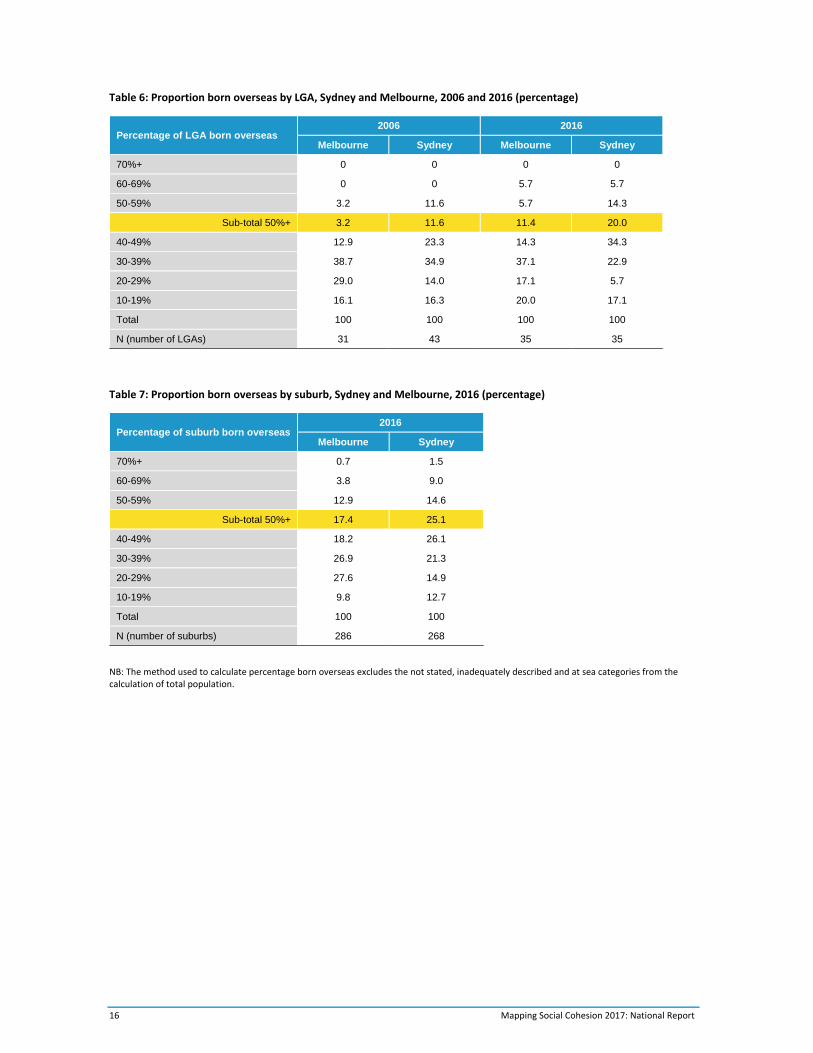
Sydney has higher concentrations of overseas‐born than Melbourne. In 2006, in 12% of Sydney Local Government Areas 50% or more of the population was overseas‐born, in Melbourne less than half of this proportion, 3%. By 2016, the proportion in Sydney had increased to 20%, in Melbourne to 11%.
At a lower level of aggregation, the suburb, in 2016 25% of the Sydney population lived in a suburb in which at least 50% of the population was overseas‐born. In Melbourne the proportion was 17%.
Figure 4: Proportion born overseas by LGA Sydney and Melbourne, 2016
6%
14%
34%
23%
6%
17%
6% 6%
14%
37%
17%
20%
0%
5%
10%
15%
20%
25%
30%
35%
40%
60‐69% 50‐59% 40‐49% 30‐39% 20‐29% 10‐19%
Percentage of LGA born overseas
Sydney Melbourne
16 Mapping Social Cohesion 2017: National Report
Table 6: Proportion born overseas by LGA, Sydney and Melbourne, 2006 and 2016 (percentage)
Table 7: Proportion born overseas by suburb, Sydney and Melbourne, 2016 (percentage)
Percentage of suburb born overseas 2016
Melbourne Sydney
70%+ 0.7 1.5
60-69% 3.8 9.0
50-59% 12.9 14.6
Sub-total 50%+ 17.4 25.1
40-49% 18.2 26.1
30-39% 26.9 21.3
20-29% 27.6 14.9
10-19% 9.8 12.7
Total 100 100
N (number of suburbs) 286 268
NB: The method used to calculate percentage born overseas excludes the not stated, inadequately described and at sea categories from the calculation of total population.
Percentage of LGA born overseas 2006 2016
Melbourne Sydney Melbourne Sydney
70%+ 0 0 0 0
60-69% 0 0 5.7 5.7
50-59% 3.2 11.6 5.7 14.3
Sub-total 50%+ 3.2 11.6 11.4 20.0
40-49% 12.9 23.3 14.3 34.3
30-39% 38.7 34.9 37.1 22.9
20-29% 29.0 14.0 17.1 5.7
10-19% 16.1 16.3 20.0 17.1
Total 100 100 100 100
N (number of LGAs) 31 43 35 35
Mapping Social Cohesion 2017: National Report 17
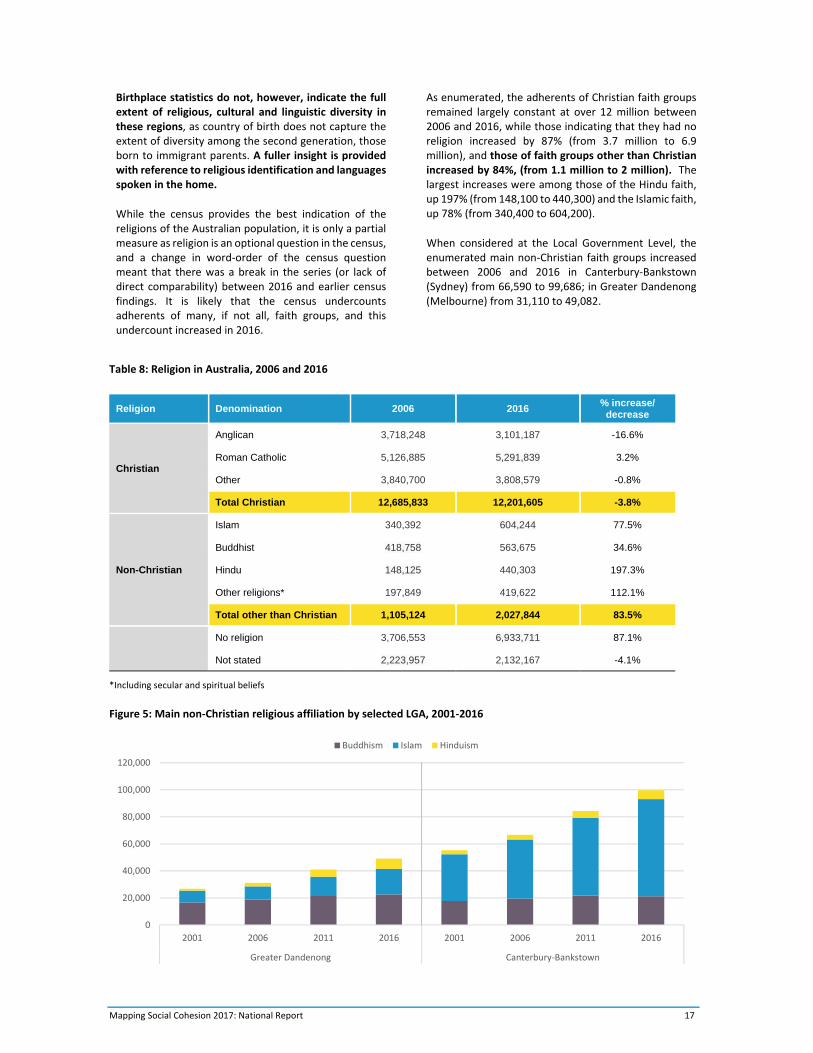
Birthplace statistics do not, however, indicate the full extent of religious, cultural and linguistic diversity in these regions, as country of birth does not capture the extent of diversity among the second generation, those born to immigrant parents. A fuller insight is provided with reference to religious identification and languages spoken in the home.
While the census provides the best indication of the religions of the Australian population, it is only a partial measure as religion is an optional question in the census, and a change in word‐order of the census question meant that there was a break in the series (or lack of direct comparability) between 2016 and earlier census findings. It is likely that the census undercounts adherents of many, if not all, faith groups, and this undercount increased in 2016.
As enumerated, the adherents of Christian faith groups remained largely constant at over 12 million between 2006 and 2016, while those indicating that they had no religion increased by 87% (from 3.7 million to 6.9 million), and those of faith groups other than Christian increased by 84%, (from 1.1 million to 2 million). The largest increases were among those of the Hindu faith, up 197% (from 148,100 to 440,300) and the Islamic faith, up 78% (from 340,400 to 604,200).
When considered at the Local Government Level, the enumerated main non‐Christian faith groups increased between 2006 and 2016 in Canterbury‐Bankstown (Sydney) from 66,590 to 99,686; in Greater Dandenong (Melbourne) from 31,110 to 49,082.
Table 8: Religion in Australia, 2006 and 2016
Religion Denomination 2006 2016 % increase/
decrease
Christian
Anglican 3,718,248 3,101,187 -16.6%
Roman Catholic 5,126,885 5,291,839 3.2%
Other 3,840,700 3,808,579 -0.8%
Total Christian 12,685,833 12,201,605 -3.8%
Non-Christian
Islam 340,392 604,244 77.5%
Buddhist 418,758 563,675 34.6%
Hindu 148,125 440,303 197.3%
Other religions* 197,849 419,622 112.1%
Total other than Christian 1,105,124 2,027,844 83.5%
No religion 3,706,553 6,933,711 87.1%
Not stated 2,223,957 2,132,167 -4.1%
*Including secular and spiritual beliefs
Figure 5: Main non‐Christian religious affiliation by selected LGA, 2001‐2016
0
20,000
40,000
60,000
80,000
100,000
120,000
2001 2006 2011 2016 2001 2006 2011 2016
Greater Dandenong Canterbury‐Bankstown
Buddhism Islam Hinduism
18 Mapping Social Cohesion 2017: National Report
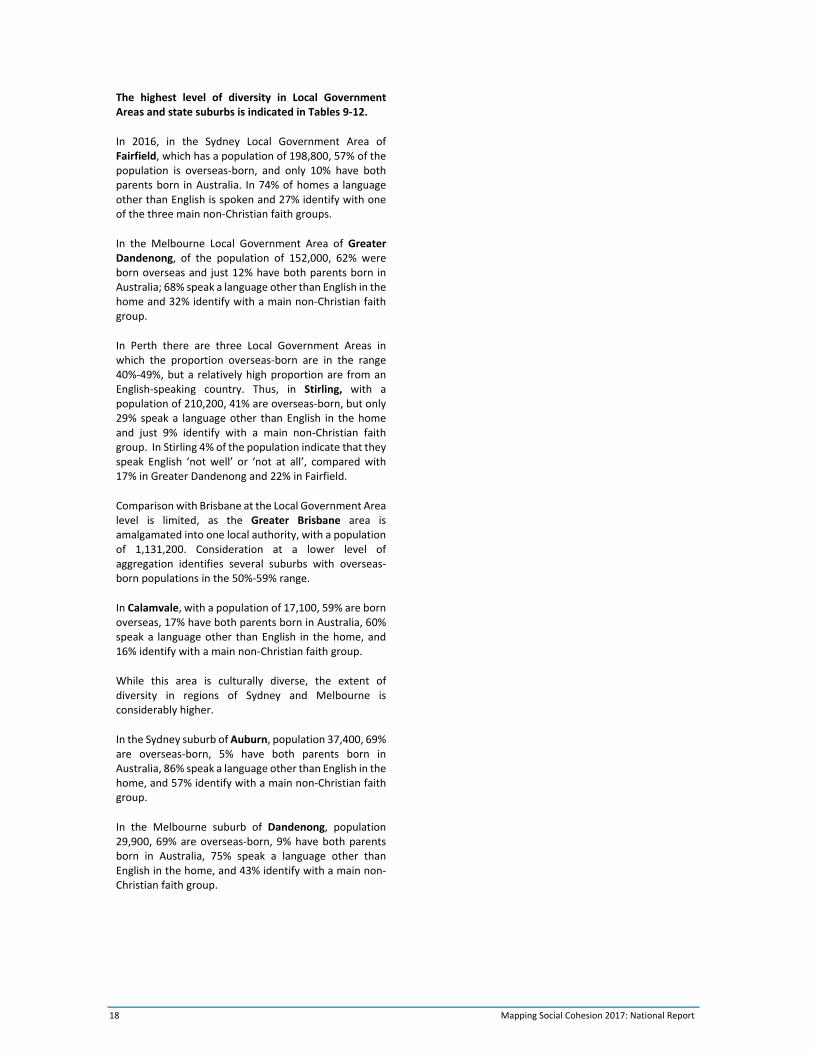
The highest level of diversity in Local Government Areas and state suburbs is indicated in Tables 9‐12.
In 2016, in the Sydney Local Government Area of Fairfield, which has a population of 198,800, 57% of the population is overseas‐born, and only 10% have both parents born in Australia. In 74% of homes a language other than English is spoken and 27% identify with one of the three main non‐Christian faith groups.
In the Melbourne Local Government Area of Greater Dandenong, of the population of 152,000, 62% were born overseas and just 12% have both parents born in Australia; 68% speak a language other than English in the home and 32% identify with a main non‐Christian faith group.
In Perth there are three Local Government Areas in which the proportion overseas‐born are in the range 40%‐49%, but a relatively high proportion are from an English‐speaking country. Thus, in Stirling, with a population of 210,200, 41% are overseas‐born, but only 29% speak a language other than English in the home and just 9% identify with a main non‐Christian faith group. In Stirling 4% of the population indicate that they speak English ‘not well’ or ‘not at all’, compared with 17% in Greater Dandenong and 22% in Fairfield.
Comparison with Brisbane at the Local Government Area level is limited, as the Greater Brisbane area is amalgamated into one local authority, with a population of 1,131,200. Consideration at a lower level of aggregation identifies several suburbs with overseas‐born populations in the 50%‐59% range.
In Calamvale, with a population of 17,100, 59% are born overseas, 17% have both parents born in Australia, 60% speak a language other than English in the home, and 16% identify with a main non‐Christian faith group.
While this area is culturally diverse, the extent of diversity in regions of Sydney and Melbourne is considerably higher.
In the Sydney suburb of Auburn, population 37,400, 69% are overseas‐born, 5% have both parents born in Australia, 86% speak a language other than English in the home, and 57% identify with a main non‐Christian faith group.
In the Melbourne suburb of Dandenong, population 29,900, 69% are overseas‐born, 9% have both parents born in Australia, 75% speak a language other than English in the home, and 43% identify with a main non‐Christian faith group.
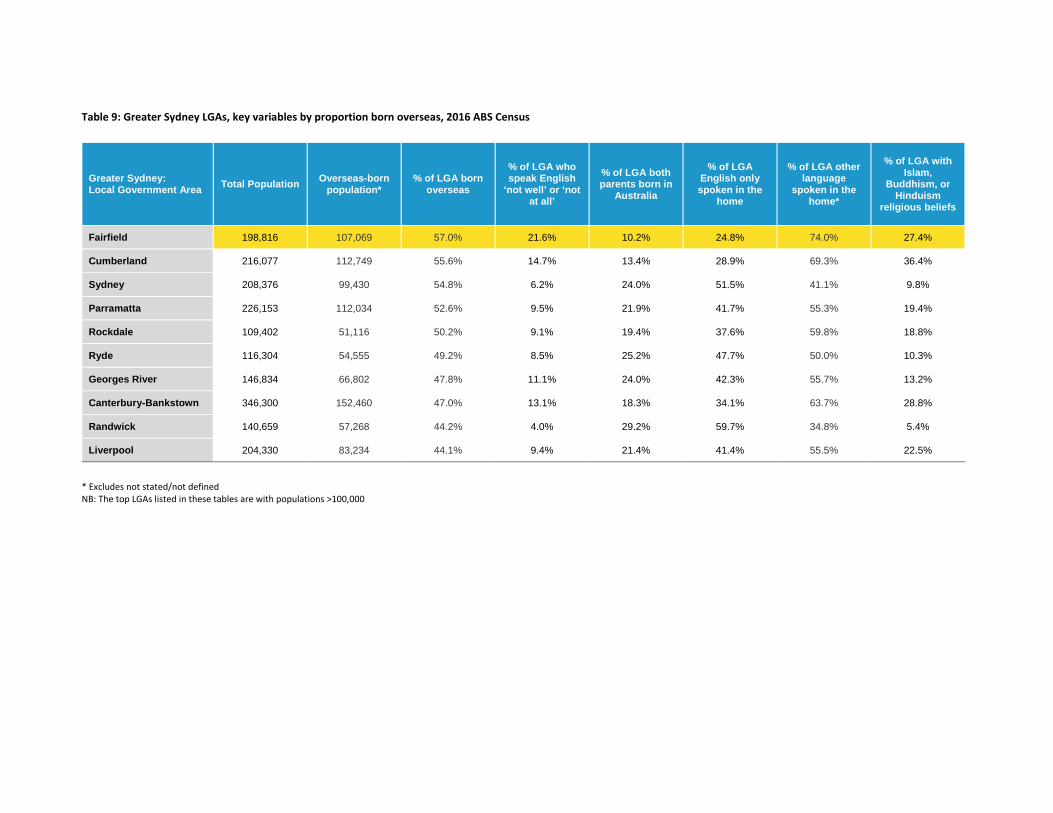
Table 9: Greater Sydney LGAs, key variables by proportion born overseas, 2016 ABS Census
Greater Sydney: Local Government Area
Total Population Overseas-born
population* % of LGA born
overseas
% of LGA who speak English
‘not well’ or ‘not at all’
% of LGA both parents born in
Australia
% of LGA English only spoken in the
home
% of LGA other language
spoken in the home*
% of LGA with Islam,
Buddhism, or Hinduism
religious beliefs
Fairfield 198,816 107,069 57.0% 21.6% 10.2% 24.8% 74.0% 27.4%
Cumberland 216,077 112,749 55.6% 14.7% 13.4% 28.9% 69.3% 36.4%
Sydney 208,376 99,430 54.8% 6.2% 24.0% 51.5% 41.1% 9.8%
Parramatta 226,153 112,034 52.6% 9.5% 21.9% 41.7% 55.3% 19.4%
Rockdale 109,402 51,116 50.2% 9.1% 19.4% 37.6% 59.8% 18.8%
Ryde 116,304 54,555 49.2% 8.5% 25.2% 47.7% 50.0% 10.3%
Georges River 146,834 66,802 47.8% 11.1% 24.0% 42.3% 55.7% 13.2%
Canterbury-Bankstown 346,300 152,460 47.0% 13.1% 18.3% 34.1% 63.7% 28.8%
Randwick 140,659 57,268 44.2% 4.0% 29.2% 59.7% 34.8% 5.4%
Liverpool 204,330 83,234 44.1% 9.4% 21.4% 41.4% 55.5% 22.5%
* Excludes not stated/not defined NB: The top LGAs listed in these tables are with populations >100,000
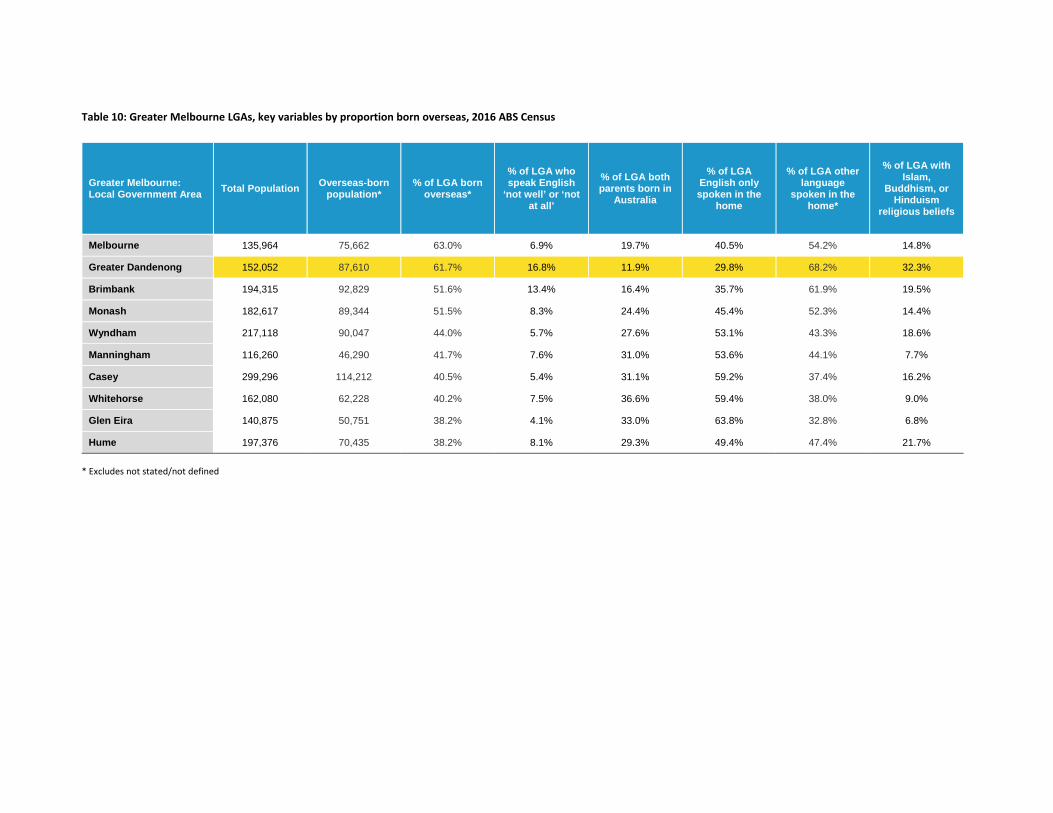
Table 10: Greater Melbourne LGAs, key variables by proportion born overseas, 2016 ABS Census
Greater Melbourne: Local Government Area
Total Population Overseas-born
population* % of LGA born
overseas*
% of LGA who speak English
‘not well’ or ‘not at all’
% of LGA both parents born in
Australia
% of LGA English only spoken in the
home
% of LGA other language
spoken in the home*
% of LGA with Islam,
Buddhism, or Hinduism
religious beliefs
Melbourne 135,964 75,662 63.0% 6.9% 19.7% 40.5% 54.2% 14.8%
Greater Dandenong 152,052 87,610 61.7% 16.8% 11.9% 29.8% 68.2% 32.3%
Brimbank 194,315 92,829 51.6% 13.4% 16.4% 35.7% 61.9% 19.5%
Monash 182,617 89,344 51.5% 8.3% 24.4% 45.4% 52.3% 14.4%
Wyndham 217,118 90,047 44.0% 5.7% 27.6% 53.1% 43.3% 18.6%
Manningham 116,260 46,290 41.7% 7.6% 31.0% 53.6% 44.1% 7.7%
Casey 299,296 114,212 40.5% 5.4% 31.1% 59.2% 37.4% 16.2%
Whitehorse 162,080 62,228 40.2% 7.5% 36.6% 59.4% 38.0% 9.0%
Glen Eira 140,875 50,751 38.2% 4.1% 33.0% 63.8% 32.8% 6.8%
Hume 197,376 70,435 38.2% 8.1% 29.3% 49.4% 47.4% 21.7%
* Excludes not stated/not defined
Table 11: Greater Brisbane and Greater Perth LGAs, key variables by proportion born overseas, 2016 ABS Census
Greater Brisbane: Local Government Area
Total Population Overseas-born
population* % of LGA born
overseas*
% of LGA who speak English
‘not well’ or ‘not at all’
% of LGA both parents born in
Australia
% of LGA English only spoken in the
home
% of LGA other language
spoken in the home*
% of LGA with Islam,
Buddhism, or Hinduism
religious beliefs
Brisbane 1,131,155 345,690 32.5% 3.6% 44.3% 71.8% 23.6% 7.0%
Logan 303,384 82,708 29.3% 2.9% 45.5% 77.8% 16.8% 5.4%
Redland 147,011 33,133 23.7% 0.7% 54.3% 88.9% 6.8% 1.6%
Ipswich 193,737 38,934 21.6% 1.7% 54.9% 81.8% 12.2% 3.0%
Moreton Bay 425,309 83,254 20.9% 0.8% 57.2% 87.3% 7.1% 1.8%
Greater Perth LGAs
Gosnells 118,073 51,018 45.8% 5.8% 27.3% 62.2% 33.7% 15.3%
Wanneroo 188,216 77,011 43.7% 3.3% 28.1% 74.0% 21.3% 6.9%
Stirling 210,209 79,221 40.5% 4.4% 31.0% 66.3% 28.9% 9.0%
Joondalup 154,443 58,349 39.5% 1.0% 34.4% 85.2% 11.2% 2.7%
Cockburn 104,472 35,655 36.6% 3.0% 34.5% 72.4% 22.7% 4.3%
Swan 133,851 43,968 35.3% 3.3% 35.3% 72.5% 22.0% 7.9%
Rockingham 125,112 39,601 34.3% 0.8% 37.9% 85.2% 8.2% 2.0%
* Excludes not stated/not defined
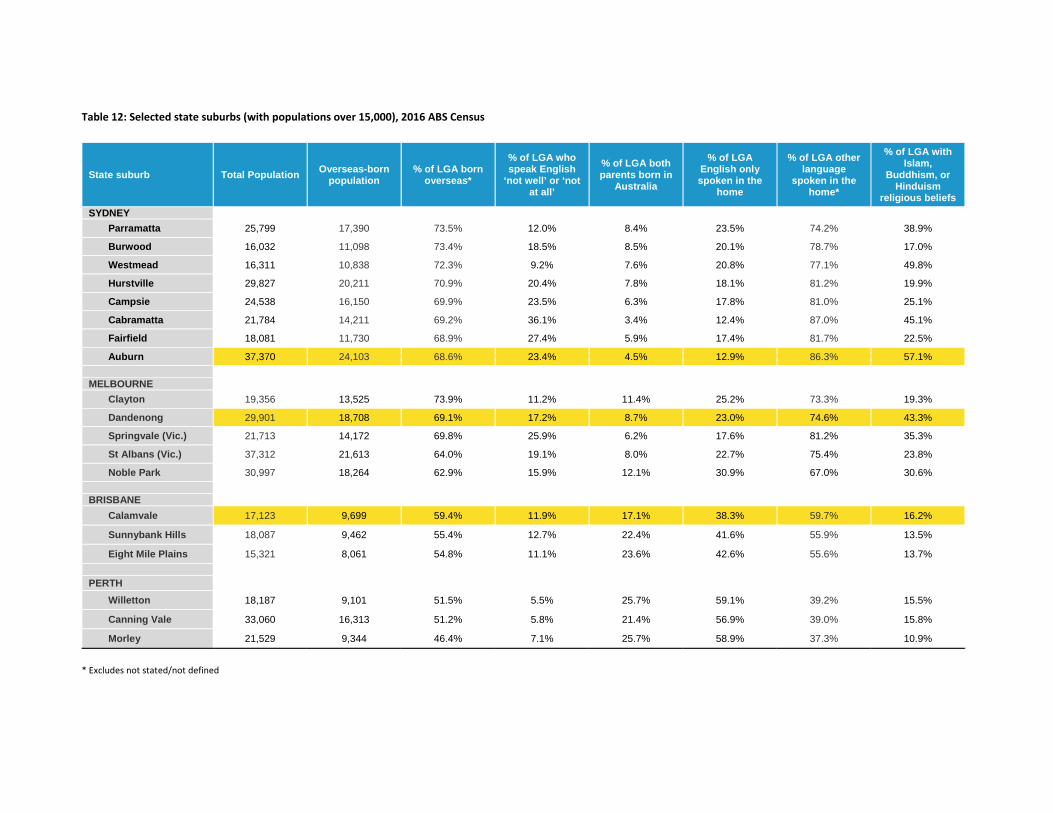
Table 12: Selected state suburbs (with populations over 15,000), 2016 ABS Census
State suburb Total Population Overseas-born
population % of LGA born
overseas*
% of LGA who speak English
‘not well’ or ‘not at all’
% of LGA both parents born in
Australia
% of LGA English only spoken in the
home
% of LGA other language
spoken in the home*
% of LGA with Islam,
Buddhism, or Hinduism
religious beliefs
SYDNEY
Parramatta 25,799 17,390 73.5% 12.0% 8.4% 23.5% 74.2% 38.9%
Burwood 16,032 11,098 73.4% 18.5% 8.5% 20.1% 78.7% 17.0%
Westmead 16,311 10,838 72.3% 9.2% 7.6% 20.8% 77.1% 49.8%
Hurstville 29,827 20,211 70.9% 20.4% 7.8% 18.1% 81.2% 19.9%
Campsie 24,538 16,150 69.9% 23.5% 6.3% 17.8% 81.0% 25.1%
Cabramatta 21,784 14,211 69.2% 36.1% 3.4% 12.4% 87.0% 45.1%
Fairfield 18,081 11,730 68.9% 27.4% 5.9% 17.4% 81.7% 22.5%
Auburn 37,370 24,103 68.6% 23.4% 4.5% 12.9% 86.3% 57.1%
MELBOURNE
Clayton 19,356 13,525 73.9% 11.2% 11.4% 25.2% 73.3% 19.3%
Dandenong 29,901 18,708 69.1% 17.2% 8.7% 23.0% 74.6% 43.3%
Springvale (Vic.) 21,713 14,172 69.8% 25.9% 6.2% 17.6% 81.2% 35.3%
St Albans (Vic.) 37,312 21,613 64.0% 19.1% 8.0% 22.7% 75.4% 23.8%
Noble Park 30,997 18,264 62.9% 15.9% 12.1% 30.9% 67.0% 30.6%
BRISBANE
Calamvale 17,123 9,699 59.4% 11.9% 17.1% 38.3% 59.7% 16.2%
Sunnybank Hills 18,087 9,462 55.4% 12.7% 22.4% 41.6% 55.9% 13.5%
Eight Mile Plains 15,321 8,061 54.8% 11.1% 23.6% 42.6% 55.6% 13.7%
PERTH
Willetton 18,187 9,101 51.5% 5.5% 25.7% 59.1% 39.2% 15.5%
Canning Vale 33,060 16,313 51.2% 5.8% 21.4% 56.9% 39.0% 15.8%
Morley 21,529 9,344 46.4% 7.1% 25.7% 58.9% 37.3% 10.9%
* Excludes not stated/not defined
23 Mapping Social Cohesion 2017: National report
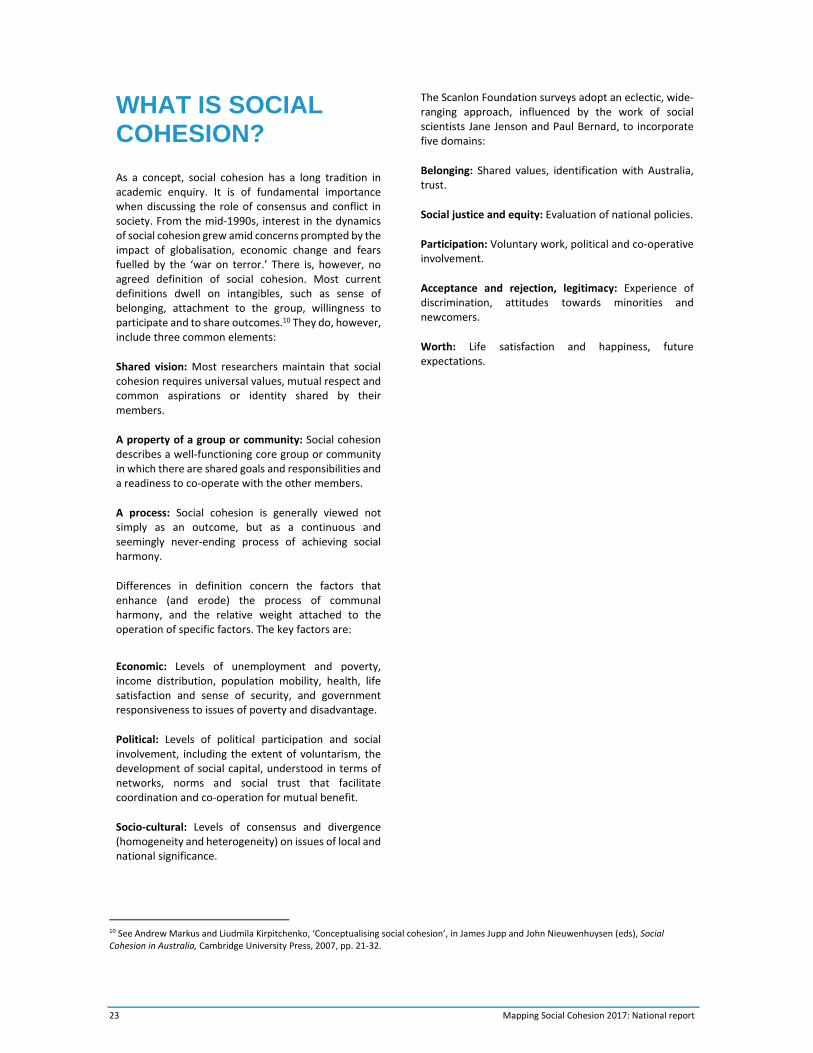
WHAT IS SOCIAL COHESION?
As a concept, social cohesion has a long tradition in academic enquiry. It is of fundamental importance when discussing the role of consensus and conflict in society. From the mid‐1990s, interest in the dynamics of social cohesion grew amid concerns prompted by the impact of globalisation, economic change and fears fuelled by the ‘war on terror.’ There is, however, no agreed definition of social cohesion. Most current definitions dwell on intangibles, such as sense of belonging, attachment to the group, willingness to participate and to share outcomes.10 They do, however, include three common elements:
Shared vision: Most researchers maintain that social cohesion requires universal values, mutual respect and common aspirations or identity shared by their members.
A property of a group or community: Social cohesion describes a well‐functioning core group or community in which there are shared goals and responsibilities and a readiness to co‐operate with the other members.
A process: Social cohesion is generally viewed not simply as an outcome, but as a continuous and seemingly never‐ending process of achieving social harmony.
Differences in definition concern the factors that enhance (and erode) the process of communal harmony, and the relative weight attached to the operation of specific factors. The key factors are:
Economic: Levels of unemployment and poverty, income distribution, population mobility, health, life satisfaction and sense of security, and government responsiveness to issues of poverty and disadvantage.
Political: Levels of political participation and social involvement, including the extent of voluntarism, the development of social capital, understood in terms of networks, norms and social trust that facilitate coordination and co‐operation for mutual benefit.
Socio‐cultural: Levels of consensus and divergence (homogeneity and heterogeneity) on issues of local and national significance.
The Scanlon Foundation surveys adopt an eclectic, wide‐ranging approach, influenced by the work of social scientists Jane Jenson and Paul Bernard, to incorporate five domains:
Belonging: Shared values, identification with Australia, trust.
Social justice and equity: Evaluation of national policies.
Participation: Voluntary work, political and co‐operative involvement.
Acceptance and rejection, legitimacy: Experience of discrimination, attitudes towards minorities and newcomers.
Worth: Life satisfaction and happiness, future expectations.
10 See Andrew Markus and Liudmila Kirpitchenko, ‘Conceptualising social cohesion’, in James Jupp and John Nieuwenhuysen (eds), Social Cohesion in Australia, Cambridge University Press, 2007, pp. 21‐32.
24 Mapping Social Cohesion 2017: National report
11 The nominal index scores the level of agreement (or disagreement in the index of rejection). The highest level of response (for example, ‘strongly agree’) is scored twice the value of the second level (‘agree’). Responses within four of the five indexes are equalised; within the index of participation, activities requiring greater initiative (contacting a Member of Parliament, participating in a boycott, attending a protest) are accorded double the weight of the more passive activities of voting (compulsory in Australia) and signing a petition. See Andrew Markus and Jessica Arnup, Mapping Social Cohesion 2009: The Scanlon Foundations Surveys Full Report (2010), section 12
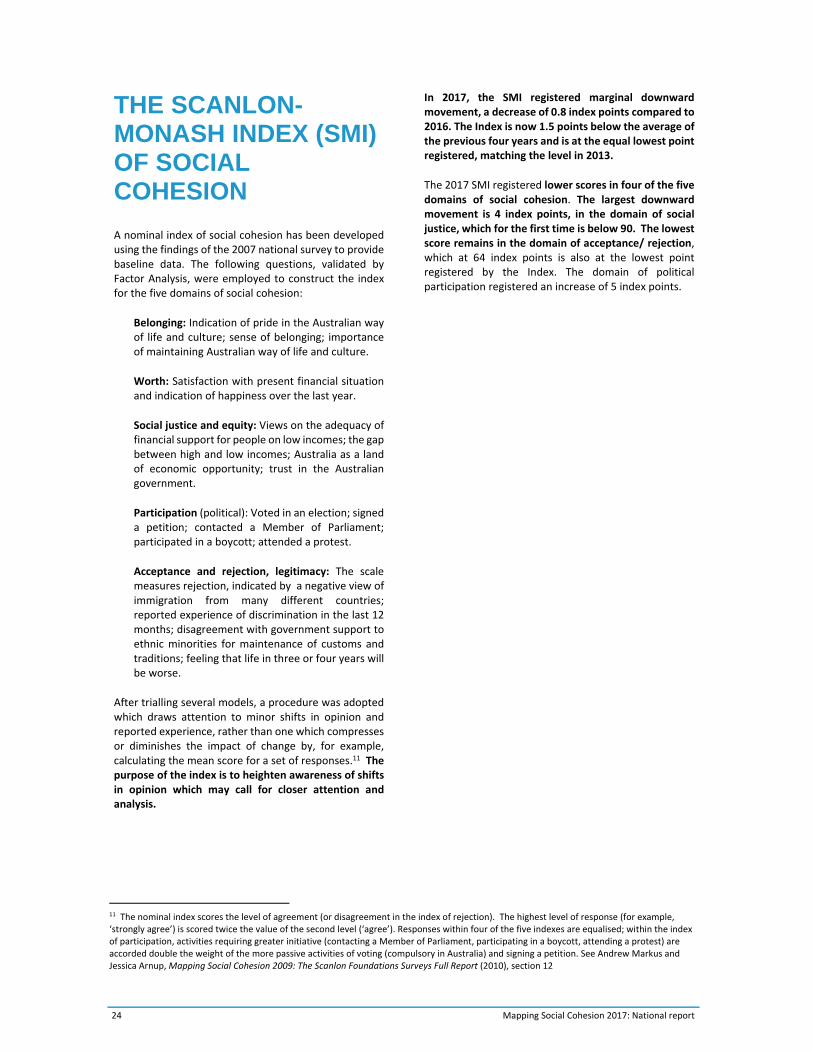
THE SCANLON-MONASH INDEX (SMI) OF SOCIAL COHESION
A nominal index of social cohesion has been developed using the findings of the 2007 national survey to provide baseline data. The following questions, validated by Factor Analysis, were employed to construct the index for the five domains of social cohesion:
Belonging: Indication of pride in the Australian way of life and culture; sense of belonging; importance of maintaining Australian way of life and culture.
Worth: Satisfaction with present financial situation and indication of happiness over the last year.
Social justice and equity: Views on the adequacy of financial support for people on low incomes; the gap between high and low incomes; Australia as a land of economic opportunity; trust in the Australian government.
Participation (political): Voted in an election; signed a petition; contacted a Member of Parliament; participated in a boycott; attended a protest.
Acceptance and rejection, legitimacy: The scale measures rejection, indicated by a negative view of immigration from many different countries; reported experience of discrimination in the last 12 months; disagreement with government support to ethnic minorities for maintenance of customs and traditions; feeling that life in three or four years will be worse.
After trialling several models, a procedure was adopted which draws attention to minor shifts in opinion and reported experience, rather than one which compresses or diminishes the impact of change by, for example, calculating the mean score for a set of responses.11 The purpose of the index is to heighten awareness of shifts in opinion which may call for closer attention and analysis.
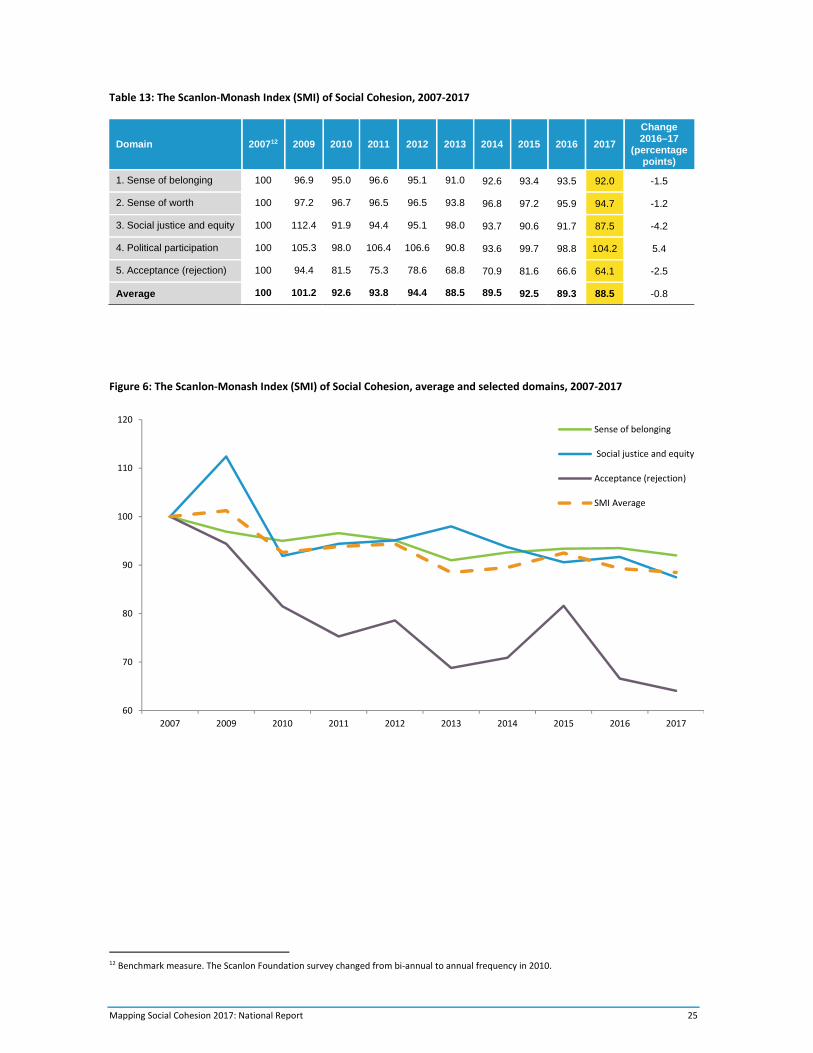
In 2017, the SMI registered marginal downward movement, a decrease of 0.8 index points compared to 2016. The Index is now 1.5 points below the average of the previous four years and is at the equal lowest point registered, matching the level in 2013.
The 2017 SMI registered lower scores in four of the five domains of social cohesion. The largest downward movement is 4 index points, in the domain of social justice, which for the first time is below 90. The lowest score remains in the domain of acceptance/ rejection, which at 64 index points is also at the lowest point registered by the Index. The domain of political participation registered an increase of 5 index points.
Mapping Social Cohesion 2017: National Report 25
Table 13: The Scanlon‐Monash Index (SMI) of Social Cohesion, 2007‐2017
Domain 200712 2009 2010 2011 2012 2013 2014 2015 2016 2017
Change 2016–17
(percentage points)
1. Sense of belonging 100 96.9 95.0 96.6 95.1 91.0 92.6 93.4 93.5 92.0 -1.5
2. Sense of worth 100 97.2 96.7 96.5 96.5 93.8 96.8 97.2 95.9 94.7 -1.2
3. Social justice and equity 100 112.4 91.9 94.4 95.1 98.0 93.7 90.6 91.7 87.5 -4.2
4. Political participation 100 105.3 98.0 106.4 106.6 90.8 93.6 99.7 98.8 104.2 5.4
5. Acceptance (rejection) 100 94.4 81.5 75.3 78.6 68.8 70.9 81.6 66.6 64.1 -2.5
Average 100 101.2 92.6 93.8 94.4 88.5 89.5 92.5 89.3 88.5 -0.8
Figure 6: The Scanlon‐Monash Index (SMI) of Social Cohesion, average and selected domains, 2007‐2017
12 Benchmark measure. The Scanlon Foundation survey changed from bi‐annual to annual frequency in 2010.
60
70
80
90
100
110
120
2007 2009 2010 2011 2012 2013 2014 2015 2016 2017
Sense of belonging
Social justice and equity
Acceptance (rejection)
SMI Average
26 Mapping Social Cohesion 2017: National report
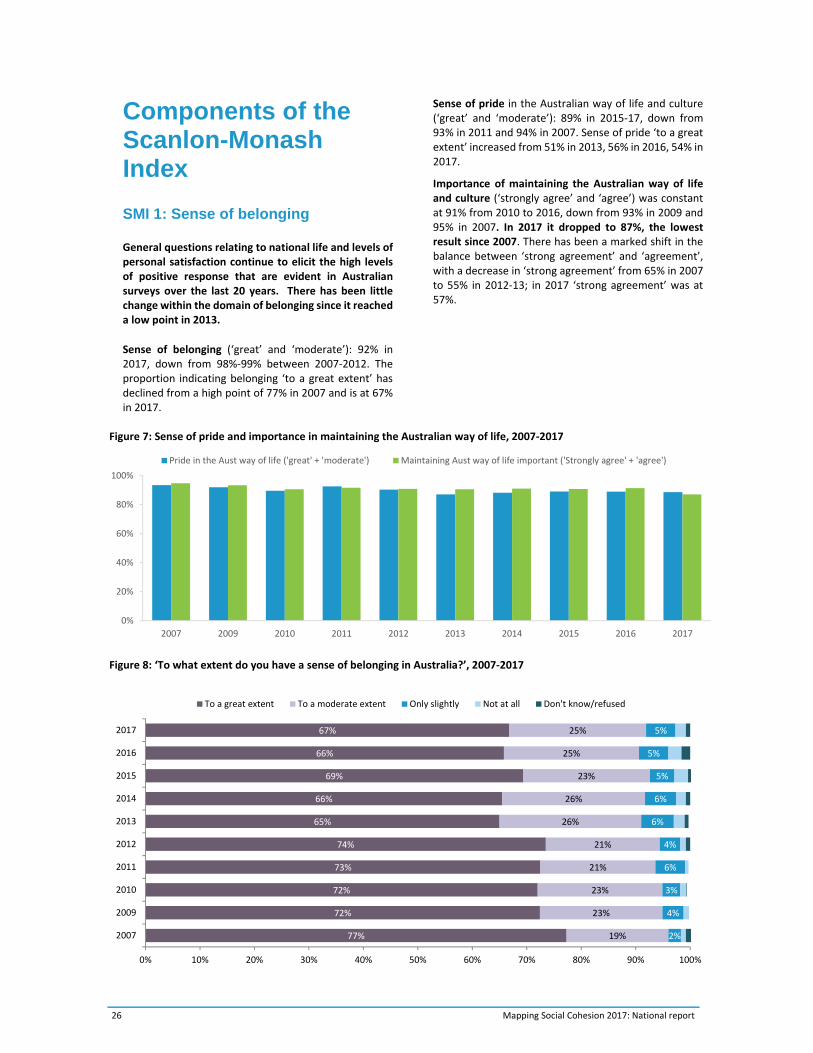
Figure 7: Sense of pride and importance in maintaining the Australian way of life, 2007‐2017
Figure 8: ‘To what extent do you have a sense of belonging in Australia?’, 2007‐2017
0%
20%
40%
60%
80%
100%
2007 2009 2010 2011 2012 2013 2014 2015 2016 2017
Pride in the Aust way of life ('great' + 'moderate') Maintaining Aust way of life important ('Strongly agree' + 'agree')
77%
72%
72%
73%
74%
65%
66%
69%
66%
67%
19%
23%
23%
21%
21%
26%
26%
23%
25%
25%
2%
4%
3%
6%
4%
6%
6%
5%
5%
5%
0% 10% 20% 30% 40% 50% 60% 70% 80% 90% 100%
2007
2009
2010
2011
2012
2013
2014
2015
2016
2017
To a great extent To a moderate extent Only slightly Not at all Don't know/refused
Components of the Scanlon-Monash Index
SMI 1: Sense of belonging
General questions relating to national life and levels of personal satisfaction continue to elicit the high levels of positive response that are evident in Australian surveys over the last 20 years. There has been little change within the domain of belonging since it reached a low point in 2013.
Sense of belonging (‘great’ and ‘moderate’): 92% in 2017, down from 98%‐99% between 2007‐2012. The proportion indicating belonging ‘to a great extent’ has declined from a high point of 77% in 2007 and is at 67% in 2017.
Sense of pride in the Australian way of life and culture (‘great’ and ‘moderate’): 89% in 2015‐17, down from 93% in 2011 and 94% in 2007. Sense of pride ‘to a great extent’ increased from 51% in 2013, 56% in 2016, 54% in 2017.
Importance of maintaining the Australian way of life and culture (‘strongly agree’ and ‘agree’) was constant at 91% from 2010 to 2016, down from 93% in 2009 and 95% in 2007. In 2017 it dropped to 87%, the lowest result since 2007. There has been a marked shift in the balance between ‘strong agreement’ and ‘agreement’, with a decrease in ‘strong agreement’ from 65% in 2007 to 55% in 2012‐13; in 2017 ‘strong agreement’ was at 57%.
Mapping Social Cohesion 2017: National Report 27
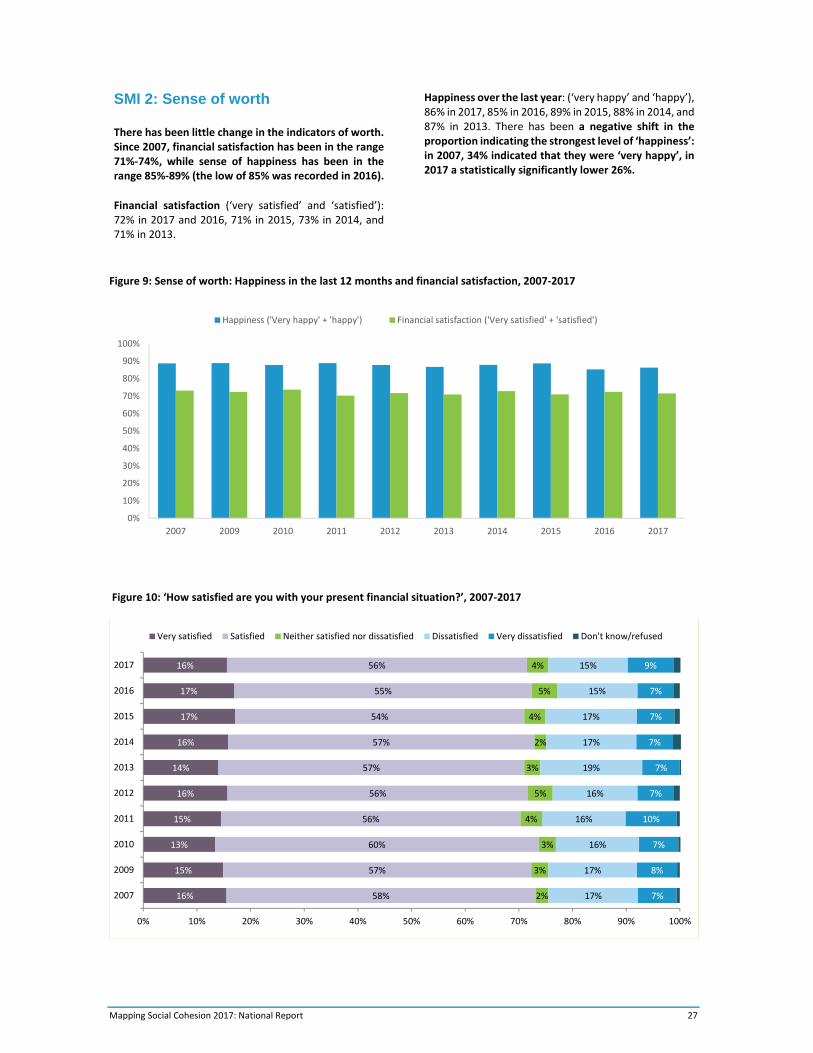
Figure 9: Sense of worth: Happiness in the last 12 months and financial satisfaction, 2007‐2017
Figure 10: ‘How satisfied are you with your present financial situation?’, 2007‐2017
0%
10%
20%
30%
40%
50%
60%
70%
80%
90%
100%
2007 2009 2010 2011 2012 2013 2014 2015 2016 2017
Happiness ('Very happy' + 'happy') Financial satisfaction ('Very satisfied' + 'satisfied')
16%
15%
13%
15%
16%
14%
16%
17%
17%
16%
58%
57%
60%
56%
56%
57%
57%
54%
55%
56%
2%
3%
3%
4%
5%
3%
2%
4%
5%
4%
17%
17%
16%
16%
16%
19%
17%
17%
15%
15%
7%
8%
7%
10%
7%
7%
7%
7%
7%
9%
0% 10% 20% 30% 40% 50% 60% 70% 80% 90% 100%
2007
2009
2010
2011
2012
2013
2014
2015
2016
2017
Very satisfied Satisfied Neither satisfied nor dissatisfied Dissatisfied Very dissatisfied Don't know/refused
SMI 2: Sense of worth
There has been little change in the indicators of worth. Since 2007, financial satisfaction has been in the range 71%‐74%, while sense of happiness has been in the range 85%‐89% (the low of 85% was recorded in 2016).
Financial satisfaction (‘very satisfied’ and ‘satisfied’): 72% in 2017 and 2016, 71% in 2015, 73% in 2014, and 71% in 2013.
Happiness over the last year: (‘very happy’ and ‘happy’), 86% in 2017, 85% in 2016, 89% in 2015, 88% in 2014, and 87% in 2013. There has been a negative shift in the proportion indicating the strongest level of ‘happiness’: in 2007, 34% indicated that they were ‘very happy’, in 2017 a statistically significantly lower 26%.
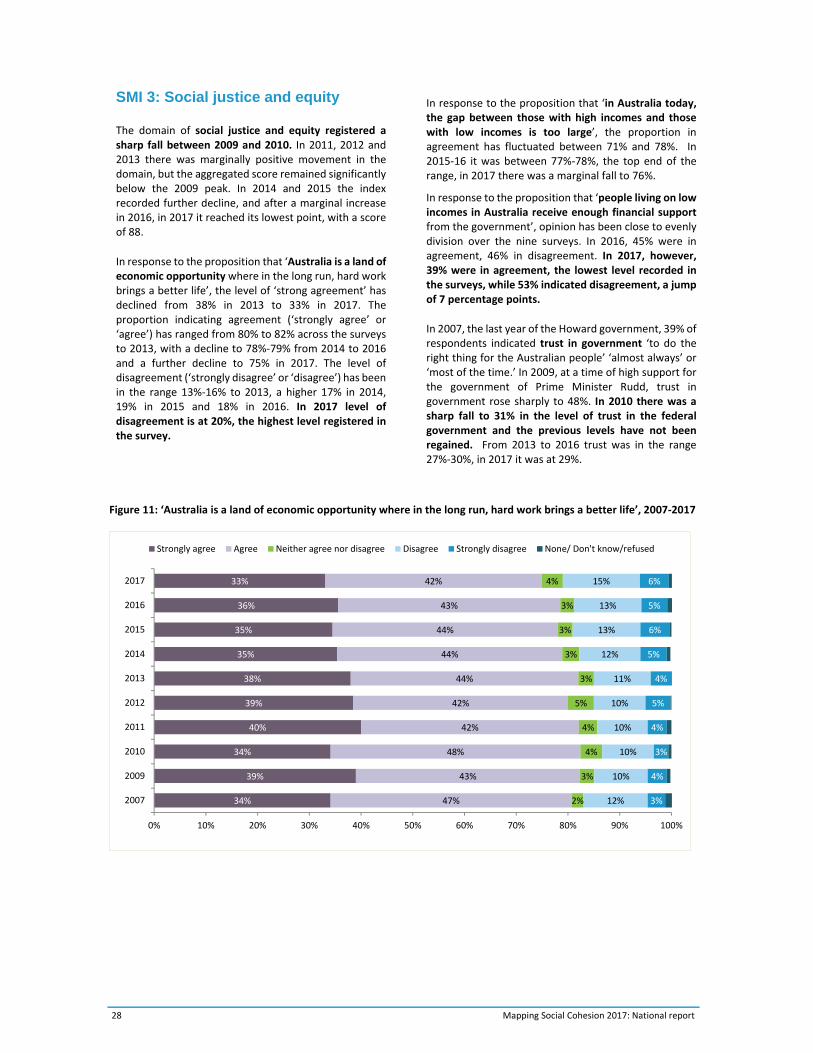
28 Mapping Social Cohesion 2017: National report
Figure 11: ‘Australia is a land of economic opportunity where in the long run, hard work brings a better life’, 2007‐2017
34%
39%
34%
40%
39%
38%
35%
35%
36%
33%
47%
43%
48%
42%
42%
44%
44%
44%
43%
42%
2%
3%
4%
4%
5%
3%
3%
3%
3%
4%
12%
10%
10%
10%
10%
11%
12%
13%
13%
15%
3%
4%
3%
4%
5%
4%
5%
6%
5%
6%
0% 10% 20% 30% 40% 50% 60% 70% 80% 90% 100%
2007
2009
2010
2011
2012
2013
2014
2015
2016
2017
Strongly agree Agree Neither agree nor disagree Disagree Strongly disagree None/ Don't know/refused
SMI 3: Social justice and equity
The domain of social justice and equity registered a sharp fall between 2009 and 2010. In 2011, 2012 and 2013 there was marginally positive movement in the domain, but the aggregated score remained significantly below the 2009 peak. In 2014 and 2015 the index recorded further decline, and after a marginal increase in 2016, in 2017 it reached its lowest point, with a score of 88.
In response to the proposition that ‘Australia is a land of economic opportunity where in the long run, hard work brings a better life’, the level of ‘strong agreement’ has declined from 38% in 2013 to 33% in 2017. The proportion indicating agreement (‘strongly agree’ or ‘agree’) has ranged from 80% to 82% across the surveys to 2013, with a decline to 78%‐79% from 2014 to 2016 and a further decline to 75% in 2017. The level of disagreement (‘strongly disagree’ or ‘disagree’) has been in the range 13%‐16% to 2013, a higher 17% in 2014, 19% in 2015 and 18% in 2016. In 2017 level of disagreement is at 20%, the highest level registered in the survey.
In response to the proposition that ‘in Australia today, the gap between those with high incomes and those with low incomes is too large’, the proportion in agreement has fluctuated between 71% and 78%. In 2015‐16 it was between 77%‐78%, the top end of the range, in 2017 there was a marginal fall to 76%.
In response to the proposition that ‘people living on low incomes in Australia receive enough financial support from the government’, opinion has been close to evenly division over the nine surveys. In 2016, 45% were in agreement, 46% in disagreement. In 2017, however, 39% were in agreement, the lowest level recorded in the surveys, while 53% indicated disagreement, a jump of 7 percentage points.
In 2007, the last year of the Howard government, 39% of respondents indicated trust in government ‘to do the right thing for the Australian people’ ‘almost always’ or ‘most of the time.’ In 2009, at a time of high support for the government of Prime Minister Rudd, trust in government rose sharply to 48%. In 2010 there was a sharp fall to 31% in the level of trust in the federal government and the previous levels have not been regained. From 2013 to 2016 trust was in the range 27%‐30%, in 2017 it was at 29%.
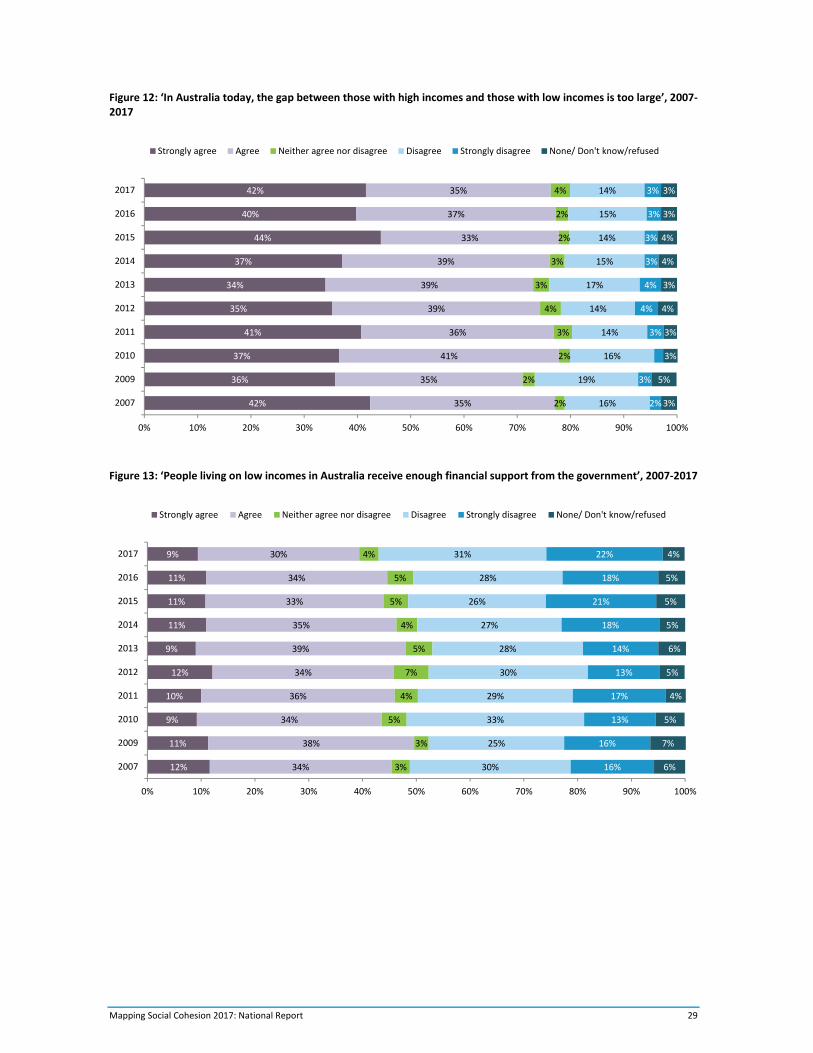
Mapping Social Cohesion 2017: National Report 29
Figure 12: ‘In Australia today, the gap between those with high incomes and those with low incomes is too large’, 2007‐2017
Figure 13: ‘People living on low incomes in Australia receive enough financial support from the government’, 2007‐2017
42%
36%
37%
41%
35%
34%
37%
44%
40%
42%
35%
35%
41%
36%
39%
39%
39%
33%
37%
35%
2%
2%
2%
3%
4%
3%
3%
2%
2%
4%
16%
19%
16%
14%
14%
17%
15%
14%
15%
14%
2%
3%
3%
4%
4%
3%
3%
3%
3%
3%
5%
3%
3%
4%
3%
4%
4%
3%
3%
0% 10% 20% 30% 40% 50% 60% 70% 80% 90% 100%
2007
2009
2010
2011
2012
2013
2014
2015
2016
2017
Strongly agree Agree Neither agree nor disagree Disagree Strongly disagree None/ Don't know/refused
12%
11%
9%
10%
12%
9%
11%
11%
11%
9%
34%
38%
34%
36%
34%
39%
35%
33%
34%
30%
3%
3%
5%
4%
7%
5%
4%
5%
5%
4%
30%
25%
33%
29%
30%
28%
27%
26%
28%
31%
16%
16%
13%
17%
13%
14%
18%
21%
18%
22%
6%
7%
5%
4%
5%
6%
5%
5%
5%
4%
0% 10% 20% 30% 40% 50% 60% 70% 80% 90% 100%
2007
2009
2010
2011
2012
2013
2014
2015
2016
2017
Strongly agree Agree Neither agree nor disagree Disagree Strongly disagree None/ Don't know/refused
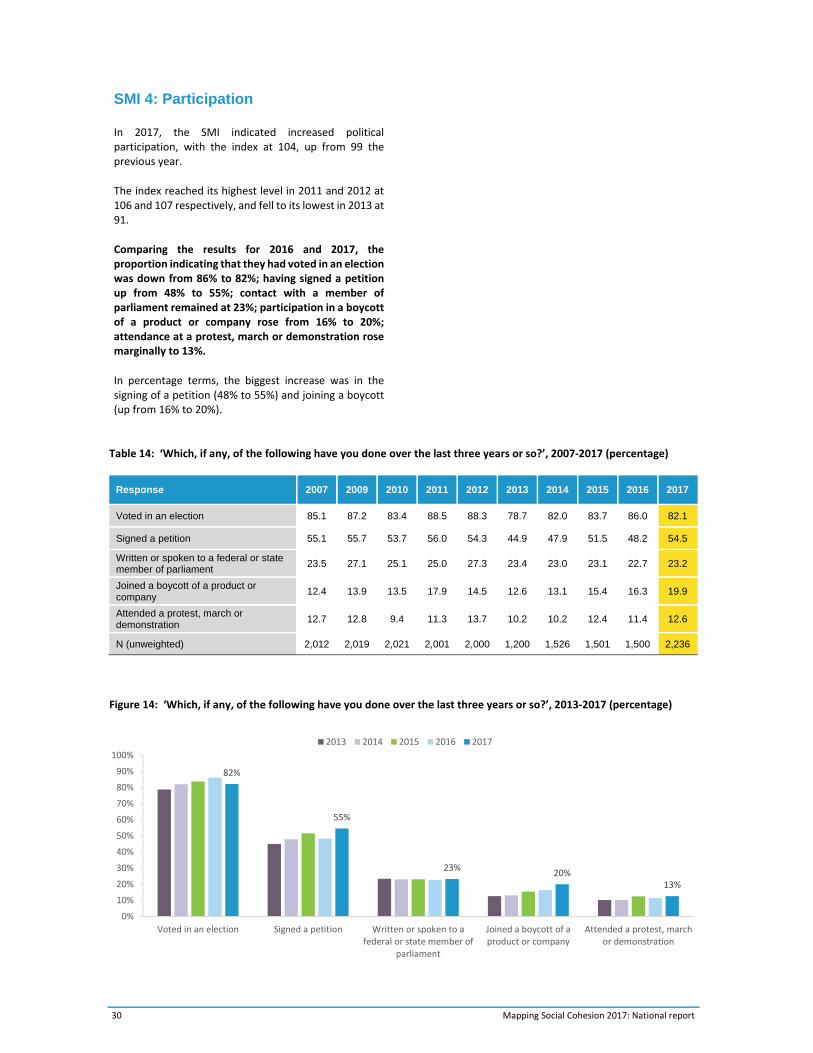
30 Mapping Social Cohesion 2017: National report
Table 14: ‘Which, if any, of the following have you done over the last three years or so?’, 2007‐2017 (percentage)
Response 2007 2009 2010 2011 2012 2013 2014 2015 2016 2017
Voted in an election 85.1 87.2 83.4 88.5 88.3 78.7 82.0 83.7 86.0 82.1
Signed a petition 55.1 55.7 53.7 56.0 54.3 44.9 47.9 51.5 48.2 54.5
Written or spoken to a federal or state member of parliament
23.5 27.1 25.1 25.0 27.3 23.4 23.0 23.1 22.7 23.2
Joined a boycott of a product or company
12.4 13.9 13.5 17.9 14.5 12.6 13.1 15.4 16.3 19.9
Attended a protest, march or demonstration
12.7 12.8 9.4 11.3 13.7 10.2 10.2 12.4 11.4 12.6
N (unweighted) 2,012 2,019 2,021 2,001 2,000 1,200 1,526 1,501 1,500 2,236
Figure 14: ‘Which, if any, of the following have you done over the last three years or so?’, 2013‐2017 (percentage)
SMI 4: Participation
In 2017, the SMI indicated increased political participation, with the index at 104, up from 99 the previous year.
The index reached its highest level in 2011 and 2012 at 106 and 107 respectively, and fell to its lowest in 2013 at 91.
Comparing the results for 2016 and 2017, the proportion indicating that they had voted in an election was down from 86% to 82%; having signed a petition up from 48% to 55%; contact with a member of parliament remained at 23%; participation in a boycott of a product or company rose from 16% to 20%; attendance at a protest, march or demonstration rose marginally to 13%.
In percentage terms, the biggest increase was in the signing of a petition (48% to 55%) and joining a boycott (up from 16% to 20%).
82%
55%
23%20%
13%
0%
10%
20%
30%
40%
50%
60%
70%
80%
90%
100%
Voted in an election Signed a petition Written or spoken to afederal or state member of
parliament
Joined a boycott of aproduct or company
Attended a protest, marchor demonstration
2013 2014 2015 2016 2017
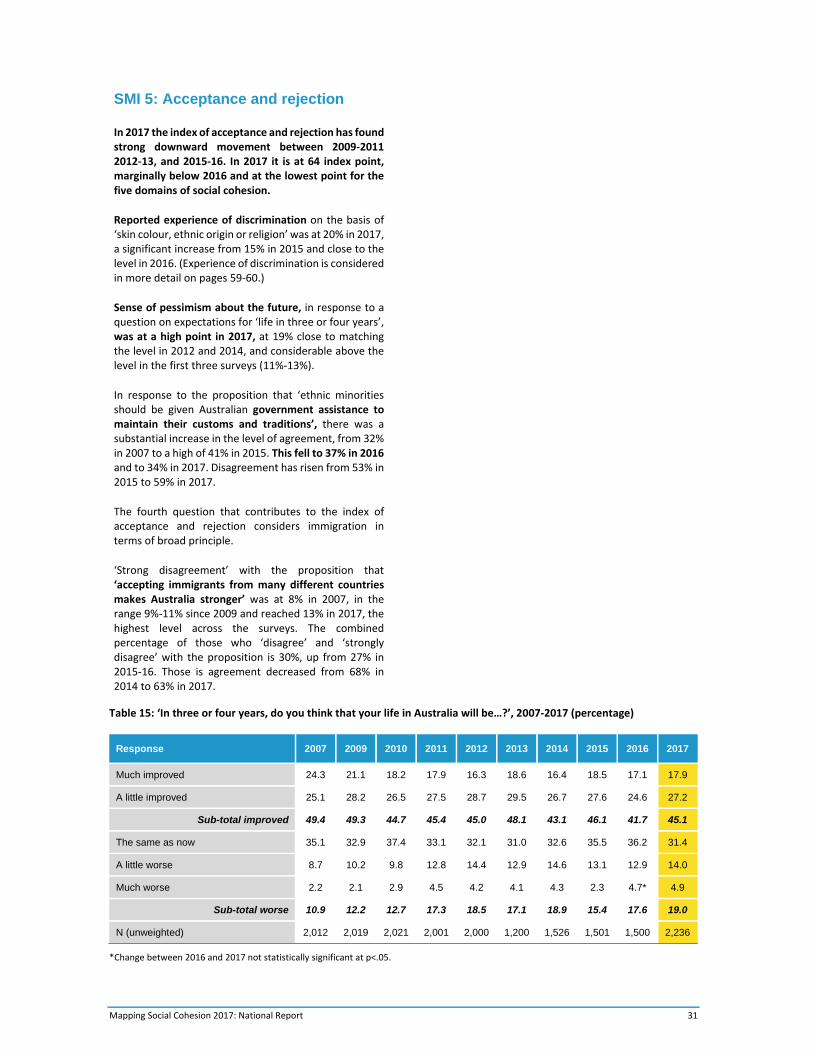
Mapping Social Cohesion 2017: National Report 31
Table 15: ‘In three or four years, do you think that your life in Australia will be…?’, 2007‐2017 (percentage)
Response 2007 2009 2010 2011 2012 2013 2014 2015 2016 2017
Much improved 24.3 21.1 18.2 17.9 16.3 18.6 16.4 18.5 17.1 17.9
A little improved 25.1 28.2 26.5 27.5 28.7 29.5 26.7 27.6 24.6 27.2
Sub-total improved 49.4 49.3 44.7 45.4 45.0 48.1 43.1 46.1 41.7 45.1
The same as now 35.1 32.9 37.4 33.1 32.1 31.0 32.6 35.5 36.2 31.4
A little worse 8.7 10.2 9.8 12.8 14.4 12.9 14.6 13.1 12.9 14.0
Much worse 2.2 2.1 2.9 4.5 4.2 4.1 4.3 2.3 4.7* 4.9
Sub-total worse 10.9 12.2 12.7 17.3 18.5 17.1 18.9 15.4 17.6 19.0
N (unweighted) 2,012 2,019 2,021 2,001 2,000 1,200 1,526 1,501 1,500 2,236
*Change between 2016 and 2017 not statistically significant at p<.05.
SMI 5: Acceptance and rejection
In 2017 the index of acceptance and rejection has found strong downward movement between 2009‐2011 2012‐13, and 2015‐16. In 2017 it is at 64 index point, marginally below 2016 and at the lowest point for the five domains of social cohesion.
Reported experience of discrimination on the basis of ‘skin colour, ethnic origin or religion’ was at 20% in 2017, a significant increase from 15% in 2015 and close to the level in 2016. (Experience of discrimination is considered in more detail on pages 59‐60.)
Sense of pessimism about the future, in response to a question on expectations for ‘life in three or four years’, was at a high point in 2017, at 19% close to matching the level in 2012 and 2014, and considerable above the level in the first three surveys (11%‐13%).
In response to the proposition that ‘ethnic minorities should be given Australian government assistance to maintain their customs and traditions’, there was a substantial increase in the level of agreement, from 32% in 2007 to a high of 41% in 2015. This fell to 37% in 2016 and to 34% in 2017. Disagreement has risen from 53% in 2015 to 59% in 2017.
The fourth question that contributes to the index of acceptance and rejection considers immigration in terms of broad principle.
‘Strong disagreement’ with the proposition that ‘accepting immigrants from many different countries makes Australia stronger’ was at 8% in 2007, in the range 9%‐11% since 2009 and reached 13% in 2017, the highest level across the surveys. The combined percentage of those who ‘disagree’ and ‘strongly disagree’ with the proposition is 30%, up from 27% in 2015‐16. Those is agreement decreased from 68% in 2014 to 63% in 2017.
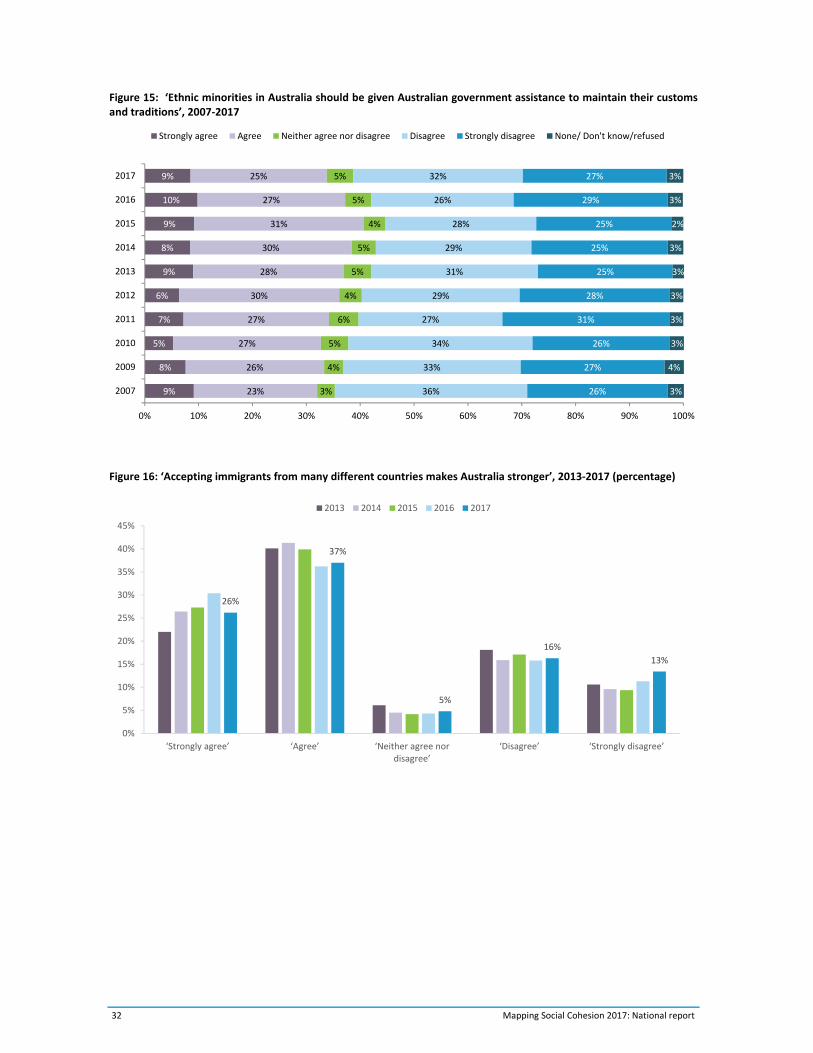
32 Mapping Social Cohesion 2017: National report
Figure 15: ‘Ethnic minorities in Australia should be given Australian government assistance to maintain their customs and traditions’, 2007‐2017
Figure 16: ‘Accepting immigrants from many different countries makes Australia stronger’, 2013‐2017 (percentage)
9%
8%
5%
7%
6%
9%
8%
9%
10%
9%
23%
26%
27%
27%
30%
28%
30%
31%
27%
25%
3%
4%
5%
6%
4%
5%
5%
4%
5%
5%
36%
33%
34%
27%
29%
31%
29%
28%
26%
32%
26%
27%
26%
31%
28%
25%
25%
25%
29%
27%
3%
4%
3%
3%
3%
3%
3%
2%
3%
3%
0% 10% 20% 30% 40% 50% 60% 70% 80% 90% 100%
2007
2009
2010
2011
2012
2013
2014
2015
2016
2017
Strongly agree Agree Neither agree nor disagree Disagree Strongly disagree None/ Don't know/refused
26%
37%
5%
16%
13%
0%
5%
10%
15%
20%
25%
30%
35%
40%
45%
‘Strongly agree’ ‘Agree’ ‘Neither agree nor disagree’
‘Disagree’ ‘Strongly disagree’
2013 2014 2015 2016 2017
Mapping Social Cohesion 2017: National Report 33
RANKING OF ISSUES
The Scanlon Foundation survey seeks to determine the issues that are of greatest concern in the community.
Since 2010, the first question in the survey has been open‐ended. It asks: ‘What do you think is the most important problem facing Australia today?’ The value of an open‐ended question is that it leaves it to respondents to stipulate issues, rather than requiring selection from a pre‐determined and limited list. An open‐ended approach necessarily produces a broad range of responses.
In the eight surveys between 2010 and 2017, respondents have consistently given first rank to issues related to the economy, unemployment and poverty. The importance of the issue increased from 22% in 2010 to a peak of 36% in 2012, with a marginal decline to 33%‐34% in the three surveys 2013‐15. It dropped to 28% in 2016 and 26% in 2017.
The quality of government and political leadership has been a consistently prominent issue, specified by 12%‐15% of respondents between 2011 and 2014. It was the second ranked issue in 2017, indicated by 10% of respondents, close to the level of the previous two years.
The issue of immigration and population was equal third ranked, selected by close to 8% of respondents. Of these, 6% indicated concern at the high level of immigration and population growth, a relatively small but increasing proportion. This level of concern contrasts with attitudes in the United Kingdom, where the Ipsos‐MORI Index found in 2015 that immigration was the top ranked issue, ahead of the National Health Service and the economy; in 2017 the YouGov survey, conducted on a monthly basis, at times weekly, has found that immigration ranks third, behind Brexit and National Health, but ahead of the economy.13
Between 2011 and 2014, concern over defence, national security and the threat of terrorism ranked low, indicated by less than 1% of respondents. In 2015, however, it increased to 10%, in the aftermath of the Lindt café siege and other terrorist incidents, including shootings in Paris, making it the second highest ranked issue of that year. In 2016, defence, national security and the threat of terrorism was the third ranked issue at 9%, and was marginally lower at 7% in 2017.
In 2017, social issues (family breakdown, child care, drug use, lack of personal direction) were ranked equal third, specified by 7% of respondents, down from 11% in 2015.
Environmental issues have declined from a peak of 18% in 2011 to 7% in 2017, close to the level of the previous four years. Nearly all who mentioned environmental issues in 2017 referred to concern over climate change. The relatively large proportion who in past years mentioned the environment because they were concerned with government over‐reaction has declined from a peak of 6% in 2011 to under 1% in the last five surveys.
The decline of concern over the issue of asylum seekers, a major finding of the 2014 survey, remains in evidence. Concern was specified by 7% of respondents in 2010 and 2011 and increased to 12% in 2012 and 2013. In 2014 concern dropped sharply to 4%. In 2017 concern was specified by just 2%, with half indicating concern over the poor treatment of asylum seekers.
Change is observed in two additional areas, as shown in Figure 18. The issue of housing affordability increased from 2% in 2016 to 6% in 2017, the highest proportion over the eight surveys; there has also been increased concern over crime and law enforcement, which averaged under 2% between 2012‐2015, in 2017 indicated by 4%.
As in earlier surveys, there was almost no reference to Indigenous issues, mentioned by 0.6% of respondents, or women’s issues/gender equality mentioned by 0.1% of respondents. Concern over racism in Australian society declined from 4% to 2%.
13 Scott Blinder and William Allen, ‘UK Public Opinion toward Immigration’, The Migration Observatory, 2016; YouGov, Top Issues Tracker (GB), 2016‐2017
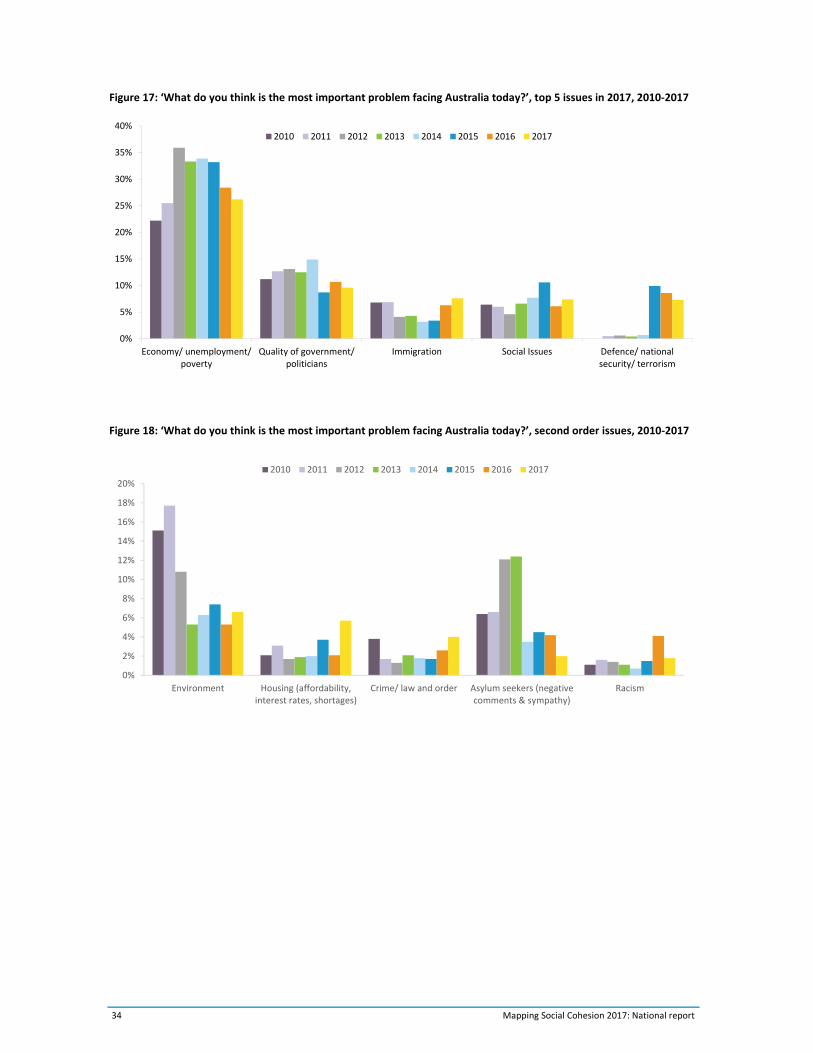
34 Mapping Social Cohesion 2017: National report
Figure 17: ‘What do you think is the most important problem facing Australia today?’, top 5 issues in 2017, 2010‐2017
Figure 18: ‘What do you think is the most important problem facing Australia today?’, second order issues, 2010‐2017
0%
5%
10%
15%
20%
25%
30%
35%
40%
Economy/ unemployment/poverty
Quality of government/politicians
Immigration Social Issues Defence/ nationalsecurity/ terrorism
2010 2011 2012 2013 2014 2015 2016 2017
0%
2%
4%
6%
8%
10%
12%
14%
16%
18%
20%
Environment Housing (affordability,interest rates, shortages)
Crime/ law and order Asylum seekers (negativecomments & sympathy)
Racism
2010 2011 2012 2013 2014 2015 2016 2017
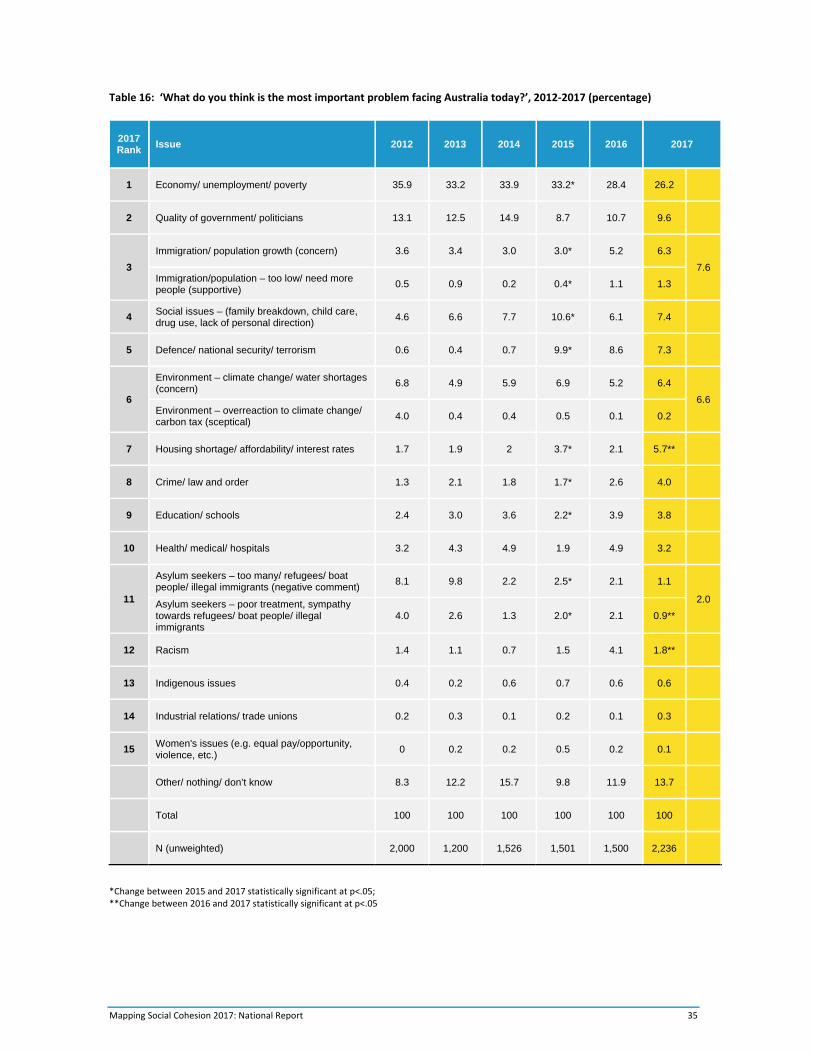
Mapping Social Cohesion 2017: National Report 35
Table 16: ‘What do you think is the most important problem facing Australia today?’, 2012‐2017 (percentage)
2017 Rank
Issue 2012 2013 2014 2015 2016 2017
1 Economy/ unemployment/ poverty 35.9 33.2 33.9 33.2* 28.4 26.2
2 Quality of government/ politicians 13.1 12.5 14.9 8.7 10.7 9.6
3
Immigration/ population growth (concern) 3.6 3.4 3.0 3.0* 5.2 6.3
7.6 Immigration/population – too low/ need more people (supportive)
0.5 0.9 0.2 0.4* 1.1 1.3
4 Social issues – (family breakdown, child care, drug use, lack of personal direction)
4.6 6.6 7.7 10.6* 6.1 7.4
5 Defence/ national security/ terrorism 0.6 0.4 0.7 9.9* 8.6 7.3
6
Environment – climate change/ water shortages (concern)
6.8 4.9 5.9 6.9 5.2 6.4
6.6 Environment – overreaction to climate change/ carbon tax (sceptical)
4.0 0.4 0.4 0.5 0.1 0.2
7 Housing shortage/ affordability/ interest rates 1.7 1.9 2 3.7* 2.1 5.7**
8 Crime/ law and order 1.3 2.1 1.8 1.7* 2.6 4.0
9 Education/ schools 2.4 3.0 3.6 2.2* 3.9 3.8
10 Health/ medical/ hospitals 3.2 4.3 4.9 1.9 4.9 3.2
11
Asylum seekers – too many/ refugees/ boat people/ illegal immigrants (negative comment)
8.1 9.8 2.2 2.5* 2.1 1.1
2.0 Asylum seekers – poor treatment, sympathy towards refugees/ boat people/ illegal immigrants
4.0 2.6 1.3 2.0* 2.1 0.9**
12 Racism 1.4 1.1 0.7 1.5 4.1 1.8**
13 Indigenous issues 0.4 0.2 0.6 0.7 0.6 0.6
14 Industrial relations/ trade unions 0.2 0.3 0.1 0.2 0.1 0.3
15 Women's issues (e.g. equal pay/opportunity, violence, etc.)
0 0.2 0.2 0.5 0.2 0.1
Other/ nothing/ don’t know 8.3 12.2 15.7 9.8 11.9 13.7
Total 100 100 100 100 100 100
N (unweighted) 2,000 1,200 1,526 1,501 1,500 2,236
*Change between 2015 and 2017 statistically significant at p<.05; **Change between 2016 and 2017 statistically significant at p<.05
36 Mapping Social Cohesion 2017: National report
DEMOCRACY
Concern with the state of Australian democracy remains a frequent topic of public discussion in Australia. A 2015 issue of the quarterly journal Meanjin was devoted to the question ‘Is there a crisis in Australian democracy?’ In August 2015 a National Reform Summit was sponsored by The Australian, The Australian Financial Review and KPMG, with the aim ‘of building a consensus for reform and break the political deadlock that has increasingly frustrated policy change.’ Paul Kelly, the Editor‐at‐large of The Australian, wrote in September 2015 of ‘an eight year fiasco under Labor and Coalition governments’ and of ‘the demise of economic reform since 2003‐04.’
In the aftermath of the 2016 federal election, Mark Triffitt, Politics lecturer at the University of Melbourne, observed that the election result ‘highlighted that the dam wall of public dissatisfaction with the major parties and their disconnected way of “doing” democracy is near‐to‐bursting.’ 14
Survey findings have featured in the discussion, with particular attention to the annual Lowy Institute Poll. The 2014 poll was interpreted at indicating ‘Australian’s Ambivalence About Democracy,’ supported by the finding that ‘only 60% of Australians…. believe that democracy is preferable to any other kind of government.’ The 2015‐17 Lowy poll findings have found little change, with preference for democracy over ‘any other kind of to government’ in the range 60%‐65%, indicating consistency rather than shift in opinion.15
The Australia Election Study, conducted after each federal election by researchers at the Australian National University, provides long term data on the trend of opinion. Satisfaction with democracy was at 60% in 2016, a similar proportion obtained by the Lowy poll in response to a differently worded question, and down from a high of 86% in 2007 and 82% in 2004. One‐in‐five respondents to the Australian Election Study agreed with the proposition that ‘who people vote for won’t make any difference,’ an increase over the last four elections, up from 13% in 2007.16
The following discussion presents the findings of the 2017 Scanlon Foundation survey, which included 15 questions on Australian democracy. In addition to this reporting on the trend of Australian opinion, it provides comparative findings on views of the working of Canadian democracy, a country which has a number of similarities with Australia and with which Australia is often compared.
TRUST IN GOVERNMENT
Since 2007 the Scanlon Foundation surveys have included a question on trust in government. Respondents are asked: ‘How often do you think the government in Canberra can be trusted to do the right thing for the Australian people?’ and are presented with four response options: ‘almost always’, ‘most of the time’, ‘only some of the time’, and ‘almost never.’ The highest proportion indicating the first or second response, ‘almost always’ or ‘most of the time’, was at 39% in 2007, the last year of the Howard government, and rose to 48% in 2009; this was followed by a sharp fall to 31% in 2010, in the context of a loss of confidence in the Rudd Labor government. A low point of 26% was reached in 2012, representing a decline of 21 percentage points since 2009, followed by stabilisation in 2013.
There was an expectation that in 2014, following the election of the Abbott government, there would be significant increase in level of trust, on the pattern of the increase in confidence in the early period of the Rudd government. This expectation was not realised. While the level of trust increased, it was only by three percentage points to 30% in 2014 and has remained at or close to that level (29%‐30%) between 2015‐17.
14 Tim Colebatch, ‘The upside of the falling big‐party vote’, Inside Story, 11 July 2016; Mark Triffitt, ‘Australia needs to lead again on democratic innovation’, The Conversation, 26 August 2016 15 Lowy Institute Press Release, 4 June 2014, Lowy Institute Polls at http://www.lowyinstitute.org/ 16 Sarah Cameron and Ian McAllister, ‘Trends in Australian Political Opinion. Results from the Australian Election Study 1987‐2016’, 2016
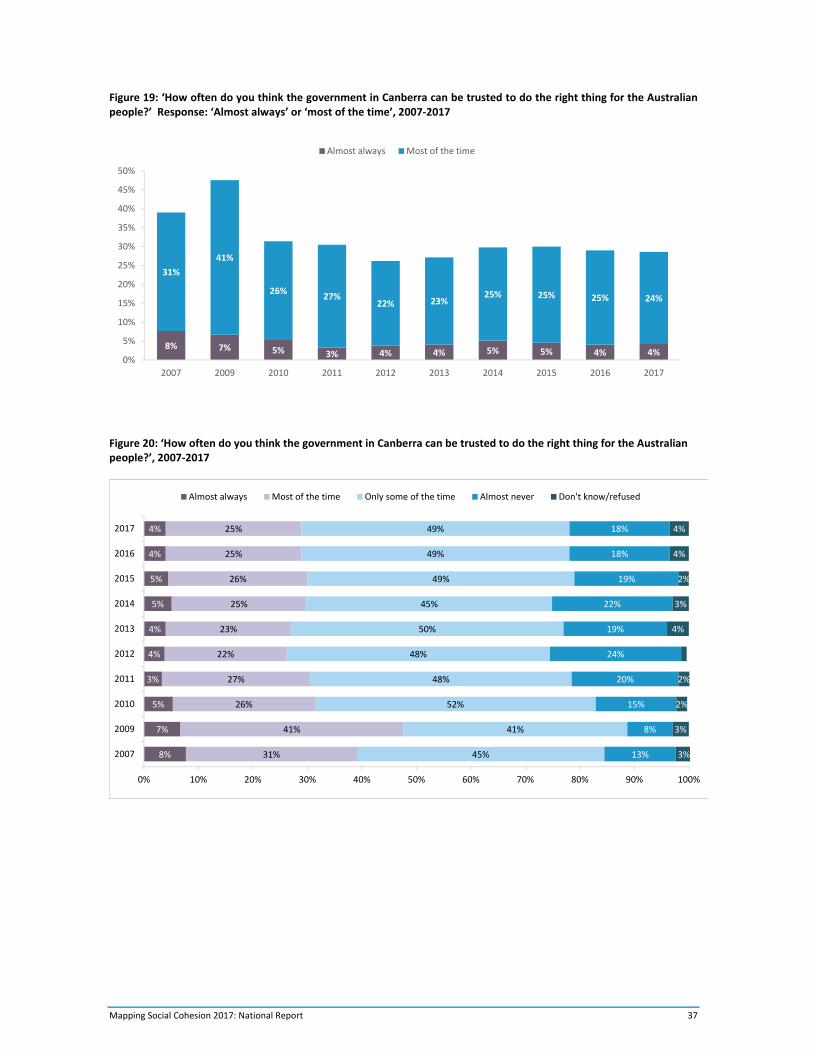
Mapping Social Cohesion 2017: National Report 37
Figure 19: ‘How often do you think the government in Canberra can be trusted to do the right thing for the Australian people?’ Response: ‘Almost always’ or ‘most of the time’, 2007‐2017
Figure 20: ‘How often do you think the government in Canberra can be trusted to do the right thing for the Australian people?’, 2007‐2017
8% 7% 5% 3% 4% 4% 5% 5% 4% 4%
31%
41%
26%27%
22% 23%25% 25% 25% 24%
0%
5%
10%
15%
20%
25%
30%
35%
40%
45%
50%
2007 2009 2010 2011 2012 2013 2014 2015 2016 2017
Almost always Most of the time
8%
7%
5%
3%
4%
4%
5%
5%
4%
4%
31%
41%
26%
27%
22%
23%
25%
26%
25%
25%
45%
41%
52%
48%
48%
50%
45%
49%
49%
49%
13%
8%
15%
20%
24%
19%
22%
19%
18%
18%
3%
3%
2%
2%
4%
3%
2%
4%
4%
0% 10% 20% 30% 40% 50% 60% 70% 80% 90% 100%
2007
2009
2010
2011
2012
2013
2014
2015
2016
2017
Almost always Most of the time Only some of the time Almost never Don't know/refused
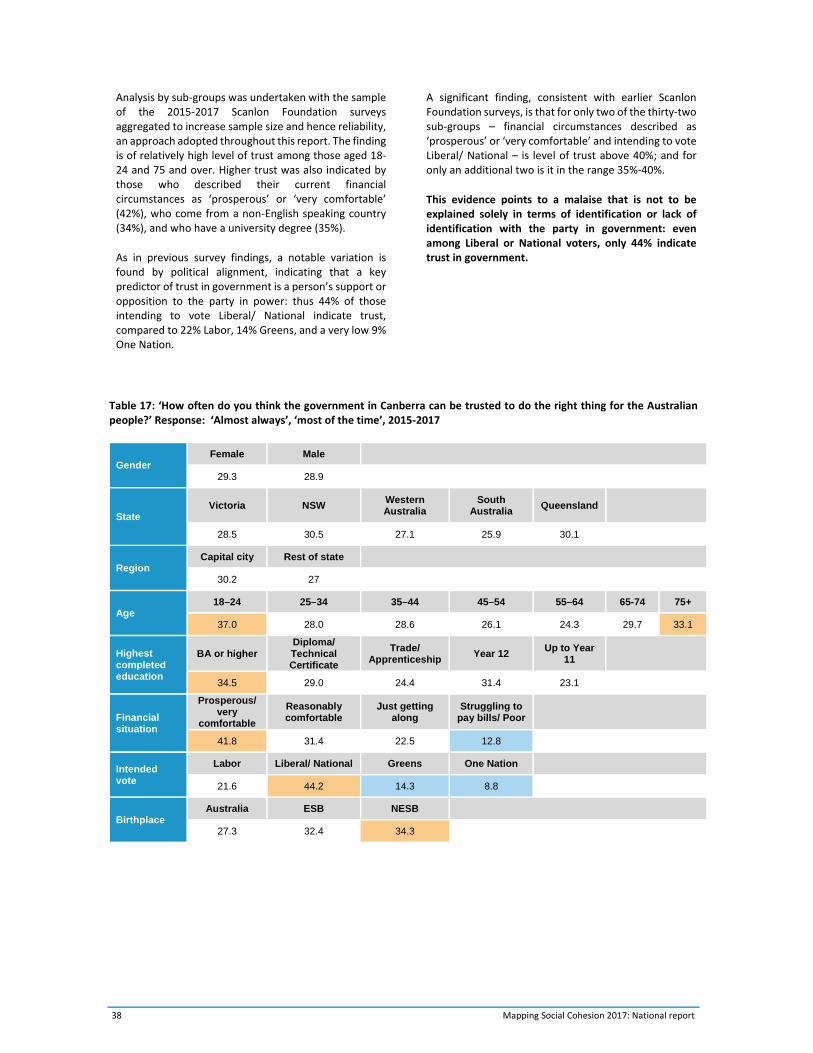
38 Mapping Social Cohesion 2017: National report
Analysis by sub‐groups was undertaken with the sample of the 2015‐2017 Scanlon Foundation surveys aggregated to increase sample size and hence reliability, an approach adopted throughout this report. The finding is of relatively high level of trust among those aged 18‐24 and 75 and over. Higher trust was also indicated by those who described their current financial circumstances as ‘prosperous’ or ‘very comfortable’ (42%), who come from a non‐English speaking country (34%), and who have a university degree (35%).
As in previous survey findings, a notable variation is found by political alignment, indicating that a key predictor of trust in government is a person’s support or opposition to the party in power: thus 44% of those intending to vote Liberal/ National indicate trust, compared to 22% Labor, 14% Greens, and a very low 9% One Nation.
A significant finding, consistent with earlier Scanlon Foundation surveys, is that for only two of the thirty‐two sub‐groups – financial circumstances described as ‘prosperous’ or ‘very comfortable’ and intending to vote Liberal/ National – is level of trust above 40%; and for only an additional two is it in the range 35%‐40%.
This evidence points to a malaise that is not to be explained solely in terms of identification or lack of identification with the party in government: even among Liberal or National voters, only 44% indicate trust in government.
Table 17: ‘How often do you think the government in Canberra can be trusted to do the right thing for the Australian people?’ Response: ‘Almost always’, ‘most of the time’, 2015‐2017
Gender Female Male
29.3 28.9
State Victoria NSW
Western Australia
South Australia
Queensland
28.5 30.5 27.1 25.9 30.1
Region Capital city Rest of state
30.2 27
Age 18–24 25–34 35–44 45–54 55–64 65-74 75+
37.0 28.0 28.6 26.1 24.3 29.7 33.1
Highest completed education
BA or higher Diploma/ Technical Certificate
Trade/ Apprenticeship
Year 12 Up to Year
11
34.5 29.0 24.4 31.4 23.1
Financial situation
Prosperous/ very
comfortable
Reasonably comfortable
Just getting along
Struggling to pay bills/ Poor
41.8 31.4 22.5 12.8
Intended vote
Labor Liberal/ National Greens One Nation
21.6 44.2 14.3 8.8
Birthplace Australia ESB NESB
27.3 32.4 34.3
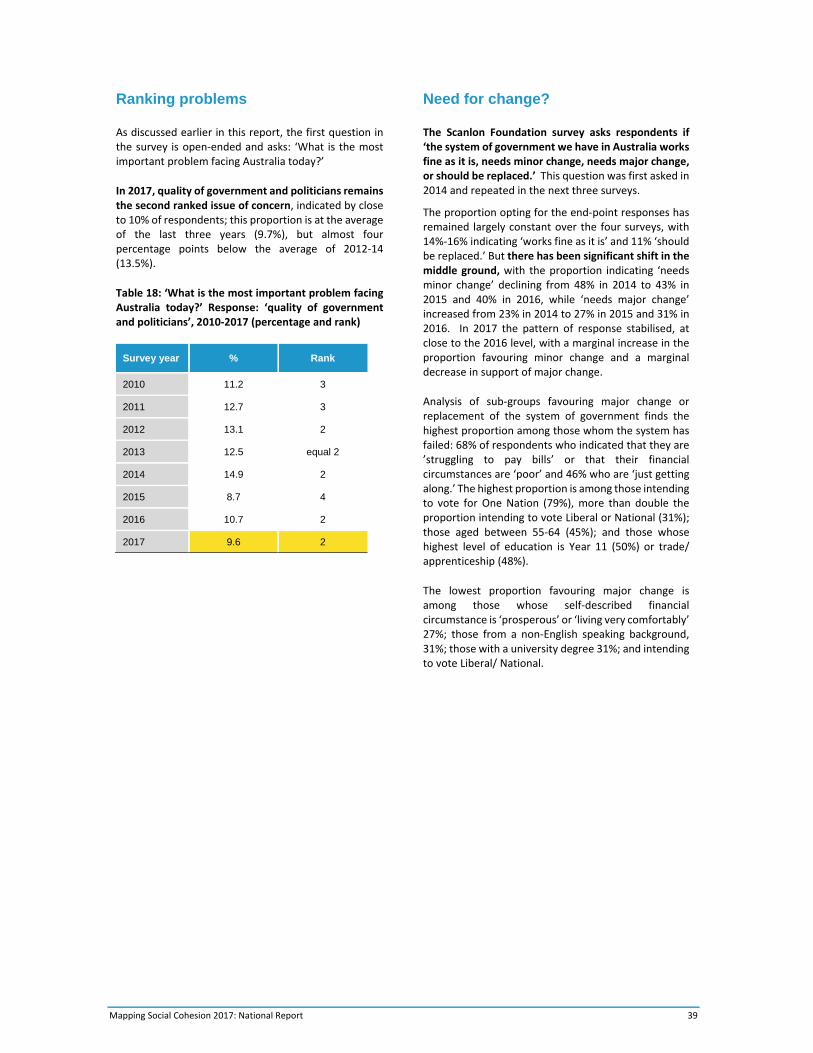
Mapping Social Cohesion 2017: National Report 39
Ranking problems
As discussed earlier in this report, the first question in the survey is open‐ended and asks: ‘What is the most important problem facing Australia today?’
In 2017, quality of government and politicians remains the second ranked issue of concern, indicated by close to 10% of respondents; this proportion is at the average of the last three years (9.7%), but almost four percentage points below the average of 2012‐14 (13.5%).
Table 18: ‘What is the most important problem facing Australia today?’ Response: ‘quality of government and politicians’, 2010‐2017 (percentage and rank)
Survey year % Rank
2010 11.2 3
2011 12.7 3
2012 13.1 2
2013 12.5 equal 2
2014 14.9 2
2015 8.7 4
2016 10.7 2
2017 9.6 2
Need for change?
The Scanlon Foundation survey asks respondents if ‘the system of government we have in Australia works fine as it is, needs minor change, needs major change, or should be replaced.’ This question was first asked in 2014 and repeated in the next three surveys.
The proportion opting for the end‐point responses has remained largely constant over the four surveys, with 14%‐16% indicating ‘works fine as it is’ and 11% ‘should be replaced.’ But there has been significant shift in the middle ground, with the proportion indicating ‘needs minor change’ declining from 48% in 2014 to 43% in 2015 and 40% in 2016, while ‘needs major change’ increased from 23% in 2014 to 27% in 2015 and 31% in 2016. In 2017 the pattern of response stabilised, at close to the 2016 level, with a marginal increase in the proportion favouring minor change and a marginal decrease in support of major change.
Analysis of sub‐groups favouring major change or replacement of the system of government finds the highest proportion among those whom the system has failed: 68% of respondents who indicated that they are ’struggling to pay bills’ or that their financial circumstances are ‘poor’ and 46% who are ‘just getting along.’ The highest proportion is among those intending to vote for One Nation (79%), more than double the proportion intending to vote Liberal or National (31%); those aged between 55‐64 (45%); and those whose highest level of education is Year 11 (50%) or trade/ apprenticeship (48%).
The lowest proportion favouring major change is among those whose self‐described financial circumstance is ‘prosperous’ or ‘living very comfortably’ 27%; those from a non‐English speaking background, 31%; those with a university degree 31%; and intending to vote Liberal/ National.
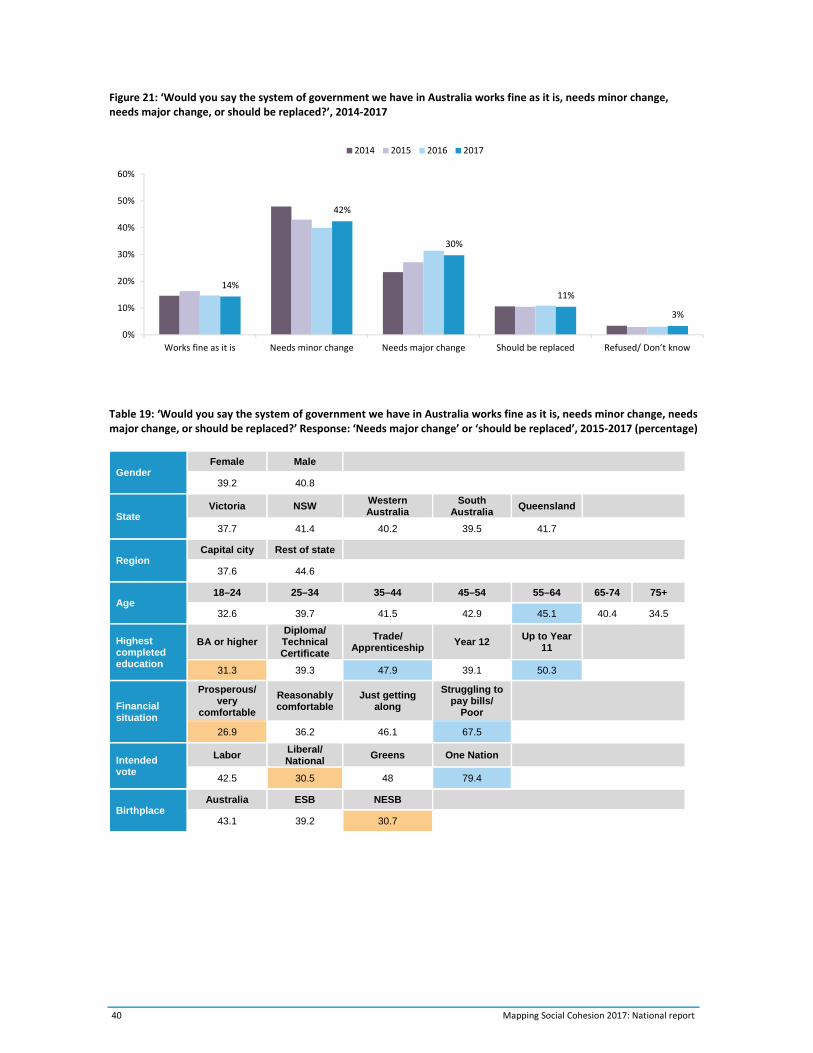
40 Mapping Social Cohesion 2017: National report
Figure 21: ‘Would you say the system of government we have in Australia works fine as it is, needs minor change, needs major change, or should be replaced?’, 2014‐2017
Table 19: ‘Would you say the system of government we have in Australia works fine as it is, needs minor change, needs major change, or should be replaced?’ Response: ‘Needs major change’ or ‘should be replaced’, 2015‐2017 (percentage)
Gender Female Male
39.2 40.8
State Victoria NSW
Western Australia
South Australia
Queensland
37.7 41.4 40.2 39.5 41.7
Region Capital city Rest of state
37.6 44.6
Age 18–24 25–34 35–44 45–54 55–64 65-74 75+
32.6 39.7 41.5 42.9 45.1 40.4 34.5
Highest completed education
BA or higher Diploma/ Technical Certificate
Trade/ Apprenticeship
Year 12 Up to Year
11
31.3 39.3 47.9 39.1 50.3
Financial situation
Prosperous/ very
comfortable
Reasonably comfortable
Just getting along
Struggling to pay bills/
Poor
26.9 36.2 46.1 67.5
Intended vote
Labor Liberal/ National
Greens One Nation
42.5 30.5 48 79.4
Birthplace Australia ESB NESB
43.1 39.2 30.7
14%
42%
30%
11%
3%
0%
10%
20%
30%
40%
50%
60%
Works fine as it is Needs minor change Needs major change Should be replaced Refused/ Don’t know
2014 2015 2016 2017
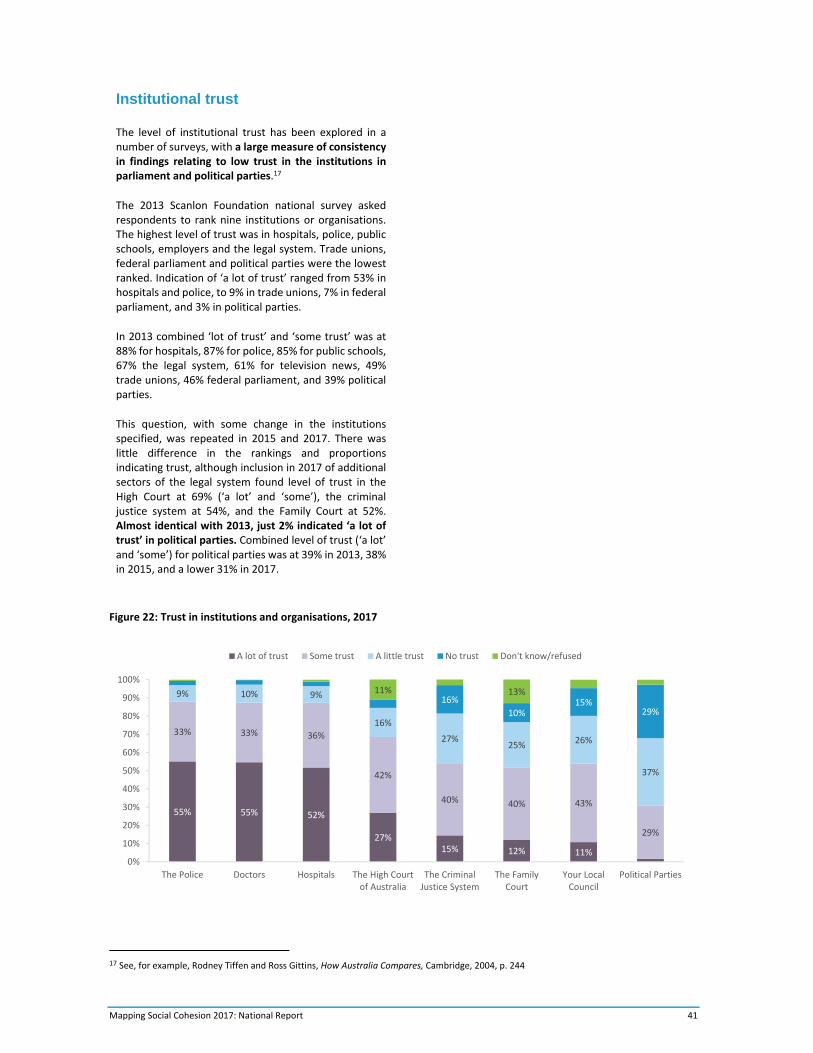
Mapping Social Cohesion 2017: National Report 41
Institutional trust
The level of institutional trust has been explored in a number of surveys, with a large measure of consistency in findings relating to low trust in the institutions in parliament and political parties.17
The 2013 Scanlon Foundation national survey asked respondents to rank nine institutions or organisations. The highest level of trust was in hospitals, police, public schools, employers and the legal system. Trade unions, federal parliament and political parties were the lowest ranked. Indication of ‘a lot of trust’ ranged from 53% in hospitals and police, to 9% in trade unions, 7% in federal parliament, and 3% in political parties.
In 2013 combined ‘lot of trust’ and ‘some trust’ was at 88% for hospitals, 87% for police, 85% for public schools, 67% the legal system, 61% for television news, 49% trade unions, 46% federal parliament, and 39% political parties.
This question, with some change in the institutions specified, was repeated in 2015 and 2017. There was little difference in the rankings and proportions indicating trust, although inclusion in 2017 of additional sectors of the legal system found level of trust in the High Court at 69% (‘a lot’ and ‘some’), the criminal justice system at 54%, and the Family Court at 52%. Almost identical with 2013, just 2% indicated ‘a lot of trust’ in political parties. Combined level of trust (‘a lot’ and ‘some’) for political parties was at 39% in 2013, 38% in 2015, and a lower 31% in 2017.
Figure 22: Trust in institutions and organisations, 2017
17 See, for example, Rodney Tiffen and Ross Gittins, How Australia Compares, Cambridge, 2004, p. 244
55% 55% 52%
27%15% 12% 11%
33% 33% 36%
42%
40% 40% 43%
29%
9% 10% 9%
16%
27%25% 26%
37%
16%
10%15%
29%
11% 13%
0%
10%
20%
30%
40%
50%
60%
70%
80%
90%
100%
The Police Doctors Hospitals The High Courtof Australia
The CriminalJustice System
The FamilyCourt
Your LocalCouncil
Political Parties
A lot of trust Some trust A little trust No trust Don't know/refused
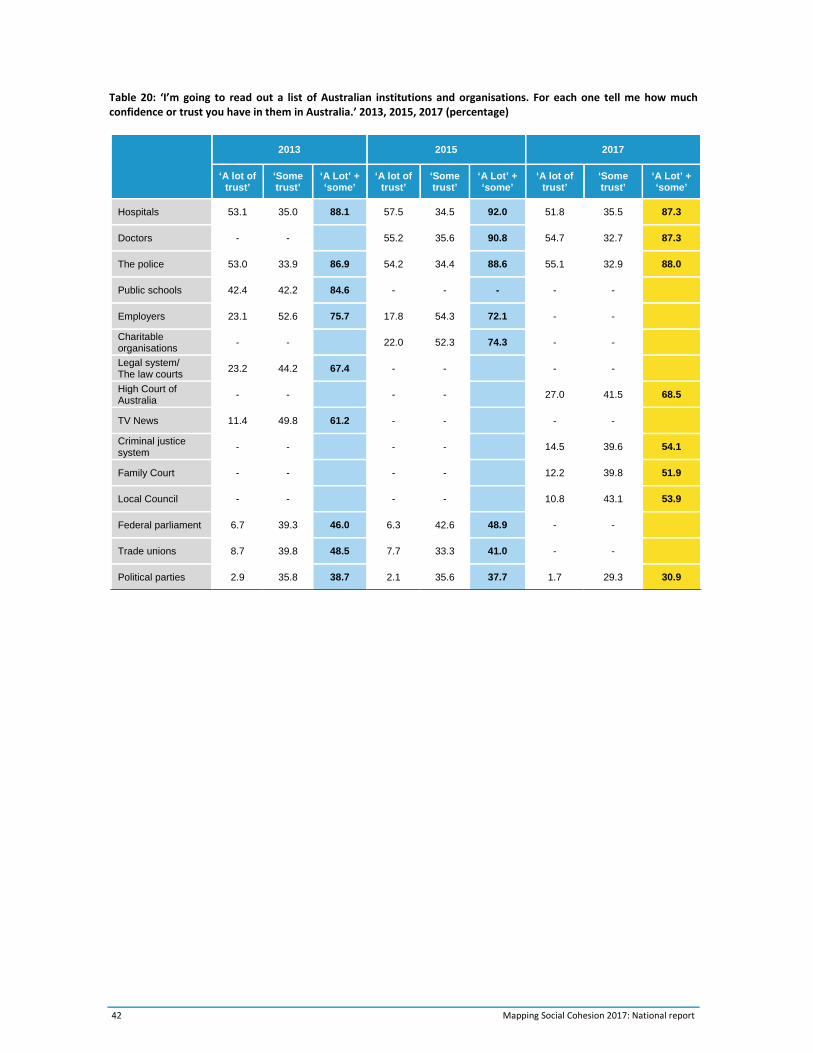
42 Mapping Social Cohesion 2017: National report
Table 20: ‘I’m going to read out a list of Australian institutions and organisations. For each one tell me how much confidence or trust you have in them in Australia.’ 2013, 2015, 2017 (percentage)
2013 2015 2017
‘A lot of trust’
‘Some trust’
‘A Lot’ + ‘some’
‘A lot of trust’
‘Some trust’
‘A Lot’ + ‘some’
‘A lot of trust’
‘Some trust’
‘A Lot’ + ‘some’
Hospitals 53.1 35.0 88.1 57.5 34.5 92.0 51.8 35.5 87.3
Doctors - - 55.2 35.6 90.8 54.7 32.7 87.3
The police 53.0 33.9 86.9 54.2 34.4 88.6 55.1 32.9 88.0
Public schools 42.4 42.2 84.6 - - - - -
Employers 23.1 52.6 75.7 17.8 54.3 72.1 - -
Charitable organisations
- - 22.0 52.3 74.3 - -
Legal system/ The law courts
23.2 44.2 67.4 - - - -
High Court of Australia
- - - - 27.0 41.5 68.5
TV News 11.4 49.8 61.2 - - - -
Criminal justice system
- - - - 14.5 39.6 54.1
Family Court - - - - 12.2 39.8 51.9
Local Council - - - - 10.8 43.1 53.9
Federal parliament 6.7 39.3 46.0 6.3 42.6 48.9 - -
Trade unions 8.7 39.8 48.5 7.7 33.3 41.0 - -
Political parties 2.9 35.8 38.7 2.1 35.6 37.7 1.7 29.3 30.9
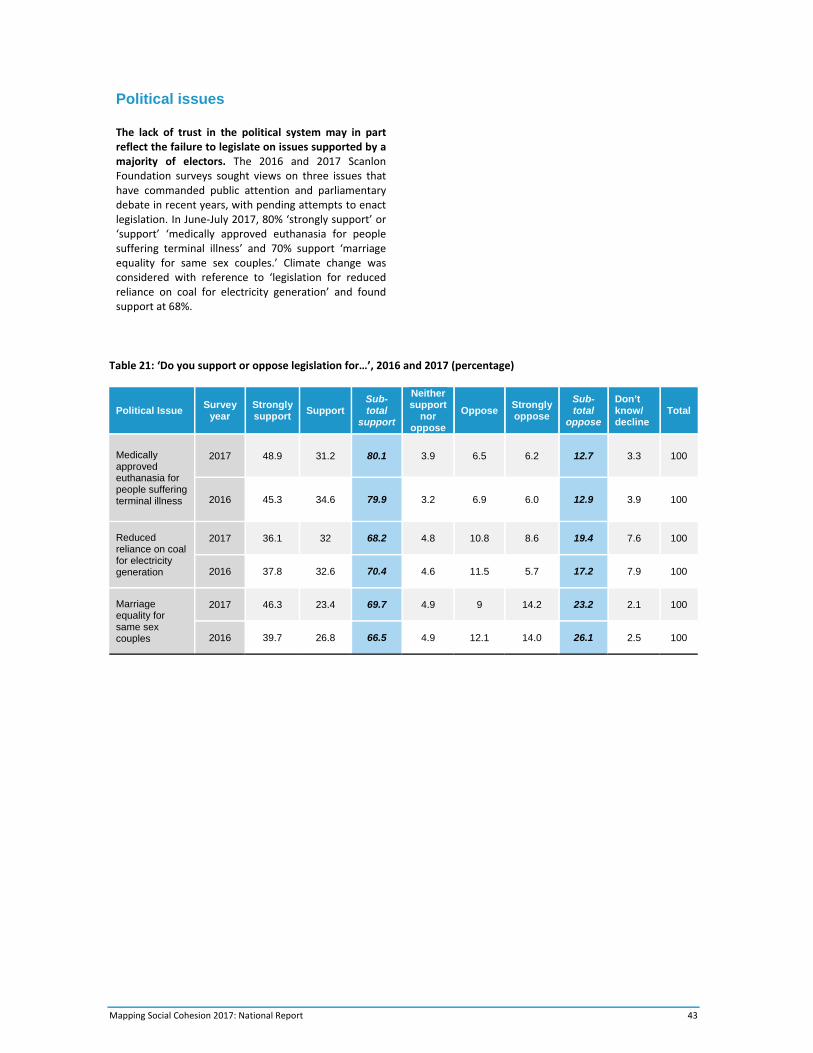
Mapping Social Cohesion 2017: National Report 43
Political issues
The lack of trust in the political system may in part reflect the failure to legislate on issues supported by a majority of electors. The 2016 and 2017 Scanlon Foundation surveys sought views on three issues that have commanded public attention and parliamentary debate in recent years, with pending attempts to enact legislation. In June‐July 2017, 80% ‘strongly support’ or ‘support’ ‘medically approved euthanasia for people suffering terminal illness’ and 70% support ‘marriage equality for same sex couples.’ Climate change was considered with reference to ‘legislation for reduced reliance on coal for electricity generation’ and found support at 68%.
Table 21: ‘Do you support or oppose legislation for…’, 2016 and 2017 (percentage)
Political Issue Survey
year Strongly support
Support Sub-total
support
Neither support
nor oppose
Oppose Strongly oppose
Sub-total
oppose
Don’t know/ decline
Total
Medically approved euthanasia for people suffering terminal illness
2017 48.9 31.2 80.1 3.9 6.5 6.2 12.7 3.3 100
2016 45.3 34.6 79.9 3.2 6.9 6.0 12.9 3.9 100
Reduced reliance on coal for electricity generation
2017 36.1 32 68.2 4.8 10.8 8.6 19.4 7.6 100
2016 37.8 32.6 70.4 4.6 11.5 5.7 17.2 7.9 100
Marriage equality for same sex couples
2017 46.3 23.4 69.7 4.9 9 14.2 23.2 2.1 100
2016 39.7 26.8 66.5 4.9 12.1 14.0 26.1 2.5 100
44 Mapping Social Cohesion 2017: National report
Australia and Canada compared
How does opinion in Australia on the political system compare with other democracies? While there is a substantial body of survey data, comparative studies need to be undertaken with care. In nearly all surveys there are differences in question wording and question context, and survey mode and sample size. A further problem relates to difference of meaning that can be attached to specific words in different countries.
The following discussion compares survey findings in Australia and Canada, two new world immigrant nations, mid‐ranked economies with significant reliance on mining, and which have traditionally compared their progress and influenced each other in aspects of policy development.18
Political mood
Both the current mood and the trend of Canadian opinion is more positive than the Australian with regard to government.
Hence, a June 2017 article in The Globe and Mail (29 June 2017) reported that a recent survey found Canada to be an ‘ “island of stability” amidst a Western world roiled by political discontent and populism.’ According to the poll, Canadians were ‘particularly trustful of their democracy.’ A second survey, based on a sample of 4000 Canadians, was reported as finding that the ‘Health of Canadian democracy improving, but concerns remain.’ (CBC News, 28 March 2017) Canada’s political culture was graded at B‐minus, a slight improvement from the grading of C in 2015. It was found that 71% of Canadians were ‘very’ or ‘fairly satisfied’ with their democracy, compared to 65% in 2014.
Survey findings
One source of comparative data relates to political involvement. Australia, with its compulsory voting, has a higher participation rate in elections (over 90% among registered voters, under 70% in Canada), but lower participation is indicated in other forms of political action, particularly those such as public protest which require active participation. The Samara Democracy 360 study in Canada found that in 2016, 59% of respondents indicated that they had signed a petition over the last year (48% in 2016 in Australia, as indicated by the Scanlon Foundation survey); 40% had participated in a boycott (16%); and 21% had been involved in a protest on demonstration (11%).19
Questions on level of trust in parliament and political parties is low in both countries, but it is even lower in Australia: 19% of Canadians indicate a high level of trust in parliament (at points 6 or 7 on the seven‐point scale employed by Environics Canada), 6% in Australia as indicated by the Scanlon Foundation survey; 10% in political parties, 2% in Australia.
Questions on level of satisfaction (combined ‘satisfied’ and ‘very satisfied’) with the working of democracy was found to be at 79% by Environics in their 2017 Canadian survey, at 71% by Samara in 2016. A similar question in the 2017 Scanlon Foundation survey, which asked respondents for their view on the working of democracy obtained 56% positive (combined ‘works fine as it is’ and ‘needs minor change’).
Environics Canada presented respondents with three response options concerning democratic and other forms of government in 2014 and 2017; the Lowy Institute has employed a question with almost identical wording. The Canadian surveys in 2014 and 2017 found preference for democracy over other forms of government at 74% and 65%, the Australian survey at 60% in both years; in contrast, the statement that ‘in some circumstances, authoritarian government may be preferable’ obtained agreement in Canada at 11%‐13%, a higher 20%‐24% in Australia for a question worded with reference to ‘a non‐democratic government’.
Lastly, there are surveys in both countries which gauge level of confidence in political leadership.
Environics Canada has found that trust in the Prime Minister has improved since 2014, reflecting change of leader and party in government. Trust at the level of ‘a lot’ increased from 15% in 2014 to 26% in 2017. The rating of the performance of the Prime Minister in 2017 was 43% positive, 24% negative, net 19% positive; for the previous Canadian Prime Minister, the net result in 2014 was 2% negative.
In Australia, surveys adopt different wording, but the net satisfaction rating provides a basis for comparison. Surveys conducted by Newspoll and Galaxy ask respondents for level of satisfaction ‘with the way the Prime Minister is doing his job’ (Newspoll); in the period August‐October 2017 these surveys have obtained net negative results in the 17%‐28% range.
18 See, for example, Freda Hawkins, Critical Years in Immigration: Canada and Australia Compared, McGill‐Queen’s University Press 2nd edition, 1991; Lesleyanne Hawthorne, ‘Skilled Enough? Employment Outcomes for Recent Economic Migrants in Canada Compared to Australia,’ 2013 19 Samara’s 2017 Democracy 360. The Second Report Card on How Canadians Communicate, Participate and Lead in Politics, slide 21; http://www.samaracanada.com/docs/default‐source/Reports/samara's‐2017‐democracy‐360.pdf?sfvrsn=16
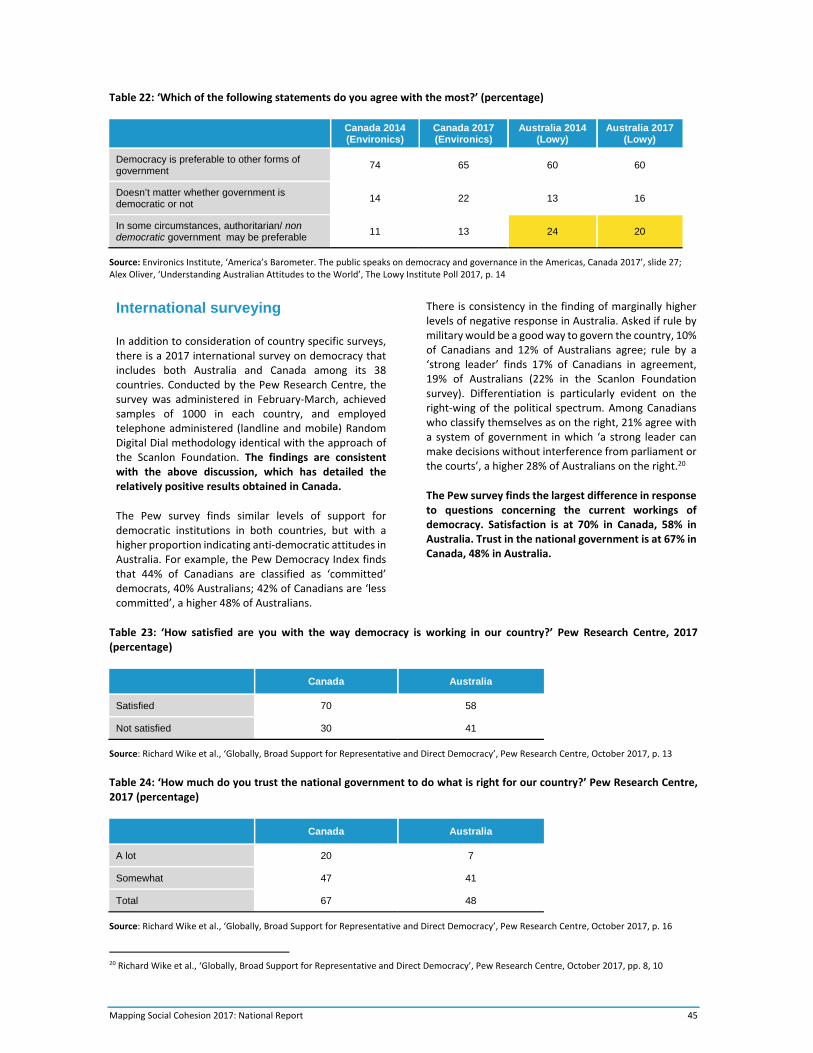
Mapping Social Cohesion 2017: National Report 45
Table 22: ‘Which of the following statements do you agree with the most?’ (percentage)
Canada 2014 (Environics)
Canada 2017 (Environics)
Australia 2014 (Lowy)
Australia 2017 (Lowy)
Democracy is preferable to other forms of government
74 65 60 60
Doesn’t matter whether government is democratic or not
14 22 13 16
In some circumstances, authoritarian/ non democratic government may be preferable
11 13 24 20
Source: Environics Institute, ‘America’s Barometer. The public speaks on democracy and governance in the Americas, Canada 2017’, slide 27; Alex Oliver, ‘Understanding Australian Attitudes to the World’, The Lowy Institute Poll 2017, p. 14
International surveying
In addition to consideration of country specific surveys, there is a 2017 international survey on democracy that includes both Australia and Canada among its 38 countries. Conducted by the Pew Research Centre, the survey was administered in February‐March, achieved samples of 1000 in each country, and employed telephone administered (landline and mobile) Random Digital Dial methodology identical with the approach of the Scanlon Foundation. The findings are consistent with the above discussion, which has detailed the relatively positive results obtained in Canada.
The Pew survey finds similar levels of support for democratic institutions in both countries, but with a higher proportion indicating anti‐democratic attitudes in Australia. For example, the Pew Democracy Index finds that 44% of Canadians are classified as ‘committed’ democrats, 40% Australians; 42% of Canadians are ‘less committed’, a higher 48% of Australians.
There is consistency in the finding of marginally higher levels of negative response in Australia. Asked if rule by military would be a good way to govern the country, 10% of Canadians and 12% of Australians agree; rule by a ‘strong leader’ finds 17% of Canadians in agreement, 19% of Australians (22% in the Scanlon Foundation survey). Differentiation is particularly evident on the right‐wing of the political spectrum. Among Canadians who classify themselves as on the right, 21% agree with a system of government in which ‘a strong leader can make decisions without interference from parliament or the courts’, a higher 28% of Australians on the right.20
The Pew survey finds the largest difference in response to questions concerning the current workings of democracy. Satisfaction is at 70% in Canada, 58% in Australia. Trust in the national government is at 67% in Canada, 48% in Australia.
Table 23: ‘How satisfied are you with the way democracy is working in our country?’ Pew Research Centre, 2017 (percentage)
Canada Australia
Satisfied 70 58
Not satisfied 30 41
Source: Richard Wike et al., ‘Globally, Broad Support for Representative and Direct Democracy’, Pew Research Centre, October 2017, p. 13
Table 24: ‘How much do you trust the national government to do what is right for our country?’ Pew Research Centre, 2017 (percentage)
Canada Australia
A lot 20 7
Somewhat 47 41
Total 67 48
Source: Richard Wike et al., ‘Globally, Broad Support for Representative and Direct Democracy’, Pew Research Centre, October 2017, p. 16
20 Richard Wike et al., ‘Globally, Broad Support for Representative and Direct Democracy’, Pew Research Centre, October 2017, pp. 8, 10
46 Mapping Social Cohesion 2017: National report
IMMIGRATION
Questions related to the immigration intake have been a staple of public opinion polling in Australia for over 50 years. But this polling has not been systematic, nor taken at regular intervals. The Scanlon Foundation surveys provide for the first time publicly available annual findings on a range of immigration issues. In the 2017 survey there were sixteen questions on immigration and cultural diversity, in the context of a comprehensive questionnaire of 56 substantive and 21 demographic questions.
The Scanlon Foundation surveys provide important findings on perceptions of the level of immigration, providing evidence that attitudes are not based on an accurate understanding of immigration levels.
In public discussion of immigration there is considerable misunderstanding, a function of ignorance of the detail of policy, as well as of statistics and terminology that are difficult to interpret. A question on the level of immigration asked in four Scanlon Foundation surveys (2009‐2012) indicates little correlation in public perception and actual changes in the intake. Thus, despite the sharp fall in net overseas migration between 2008 and 2010 (from 277,300 to 196,100), in 2010 only 4% of respondents perceived a decline. It is for this reason that the Scanlon Foundation surveys seek to understand outlook and value orientation; they do not provide factual information on immigrant numbers or policy in the introduction to questions as respondents typically have no frame of reference accurately to interpret information provided.
Analysis of attitudes to immigration over the last 30 years indicates that it is an issue on which there has been considerable volatility of opinion. Whereas in the early 1990s a large majority (over 70% at its peak) considered the intake to be ‘too high’, this has been a minority viewpoint in most surveys conducted since 2000. (Figure 24)
Two key factors seem to inform Australian attitudes to immigration: the political prominence of immigration issues and the level of unemployment. For the years 2001‐2009, in the context of a growing economy, most surveys found that the proportion who considered the intake to be ‘about right’ or ‘too low’ was in the range 54%–57%.
In 2010 there was heightened political debate over immigration and the desirable future population of Australia, in the context of increased unemployment. In that year the Scanlon Foundation survey found increased agreement that the intake was ‘too high’, up from 37% in 2009 to 47%. This finding is almost identical to the 46% average result from five polls conducted by survey agencies in the period March–July 2010.21
This increased negativity towards immigration was temporary. Between 2011 and 2013 the proportion in agreement that the intake was too high was in the range 38%‐42%, between 2014 and 2016 a lower 34%‐35%. In 2016 a substantial majority, 59%, considered that the intake was ‘about right’ or ‘too low.’
The findings for 2017 in large measure conform to the pattern of the last seven years, but at the mid‐point in the range: 37% consider that the intake is too high (a marginal increase of 3 percentage points), 56% that it is ‘about right’ or ‘too low’.
21 Age (Nielsen), 31 July 2010; Roy Morgan Research Finding No. 4536; Essential Report 5 July 2010; Age (Nielsen), 19 April 2010; Roy Morgan Research Finding No. 4482.
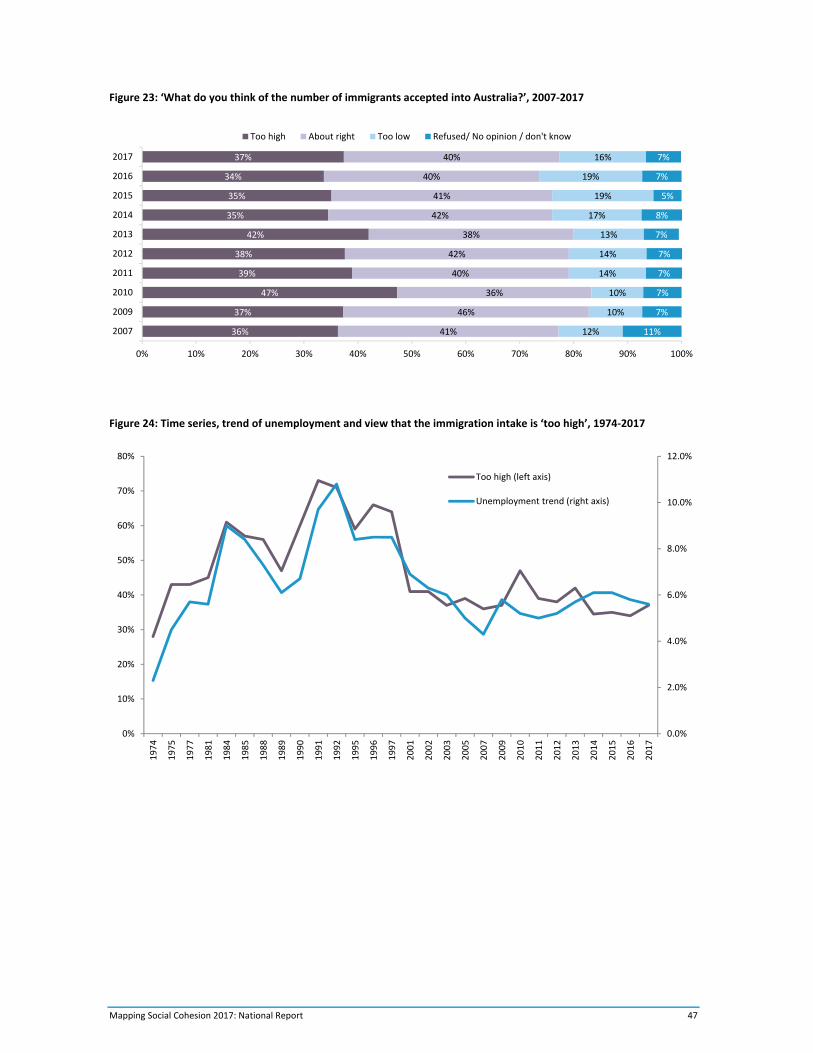
Mapping Social Cohesion 2017: National Report 47
Figure 23: ‘What do you think of the number of immigrants accepted into Australia?’, 2007‐2017
Figure 24: Time series, trend of unemployment and view that the immigration intake is ‘too high’, 1974‐2017
36%
37%
47%
39%
38%
42%
35%
35%
34%
37%
41%
46%
36%
40%
42%
38%
42%
41%
40%
40%
12%
10%
10%
14%
14%
13%
17%
19%
19%
16%
11%
7%
7%
7%
7%
7%
8%
5%
7%
7%
0% 10% 20% 30% 40% 50% 60% 70% 80% 90% 100%
2007
2009
2010
2011
2012
2013
2014
2015
2016
2017
Too high About right Too low Refused/ No opinion / don't know
0.0%
2.0%
4.0%
6.0%
8.0%
10.0%
12.0%
0%
10%
20%
30%
40%
50%
60%
70%
80%
1974
1975
1977
1981
1984
1985
1988
1989
1990
1991
1992
1995
1996
1997
2001
2002
2003
2005
2007
2009
2010
2011
2012
2013
2014
2015
2016
2017
Too high (left axis)
Unemployment trend (right axis)
48 Mapping Social Cohesion 2017: National report
22 Alex Oliver, Lowy Institute Poll 2014, p. 28; Alex Oliver, Lowy Institute Poll 2016, p. 27 23 Roy Morgan Research, finding no. 6507 (20 October 2015), 7025 (26 October 2016)
If attention is narrowed to those who are Australian citizens (and have voting rights) there is little difference in the result. Across the ten Scanlon Foundation surveys, 39.1% of citizens have considered the intake to be ‘too high’; for the last five years the proportions are 43%, 36%, 36%, 34%, and 39%.
A number of recent polls which included questions on immigration support the pattern indicated by Scanlon Foundation surveys.
The 2014 Lowy Institute Poll found that 37% of respondents considered the intake to be ‘too high’, 61% ‘about right’ or ‘too low.’ In 2016 the Lowy Poll tested response to the proposition that ‘overall, there is too much immigration to Australia’: 40% agreed, 57% disagreed. The 2017 Lowy poll repeated the 2014 question, with the finding that 40% indicated that the intake was ‘too high’, up by 3 percentage points, while a majority, 53%, indicated that it was ‘about right’ or ‘too low.’22
The April 2015 ANUpoll asked, ‘Do you think the number of immigrants to Australia nowadays should be increased, remain the same as it is, or be reduced?’ Just 28% favoured reduction, 67% an increase or the current level.
While a question on immigration is not included in all ANUpolls, which are conducted several times a year, each poll includes a question on the ‘the most important problem facing Australia today.’ Unlike the Scanlon Foundation approach, the ANUpoll does not disaggregate positive or negative comment, and includes the asylum issue within the immigration category. While this limits interpretation, it is notable that the poll has not registered a significant increase in concern. Over the 11 surveys conducted between January 2014 and March 2017, an average 11.9% have specified immigration as ‘the most important problem’; in the latest poll, conducted in March 2017, the proportion was only marginally higher at 12.7%.
The Australian Election Study, conducted by Australian National University researchers after federal elections since 1987, includes several questions on immigration. Asked if the number of immigrants allowed into Australia has ‘gone too far’, 52% of respondents agreed in 2010, 42% in 2013, and 40% in 2016. Asked if immigration should be reduced, 41% agreed in 2013, 42% in 2016.
In October 2015, Roy Morgan Research informed respondents that ‘over the last year about 180,000 immigrants came to Australia … to live permanently’ and asked if the number ‘should be increased, or reduced, or remain about the same?’ 26% indicated that the intake should be reduced, 69% that it should remain the same or be increased. When the same question was asked in October 2016, the proportion favouring reduction had increased, but only to 34%, while a clear majority, 61%, supported the current level or an increase. 23
An issue in surveying, as discussed above (p.8), is the impact of interviewer administration. Three of the four surveys discussed, as well as the Scanlon Foundation national survey, are interviewer administered. But the Australian Election Study, which obtained similar results to the other surveys, is self‐administered.
To test the impact of interviewer and mode of administration, the Scanlon Foundation funded the inclusion of seven questions on immigration and cultural diversity in the probability based Life in Australia panel, and a larger number of questions in a non‐probability panel. The large majority of the Life in Australia panel respondents complete the survey online, without interviewer assistance. In the June‐July 2017 survey, 40% of respondents considered that the intake was too high. In an earlier Life in Australia survey, conducted between October‐December 2016, again only a minority (35%) agreed that the intake was too high.
Commercial non‐probability panels have found relatively high levels of negative sentiment towards immigration, but their margin of error cannot be established, unlike probability based surveying.
In 2017 the Scanlon Foundation survey was administered to a non‐probability commercial panel, with a small (n=203) stratified sample to test pattern of response to immigration issues. While the sample was too small to provide statistically reliable results, an interesting finding is that the panel yielded a higher level of negative response than probability sampling: 50% of the full sample indicated agreement that the intake was too high and 53% of those who were Australian citizens.
Mapping Social Cohesion 2017: National Report 49
A 2017 survey undertaken for ‘The Australian Population Research Institute,’ which largely issues research papers authored or co‐authored by Dr Bob Birrell, obtained almost the same result from a large non‐probability sample of 2,067 respondents: 54% of respondents who were Australian voters indicated that the number of immigrants should be reduced.
In addition, this survey asked a number of what are arguably leading questions. For example, it informed respondents that ‘From December 2005 to December 2016 Australia’s population grew from 20.5 million to 24.4 million; 62% of this growth was from net overseas migration.’ It then asked, in blunt terms: ‘Do you think Australia needs more people?’ With this question wording the proportion indicating a negative view of immigration (i.e. Australia does not need more people) jumped to 74%. These and other findings provided rich material for sections of the media with no interest in , or no capacity to undertake, critical scrutiny of question wording and other aspects of survey methodology.24
In addition to the large measure of consistency in the probability based surveys that have been considered, there is one additional finding of significance: all the probability based surveys have registered an increasing proportion of respondents indicating that the immigration intake is too high, but by an average of less than five percentage points.
Analysis by the range of variables employed in this report finds that the highest proportion in agreement that the immigration intake is ‘too high’ is found amongst supporters of One Nation (86%), those with education up to Year 11 level (53%), struggling to pay bills or poor (50%), over the age of 55 (44%‐48%), with Trade or Apprenticeship qualifications (42%), and resident outside capital cities (42%).
24 See Katherine Betts and Bob Birrell, ‘Australian voters’ views on immigration policy’, The Australian Population Research Institute, 25 October 2017; John Masanauskas, ‘Voters say country is full …,’ Herald Sun, 25 October 2017 (‘The explosive data from the poll, commissioned by The Australian Population Research Institute, has enormous implications for the main political parties …’); Rita Panahi, ‘We need an honest discussion about migration and population,’ Herald Sun, 8 November 2017 (‘It shouldn’t surprise anybody who’s been paying attention that a majority of Australians would like to see migrant numbers slashed. The results of a survey commissioned by The Australian Population Research Institute (TAPRI) mirror several other reputable polls in recent years that show the major political parties are wilfully ignoring the wishes of the electorate when it comes to immigration and population policy.’)
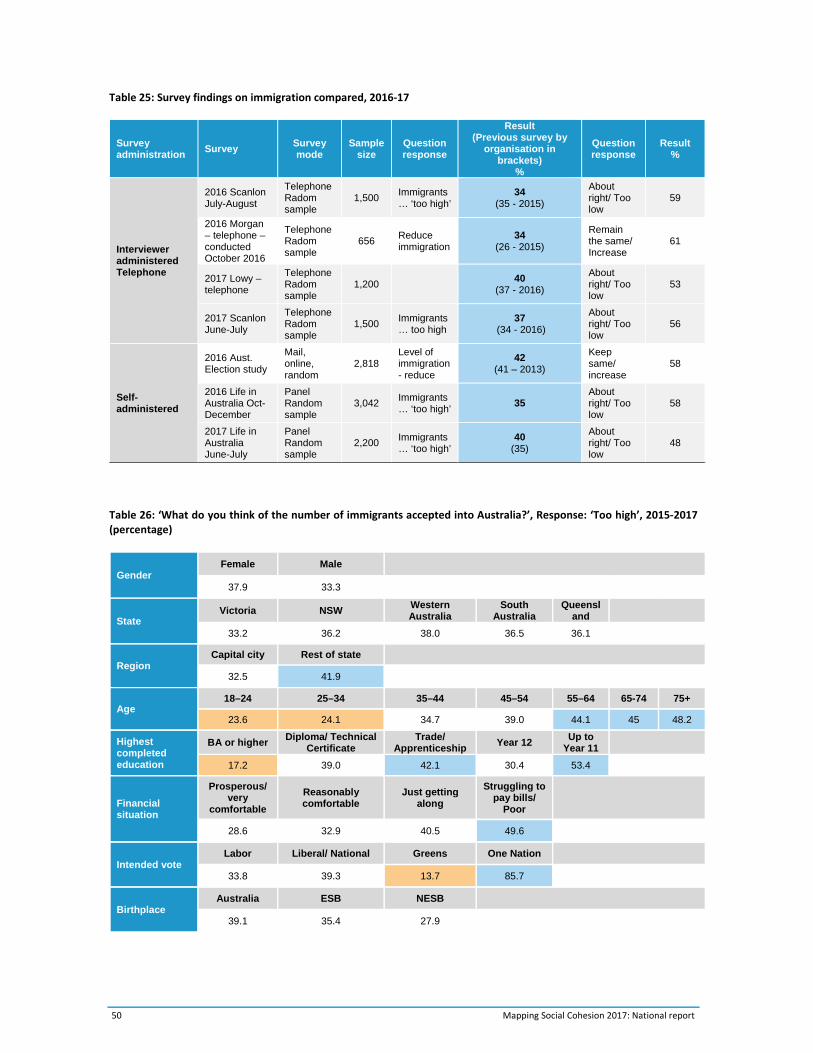
50 Mapping Social Cohesion 2017: National report
Table 25: Survey findings on immigration compared, 2016‐17
Survey administration
Survey Survey mode
Sample size
Question response
Result (Previous survey by
organisation in brackets)
%
Question response
Result %
Interviewer administered Telephone
2016 Scanlon July-August
Telephone Radom sample
1,500 Immigrants … ‘too high’
34 (35 - 2015)
About right/ Too low
59
2016 Morgan – telephone – conducted October 2016
Telephone Radom sample
656 Reduce immigration
34 (26 - 2015)
Remain the same/ Increase
61
2017 Lowy – telephone
Telephone Radom sample
1,200 40
(37 - 2016)
About right/ Too low
53
2017 Scanlon June-July
Telephone Radom sample
1,500 Immigrants … too high
37 (34 - 2016)
About right/ Too low
56
Self-administered
2016 Aust. Election study
Mail, online, random
2,818 Level of immigration - reduce
42 (41 – 2013)
Keep same/ increase
58
2016 Life in Australia Oct-December
Panel Random sample
3,042 Immigrants … ‘too high’
35 About right/ Too low
58
2017 Life in Australia June-July
Panel Random sample
2,200 Immigrants … ‘too high’
40 (35)
About right/ Too low
48
Table 26: ‘What do you think of the number of immigrants accepted into Australia?’, Response: ‘Too high’, 2015‐2017 (percentage)
Gender Female Male
37.9 33.3
State Victoria NSW
Western Australia
South Australia
Queensland
33.2 36.2 38.0 36.5 36.1
Region Capital city Rest of state
32.5 41.9
Age 18–24 25–34 35–44 45–54 55–64 65-74 75+
23.6 24.1 34.7 39.0 44.1 45 48.2
Highest completed education
BA or higher Diploma/ Technical
Certificate Trade/
Apprenticeship Year 12
Up to Year 11
17.2 39.0 42.1 30.4 53.4
Financial situation
Prosperous/ very
comfortable
Reasonably comfortable
Just getting along
Struggling to pay bills/
Poor
28.6 32.9 40.5 49.6
Intended vote Labor Liberal/ National Greens One Nation
33.8 39.3 13.7 85.7
Birthplace Australia ESB NESB
39.1 35.4 27.9
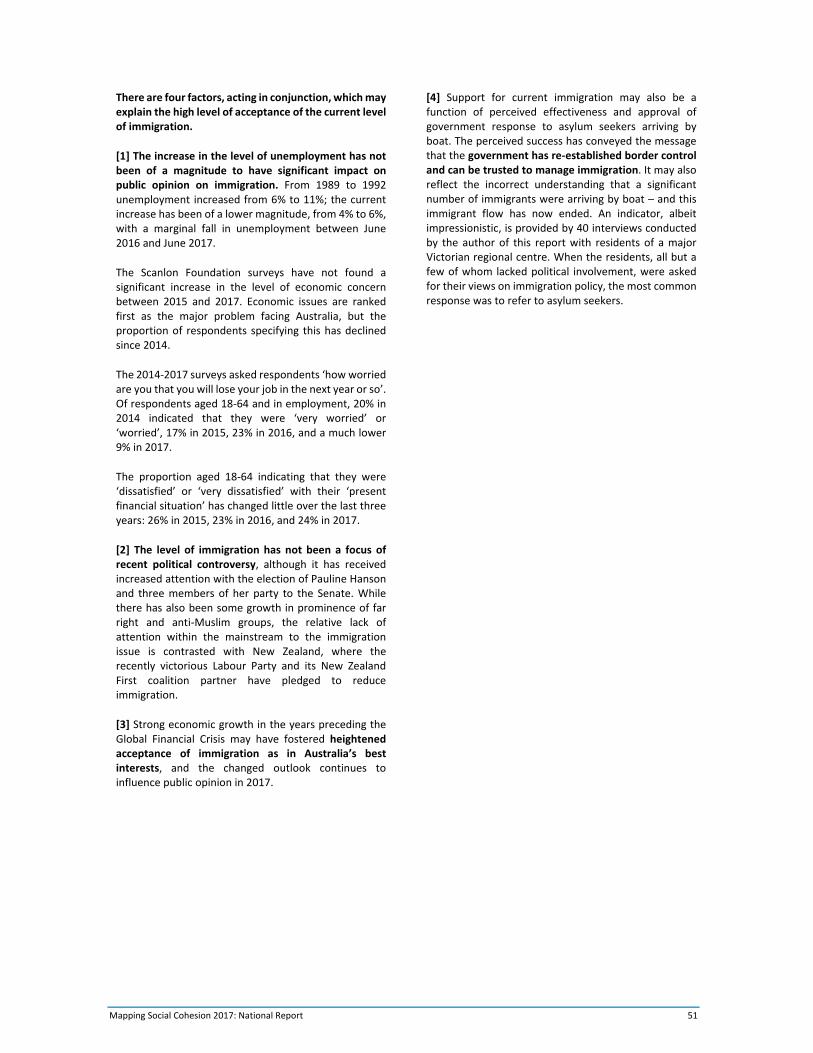
Mapping Social Cohesion 2017: National Report 51
There are four factors, acting in conjunction, which may explain the high level of acceptance of the current level of immigration.
[1] The increase in the level of unemployment has not been of a magnitude to have significant impact on public opinion on immigration. From 1989 to 1992 unemployment increased from 6% to 11%; the current increase has been of a lower magnitude, from 4% to 6%, with a marginal fall in unemployment between June 2016 and June 2017.
The Scanlon Foundation surveys have not found a significant increase in the level of economic concern between 2015 and 2017. Economic issues are ranked first as the major problem facing Australia, but the proportion of respondents specifying this has declined since 2014.
The 2014‐2017 surveys asked respondents ‘how worried are you that you will lose your job in the next year or so’. Of respondents aged 18‐64 and in employment, 20% in 2014 indicated that they were ‘very worried’ or ‘worried’, 17% in 2015, 23% in 2016, and a much lower 9% in 2017.
The proportion aged 18‐64 indicating that they were ‘dissatisfied’ or ‘very dissatisfied’ with their ‘present financial situation’ has changed little over the last three years: 26% in 2015, 23% in 2016, and 24% in 2017.
[2] The level of immigration has not been a focus of recent political controversy, although it has received increased attention with the election of Pauline Hanson and three members of her party to the Senate. While there has also been some growth in prominence of far right and anti‐Muslim groups, the relative lack of attention within the mainstream to the immigration issue is contrasted with New Zealand, where the recently victorious Labour Party and its New Zealand First coalition partner have pledged to reduce immigration.
[3] Strong economic growth in the years preceding the Global Financial Crisis may have fostered heightened acceptance of immigration as in Australia’s best interests, and the changed outlook continues to influence public opinion in 2017.
[4] Support for current immigration may also be a function of perceived effectiveness and approval of government response to asylum seekers arriving by boat. The perceived success has conveyed the message that the government has re‐established border control and can be trusted to manage immigration. It may also reflect the incorrect understanding that a significant number of immigrants were arriving by boat – and this immigrant flow has now ended. An indicator, albeit impressionistic, is provided by 40 interviews conducted by the author of this report with residents of a major Victorian regional centre. When the residents, all but a few of whom lacked political involvement, were asked for their views on immigration policy, the most common response was to refer to asylum seekers.
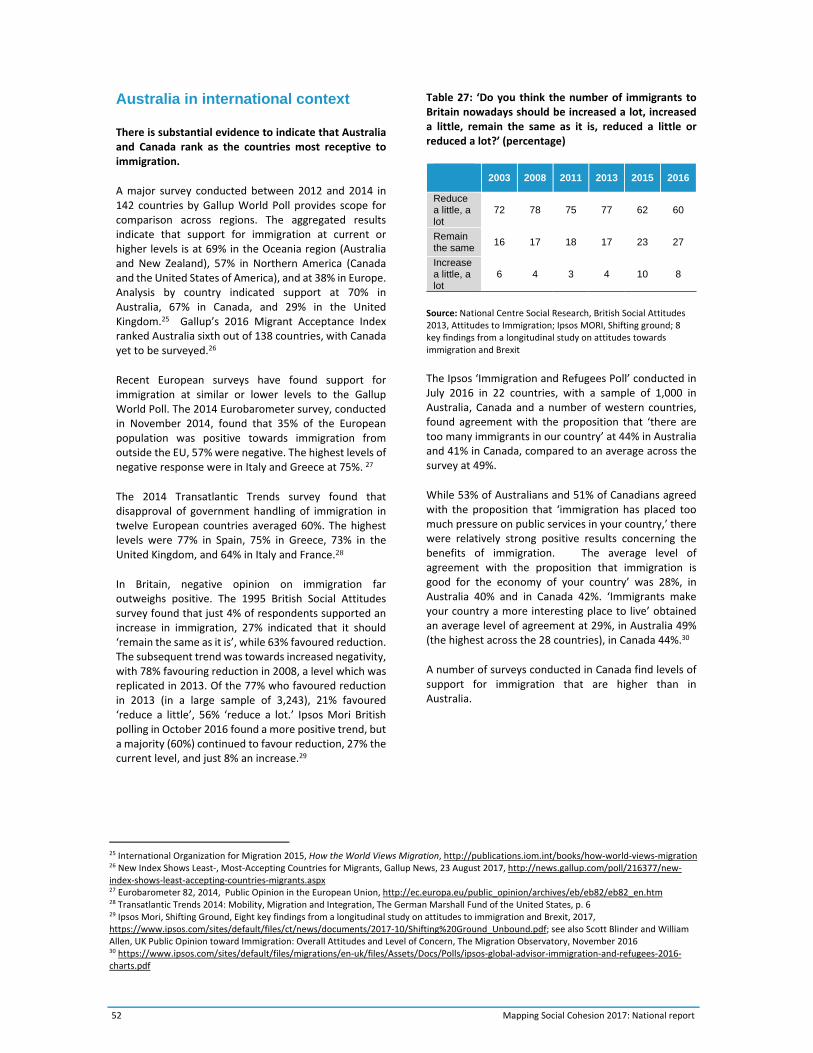
52 Mapping Social Cohesion 2017: National report
Australia in international context
There is substantial evidence to indicate that Australia and Canada rank as the countries most receptive to immigration.
A major survey conducted between 2012 and 2014 in 142 countries by Gallup World Poll provides scope for comparison across regions. The aggregated results indicate that support for immigration at current or higher levels is at 69% in the Oceania region (Australia and New Zealand), 57% in Northern America (Canada and the United States of America), and at 38% in Europe. Analysis by country indicated support at 70% in Australia, 67% in Canada, and 29% in the United Kingdom.25 Gallup’s 2016 Migrant Acceptance Index ranked Australia sixth out of 138 countries, with Canada yet to be surveyed.26
Recent European surveys have found support for immigration at similar or lower levels to the Gallup World Poll. The 2014 Eurobarometer survey, conducted in November 2014, found that 35% of the European population was positive towards immigration from outside the EU, 57% were negative. The highest levels of negative response were in Italy and Greece at 75%. 27
The 2014 Transatlantic Trends survey found that disapproval of government handling of immigration in twelve European countries averaged 60%. The highest levels were 77% in Spain, 75% in Greece, 73% in the United Kingdom, and 64% in Italy and France.28
In Britain, negative opinion on immigration far outweighs positive. The 1995 British Social Attitudes survey found that just 4% of respondents supported an increase in immigration, 27% indicated that it should ‘remain the same as it is’, while 63% favoured reduction. The subsequent trend was towards increased negativity, with 78% favouring reduction in 2008, a level which was replicated in 2013. Of the 77% who favoured reduction in 2013 (in a large sample of 3,243), 21% favoured ‘reduce a little’, 56% ‘reduce a lot.’ Ipsos Mori British polling in October 2016 found a more positive trend, but a majority (60%) continued to favour reduction, 27% the current level, and just 8% an increase.29
Table 27: ‘Do you think the number of immigrants to Britain nowadays should be increased a lot, increased a little, remain the same as it is, reduced a little or reduced a lot?’ (percentage)
2003 2008 2011 2013 2015 2016
Reduce a little, a lot
72 78 75 77 62 60
Remain the same
16 17 18 17 23 27
Increase a little, a lot
6 4 3 4 10 8
Source: National Centre Social Research, British Social Attitudes 2013, Attitudes to Immigration; Ipsos MORI, Shifting ground; 8 key findings from a longitudinal study on attitudes towards immigration and Brexit
The Ipsos ‘Immigration and Refugees Poll’ conducted in July 2016 in 22 countries, with a sample of 1,000 in Australia, Canada and a number of western countries, found agreement with the proposition that ‘there are too many immigrants in our country’ at 44% in Australia and 41% in Canada, compared to an average across the survey at 49%.
While 53% of Australians and 51% of Canadians agreed with the proposition that ‘immigration has placed too much pressure on public services in your country,’ there were relatively strong positive results concerning the benefits of immigration. The average level of agreement with the proposition that immigration is good for the economy of your country’ was 28%, in Australia 40% and in Canada 42%. ‘Immigrants make your country a more interesting place to live’ obtained an average level of agreement at 29%, in Australia 49% (the highest across the 28 countries), in Canada 44%.30
A number of surveys conducted in Canada find levels of support for immigration that are higher than in Australia.
25 International Organization for Migration 2015, How the World Views Migration, http://publications.iom.int/books/how‐world‐views‐migration 26 New Index Shows Least‐, Most‐Accepting Countries for Migrants, Gallup News, 23 August 2017, http://news.gallup.com/poll/216377/new‐index‐shows‐least‐accepting‐countries‐migrants.aspx 27 Eurobarometer 82, 2014, Public Opinion in the European Union, http://ec.europa.eu/public_opinion/archives/eb/eb82/eb82_en.htm 28 Transatlantic Trends 2014: Mobility, Migration and Integration, The German Marshall Fund of the United States, p. 6 29 Ipsos Mori, Shifting Ground, Eight key findings from a longitudinal study on attitudes to immigration and Brexit, 2017, https://www.ipsos.com/sites/default/files/ct/news/documents/2017‐10/Shifting%20Ground_Unbound.pdf; see also Scott Blinder and William Allen, UK Public Opinion toward Immigration: Overall Attitudes and Level of Concern, The Migration Observatory, November 2016 30 https://www.ipsos.com/sites/default/files/migrations/en‐uk/files/Assets/Docs/Polls/ipsos‐global‐advisor‐immigration‐and‐refugees‐2016‐charts.pdf
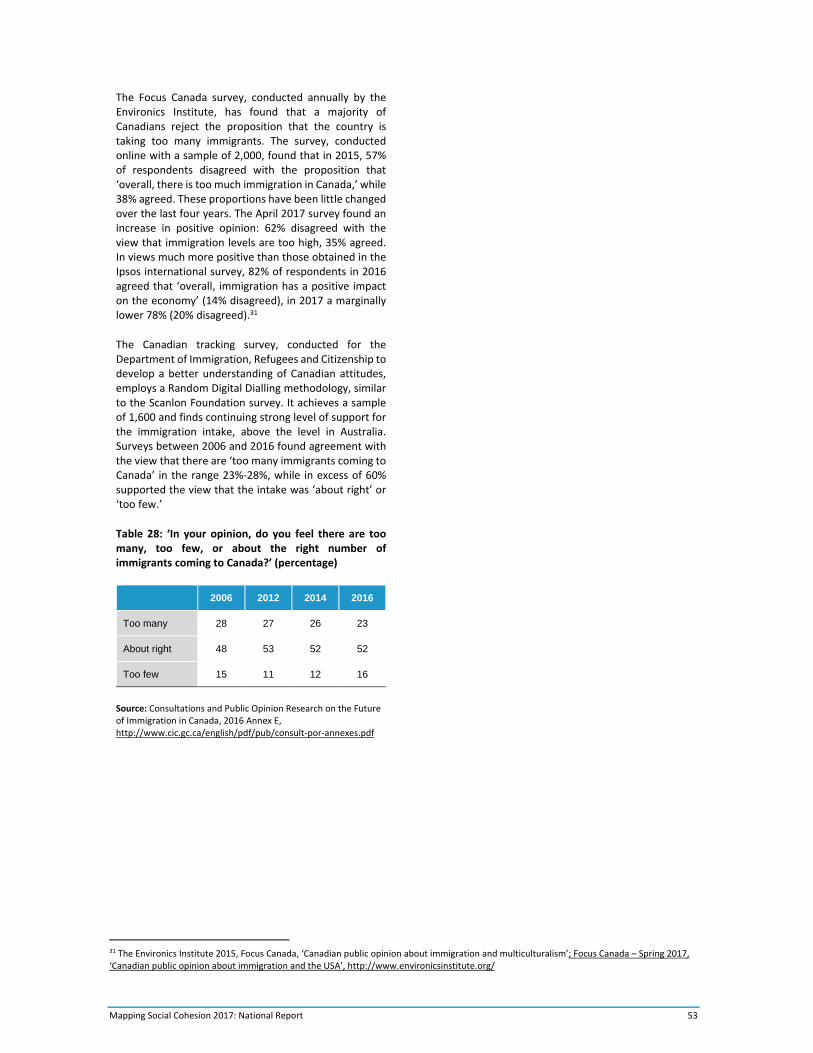
Mapping Social Cohesion 2017: National Report 53
The Focus Canada survey, conducted annually by the Environics Institute, has found that a majority of Canadians reject the proposition that the country is taking too many immigrants. The survey, conducted online with a sample of 2,000, found that in 2015, 57% of respondents disagreed with the proposition that ‘overall, there is too much immigration in Canada,’ while 38% agreed. These proportions have been little changed over the last four years. The April 2017 survey found an increase in positive opinion: 62% disagreed with the view that immigration levels are too high, 35% agreed. In views much more positive than those obtained in the Ipsos international survey, 82% of respondents in 2016 agreed that ‘overall, immigration has a positive impact on the economy’ (14% disagreed), in 2017 a marginally lower 78% (20% disagreed).31
The Canadian tracking survey, conducted for the Department of Immigration, Refugees and Citizenship to develop a better understanding of Canadian attitudes, employs a Random Digital Dialling methodology, similar to the Scanlon Foundation survey. It achieves a sample of 1,600 and finds continuing strong level of support for the immigration intake, above the level in Australia. Surveys between 2006 and 2016 found agreement with the view that there are ‘too many immigrants coming to Canada’ in the range 23%‐28%, while in excess of 60% supported the view that the intake was ‘about right’ or ‘too few.’
Table 28: ‘In your opinion, do you feel there are too many, too few, or about the right number of immigrants coming to Canada?’ (percentage)
2006 2012 2014 2016
Too many 28 27 26 23
About right 48 53 52 52
Too few 15 11 12 16
Source: Consultations and Public Opinion Research on the Future of Immigration in Canada, 2016 Annex E, http://www.cic.gc.ca/english/pdf/pub/consult‐por‐annexes.pdf
31 The Environics Institute 2015, Focus Canada, ‘Canadian public opinion about immigration and multiculturalism’; Focus Canada – Spring 2017, ‘Canadian public opinion about immigration and the USA’, http://www.environicsinstitute.org/
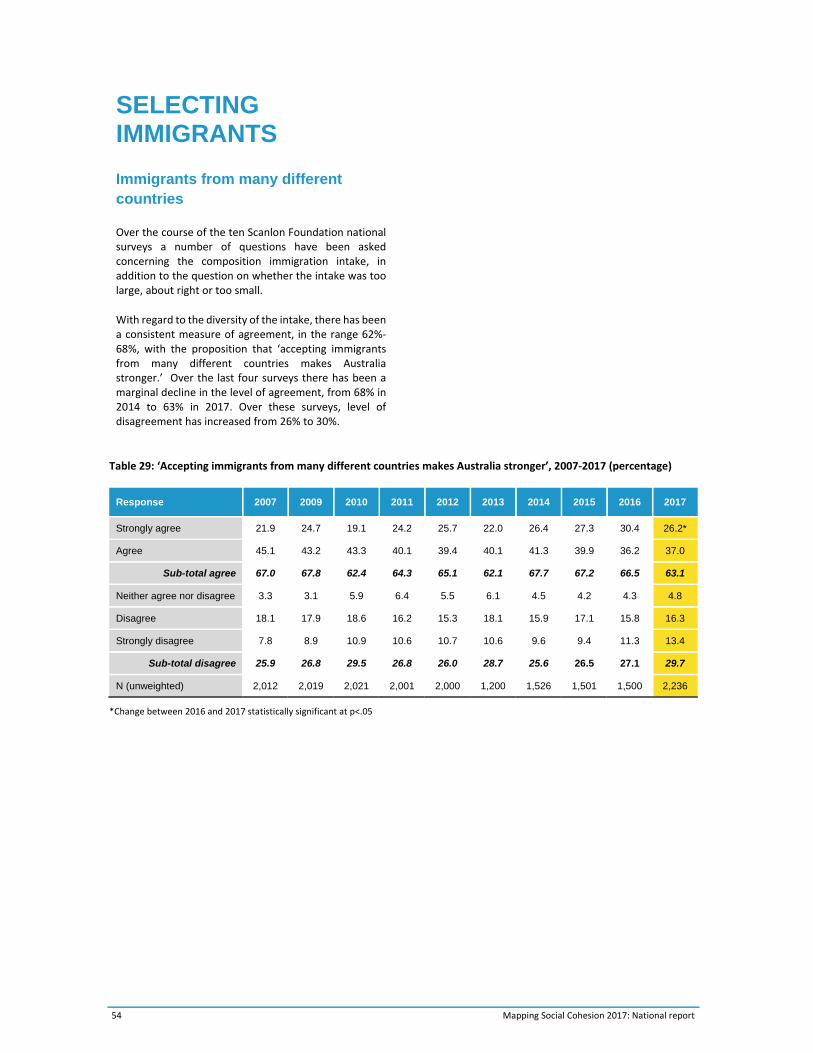
54 Mapping Social Cohesion 2017: National report
SELECTING IMMIGRANTS
Immigrants from many different countries
Over the course of the ten Scanlon Foundation national surveys a number of questions have been asked concerning the composition immigration intake, in addition to the question on whether the intake was too large, about right or too small.
With regard to the diversity of the intake, there has been a consistent measure of agreement, in the range 62%‐68%, with the proposition that ‘accepting immigrants from many different countries makes Australia stronger.’ Over the last four surveys there has been a marginal decline in the level of agreement, from 68% in 2014 to 63% in 2017. Over these surveys, level of disagreement has increased from 26% to 30%.
Table 29: ‘Accepting immigrants from many different countries makes Australia stronger’, 2007‐2017 (percentage)
Response 2007 2009 2010 2011 2012 2013 2014 2015 2016 2017
Strongly agree 21.9 24.7 19.1 24.2 25.7 22.0 26.4 27.3 30.4 26.2*
Agree 45.1 43.2 43.3 40.1 39.4 40.1 41.3 39.9 36.2 37.0
Sub-total agree 67.0 67.8 62.4 64.3 65.1 62.1 67.7 67.2 66.5 63.1
Neither agree nor disagree 3.3 3.1 5.9 6.4 5.5 6.1 4.5 4.2 4.3 4.8
Disagree 18.1 17.9 18.6 16.2 15.3 18.1 15.9 17.1 15.8 16.3
Strongly disagree 7.8 8.9 10.9 10.6 10.7 10.6 9.6 9.4 11.3 13.4
Sub-total disagree 25.9 26.8 29.5 26.8 26.0 28.7 25.6 26.5 27.1 29.7
N (unweighted) 2,012 2,019 2,021 2,001 2,000 1,200 1,526 1,501 1,500 2,236
*Change between 2016 and 2017 statistically significant at p<.05
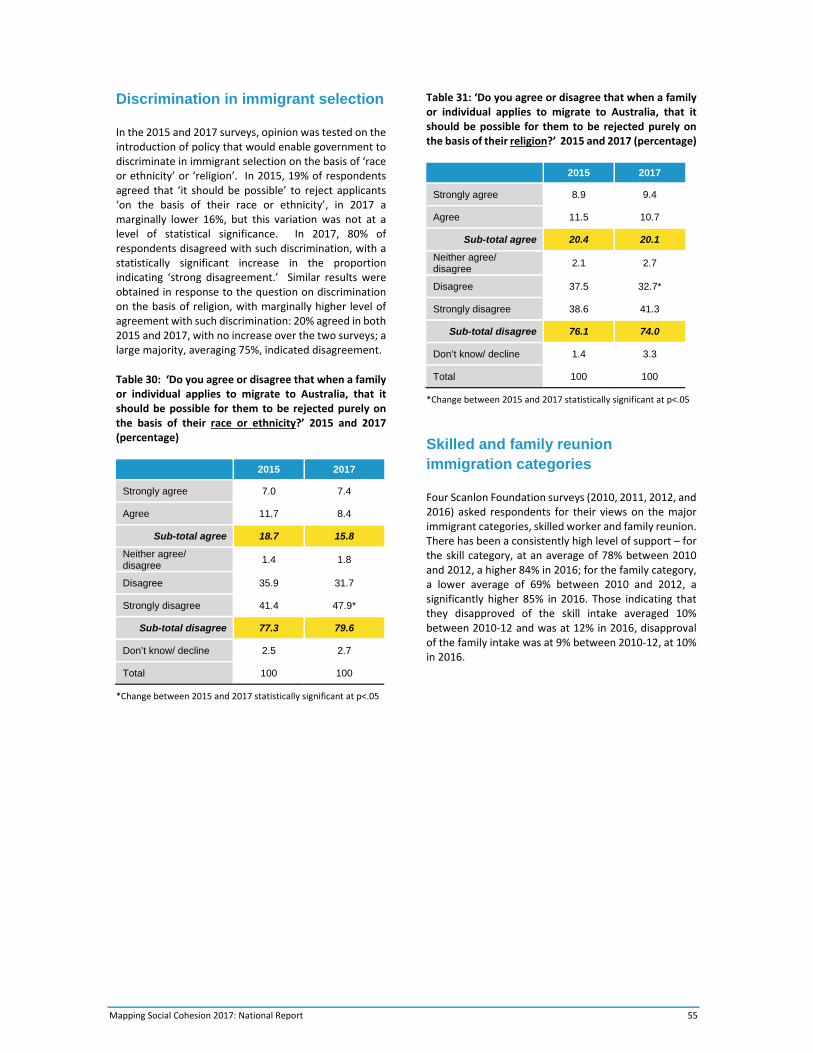
Mapping Social Cohesion 2017: National Report 55
Discrimination in immigrant selection
In the 2015 and 2017 surveys, opinion was tested on the introduction of policy that would enable government to discriminate in immigrant selection on the basis of ‘race or ethnicity’ or ‘religion’. In 2015, 19% of respondents agreed that ‘it should be possible’ to reject applicants ‘on the basis of their race or ethnicity’, in 2017 a marginally lower 16%, but this variation was not at a level of statistical significance. In 2017, 80% of respondents disagreed with such discrimination, with a statistically significant increase in the proportion indicating ‘strong disagreement.’ Similar results were obtained in response to the question on discrimination on the basis of religion, with marginally higher level of agreement with such discrimination: 20% agreed in both 2015 and 2017, with no increase over the two surveys; a large majority, averaging 75%, indicated disagreement.
Table 30: ‘Do you agree or disagree that when a family or individual applies to migrate to Australia, that it should be possible for them to be rejected purely on the basis of their race or ethnicity?’ 2015 and 2017 (percentage)
2015 2017
Strongly agree 7.0 7.4
Agree 11.7 8.4
Sub-total agree 18.7 15.8
Neither agree/ disagree
1.4 1.8
Disagree 35.9 31.7
Strongly disagree 41.4 47.9*
Sub-total disagree 77.3 79.6
Don’t know/ decline 2.5 2.7
Total 100 100
*Change between 2015 and 2017 statistically significant at p<.05
Table 31: ‘Do you agree or disagree that when a family or individual applies to migrate to Australia, that it should be possible for them to be rejected purely on the basis of their religion?’ 2015 and 2017 (percentage)
2015 2017
Strongly agree 8.9 9.4
Agree 11.5 10.7
Sub-total agree 20.4 20.1
Neither agree/ disagree
2.1 2.7
Disagree 37.5 32.7*
Strongly disagree 38.6 41.3
Sub-total disagree 76.1 74.0
Don’t know/ decline 1.4 3.3
Total 100 100
*Change between 2015 and 2017 statistically significant at p<.05
Skilled and family reunion immigration categories
Four Scanlon Foundation surveys (2010, 2011, 2012, and 2016) asked respondents for their views on the major immigrant categories, skilled worker and family reunion. There has been a consistently high level of support – for the skill category, at an average of 78% between 2010 and 2012, a higher 84% in 2016; for the family category, a lower average of 69% between 2010 and 2012, a significantly higher 85% in 2016. Those indicating that they disapproved of the skill intake averaged 10% between 2010‐12 and was at 12% in 2016, disapproval of the family intake was at 9% between 2010‐12, at 10% in 2016.
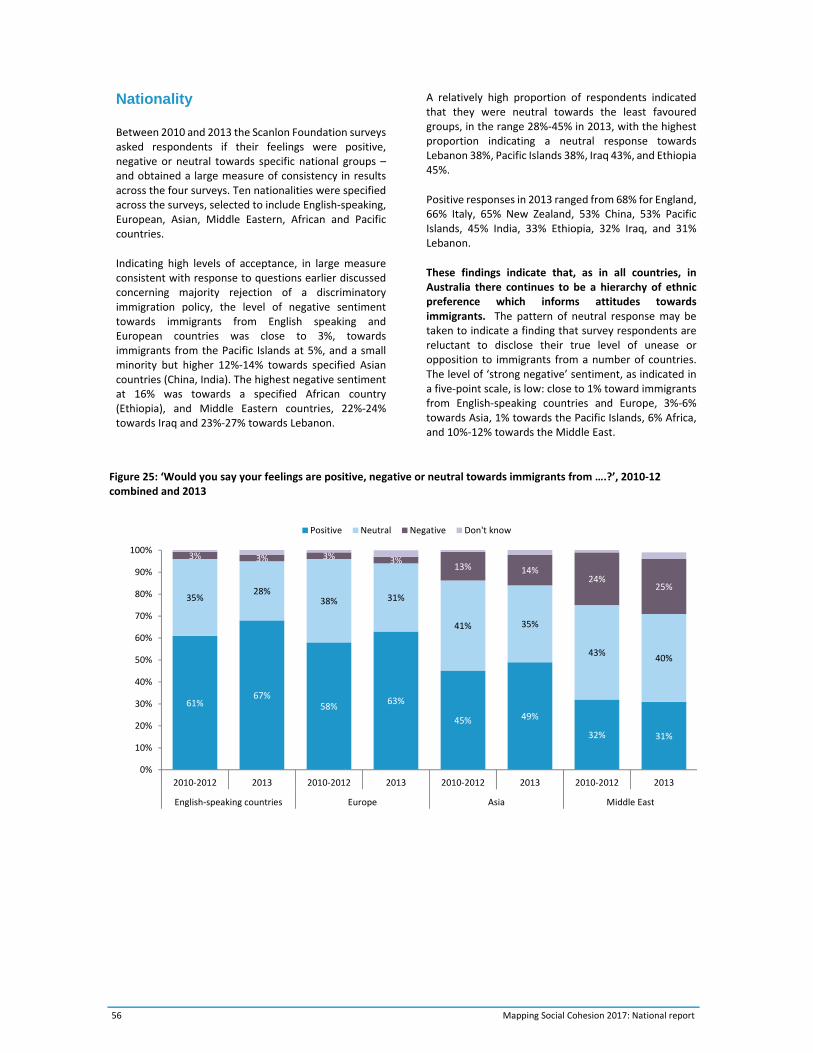
56 Mapping Social Cohesion 2017: National report
Nationality
Between 2010 and 2013 the Scanlon Foundation surveys asked respondents if their feelings were positive, negative or neutral towards specific national groups – and obtained a large measure of consistency in results across the four surveys. Ten nationalities were specified across the surveys, selected to include English‐speaking, European, Asian, Middle Eastern, African and Pacific countries.
Indicating high levels of acceptance, in large measure consistent with response to questions earlier discussed concerning majority rejection of a discriminatory immigration policy, the level of negative sentiment towards immigrants from English speaking and European countries was close to 3%, towards immigrants from the Pacific Islands at 5%, and a small minority but higher 12%‐14% towards specified Asian countries (China, India). The highest negative sentiment at 16% was towards a specified African country (Ethiopia), and Middle Eastern countries, 22%‐24% towards Iraq and 23%‐27% towards Lebanon.
A relatively high proportion of respondents indicated that they were neutral towards the least favoured groups, in the range 28%‐45% in 2013, with the highest proportion indicating a neutral response towards Lebanon 38%, Pacific Islands 38%, Iraq 43%, and Ethiopia 45%.
Positive responses in 2013 ranged from 68% for England, 66% Italy, 65% New Zealand, 53% China, 53% Pacific Islands, 45% India, 33% Ethiopia, 32% Iraq, and 31% Lebanon.
These findings indicate that, as in all countries, in Australia there continues to be a hierarchy of ethnic preference which informs attitudes towards immigrants. The pattern of neutral response may be taken to indicate a finding that survey respondents are reluctant to disclose their true level of unease or opposition to immigrants from a number of countries. The level of ‘strong negative’ sentiment, as indicated in a five‐point scale, is low: close to 1% toward immigrants from English‐speaking countries and Europe, 3%‐6% towards Asia, 1% towards the Pacific Islands, 6% Africa, and 10%‐12% towards the Middle East.
Figure 25: ‘Would you say your feelings are positive, negative or neutral towards immigrants from ….?’, 2010‐12 combined and 2013
61%67%
58%63%
45% 49%
32% 31%
35%28%
38% 31%
41% 35%
43%40%
3% 3% 3% 3%13% 14%
24%25%
0%
10%
20%
30%
40%
50%
60%
70%
80%
90%
100%
2010‐2012 2013 2010‐2012 2013 2010‐2012 2013 2010‐2012 2013
English‐speaking countries Europe Asia Middle East
Positive Neutral Negative Don't know
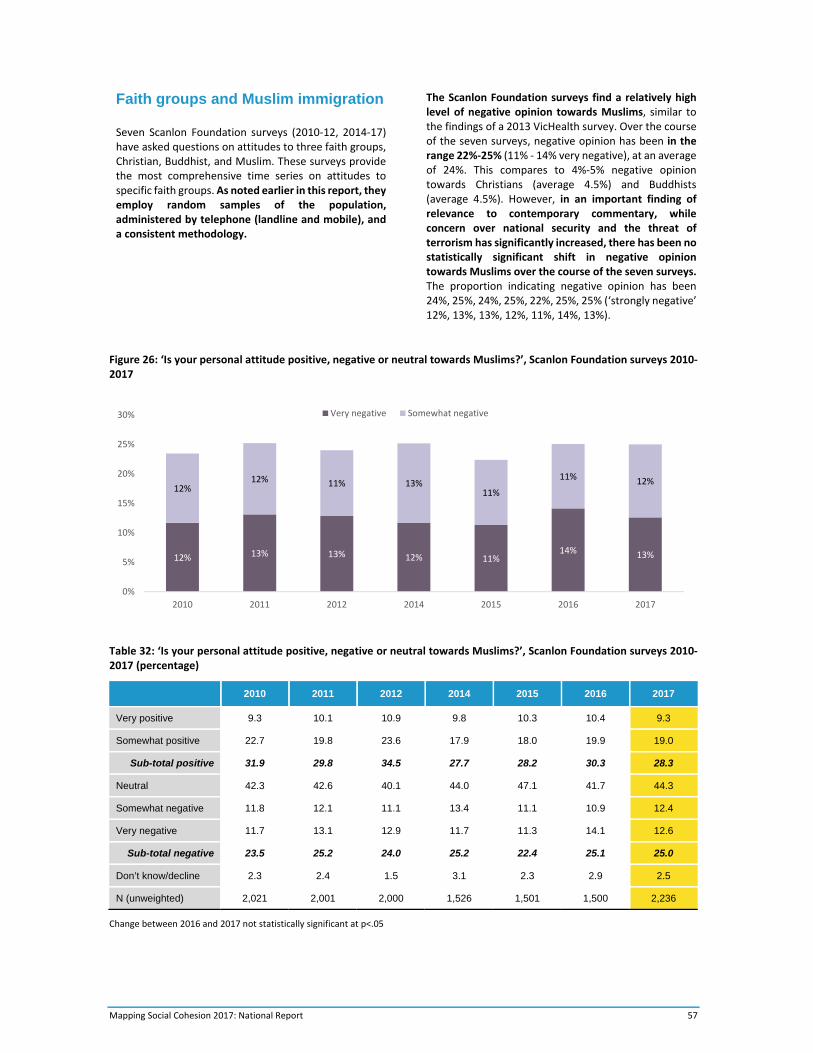
Mapping Social Cohesion 2017: National Report 57
Faith groups and Muslim immigration
Seven Scanlon Foundation surveys (2010‐12, 2014‐17) have asked questions on attitudes to three faith groups, Christian, Buddhist, and Muslim. These surveys provide the most comprehensive time series on attitudes to specific faith groups. As noted earlier in this report, they employ random samples of the population, administered by telephone (landline and mobile), and a consistent methodology.
The Scanlon Foundation surveys find a relatively high level of negative opinion towards Muslims, similar to the findings of a 2013 VicHealth survey. Over the course of the seven surveys, negative opinion has been in the range 22%‐25% (11% ‐ 14% very negative), at an average of 24%. This compares to 4%‐5% negative opinion towards Christians (average 4.5%) and Buddhists (average 4.5%). However, in an important finding of relevance to contemporary commentary, while concern over national security and the threat of terrorism has significantly increased, there has been no statistically significant shift in negative opinion towards Muslims over the course of the seven surveys. The proportion indicating negative opinion has been 24%, 25%, 24%, 25%, 22%, 25%, 25% (‘strongly negative’ 12%, 13%, 13%, 12%, 11%, 14%, 13%).
Figure 26: ‘Is your personal attitude positive, negative or neutral towards Muslims?’, Scanlon Foundation surveys 2010‐2017
Table 32: ‘Is your personal attitude positive, negative or neutral towards Muslims?’, Scanlon Foundation surveys 2010‐2017 (percentage)
Change between 2016 and 2017 not statistically significant at p<.05
12% 13% 13% 12% 11%14% 13%
12%12% 11% 13%
11%
11% 12%
0%
5%
10%
15%
20%
25%
30%
2010 2011 2012 2014 2015 2016 2017
Very negative Somewhat negative
2010 2011 2012 2014 2015 2016 2017
Very positive 9.3 10.1 10.9 9.8 10.3 10.4 9.3
Somewhat positive 22.7 19.8 23.6 17.9 18.0 19.9 19.0
Sub-total positive 31.9 29.8 34.5 27.7 28.2 30.3 28.3
Neutral 42.3 42.6 40.1 44.0 47.1 41.7 44.3
Somewhat negative 11.8 12.1 11.1 13.4 11.1 10.9 12.4
Very negative 11.7 13.1 12.9 11.7 11.3 14.1 12.6
Sub-total negative 23.5 25.2 24.0 25.2 22.4 25.1 25.0
Don’t know/decline 2.3 2.4 1.5 3.1 2.3 2.9 2.5
N (unweighted) 2,021 2,001 2,000 1,526 1,501 1,500 2,236
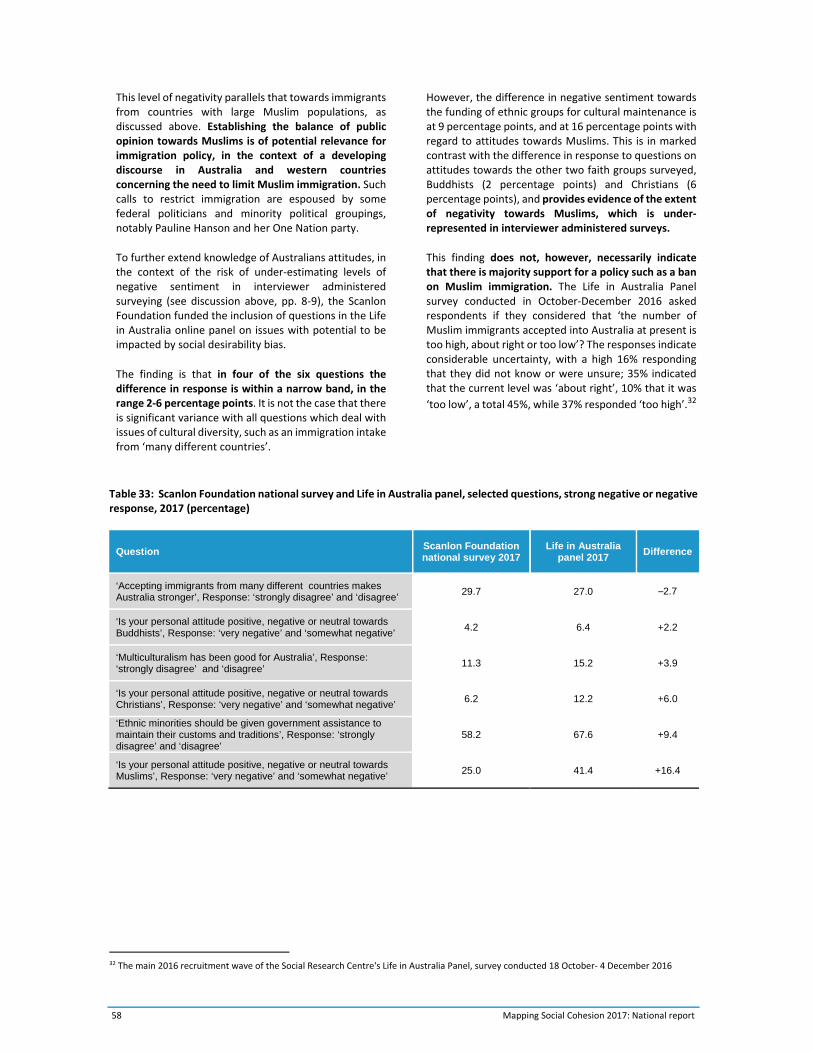
58 Mapping Social Cohesion 2017: National report
This level of negativity parallels that towards immigrants from countries with large Muslim populations, as discussed above. Establishing the balance of public opinion towards Muslims is of potential relevance for immigration policy, in the context of a developing discourse in Australia and western countries concerning the need to limit Muslim immigration. Such calls to restrict immigration are espoused by some federal politicians and minority political groupings, notably Pauline Hanson and her One Nation party.
To further extend knowledge of Australians attitudes, in the context of the risk of under‐estimating levels of negative sentiment in interviewer administered surveying (see discussion above, pp. 8‐9), the Scanlon Foundation funded the inclusion of questions in the Life in Australia online panel on issues with potential to be impacted by social desirability bias.
The finding is that in four of the six questions the difference in response is within a narrow band, in the range 2‐6 percentage points. It is not the case that there is significant variance with all questions which deal with issues of cultural diversity, such as an immigration intake from ‘many different countries’.
However, the difference in negative sentiment towards the funding of ethnic groups for cultural maintenance is at 9 percentage points, and at 16 percentage points with regard to attitudes towards Muslims. This is in marked contrast with the difference in response to questions on attitudes towards the other two faith groups surveyed, Buddhists (2 percentage points) and Christians (6 percentage points), and provides evidence of the extent of negativity towards Muslims, which is under‐represented in interviewer administered surveys.
This finding does not, however, necessarily indicate that there is majority support for a policy such as a ban on Muslim immigration. The Life in Australia Panel survey conducted in October‐December 2016 asked respondents if they considered that ‘the number of Muslim immigrants accepted into Australia at present is too high, about right or too low’? The responses indicate considerable uncertainty, with a high 16% responding that they did not know or were unsure; 35% indicated that the current level was ‘about right’, 10% that it was
‘too low’, a total 45%, while 37% responded ‘too high’.32
Table 33: Scanlon Foundation national survey and Life in Australia panel, selected questions, strong negative or negative response, 2017 (percentage)
Question Scanlon Foundation national survey 2017
Life in Australia panel 2017
Difference
‘Accepting immigrants from many different countries makes Australia stronger’, Response: ‘strongly disagree’ and ‘disagree’
29.7 27.0 –2.7
‘Is your personal attitude positive, negative or neutral towards Buddhists’, Response: ‘very negative’ and ‘somewhat negative’
4.2 6.4 +2.2
‘Multiculturalism has been good for Australia’, Response: ‘strongly disagree’ and ‘disagree’
11.3 15.2 +3.9
‘Is your personal attitude positive, negative or neutral towards Christians’, Response: ‘very negative’ and ‘somewhat negative’
6.2 12.2 +6.0
‘Ethnic minorities should be given government assistance to maintain their customs and traditions’, Response: ‘strongly disagree’ and ‘disagree’
58.2 67.6 +9.4
‘Is your personal attitude positive, negative or neutral towards Muslims’, Response: ‘very negative’ and ‘somewhat negative’
25.0 41.4 +16.4
32 The main 2016 recruitment wave of the Social Research Centre's Life in Australia Panel, survey conducted 18 October‐ 4 December 2016
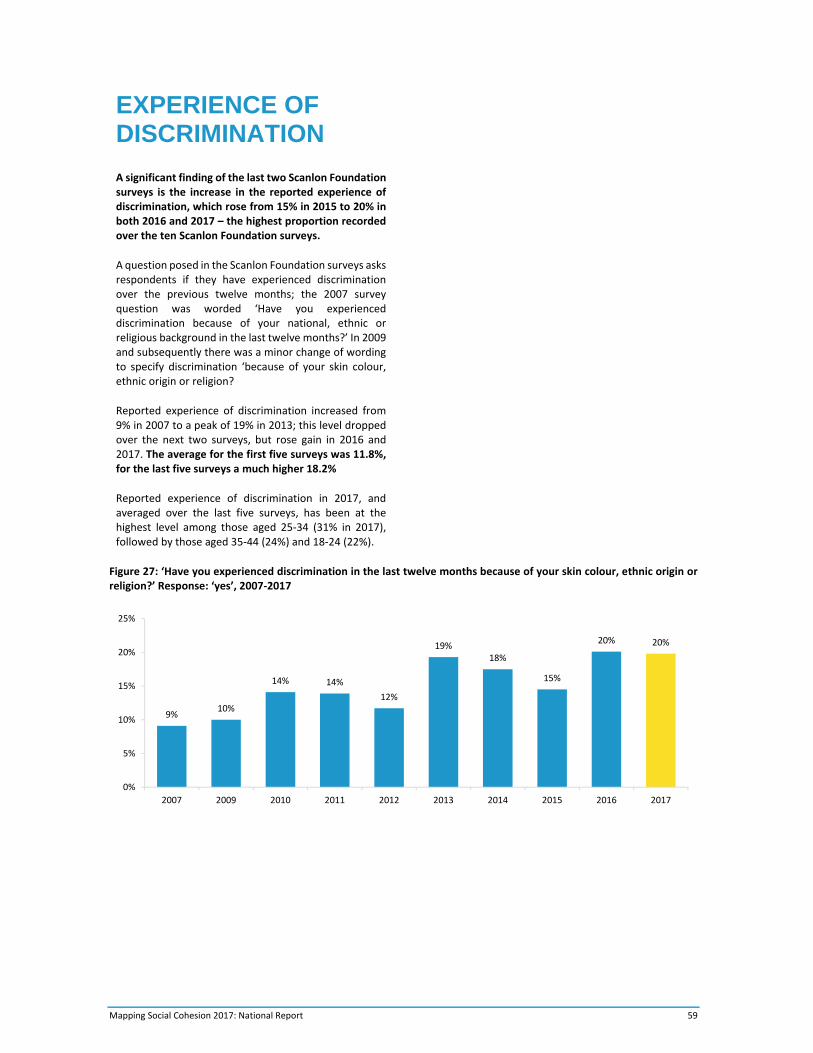
Mapping Social Cohesion 2017: National Report 59
EXPERIENCE OF DISCRIMINATION
A significant finding of the last two Scanlon Foundation surveys is the increase in the reported experience of discrimination, which rose from 15% in 2015 to 20% in both 2016 and 2017 – the highest proportion recorded over the ten Scanlon Foundation surveys.
A question posed in the Scanlon Foundation surveys asks respondents if they have experienced discrimination over the previous twelve months; the 2007 survey question was worded ‘Have you experienced discrimination because of your national, ethnic or religious background in the last twelve months?’ In 2009 and subsequently there was a minor change of wording to specify discrimination ‘because of your skin colour, ethnic origin or religion?
Reported experience of discrimination increased from 9% in 2007 to a peak of 19% in 2013; this level dropped over the next two surveys, but rose gain in 2016 and 2017. The average for the first five surveys was 11.8%, for the last five surveys a much higher 18.2%
Reported experience of discrimination in 2017, and averaged over the last five surveys, has been at the highest level among those aged 25‐34 (31% in 2017), followed by those aged 35‐44 (24%) and 18‐24 (22%).
Figure 27: ‘Have you experienced discrimination in the last twelve months because of your skin colour, ethnic origin or religion?’ Response: ‘yes’, 2007‐2017
9%10%
14% 14%
12%
19%18%
15%
20% 20%
0%
5%
10%
15%
20%
25%
2007 2009 2010 2011 2012 2013 2014 2015 2016 2017
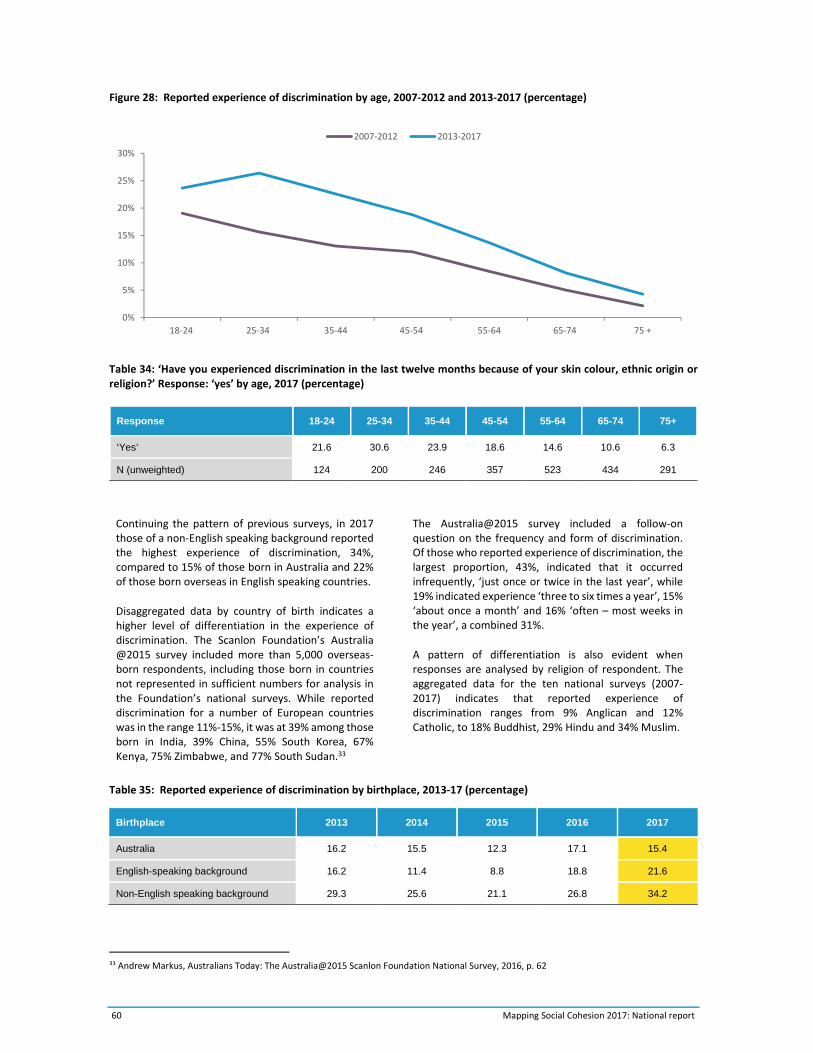
60 Mapping Social Cohesion 2017: National report
Figure 28: Reported experience of discrimination by age, 2007‐2012 and 2013‐2017 (percentage)
Table 34: ‘Have you experienced discrimination in the last twelve months because of your skin colour, ethnic origin or religion?’ Response: ‘yes’ by age, 2017 (percentage)
Response 18-24 25-34 35-44 45-54 55-64 65-74 75+
‘Yes’ 21.6 30.6 23.9 18.6 14.6 10.6 6.3
N (unweighted) 124 200 246 357 523 434 291
Table 35: Reported experience of discrimination by birthplace, 2013‐17 (percentage)
33 Andrew Markus, Australians Today: The Australia@2015 Scanlon Foundation National Survey, 2016, p. 62
0%
5%
10%
15%
20%
25%
30%
18‐24 25‐34 35‐44 45‐54 55‐64 65‐74 75 +
2007‐2012 2013‐2017
Continuing the pattern of previous surveys, in 2017 those of a non‐English speaking background reported the highest experience of discrimination, 34%, compared to 15% of those born in Australia and 22% of those born overseas in English speaking countries.
Disaggregated data by country of birth indicates a higher level of differentiation in the experience of discrimination. The Scanlon Foundation’s Australia @2015 survey included more than 5,000 overseas‐born respondents, including those born in countries not represented in sufficient numbers for analysis in the Foundation’s national surveys. While reported discrimination for a number of European countries was in the range 11%‐15%, it was at 39% among those born in India, 39% China, 55% South Korea, 67% Kenya, 75% Zimbabwe, and 77% South Sudan.33
The Australia@2015 survey included a follow‐on question on the frequency and form of discrimination. Of those who reported experience of discrimination, the largest proportion, 43%, indicated that it occurred infrequently, ‘just once or twice in the last year’, while 19% indicated experience ‘three to six times a year’, 15% ‘about once a month’ and 16% ‘often – most weeks in the year’, a combined 31%.
A pattern of differentiation is also evident when responses are analysed by religion of respondent. The aggregated data for the ten national surveys (2007‐2017) indicates that reported experience of discrimination ranges from 9% Anglican and 12% Catholic, to 18% Buddhist, 29% Hindu and 34% Muslim.
Birthplace 2013 2014 2015 2016 2017
Australia 16.2 15.5 12.3 17.1 15.4
English-speaking background 16.2 11.4 8.8 18.8 21.6
Non-English speaking background 29.3 25.6 21.1 26.8 34.2
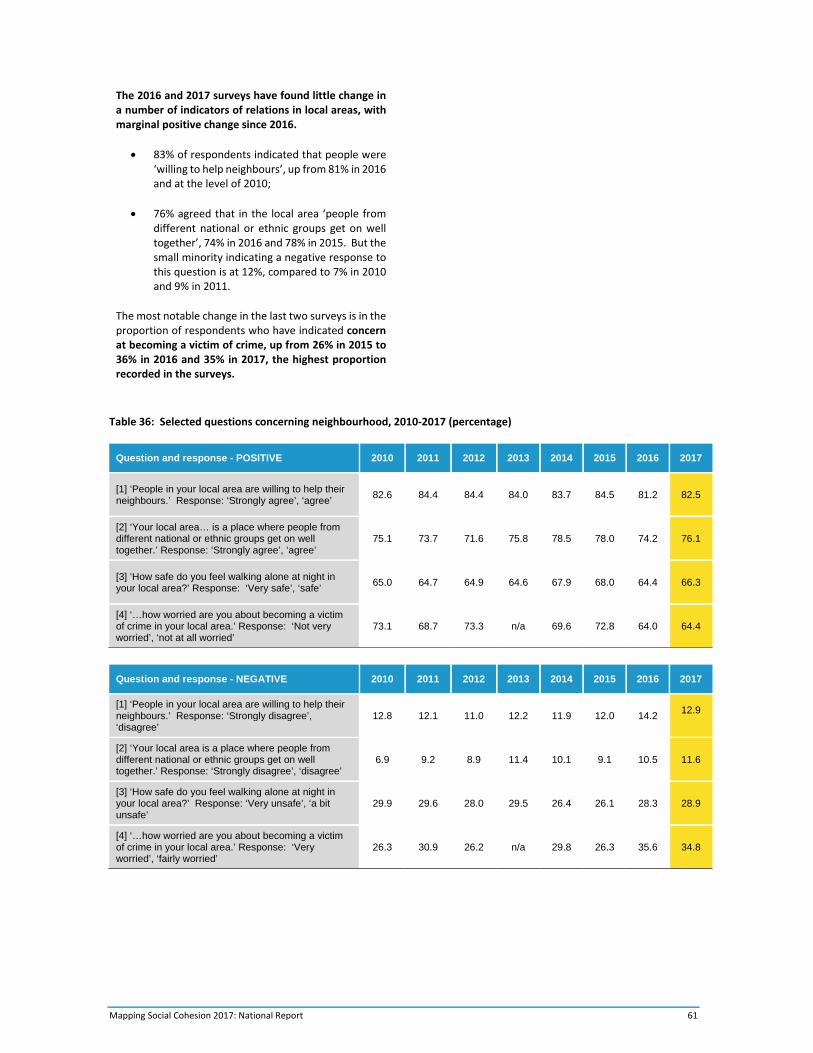
Mapping Social Cohesion 2017: National Report 61
Table 36: Selected questions concerning neighbourhood, 2010‐2017 (percentage)
Question and response - POSITIVE 2010 2011 2012 2013 2014 2015 2016 2017
[1] ‘People in your local area are willing to help their neighbours.’ Response: ‘Strongly agree’, ‘agree’
82.6 84.4 84.4 84.0 83.7 84.5 81.2 82.5
[2] ‘Your local area… is a place where people from different national or ethnic groups get on well together.’ Response: ‘Strongly agree’, ‘agree’
75.1 73.7 71.6 75.8 78.5 78.0 74.2 76.1
[3] ‘How safe do you feel walking alone at night in your local area?’ Response: ‘Very safe’, ‘safe’
65.0 64.7 64.9 64.6 67.9 68.0 64.4 66.3
[4] ‘…how worried are you about becoming a victim of crime in your local area.’ Response: ‘Not very worried’, ‘not at all worried’
73.1 68.7 73.3 n/a 69.6 72.8 64.0 64.4
Question and response - NEGATIVE 2010 2011 2012 2013 2014 2015 2016 2017
[1] ‘People in your local area are willing to help their neighbours.’ Response: ‘Strongly disagree’, ‘disagree’
12.8 12.1 11.0 12.2 11.9 12.0 14.2 12.9
[2] ‘Your local area is a place where people from different national or ethnic groups get on well together.’ Response: ‘Strongly disagree’, ‘disagree’
6.9 9.2 8.9 11.4 10.1 9.1 10.5 11.6
[3] ‘How safe do you feel walking alone at night in your local area?’ Response: ‘Very unsafe’, ‘a bit unsafe’
29.9 29.6 28.0 29.5 26.4 26.1 28.3 28.9
[4] ‘…how worried are you about becoming a victim of crime in your local area.’ Response: ‘Very worried’, ‘fairly worried’
26.3 30.9 26.2 n/a 29.8 26.3 35.6 34.8
The 2016 and 2017 surveys have found little change in a number of indicators of relations in local areas, with marginal positive change since 2016.
83% of respondents indicated that people were ‘willing to help neighbours’, up from 81% in 2016 and at the level of 2010;
76% agreed that in the local area ‘people from different national or ethnic groups get on well together’, 74% in 2016 and 78% in 2015. But the small minority indicating a negative response to this question is at 12%, compared to 7% in 2010 and 9% in 2011.
The most notable change in the last two surveys is in the proportion of respondents who have indicated concern at becoming a victim of crime, up from 26% in 2015 to 36% in 2016 and 35% in 2017, the highest proportion recorded in the surveys.
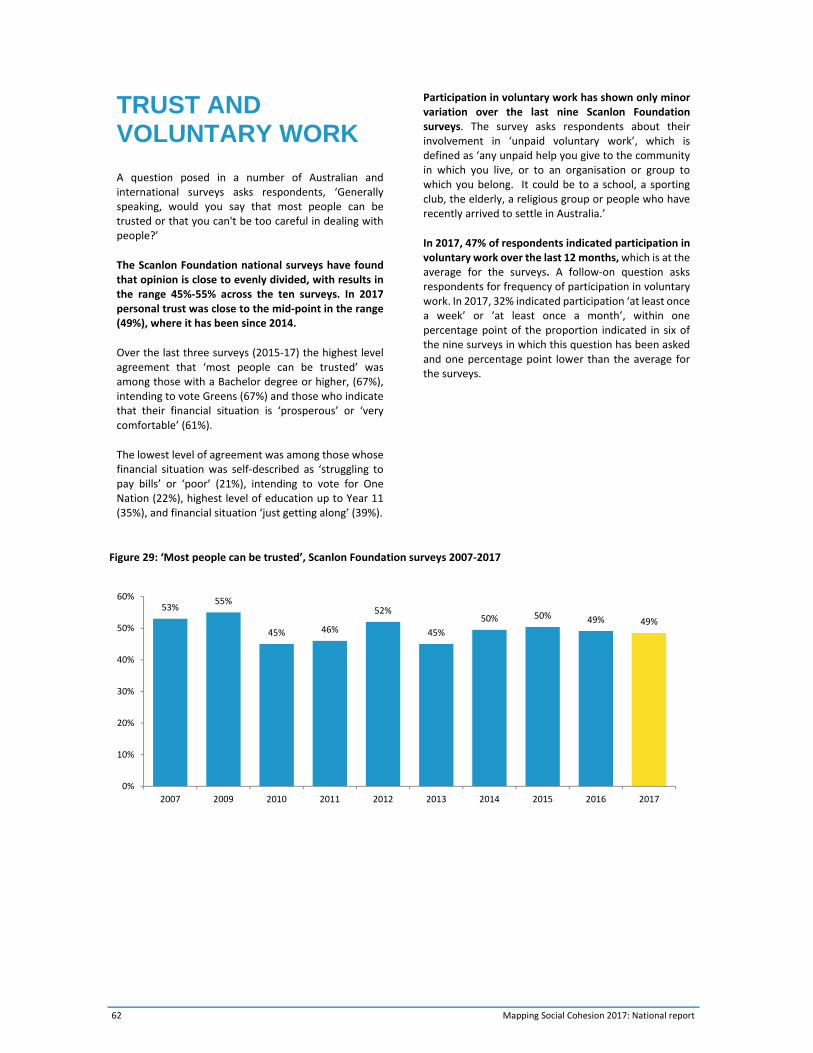
62 Mapping Social Cohesion 2017: National report
TRUST AND VOLUNTARY WORK
A question posed in a number of Australian and international surveys asks respondents, ‘Generally speaking, would you say that most people can be trusted or that you can't be too careful in dealing with people?’
The Scanlon Foundation national surveys have found that opinion is close to evenly divided, with results in the range 45%‐55% across the ten surveys. In 2017 personal trust was close to the mid‐point in the range (49%), where it has been since 2014.
Over the last three surveys (2015‐17) the highest level agreement that ‘most people can be trusted’ was among those with a Bachelor degree or higher, (67%), intending to vote Greens (67%) and those who indicate that their financial situation is ‘prosperous’ or ‘very comfortable’ (61%).
The lowest level of agreement was among those whose financial situation was self‐described as ‘struggling to pay bills’ or ‘poor’ (21%), intending to vote for One Nation (22%), highest level of education up to Year 11 (35%), and financial situation ‘just getting along’ (39%).
Participation in voluntary work has shown only minor variation over the last nine Scanlon Foundation surveys. The survey asks respondents about their involvement in ‘unpaid voluntary work’, which is defined as ‘any unpaid help you give to the community in which you live, or to an organisation or group to which you belong. It could be to a school, a sporting club, the elderly, a religious group or people who have recently arrived to settle in Australia.’
In 2017, 47% of respondents indicated participation in voluntary work over the last 12 months, which is at the average for the surveys. A follow‐on question asks respondents for frequency of participation in voluntary work. In 2017, 32% indicated participation ‘at least once a week’ or ‘at least once a month’, within one percentage point of the proportion indicated in six of the nine surveys in which this question has been asked and one percentage point lower than the average for the surveys.
Figure 29: ‘Most people can be trusted’, Scanlon Foundation surveys 2007‐2017
53%55%
45% 46%
52%
45%
50% 50% 49% 49%
0%
10%
20%
30%
40%
50%
60%
2007 2009 2010 2011 2012 2013 2014 2015 2016 2017
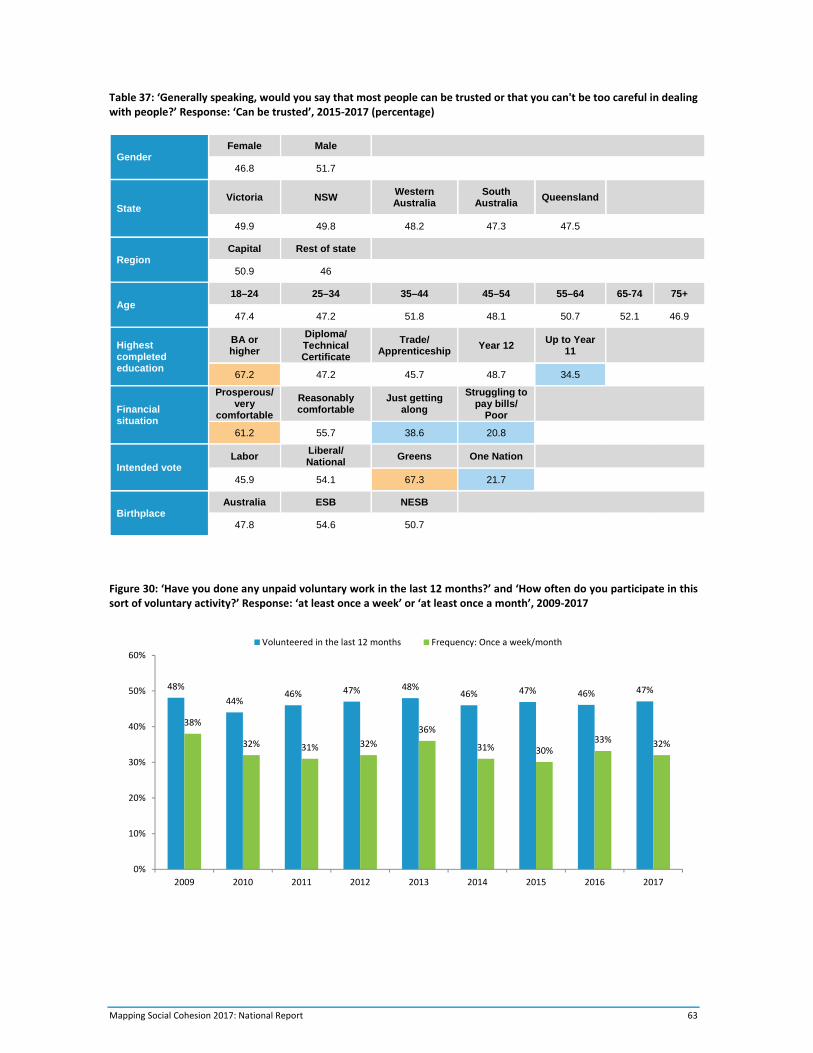
Mapping Social Cohesion 2017: National Report 63
Table 37: ‘Generally speaking, would you say that most people can be trusted or that you can't be too careful in dealing with people?’ Response: ‘Can be trusted’, 2015‐2017 (percentage)
Gender Female Male
46.8 51.7
State Victoria NSW
Western Australia
South Australia
Queensland
49.9 49.8 48.2 47.3 47.5
Region Capital Rest of state
50.9 46
Age 18–24 25–34 35–44 45–54 55–64 65-74 75+
47.4 47.2 51.8 48.1 50.7 52.1 46.9
Highest completed education
BA or higher
Diploma/ Technical Certificate
Trade/ Apprenticeship
Year 12 Up to Year
11
67.2 47.2 45.7 48.7 34.5
Financial situation
Prosperous/ very
comfortable
Reasonably comfortable
Just getting along
Struggling to pay bills/
Poor
61.2 55.7 38.6 20.8
Intended vote Labor
Liberal/ National
Greens One Nation
45.9 54.1 67.3 21.7
Birthplace Australia ESB NESB
47.8 54.6 50.7
Figure 30: ‘Have you done any unpaid voluntary work in the last 12 months?’ and ‘How often do you participate in this sort of voluntary activity?’ Response: ‘at least once a week’ or ‘at least once a month’, 2009‐2017
48%
44%46% 47% 48%
46% 47% 46% 47%
38%
32% 31% 32%
36%
31% 30%33% 32%
0%
10%
20%
30%
40%
50%
60%
2009 2010 2011 2012 2013 2014 2015 2016 2017
Volunteered in the last 12 months Frequency: Once a week/month
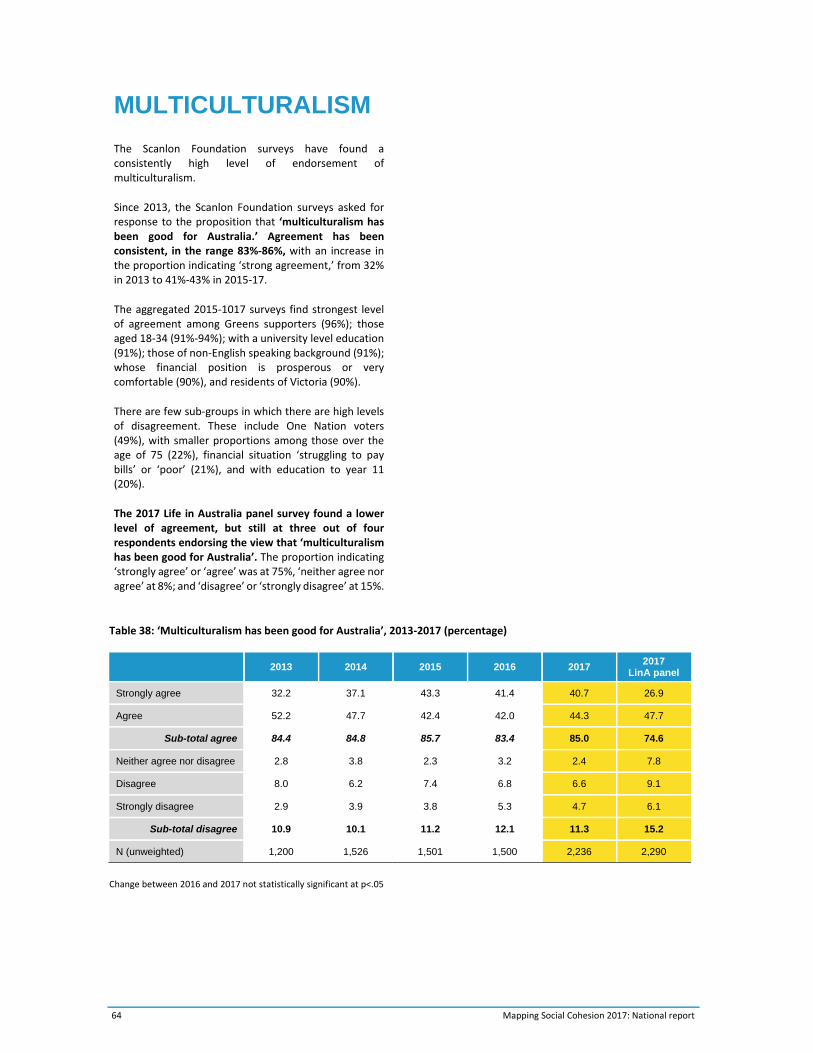
64 Mapping Social Cohesion 2017: National report
Table 38: ‘Multiculturalism has been good for Australia’, 2013‐2017 (percentage)
2013 2014 2015 2016 2017 2017
LinA panel
Strongly agree 32.2 37.1 43.3 41.4 40.7 26.9
Agree 52.2 47.7 42.4 42.0 44.3 47.7
Sub-total agree 84.4 84.8 85.7 83.4 85.0 74.6
Neither agree nor disagree 2.8 3.8 2.3 3.2 2.4 7.8
Disagree 8.0 6.2 7.4 6.8 6.6 9.1
Strongly disagree 2.9 3.9 3.8 5.3 4.7 6.1
Sub-total disagree 10.9 10.1 11.2 12.1 11.3 15.2
N (unweighted) 1,200 1,526 1,501 1,500 2,236 2,290
Change between 2016 and 2017 not statistically significant at p<.05
MULTICULTURALISM
The Scanlon Foundation surveys have found a consistently high level of endorsement of multiculturalism.
Since 2013, the Scanlon Foundation surveys asked for response to the proposition that ‘multiculturalism has been good for Australia.’ Agreement has been consistent, in the range 83%‐86%, with an increase in the proportion indicating ‘strong agreement,’ from 32% in 2013 to 41%‐43% in 2015‐17.
The aggregated 2015‐1017 surveys find strongest level of agreement among Greens supporters (96%); those aged 18‐34 (91%‐94%); with a university level education (91%); those of non‐English speaking background (91%); whose financial position is prosperous or very comfortable (90%), and residents of Victoria (90%).
There are few sub‐groups in which there are high levels of disagreement. These include One Nation voters (49%), with smaller proportions among those over the age of 75 (22%), financial situation ‘struggling to pay bills’ or ‘poor’ (21%), and with education to year 11 (20%).
The 2017 Life in Australia panel survey found a lower level of agreement, but still at three out of four respondents endorsing the view that ‘multiculturalism has been good for Australia’. The proportion indicating ‘strongly agree’ or ‘agree’ was at 75%, ‘neither agree nor agree’ at 8%; and ‘disagree’ or ‘strongly disagree’ at 15%.
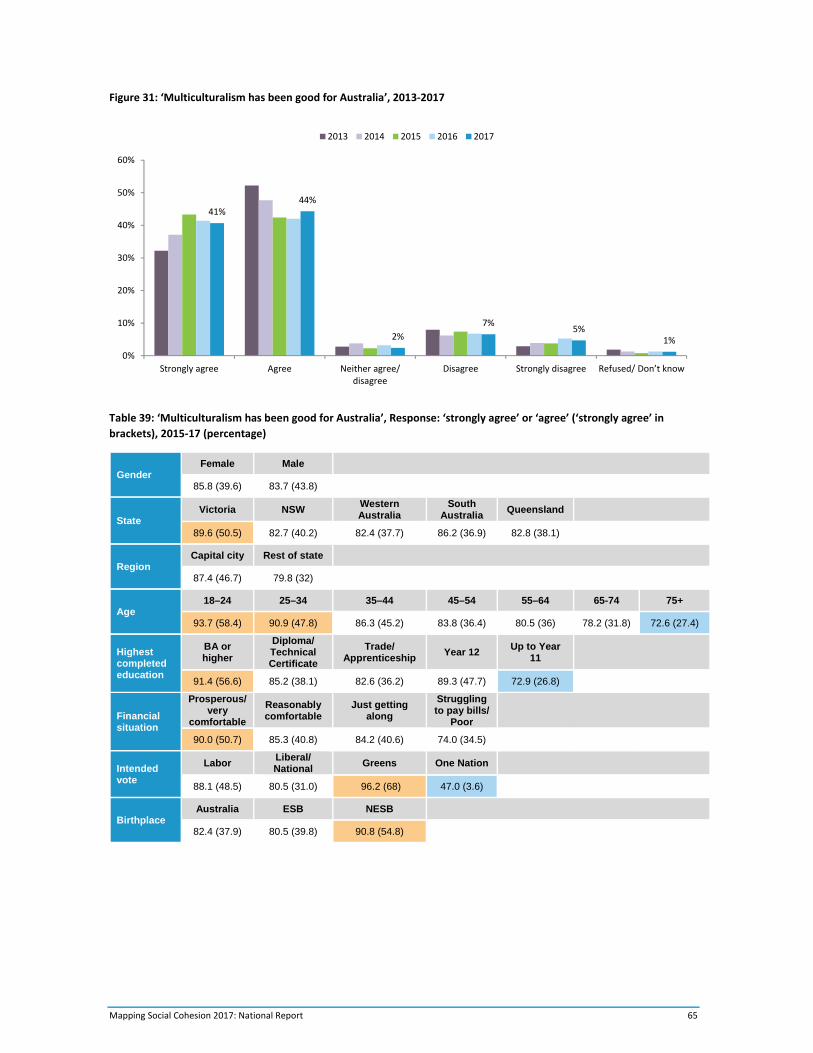
Mapping Social Cohesion 2017: National Report 65
Figure 31: ‘Multiculturalism has been good for Australia’, 2013‐2017
Table 39: ‘Multiculturalism has been good for Australia’, Response: ‘strongly agree’ or ‘agree’ (‘strongly agree’ in
brackets), 2015‐17 (percentage)
Gender Female Male
85.8 (39.6) 83.7 (43.8)
State Victoria NSW
Western Australia
South Australia
Queensland
89.6 (50.5) 82.7 (40.2) 82.4 (37.7) 86.2 (36.9) 82.8 (38.1)
Region Capital city Rest of state
87.4 (46.7) 79.8 (32)
Age 18–24 25–34 35–44 45–54 55–64 65-74 75+
93.7 (58.4) 90.9 (47.8) 86.3 (45.2) 83.8 (36.4) 80.5 (36) 78.2 (31.8) 72.6 (27.4)
Highest completed education
BA or higher
Diploma/ Technical Certificate
Trade/ Apprenticeship
Year 12 Up to Year
11
91.4 (56.6) 85.2 (38.1) 82.6 (36.2) 89.3 (47.7) 72.9 (26.8)
Financial situation
Prosperous/ very
comfortable
Reasonably comfortable
Just getting along
Struggling to pay bills/
Poor
90.0 (50.7) 85.3 (40.8) 84.2 (40.6) 74.0 (34.5)
Intended vote
Labor Liberal/ National
Greens One Nation
88.1 (48.5) 80.5 (31.0) 96.2 (68) 47.0 (3.6)
Birthplace Australia ESB NESB
82.4 (37.9) 80.5 (39.8) 90.8 (54.8)
41%44%
2%
7%5%
1%
0%
10%
20%
30%
40%
50%
60%
Strongly agree Agree Neither agree/disagree
Disagree Strongly disagree Refused/ Don’t know
2013 2014 2015 2016 2017
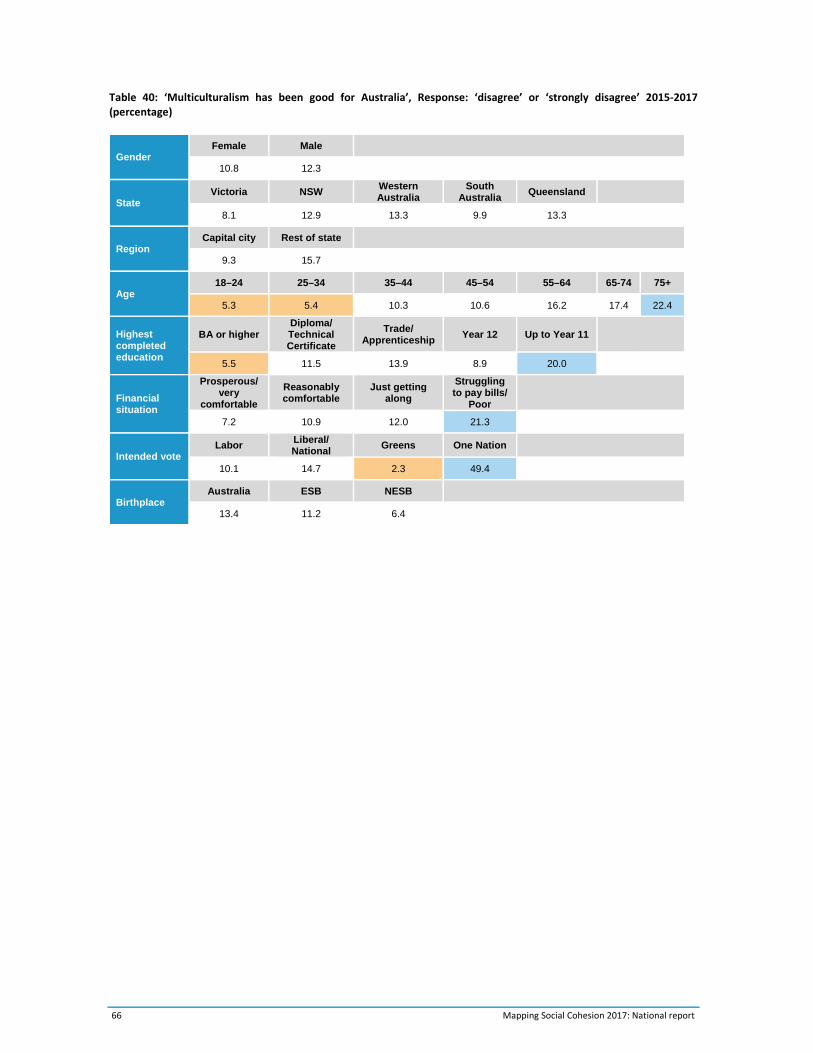
66 Mapping Social Cohesion 2017: National report
Table 40: ‘Multiculturalism has been good for Australia’, Response: ‘disagree’ or ‘strongly disagree’ 2015‐2017 (percentage)
Gender Female Male
10.8 12.3
State Victoria NSW
Western Australia
South Australia
Queensland
8.1 12.9 13.3 9.9 13.3
Region Capital city Rest of state
9.3 15.7
Age 18–24 25–34 35–44 45–54 55–64 65-74 75+
5.3 5.4 10.3 10.6 16.2 17.4 22.4
Highest completed education
BA or higher Diploma/ Technical Certificate
Trade/ Apprenticeship
Year 12 Up to Year 11
5.5 11.5 13.9 8.9 20.0
Financial situation
Prosperous/ very
comfortable
Reasonably comfortable
Just getting along
Struggling to pay bills/
Poor
7.2 10.9 12.0 21.3
Intended vote Labor
Liberal/ National
Greens One Nation
10.1 14.7 2.3 49.4
Birthplace Australia ESB NESB
13.4 11.2 6.4
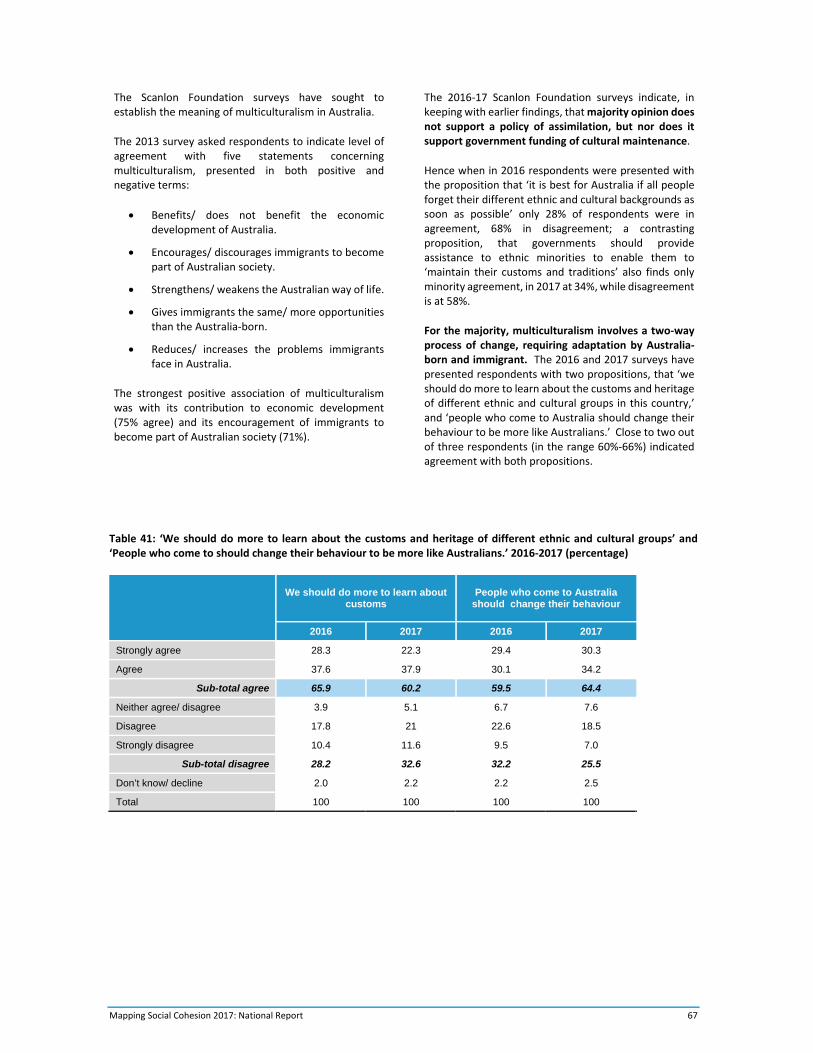
Mapping Social Cohesion 2017: National Report 67
Table 41: ‘We should do more to learn about the customs and heritage of different ethnic and cultural groups’ and ‘People who come to should change their behaviour to be more like Australians.’ 2016‐2017 (percentage)
We should do more to learn about customs
People who come to Australia should change their behaviour
2016 2017 2016 2017
Strongly agree 28.3 22.3 29.4 30.3
Agree 37.6 37.9 30.1 34.2
Sub-total agree 65.9 60.2 59.5 64.4
Neither agree/ disagree 3.9 5.1 6.7 7.6
Disagree 17.8 21 22.6 18.5
Strongly disagree 10.4 11.6 9.5 7.0
Sub-total disagree 28.2 32.6 32.2 25.5
Don’t know/ decline 2.0 2.2 2.2 2.5
Total 100 100 100 100
The Scanlon Foundation surveys have sought to establish the meaning of multiculturalism in Australia.
The 2013 survey asked respondents to indicate level of agreement with five statements concerning multiculturalism, presented in both positive and negative terms:
Benefits/ does not benefit the economic development of Australia.
Encourages/ discourages immigrants to become part of Australian society.
Strengthens/ weakens the Australian way of life.
Gives immigrants the same/ more opportunities than the Australia‐born.
Reduces/ increases the problems immigrants face in Australia.
The strongest positive association of multiculturalism was with its contribution to economic development (75% agree) and its encouragement of immigrants to become part of Australian society (71%).
The 2016‐17 Scanlon Foundation surveys indicate, in keeping with earlier findings, that majority opinion does not support a policy of assimilation, but nor does it support government funding of cultural maintenance.
Hence when in 2016 respondents were presented with the proposition that ‘it is best for Australia if all people forget their different ethnic and cultural backgrounds as soon as possible’ only 28% of respondents were in agreement, 68% in disagreement; a contrasting proposition, that governments should provide assistance to ethnic minorities to enable them to ‘maintain their customs and traditions’ also finds only minority agreement, in 2017 at 34%, while disagreement is at 58%.
For the majority, multiculturalism involves a two‐way process of change, requiring adaptation by Australia‐born and immigrant. The 2016 and 2017 surveys have presented respondents with two propositions, that ‘we should do more to learn about the customs and heritage of different ethnic and cultural groups in this country,’ and ‘people who come to Australia should change their behaviour to be more like Australians.’ Close to two out of three respondents (in the range 60%‐66%) indicated agreement with both propositions.
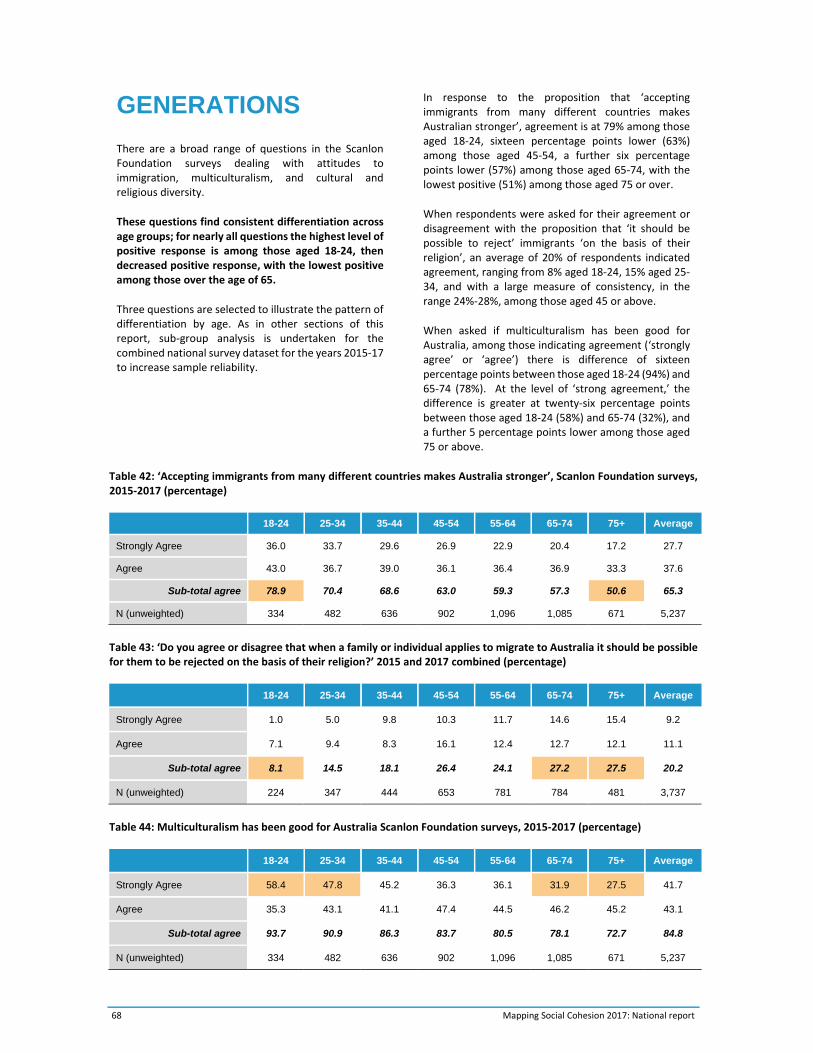
68 Mapping Social Cohesion 2017: National report
GENERATIONS
There are a broad range of questions in the Scanlon Foundation surveys dealing with attitudes to immigration, multiculturalism, and cultural and religious diversity.
These questions find consistent differentiation across age groups; for nearly all questions the highest level of positive response is among those aged 18‐24, then decreased positive response, with the lowest positive among those over the age of 65.
Three questions are selected to illustrate the pattern of differentiation by age. As in other sections of this report, sub‐group analysis is undertaken for the combined national survey dataset for the years 2015‐17 to increase sample reliability.
In response to the proposition that ‘accepting immigrants from many different countries makes Australian stronger’, agreement is at 79% among those aged 18‐24, sixteen percentage points lower (63%) among those aged 45‐54, a further six percentage points lower (57%) among those aged 65‐74, with the lowest positive (51%) among those aged 75 or over.
When respondents were asked for their agreement or disagreement with the proposition that ‘it should be possible to reject’ immigrants ‘on the basis of their religion’, an average of 20% of respondents indicated agreement, ranging from 8% aged 18‐24, 15% aged 25‐34, and with a large measure of consistency, in the range 24%‐28%, among those aged 45 or above.
When asked if multiculturalism has been good for Australia, among those indicating agreement (‘strongly agree’ or ‘agree’) there is difference of sixteen percentage points between those aged 18‐24 (94%) and 65‐74 (78%). At the level of ‘strong agreement,’ the difference is greater at twenty‐six percentage points between those aged 18‐24 (58%) and 65‐74 (32%), and a further 5 percentage points lower among those aged 75 or above.
Table 42: ‘Accepting immigrants from many different countries makes Australia stronger’, Scanlon Foundation surveys, 2015‐2017 (percentage)
18-24 25-34 35-44 45-54 55-64 65-74 75+ Average
Strongly Agree 36.0 33.7 29.6 26.9 22.9 20.4 17.2 27.7
Agree 43.0 36.7 39.0 36.1 36.4 36.9 33.3 37.6
Sub-total agree 78.9 70.4 68.6 63.0 59.3 57.3 50.6 65.3
N (unweighted) 334 482 636 902 1,096 1,085 671 5,237
Table 43: ‘Do you agree or disagree that when a family or individual applies to migrate to Australia it should be possible for them to be rejected on the basis of their religion?’ 2015 and 2017 combined (percentage)
18-24 25-34 35-44 45-54 55-64 65-74 75+ Average
Strongly Agree 1.0 5.0 9.8 10.3 11.7 14.6 15.4 9.2
Agree 7.1 9.4 8.3 16.1 12.4 12.7 12.1 11.1
Sub-total agree 8.1 14.5 18.1 26.4 24.1 27.2 27.5 20.2
N (unweighted) 224 347 444 653 781 784 481 3,737
Table 44: Multiculturalism has been good for Australia Scanlon Foundation surveys, 2015‐2017 (percentage)
18-24 25-34 35-44 45-54 55-64 65-74 75+ Average
Strongly Agree 58.4 47.8 45.2 36.3 36.1 31.9 27.5 41.7
Agree 35.3 43.1 41.1 47.4 44.5 46.2 45.2 43.1
Sub-total agree 93.7 90.9 86.3 83.7 80.5 78.1 72.7 84.8
N (unweighted) 334 482 636 902 1,096 1,085 671 5,237
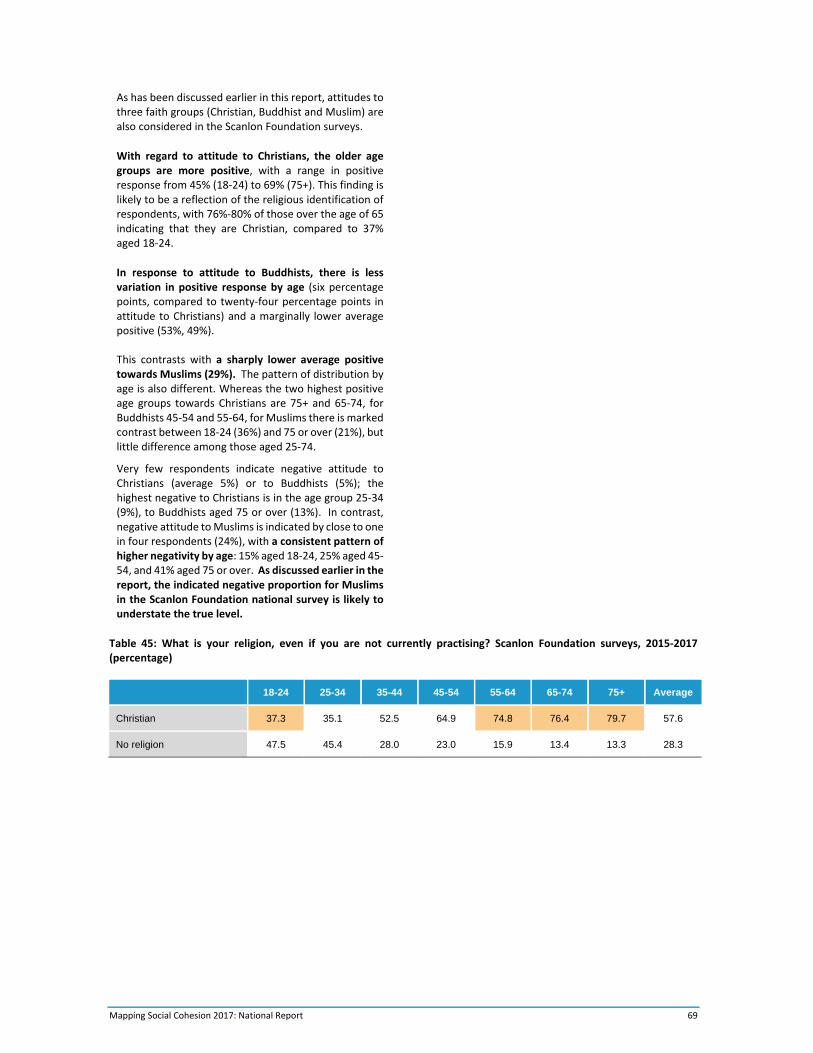
Mapping Social Cohesion 2017: National Report 69
As has been discussed earlier in this report, attitudes to three faith groups (Christian, Buddhist and Muslim) are also considered in the Scanlon Foundation surveys.
With regard to attitude to Christians, the older age groups are more positive, with a range in positive response from 45% (18‐24) to 69% (75+). This finding is likely to be a reflection of the religious identification of respondents, with 76%‐80% of those over the age of 65 indicating that they are Christian, compared to 37% aged 18‐24.
In response to attitude to Buddhists, there is less variation in positive response by age (six percentage points, compared to twenty‐four percentage points in attitude to Christians) and a marginally lower average positive (53%, 49%). This contrasts with a sharply lower average positive towards Muslims (29%). The pattern of distribution by age is also different. Whereas the two highest positive age groups towards Christians are 75+ and 65‐74, for Buddhists 45‐54 and 55‐64, for Muslims there is marked contrast between 18‐24 (36%) and 75 or over (21%), but little difference among those aged 25‐74.
Very few respondents indicate negative attitude to Christians (average 5%) or to Buddhists (5%); the highest negative to Christians is in the age group 25‐34 (9%), to Buddhists aged 75 or over (13%). In contrast, negative attitude to Muslims is indicated by close to one in four respondents (24%), with a consistent pattern of higher negativity by age: 15% aged 18‐24, 25% aged 45‐54, and 41% aged 75 or over. As discussed earlier in the report, the indicated negative proportion for Muslims in the Scanlon Foundation national survey is likely to understate the true level.
Table 45: What is your religion, even if you are not currently practising? Scanlon Foundation surveys, 2015‐2017 (percentage)
18-24 25-34 35-44 45-54 55-64 65-74 75+ Average
Christian 37.3 35.1 52.5 64.9 74.8 76.4 79.7 57.6
No religion 47.5 45.4 28.0 23.0 15.9 13.4 13.3 28.3
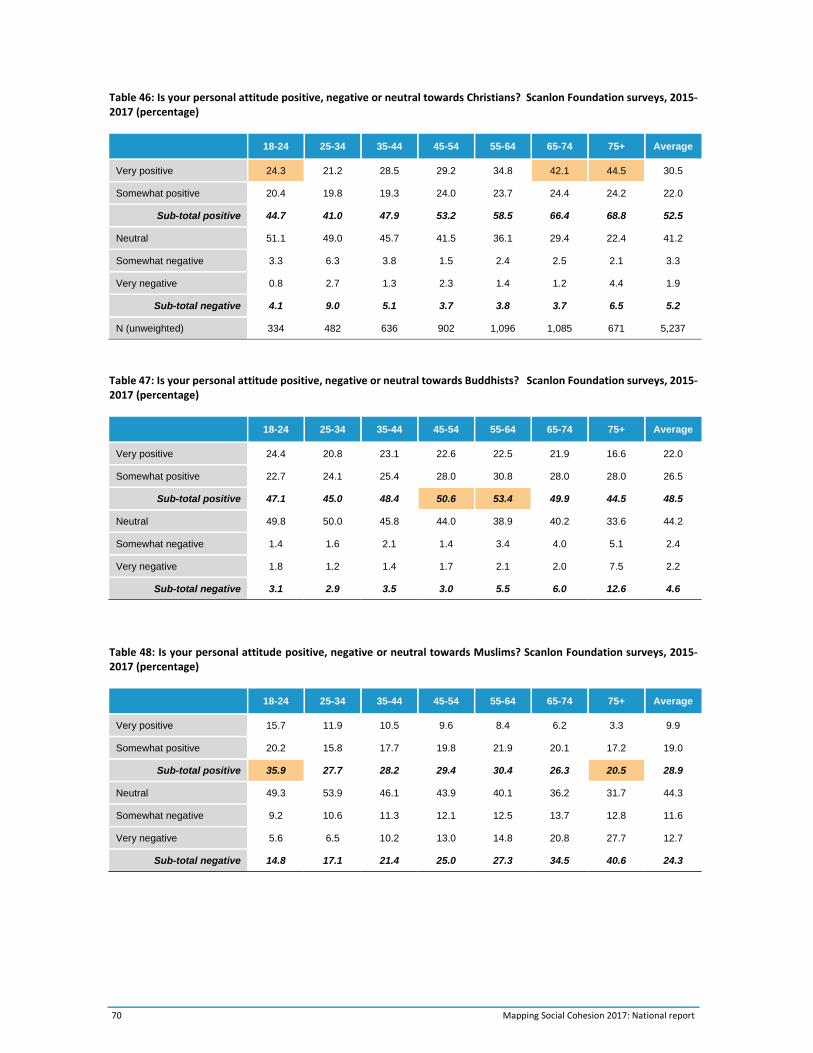
70 Mapping Social Cohesion 2017: National report
Table 46: Is your personal attitude positive, negative or neutral towards Christians? Scanlon Foundation surveys, 2015‐2017 (percentage)
18-24 25-34 35-44 45-54 55-64 65-74 75+ Average
Very positive 24.3 21.2 28.5 29.2 34.8 42.1 44.5 30.5
Somewhat positive 20.4 19.8 19.3 24.0 23.7 24.4 24.2 22.0
Sub-total positive 44.7 41.0 47.9 53.2 58.5 66.4 68.8 52.5
Neutral 51.1 49.0 45.7 41.5 36.1 29.4 22.4 41.2
Somewhat negative 3.3 6.3 3.8 1.5 2.4 2.5 2.1 3.3
Very negative 0.8 2.7 1.3 2.3 1.4 1.2 4.4 1.9
Sub-total negative 4.1 9.0 5.1 3.7 3.8 3.7 6.5 5.2
N (unweighted) 334 482 636 902 1,096 1,085 671 5,237
Table 47: Is your personal attitude positive, negative or neutral towards Buddhists? Scanlon Foundation surveys, 2015‐2017 (percentage)
18-24 25-34 35-44 45-54 55-64 65-74 75+ Average
Very positive 24.4 20.8 23.1 22.6 22.5 21.9 16.6 22.0
Somewhat positive 22.7 24.1 25.4 28.0 30.8 28.0 28.0 26.5
Sub-total positive 47.1 45.0 48.4 50.6 53.4 49.9 44.5 48.5
Neutral 49.8 50.0 45.8 44.0 38.9 40.2 33.6 44.2
Somewhat negative 1.4 1.6 2.1 1.4 3.4 4.0 5.1 2.4
Very negative 1.8 1.2 1.4 1.7 2.1 2.0 7.5 2.2
Sub-total negative 3.1 2.9 3.5 3.0 5.5 6.0 12.6 4.6
Table 48: Is your personal attitude positive, negative or neutral towards Muslims? Scanlon Foundation surveys, 2015‐2017 (percentage)
18-24 25-34 35-44 45-54 55-64 65-74 75+ Average
Very positive 15.7 11.9 10.5 9.6 8.4 6.2 3.3 9.9
Somewhat positive 20.2 15.8 17.7 19.8 21.9 20.1 17.2 19.0
Sub-total positive 35.9 27.7 28.2 29.4 30.4 26.3 20.5 28.9
Neutral 49.3 53.9 46.1 43.9 40.1 36.2 31.7 44.3
Somewhat negative 9.2 10.6 11.3 12.1 12.5 13.7 12.8 11.6
Very negative 5.6 6.5 10.2 13.0 14.8 20.8 27.7 12.7
Sub-total negative 14.8 17.1 21.4 25.0 27.3 34.5 40.6 24.3
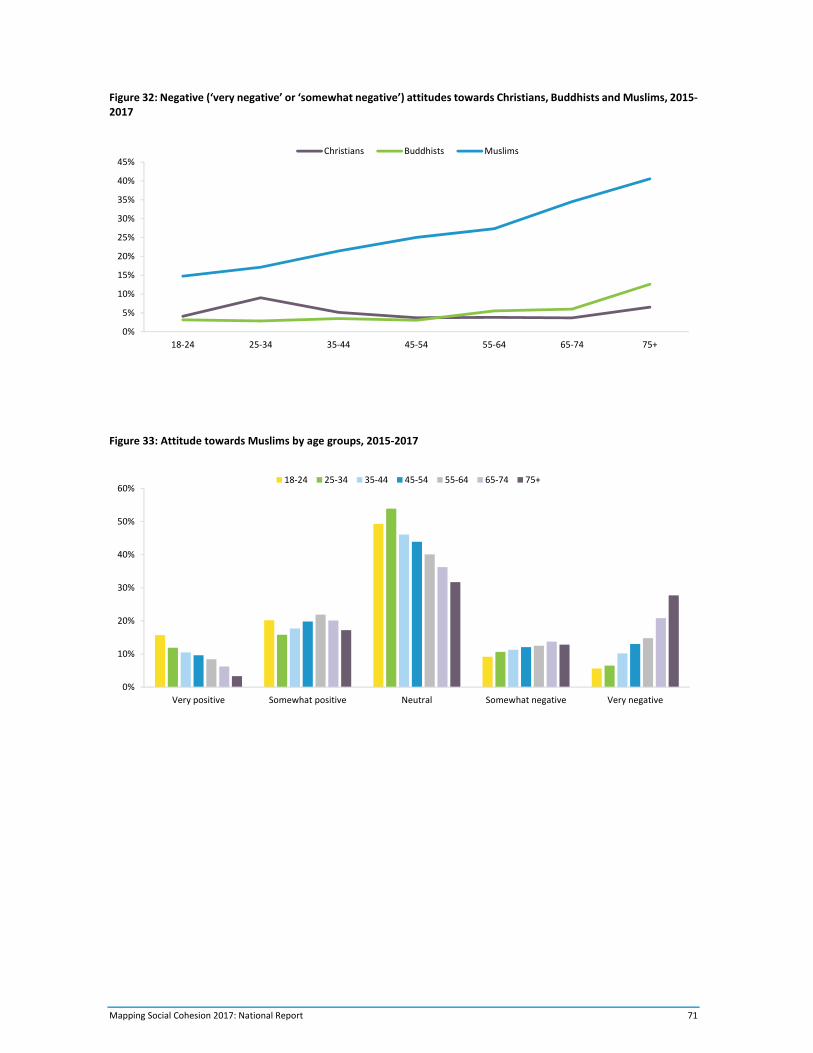
Mapping Social Cohesion 2017: National Report 71
Figure 32: Negative (‘very negative’ or ‘somewhat negative’) attitudes towards Christians, Buddhists and Muslims, 2015‐2017
Figure 33: Attitude towards Muslims by age groups, 2015‐2017
0%
5%
10%
15%
20%
25%
30%
35%
40%
45%
18‐24 25‐34 35‐44 45‐54 55‐64 65‐74 75+
Christians Buddhists Muslims
0%
10%
20%
30%
40%
50%
60%
Very positive Somewhat positive Neutral Somewhat negative Very negative
18‐24 25‐34 35‐44 45‐54 55‐64 65‐74 75+
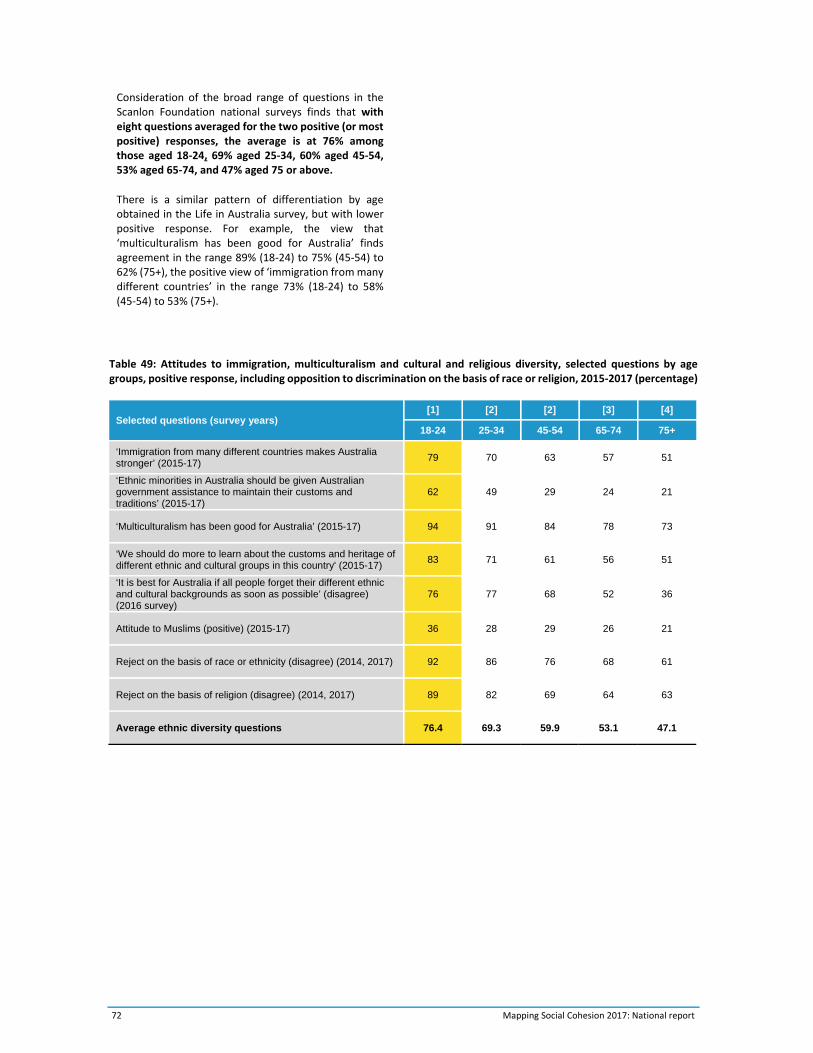
72 Mapping Social Cohesion 2017: National report
Consideration of the broad range of questions in the Scanlon Foundation national surveys finds that with eight questions averaged for the two positive (or most positive) responses, the average is at 76% among those aged 18‐24, 69% aged 25‐34, 60% aged 45‐54, 53% aged 65‐74, and 47% aged 75 or above.
There is a similar pattern of differentiation by age obtained in the Life in Australia survey, but with lower positive response. For example, the view that ‘multiculturalism has been good for Australia’ finds agreement in the range 89% (18‐24) to 75% (45‐54) to 62% (75+), the positive view of ‘immigration from many different countries’ in the range 73% (18‐24) to 58% (45‐54) to 53% (75+).
Table 49: Attitudes to immigration, multiculturalism and cultural and religious diversity, selected questions by age groups, positive response, including opposition to discrimination on the basis of race or religion, 2015‐2017 (percentage)
Selected questions (survey years) [1] [2] [2] [3] [4]
18-24 25-34 45-54 65-74 75+
‘Immigration from many different countries makes Australia stronger’ (2015-17)
79 70 63 57 51
‘Ethnic minorities in Australia should be given Australian government assistance to maintain their customs and traditions’ (2015-17)
62 49 29 24 21
‘Multiculturalism has been good for Australia’ (2015-17) 94 91 84 78 73
‘We should do more to learn about the customs and heritage of different ethnic and cultural groups in this country' (2015-17)
83 71 61 56 51
‘It is best for Australia if all people forget their different ethnic and cultural backgrounds as soon as possible’ (disagree) (2016 survey)
76 77 68 52 36
Attitude to Muslims (positive) (2015-17) 36 28 29 26 21
Reject on the basis of race or ethnicity (disagree) (2014, 2017) 92 86 76 68 61
Reject on the basis of religion (disagree) (2014, 2017) 89 82 69 64 63
Average ethnic diversity questions 76.4 69.3 59.9 53.1 47.1
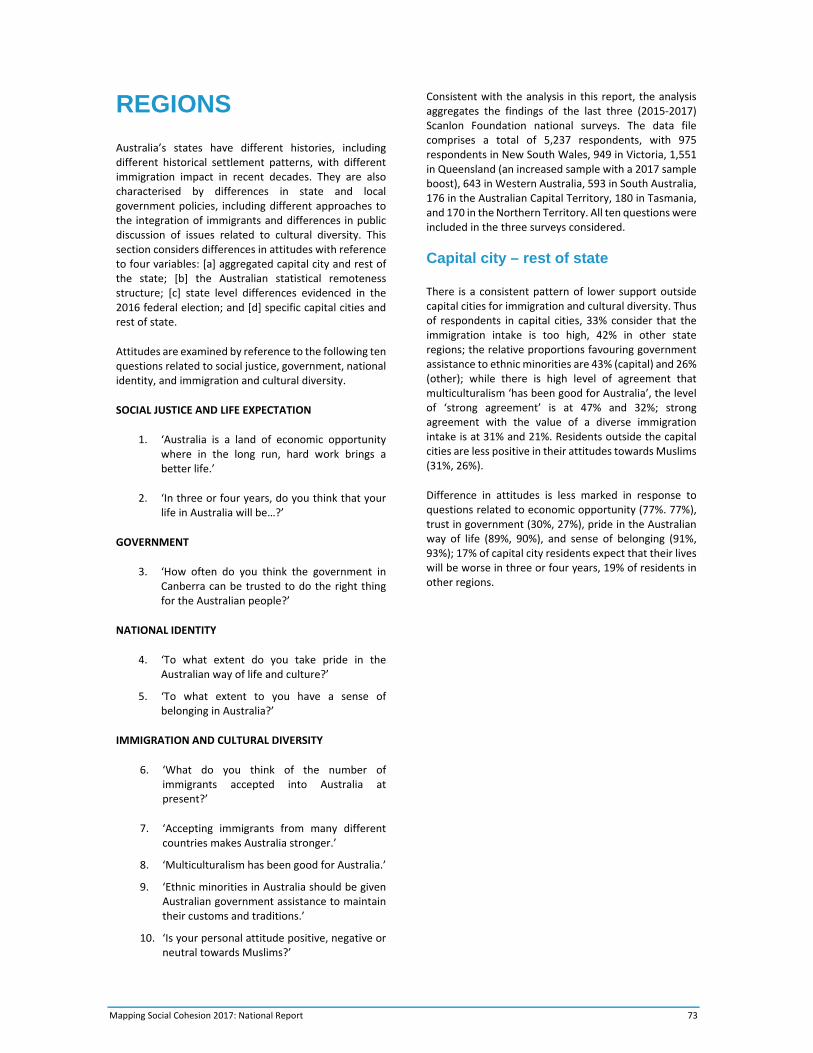
Mapping Social Cohesion 2017: National Report 73
REGIONS
Australia’s states have different histories, including different historical settlement patterns, with different immigration impact in recent decades. They are also characterised by differences in state and local government policies, including different approaches to the integration of immigrants and differences in public discussion of issues related to cultural diversity. This section considers differences in attitudes with reference to four variables: [a] aggregated capital city and rest of the state; [b] the Australian statistical remoteness structure; [c] state level differences evidenced in the 2016 federal election; and [d] specific capital cities and rest of state.
Attitudes are examined by reference to the following ten questions related to social justice, government, national identity, and immigration and cultural diversity.
SOCIAL JUSTICE AND LIFE EXPECTATION
1. ‘Australia is a land of economic opportunity where in the long run, hard work brings a better life.’
2. ‘In three or four years, do you think that your life in Australia will be…?’
GOVERNMENT
3. ‘How often do you think the government in Canberra can be trusted to do the right thing for the Australian people?’
NATIONAL IDENTITY
4. ‘To what extent do you take pride in the Australian way of life and culture?’
5. ‘To what extent to you have a sense of belonging in Australia?’
IMMIGRATION AND CULTURAL DIVERSITY
6. ‘What do you think of the number of immigrants accepted into Australia at present?’
7. ‘Accepting immigrants from many different countries makes Australia stronger.’
8. ‘Multiculturalism has been good for Australia.’
9. ‘Ethnic minorities in Australia should be given Australian government assistance to maintain their customs and traditions.’
10. ‘Is your personal attitude positive, negative or neutral towards Muslims?’
Consistent with the analysis in this report, the analysis aggregates the findings of the last three (2015‐2017) Scanlon Foundation national surveys. The data file comprises a total of 5,237 respondents, with 975 respondents in New South Wales, 949 in Victoria, 1,551 in Queensland (an increased sample with a 2017 sample boost), 643 in Western Australia, 593 in South Australia, 176 in the Australian Capital Territory, 180 in Tasmania, and 170 in the Northern Territory. All ten questions were included in the three surveys considered.
Capital city – rest of state
There is a consistent pattern of lower support outside capital cities for immigration and cultural diversity. Thus of respondents in capital cities, 33% consider that the immigration intake is too high, 42% in other state regions; the relative proportions favouring government assistance to ethnic minorities are 43% (capital) and 26% (other); while there is high level of agreement that multiculturalism ‘has been good for Australia’, the level of ‘strong agreement’ is at 47% and 32%; strong agreement with the value of a diverse immigration intake is at 31% and 21%. Residents outside the capital cities are less positive in their attitudes towards Muslims (31%, 26%).
Difference in attitudes is less marked in response to questions related to economic opportunity (77%. 77%), trust in government (30%, 27%), pride in the Australian way of life (89%, 90%), and sense of belonging (91%, 93%); 17% of capital city residents expect that their lives will be worse in three or four years, 19% of residents in other regions.
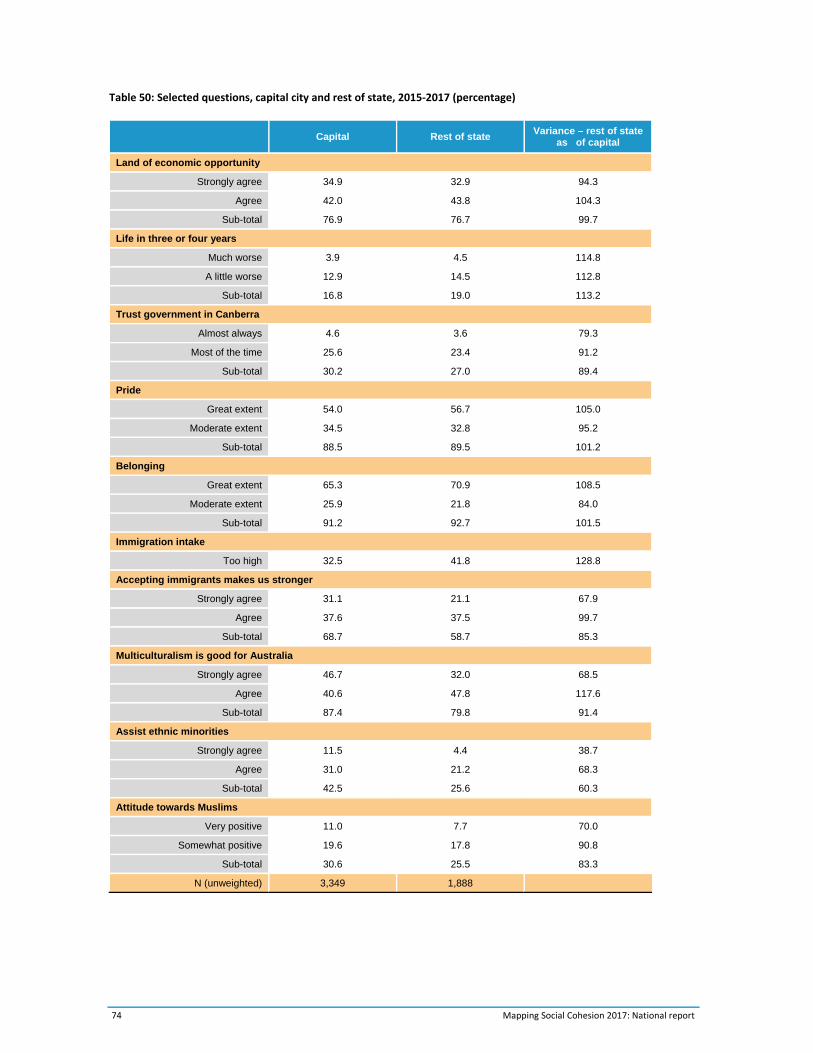
74 Mapping Social Cohesion 2017: National report
Table 50: Selected questions, capital city and rest of state, 2015‐2017 (percentage)
Capital Rest of state Variance – rest of state
as of capital
Land of economic opportunity
Strongly agree 34.9 32.9 94.3
Agree 42.0 43.8 104.3
Sub-total 76.9 76.7 99.7
Life in three or four years
Much worse 3.9 4.5 114.8
A little worse 12.9 14.5 112.8
Sub-total 16.8 19.0 113.2
Trust government in Canberra
Almost always 4.6 3.6 79.3
Most of the time 25.6 23.4 91.2
Sub-total 30.2 27.0 89.4
Pride
Great extent 54.0 56.7 105.0
Moderate extent 34.5 32.8 95.2
Sub-total 88.5 89.5 101.2
Belonging
Great extent 65.3 70.9 108.5
Moderate extent 25.9 21.8 84.0
Sub-total 91.2 92.7 101.5
Immigration intake
Too high 32.5 41.8 128.8
Accepting immigrants makes us stronger
Strongly agree 31.1 21.1 67.9
Agree 37.6 37.5 99.7
Sub-total 68.7 58.7 85.3
Multiculturalism is good for Australia
Strongly agree 46.7 32.0 68.5
Agree 40.6 47.8 117.6
Sub-total 87.4 79.8 91.4
Assist ethnic minorities
Strongly agree 11.5 4.4 38.7
Agree 31.0 21.2 68.3
Sub-total 42.5 25.6 60.3
Attitude towards Muslims
Very positive 11.0 7.7 70.0
Somewhat positive 19.6 17.8 90.8
Sub-total 30.6 25.5 83.3
N (unweighted) 3,349 1,888
Mapping Social Cohesion 2017: National Report 75
34 See Australian Bureau of Statistics, Australian Statistical Geography Standard
Remoteness structure
A more detailed disaggregation of regions than capital city/ rest of state is provided by the Australian Statistical Geographic Standard (ASGS) remoteness structure34 – which measures the distances people outside the major metropolitan areas need to travel to access services. The structure informs government policy development by classifying Australia into large regions that share common characteristics.
The following analysis utilises the five ASGS categories, with remote and very remote aggregated because of small sample size. The characteristics of the regions are:
Major city: areas where geographic distance imposes minimal restriction upon accessibility to the widest range of goods, services and opportunities for social interaction.
Inner regional: geographic distance imposes some restriction upon accessibility. The parts of Australia classified as inner regional include Tamworth and Wagga Wagga in New South Wales, Ballarat and Bendigo in Victoria.
Outer regional geographic distance imposes a moderate restriction upon accessibility. The parts of Australia classified as outer regional include Broken Hill, Griffith, Gunnedah in New South Wales, Horsham, Swan Hill, and Traralgon in Victoria.
Remote/ Very remote: geographic distance imposes a high or highest restriction upon accessibility. Parts of Australia classified as remote include Cobar (New South Wales), the northern Wimmera district (Victoria), Charters Towers and Cooktown (Queensland), Very remote includes the far west of New South Wales and Queensland, northern South Australia and Western Australia, and most of the Northern Territory.
Findings indicate relatively minor differentiation across the first three regions in response to questions on social justice, government and sense of belonging. Thus agreement that Australia is a land of economic opportunity is at 77%, 78% and 77% for major city, inner regional and outer regional. Trust in government is at 30%, 28% and 27%. Sense of pride and belonging is at high levels across the three regions, but a higher proportion indicate agreement to a ‘great extent’ in the outer regional than major city groupings – sense of belong to a ‘great extent’ is at 75% outer regional, 66% major city.
Questions related to economic opportunity life expectations and trust find lower positive response in remote and very remote regions; agreement that Australia is a land of economic opportunity is at 77%‐78% in the first three regions, some ten percentage points lower in remote and very remote Australia; there is a higher expectation that life will be worse in three or four years (17%, 18%, 21%, 22%), and trust in government falls from 27%‐30% in the first three zones to 23% in the remote and very remote regions.
The most marked differentiation is obtained in response to some questions concerning immigration and cultural diversity, differentiating capital cities and other regions as already noted. Those of the view that the immigration intake is too high increases from 32% in major cities to 42% inner regional, 43% outer regional, and 55% remote. The view that immigration from many different countries is good for Australia is endorsed by 69% in major cities, 59% inner regional, 62% outer regional, and a much lower 45% in remote regions. Support for government assistance to ethnic minorities is differentiated between capital cities the other three regions. Support for the proposition that multiculturalism has been good for Australia is highest in capital cities, but it is still at 74% in remote regions; ‘strong agreement’, however, in markedly differentiated, with a fall from 47% to 34%, 28% and 22%.
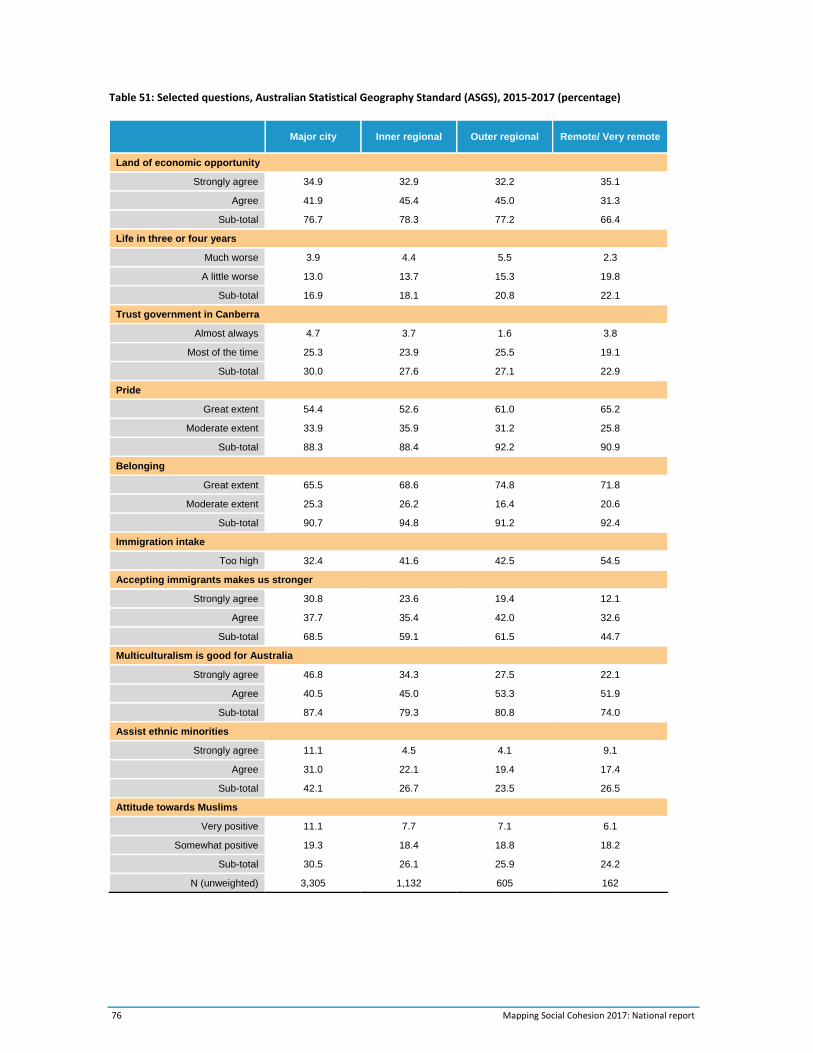
76 Mapping Social Cohesion 2017: National report
Table 51: Selected questions, Australian Statistical Geography Standard (ASGS), 2015‐2017 (percentage)
Major city Inner regional Outer regional Remote/ Very remote
Land of economic opportunity
Strongly agree 34.9 32.9 32.2 35.1
Agree 41.9 45.4 45.0 31.3
Sub-total 76.7 78.3 77.2 66.4
Life in three or four years
Much worse 3.9 4.4 5.5 2.3
A little worse 13.0 13.7 15.3 19.8
Sub-total 16.9 18.1 20.8 22.1
Trust government in Canberra
Almost always 4.7 3.7 1.6 3.8
Most of the time 25.3 23.9 25.5 19.1
Sub-total 30.0 27.6 27.1 22.9
Pride
Great extent 54.4 52.6 61.0 65.2
Moderate extent 33.9 35.9 31.2 25.8
Sub-total 88.3 88.4 92.2 90.9
Belonging
Great extent 65.5 68.6 74.8 71.8
Moderate extent 25.3 26.2 16.4 20.6
Sub-total 90.7 94.8 91.2 92.4
Immigration intake
Too high 32.4 41.6 42.5 54.5
Accepting immigrants makes us stronger
Strongly agree 30.8 23.6 19.4 12.1
Agree 37.7 35.4 42.0 32.6
Sub-total 68.5 59.1 61.5 44.7
Multiculturalism is good for Australia
Strongly agree 46.8 34.3 27.5 22.1
Agree 40.5 45.0 53.3 51.9
Sub-total 87.4 79.3 80.8 74.0
Assist ethnic minorities
Strongly agree 11.1 4.5 4.1 9.1
Agree 31.0 22.1 19.4 17.4
Sub-total 42.1 26.7 23.5 26.5
Attitude towards Muslims
Very positive 11.1 7.7 7.1 6.1
Somewhat positive 19.3 18.4 18.8 18.2
Sub-total 30.5 26.1 25.9 24.2
N (unweighted) 3,305 1,132 605 162
Mapping Social Cohesion 2017: National Report 77
35 George Megalogenis, ‘Australia Divided’, The Monthly, December 2016‐January 2017
A fractured electorate
A basis for differentiating Australian states has been developed by the political commentator and journalist George Megalogenis on the basis of the 2016 federal election. Megalogenis argues that the Australian electorate has fractured into three economic and cultural zones, with the result that for the first time in federal history the election was not determined by the vote in the south‐east of the country.35 The three zones, which are analysed using the ten questions employed in this section, are
New South Wales, Victoria and the ACT, characterised by adequately functioning economies and acceptance of globalisation.
Queensland and Western Australia, characterised by the significance of mining in their economies and the consequent boom‐and‐bust economic cycles; these states tend to be conservative politically, and have relatively high proportion of Australia‐born or immigrants of English speaking background in their populations.
South Australia, Tasmania and the Northern Territory, characterised by a relatively high level of economic disadvantage and dependency on federal government funding.
Different voting patterns for the three zones were evident in the 2016 election. In the vote for the House of Representatives, the south‐east region returned 44 Labor candidates to the Coalition’s 40. Labor was the dominant party in the disadvantaged region, winning 12 seats to the Coalition’s 4. The election outcome was decided in the Coalition’s favour in the mining states, where it won 32 seats to 13 by Labor.
At the level of state aggregation, there is limited difference between the three zones; for example, agreement that Australia is a land of economic opportunity is at 77% across the three and there is a similar (low) level of trust in the federal government, below 30%. Sense of pride and belonging is marginally higher in the states characterised by relative disadvantage, and in the second and third regions a marginally higher proportion indicate agreement with the view that immigration is too high (37%, 35%).
The main difference relates to pessimism about the future and acceptance of cultural diversity. In the relatively disadvantaged zone, consistent with expectation, a higher proportion indicate that life will be worse in three of four years: 23%, compared to 17%‐18%.
The highest level of ‘strong agreement’ with a diverse immigration intake, and the benefit to Australia of multiculturalism, is in NSW, Victoria and the ACT, with lowest level of aggregated agreement in the mining states. Agreement with government assistance to ethnic groups for cultural maintenance is at 40% in the first zone, 33% in the mining states and 29% in the relatively disadvantaged states.
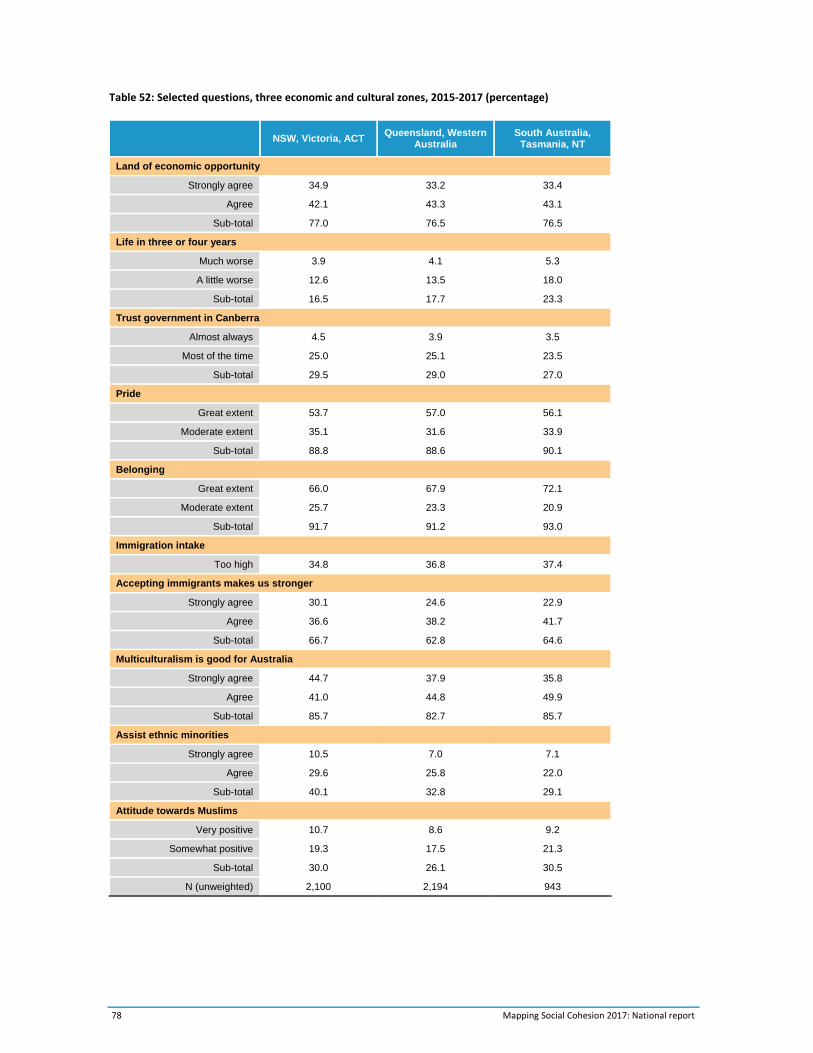
78 Mapping Social Cohesion 2017: National report
Table 52: Selected questions, three economic and cultural zones, 2015‐2017 (percentage)
NSW, Victoria, ACT Queensland, Western
Australia South Australia,
Tasmania, NT
Land of economic opportunity
Strongly agree 34.9 33.2 33.4
Agree 42.1 43.3 43.1
Sub-total 77.0 76.5 76.5
Life in three or four years
Much worse 3.9 4.1 5.3
A little worse 12.6 13.5 18.0
Sub-total 16.5 17.7 23.3
Trust government in Canberra
Almost always 4.5 3.9 3.5
Most of the time 25.0 25.1 23.5
Sub-total 29.5 29.0 27.0
Pride
Great extent 53.7 57.0 56.1
Moderate extent 35.1 31.6 33.9
Sub-total 88.8 88.6 90.1
Belonging
Great extent 66.0 67.9 72.1
Moderate extent 25.7 23.3 20.9
Sub-total 91.7 91.2 93.0
Immigration intake
Too high 34.8 36.8 37.4
Accepting immigrants makes us stronger
Strongly agree 30.1 24.6 22.9
Agree 36.6 38.2 41.7
Sub-total 66.7 62.8 64.6
Multiculturalism is good for Australia
Strongly agree 44.7 37.9 35.8
Agree 41.0 44.8 49.9
Sub-total 85.7 82.7 85.7
Assist ethnic minorities
Strongly agree 10.5 7.0 7.1
Agree 29.6 25.8 22.0
Sub-total 40.1 32.8 29.1
Attitude towards Muslims
Very positive 10.7 8.6 9.2
Somewhat positive 19.3 17.5 21.3
Sub-total 30.0 26.1 30.5
N (unweighted) 2,100 2,194 943
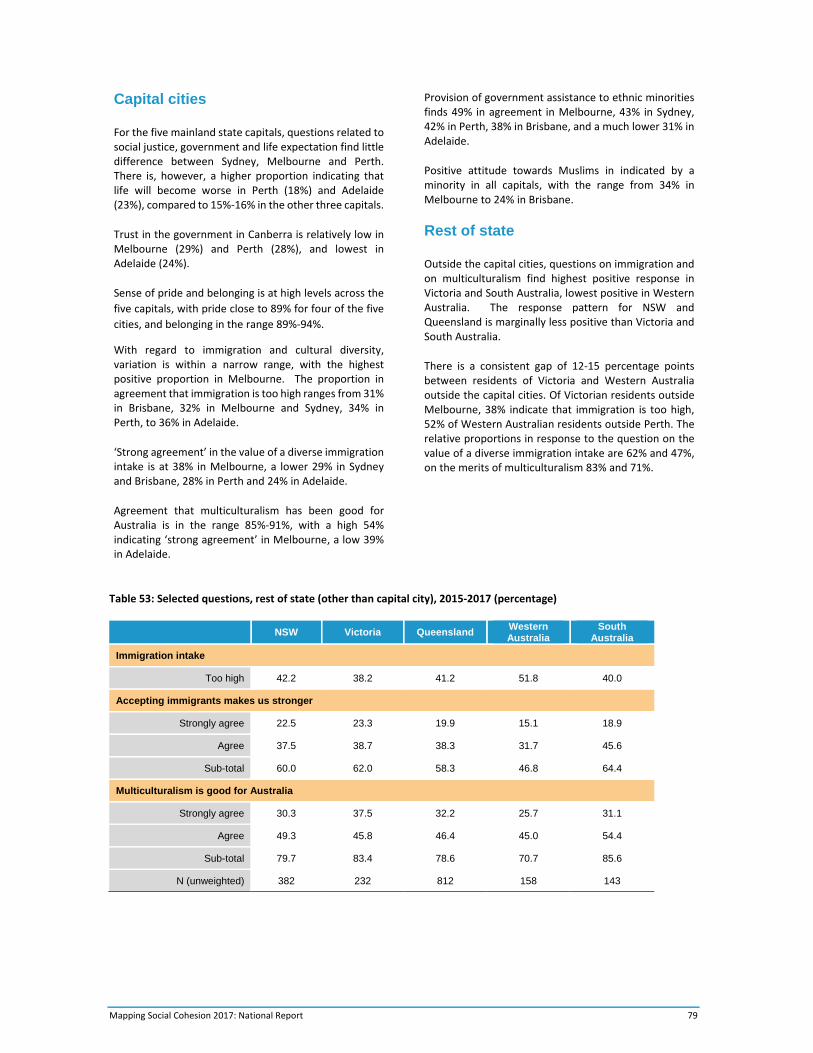
Mapping Social Cohesion 2017: National Report 79
Table 53: Selected questions, rest of state (other than capital city), 2015‐2017 (percentage)
NSW Victoria Queensland Western Australia
South Australia
Immigration intake
Too high 42.2 38.2 41.2 51.8 40.0
Accepting immigrants makes us stronger
Strongly agree 22.5 23.3 19.9 15.1 18.9
Agree 37.5 38.7 38.3 31.7 45.6
Sub-total 60.0 62.0 58.3 46.8 64.4
Multiculturalism is good for Australia
Strongly agree 30.3 37.5 32.2 25.7 31.1
Agree 49.3 45.8 46.4 45.0 54.4
Sub-total 79.7 83.4 78.6 70.7 85.6
N (unweighted) 382 232 812 158 143
Capital cities
For the five mainland state capitals, questions related to social justice, government and life expectation find little difference between Sydney, Melbourne and Perth. There is, however, a higher proportion indicating that life will become worse in Perth (18%) and Adelaide (23%), compared to 15%‐16% in the other three capitals.
Trust in the government in Canberra is relatively low in Melbourne (29%) and Perth (28%), and lowest in Adelaide (24%).
Sense of pride and belonging is at high levels across the
five capitals, with pride close to 89% for four of the five
cities, and belonging in the range 89%‐94%.
With regard to immigration and cultural diversity, variation is within a narrow range, with the highest positive proportion in Melbourne. The proportion in agreement that immigration is too high ranges from 31% in Brisbane, 32% in Melbourne and Sydney, 34% in Perth, to 36% in Adelaide.
‘Strong agreement’ in the value of a diverse immigration intake is at 38% in Melbourne, a lower 29% in Sydney and Brisbane, 28% in Perth and 24% in Adelaide.
Agreement that multiculturalism has been good for Australia is in the range 85%‐91%, with a high 54% indicating ‘strong agreement’ in Melbourne, a low 39% in Adelaide.
Provision of government assistance to ethnic minorities finds 49% in agreement in Melbourne, 43% in Sydney, 42% in Perth, 38% in Brisbane, and a much lower 31% in Adelaide.
Positive attitude towards Muslims in indicated by a minority in all capitals, with the range from 34% in Melbourne to 24% in Brisbane.
Rest of state
Outside the capital cities, questions on immigration and on multiculturalism find highest positive response in Victoria and South Australia, lowest positive in Western Australia. The response pattern for NSW and Queensland is marginally less positive than Victoria and South Australia.
There is a consistent gap of 12‐15 percentage points between residents of Victoria and Western Australia outside the capital cities. Of Victorian residents outside Melbourne, 38% indicate that immigration is too high, 52% of Western Australian residents outside Perth. The relative proportions in response to the question on the value of a diverse immigration intake are 62% and 47%, on the merits of multiculturalism 83% and 71%.
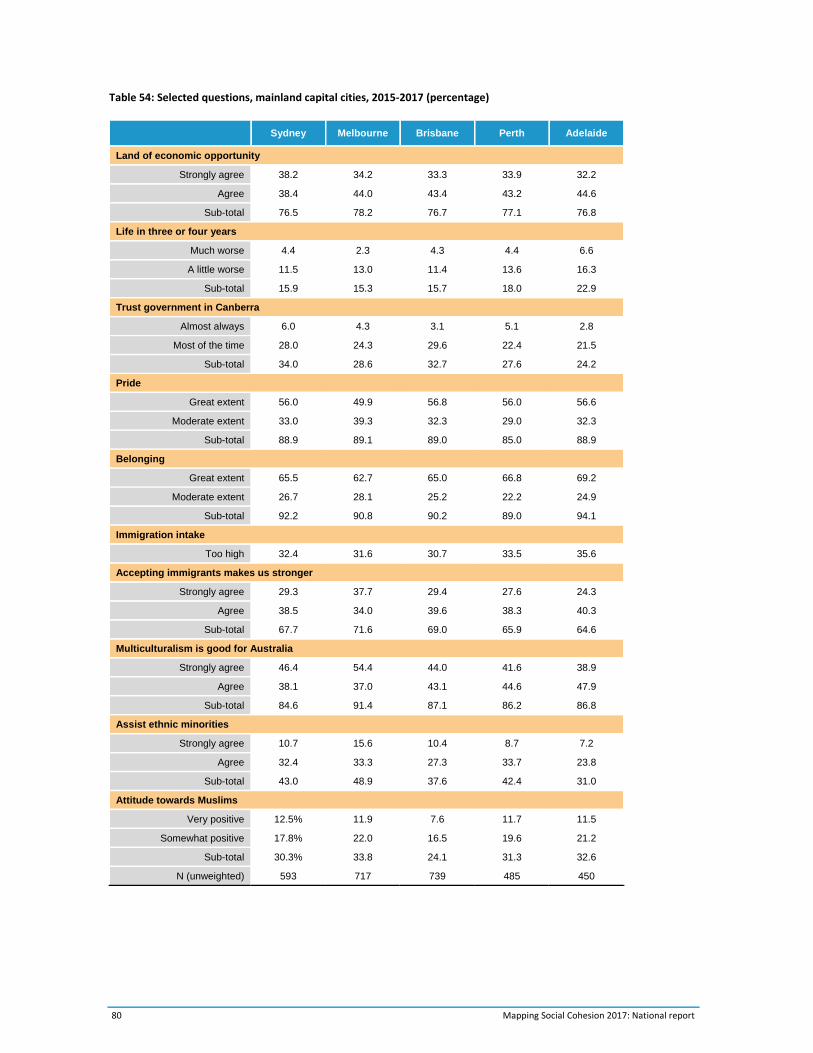
80 Mapping Social Cohesion 2017: National report
Table 54: Selected questions, mainland capital cities, 2015‐2017 (percentage)
Sydney Melbourne Brisbane Perth Adelaide
Land of economic opportunity
Strongly agree 38.2 34.2 33.3 33.9 32.2
Agree 38.4 44.0 43.4 43.2 44.6
Sub-total 76.5 78.2 76.7 77.1 76.8
Life in three or four years
Much worse 4.4 2.3 4.3 4.4 6.6
A little worse 11.5 13.0 11.4 13.6 16.3
Sub-total 15.9 15.3 15.7 18.0 22.9
Trust government in Canberra
Almost always 6.0 4.3 3.1 5.1 2.8
Most of the time 28.0 24.3 29.6 22.4 21.5
Sub-total 34.0 28.6 32.7 27.6 24.2
Pride
Great extent 56.0 49.9 56.8 56.0 56.6
Moderate extent 33.0 39.3 32.3 29.0 32.3
Sub-total 88.9 89.1 89.0 85.0 88.9
Belonging
Great extent 65.5 62.7 65.0 66.8 69.2
Moderate extent 26.7 28.1 25.2 22.2 24.9
Sub-total 92.2 90.8 90.2 89.0 94.1
Immigration intake
Too high 32.4 31.6 30.7 33.5 35.6
Accepting immigrants makes us stronger
Strongly agree 29.3 37.7 29.4 27.6 24.3
Agree 38.5 34.0 39.6 38.3 40.3
Sub-total 67.7 71.6 69.0 65.9 64.6
Multiculturalism is good for Australia
Strongly agree 46.4 54.4 44.0 41.6 38.9
Agree 38.1 37.0 43.1 44.6 47.9
Sub-total 84.6 91.4 87.1 86.2 86.8
Assist ethnic minorities
Strongly agree 10.7 15.6 10.4 8.7 7.2
Agree 32.4 33.3 27.3 33.7 23.8
Sub-total 43.0 48.9 37.6 42.4 31.0
Attitude towards Muslims
Very positive 12.5% 11.9 7.6 11.7 11.5
Somewhat positive 17.8% 22.0 16.5 19.6 21.2
Sub-total 30.3% 33.8 24.1 31.3 32.6
N (unweighted) 593 717 739 485 450
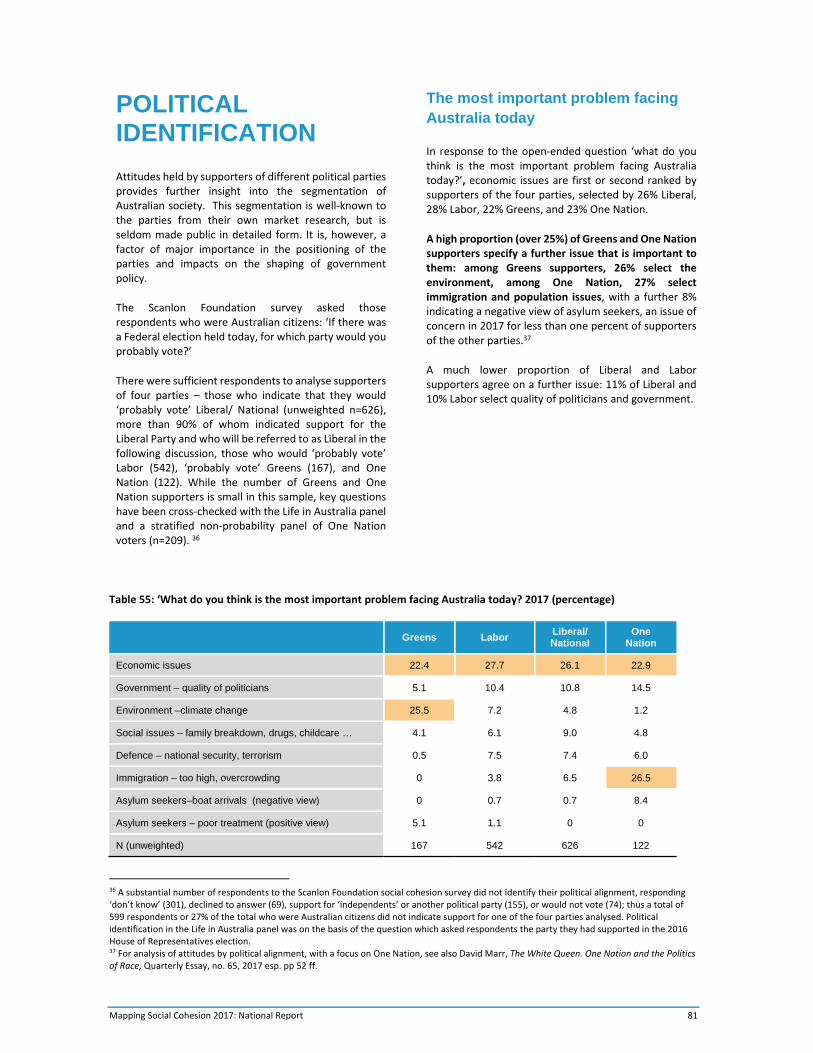
Mapping Social Cohesion 2017: National Report 81
Table 55: ‘What do you think is the most important problem facing Australia today? 2017 (percentage)
Greens Labor Liberal/ National
One Nation
Economic issues 22.4 27.7 26.1 22.9
Government – quality of politicians 5.1 10.4 10.8 14.5
Environment –climate change 25.5 7.2 4.8 1.2
Social issues – family breakdown, drugs, childcare … 4.1 6.1 9.0 4.8
Defence – national security, terrorism 0.5 7.5 7.4 6.0
Immigration – too high, overcrowding 0 3.8 6.5 26.5
Asylum seekers–boat arrivals (negative view) 0 0.7 0.7 8.4
Asylum seekers – poor treatment (positive view) 5.1 1.1 0 0
N (unweighted) 167 542 626 122
36 A substantial number of respondents to the Scanlon Foundation social cohesion survey did not identify their political alignment, responding ‘don’t know’ (301), declined to answer (69), support for ‘independents’ or another political party (155), or would not vote (74); thus a total of 599 respondents or 27% of the total who were Australian citizens did not indicate support for one of the four parties analysed. Political identification in the Life in Australia panel was on the basis of the question which asked respondents the party they had supported in the 2016 House of Representatives election. 37 For analysis of attitudes by political alignment, with a focus on One Nation, see also David Marr, The White Queen. One Nation and the Politics of Race, Quarterly Essay, no. 65, 2017 esp. pp 52 ff.
POLITICAL IDENTIFICATION
Attitudes held by supporters of different political parties provides further insight into the segmentation of Australian society. This segmentation is well‐known to the parties from their own market research, but is seldom made public in detailed form. It is, however, a factor of major importance in the positioning of the parties and impacts on the shaping of government policy.
The Scanlon Foundation survey asked those respondents who were Australian citizens: ‘If there was a Federal election held today, for which party would you probably vote?’
There were sufficient respondents to analyse supporters of four parties – those who indicate that they would ‘probably vote’ Liberal/ National (unweighted n=626), more than 90% of whom indicated support for the Liberal Party and who will be referred to as Liberal in the following discussion, those who would ‘probably vote’ Labor (542), ‘probably vote’ Greens (167), and One Nation (122). While the number of Greens and One Nation supporters is small in this sample, key questions have been cross‐checked with the Life in Australia panel and a stratified non‐probability panel of One Nation voters (n=209). 36
The most important problem facing Australia today
In response to the open‐ended question ‘what do you think is the most important problem facing Australia today?’, economic issues are first or second ranked by supporters of the four parties, selected by 26% Liberal, 28% Labor, 22% Greens, and 23% One Nation.
A high proportion (over 25%) of Greens and One Nation supporters specify a further issue that is important to them: among Greens supporters, 26% select the environment, among One Nation, 27% select immigration and population issues, with a further 8% indicating a negative view of asylum seekers, an issue of concern in 2017 for less than one percent of supporters of the other parties.37
A much lower proportion of Liberal and Labor supporters agree on a further issue: 11% of Liberal and 10% Labor select quality of politicians and government.
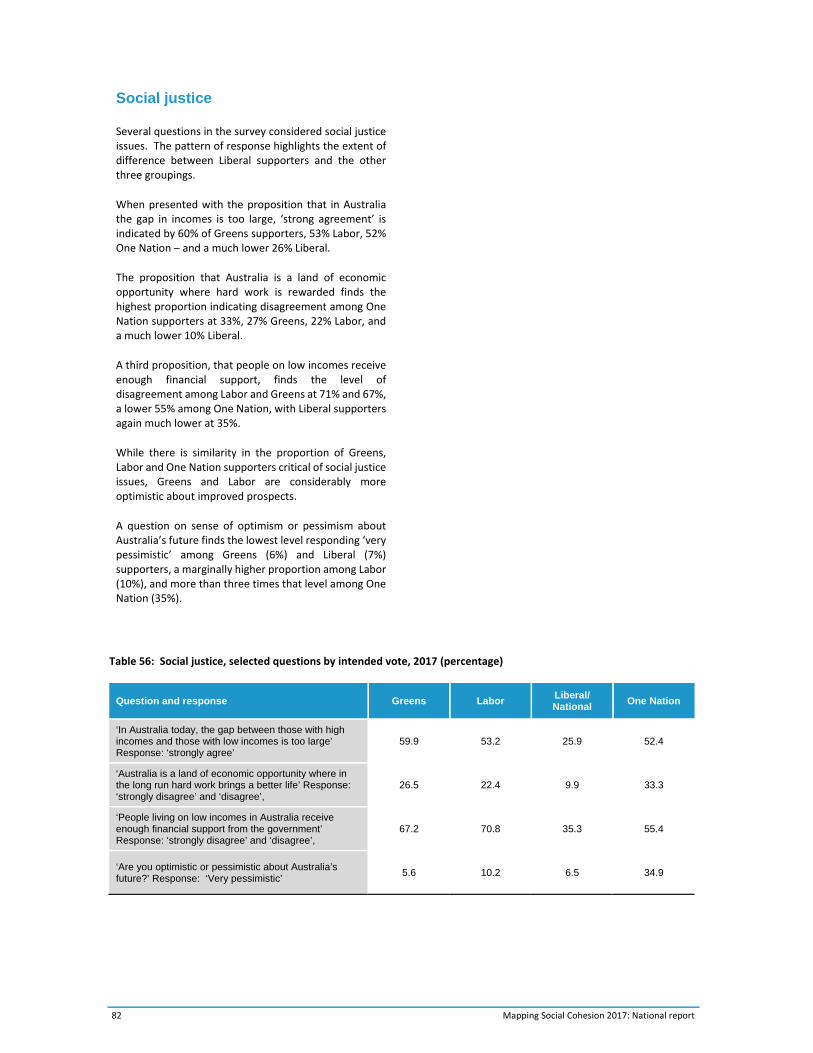
82 Mapping Social Cohesion 2017: National report
Table 56: Social justice, selected questions by intended vote, 2017 (percentage)
Question and response Greens Labor Liberal/ National
One Nation
‘In Australia today, the gap between those with high incomes and those with low incomes is too large’ Response: ‘strongly agree’
59.9 53.2 25.9 52.4
‘Australia is a land of economic opportunity where in the long run hard work brings a better life’ Response: ‘strongly disagree’ and ‘disagree’,
26.5 22.4 9.9 33.3
‘People living on low incomes in Australia receive enough financial support from the government’ Response: ‘strongly disagree’ and ‘disagree’,
67.2 70.8 35.3 55.4
‘Are you optimistic or pessimistic about Australia’s future?’ Response: ‘Very pessimistic’
5.6 10.2 6.5 34.9
Social justice
Several questions in the survey considered social justice issues. The pattern of response highlights the extent of difference between Liberal supporters and the other three groupings.
When presented with the proposition that in Australia the gap in incomes is too large, ‘strong agreement’ is indicated by 60% of Greens supporters, 53% Labor, 52% One Nation – and a much lower 26% Liberal.
The proposition that Australia is a land of economic opportunity where hard work is rewarded finds the highest proportion indicating disagreement among One Nation supporters at 33%, 27% Greens, 22% Labor, and a much lower 10% Liberal.
A third proposition, that people on low incomes receive enough financial support, finds the level of disagreement among Labor and Greens at 71% and 67%, a lower 55% among One Nation, with Liberal supporters again much lower at 35%.
While there is similarity in the proportion of Greens, Labor and One Nation supporters critical of social justice issues, Greens and Labor are considerably more optimistic about improved prospects.
A question on sense of optimism or pessimism about Australia’s future finds the lowest level responding ‘very pessimistic’ among Greens (6%) and Liberal (7%) supporters, a marginally higher proportion among Labor (10%), and more than three times that level among One Nation (35%).
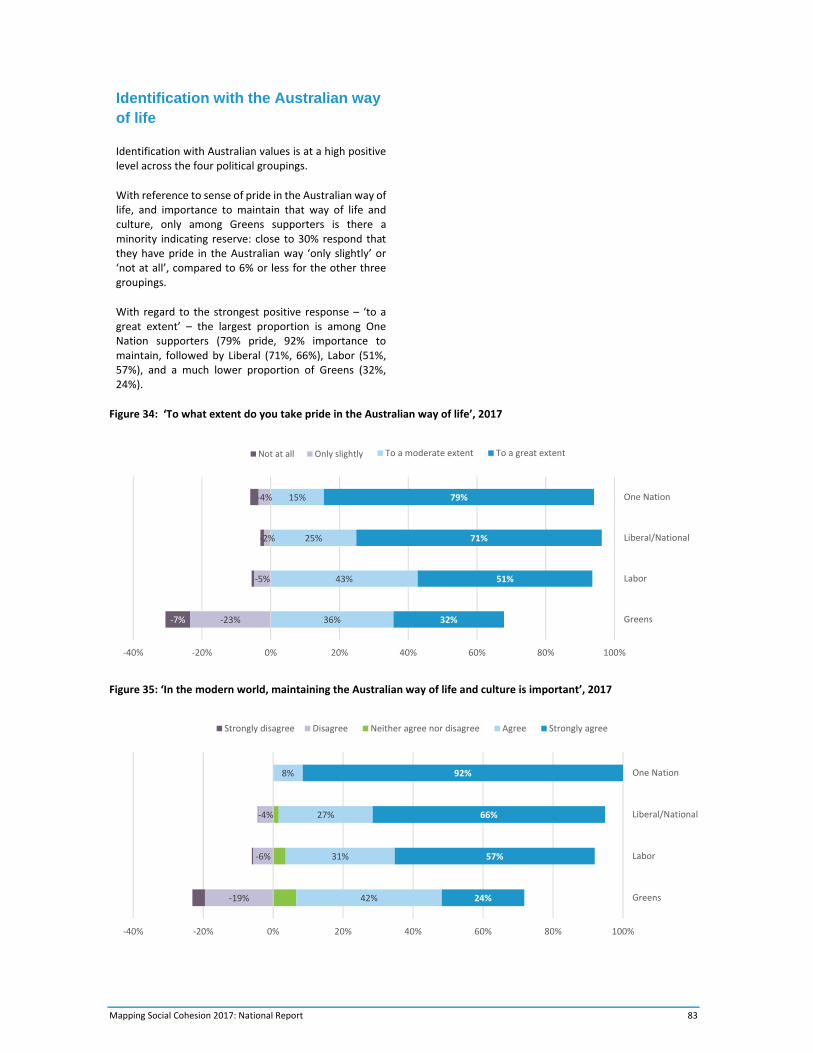
Mapping Social Cohesion 2017: National Report 83
Figure 34: ‘To what extent do you take pride in the Australian way of life’, 2017
Figure 35: ‘In the modern world, maintaining the Australian way of life and culture is important’, 2017
‐23%
‐5%
‐2%
‐4%
‐7% 36%
43%
25%
15%
32%
51%
71%
79%
‐40% ‐20% 0% 20% 40% 60% 80% 100%
Greens
Labor
Liberal/National
One Nation
To a moderate extent To a great extent
‐19%
‐6%
‐4%
42%
31%
27%
8%
24%
57%
66%
92%
‐40% ‐20% 0% 20% 40% 60% 80% 100%
Greens
Labor
Liberal/National
One Nation
DisagreeStrongly disagree Neither agree nor disagree Agree Strongly agree
Identification with the Australian way of life
Identification with Australian values is at a high positive level across the four political groupings.
With reference to sense of pride in the Australian way of life, and importance to maintain that way of life and culture, only among Greens supporters is there a minority indicating reserve: close to 30% respond that they have pride in the Australian way ‘only slightly’ or ‘not at all’, compared to 6% or less for the other three groupings.
With regard to the strongest positive response – ‘to a great extent’ – the largest proportion is among One Nation supporters (79% pride, 92% importance to maintain, followed by Liberal (71%, 66%), Labor (51%, 57%), and a much lower proportion of Greens (32%, 24%).
Only slightlyNot at all
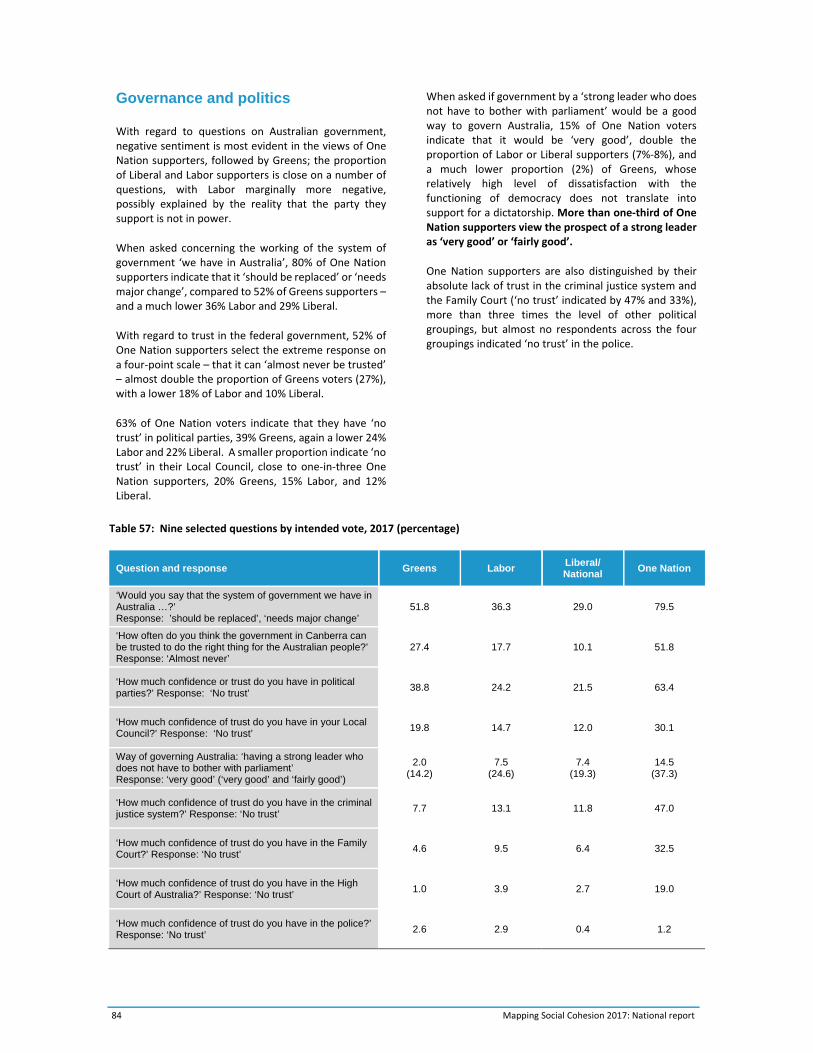
84 Mapping Social Cohesion 2017: National report
Table 57: Nine selected questions by intended vote, 2017 (percentage)
Question and response Greens Labor Liberal/ National
One Nation
‘Would you say that the system of government we have in Australia …?’ Response: ’should be replaced’, ‘needs major change’
51.8 36.3 29.0 79.5
‘How often do you think the government in Canberra can be trusted to do the right thing for the Australian people?’ Response: ‘Almost never’
27.4 17.7 10.1 51.8
‘How much confidence or trust do you have in political parties?’ Response: ‘No trust’
38.8 24.2 21.5 63.4
‘How much confidence of trust do you have in your Local Council?’ Response: ‘No trust’
19.8 14.7 12.0 30.1
Way of governing Australia: ‘having a strong leader who does not have to bother with parliament’ Response: ‘very good’ (‘very good’ and ‘fairly good’)
2.0 (14.2)
7.5 (24.6)
7.4 (19.3)
14.5 (37.3)
‘How much confidence of trust do you have in the criminal justice system?’ Response: ‘No trust’
7.7 13.1 11.8 47.0
‘How much confidence of trust do you have in the Family Court?’ Response: ‘No trust’
4.6 9.5 6.4 32.5
‘How much confidence of trust do you have in the High Court of Australia?’ Response: ‘No trust’
1.0 3.9 2.7 19.0
‘How much confidence of trust do you have in the police?’ Response: ‘No trust’
2.6 2.9 0.4 1.2
Governance and politics
With regard to questions on Australian government, negative sentiment is most evident in the views of One Nation supporters, followed by Greens; the proportion of Liberal and Labor supporters is close on a number of questions, with Labor marginally more negative, possibly explained by the reality that the party they support is not in power.
When asked concerning the working of the system of government ‘we have in Australia’, 80% of One Nation supporters indicate that it ‘should be replaced’ or ‘needs major change’, compared to 52% of Greens supporters – and a much lower 36% Labor and 29% Liberal.
With regard to trust in the federal government, 52% of One Nation supporters select the extreme response on a four‐point scale – that it can ‘almost never be trusted’ – almost double the proportion of Greens voters (27%), with a lower 18% of Labor and 10% Liberal.
63% of One Nation voters indicate that they have ‘no trust’ in political parties, 39% Greens, again a lower 24% Labor and 22% Liberal. A smaller proportion indicate ‘no trust’ in their Local Council, close to one‐in‐three One Nation supporters, 20% Greens, 15% Labor, and 12% Liberal.
When asked if government by a ‘strong leader who does not have to bother with parliament’ would be a good way to govern Australia, 15% of One Nation voters indicate that it would be ‘very good’, double the proportion of Labor or Liberal supporters (7%‐8%), and a much lower proportion (2%) of Greens, whose relatively high level of dissatisfaction with the functioning of democracy does not translate into support for a dictatorship. More than one‐third of One Nation supporters view the prospect of a strong leader as ‘very good’ or ‘fairly good’.
One Nation supporters are also distinguished by their absolute lack of trust in the criminal justice system and the Family Court (‘no trust’ indicated by 47% and 33%), more than three times the level of other political groupings, but almost no respondents across the four groupings indicated ‘no trust’ in the police.
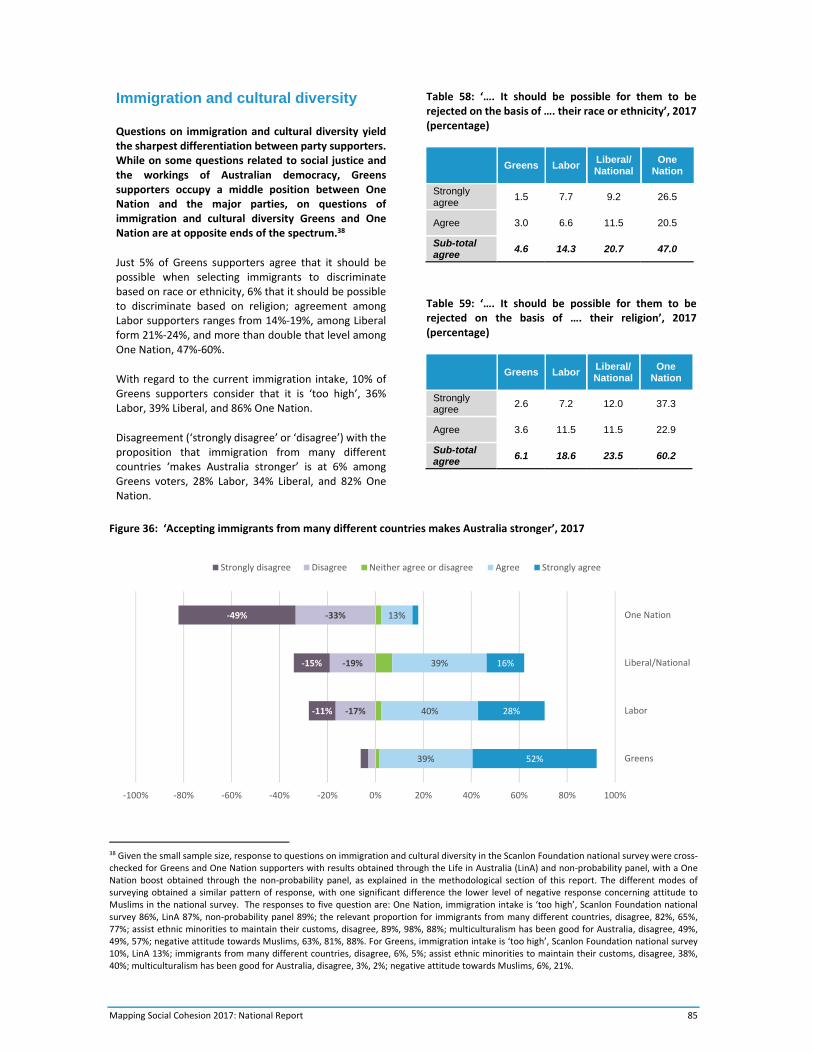
Mapping Social Cohesion 2017: National Report 85
Figure 36: ‘Accepting immigrants from many different countries makes Australia stronger’, 2017
38 Given the small sample size, response to questions on immigration and cultural diversity in the Scanlon Foundation national survey were cross‐checked for Greens and One Nation supporters with results obtained through the Life in Australia (LinA) and non‐probability panel, with a One Nation boost obtained through the non‐probability panel, as explained in the methodological section of this report. The different modes of surveying obtained a similar pattern of response, with one significant difference the lower level of negative response concerning attitude to Muslims in the national survey. The responses to five question are: One Nation, immigration intake is ‘too high’, Scanlon Foundation national survey 86%, LinA 87%, non‐probability panel 89%; the relevant proportion for immigrants from many different countries, disagree, 82%, 65%, 77%; assist ethnic minorities to maintain their customs, disagree, 89%, 98%, 88%; multiculturalism has been good for Australia, disagree, 49%, 49%, 57%; negative attitude towards Muslims, 63%, 81%, 88%. For Greens, immigration intake is ‘too high’, Scanlon Foundation national survey 10%, LinA 13%; immigrants from many different countries, disagree, 6%, 5%; assist ethnic minorities to maintain their customs, disagree, 38%, 40%; multiculturalism has been good for Australia, disagree, 3%, 2%; negative attitude towards Muslims, 6%, 21%.
‐17%
‐19%
‐33%
‐11%
‐15%
‐49%
39%
40%
39%
13%
52%
28%
16%
‐100% ‐80% ‐60% ‐40% ‐20% 0% 20% 40% 60% 80% 100%
Greens
Labor
Liberal/National
One Nation
DisagreeStrongly disagree Neither agree or disagree Agree Strongly agree
Immigration and cultural diversity
Questions on immigration and cultural diversity yield the sharpest differentiation between party supporters. While on some questions related to social justice and the workings of Australian democracy, Greens supporters occupy a middle position between One Nation and the major parties, on questions of immigration and cultural diversity Greens and One Nation are at opposite ends of the spectrum.38
Just 5% of Greens supporters agree that it should be possible when selecting immigrants to discriminate based on race or ethnicity, 6% that it should be possible to discriminate based on religion; agreement among Labor supporters ranges from 14%‐19%, among Liberal form 21%‐24%, and more than double that level among One Nation, 47%‐60%.
With regard to the current immigration intake, 10% of Greens supporters consider that it is ‘too high’, 36% Labor, 39% Liberal, and 86% One Nation.
Disagreement (‘strongly disagree’ or ‘disagree’) with the proposition that immigration from many different countries ‘makes Australia stronger’ is at 6% among Greens voters, 28% Labor, 34% Liberal, and 82% One Nation.
Table 58: ‘…. It should be possible for them to be rejected on the basis of …. their race or ethnicity’, 2017 (percentage)
Greens Labor Liberal/ National
One Nation
Strongly agree
1.5 7.7 9.2 26.5
Agree 3.0 6.6 11.5 20.5
Sub-total agree
4.6 14.3 20.7 47.0
Table 59: ‘…. It should be possible for them to be rejected on the basis of …. their religion’, 2017 (percentage)
Greens Labor Liberal/ National
One Nation
Strongly agree
2.6 7.2 12.0 37.3
Agree 3.6 11.5 11.5 22.9
Sub-total agree
6.1 18.6 23.5 60.2
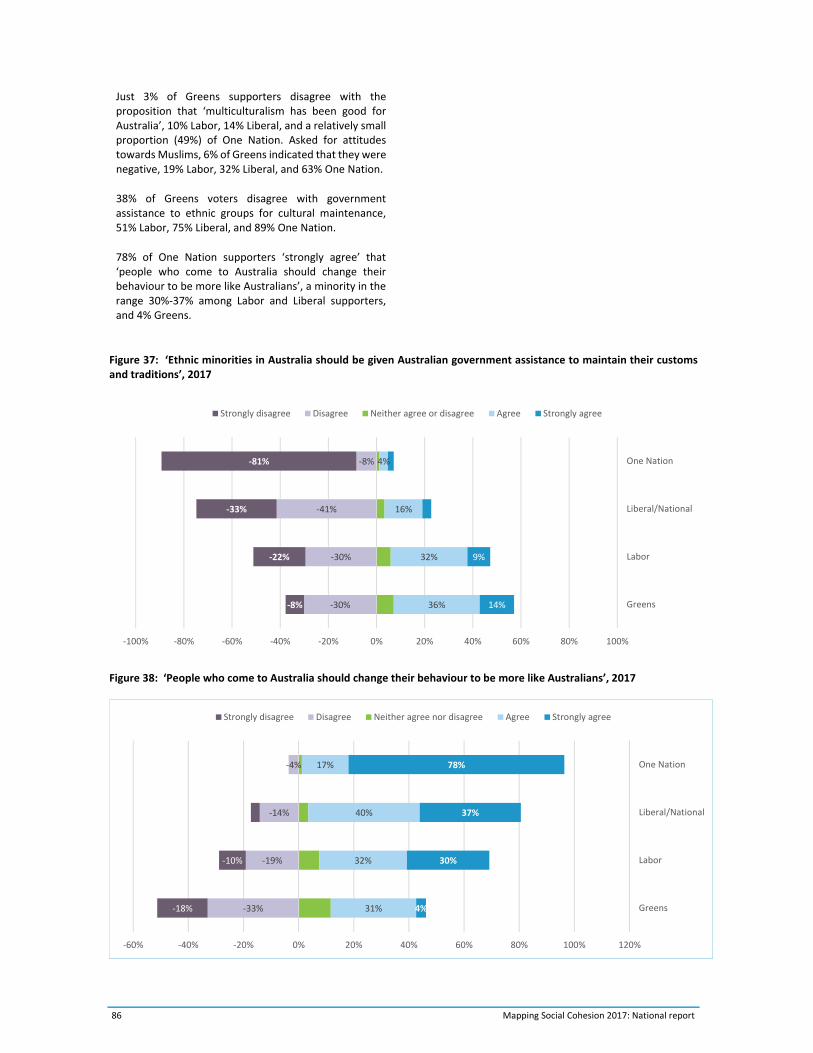
86 Mapping Social Cohesion 2017: National report
Figure 37: ‘Ethnic minorities in Australia should be given Australian government assistance to maintain their customs and traditions’, 2017
Figure 38: ‘People who come to Australia should change their behaviour to be more like Australians’, 2017
‐30%
‐30%
‐41%
‐8%
‐8%
‐22%
‐33%
‐81%
36%
32%
16%
4%
14%
9%
‐100% ‐80% ‐60% ‐40% ‐20% 0% 20% 40% 60% 80% 100%
Greens
Labor
Liberal/National
One Nation
DisagreeStrongly disagree Neither agree or disagree Agree Strongly agree
‐33%
‐19%
‐14%
‐4%
‐18%
‐10%
31%
32%
40%
17%
4%
30%
37%
78%
‐60% ‐40% ‐20% 0% 20% 40% 60% 80% 100% 120%
Greens
Labor
Liberal/National
One Nation
DisagreeStrongly disagree Neither agree nor disagree Agree Strongly agree
Just 3% of Greens supporters disagree with the proposition that ‘multiculturalism has been good for Australia’, 10% Labor, 14% Liberal, and a relatively small proportion (49%) of One Nation. Asked for attitudes towards Muslims, 6% of Greens indicated that they were negative, 19% Labor, 32% Liberal, and 63% One Nation.
38% of Greens voters disagree with government assistance to ethnic groups for cultural maintenance, 51% Labor, 75% Liberal, and 89% One Nation.
78% of One Nation supporters ‘strongly agree’ that ‘people who come to Australia should change their behaviour to be more like Australians’, a minority in the range 30%‐37% among Labor and Liberal supporters, and 4% Greens.
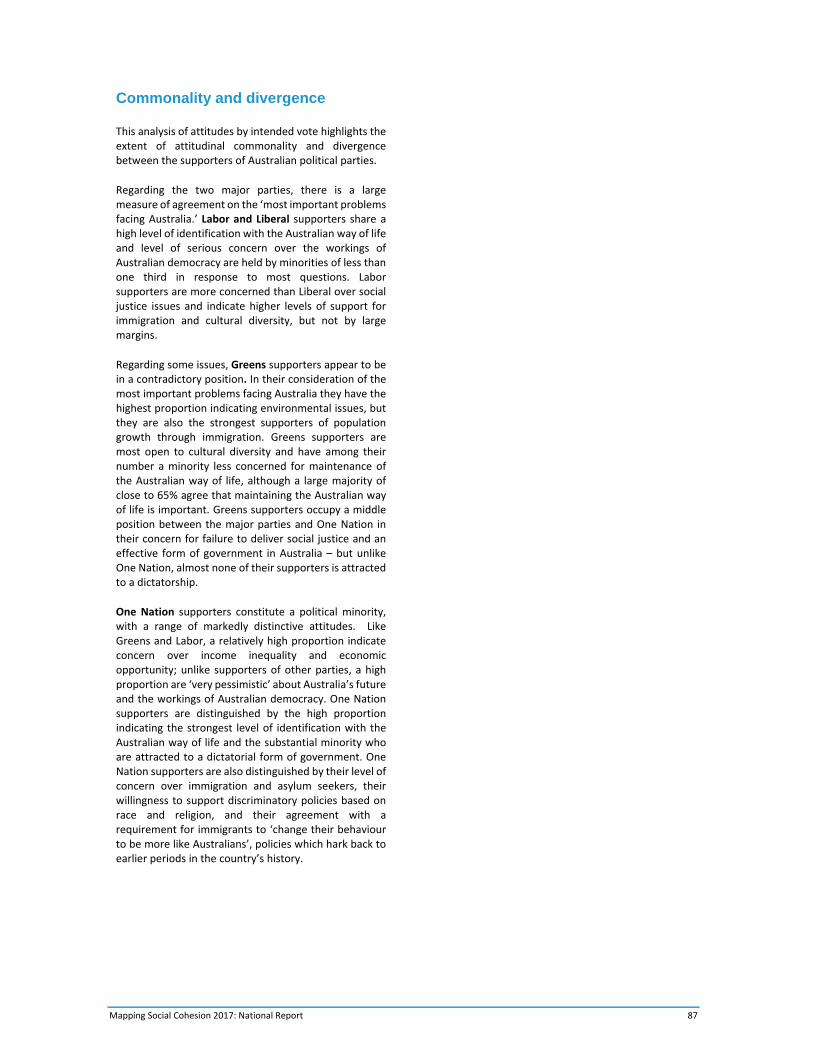
Mapping Social Cohesion 2017: National Report 87
Commonality and divergence
This analysis of attitudes by intended vote highlights the extent of attitudinal commonality and divergence between the supporters of Australian political parties.
Regarding the two major parties, there is a large measure of agreement on the ‘most important problems facing Australia.’ Labor and Liberal supporters share a high level of identification with the Australian way of life and level of serious concern over the workings of Australian democracy are held by minorities of less than one third in response to most questions. Labor supporters are more concerned than Liberal over social justice issues and indicate higher levels of support for immigration and cultural diversity, but not by large margins.
Regarding some issues, Greens supporters appear to be in a contradictory position. In their consideration of the most important problems facing Australia they have the highest proportion indicating environmental issues, but they are also the strongest supporters of population growth through immigration. Greens supporters are most open to cultural diversity and have among their number a minority less concerned for maintenance of the Australian way of life, although a large majority of close to 65% agree that maintaining the Australian way of life is important. Greens supporters occupy a middle position between the major parties and One Nation in their concern for failure to deliver social justice and an effective form of government in Australia – but unlike One Nation, almost none of their supporters is attracted to a dictatorship.
One Nation supporters constitute a political minority, with a range of markedly distinctive attitudes. Like Greens and Labor, a relatively high proportion indicate concern over income inequality and economic opportunity; unlike supporters of other parties, a high proportion are ‘very pessimistic’ about Australia’s future and the workings of Australian democracy. One Nation supporters are distinguished by the high proportion indicating the strongest level of identification with the Australian way of life and the substantial minority who are attracted to a dictatorial form of government. One Nation supporters are also distinguished by their level of concern over immigration and asylum seekers, their willingness to support discriminatory policies based on race and religion, and their agreement with a requirement for immigrants to ‘change their behaviour to be more like Australians’, policies which hark back to earlier periods in the country’s history.
88 Mapping Social Cohesion 2017: National report
BALANCE OF AUSTRALIAN OPINION
All populations are made up of people with diverse personalities and views ranging, for example, from the tolerant to the intolerant – from those who celebrate cultural diversity to those who are comfortable only with what they perceive to be Australian culture.
The following analysis seeks to provide a balanced understanding of Australian opinion: the relative proportions of the strongly negative, strongly positive, and those in the middle who are not committed to a firm position. There are, however, no simple answers and results are nuanced.
The broad range of questions in the Scanlon Foundation surveys provide a number of perspectives for determining the balance of opinion in Australian society. The following analysis considers eight questions which dealt with immigration and cultural diversity in the 2015‐2017 surveys, most of them requiring response to a statement. Only questions with a five‐point response scale (ranging from strongly agree to strongly disagree) are included.
The eight questions used for the 2017 calculation are:
1. ‘Accepting immigrants from many different countries makes Australia stronger.’
2. ‘Ethnic minorities in Australia should be given Australian government assistance to maintain their customs and traditions.’
3. ‘Multiculturalism has been good for Australia.’
4. ‘We should do more to learn about the customs and heritage of different ethnic and cultural groups in this country.’
5. ‘Is your personal attitude positive, negative, or neutral towards Buddhists?’
6. ‘Is your personal attitude positive, negative, or neutral towards Muslims?’
7. ‘My local area is a place where people from different national or ethnic backgrounds get on well together.’
8. ‘People who come to Australia should change their behaviour to be more like Australians.’ (reverse scored)
The first part of the analysis involves calculating the average for the eight questions. The average was calculated for the extreme points (‘strongly agree’, ‘strongly disagree’) and the middle, those indicating a second level response (‘agree’, ‘disagree’) or a neutral response (‘neither agree nor disagree’). Results are presented in the following table:
Table 60: Eight selected questions, average score, 2015‐2017 (percentage)
Strong negative Middle Strong positive
2015 2016 2017 2015 2016 2017 2015 2016 2017
Average 11.1 13.0 13.0 66.2 62.4 64.1 20.8 22.3 20.4
Mapping Social Cohesion 2017: National Report 89
The results obtained indicate a high level of consistency across the three surveys – the strong negative has ranged from 11% to 13%; the strong positive from 21%‐22%, and the middle ground from 62%‐66%. An additional 3% to 4% of respondents declined to answer or did not know. There has been a marginal increase at the strong negative level of two percentage points. The shift in relative proportions may be more significant: the gap between the strong negative/ strong positive response has narrowed from 11%/21% in 2015 to 13%/20% in 2017. This gap is much smaller in the Life in Australia survey.
Five of the eight questions (numbers 1, 2, 3, 5, and 6) are common to both the telephone administered survey and the Life in Australia panel. The same pattern of response is obtained when the questions common to both surveys are compared: the major difference is in the proportion indicating a strong positive response, down from 21% to 15%. The strong negative response is one percentage point higher and the middle ground four percentage points higher. The relative proportion of strong negative to strong positive response is 13% to 15%.
Table 61: Five selected questions, Scanlon Foundation social cohesion survey and Life in Australia surveys compared, 2017 (percentage)
Survey Strong
negative Middle
Strong positive
Scanlon Foundation social cohesion
11.9 64.3 21.4
Life in Australia 13.3 68.5 14.9
Difference +1.4 +4.2 –6.5
Thematic groupings
The eight questions on immigration and cultural diversity common to the 2015‐2017 Scanlon Foundation social cohesion surveys, and two additional questions common to the 2015 and 2017 surveys, yields four thematic groupings.
[1] The lowest level of negative response is to questions concerning local areas and multiculturalism. Across the three surveys, for the question on neighbourhood the strongly negative has been in the range 2%‐3%, the strongly positive in the range 24%‐28%. The largest proportion, in the middle, tends to the positive. In response to the question on multiculturalism, the strongly negative has been 4%‐5%, strongly positive 41‐43%, and those with less firmly held views again tending to the positive.
[2] Questions on discrimination in immigrant selection on the basis of race or ethnicity, or religion, on the value of a diverse immigration intake, and integration of immigrants, finds 7%‐13% strongly negative, 22%‐48% strongly positive, with a substantial minority or majority in the middle and tending to the positive.
[3] Attitudes towards those of the Muslim faith finds more evenly divided opinion: 11%‐14% are strongly negative, a smaller proportion, 9%‐10% strongly positive, with the large majority indicating a mid‐range response. As has been noted, in the self‐completion Life in Australia survey, a higher proportion indicate a negative response. These proportions are in marked contrast with the less than 5% indicating a strong negative attitude towards Buddhists.
[4] General statements, which may be interpreted as a rejection of cultural diversity find relatively high levels in agreement, over one in four respondents. Thus when presented with the proposition that immigrants ‘should change their behaviour to be more like Australians’, 27%‐30% ‘strongly agree’; a similar proportion (25%‐29%) strongly oppose government assistance to ethnic minorities for cultural maintenance.
This analysis demonstrates that there is no simple or definitive determination of the balance of Australian opinion: answers are dependent on specific questions and approach to analysis, including mode of surveying.
Australian opinion, however, remains distinctive in the majority support for immigration, a diverse immigration intake, and multiculturalism – in contrast with opinion in the majority of western countries.
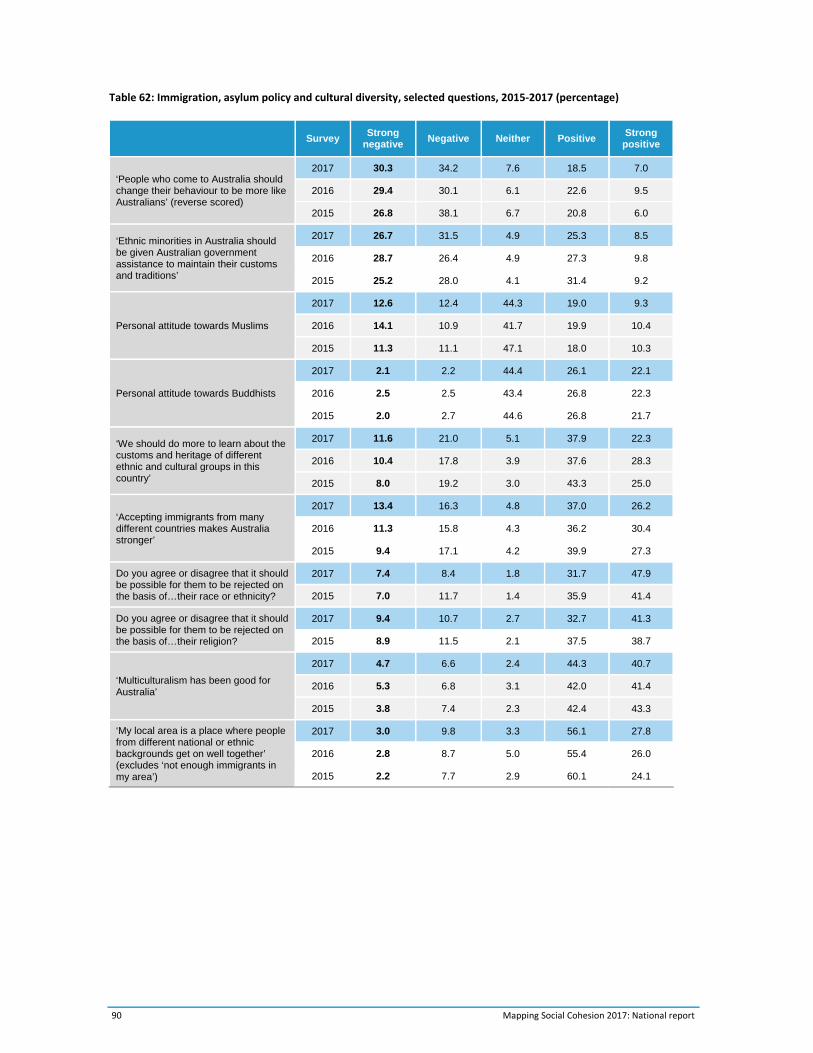
90 Mapping Social Cohesion 2017: National report
Table 62: Immigration, asylum policy and cultural diversity, selected questions, 2015‐2017 (percentage)
Survey Strong
negative Negative Neither Positive
Strong positive
‘People who come to Australia should change their behaviour to be more like Australians’ (reverse scored)
2017 30.3 34.2 7.6 18.5 7.0
2016 29.4 30.1 6.1 22.6 9.5
2015 26.8 38.1 6.7 20.8 6.0
‘Ethnic minorities in Australia should be given Australian government assistance to maintain their customs and traditions’
2017 26.7 31.5 4.9 25.3 8.5
2016 28.7 26.4 4.9 27.3 9.8
2015 25.2 28.0 4.1 31.4 9.2
Personal attitude towards Muslims
2017 12.6 12.4 44.3 19.0 9.3
2016 14.1 10.9 41.7 19.9 10.4
2015 11.3 11.1 47.1 18.0 10.3
Personal attitude towards Buddhists
2017 2.1 2.2 44.4 26.1 22.1
2016 2.5 2.5 43.4 26.8 22.3
2015 2.0 2.7 44.6 26.8 21.7
‘We should do more to learn about the customs and heritage of different ethnic and cultural groups in this country’
2017 11.6 21.0 5.1 37.9 22.3
2016 10.4 17.8 3.9 37.6 28.3
2015 8.0 19.2 3.0 43.3 25.0
‘Accepting immigrants from many different countries makes Australia stronger’
2017 13.4 16.3 4.8 37.0 26.2
2016 11.3 15.8 4.3 36.2 30.4
2015 9.4 17.1 4.2 39.9 27.3
Do you agree or disagree that it should be possible for them to be rejected on the basis of…their race or ethnicity?
2017 7.4 8.4 1.8 31.7 47.9
2015 7.0 11.7 1.4 35.9 41.4
Do you agree or disagree that it should be possible for them to be rejected on the basis of…their religion?
2017 9.4 10.7 2.7 32.7 41.3
2015 8.9 11.5 2.1 37.5 38.7
‘Multiculturalism has been good for Australia’
2017 4.7 6.6 2.4 44.3 40.7
2016 5.3 6.8 3.1 42.0 41.4
2015 3.8 7.4 2.3 42.4 43.3
‘My local area is a place where people from different national or ethnic backgrounds get on well together’ (excludes ‘not enough immigrants in my area’)
2017 3.0 9.8 3.3 56.1 27.8
2016 2.8 8.7 5.0 55.4 26.0
2015 2.2 7.7 2.9 60.1 24.1
Mapping Social Cohesion 2017: National Report 91
Acknowledgements
This project has been made possible with the financial support and vision of the Scanlon Foundation. The author is particularly grateful to Mr Peter Scanlon, Chairman, and Ms Anthea Hancocks, Chief Executive Officer of the Scanlon Foundation, for the support provided. The support of Mr Tony Fry, past Chief Executive Officer of the Scanlon Foundation, is also gratefully acknowledged.
In the initial planning and implementation of this project during 2006‐07, Emeritus Professor John Nieuwenhuysen, then of Monash University, and Dr Hass Dellal, Executive Director, Australian Multicultural Foundation, played key roles.
Mr Bruce Smith, independent consultant and Fellow of the Australian Market and Social Research Society, has been involved in the project from its inception and has provided sound advice and support at all stages of the project implementation, data analysis and interpretation.
Mr Bruce Smith, Adjunct Professor Darren Pennay, CEO Social Research Centre, and Emeritus Professor John Nieuwenhuysen provided comment on the draft of this report.
Ms Tanya Munz assisted with research and data analysis and formatted this publication.
Administration of the national survey was undertaken by The Social Research Centre. The SRC provided expert advice during project planning and developed and applied the survey weight.
Monash University provides the research environment that sustains this project.
Credits
Professor Andrew Markus is the Pratt Foundation Research Professor in the School of Historical, International and Philosophical Studies, Monash University, and a Fellow of the Academy of the Social Sciences in Australia. He has authored the annual Scanlon Foundation social cohesion reports since the project’s establishment in 2007 and has published extensively in the field of Australian indigenous and immigration history. His publications include Australia’s Immigration Revolution (Allen & Unwin, Sydney 2009), co‐authored with James Jupp and Peter McDonald; Race: John Howard and the Remaking of Australia (Allen & Unwin, Sydney, 2001) and Building a New Community: Immigration and the Victorian Economy (editor, Allen & Unwin, Sydney, 2001).
The Scanlon Foundation is a member of Philanthropy Australia, the national membership organisation for grant‐making trusts and foundations. Established in June 2001, the Foundation’s mission to support ‘the advance of Australia as a welcoming, prosperous and cohesive nation’ has led to the support of a number of social cohesion research projects, including this tenth survey of social cohesion in Australia.
The Australian Multicultural Foundation was established in 1989 as a legacy of Australia’s Bicentenary, to promote an awareness among the people of Australia of the diversity of cultures, and the contributions made by those from different backgrounds to the development of Australia’s social, cultural and economic wellbeing, by adopting issues of national significance and initiating projects in any worthwhile field or activity to the benefit of the community.

Mapping Social Cohesion The Scanlon Foundation surveys 2015
Professor Andrew Markus
Mapping Social Cohesion The Australia@2015 survey
Professor Andrew Markus
Mapping Social Cohesion The Scanlon Foundation surveys 2015
Professor Andrew Markus
Professor Andrew Markus