Embed Size (px)
Citation preview
THE SCALE OF UK HIGHER EDUCATION
TRANSNATIONAL EDUCATION 2015–16
TREND ANALySIS OF HESA DATA
ExECUTIvE SUmmARy 2
1. INTRODUCTION 3
2. 2015–16 AGGREGATE OFFSHORE RECORD OvERvIEw 6
3. UK HE TNE HOST COUNTRIES 12 4. INSIGHTS by REGION 20
Africa 20 Asia 25 Australasia 30 European Union 34 Europe (non-EU) 39 Middle East 44 North America 49 South America 54
5. CONCLUSION 59
CONTENTS
1 THE SCALE OF UK HIGHER EDUCATION TRANSNATIONAL EDUCATION 2015–16
UNIvERSITIES UK INTERNATIONALUUKi is the international arm of Universities UK, representing UK universities and acting in their collective interests globally . We actively promote universities abroad, provide trusted informa tion for and about them, and create new opportunities for the sector.
TExT AND ANALySIS by LEO bOE JANUARy 2018 ISbN: 978-1-84036-393-7
ExECUTIvE SUmmARy Higher education transnational education (HE TNE) is an increasingly significant and successful characteristic of UK universities’ international activity.Over 700,000 students were studying for UK degrees outside the UK in 2015-16, which is 1.6 times the number of international students in the UK in the same year. Universities, sector agencies and the UK government are prioritising TNE as a growing area of activity. This report, the first of its kind, provides analysis on where UK HE TNE students are studying, at what level, through what kind of provision at global and regional levels.
The UK’s UK HE TNE provision in 2015 –16:1
• 701,010 students were studying UK HE TNE programmes.
• UK HE TNE student numbers grew by 17% from 2012-13 to 2015-16. The growth rate from 2014-15 to 2015-16 grew slightly to 5.3% from 4.3% between 2013-14 and 2014-15.2
• The growth rate excluding Oxford Brookes University BSc Applied Accounting was 1.4%, a decrease in the rate of change from 2013-14 to 2014-15 of 7.1%.
• 82% of UK universities delivered UK HE TNE.
• 75% of UK HE TNE students were enrolled in a programme delivered by or associated with 11% of UK universities.
• 23 UK universities hosted more than 5,000 TNE students, an increase from 18 in 2012. 82% of all TNE students attended these universities.
• 44% of students were studying through collaborative provision, 25% were studying through the reporting provider, 20% through distance, flexible or distributed learning, 8% through overseas campuses and 3% through other provision.
• 65% of students were undergraduates and 35% were postgraduates.
Host countries for UK HE TNE students in 2015-16:3
• The 10 countries hosting the highest numbers of students in 2015-16 were the same as in 2014-15, although the order is slightly different. In both years Malaysia and Singapore hosted the highest number of students (78,850 and 49,970 in 2015–16 respectively).
• Of the 20 countries hosting the most students, 7 are in Asia, 6 are in MENA, 4 are in Europe and 3 are in the Americas showing take-up of UK HE TNE across mature and emerging economies.
• 76% of students are on programmes in the 20 countries with the highest volume of TNE students.
• South America had the highest average year on year growth from 2012-13 to 2015-16 (12.6%) although there was no change from 2013-14 to 2015-16. North America had the lowest (1.7%) year on year growth rate and saw a 0.8% decrease in student numbers from 2014-15 to 2015-16. Student numbers fell by 5% in non-EU Europe over the same period.
1. Excluding Oxford Brookes University BSc in Applied Accounting students unless otherwise stated. 2. Including Oxford Brookes BSc Applied Accounting students. 3. Excluding Oxford Brookes University BSc in Applied Accounting students unless otherwise stated.
2 THE SCALE OF UK HIGHER EDUCATION TRANSNATIONAL EDUCATION 2015–16 Executive summary
1. INTRODUCTION This report provides an update on the analysis included in The Scale and Scope of UK Higher Education Transnational Education Report which related to 2014-15 UK HE TNE student numbers. This report includes, for the first time, a detailed analysis of regional trends according to the Higher Education Statistics Agency’s Aggregate Offshore Record (HESA AOR) data.
UK HE TNE is growing and diversifying and UK universities are partners of choice for TNE globally. With over 700,000 TNE students, UK universities are delivering high quality programmes complemented by strong assessment processes and pedagogical approaches around the world. UK HE TNE is integral to the internationalisation of the UK higher education sector which contributes to universities’ excellence and international reputation.
UK HE TNE is growing in scale and strategic importance; latest data from HESA’s snapshot Higher Education Statistics 2016-17 Summary4 shows that 707,9155 students were studying for UK degrees overseas and that 138 UK universities were delivering UK HE TNE, more than the previous year. These figures have only increased year on year since 2007-08. Comprehensive data for the previous year showed that 701,010 TNE students were studying through 132 UK universities for awards in 224 countries and territories, a growth of 17% from 2012-13. In 2014-15 TNE had an estimated value of £550m to the UK economy. The reasons that universities deliver TNE are many. It can be the origin of, or the catalyst for deeper international partnerships, including mobility, research and innovation links. They can be financial: TNE is pursued where it is at least a financially sustainable endeavour. They can be strategic: supporting capacity building in-country can lead to strong relationships with policy makers and industry. They can increase international student recruitment by creating a pathway for students to pursue further study physically in the UK.
From a policy perspective, UK HE TNE in part cements bilateral education relationships. The validity of UK issued awards, the ability for universities to deliver diverse types of TNE in-country, and the important partnerships which underpin TNE programmes support UK Government objectives to increase meaningful links between people, sectors and industry. The UK sector’s capacity to deliver context-sensitive, relevant and demand-driven courses through relevant and accessible methods of delivery aim to complement the fabric of domestic higher education systems.
As a result of TNE’s increased profile in the sector, sector agencies and within Government, there is an interest in better understanding UK universities’ performance as a sector and knowing which students are accessing UK degrees outside of the UK, at what level, and where. This report details what we know about UK HE TNE in 2015-16 as well as trends over the last few years. Through providing the first deep-dive analysis of HESA data, this report includes insights into what is happening at a regional level. In providing this level of detail, it complements other resources (for example the British Council’s Global Gauge of Higher Education Policy (March 2017)6) and studies (for example the Department for Education’s Education-related exports and transnational education activity from 2010 to 2014 (July 2017)7) to support universities, higher education sector bodies and relevant government departments to understand what the next steps for TNE might be.
This report is divided into three sections. It begins by highlighting how universities are performing in terms of UK HE TNE student numbers, including what type of provision students are studying through and at what level of study. This is followed by a summary of the global picture and includes the spread of students across regions, type and level of study. Finally, the third section delves into UK HE TNE patterns across the eight regions of the world. 4. https://www.hesa.ac.uk/news/11-01-2018/sfr247-higher-education-studentstatistics/location 5. Data retrieved in January 2018 did not include breakdowns by region or institution. At the time of publication it was
therefore not possible to compare 2016-17 data with previous years. 6. https://www.britishcouncil.org/education/ihe/knowledge-centre/global-landscape/global-gauge 7. https://www.gov.uk/government/uploads/system/uploads/attachment_data/file/630741/UK_Revenue_from_
Educational_Exports_2010-14.pdf
3 THE SCALE OF UK HIGHER EDUCATION TRANSNATIONAL EDUCATION 2015–16 Introduction
A NOTE ON DEFINITIONSHigher education TNE activity is the delivery of degrees in a country other than where the awarding institution is based. It can include but is not limited to overseas campuses, distance learning, online provision, joint and dual degree programmes, ‘fly-in’ faculty, and mixed models, traditionally referred to as blended learning.
For the purposes of this report, UK HE TNE students are defined as students studying a higher education degree programme leading to a UK qualification in a country other than the one in which the awarding institution is located. This includes joint, double or dual awards.
Data about the UK’s HE TNE is collected annually by the Higher Education Statistics Agency (HESA) via the Aggregate Offshore Record (AOR). AOR data has been collected since 2007–08 from subscribing UK higher education providers. Universities return data about “students that are studying wholly outside the UK who are either registered with the reporting provider or who are studying for an award of the reporting provider.”8
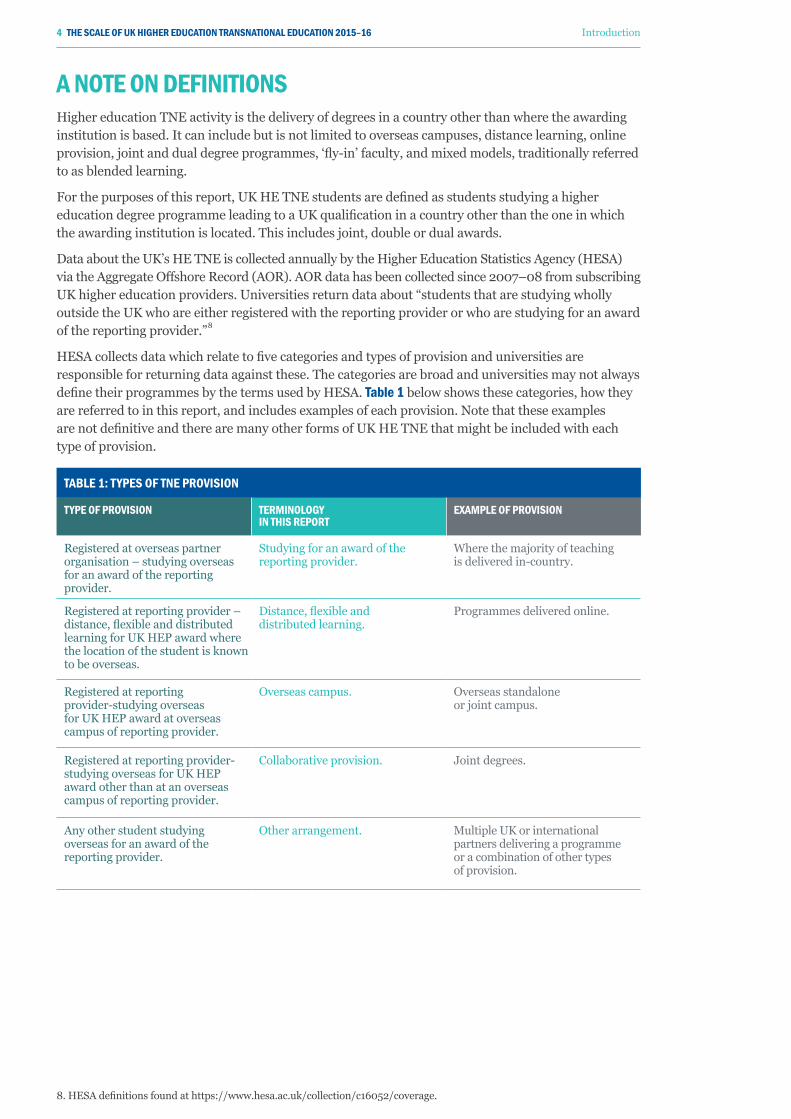
HESA collects data which relate to five categories and types of provision and universities are responsible for returning data against these. The categories are broad and universities may not always define their programmes by the terms used by HESA. Table 1 below shows these categories, how they are referred to in this report, and includes examples of each provision. Note that these examples are not definitive and there are many other forms of UK HE TNE that might be included with each type of provision.
TAbLE 1: TypES OF TNE pROvISION
TypE OF pROvISION TERmINOLOGy IN THIS REpORT
ExAmpLE OF pROvISION
Registered at overseas partner organisation – studying overseas for an award of the reporting provider.
Studying for an award of the reporting provider.
Where the majority of teaching is delivered in-country.
Registered at reporting provider – distance, flexible and distributed learning for UK HEP award where the location of the student is known to be overseas.
Distance, flexible and distributed learning.
Programmes delivered online.
Registered at reporting provider-studying overseas for UK HEP award at overseas campus of reporting provider.
Overseas campus. Overseas standalone or joint campus.
Registered at reporting provider-studying overseas for UK HEP award other than at an overseas campus of reporting provider.
Collaborative provision. Joint degrees.
Any other student studying overseas for an award of the reporting provider.
Other arrangement. Multiple UK or international partners delivering a programme or a combination of other types of provision.
8. HESA definitions found at https://www.hesa.ac.uk/collection/c16052/coverage.
4 THE SCALE OF UK HIGHER EDUCATION TRANSNATIONAL EDUCATION 2015–16 Introduction
mETHODOLOGy AND LImITATIONS This report is based on analysis of the 2015-16 HESA AOR and was carried out in the summer of 2017. 132 universities returned TNE activity to the AOR.
This includes “all students active at any point in the reporting period, including students becoming dormant part way through the year, and those withdrawing from courses.” Universities return figures into specified categories including location, level and type of study. HESA does not collect non-aggregated data, for example student demographics or subject of study. The data therefore does not go into the same depth as Student Record data which is used to analyse student numbers studying in the UK.
The AOR is limited for three principle reasons. Firstly, universities are not asked to return subject-specific or demographic data which, if included, would provide universities with a much clearer picture of how they are performing compared to the sector as a whole. Secondly, respondents may interpret the “type of study” field differently, potentially resulting in inconsistent coding of data, which limits the reliability of this data for making comparisons between universities. Thirdly, UK HE institutions undertake some activity overseas which is not captured within the coverage of the AOR. This analysis is based on the figures returned to HESA by universities and may therefore not reflect the full picture of UK HE TNE.
Unless otherwise stated in this report, analysis excludes Oxford Brookes University BSc in Applied Accounting, Open University (OU) and University of London International Programme (UoLIP) students. Together the programmes offered in these three groups make up 55% of the 2015-16 AOR and are all categorised as ‘distance, flexible or distributed learning’ which can include blended delivery models. This affects our understanding of performance and spread of TNE more generally amongst UK universities. Throughout this report, these institutions are referred to as ‘the three main distance and blended providers’ for simplicity.
Students on Oxford Brookes’ BSc in Applied Accounting programme9 make up 45% of all UK HE TNE students. The programme is a professionally accredited programme delivered in partnership with the Association of Chartered Certified Accountants. According to a UK sector survey in 2016, only around one in ten programmes (9% of programmes or 15% of students)10 are professionally accredited. These tend to be either solely UK or global professional standards most commonly the AACS (Association to Advance Collegiate Schools of Business). Students who wish to undertake a professionally qualifying Accounting programme internationally therefore must study for ACCA exams through Oxford Brookes University.
All HESA figures quoted in the report that relate to student and staff numbers have been rounded to the nearest five in accordance with HESA data protection protocols. All percentages have been calculated using raw figures and rounded, and therefore rounded figures may not sum precisely. Neither the Higher Education Statistics Agency Limited nor HESA Services Limited can accept responsibility for any inferences or conclusions derived by third parties from data or other information obtained from HESA sources.
This report is a snapshot of the scale of UK HE TNE in 2015-16 and trends which can be determined from previous years until 2015-16. It does not seek to identify causal links. It identifies patterns of growth and offers a basis for horizon scanning to create a more complete picture of UK TNE activity around the world.
On 11 January 2018, HESA announced its release of top-line aggregated statistics for the 2016-17 cohort11. This is the first statistical release only; the full data will not be available until later this year. As such, the research presented in this report of 2015-16 data is the most up to date and comprehensive analysis possible.
9. 0.89% of all Oxford Brookes University TNE students were not undertaking the BSc Applied Accounting qualification.10. UUKi, 2016. The Scale and Scope of UK Higher Education Transnational Education.11. https://www.hesa.ac.uk/news/11-01-2018/sfr247-higher-education-student-statistics/location
5 THE SCALE OF UK HIGHER EDUCATION TRANSNATIONAL EDUCATION 2015–16 Introduction
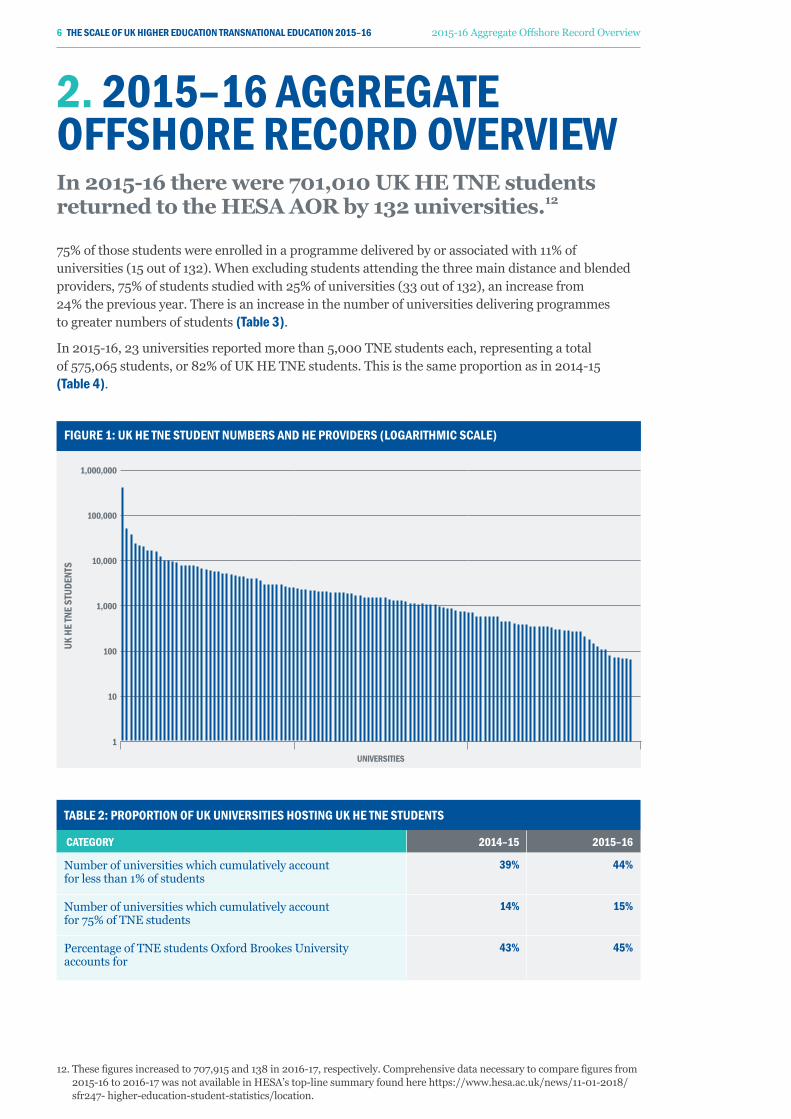
2. 2015–16 AGGREGATE OFFSHORE RECORD OvERvIEw In 2015-16 there were 701,010 UK HE TNE students returned to the HESA AOR by 132 universities.12
75% of those students were enrolled in a programme delivered by or associated with 11% of universities (15 out of 132). When excluding students attending the three main distance and blended providers, 75% of students studied with 25% of universities (33 out of 132), an increase from 24% the previous year. There is an increase in the number of universities delivering programmes to greater numbers of students (Table 3).
In 2015-16, 23 universities reported more than 5,000 TNE students each, representing a total of 575,065 students, or 82% of UK HE TNE students. This is the same proportion as in 2014-15 (Table 4).
FIGURE 1: UK HE TNE STUDENT NUmbERS AND HE pROvIDERS (LOGARITHmIC SCALE)
UK H
E TN
E ST
UDEN
TS
1,000,000
100,000
10,000
1,000
100
10
1
UNIvERSITIES
TAbLE 2: pROpORTION OF UK UNIvERSITIES HOSTING UK HE TNE STUDENTS
CATEGORy 2014–15 2015–16
Number of universities which cumulatively account for less than 1% of students
39% 44%
Number of universities which cumulatively account for 75% of TNE students
14% 15%
Percentage of TNE students Oxford Brookes University accounts for
43% 45%
12. These figures increased to 707,915 and 138 in 2016-17, respectively. Comprehensive data necessary to compare figures from 2015-16 to 2016-17 was not available in HESA’s top-line summary found here https://www.hesa.ac.uk/news/11-01-2018/sfr247- higher-education-student-statistics/location.
6 THE SCALE OF UK HIGHER EDUCATION TRANSNATIONAL EDUCATION 2015–16 2015-16 Aggregate Offshore Record Overview
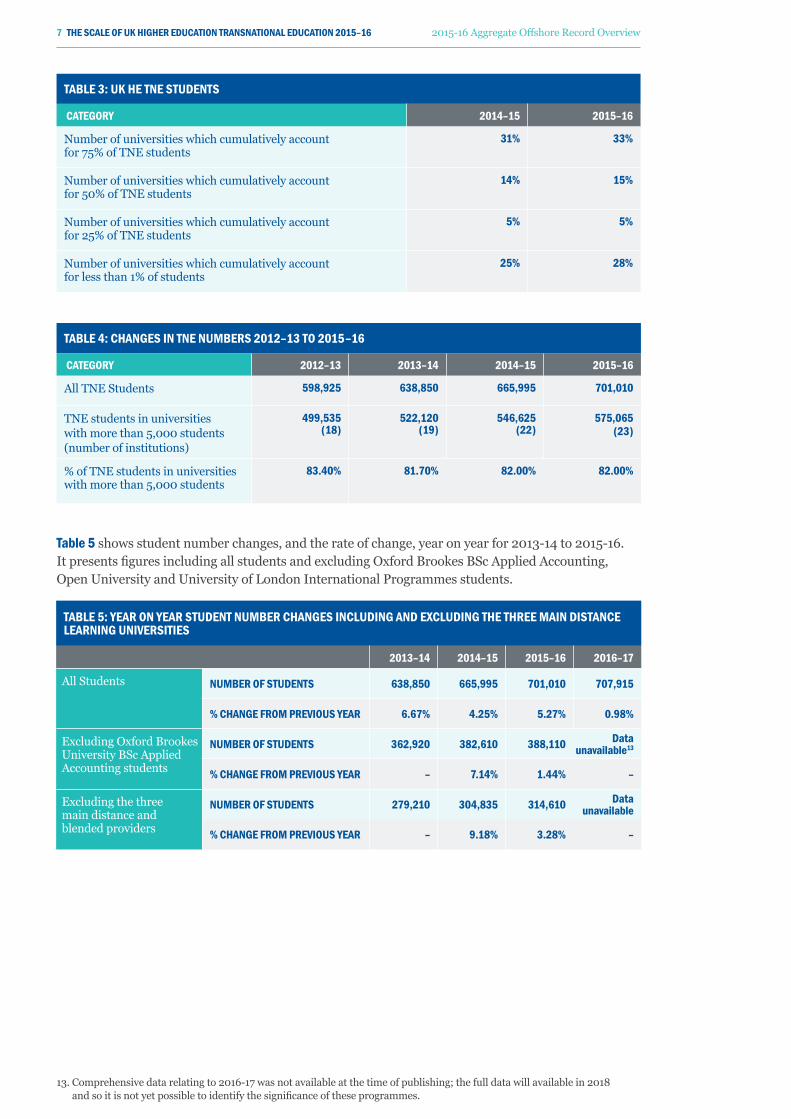
TAbLE 3: UK HE TNE STUDENTS
CATEGORy 2014–15 2015–16
Number of universities which cumulatively account for 75% of TNE students
31% 33%
Number of universities which cumulatively account for 50% of TNE students
14% 15%
Number of universities which cumulatively account for 25% of TNE students
5% 5%
Number of universities which cumulatively account for less than 1% of students
25% 28%
TAbLE 4: CHANGES IN TNE NUmbERS 2012–13 TO 2015–16
CATEGORy 2012–13 2013–14 2014–15 2015–16
All TNE Students 598,925 638,850 665,995 701,010
TNE students in universities with more than 5,000 students(number of institutions)
499,535 (18)
522,120 (19)
546,625 (22)
575,065 (23)
% of TNE students in universities with more than 5,000 students
83.40% 81.70% 82.00% 82.00%
Table 5 shows student number changes, and the rate of change, year on year for 2013-14 to 2015-16. It presents figures including all students and excluding Oxford Brookes BSc Applied Accounting, Open University and University of London International Programmes students.
TAbLE 5: yEAR ON yEAR STUDENT NUmbER CHANGES INCLUDING AND ExCLUDING THE THREE mAIN DISTANCE LEARNING UNIvERSITIES
2013–14 2014–15 2015–16 2016–17
All Students NUmbER OF STUDENTS 638,850 665,995 701,010 707,915
% CHANGE FROm pREvIOUS yEAR 6.67% 4.25% 5.27% 0.98%
Excluding Oxford Brookes University BSc Applied Accounting students
NUmbER OF STUDENTS 362,920 382,610 388,110 Data unavailable13
% CHANGE FROm pREvIOUS yEAR – 7.14% 1.44% –
Excluding the three main distance and blended providers
NUmbER OF STUDENTS 279,210 304,835 314,610 Data unavailable
% CHANGE FROm pREvIOUS yEAR – 9.18% 3.28% –
13. Comprehensive data relating to 2016-17 was not available at the time of publishing; the full data will available in 2018 and so it is not yet possible to identify the significance of these programmes.
7 THE SCALE OF UK HIGHER EDUCATION TRANSNATIONAL EDUCATION 2015–16 2015-16 Aggregate Offshore Record Overview
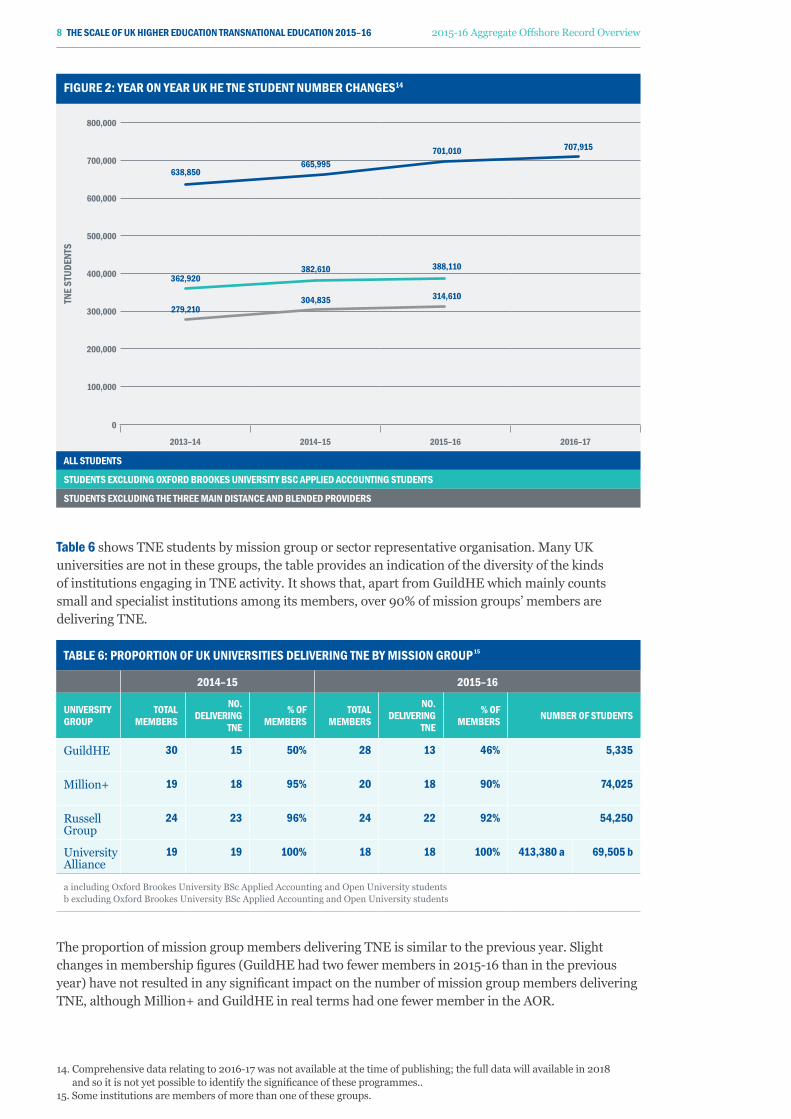
TAbLE 6: pROpORTION OF UK UNIvERSITIES DELIvERING TNE by mISSION GROUp 15
2014–15 2015–16
UNIvERSITy GROUp
TOTAL mEmbERS
NO. DELIvERING
TNE
% OF mEmbERS
TOTAL mEmbERS
NO. DELIvERING
TNE
% OF mEmbERS NUmbER OF STUDENTS
GuildHE 30 15 50% 28 13 46% 5,335
Million+ 19 18 95% 20 18 90% 74,025
Russell Group
24 23 96% 24 22 92% 54,250
University Alliance
19 19 100% 18 18 100% 413,380 a 69,505 b
a including Oxford Brookes University BSc Applied Accounting and Open University students b excluding Oxford Brookes University BSc Applied Accounting and Open University students
Table 6 shows TNE students by mission group or sector representative organisation. Many UK universities are not in these groups, the table provides an indication of the diversity of the kinds of institutions engaging in TNE activity. It shows that, apart from GuildHE which mainly counts small and specialist institutions among its members, over 90% of mission groups’ members are delivering TNE.
FIGURE 2: yEAR ON yEAR UK HE TNE STUDENT NUmbER CHANGES14
TNE
STUD
ENTS
800,000
700,000
600,000
500,000
400,000
300,000
200,000
100,000
0
2013–14 2014–15 2015–16 2016–17
ALL STUDENTS
STUDENTS ExCLUDING OxFORD bROOKES UNIvERSITy bSC AppLIED ACCOUNTING STUDENTS
STUDENTS ExCLUDING THE THREE mAIN DISTANCE AND bLENDED pROvIDERS
707,915701,010665,995
638,850
388,110382,610362,920
314,610304,835279,210
14. Comprehensive data relating to 2016-17 was not available at the time of publishing; the full data will available in 2018 and so it is not yet possible to identify the significance of these programmes..
15. Some institutions are members of more than one of these groups.
The proportion of mission group members delivering TNE is similar to the previous year. Slight changes in membership figures (GuildHE had two fewer members in 2015-16 than in the previous year) have not resulted in any significant impact on the number of mission group members delivering TNE, although Million+ and GuildHE in real terms had one fewer member in the AOR.
8 THE SCALE OF UK HIGHER EDUCATION TRANSNATIONAL EDUCATION 2015–16 2015-16 Aggregate Offshore Record Overview
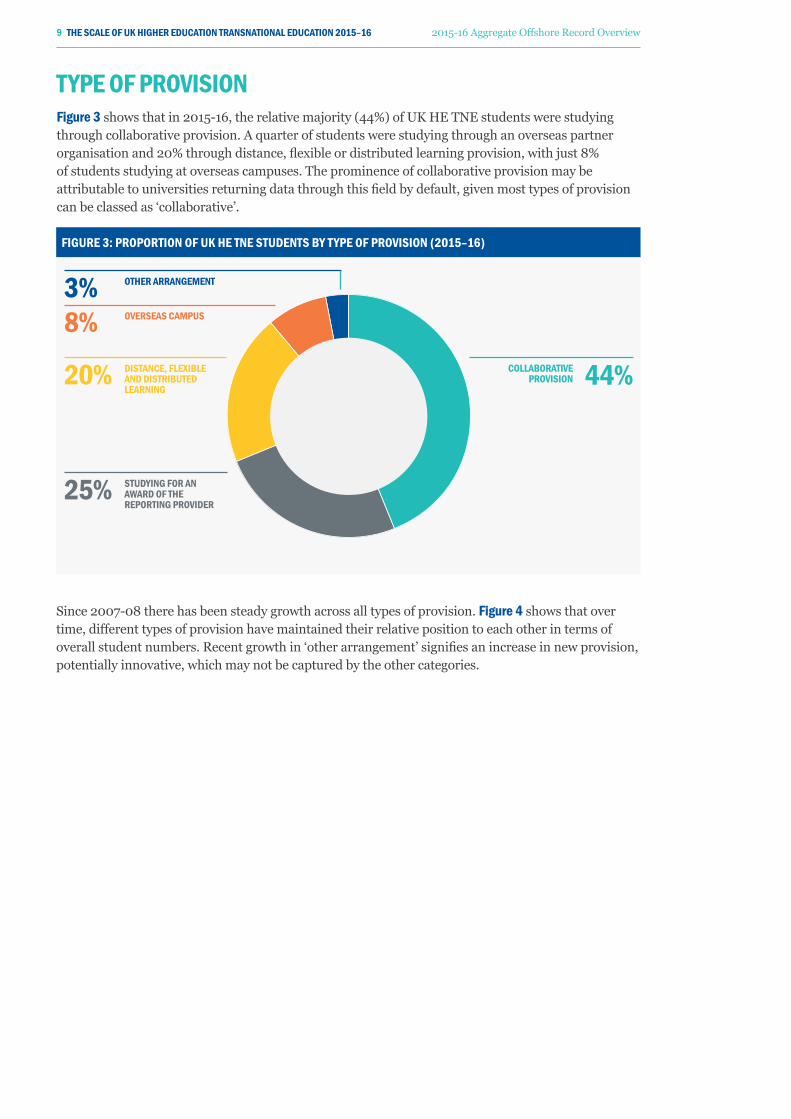
TypE OF pROvISION Figure 3 shows that in 2015-16, the relative majority (44%) of UK HE TNE students were studying through collaborative provision. A quarter of students were studying through an overseas partner organisation and 20% through distance, flexible or distributed learning provision, with just 8% of students studying at overseas campuses. The prominence of collaborative provision may be attributable to universities returning data through this field by default, given most types of provision can be classed as ‘collaborative’.
FIGURE 3: pROpORTION OF UK HE TNE STUDENTS by TypE OF pROvISION (2015–16)
Since 2007-08 there has been steady growth across all types of provision. Figure 4 shows that over time, different types of provision have maintained their relative position to each other in terms of overall student numbers. Recent growth in ‘other arrangement’ signifies an increase in new provision, potentially innovative, which may not be captured by the other categories.
COLLAbORATIvE pROvISION
DISTANCE, FLExIbLE AND DISTRIbUTED LEARNING
STUDyING FOR AN AwARD OF THE REpORTING pROvIDER
OvERSEAS CAmpUS
OTHER ARRANGEmENT
44%20%
25%
8%3%
9 THE SCALE OF UK HIGHER EDUCATION TRANSNATIONAL EDUCATION 2015–16 2015-16 Aggregate Offshore Record Overview
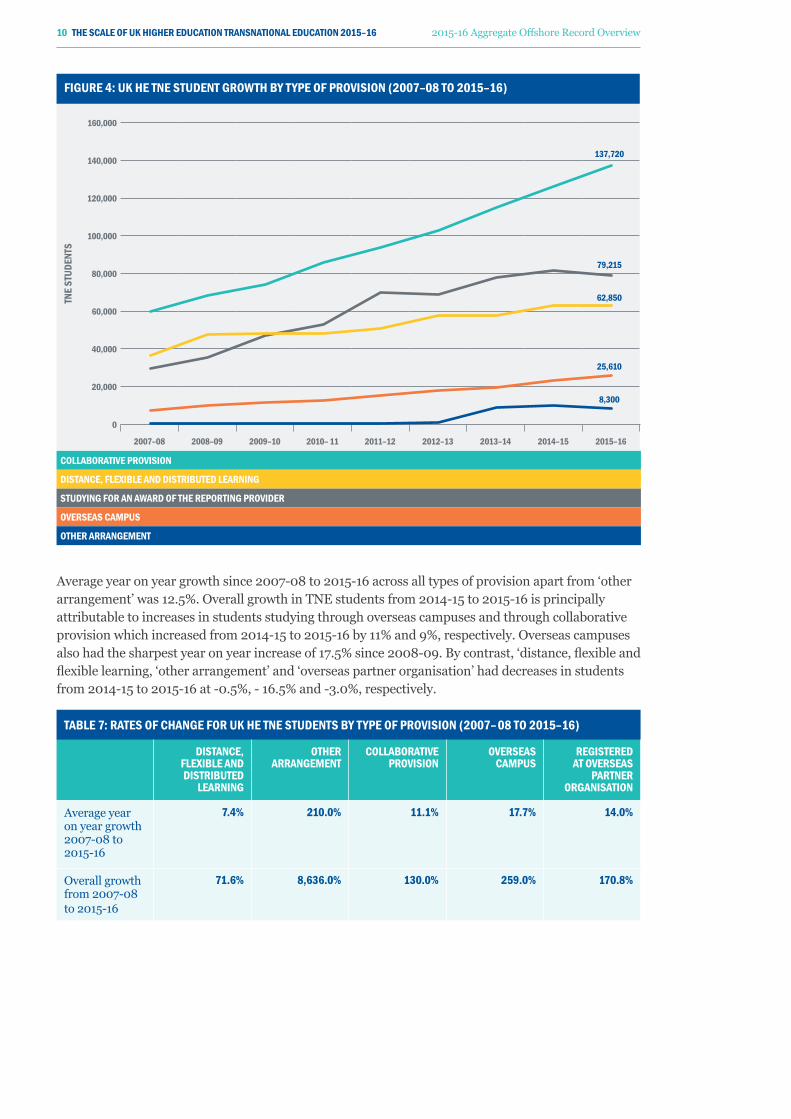
FIGURE 4: UK HE TNE STUDENT GROwTH by TypE OF pROvISION (2007–08 TO 2015–16)
TNE
STUD
ENTS
160,000
140,000
120,000
100,000
80,000
60,000
40,000
20,000
0
2007–08 2008–09 2009–10 2010– 11 2011–12 2012–13 2013–14 2014–15 2015–16
COLLAbORATIvE pROvISION
DISTANCE, FLExIbLE AND DISTRIbUTED LEARNING
STUDyING FOR AN AwARD OF THE REpORTING pROvIDER
OvERSEAS CAmpUS
OTHER ARRANGEmENT
Average year on year growth since 2007-08 to 2015-16 across all types of provision apart from ‘other arrangement’ was 12.5%. Overall growth in TNE students from 2014-15 to 2015-16 is principally attributable to increases in students studying through overseas campuses and through collaborative provision which increased from 2014-15 to 2015-16 by 11% and 9%, respectively. Overseas campuses also had the sharpest year on year increase of 17.5% since 2008-09. By contrast, ‘distance, flexible and flexible learning, ‘other arrangement’ and ‘overseas partner organisation’ had decreases in students from 2014-15 to 2015-16 at -0.5%, - 16.5% and -3.0%, respectively.
TAbLE 7: RATES OF CHANGE FOR UK HE TNE STUDENTS by TypE OF pROvISION (2007– 08 TO 2015–16)
DISTANCE, FLExIbLE AND DISTRIbUTED
LEARNING
OTHERARRANGEmENT
COLLAbORATIvEpROvISION
OvERSEASCAmpUS
REGISTEREDAT OvERSEAS
pARTNERORGANISATION
Average year on year growth 2007-08 to 2015-16
7.4% 210.0% 11.1% 17.7% 14.0%
Overall growth from 2007-08to 2015-16
71.6% 8,636.0% 130.0% 259.0% 170.8%
8,300
25,610
62,850
79,215
137,720
10 THE SCALE OF UK HIGHER EDUCATION TRANSNATIONAL EDUCATION 2015–16 2015-16 Aggregate Offshore Record Overview
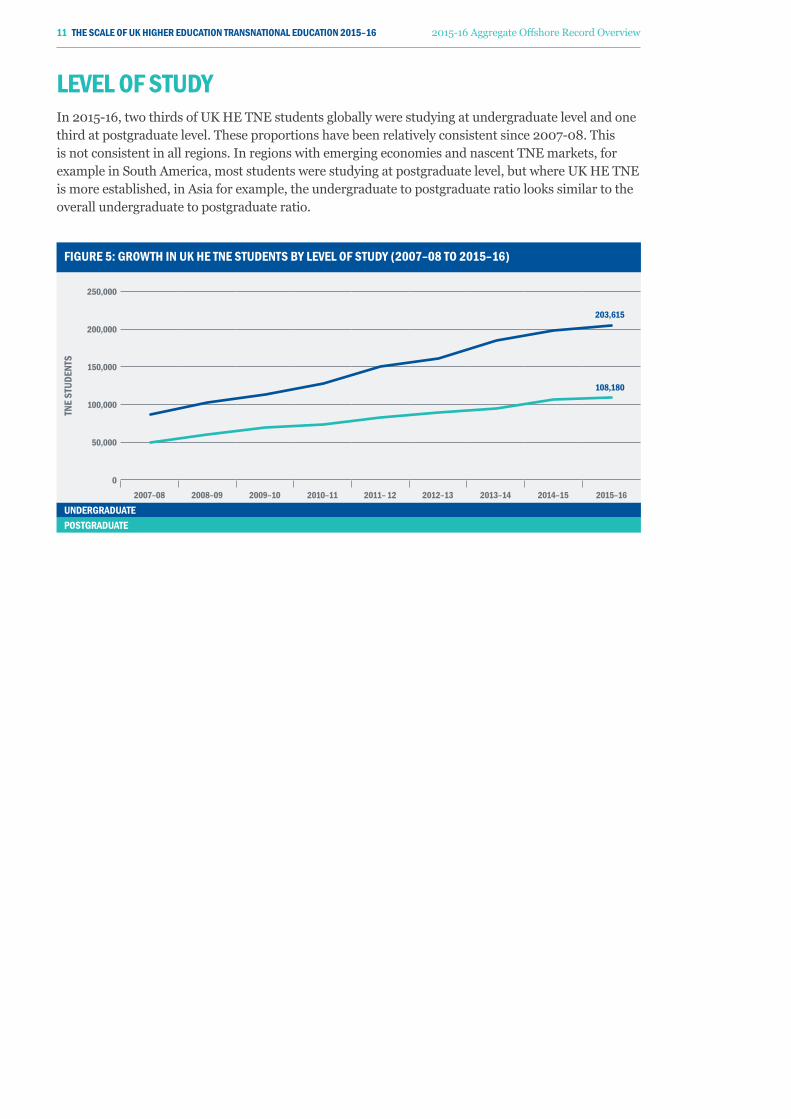
LEvEL OF STUDy In 2015-16, two thirds of UK HE TNE students globally were studying at undergraduate level and one third at postgraduate level. These proportions have been relatively consistent since 2007-08. This is not consistent in all regions. In regions with emerging economies and nascent TNE markets, for example in South America, most students were studying at postgraduate level, but where UK HE TNE is more established, in Asia for example, the undergraduate to postgraduate ratio looks similar to the overall undergraduate to postgraduate ratio.
FIGURE 5: GROwTH IN UK HE TNE STUDENTS by LEvEL OF STUDy (2007–08 TO 2015–16)
TNE
STUD
ENTS
250,000
200,000
150,000
100,000
50,000
02007–08 2008–09 2009–10 2010–11 2011– 12 2012–13 2013–14 2014–15 2015–16
UNDERGRADUATEpOSTGRADUATE
203,615
108,180
11 THE SCALE OF UK HIGHER EDUCATION TRANSNATIONAL EDUCATION 2015–16 2015-16 Aggregate Offshore Record Overview
3. UK HE TNE HOST COUNTRIES In 2015-16 UK HE TNE was delivered in 224 countries and territories around the world. 16 52% of all UK HE TNE students were based in Asia, followed by Africa (15%), the EU (13%) and the Middle East (11%).
KEy pOINTS:
• As in 2014-15, in 2015-16, Asian and African countries dominated the top 10 host countries for UK HE TNE students.
• The five countries hosting the highest volumes of UK HE TNE student numbers were consistent with 2014-15; this was the same for the top five countries in each region.
• The middle East and Asia had a majority of undergraduate students (60% and 81%, respectively) in their UK HE TNE numbers. There was a more even distribution between undergraduate and postgraduate student numbers in the EU and Africa. North America, non-EU European countries, South America and Australasia had a majority of postgraduate students.
• The majority of undergraduate (65%) and postgraduate (28%) UK HE TNE students were studying in Asia.
• In regions where UK HE TNE has been established for longer, e.g. Asia, Africa and the Middle East, most student numbers were on collaborative provision programmes.
The 10 host countries with the highest numbers of TNE students, both including and excluding Oxford Brookes University BSc Applied Accounting students, are consistent between 2014-15 and 2015-16, with slight differences in order. Malaysia hosted the largest number of UK HE TNE students, irrespective of whether Oxford Brookes University BSc Applied Accounting students are included or excluded.
When Oxford Brookes University BSc Applied Accounting students are excluded, Nigeria, Pakistan and Ghana no longer feature in the top 10 UK HE TNE host countries. Greece, the only European country in the list, the United Arab Emirates and India feature more prominently in the adjusted host country list (Table 8).
The country hosting the highest TNE numbers in each region remains the same regardless of whether Oxford Brookes BSc Applied Accounting students are considered, apart from Africa.
Of the top 20 host countries (excluding Oxford Brookes University BSc Applied Accounting students), 7 are in Asia, 6 are in the Middle East and North Africa, 4 are in Europe and 3 are in the Americas showing take-up of UK HE TNE across mature and emerging economies.
The top 20 UK HE TNE host countries excluding these students represent 76% of all UK HE TNE students.
The top 19 host countries excluding Oxford Brookes University BSc Applied Accounting students remained the same from 2014-15 to 2015-16, but with slight differences in order. Canada is now in 20th place, replacing South Africa which fell to 21st.
16. In some cases HESA collects data which relates to territories which are not independent countries.
12 THE SCALE OF UK HIGHER EDUCATION TRANSNATIONAL EDUCATION 2015–16 UK HE TNE Host Countries
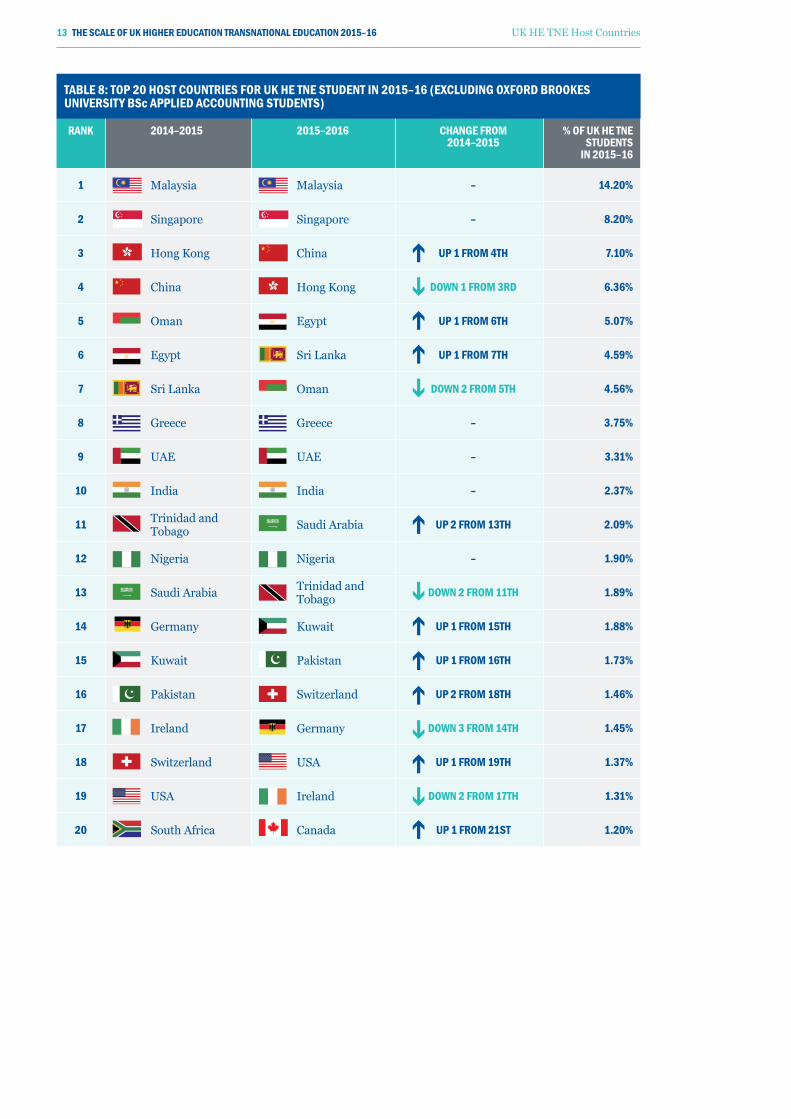
TAbLE 8: TOp 20 HOST COUNTRIES FOR UK HE TNE STUDENT IN 2015–16 (ExCLUDING OxFORD bROOKES UNIvERSITy bSc AppLIED ACCOUNTING STUDENTS)
RANK 2014–2015 2015–2016 CHANGE FROm 2014–2015
% OF UK HE TNE STUDENTS
IN 2015–16
1 Malaysia Malaysia – 14.20%
2 Singapore Singapore – 8.20%
3 Hong Kong China Up 1 FROm 4TH 7.10%
4 China Hong Kong DOwN 1 FROm 3RD 6.36%
5 Oman Egypt Up 1 FROm 6TH 5.07%
6 Egypt Sri Lanka Up 1 FROm 7TH 4.59%
7 Sri Lanka Oman DOwN 2 FROm 5TH 4.56%
8 Greece Greece – 3.75%
9 UAE UAE – 3.31%
10 India India – 2.37%
11 Trinidad and Tobago Saudi Arabia Up 2 FROm 13TH 2.09%
12 Nigeria Nigeria – 1.90%
13 Saudi Arabia Trinidad and Tobago DOwN 2 FROm 11TH 1.89%
14 Germany Kuwait Up 1 FROm 15TH 1.88%
15 Kuwait Pakistan Up 1 FROm 16TH 1.73%
16 Pakistan Switzerland Up 2 FROm 18TH 1.46%
17 Ireland Germany DOwN 3 FROm 14TH 1.45%
18 Switzerland USA Up 1 FROm 19TH 1.37%
19 USA Ireland DOwN 2 FROm 17TH 1.31%
20 South Africa Canada Up 1 FROm 21ST 1.20%
13 THE SCALE OF UK HIGHER EDUCATION TRANSNATIONAL EDUCATION 2015–16 UK HE TNE Host Countries

Figure 6 hows the breakdown of UK HE TNE students by region. The proportion of UK HE TNE students studying in each region has remained broadly the same since 2012-13. Minor exceptions to this include Asia, the EU and North America each decreasing by 1%, and Africa increasing by 2%.
Note that South America (less than 1%) hosted the fewest students in 2015-16.
Figure 7 shows overall growth over four years from 2012-13 to 2015-16 (dark blue lines) and growth between 2014-15 to 2015-16 (teal lines). In the last four years, the number of UK HE TNE students in each region increased. However, from 2014-15 to 2015-16, TNE did not continue to expand everywhere. Growth from 2012-13 to 2015-16 was greatest in the Middle East (4.6%) followed by Asia (3.9%), Africa (3.4%), the EU (0.9%) and Australasia (0.7%). Non-EU Europe shrank by 5%, North America by 0.8% and there was 0% growth in South America.
FIGURE 6: pROpORTION OF UK HE TNE STUDENTS by REGION IN 2015–16
FIGURE 7: RATES OF CHANGE IN UK HE TNE STUDENTS by REGION FROm 2012–13 TO 2015–16 AND FROm 2014–15 TO 2015–16
UK TN
E ST
UDEN
T GRO
wTH
(%)
50
40
30
20
10
0
–10
AFRICA ASIA AUSTRALASIA mIDDLE EAST NORTH AmERICA OTHER EUROpE SOUTH AmERICA EUROpEAN UNION
% CHANGE FROm 2012–13 TO 2015–16
% CHANGE FROm 2014–15 TO 2015–16
19.4
0
25.5
–5
5.00.9
30.6
–0.8
31.1
4.6
31.4
0.7
40.0
3.9
40.6
3.0
ASIA
AFRICA
EUROpEAN UNION
mIDDLE EAST
NORTH AmERICA
NON-EU AUSTRALASIA
52%
15%
13%
11%
5%3% 1%
14 THE SCALE OF UK HIGHER EDUCATION TRANSNATIONAL EDUCATION 2015–16 UK HE TNE Host Countries
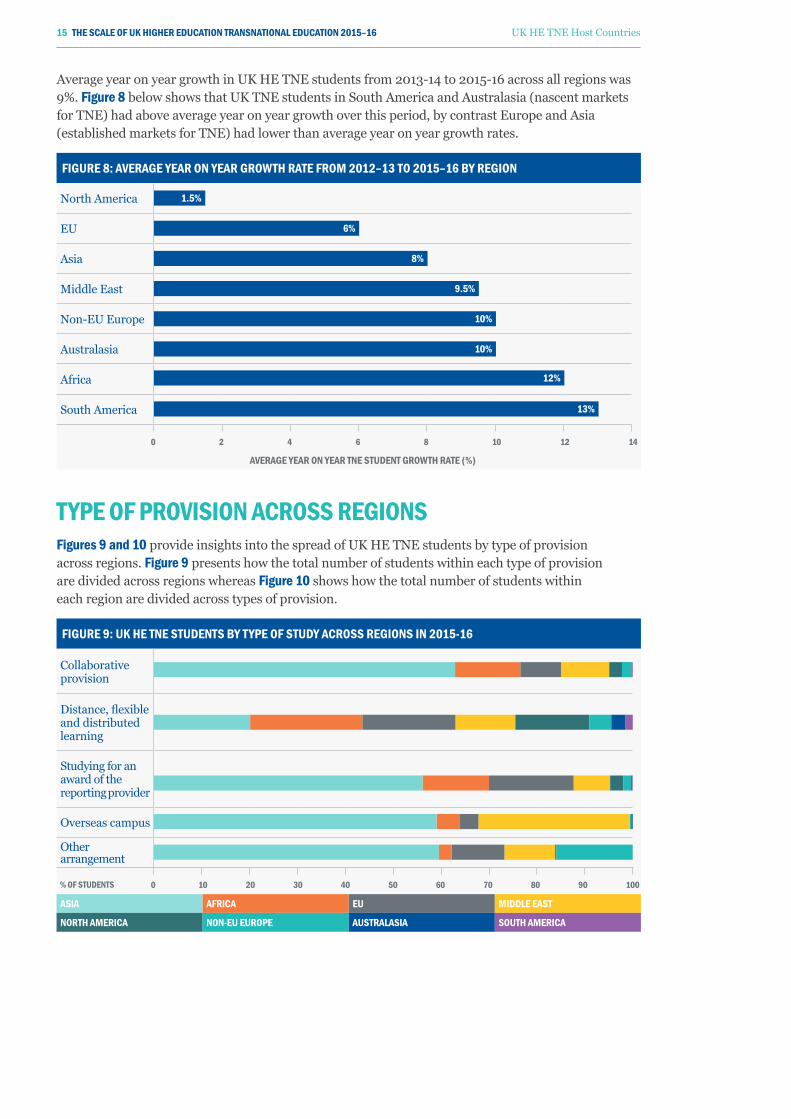
Average year on year growth in UK HE TNE students from 2013-14 to 2015-16 across all regions was 9%. Figure 8 below shows that UK TNE students in South America and Australasia (nascent markets for TNE) had above average year on year growth over this period, by contrast Europe and Asia (established markets for TNE) had lower than average year on year growth rates.
FIGURE 8: AvERAGE yEAR ON yEAR GROwTH RATE FROm 2012–13 TO 2015–16 by REGION
North America
EU
Asia
Middle East
Non-EU Europe
Australasia
Africa
South America
AvERAGE yEAR ON yEAR TNE STUDENT GROwTH RATE (%)
0 2 4 6 8 10 12 14
1.5%
6%
8%
9.5%
10%
10%
12%
13%
TypE OF pROvISION ACROSS REGIONSFigures 9 and 10 provide insights into the spread of UK HE TNE students by type of provision across regions. Figure 9 presents how the total number of students within each type of provision are divided across regions whereas Figure 10 shows how the total number of students within each region are divided across types of provision.
FIGURE 9: UK HE TNE STUDENTS by TypE OF STUDy ACROSS REGIONS IN 2015-16
Collaborative provision
Distance, flexible and distributed learning
Studying for an award of the reporting provider
Overseas campus
Other arrangement
0 10 20 30 40 50 60 70 80 90 100
ASIA AFRICA EU mIDDLE EAST
NORTH AmERICA NON-EU EUROpE AUSTRALASIA SOUTH AmERICA
% OF STUDENTS
15 THE SCALE OF UK HIGHER EDUCATION TRANSNATIONAL EDUCATION 2015–16 UK HE TNE Host Countries

Collaborative provision, including joint degrees, has been consistently the principal type of provision through which UK HE TNE students study. In 2015-16, 63% of students on these programmes were hosted by countries in Asia, followed by Africa (13.5%), the Middle East (10%) and the EU (8.5%).
Asia hosted the most students who were studying for an award of the reporting provider (59%) followed by the Middle East (31.5%). Together, these regions host over 90% of students studying through this type of provision.
Overseas campuses are more prevalent in Asia (59%) and the Middle East (32%) than other regions. With new campus announcements in 2017 and more pending, the number of students attending these over time is likely to increase. At the time of research 29 UK universities were delivering programmes through 39 overseas campuses.17
Distance, flexible and distributed learning continues to increase in significance for UK HE TNE, particularly in newer or growing TNE markets. Students studying through this type of provision were more evenly spread than others. Africa led (23%) followed by Asia and the EU (20% each) and North America (16%).
Looking at students by type of provision within each region (Figure 18) shows that regions with long established TNE (namely Africa, Asia and the Middle East) each hosted a higher proportion of students studying through collaborative provision, whereas regions with more nascent TNE activity (namely Australasia, North America, South America and non-EU Europe) each hosted a higher proportion of students studying through distance, flexible or distributed learning. The EU is an exception to these with a more even split between students registered at reporting providers (35%), students studying through distance, flexible or distributed learning (31%) and students studying through collaborative provision (30%).
FIGURE 10: UK HE TNE STUDENTS by REGION ACROSS TypE OF STUDy IN 2015–16
Asia
Africa
EU
Middle East
North America
Non-EU Europe
Australasia
South America
COLLAbORATIvE pROvISION
STUDyING FOR AN AwARD OF THE REpORTING pROvIDER
DISTANCE, FLExIbLE AND DISTRIbUTED LEARNING
OvERSEAS CAmpUS
OTHER ARRANGEmENT
0 10 20 30 40 50 60 70 80 90 100
17. Data from Border Education Research Team: http://cbert.org/?page_id=34. Accessed 1 November 2017.
% OF STUDENTS
16 THE SCALE OF UK HIGHER EDUCATION TRANSNATIONAL EDUCATION 2015–16 UK HE TNE Host Countries
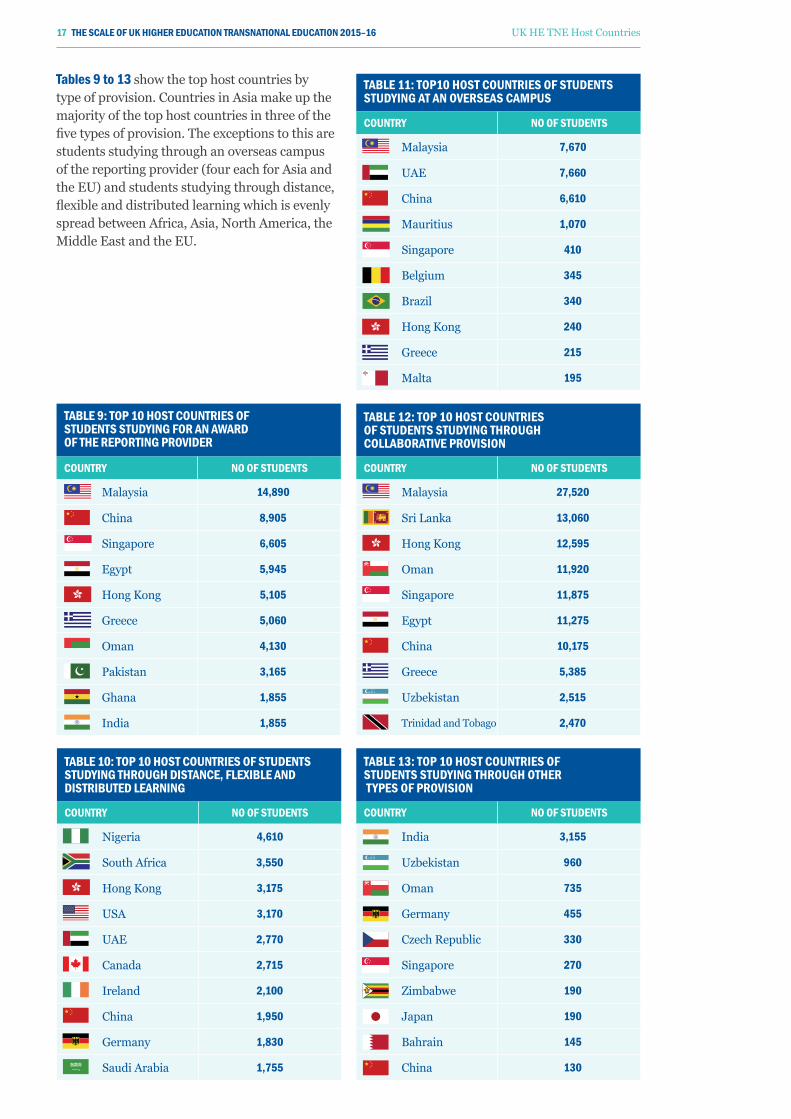
TAbLE 9: TOp 10 HOST COUNTRIES OF STUDENTS STUDyING FOR AN AwARD OF THE REpORTING pROvIDER
COUNTRy NO OF STUDENTS
Malaysia 14,890
China 8,905
Singapore 6,605
Egypt 5,945
Hong Kong 5,105
Greece 5,060
Oman 4,130
Pakistan 3,165
Ghana 1,855
India 1,855
TAbLE 11: TOp10 HOST COUNTRIES OF STUDENTS STUDyING AT AN OvERSEAS CAmpUS
COUNTRy NO OF STUDENTS
Malaysia 7,670
UAE 7,660
China 6,610
Mauritius 1,070
Singapore 410
Belgium 345
Brazil 340
Hong Kong 240
Greece 215
Malta 195
Tables 9 to 13 show the top host countries by type of provision. Countries in Asia make up the majority of the top host countries in three of the five types of provision. The exceptions to this are students studying through an overseas campus of the reporting provider (four each for Asia and the EU) and students studying through distance, flexible and distributed learning which is evenly spread between Africa, Asia, North America, the Middle East and the EU.
TAbLE 12: TOp 10 HOST COUNTRIES OF STUDENTS STUDyING THROUGH COLLAbORATIvE pROvISION
COUNTRy NO OF STUDENTS
Malaysia 27,520
Sri Lanka 13,060
Hong Kong 12,595
Oman 11,920
Singapore 11,875
Egypt 11,275
China 10,175
Greece 5,385
Uzbekistan 2,515
Trinidad and Tobago 2,470
TAbLE 13: TOp 10 HOST COUNTRIES OF STUDENTS STUDyING THROUGH OTHER TypES OF pROvISION
COUNTRy NO OF STUDENTS
India 3,155
Uzbekistan 960
Oman 735
Germany 455
Czech Republic 330
Singapore 270
Zimbabwe 190
Japan 190
Bahrain 145
China 130
TAbLE 10: TOp 10 HOST COUNTRIES OF STUDENTS STUDyING THROUGH DISTANCE, FLExIbLE AND DISTRIbUTED LEARNING
COUNTRy NO OF STUDENTS
Nigeria 4,610
South Africa 3,550
Hong Kong 3,175
USA 3,170
UAE 2,770
Canada 2,715
Ireland 2,100
China 1,950
Germany 1,830
Saudi Arabia 1,755
17 THE SCALE OF UK HIGHER EDUCATION TRANSNATIONAL EDUCATION 2015–16 UK HE TNE Host Countries
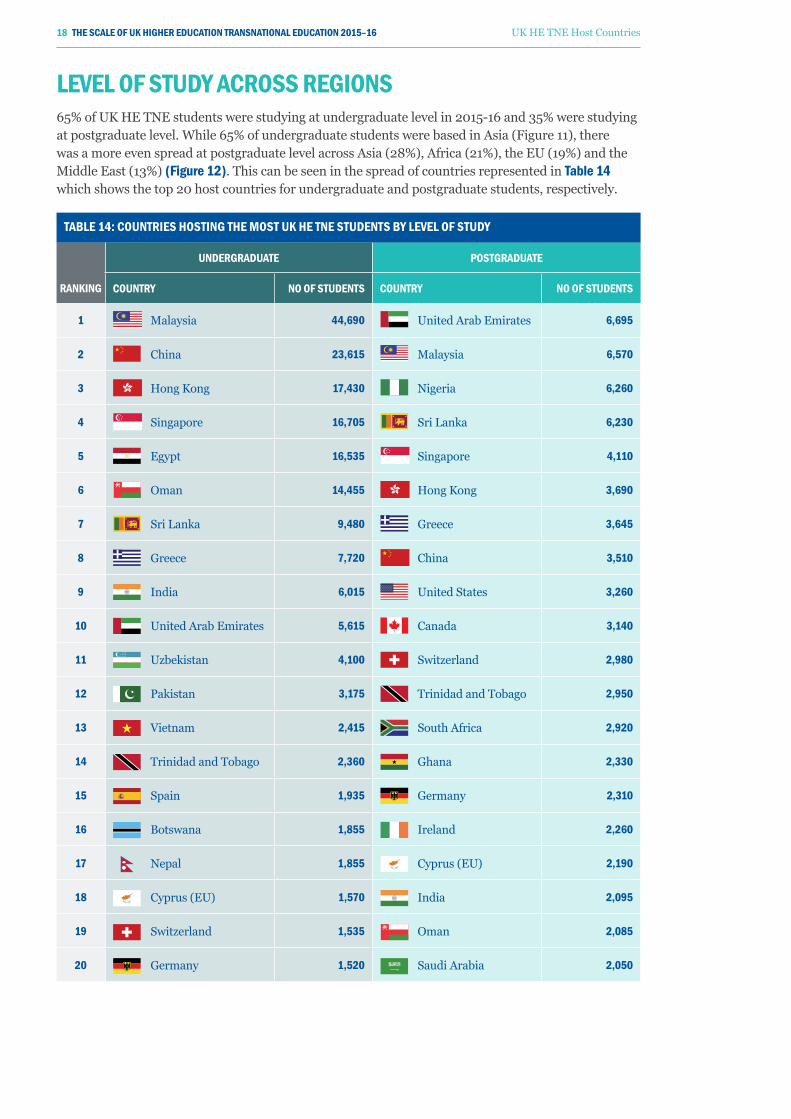
LEvEL OF STUDy ACROSS REGIONS 65% of UK HE TNE students were studying at undergraduate level in 2015-16 and 35% were studying at postgraduate level. While 65% of undergraduate students were based in Asia (Figure 11), there was a more even spread at postgraduate level across Asia (28%), Africa (21%), the EU (19%) and the Middle East (13%) (Figure 12). This can be seen in the spread of countries represented in Table 14 which shows the top 20 host countries for undergraduate and postgraduate students, respectively.
TAbLE 14: COUNTRIES HOSTING THE mOST UK HE TNE STUDENTS by LEvEL OF STUDy
UNDERGRADUATE pOSTGRADUATE
RANKING COUNTRy NO OF STUDENTS COUNTRy NO OF STUDENTS
1 Malaysia 44,690 United Arab Emirates 6,695
2 China 23,615 Malaysia 6,570
3 Hong Kong 17,430 Nigeria 6,260
4 Singapore 16,705 Sri Lanka 6,230
5 Egypt 16,535 Singapore 4,110
6 Oman 14,455 Hong Kong 3,690
7 Sri Lanka 9,480 Greece 3,645
8 Greece 7,720 China 3,510
9 India 6,015 United States 3,260
10 United Arab Emirates 5,615 Canada 3,140
11 Uzbekistan 4,100 Switzerland 2,980
12 Pakistan 3,175 Trinidad and Tobago 2,950
13 Vietnam 2,415 South Africa 2,920
14 Trinidad and Tobago 2,360 Ghana 2,330
15 Spain 1,935 Germany 2,310
16 Botswana 1,855 Ireland 2,260
17 Nepal 1,855 Cyprus (EU) 2,190
18 Cyprus (EU) 1,570 India 2,095
19 Switzerland 1,535 Oman 2,085
20 Germany 1,520 Saudi Arabia 2,050
18 THE SCALE OF UK HIGHER EDUCATION TRANSNATIONAL EDUCATION 2015–16 UK HE TNE Host Countries
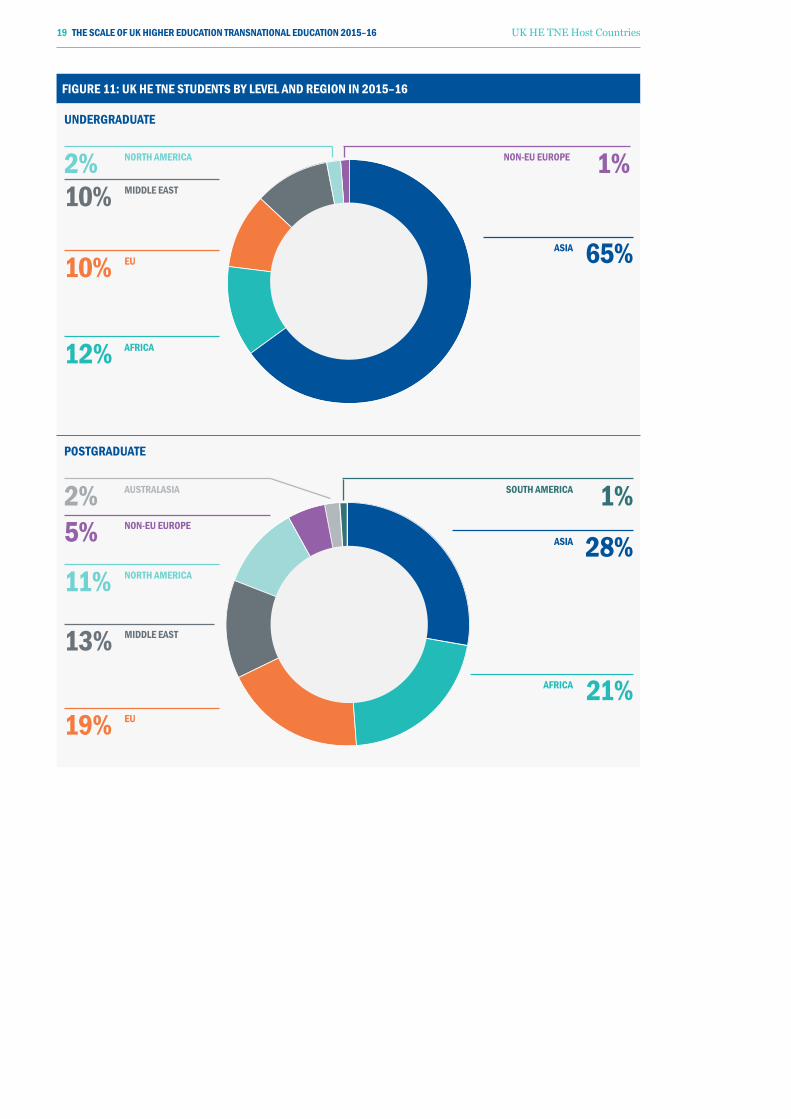
FIGURE 11: UK HE TNE STUDENTS by LEvEL AND REGION IN 2015–16
UNDERGRADUATE
pOSTGRADUATE
ASIA
ASIA
AFRICA
AFRICA
EU
mIDDLE EAST
mIDDLE EAST
NORTH AmERICA
NORTH AmERICA NON-EU EUROpE
NON-EU EUROpE
AUSTRALASIA SOUTH AmERICA
EU
65%
28%
21%
12%
10%
10%
13%
11%
2% 1%
5%2% 1%
19%
19 THE SCALE OF UK HIGHER EDUCATION TRANSNATIONAL EDUCATION 2015–16 UK HE TNE Host Countries
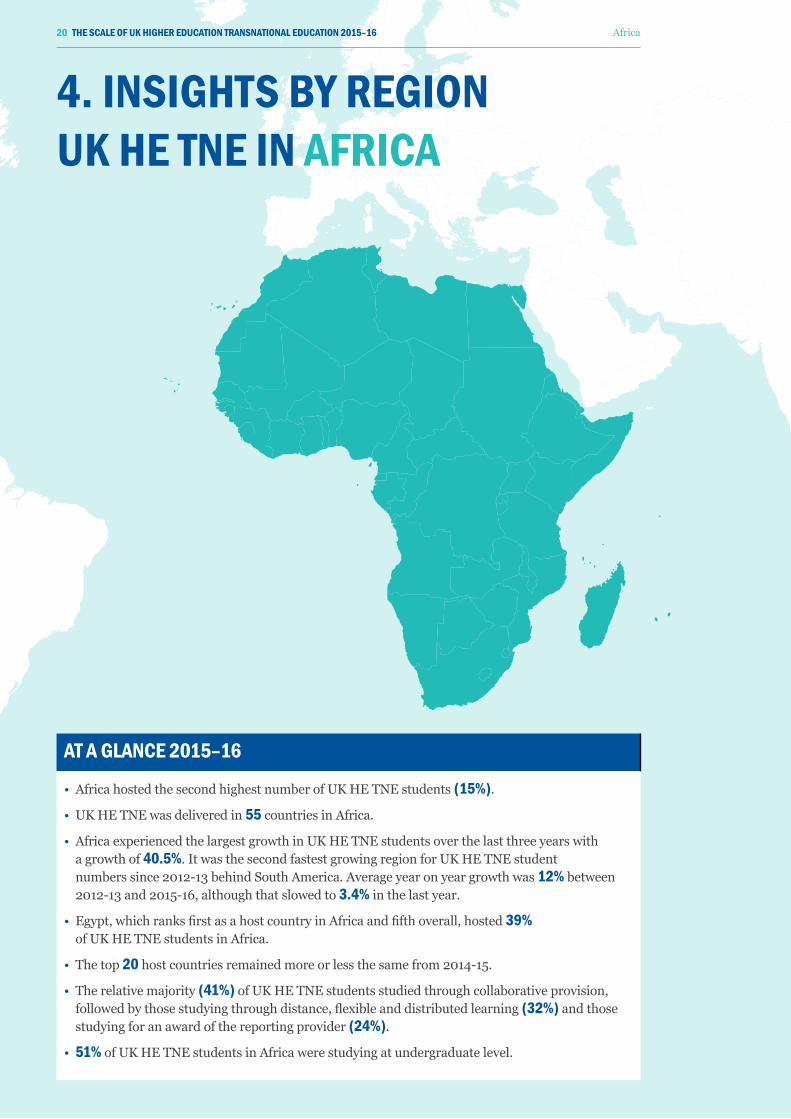
4. INSIGHTS by REGION UK HE TNE IN AFRICA
AT A GLANCE 2015–16
• Africa hosted the second highest number of UK HE TNE students (15%).
• UK HE TNE was delivered in 55 countries in Africa.
• Africa experienced the largest growth in UK HE TNE students over the last three years with a growth of 40.5%. It was the second fastest growing region for UK HE TNE student numbers since 2012-13 behind South America. Average year on year growth was 12% between 2012-13 and 2015-16, although that slowed to 3.4% in the last year.
• Egypt, which ranks first as a host country in Africa and fifth overall, hosted 39% of UK HE TNE students in Africa.
• The top 20 host countries remained more or less the same from 2014-15.
• The relative majority (41%) of UK HE TNE students studied through collaborative provision, followed by those studying through distance, flexible and distributed learning (32%) and those studying for an award of the reporting provider (24%).
• 51% of UK HE TNE students in Africa were studying at undergraduate level.
20 THE SCALE OF UK HIGHER EDUCATION TRANSNATIONAL EDUCATION 2015–16 Africa
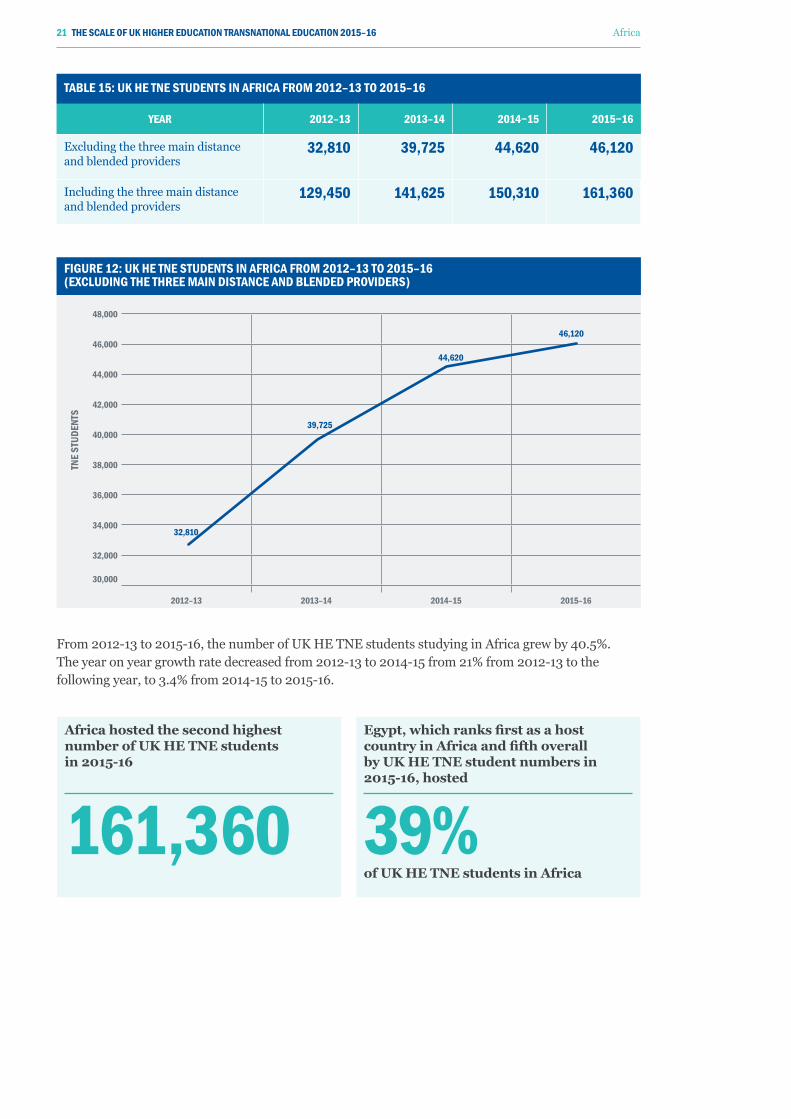
From 2012-13 to 2015-16, the number of UK HE TNE students studying in Africa grew by 40.5%. The year on year growth rate decreased from 2012-13 to 2014-15 from 21% from 2012-13 to the following year, to 3.4% from 2014-15 to 2015-16.
TAbLE 15: UK HE TNE STUDENTS IN AFRICA FROm 2012–13 TO 2015–16
yEAR 2012–13 2013–14 2014−15 2015−16
Excluding the three main distance and blended providers
32,810 39,725 44,620 46,120
Including the three main distance and blended providers
129,450 141,625 150,310 161,360
FIGURE 12: UK HE TNE STUDENTS IN AFRICA FROm 2012–13 TO 2015–16 (ExCLUDING THE THREE mAIN DISTANCE AND bLENDED pROvIDERS)
48,000
46,000
44,000
42,000
40,000
38,000
36,000
34,000
32,000
30,000
2012–13 2013–14 2014–15 2015–16
Africa hosted the second highest number of UK HE TNE students in 2015-16
161,360
Egypt, which ranks first as a hostcountry in Africa and fifth overall by UK HE TNE student numbers in 2015-16, hosted
39% of UK HE TNE students in Africa
TNE
STUD
ENTS
46,120
32,810
39,725
44,620
21 THE SCALE OF UK HIGHER EDUCATION TRANSNATIONAL EDUCATION 2015–16 Africa
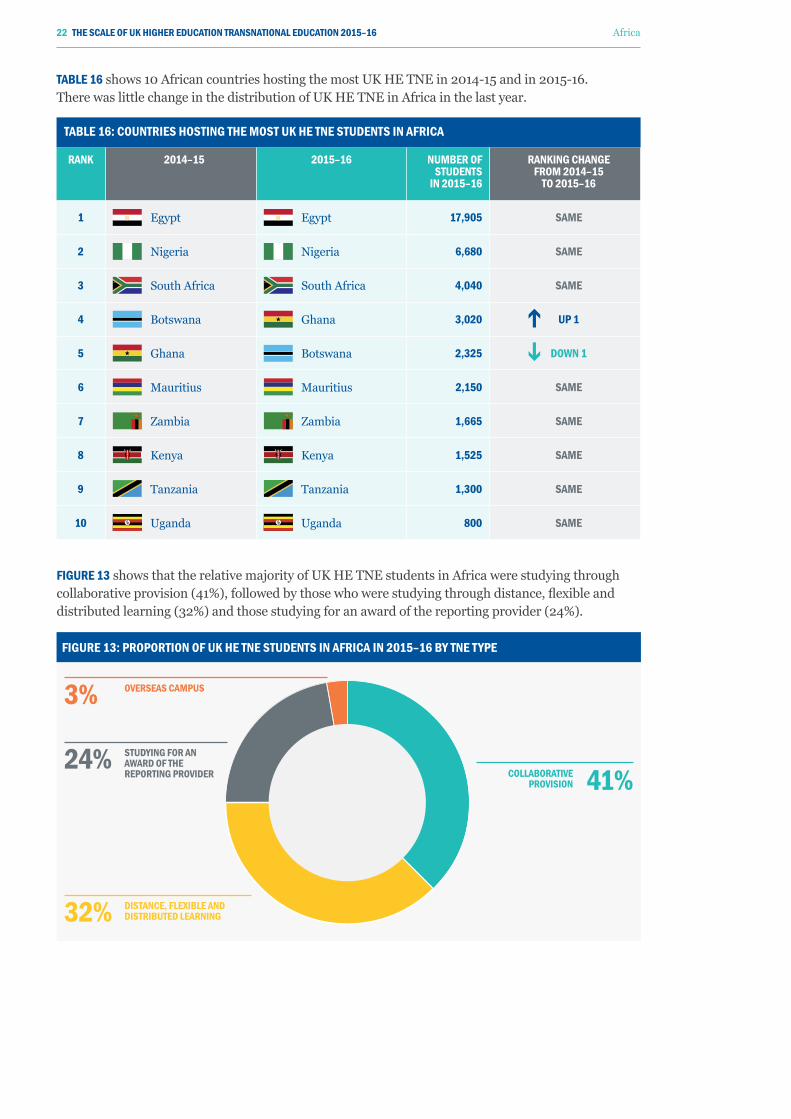
TAbLE 16: COUNTRIES HOSTING THE mOST UK HE TNE STUDENTS IN AFRICA
RANK 2014–15 2015–16 NUmbER OF STUDENTS
IN 2015–16
RANKING CHANGE FROm 2014–15
TO 2015–16
1 Egypt Egypt 17,905 SAmE
2 Nigeria Nigeria 6,680 SAmE
3 South Africa South Africa 4,040 SAmE
4 Botswana Ghana 3,020 Up 1
5 Ghana Botswana 2,325 DOwN 1
6 Mauritius Mauritius 2,150 SAmE
7 Zambia Zambia 1,665 SAmE
8 Kenya Kenya 1,525 SAmE
9 Tanzania Tanzania 1,300 SAmE
10 Uganda Uganda 800 SAmE
FIGURE 13 shows that the relative majority of UK HE TNE students in Africa were studying through collaborative provision (41%), followed by those who were studying through distance, flexible and distributed learning (32%) and those studying for an award of the reporting provider (24%).
TAbLE 16 shows 10 African countries hosting the most UK HE TNE in 2014-15 and in 2015-16. There was little change in the distribution of UK HE TNE in Africa in the last year.
FIGURE 13: pROpORTION OF UK HE TNE STUDENTS IN AFRICA IN 2015–16 by TNE TypE
41%32%24%3%0%
COLLAbORATIvE pROvISION
DISTANCE, FLExIbLE AND DISTRIbUTED LEARNING
STUDyING FOR AN AwARD OF THE REpORTING pROvIDER
OvERSEAS CAmpUS
41%
32%
24%
3%
22 THE SCALE OF UK HIGHER EDUCATION TRANSNATIONAL EDUCATION 2015–16 Africa
There is an almost even distribution between undergraduate (51%) and postgraduate (49%) UK HE TNE students in Africa. However, the picture changes when broken down by country. For example:
• Six countries host both the highest numbers of undergraduate and postgraduate students
• Botswana, Morocco and Malawi rank in the top ten host countries for undergraduate UK HE TNE student numbers (ranking second, eighth and tenth respectively) but fall outside the top ten for hosting postgraduate UK HE TNE students
• Egypt, Mauritius, Morocco and Botswana host more undergraduate than postgraduate students
• South Africa, Ghana, Zambia, Nigeria, Kenya, Tanzania and Zimbabwe host more postgraduate students than undergraduates.
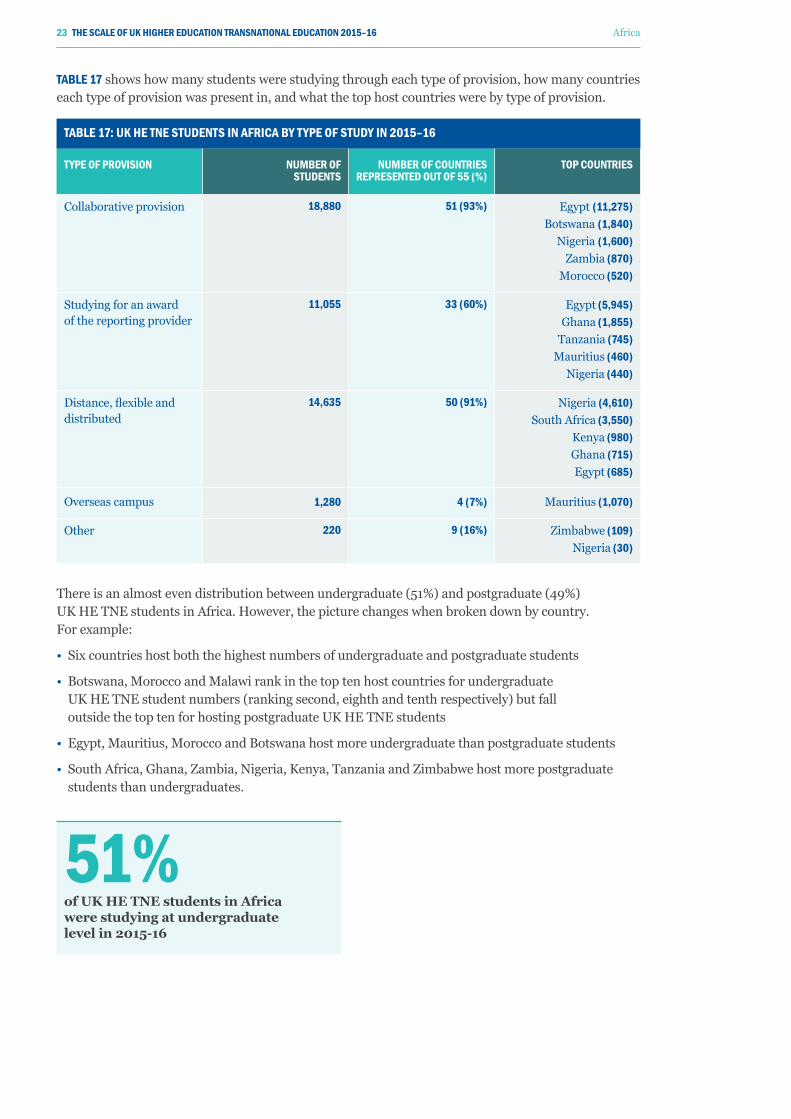
TAbLE 17: UK HE TNE STUDENTS IN AFRICA by TypE OF STUDy IN 2015–16
TypE OF pROvISION NUmbER OF STUDENTS
NUmbER OF COUNTRIES REpRESENTED OUT OF 55 (%)
TOp COUNTRIES
Collaborative provision 18,880 51 (93%) Egypt (11,275)Botswana (1,840)
Nigeria (1,600)Zambia (870)
Morocco (520)
Studying for an award of the reporting provider
11,055 33 (60%) Egypt (5,945)Ghana (1,855)
Tanzania (745)Mauritius (460)
Nigeria (440)
Distance, flexible and distributed
14,635 50 (91%) Nigeria (4,610)South Africa (3,550)
Kenya (980) Ghana (715)Egypt (685)
Overseas campus 1,280 4 (7%) Mauritius (1,070)
Other 220 9 (16%) Zimbabwe (109)Nigeria (30)
TAbLE 17 shows how many students were studying through each type of provision, how many countries each type of provision was present in, and what the top host countries were by type of provision.
51% of UK HE TNE students in Africa were studying at undergraduate level in 2015-16
23 THE SCALE OF UK HIGHER EDUCATION TRANSNATIONAL EDUCATION 2015–16 Africa
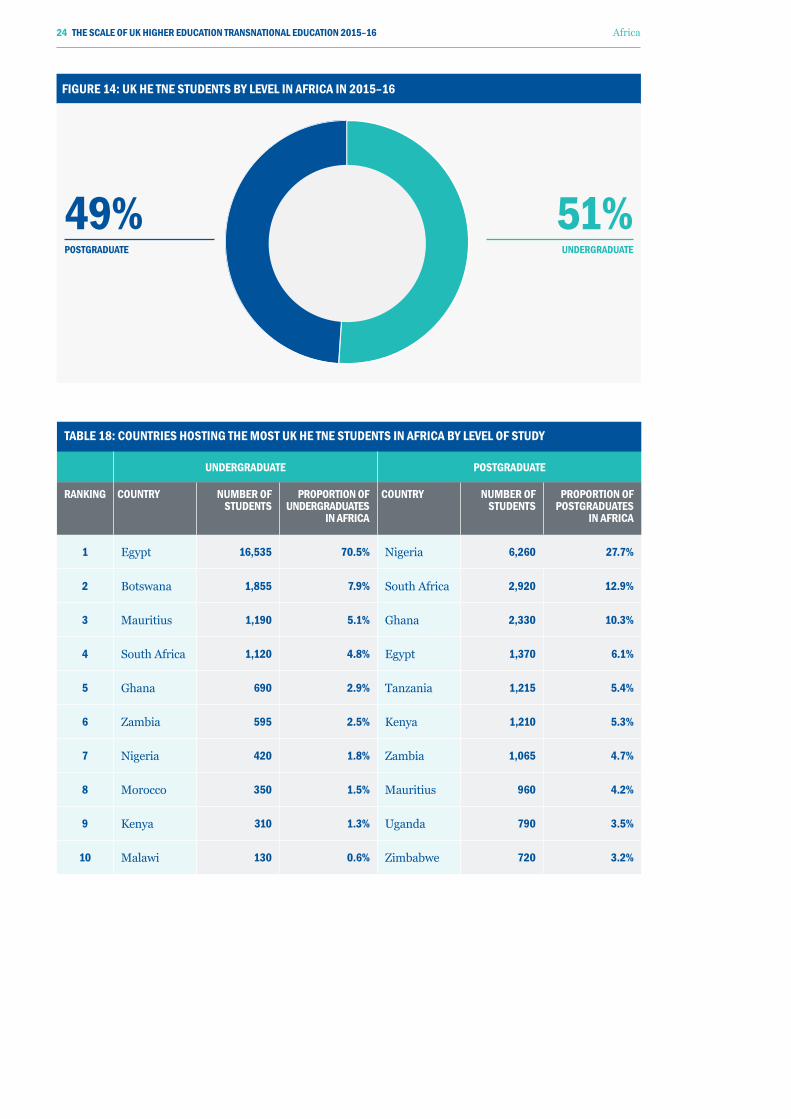
TAbLE 18: COUNTRIES HOSTING THE mOST UK HE TNE STUDENTS IN AFRICA by LEvEL OF STUDy
UNDERGRADUATE pOSTGRADUATE
RANKING COUNTRy NUmbER OF STUDENTS
pROpORTION OF UNDERGRADUATES
IN AFRICA
COUNTRy NUmbER OF STUDENTS
pROpORTION OF pOSTGRADUATES
IN AFRICA
1 Egypt 16,535 70.5% Nigeria 6,260 27.7%
2 Botswana 1,855 7.9% South Africa 2,920 12.9%
3 Mauritius 1,190 5.1% Ghana 2,330 10.3%
4 South Africa 1,120 4.8% Egypt 1,370 6.1%
5 Ghana 690 2.9% Tanzania 1,215 5.4%
6 Zambia 595 2.5% Kenya 1,210 5.3%
7 Nigeria 420 1.8% Zambia 1,065 4.7%
8 Morocco 350 1.5% Mauritius 960 4.2%
9 Kenya 310 1.3% Uganda 790 3.5%
10 Malawi 130 0.6% Zimbabwe 720 3.2%
FIGURE 14: UK HE TNE STUDENTS by LEvEL IN AFRICA IN 2015–16
51% UNDERGRADUATE
49% pOSTGRADUATE
24 THE SCALE OF UK HIGHER EDUCATION TRANSNATIONAL EDUCATION 2015–16 Africa
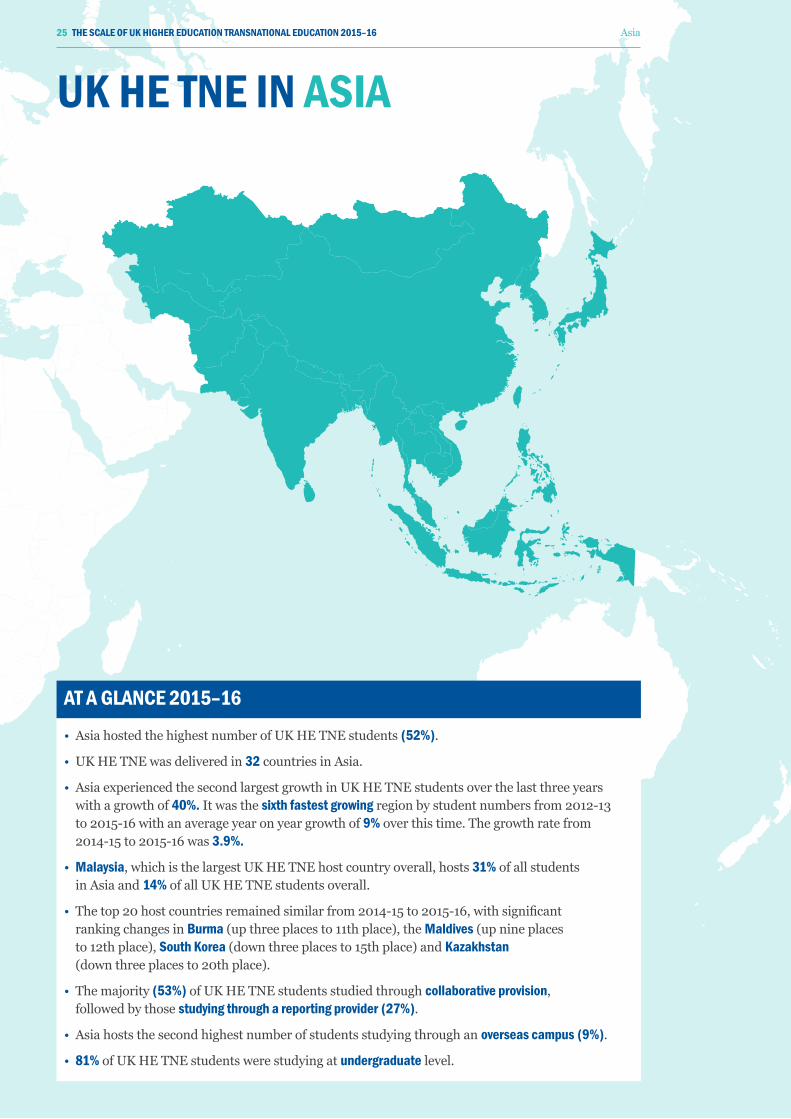
UK HE TNE IN ASIA
AT A GLANCE 2015–16
• Asia hosted the highest number of UK HE TNE students (52%).
• UK HE TNE was delivered in 32 countries in Asia.
• Asia experienced the second largest growth in UK HE TNE students over the last three years with a growth of 40%. It was the sixth fastest growing region by student numbers from 2012-13 to 2015-16 with an average year on year growth of 9% over this time. The growth rate from 2014-15 to 2015-16 was 3.9%.
• malaysia, which is the largest UK HE TNE host country overall, hosts 31% of all students in Asia and 14% of all UK HE TNE students overall.
• The top 20 host countries remained similar from 2014-15 to 2015-16, with significant ranking changes in burma (up three places to 11th place), the maldives (up nine places to 12th place), South Korea (down three places to 15th place) and Kazakhstan (down three places to 20th place).
• The majority (53%) of UK HE TNE students studied through collaborative provision, followed by those studying through a reporting provider (27%).
• Asia hosts the second highest number of students studying through an overseas campus (9%).
• 81% of UK HE TNE students were studying at undergraduate level.
25 THE SCALE OF UK HIGHER EDUCATION TRANSNATIONAL EDUCATION 2015–16 Asia
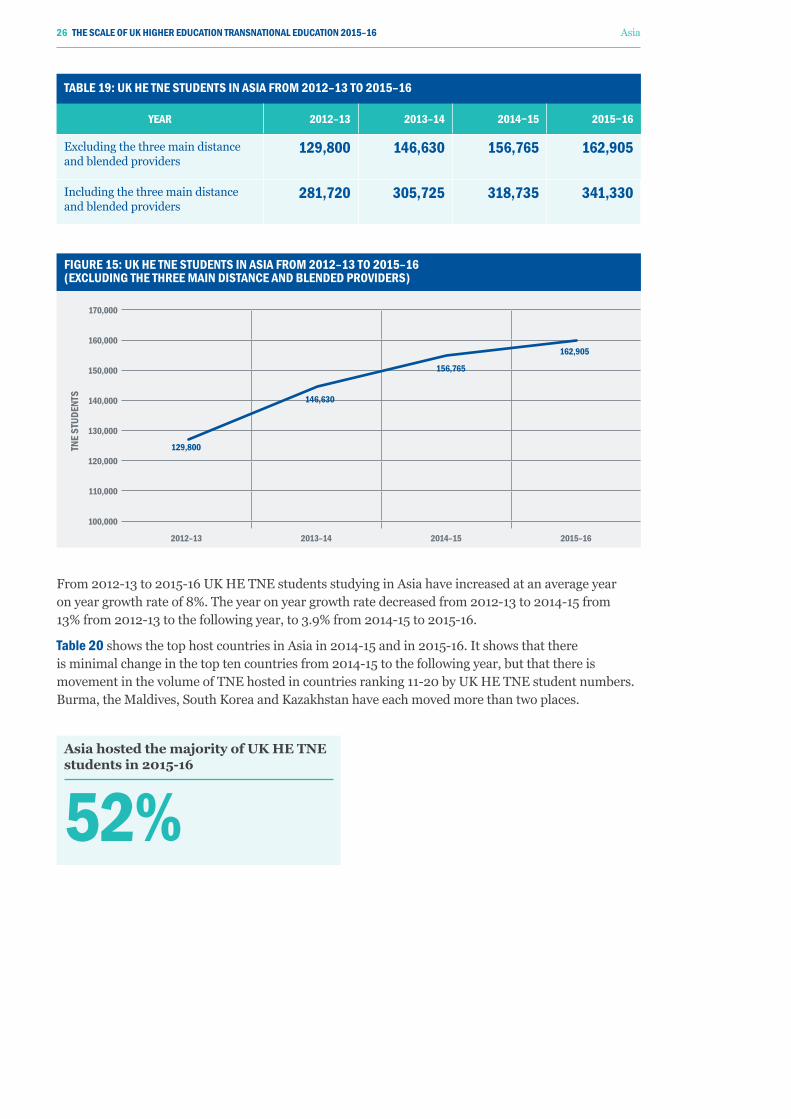
From 2012-13 to 2015-16 UK HE TNE students studying in Asia have increased at an average year on year growth rate of 8%. The year on year growth rate decreased from 2012-13 to 2014-15 from 13% from 2012-13 to the following year, to 3.9% from 2014-15 to 2015-16.
Table 20 shows the top host countries in Asia in 2014-15 and in 2015-16. It shows that there is minimal change in the top ten countries from 2014-15 to the following year, but that there is movement in the volume of TNE hosted in countries ranking 11-20 by UK HE TNE student numbers. Burma, the Maldives, South Korea and Kazakhstan have each moved more than two places.
FIGURE 15: UK HE TNE STUDENTS IN ASIA FROm 2012–13 TO 2015–16 (ExCLUDING THE THREE mAIN DISTANCE AND bLENDED pROvIDERS)
170,000
160,000
150,000
140,000
130,000
120,000
110,000
100,000
2012–13 2013–14 2014–15 2015–16
TNE
STUD
ENTS
129,800
146,630
156,765
162,905
TAbLE 19: UK HE TNE STUDENTS IN ASIA FROm 2012–13 TO 2015–16
yEAR 2012–13 2013–14 2014−15 2015−16
Excluding the three main distance and blended providers
129,800 146,630 156,765 162,905
Including the three main distance and blended providers
281,720 305,725 318,735 341,330
Asia hosted the majority of UK HE TNE students in 2015-16
52%
26 THE SCALE OF UK HIGHER EDUCATION TRANSNATIONAL EDUCATION 2015–16 Asia
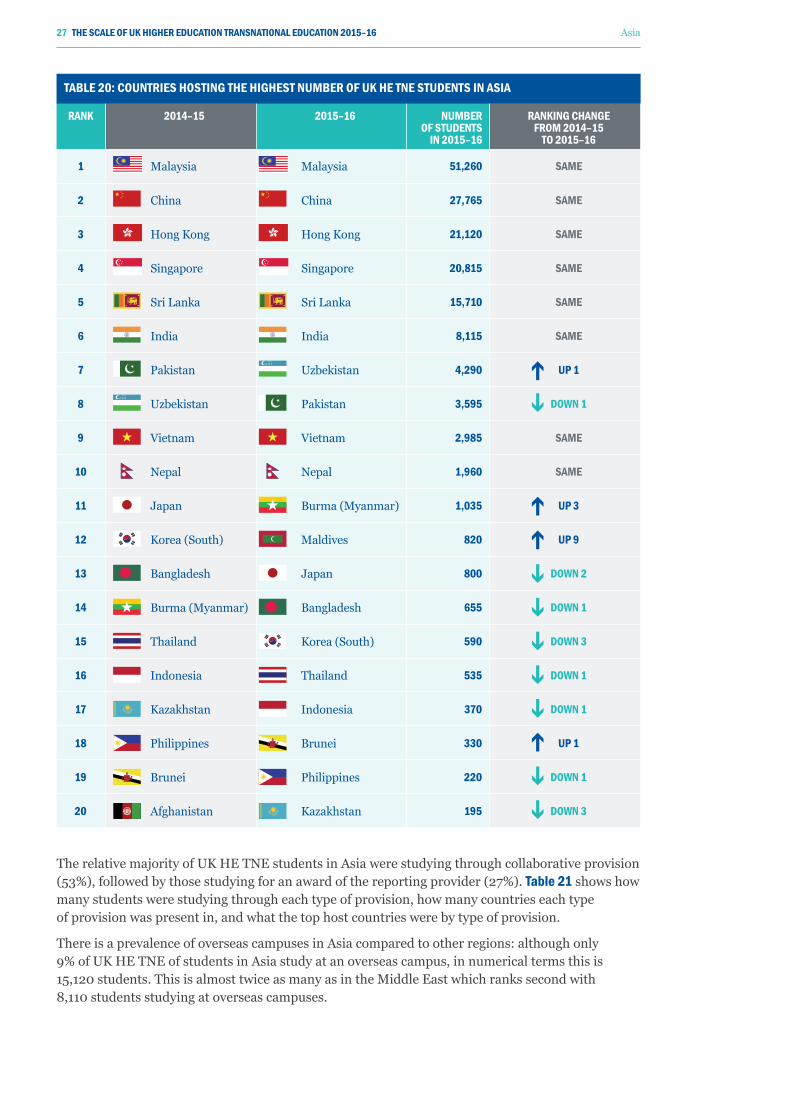
TAbLE 20: COUNTRIES HOSTING THE HIGHEST NUmbER OF UK HE TNE STUDENTS IN ASIA
RANK 2014–15 2015–16 NUmbER OF STUDENTS
IN 2015–16
RANKING CHANGE FROm 2014–15
TO 2015–16
1 Malaysia Malaysia 51,260 SAmE
2 China China 27,765 SAmE
3 Hong Kong Hong Kong 21,120 SAmE
4 Singapore Singapore 20,815 SAmE
5 Sri Lanka Sri Lanka 15,710 SAmE
6 India India 8,115 SAmE
7 Pakistan Uzbekistan 4,290 Up 1
8 Uzbekistan Pakistan 3,595 DOwN 1
9 Vietnam Vietnam 2,985 SAmE
10 Nepal Nepal 1,960 SAmE
11 Japan Burma (Myanmar) 1,035 Up 3
12 Korea (South) Maldives 820 Up 9
13 Bangladesh Japan 800 DOwN 2
14 Burma (Myanmar) Bangladesh 655 DOwN 1
15 Thailand Korea (South) 590 DOwN 3
16 Indonesia Thailand 535 DOwN 1
17 Kazakhstan Indonesia 370 DOwN 1
18 Philippines Brunei 330 Up 1
19 Brunei Philippines 220 DOwN 1
20 Afghanistan Kazakhstan 195 DOwN 3
The relative majority of UK HE TNE students in Asia were studying through collaborative provision (53%), followed by those studying for an award of the reporting provider (27%). Table 21 shows how many students were studying through each type of provision, how many countries each type of provision was present in, and what the top host countries were by type of provision.
There is a prevalence of overseas campuses in Asia compared to other regions: although only 9% of UK HE TNE of students in Asia study at an overseas campus, in numerical terms this is 15,120 students. This is almost twice as many as in the Middle East which ranks second with 8,110 students studying at overseas campuses.
27 THE SCALE OF UK HIGHER EDUCATION TRANSNATIONAL EDUCATION 2015–16 Asia
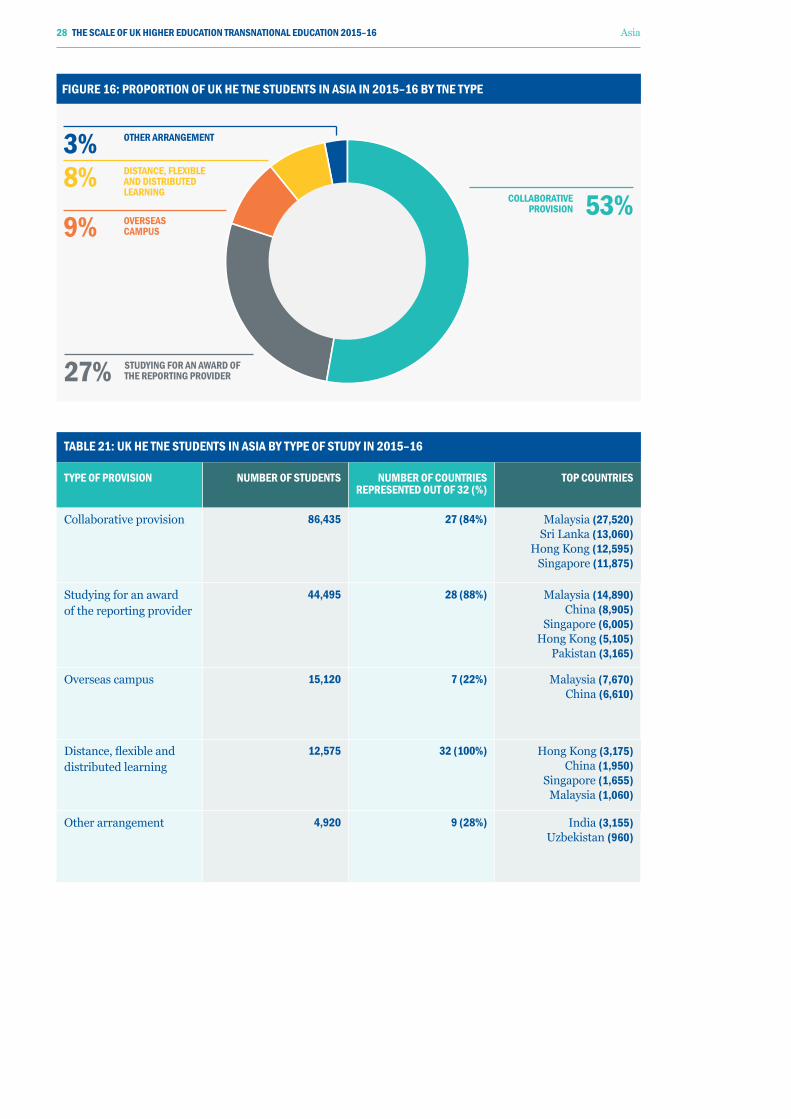
FIGURE 16: pROpORTION OF UK HE TNE STUDENTS IN ASIA IN 2015–16 by TNE TypE
TAbLE 21: UK HE TNE STUDENTS IN ASIA by TypE OF STUDy IN 2015–16
TypE OF pROvISION NUmbER OF STUDENTS NUmbER OF COUNTRIES REpRESENTED OUT OF 32 (%)
TOp COUNTRIES
Collaborative provision 86,435 27 (84%) Malaysia (27,520)Sri Lanka (13,060)
Hong Kong (12,595)Singapore (11,875)
Studying for an award of the reporting provider
44,495 28 (88%) Malaysia (14,890)China (8,905)
Singapore (6,005)Hong Kong (5,105)
Pakistan (3,165)
Overseas campus 15,120 7 (22%) Malaysia (7,670)China (6,610)
Distance, flexible and distributed learning
12,575 32 (100%) Hong Kong (3,175)China (1,950)
Singapore (1,655)Malaysia (1,060)
Other arrangement 4,920 9 (28%) India (3,155)Uzbekistan (960)
COLLAbORATIvE pROvISION
OvERSEAS CAmpUS
DISTANCE, FLExIbLE AND DISTRIbUTED LEARNING
OTHER ARRANGEmENT
STUDyING FOR AN AwARD OF THE REpORTING pROvIDER
53%9%
8%3%
27%
28 THE SCALE OF UK HIGHER EDUCATION TRANSNATIONAL EDUCATION 2015–16 Asia
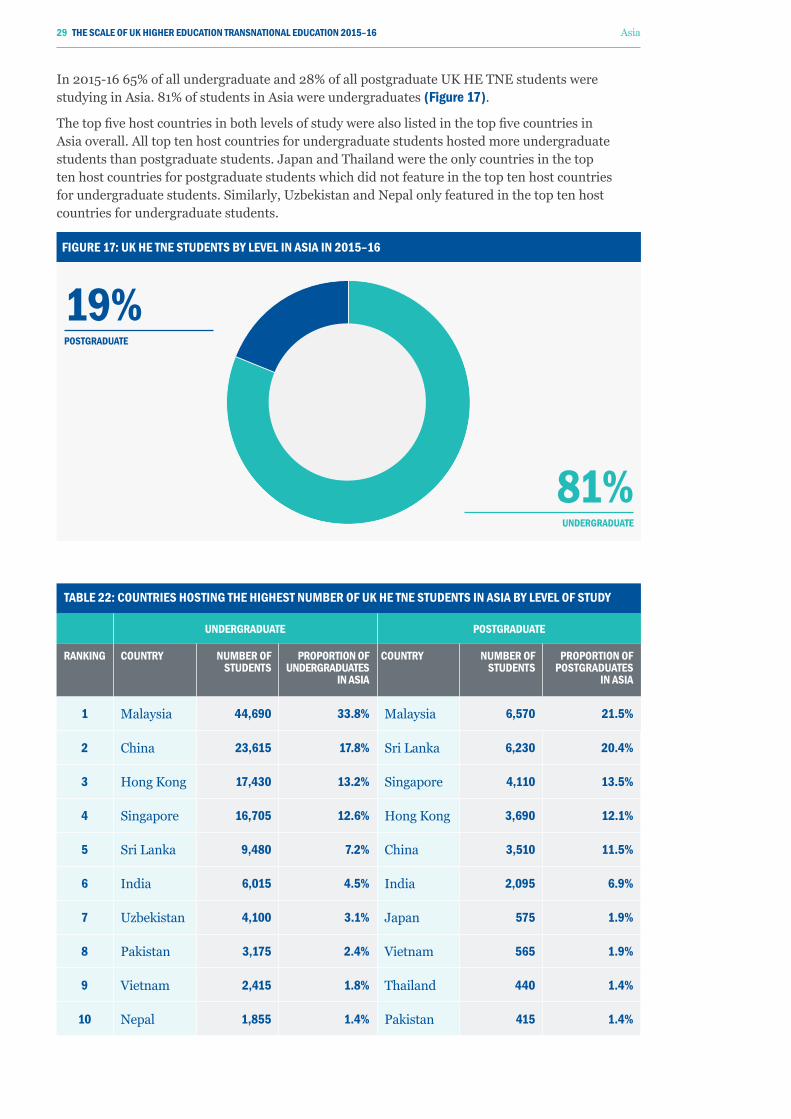
In 2015-16 65% of all undergraduate and 28% of all postgraduate UK HE TNE students were studying in Asia. 81% of students in Asia were undergraduates (Figure 17).
The top five host countries in both levels of study were also listed in the top five countries in Asia overall. All top ten host countries for undergraduate students hosted more undergraduate students than postgraduate students. Japan and Thailand were the only countries in the top ten host countries for postgraduate students which did not feature in the top ten host countries for undergraduate students. Similarly, Uzbekistan and Nepal only featured in the top ten host countries for undergraduate students.
FIGURE 17: UK HE TNE STUDENTS by LEvEL IN ASIA IN 2015–16
81% UNDERGRADUATE
19% pOSTGRADUATE
TAbLE 22: COUNTRIES HOSTING THE HIGHEST NUmbER OF UK HE TNE STUDENTS IN ASIA by LEvEL OF STUDy
UNDERGRADUATE pOSTGRADUATE
RANKING COUNTRy NUmbER OF STUDENTS
pROpORTION OF UNDERGRADUATES
IN ASIA
COUNTRy NUmbER OF STUDENTS
pROpORTION OF pOSTGRADUATES
IN ASIA
1 Malaysia 44,690 33.8% Malaysia 6,570 21.5%
2 China 23,615 17.8% Sri Lanka 6,230 20.4%
3 Hong Kong 17,430 13.2% Singapore 4,110 13.5%
4 Singapore 16,705 12.6% Hong Kong 3,690 12.1%
5 Sri Lanka 9,480 7.2% China 3,510 11.5%
6 India 6,015 4.5% India 2,095 6.9%
7 Uzbekistan 4,100 3.1% Japan 575 1.9%
8 Pakistan 3,175 2.4% Vietnam 565 1.9%
9 Vietnam 2,415 1.8% Thailand 440 1.4%
10 Nepal 1,855 1.4% Pakistan 415 1.4%
29 THE SCALE OF UK HIGHER EDUCATION TRANSNATIONAL EDUCATION 2015–16 Asia
UK HE TNE IN AUSTRALASIA
AT A GLANCE 2015–16
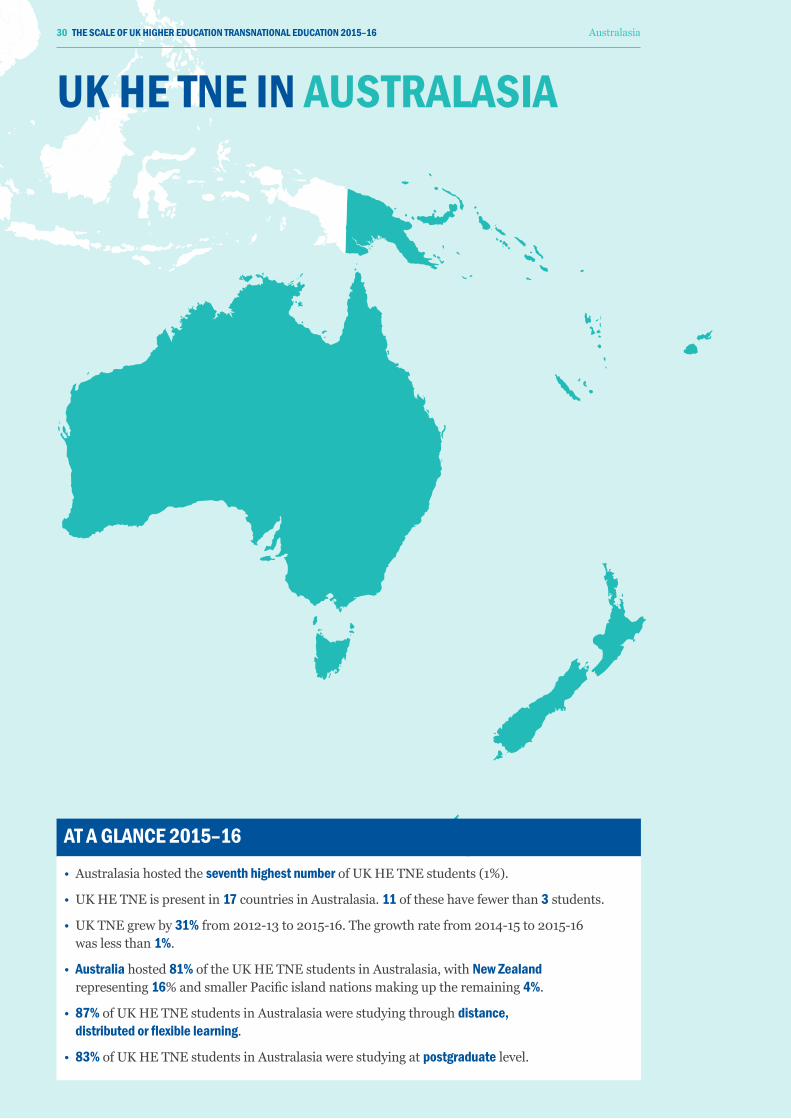
• Australasia hosted the seventh highest number of UK HE TNE students (1%).
• UK HE TNE is present in 17 countries in Australasia. 11 of these have fewer than 3 students.
• UK TNE grew by 31% from 2012-13 to 2015-16. The growth rate from 2014-15 to 2015-16 was less than 1%.
• Australia hosted 81% of the UK HE TNE students in Australasia, with New Zealand representing 16% and smaller Pacific island nations making up the remaining 4%.
• 87% of UK HE TNE students in Australasia were studying through distance, distributed or flexible learning.
• 83% of UK HE TNE students in Australasia were studying at postgraduate level.
30 THE SCALE OF UK HIGHER EDUCATION TRANSNATIONAL EDUCATION 2015–16 Australasia
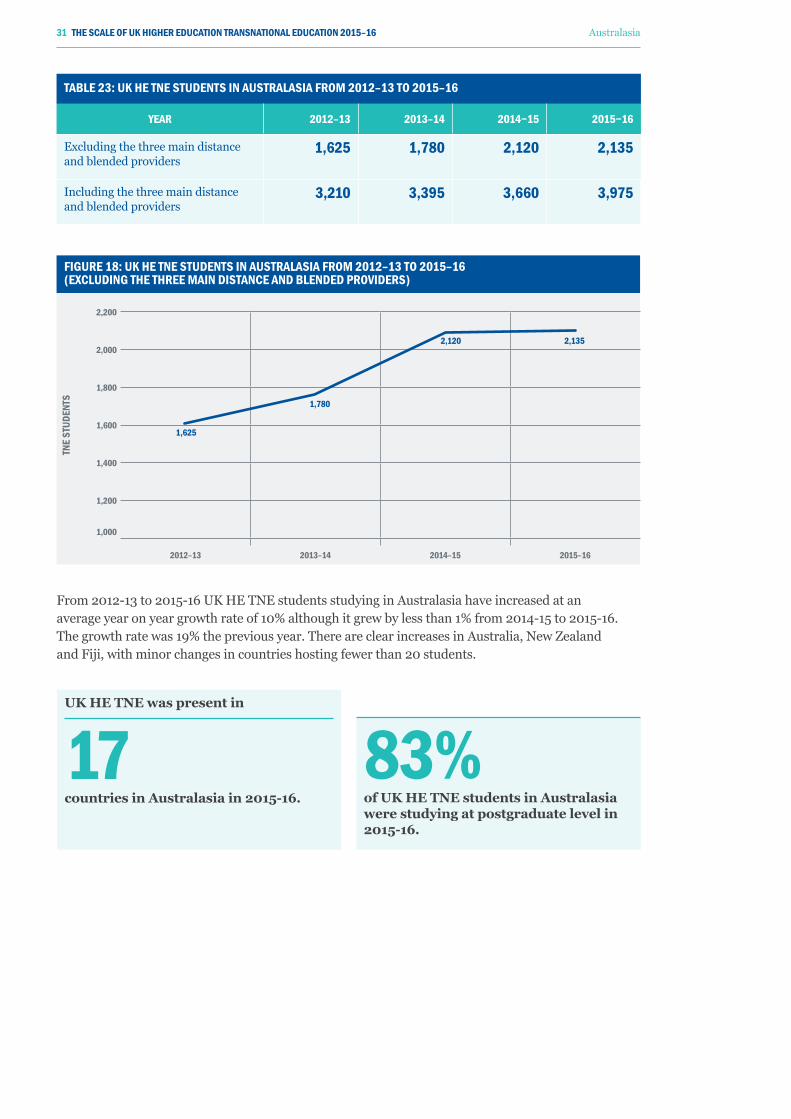
TAbLE 23: UK HE TNE STUDENTS IN AUSTRALASIA FROm 2012–13 TO 2015–16
yEAR 2012–13 2013–14 2014−15 2015−16
Excluding the three main distance and blended providers
1,625 1,780 2,120 2,135
Including the three main distance and blended providers
3,210 3,395 3,660 3,975
FIGURE 18: UK HE TNE STUDENTS IN AUSTRALASIA FROm 2012–13 TO 2015–16 (ExCLUDING THE THREE mAIN DISTANCE AND bLENDED pROvIDERS)
TNE
STUD
ENTS
2,200
2,000
1,800
1,600
1,400
1,200
1,000
2012–13 2013–14 2014–15 2015–16
1,625
1,780
2,120 2,135
From 2012-13 to 2015-16 UK HE TNE students studying in Australasia have increased at an average year on year growth rate of 10% although it grew by less than 1% from 2014-15 to 2015-16. The growth rate was 19% the previous year. There are clear increases in Australia, New Zealand and Fiji, with minor changes in countries hosting fewer than 20 students.
83% of UK HE TNE students in Australasia were studying at postgraduate level in 2015-16.
UK HE TNE was present in
17 countries in Australasia in 2015-16.
31 THE SCALE OF UK HIGHER EDUCATION TRANSNATIONAL EDUCATION 2015–16 Australasia
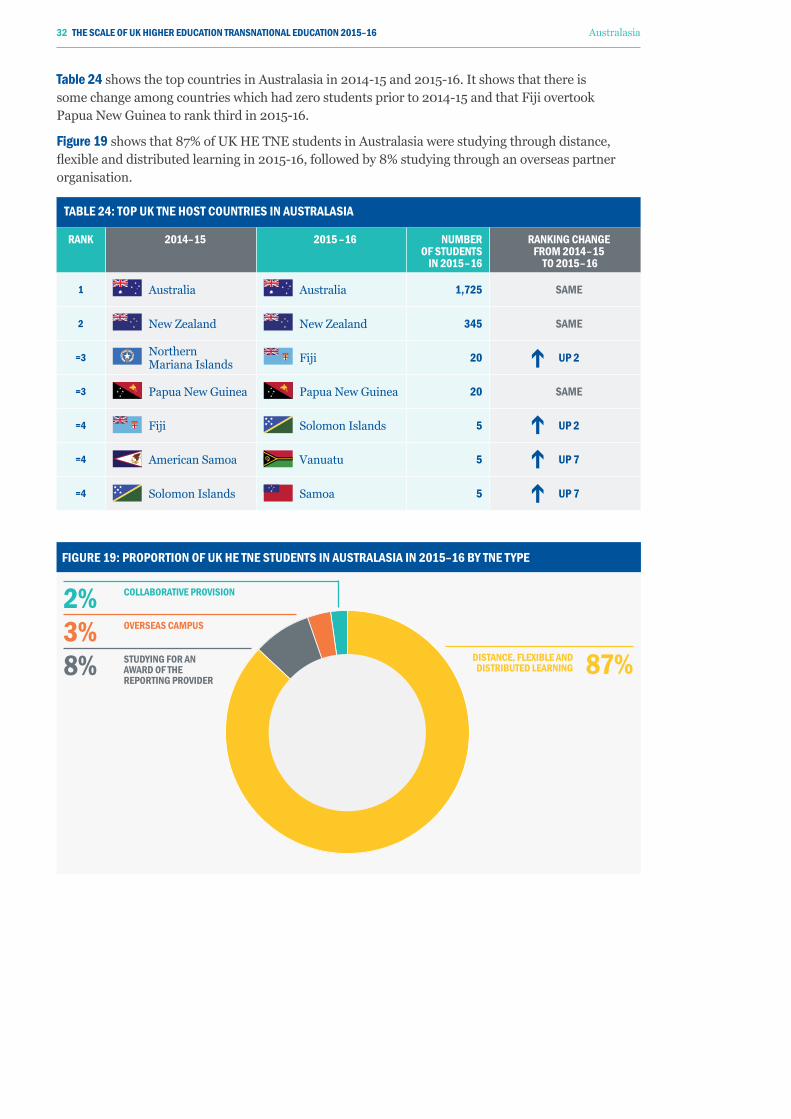
TAbLE 24: TOp UK TNE HOST COUNTRIES IN AUSTRALASIA
RANK 2014–15 2015 –16 NUmbER OF STUDENTS
IN 2015–16
RANKING CHANGE FROm 2014–15
TO 2015–16
1 Australia Australia 1,725 SAmE
2 New Zealand New Zealand 345 SAmE
=3 Northern Mariana Islands Fiji 20 Up 2
=3 Papua New Guinea Papua New Guinea 20 SAmE
=4 Fiji Solomon Islands 5 Up 2
=4 American Samoa Vanuatu 5 Up 7
=4 Solomon Islands Samoa 5 Up 7
FIGURE 19: pROpORTION OF UK HE TNE STUDENTS IN AUSTRALASIA IN 2015–16 by TNE TypE
87%
Table 24 shows the top countries in Australasia in 2014-15 and 2015-16. It shows that there is some change among countries which had zero students prior to 2014-15 and that Fiji overtook Papua New Guinea to rank third in 2015-16.
Figure 19 shows that 87% of UK HE TNE students in Australasia were studying through distance, flexible and distributed learning in 2015-16, followed by 8% studying through an overseas partner organisation.
DISTANCE, FLExIbLE AND DISTRIbUTED LEARNING
STUDyING FOR AN AwARD OF THE REpORTING pROvIDER
OvERSEAS CAmpUS
COLLAbORATIvE pROvISION
87%8%3%2%
32 THE SCALE OF UK HIGHER EDUCATION TRANSNATIONAL EDUCATION 2015–16 Australasia
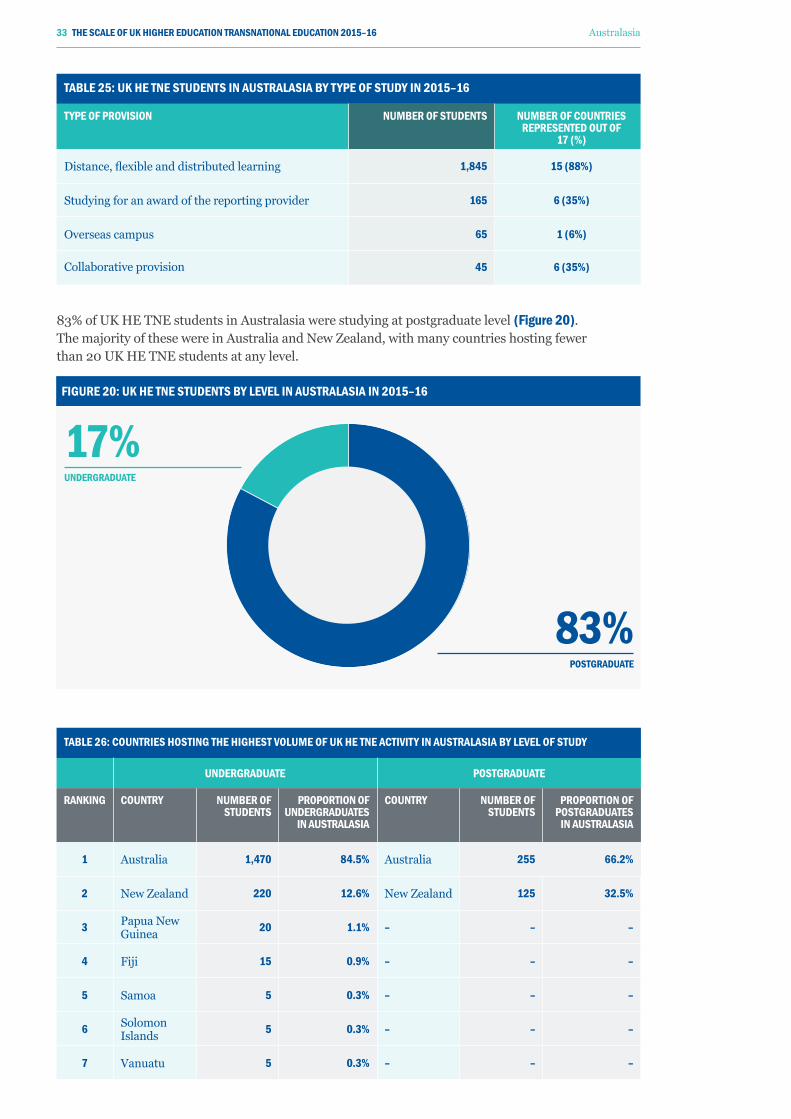
TAbLE 25: UK HE TNE STUDENTS IN AUSTRALASIA by TypE OF STUDy IN 2015–16
TypE OF pROvISION NUmbER OF STUDENTS NUmbER OF COUNTRIES REpRESENTED OUT OF
17 (%)
Distance, flexible and distributed learning 1,845 15 (88%)
Studying for an award of the reporting provider 165 6 (35%)
Overseas campus 65 1 (6%)
Collaborative provision 45 6 (35%)
FIGURE 20: UK HE TNE STUDENTS by LEvEL IN AUSTRALASIA IN 2015–16
83% of UK HE TNE students in Australasia were studying at postgraduate level (Figure 20). The majority of these were in Australia and New Zealand, with many countries hosting fewer than 20 UK HE TNE students at any level.
83% pOSTGRADUATE
17% UNDERGRADUATE
TAbLE 26: COUNTRIES HOSTING THE HIGHEST vOLUmE OF UK HE TNE ACTIvITy IN AUSTRALASIA by LEvEL OF STUDy
UNDERGRADUATE pOSTGRADUATE
RANKING COUNTRy NUmbER OF STUDENTS
pROpORTION OF UNDERGRADUATES
IN AUSTRALASIA
COUNTRy NUmbER OF STUDENTS
pROpORTION OF pOSTGRADUATES
IN AUSTRALASIA
1 Australia 1,470 84.5% Australia 255 66.2%
2 New Zealand 220 12.6% New Zealand 125 32.5%
3 Papua New Guinea 20 1.1% – – –
4 Fiji 15 0.9% – – –
5 Samoa 5 0.3% – – –
6 Solomon Islands 5 0.3% – – –
7 Vanuatu 5 0.3% – – –
33 THE SCALE OF UK HIGHER EDUCATION TRANSNATIONAL EDUCATION 2015–16 Australasia
UK HE TNE IN THE EUROpEAN UNION
18. This excludes four UK Crown Dependencies
AT A GLANCE 2015–16
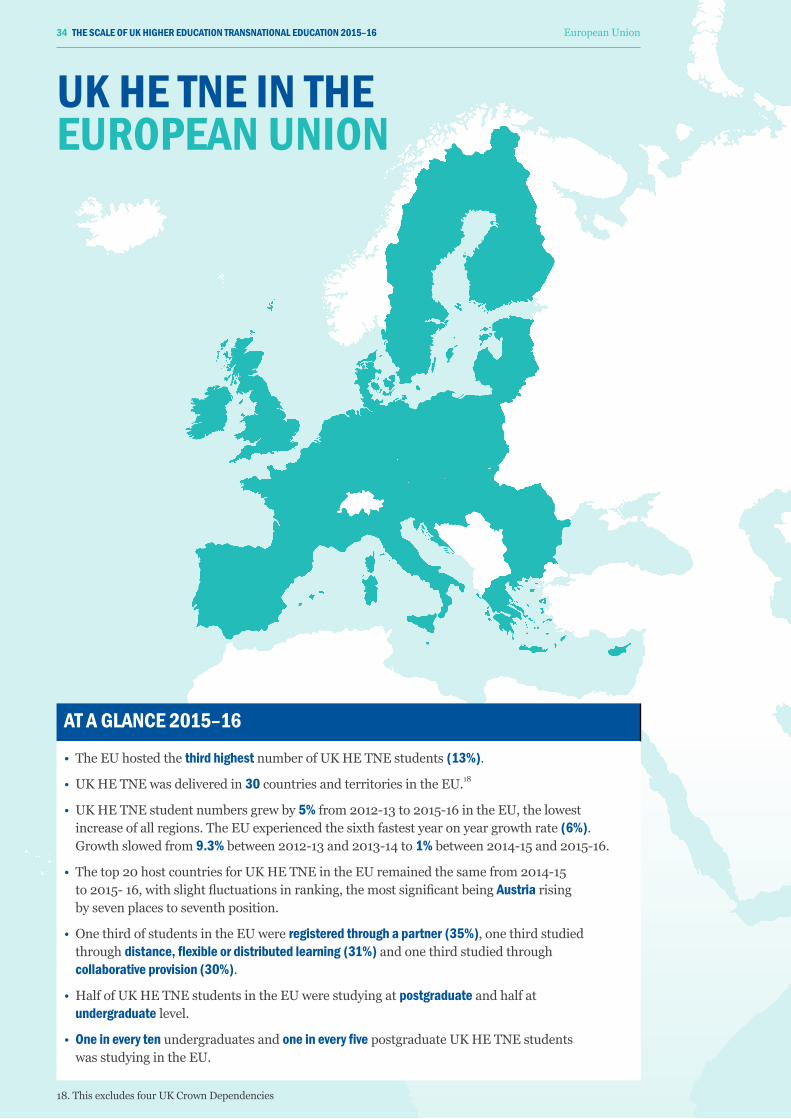
• The EU hosted the third highest number of UK HE TNE students (13%).
• UK HE TNE was delivered in 30 countries and territories in the EU.18
• UK HE TNE student numbers grew by 5% from 2012-13 to 2015-16 in the EU, the lowest increase of all regions. The EU experienced the sixth fastest year on year growth rate (6%). Growth slowed from 9.3% between 2012-13 and 2013-14 to 1% between 2014-15 and 2015-16.
• The top 20 host countries for UK HE TNE in the EU remained the same from 2014-15 to 2015- 16, with slight fluctuations in ranking, the most significant being Austria rising by seven places to seventh position.
• One third of students in the EU were registered through a partner (35%), one third studied through distance, flexible or distributed learning (31%) and one third studied through collaborative provision (30%).
• Half of UK HE TNE students in the EU were studying at postgraduate and half at undergraduate level.
• One in every ten undergraduates and one in every five postgraduate UK HE TNE students was studying in the EU.
34 THE SCALE OF UK HIGHER EDUCATION TRANSNATIONAL EDUCATION 2015–16 European Union
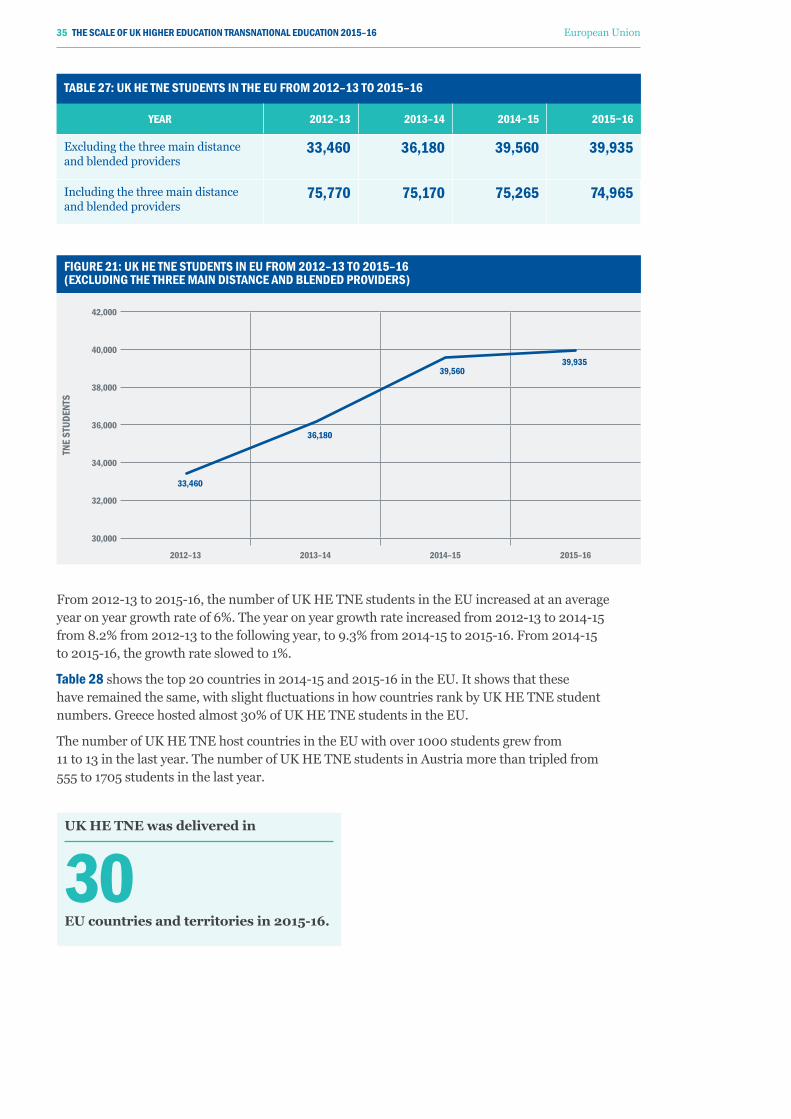
TAbLE 27: UK HE TNE STUDENTS IN THE EU FROm 2012–13 TO 2015–16
yEAR 2012–13 2013–14 2014−15 2015−16
Excluding the three main distance and blended providers
33,460 36,180 39,560 39,935
Including the three main distance and blended providers
75,770 75,170 75,265 74,965
From 2012-13 to 2015-16, the number of UK HE TNE students in the EU increased at an average year on year growth rate of 6%. The year on year growth rate increased from 2012-13 to 2014-15 from 8.2% from 2012-13 to the following year, to 9.3% from 2014-15 to 2015-16. From 2014-15 to 2015-16, the growth rate slowed to 1%.
Table 28 shows the top 20 countries in 2014-15 and 2015-16 in the EU. It shows that these have remained the same, with slight fluctuations in how countries rank by UK HE TNE student numbers. Greece hosted almost 30% of UK HE TNE students in the EU.
The number of UK HE TNE host countries in the EU with over 1000 students grew from 11 to 13 in the last year. The number of UK HE TNE students in Austria more than tripled from 555 to 1705 students in the last year.
FIGURE 21: UK HE TNE STUDENTS IN EU FROm 2012–13 TO 2015–16 (ExCLUDING THE THREE mAIN DISTANCE AND bLENDED pROvIDERS)
TNE
STUD
ENTS
42,000
40,000
38,000
36,000
34,000
32,000
30,000
2012–13 2013–14 2014–15 2015–16
33,460
36,180
39,56039,935
UK HE TNE was delivered in
30 EU countries and territories in 2015-16.
35 THE SCALE OF UK HIGHER EDUCATION TRANSNATIONAL EDUCATION 2015–16 European Union
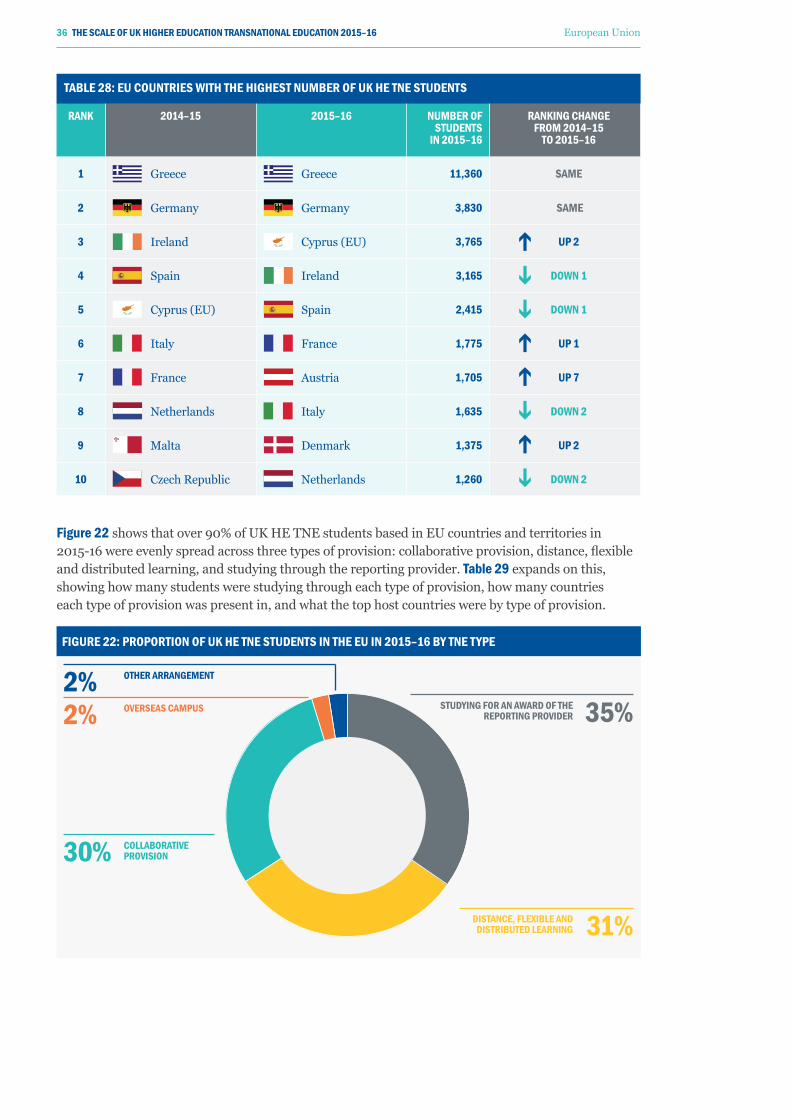
Figure 22 shows that over 90% of UK HE TNE students based in EU countries and territories in 2015-16 were evenly spread across three types of provision: collaborative provision, distance, flexible and distributed learning, and studying through the reporting provider. Table 29 expands on this, showing how many students were studying through each type of provision, how many countries each type of provision was present in, and what the top host countries were by type of provision.
FIGURE 22: pROpORTION OF UK HE TNE STUDENTS IN THE EU IN 2015–16 by TNE TypE
TAbLE 28: EU COUNTRIES wITH THE HIGHEST NUmbER OF UK HE TNE STUDENTS
RANK 2014–15 2015–16 NUmbER OF STUDENTS
IN 2015–16
RANKING CHANGE FROm 2014–15
TO 2015–16
1 Greece Greece 11,360 SAmE
2 Germany Germany 3,830 SAmE
3 Ireland Cyprus (EU) 3,765 Up 2
4 Spain Ireland 3,165 DOwN 1
5 Cyprus (EU) Spain 2,415 DOwN 1
6 Italy France 1,775 Up 1
7 France Austria 1,705 Up 7
8 Netherlands Italy 1,635 DOwN 2
9 Malta Denmark 1,375 Up 2
10 Czech Republic Netherlands 1,260 DOwN 2
STUDyING FOR AN AwARD OF THE REpORTING pROvIDER
DISTANCE, FLExIbLE AND DISTRIbUTED LEARNING
OvERSEAS CAmpUS
OTHER ARRANGEmENT
COLLAbORATIvE pROvISION
35%
31%
2%2%
30%
36 THE SCALE OF UK HIGHER EDUCATION TRANSNATIONAL EDUCATION 2015–16 European Union
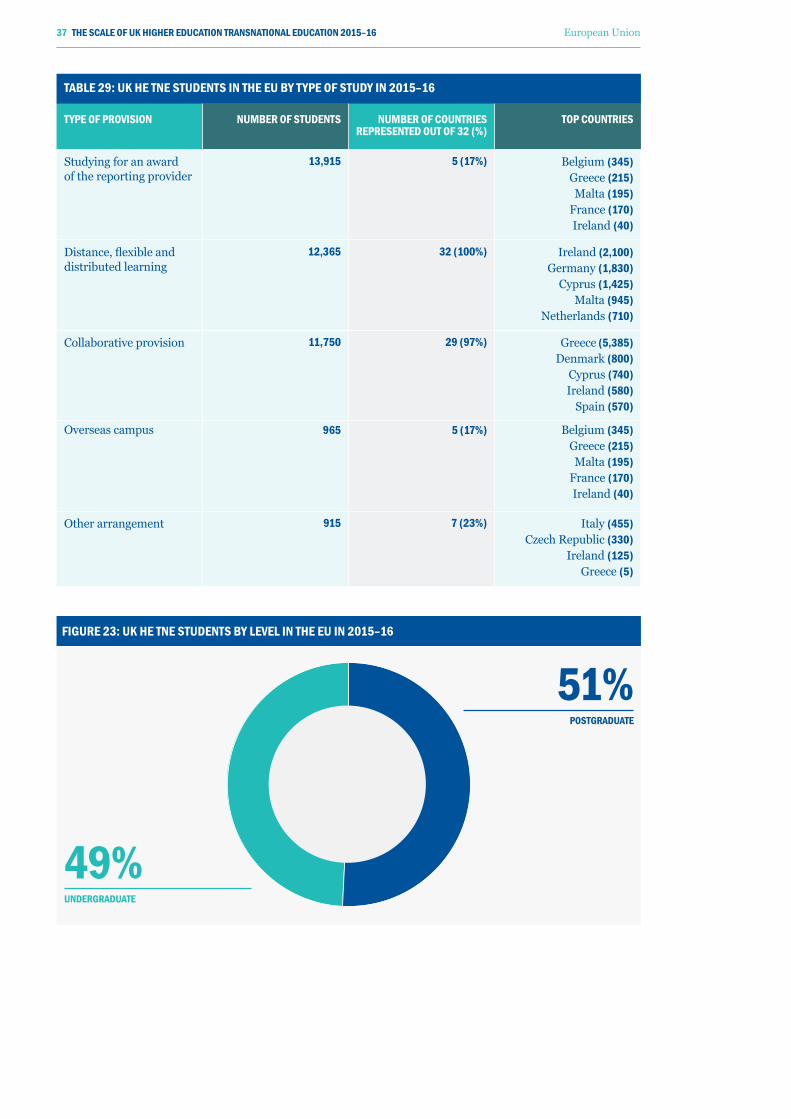
FIGURE 23: UK HE TNE STUDENTS by LEvEL IN THE EU IN 2015–16
51% pOSTGRADUATE
49% UNDERGRADUATE
TAbLE 29: UK HE TNE STUDENTS IN THE EU by TypE OF STUDy IN 2015–16
TypE OF pROvISION NUmbER OF STUDENTS NUmbER OF COUNTRIES REpRESENTED OUT OF 32 (%)
TOp COUNTRIES
Studying for an award of the reporting provider
13,915 5 (17%) Belgium (345)Greece (215)Malta (195)
France (170)Ireland (40)
Distance, flexible and distributed learning
12,365 32 (100%) Ireland (2,100)Germany (1,830)
Cyprus (1,425)Malta (945)
Netherlands (710)
Collaborative provision 11,750 29 (97%) Greece (5,385) Denmark (800)
Cyprus (740)Ireland (580)
Spain (570)
Overseas campus 965 5 (17%) Belgium (345)Greece (215) Malta (195)
France (170)Ireland (40)
Other arrangement 915 7 (23%) Italy (455) Czech Republic (330)
Ireland (125) Greece (5)
37 THE SCALE OF UK HIGHER EDUCATION TRANSNATIONAL EDUCATION 2015–16 European Union
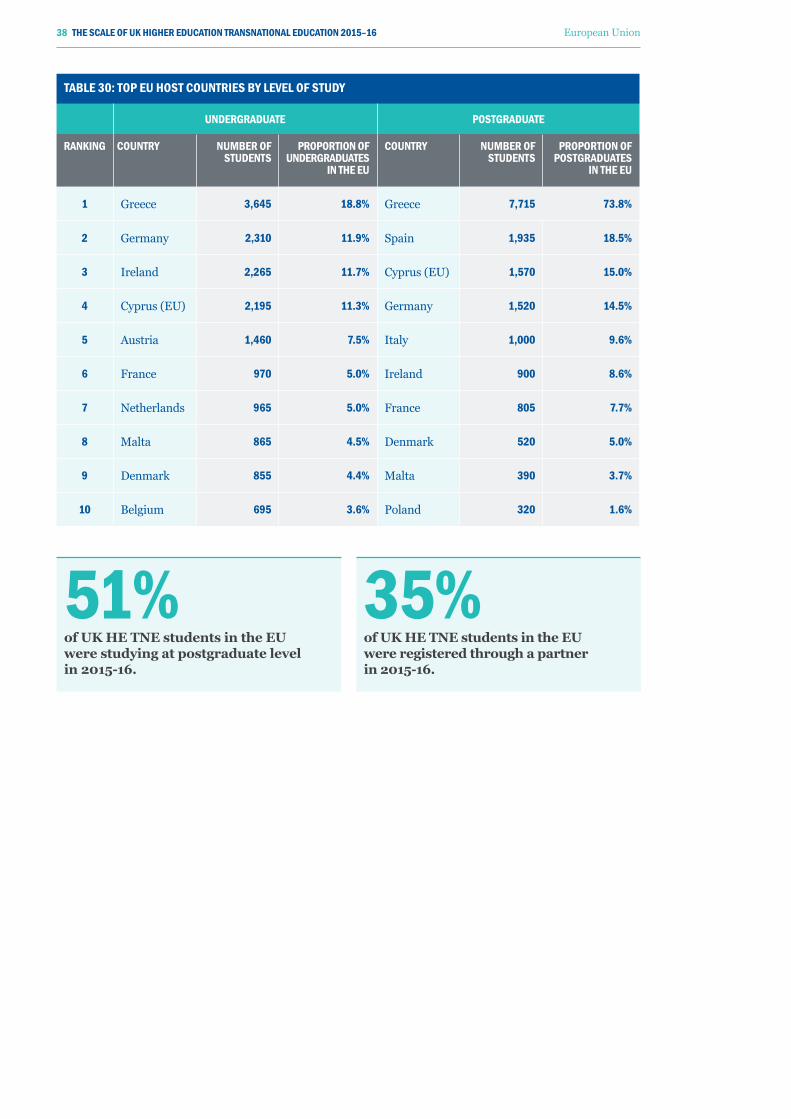
TAbLE 30: TOp EU HOST COUNTRIES by LEvEL OF STUDy
UNDERGRADUATE pOSTGRADUATE
RANKING COUNTRy NUmbER OF STUDENTS
pROpORTION OF UNDERGRADUATES
IN THE EU
COUNTRy NUmbER OF STUDENTS
pROpORTION OF pOSTGRADUATES
IN THE EU
1 Greece 3,645 18.8% Greece 7,715 73.8%
2 Germany 2,310 11.9% Spain 1,935 18.5%
3 Ireland 2,265 11.7% Cyprus (EU) 1,570 15.0%
4 Cyprus (EU) 2,195 11.3% Germany 1,520 14.5%
5 Austria 1,460 7.5% Italy 1,000 9.6%
6 France 970 5.0% Ireland 900 8.6%
7 Netherlands 965 5.0% France 805 7.7%
8 Malta 865 4.5% Denmark 520 5.0%
9 Denmark 855 4.4% Malta 390 3.7%
10 Belgium 695 3.6% Poland 320 1.6%
51% of UK HE TNE students in the EU were studying at postgraduate level in 2015-16.
35% of UK HE TNE students in the EU were registered through a partner in 2015-16.
38 THE SCALE OF UK HIGHER EDUCATION TRANSNATIONAL EDUCATION 2015–16 European Union
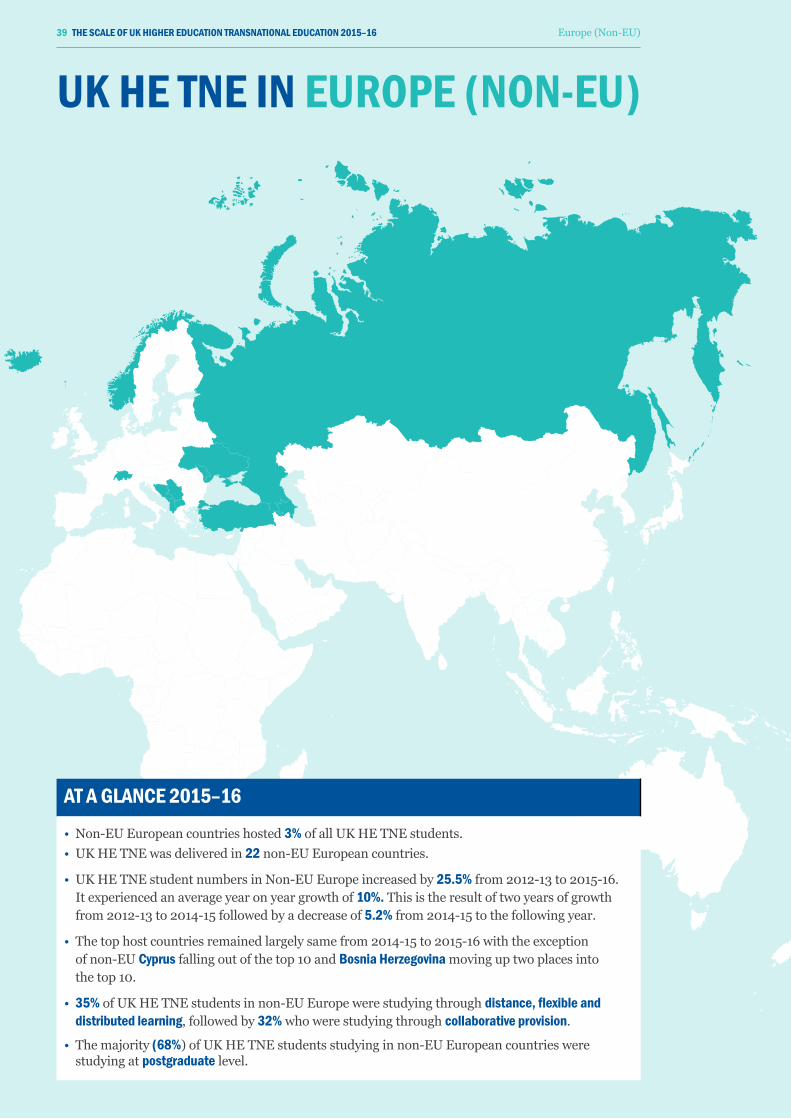
UK HE TNE IN EUROpE (NON-EU)
AT A GLANCE 2015–16
• Non-EU European countries hosted 3% of all UK HE TNE students. • UK HE TNE was delivered in 22 non-EU European countries.
• UK HE TNE student numbers in Non-EU Europe increased by 25.5% from 2012-13 to 2015-16. It experienced an average year on year growth of 10%. This is the result of two years of growth from 2012-13 to 2014-15 followed by a decrease of 5.2% from 2014-15 to the following year.
• The top host countries remained largely same from 2014-15 to 2015-16 with the exception of non-EU Cyprus falling out of the top 10 and Bosnia Herzegovina moving up two places into the top 10.
• 35% of UK HE TNE students in non-EU Europe were studying through distance, flexible and distributed learning, followed by 32% who were studying through collaborative provision.
• The majority (68%) of UK HE TNE students studying in non-EU European countries were studying at postgraduate level.
39 THE SCALE OF UK HIGHER EDUCATION TRANSNATIONAL EDUCATION 2015–16 Europe (Non-EU)
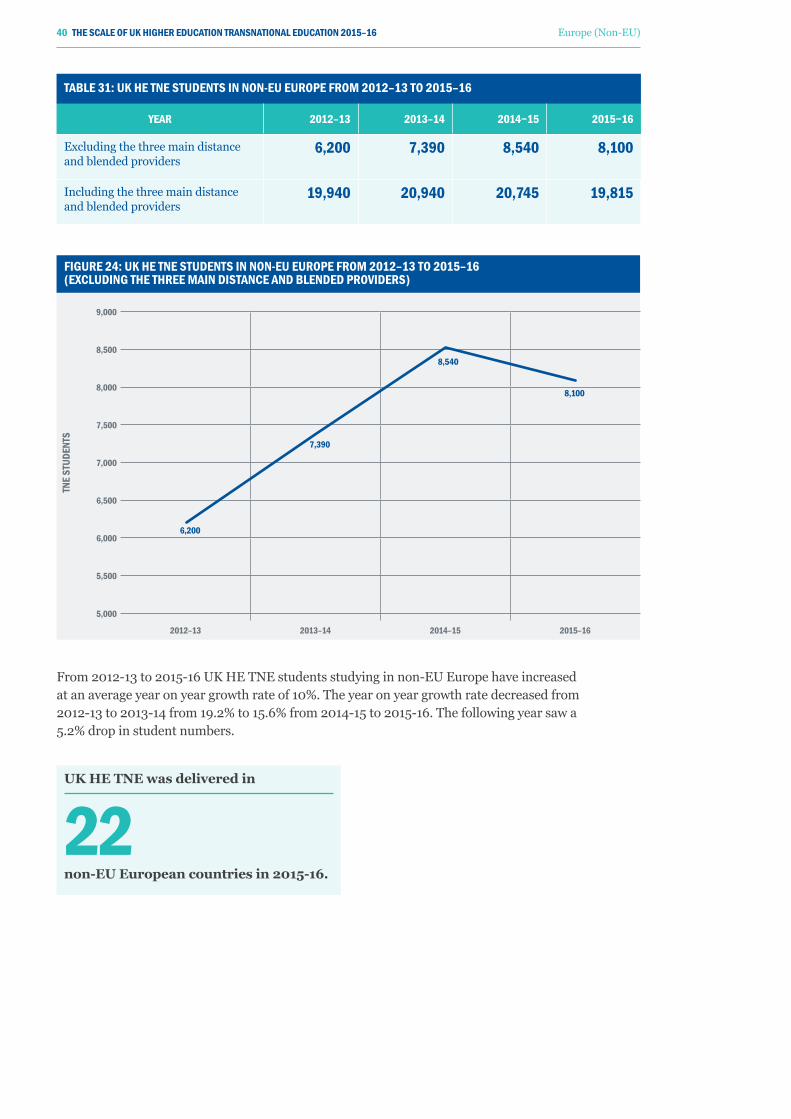
TAbLE 31: UK HE TNE STUDENTS IN NON-EU EUROpE FROm 2012–13 TO 2015–16
yEAR 2012–13 2013–14 2014−15 2015−16
Excluding the three main distance and blended providers
6,200 7,390 8,540 8,100
Including the three main distance and blended providers
19,940 20,940 20,745 19,815
From 2012-13 to 2015-16 UK HE TNE students studying in non-EU Europe have increased at an average year on year growth rate of 10%. The year on year growth rate decreased from 2012-13 to 2013-14 from 19.2% to 15.6% from 2014-15 to 2015-16. The following year saw a 5.2% drop in student numbers.
FIGURE 24: UK HE TNE STUDENTS IN NON-EU EUROpE FROm 2012–13 TO 2015–16 (ExCLUDING THE THREE mAIN DISTANCE AND bLENDED pROvIDERS)
TNE
STUD
ENTS
9,000
8,500
8,000
7,500
7,000
6,500
6,000
5,500
5,000
2012–13 2013–14 2014–15 2015–16
6,200
7,390
8,540
8,100
UK HE TNE was delivered in
22 non-EU European countries in 2015-16.
40 THE SCALE OF UK HIGHER EDUCATION TRANSNATIONAL EDUCATION 2015–16 Europe (Non-EU)
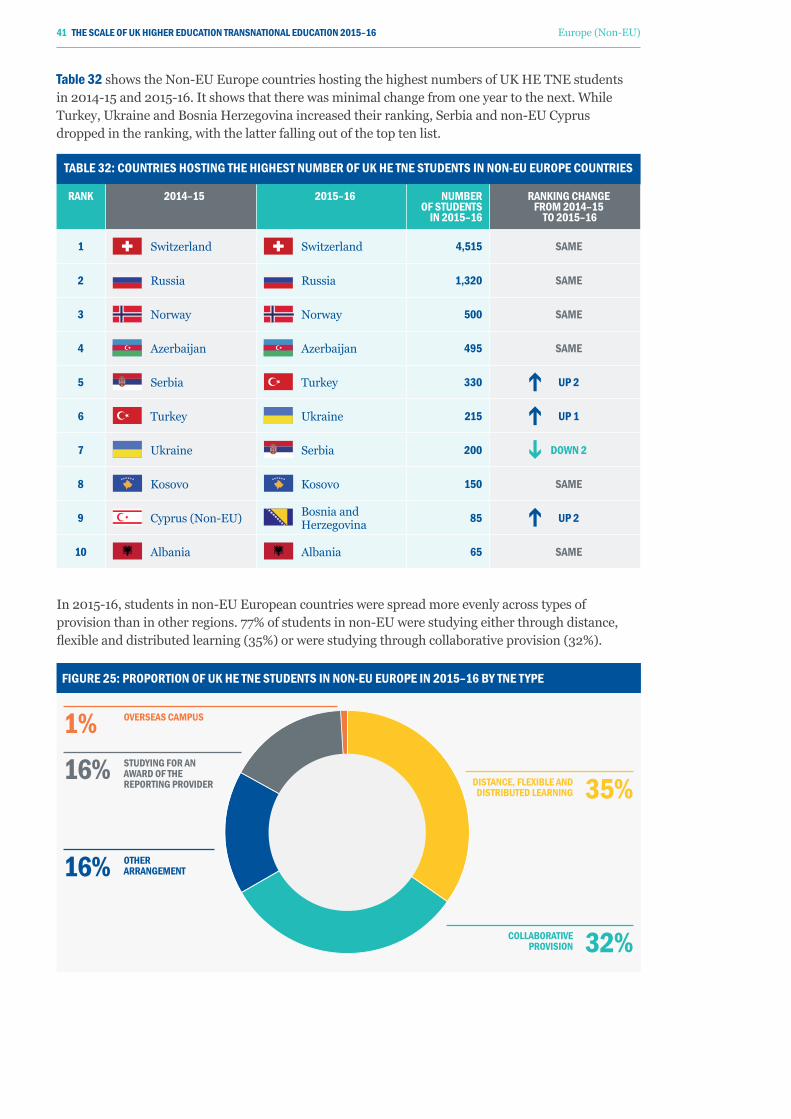
TAbLE 32: COUNTRIES HOSTING THE HIGHEST NUmbER OF UK HE TNE STUDENTS IN NON-EU EUROpE COUNTRIES
RANK 2014–15 2015–16 NUmbER OF STUDENTS
IN 2015–16
RANKING CHANGE FROm 2014–15
TO 2015–16
1 Switzerland Switzerland 4,515 SAmE
2 Russia Russia 1,320 SAmE
3 Norway Norway 500 SAmE
4 Azerbaijan Azerbaijan 495 SAmE
5 Serbia Turkey 330 Up 2
6 Turkey Ukraine 215 Up 1
7 Ukraine Serbia 200 DOwN 2
8 Kosovo Kosovo 150 SAmE
9 Cyprus (Non-EU) Bosnia and Herzegovina 85 Up 2
10 Albania Albania 65 SAmE
Table 32 shows the Non-EU Europe countries hosting the highest numbers of UK HE TNE students in 2014-15 and 2015-16. It shows that there was minimal change from one year to the next. While Turkey, Ukraine and Bosnia Herzegovina increased their ranking, Serbia and non-EU Cyprus dropped in the ranking, with the latter falling out of the top ten list.
In 2015-16, students in non-EU European countries were spread more evenly across types of provision than in other regions. 77% of students in non-EU were studying either through distance, flexible and distributed learning (35%) or were studying through collaborative provision (32%).
FIGURE 25: pROpORTION OF UK HE TNE STUDENTS IN NON-EU EUROpE IN 2015–16 by TNE TypE
DISTANCE, FLExIbLE AND DISTRIbUTED LEARNING
COLLAbORATIvE pROvISION
OTHER ARRANGEmENT
STUDyING FOR AN AwARD OF THE REpORTING pROvIDER
OvERSEAS CAmpUS
35%
32%
16%
16%1%
41 THE SCALE OF UK HIGHER EDUCATION TRANSNATIONAL EDUCATION 2015–16 Europe (Non-EU)
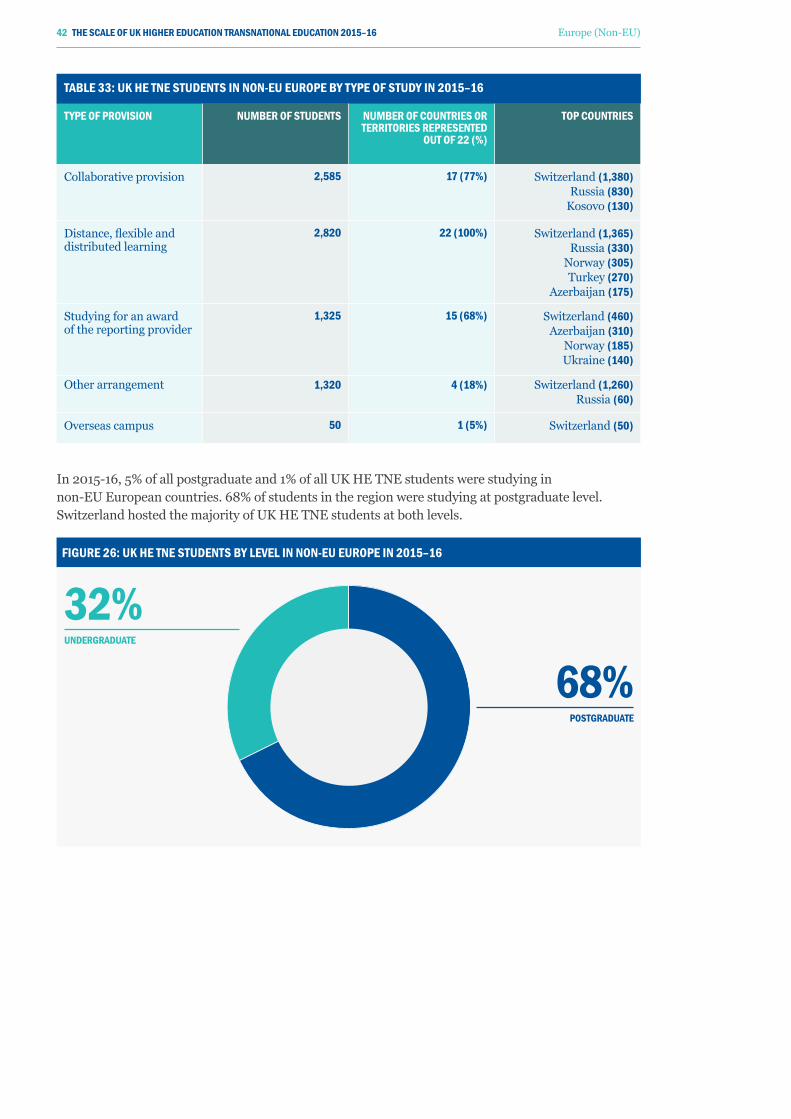
TAbLE 33: UK HE TNE STUDENTS IN NON-EU EUROpE by TypE OF STUDy IN 2015–16
TypE OF pROvISION NUmbER OF STUDENTS NUmbER OF COUNTRIES OR TERRITORIES REpRESENTED
OUT OF 22 (%)
TOp COUNTRIES
Collaborative provision 2,585 17 (77%) Switzerland (1,380)Russia (830)
Kosovo (130)
Distance, flexible and distributed learning
2,820 22 (100%) Switzerland (1,365)Russia (330)
Norway (305)Turkey (270)
Azerbaijan (175)
Studying for an award of the reporting provider
1,325 15 (68%) Switzerland (460) Azerbaijan (310)
Norway (185)Ukraine (140)
Other arrangement 1,320 4 (18%) Switzerland (1,260)Russia (60)
Overseas campus 50 1 (5%) Switzerland (50)
In 2015-16, 5% of all postgraduate and 1% of all UK HE TNE students were studying in non-EU European countries. 68% of students in the region were studying at postgraduate level. Switzerland hosted the majority of UK HE TNE students at both levels.
FIGURE 26: UK HE TNE STUDENTS by LEvEL IN NON-EU EUROpE IN 2015–16
68% pOSTGRADUATE
32% UNDERGRADUATE
42 THE SCALE OF UK HIGHER EDUCATION TRANSNATIONAL EDUCATION 2015–16 Europe (Non-EU)
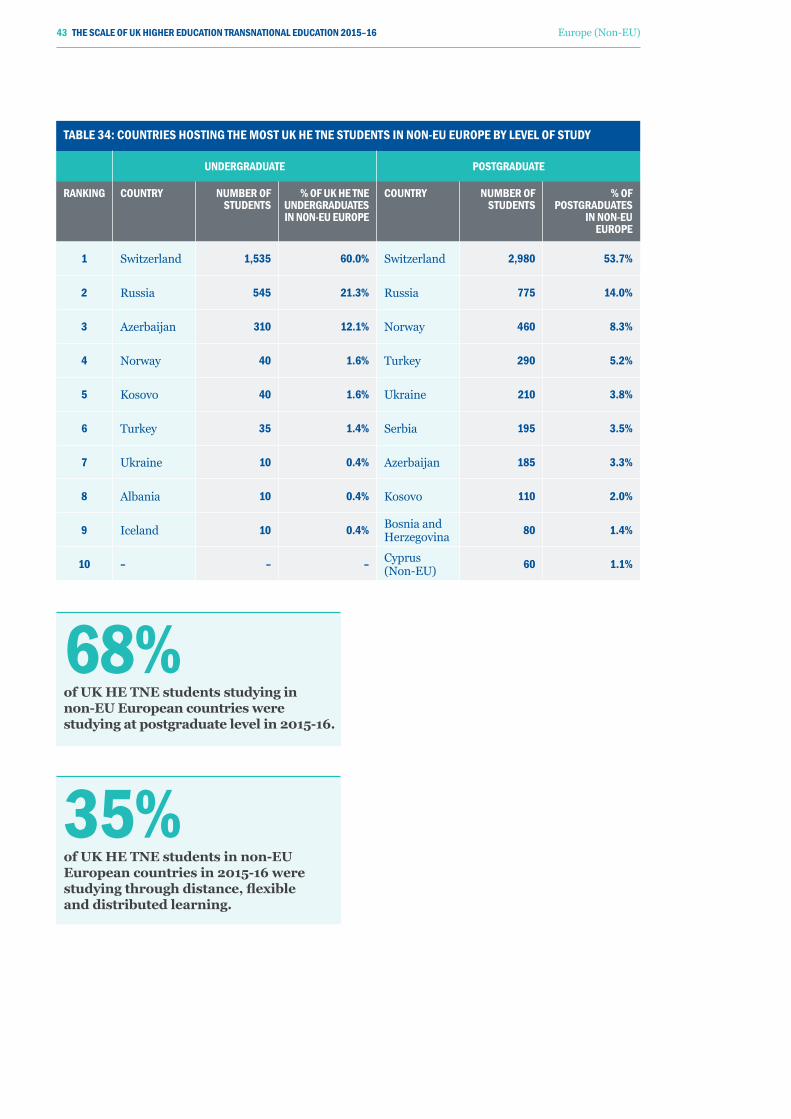
TAbLE 34: COUNTRIES HOSTING THE mOST UK HE TNE STUDENTS IN NON-EU EUROpE by LEvEL OF STUDy
UNDERGRADUATE pOSTGRADUATE
RANKING COUNTRy NUmbER OF STUDENTS
% OF UK HE TNE UNDERGRADUATES IN NON-EU EUROpE
COUNTRy NUmbER OF STUDENTS
% OF pOSTGRADUATES
IN NON-EU EUROpE
1 Switzerland 1,535 60.0% Switzerland 2,980 53.7%
2 Russia 545 21.3% Russia 775 14.0%
3 Azerbaijan 310 12.1% Norway 460 8.3%
4 Norway 40 1.6% Turkey 290 5.2%
5 Kosovo 40 1.6% Ukraine 210 3.8%
6 Turkey 35 1.4% Serbia 195 3.5%
7 Ukraine 10 0.4% Azerbaijan 185 3.3%
8 Albania 10 0.4% Kosovo 110 2.0%
9 Iceland 10 0.4% Bosnia and Herzegovina 80 1.4%
10 – – – Cyprus (Non-EU) 60 1.1%
68% of UK HE TNE students studying in non-EU European countries were studying at postgraduate level in 2015-16.
35% of UK HE TNE students in non-EU European countries in 2015-16 were studying through distance, flexible and distributed learning.
43 THE SCALE OF UK HIGHER EDUCATION TRANSNATIONAL EDUCATION 2015–16 Europe (Non-EU)
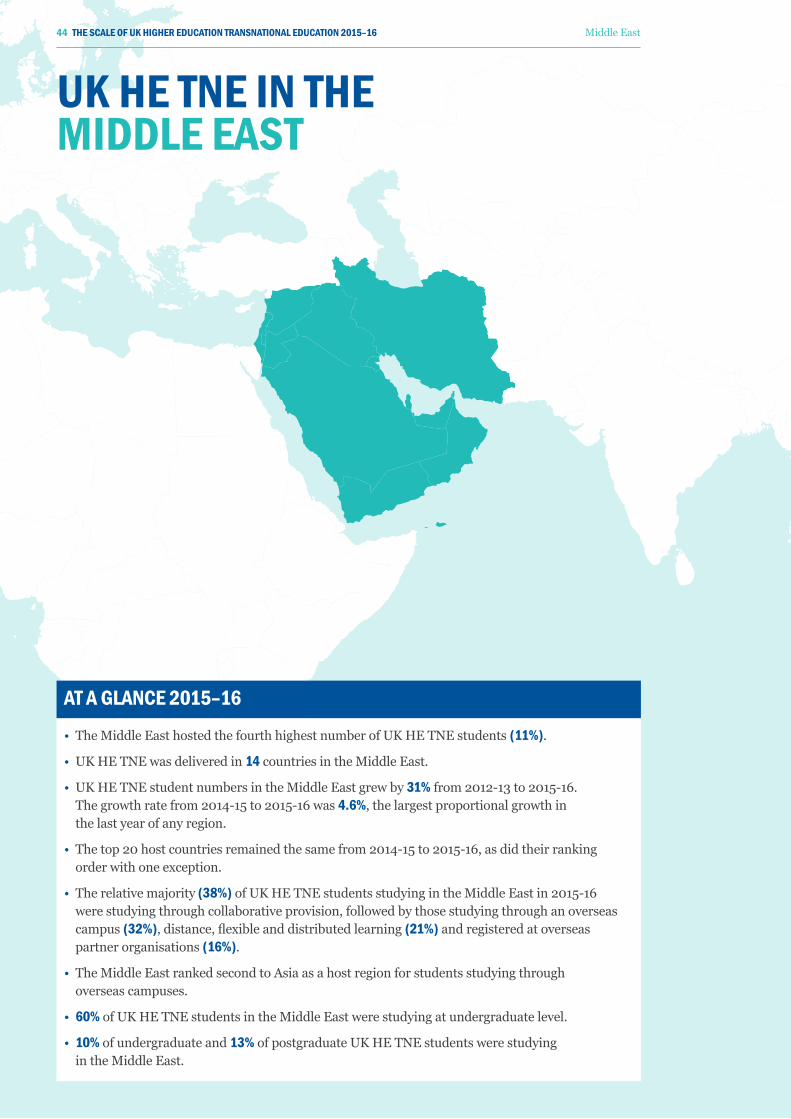
UK HE TNE IN THE mIDDLE EAST
AT A GLANCE 2015–16
• The Middle East hosted the fourth highest number of UK HE TNE students (11%).
• UK HE TNE was delivered in 14 countries in the Middle East.
• UK HE TNE student numbers in the Middle East grew by 31% from 2012-13 to 2015-16. The growth rate from 2014-15 to 2015-16 was 4.6%, the largest proportional growth in the last year of any region.
• The top 20 host countries remained the same from 2014-15 to 2015-16, as did their ranking order with one exception.
• The relative majority (38%) of UK HE TNE students studying in the Middle East in 2015-16 were studying through collaborative provision, followed by those studying through an overseas campus (32%), distance, flexible and distributed learning (21%) and registered at overseas partner organisations (16%).
• The Middle East ranked second to Asia as a host region for students studying through overseas campuses.
• 60% of UK HE TNE students in the Middle East were studying at undergraduate level.
• 10% of undergraduate and 13% of postgraduate UK HE TNE students were studying in the Middle East.
44 THE SCALE OF UK HIGHER EDUCATION TRANSNATIONAL EDUCATION 2015–16 Middle East
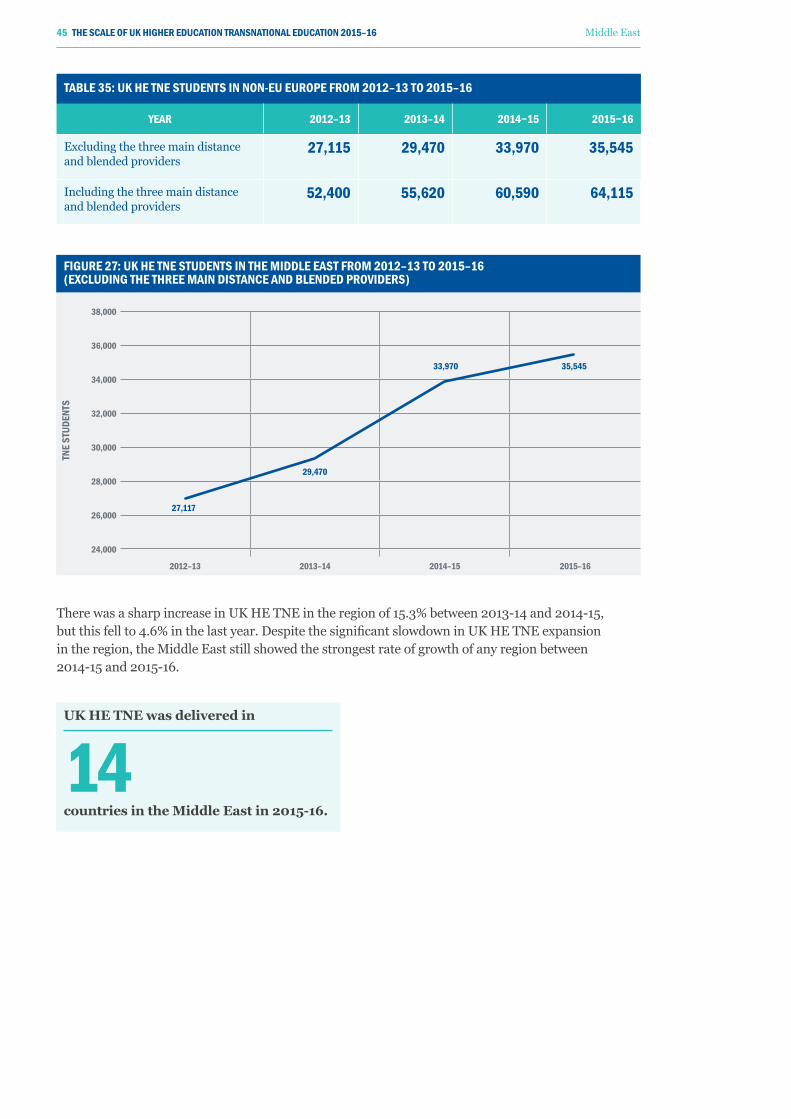
TAbLE 35: UK HE TNE STUDENTS IN NON-EU EUROpE FROm 2012–13 TO 2015–16
yEAR 2012–13 2013–14 2014−15 2015−16
Excluding the three main distance and blended providers
27,115 29,470 33,970 35,545
Including the three main distance and blended providers
52,400 55,620 60,590 64,115
FIGURE 27: UK HE TNE STUDENTS IN THE mIDDLE EAST FROm 2012–13 TO 2015–16 (ExCLUDING THE THREE mAIN DISTANCE AND bLENDED pROvIDERS)
TNE
STUD
ENTS
38,000
36,000
34,000
32,000
30,000
28,000
26,000
24,000
2012–13 2013–14 2014–15 2015–16
27,117
29,470
33,970 35,545
There was a sharp increase in UK HE TNE in the region of 15.3% between 2013-14 and 2014-15, but this fell to 4.6% in the last year. Despite the significant slowdown in UK HE TNE expansion in the region, the Middle East still showed the strongest rate of growth of any region between 2014-15 and 2015-16.
UK HE TNE was delivered in
14 countries in the Middle East in 2015-16.
45 THE SCALE OF UK HIGHER EDUCATION TRANSNATIONAL EDUCATION 2015–16 Middle East
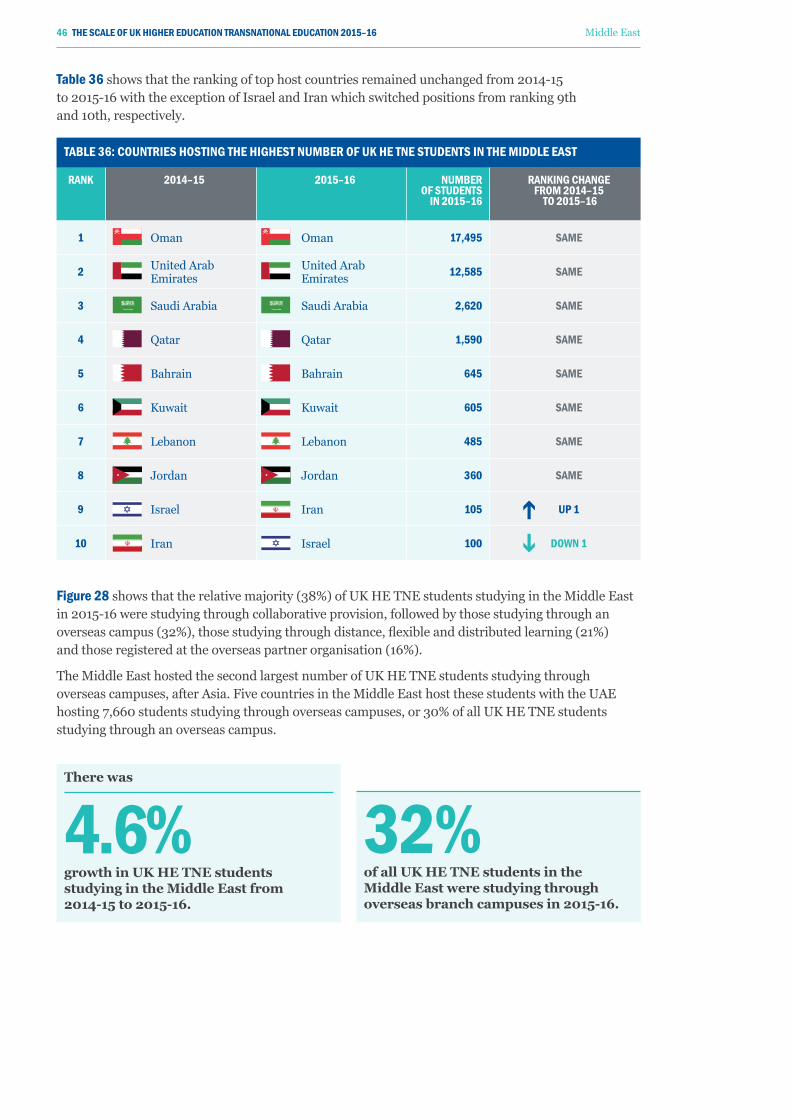
TAbLE 36: COUNTRIES HOSTING THE HIGHEST NUmbER OF UK HE TNE STUDENTS IN THE mIDDLE EAST
RANK 2014–15 2015–16 NUmbER OF STUDENTS
IN 2015–16
RANKING CHANGE FROm 2014–15
TO 2015–16
1 Oman Oman 17,495 SAmE
2 United Arab Emirates
United Arab Emirates 12,585 SAmE
3 Saudi Arabia Saudi Arabia 2,620 SAmE
4 Qatar Qatar 1,590 SAmE
5 Bahrain Bahrain 645 SAmE
6 Kuwait Kuwait 605 SAmE
7 Lebanon Lebanon 485 SAmE
8 Jordan Jordan 360 SAmE
9 Israel Iran 105 Up 1
10 Iran Israel 100 DOwN 1
Table 36 shows that the ranking of top host countries remained unchanged from 2014-15 to 2015-16 with the exception of Israel and Iran which switched positions from ranking 9th and 10th, respectively.
Figure 28 shows that the relative majority (38%) of UK HE TNE students studying in the Middle East in 2015-16 were studying through collaborative provision, followed by those studying through an overseas campus (32%), those studying through distance, flexible and distributed learning (21%) and those registered at the overseas partner organisation (16%).
The Middle East hosted the second largest number of UK HE TNE students studying through overseas campuses, after Asia. Five countries in the Middle East host these students with the UAE hosting 7,660 students studying through overseas campuses, or 30% of all UK HE TNE students studying through an overseas campus.
32% of all UK HE TNE students in the Middle East were studying through overseas branch campuses in 2015-16.
There was
4.6% growth in UK HE TNE students studying in the Middle East from 2014-15 to 2015-16.
46 THE SCALE OF UK HIGHER EDUCATION TRANSNATIONAL EDUCATION 2015–16 Middle East
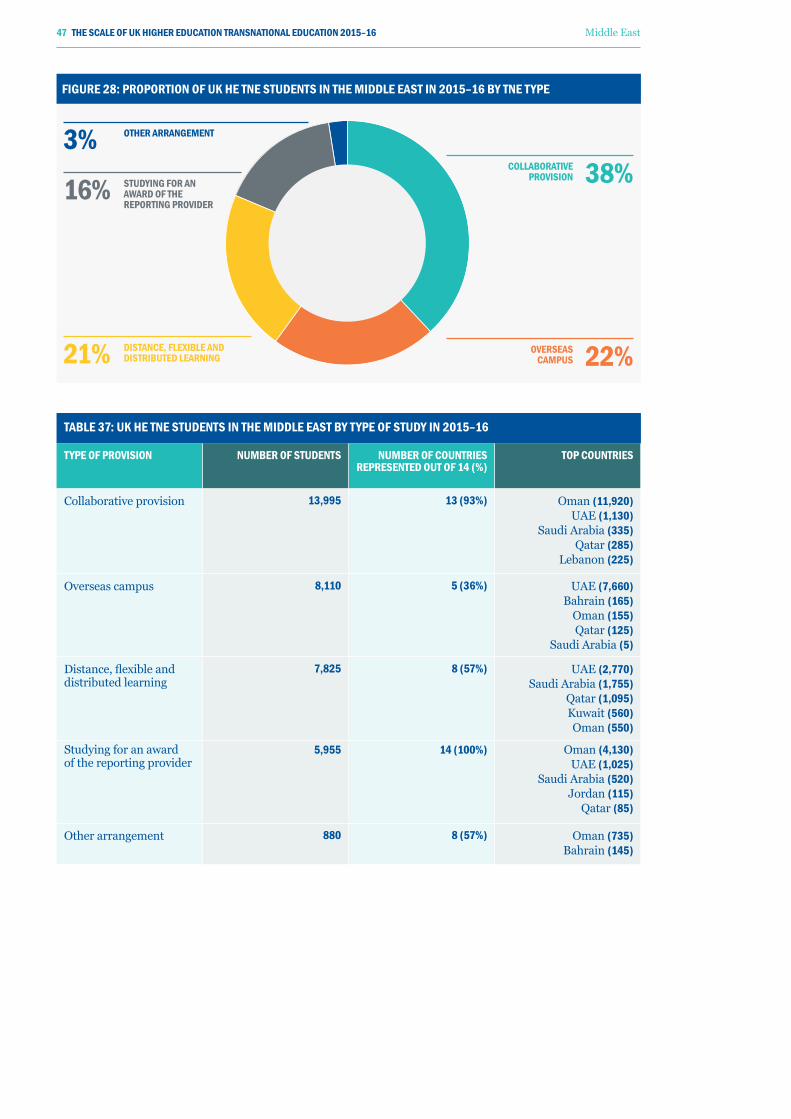
FIGURE 28: pROpORTION OF UK HE TNE STUDENTS IN THE mIDDLE EAST IN 2015–16 by TNE TypE
TAbLE 37: UK HE TNE STUDENTS IN THE mIDDLE EAST by TypE OF STUDy IN 2015–16
TypE OF pROvISION NUmbER OF STUDENTS NUmbER OF COUNTRIES REpRESENTED OUT OF 14 (%)
TOp COUNTRIES
Collaborative provision 13,995 13 (93%) Oman (11,920)UAE (1,130)
Saudi Arabia (335)Qatar (285)
Lebanon (225)
Overseas campus 8,110 5 (36%) UAE (7,660)Bahrain (165)
Oman (155)Qatar (125)
Saudi Arabia (5)
Distance, flexible and distributed learning
7,825 8 (57%) UAE (2,770)Saudi Arabia (1,755)
Qatar (1,095) Kuwait (560)Oman (550)
Studying for an award of the reporting provider
5,955 14 (100%) Oman (4,130) UAE (1,025)
Saudi Arabia (520) Jordan (115)
Qatar (85)
Other arrangement 880 8 (57%) Oman (735)Bahrain (145)
COLLAbORATIvE pROvISION
OvERSEAS CAmpUS
OTHER ARRANGEmENT
STUDyING FOR AN AwARD OF THE REpORTING pROvIDER
DISTANCE, FLExIbLE AND DISTRIbUTED LEARNING
38%
22%
3%
16%
21%
47 THE SCALE OF UK HIGHER EDUCATION TRANSNATIONAL EDUCATION 2015–16 Middle East
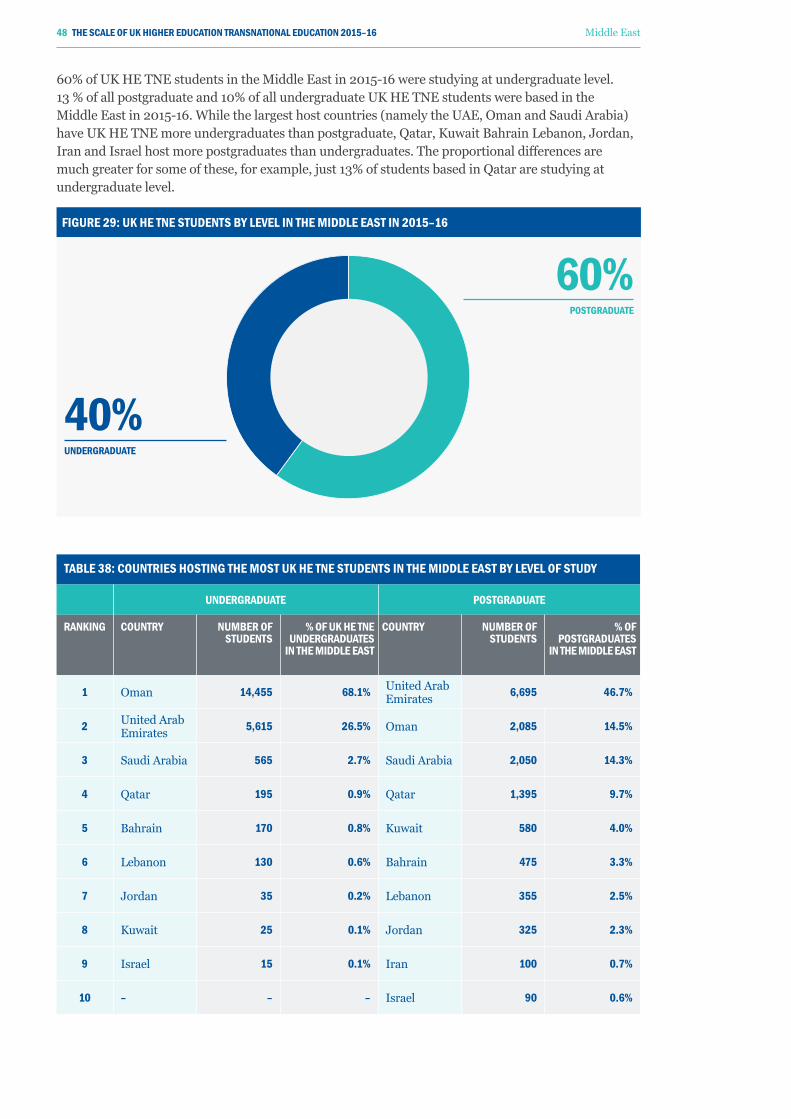
60% of UK HE TNE students in the Middle East in 2015-16 were studying at undergraduate level. 13 % of all postgraduate and 10% of all undergraduate UK HE TNE students were based in the Middle East in 2015-16. While the largest host countries (namely the UAE, Oman and Saudi Arabia) have UK HE TNE more undergraduates than postgraduate, Qatar, Kuwait Bahrain Lebanon, Jordan, Iran and Israel host more postgraduates than undergraduates. The proportional differences are much greater for some of these, for example, just 13% of students based in Qatar are studying at undergraduate level.
FIGURE 29: UK HE TNE STUDENTS by LEvEL IN THE mIDDLE EAST IN 2015–16
TAbLE 38: COUNTRIES HOSTING THE mOST UK HE TNE STUDENTS IN THE mIDDLE EAST by LEvEL OF STUDy
UNDERGRADUATE pOSTGRADUATE
RANKING COUNTRy NUmbER OF STUDENTS
% OF UK HE TNE UNDERGRADUATES
IN THE mIDDLE EAST
COUNTRy NUmbER OF STUDENTS
% OF pOSTGRADUATES
IN THE mIDDLE EAST
1 Oman 14,455 68.1% United Arab Emirates 6,695 46.7%
2 United Arab Emirates 5,615 26.5% Oman 2,085 14.5%
3 Saudi Arabia 565 2.7% Saudi Arabia 2,050 14.3%
4 Qatar 195 0.9% Qatar 1,395 9.7%
5 Bahrain 170 0.8% Kuwait 580 4.0%
6 Lebanon 130 0.6% Bahrain 475 3.3%
7 Jordan 35 0.2% Lebanon 355 2.5%
8 Kuwait 25 0.1% Jordan 325 2.3%
9 Israel 15 0.1% Iran 100 0.7%
10 – – – Israel 90 0.6%
60% pOSTGRADUATE
40% UNDERGRADUATE
48 THE SCALE OF UK HIGHER EDUCATION TRANSNATIONAL EDUCATION 2015–16 Middle East
UK HE TNE IN NORTH AmERICA
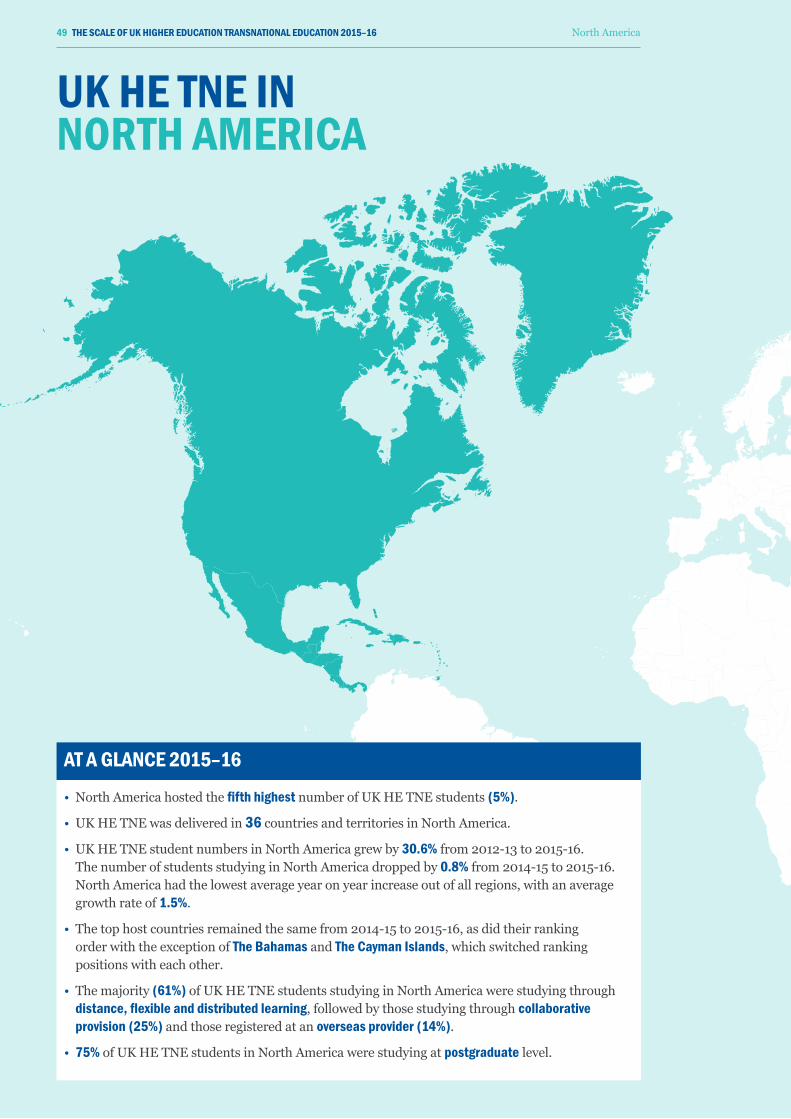
AT A GLANCE 2015–16
• North America hosted the fifth highest number of UK HE TNE students (5%).
• UK HE TNE was delivered in 36 countries and territories in North America.
• UK HE TNE student numbers in North America grew by 30.6% from 2012-13 to 2015-16. The number of students studying in North America dropped by 0.8% from 2014-15 to 2015-16. North America had the lowest average year on year increase out of all regions, with an average growth rate of 1.5%.
• The top host countries remained the same from 2014-15 to 2015-16, as did their ranking order with the exception of The Bahamas and The Cayman Islands, which switched ranking positions with each other.
• The majority (61%) of UK HE TNE students studying in North America were studying through distance, flexible and distributed learning, followed by those studying through collaborative provision (25%) and those registered at an overseas provider (14%).
• 75% of UK HE TNE students in North America were studying at postgraduate level.
49 THE SCALE OF UK HIGHER EDUCATION TRANSNATIONAL EDUCATION 2015–16 North America
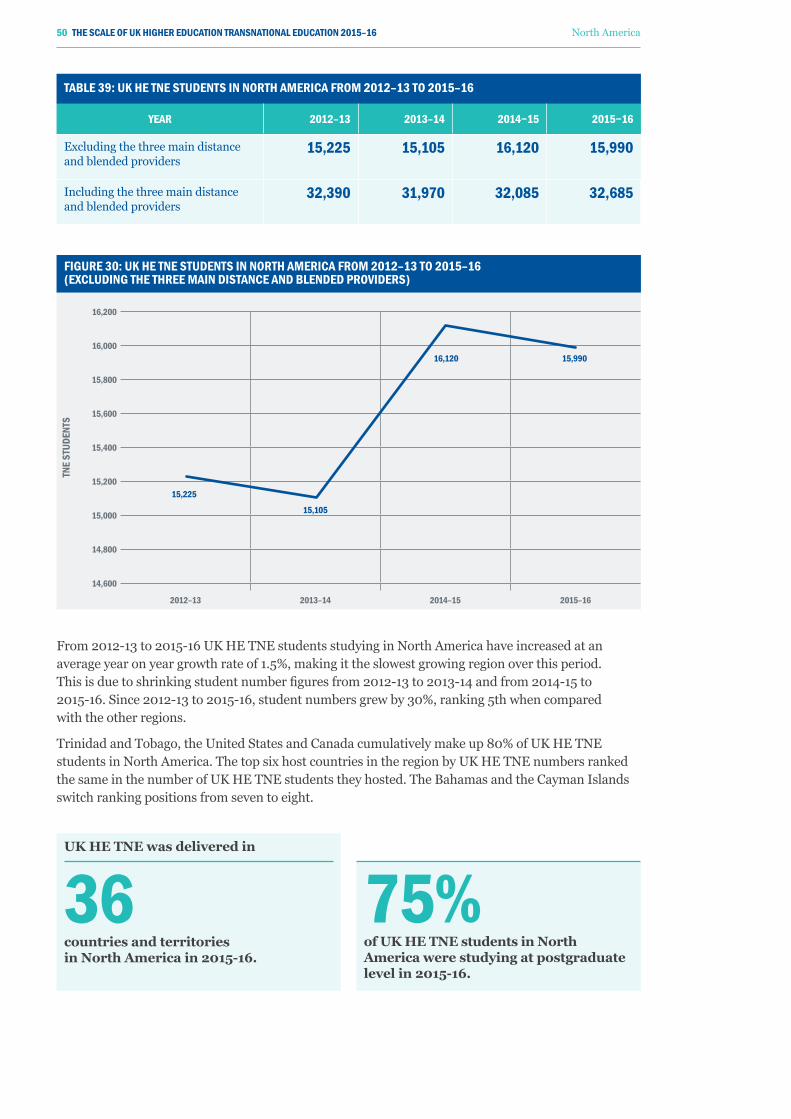
TAbLE 39: UK HE TNE STUDENTS IN NORTH AmERICA FROm 2012–13 TO 2015–16
yEAR 2012–13 2013–14 2014−15 2015−16
Excluding the three main distance and blended providers
15,225 15,105 16,120 15,990
Including the three main distance and blended providers
32,390 31,970 32,085 32,685
From 2012-13 to 2015-16 UK HE TNE students studying in North America have increased at an average year on year growth rate of 1.5%, making it the slowest growing region over this period. This is due to shrinking student number figures from 2012-13 to 2013-14 and from 2014-15 to 2015-16. Since 2012-13 to 2015-16, student numbers grew by 30%, ranking 5th when compared with the other regions.
Trinidad and Tobago, the United States and Canada cumulatively make up 80% of UK HE TNE students in North America. The top six host countries in the region by UK HE TNE numbers ranked the same in the number of UK HE TNE students they hosted. The Bahamas and the Cayman Islands switch ranking positions from seven to eight.
FIGURE 30: UK HE TNE STUDENTS IN NORTH AmERICA FROm 2012–13 TO 2015–16 (ExCLUDING THE THREE mAIN DISTANCE AND bLENDED pROvIDERS)
TNE
STUD
ENTS
16,200
16,000
15,800
15,600
15,400
15,200
15,000
14,800
14,600
2012–13 2013–14 2014–15 2015–16
15,225
15,105
16,120 15,990
UK HE TNE was delivered in
36 countries and territories in North America in 2015-16.
75% of UK HE TNE students in North America were studying at postgraduate level in 2015-16.
50 THE SCALE OF UK HIGHER EDUCATION TRANSNATIONAL EDUCATION 2015–16 North America
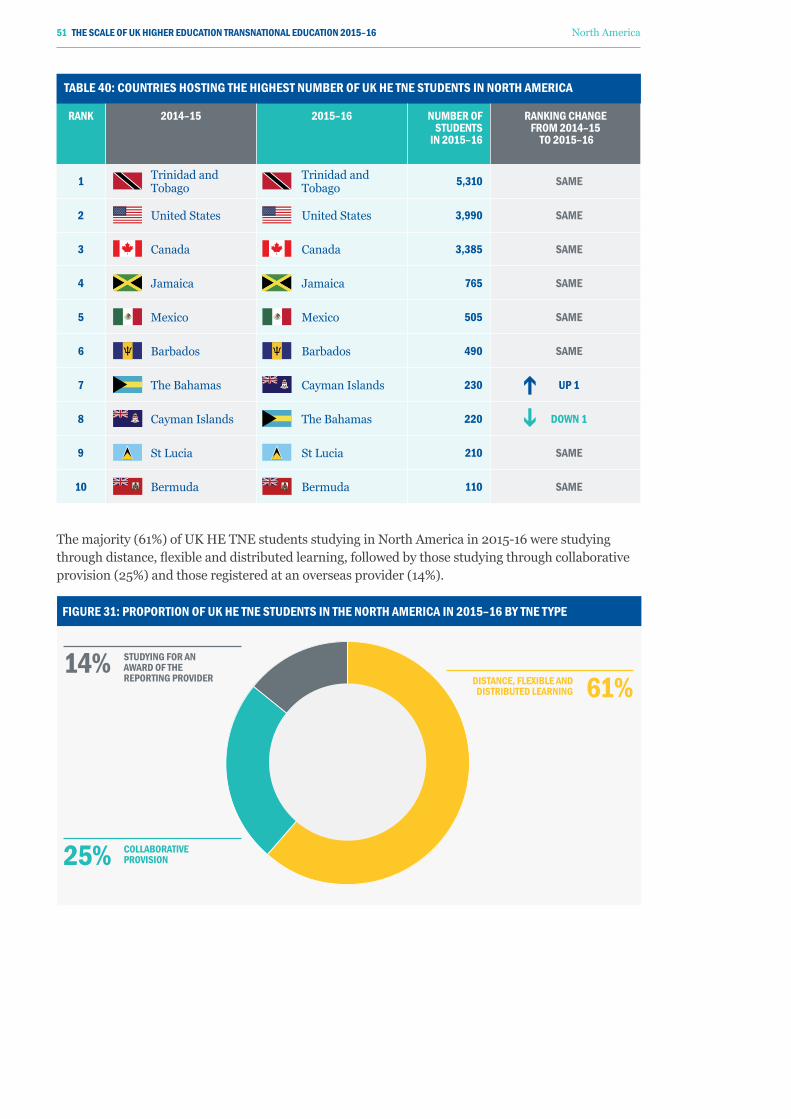
TAbLE 40: COUNTRIES HOSTING THE HIGHEST NUmbER OF UK HE TNE STUDENTS IN NORTH AmERICA
RANK 2014–15 2015–16 NUmbER OF STUDENTS
IN 2015–16
RANKING CHANGE FROm 2014–15
TO 2015–16
1 Trinidad and Tobago
Trinidad and Tobago 5,310 SAmE
2 United States United States 3,990 SAmE
3 Canada Canada 3,385 SAmE
4 Jamaica Jamaica 765 SAmE
5 Mexico Mexico 505 SAmE
6 Barbados Barbados 490 SAmE
7 The Bahamas Cayman Islands 230 Up 1
8 Cayman Islands The Bahamas 220 DOwN 1
9 St Lucia St Lucia 210 SAmE
10 Bermuda Bermuda 110 SAmE
The majority (61%) of UK HE TNE students studying in North America in 2015-16 were studying through distance, flexible and distributed learning, followed by those studying through collaborative provision (25%) and those registered at an overseas provider (14%).
FIGURE 31: pROpORTION OF UK HE TNE STUDENTS IN THE NORTH AmERICA IN 2015–16 by TNE TypE
DISTANCE, FLExIbLE AND DISTRIbUTED LEARNING
STUDyING FOR AN AwARD OF THE REpORTING pROvIDER
COLLAbORATIvE pROvISION
61%14%
25%
51 THE SCALE OF UK HIGHER EDUCATION TRANSNATIONAL EDUCATION 2015–16 North America
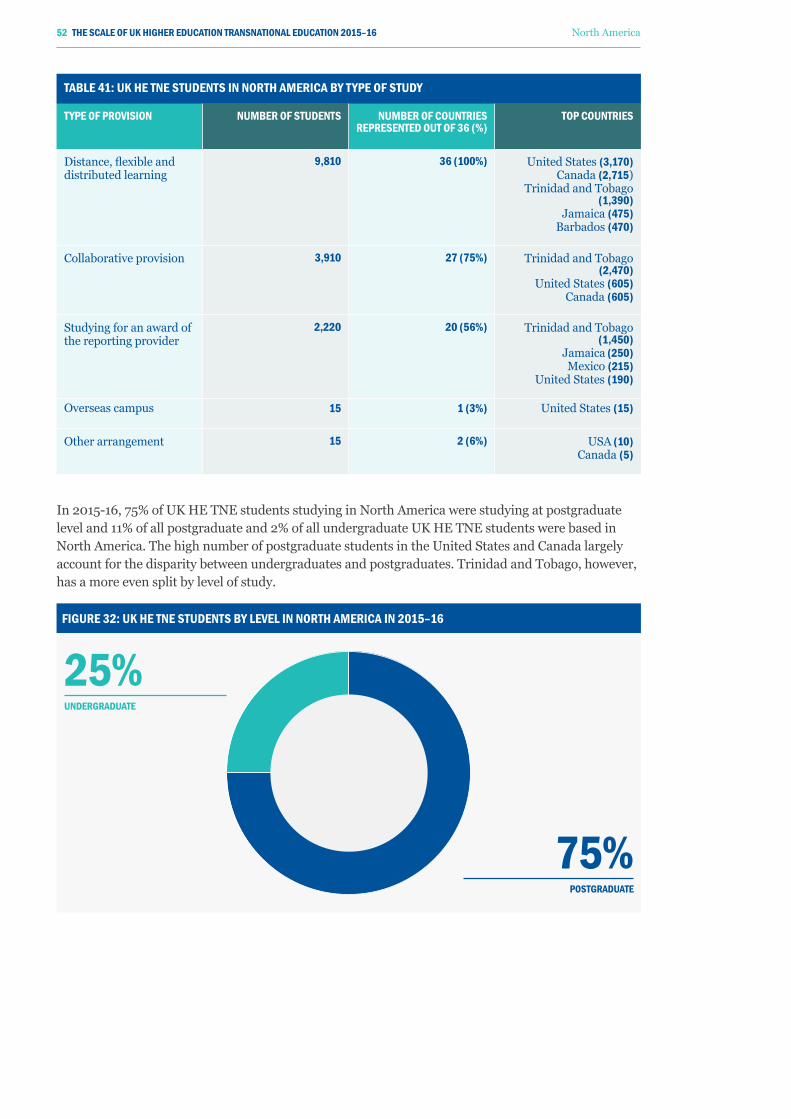
TAbLE 41: UK HE TNE STUDENTS IN NORTH AmERICA by TypE OF STUDy
TypE OF pROvISION NUmbER OF STUDENTS NUmbER OF COUNTRIES REpRESENTED OUT OF 36 (%)
TOp COUNTRIES
Distance, flexible and distributed learning
9,810 36 (100%) United States (3,170)Canada (2,715)
Trinidad and Tobago (1,390)
Jamaica (475)Barbados (470)
Collaborative provision 3,910 27 (75%) Trinidad and Tobago (2,470)
United States (605)Canada (605)
Studying for an award of the reporting provider
2,220 20 (56%) Trinidad and Tobago (1,450)
Jamaica (250)Mexico (215)
United States (190)
Overseas campus 15 1 (3%) United States (15)
Other arrangement 15 2 (6%) USA (10)Canada (5)
In 2015-16, 75% of UK HE TNE students studying in North America were studying at postgraduate level and 11% of all postgraduate and 2% of all undergraduate UK HE TNE students were based in North America. The high number of postgraduate students in the United States and Canada largely account for the disparity between undergraduates and postgraduates. Trinidad and Tobago, however, has a more even split by level of study.
FIGURE 32: UK HE TNE STUDENTS by LEvEL IN NORTH AmERICA IN 2015–16
75% pOSTGRADUATE
25% UNDERGRADUATE
52 THE SCALE OF UK HIGHER EDUCATION TRANSNATIONAL EDUCATION 2015–16 North America
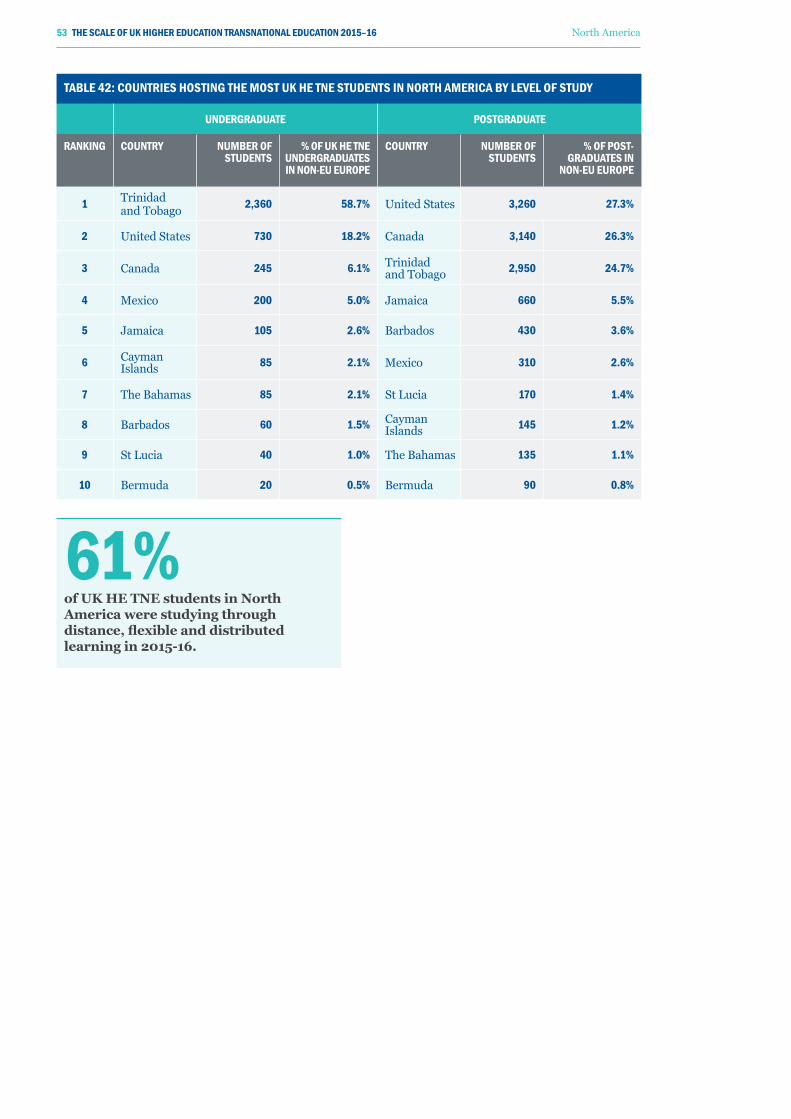
TAbLE 42: COUNTRIES HOSTING THE mOST UK HE TNE STUDENTS IN NORTH AmERICA by LEvEL OF STUDy
UNDERGRADUATE pOSTGRADUATE
RANKING COUNTRy NUmbER OF STUDENTS
% OF UK HE TNE UNDERGRADUATES IN NON-EU EUROpE
COUNTRy NUmbER OF STUDENTS
% OF pOST-GRADUATES IN
NON-EU EUROpE
1 Trinidad and Tobago 2,360 58.7% United States 3,260 27.3%
2 United States 730 18.2% Canada 3,140 26.3%
3 Canada 245 6.1% Trinidad and Tobago 2,950 24.7%
4 Mexico 200 5.0% Jamaica 660 5.5%
5 Jamaica 105 2.6% Barbados 430 3.6%
6 Cayman Islands 85 2.1% Mexico 310 2.6%
7 The Bahamas 85 2.1% St Lucia 170 1.4%
8 Barbados 60 1.5% Cayman Islands 145 1.2%
9 St Lucia 40 1.0% The Bahamas 135 1.1%
10 Bermuda 20 0.5% Bermuda 90 0.8%
61% of UK HE TNE students in North America were studying through distance, flexible and distributed learning in 2015-16.
53 THE SCALE OF UK HIGHER EDUCATION TRANSNATIONAL EDUCATION 2015–16 North America
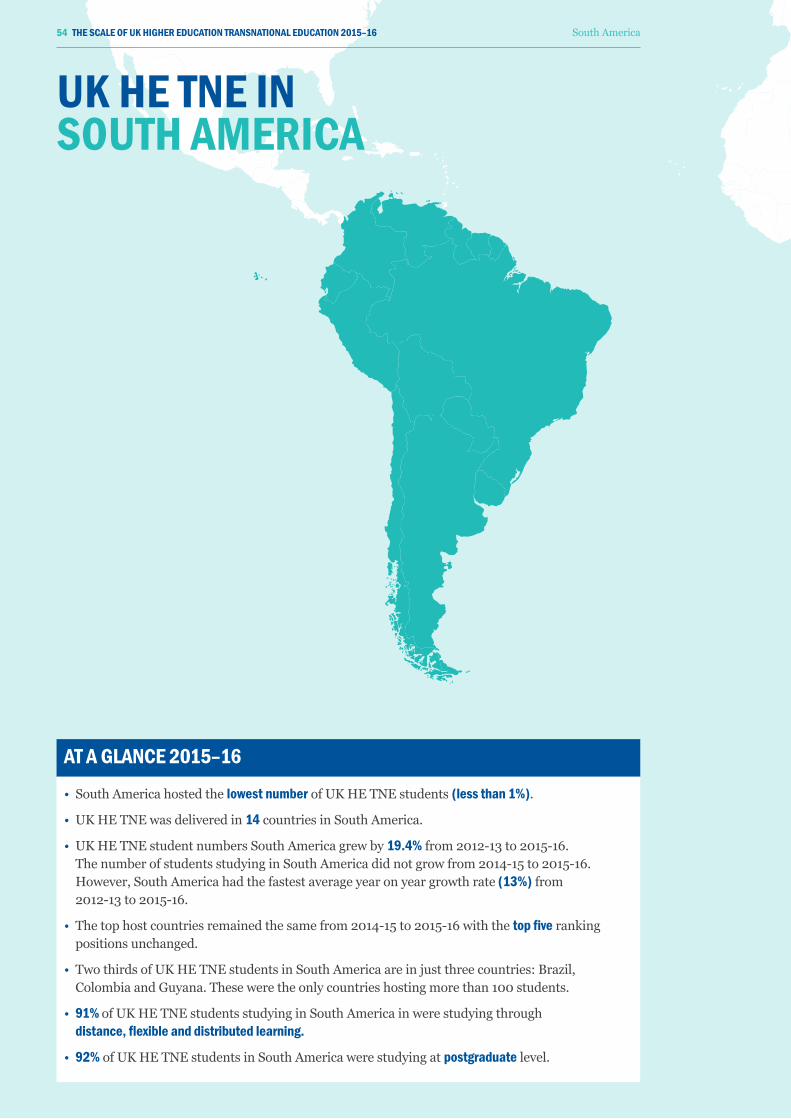
UK HE TNE IN SOUTH AmERICA
AT A GLANCE 2015–16
• South America hosted the lowest number of UK HE TNE students (less than 1%).
• UK HE TNE was delivered in 14 countries in South America.
• UK HE TNE student numbers South America grew by 19.4% from 2012-13 to 2015-16. The number of students studying in South America did not grow from 2014-15 to 2015-16. However, South America had the fastest average year on year growth rate (13%) from 2012-13 to 2015-16.
• The top host countries remained the same from 2014-15 to 2015-16 with the top five ranking positions unchanged.
• Two thirds of UK HE TNE students in South America are in just three countries: Brazil, Colombia and Guyana. These were the only countries hosting more than 100 students.
• 91% of UK HE TNE students studying in South America in were studying through distance, flexible and distributed learning.
• 92% of UK HE TNE students in South America were studying at postgraduate level.
54 THE SCALE OF UK HIGHER EDUCATION TRANSNATIONAL EDUCATION 2015–16 South America
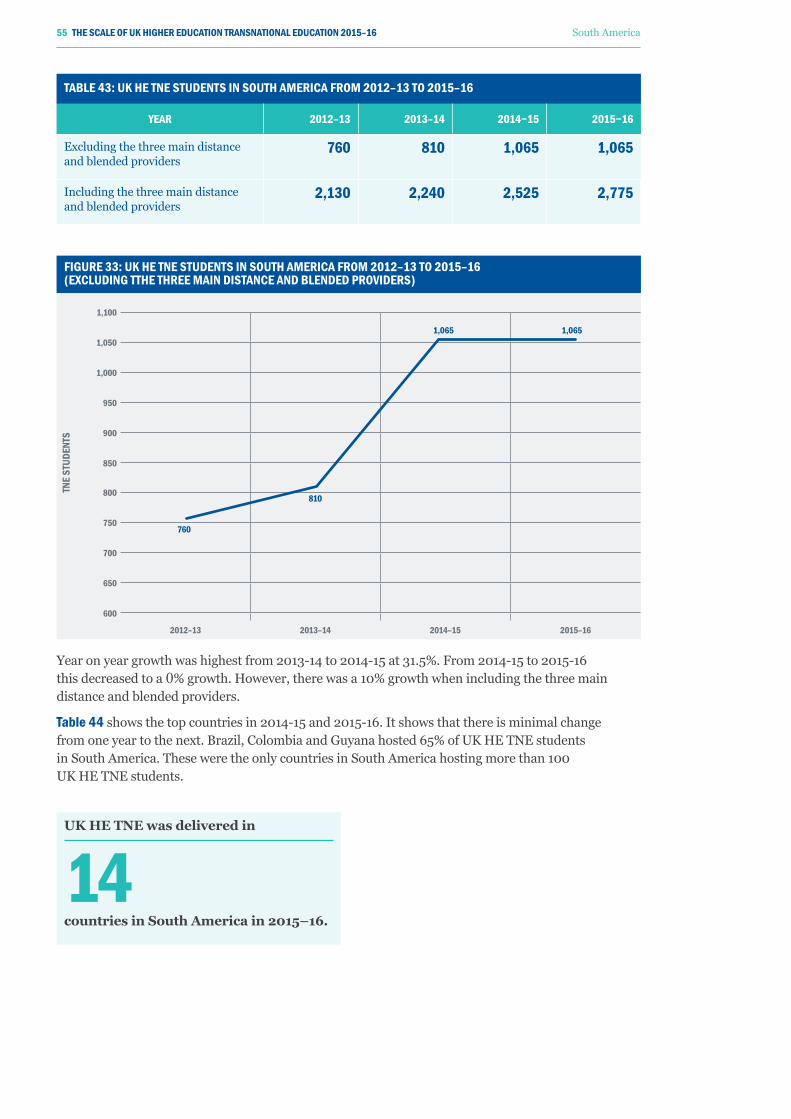
TAbLE 43: UK HE TNE STUDENTS IN SOUTH AmERICA FROm 2012–13 TO 2015–16
yEAR 2012–13 2013–14 2014−15 2015−16
Excluding the three main distance and blended providers
760 810 1,065 1,065
Including the three main distance and blended providers
2,130 2,240 2,525 2,775
Year on year growth was highest from 2013-14 to 2014-15 at 31.5%. From 2014-15 to 2015-16 this decreased to a 0% growth. However, there was a 10% growth when including the three main distance and blended providers.
Table 44 shows the top countries in 2014-15 and 2015-16. It shows that there is minimal change from one year to the next. Brazil, Colombia and Guyana hosted 65% of UK HE TNE students in South America. These were the only countries in South America hosting more than 100 UK HE TNE students.
FIGURE 33: UK HE TNE STUDENTS IN SOUTH AmERICA FROm 2012–13 TO 2015–16 (ExCLUDING TTHE THREE mAIN DISTANCE AND bLENDED pROvIDERS)
TNE
STUD
ENTS
1,100
1,050
1,000
950
900
850
800
750
700
650
600
2012–13 2013–14 2014–15 2015–16
760
810
1,065 1,065
UK HE TNE was delivered in
14 countries in South America in 2015–16.
55 THE SCALE OF UK HIGHER EDUCATION TRANSNATIONAL EDUCATION 2015–16 South America
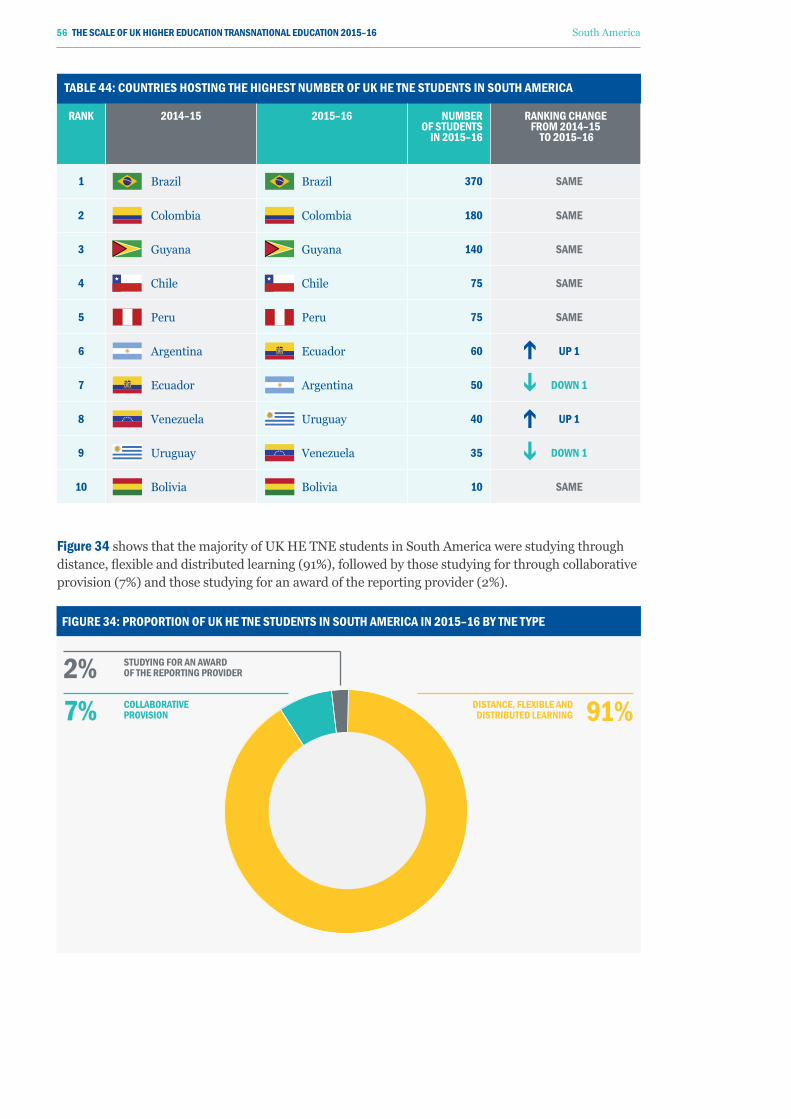
TAbLE 44: COUNTRIES HOSTING THE HIGHEST NUmbER OF UK HE TNE STUDENTS IN SOUTH AmERICA
RANK 2014–15 2015–16 NUmbER OF STUDENTS
IN 2015–16
RANKING CHANGE FROm 2014–15
TO 2015–16
1 Brazil Brazil 370 SAmE
2 Colombia Colombia 180 SAmE
3 Guyana Guyana 140 SAmE
4 Chile Chile 75 SAmE
5 Peru Peru 75 SAmE
6 Argentina Ecuador 60 Up 1
7 Ecuador Argentina 50 DOwN 1
8 Venezuela Uruguay 40 Up 1
9 Uruguay Venezuela 35 DOwN 1
10 Bolivia Bolivia 10 SAmE
Figure 34 shows that the majority of UK HE TNE students in South America were studying through distance, flexible and distributed learning (91%), followed by those studying for through collaborative provision (7%) and those studying for an award of the reporting provider (2%).
FIGURE 34: pROpORTION OF UK HE TNE STUDENTS IN SOUTH AmERICA IN 2015–16 by TNE TypE
DISTANCE, FLExIbLE AND DISTRIbUTED LEARNING
STUDyING FOR AN AwARD OF THE REpORTING pROvIDER
COLLAbORATIvE pROvISION 91%
2%7%
56 THE SCALE OF UK HIGHER EDUCATION TRANSNATIONAL EDUCATION 2015–16 South America
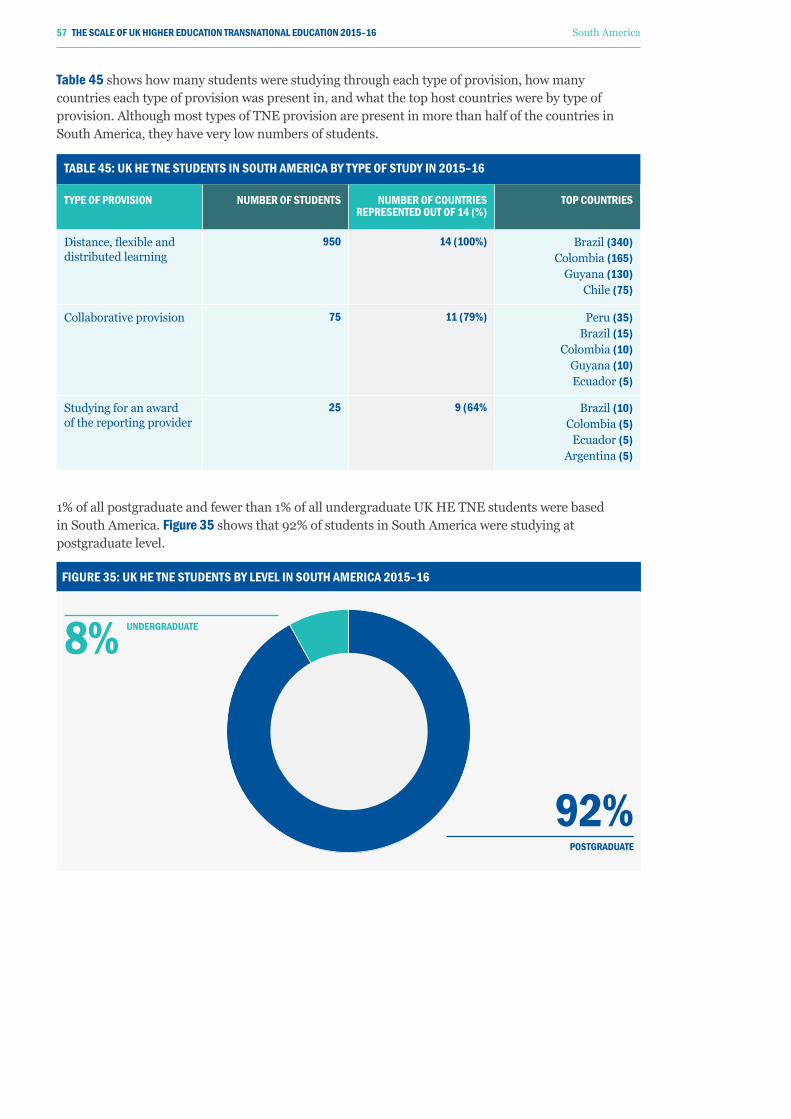
1% of all postgraduate and fewer than 1% of all undergraduate UK HE TNE students were based in South America. Figure 35 shows that 92% of students in South America were studying at postgraduate level.
FIGURE 35: UK HE TNE STUDENTS by LEvEL IN SOUTH AmERICA 2015–16
Table 45 shows how many students were studying through each type of provision, how many countries each type of provision was present in, and what the top host countries were by type of provision. Although most types of TNE provision are present in more than half of the countries in South America, they have very low numbers of students.
TAbLE 45: UK HE TNE STUDENTS IN SOUTH AmERICA by TypE OF STUDy IN 2015–16
TypE OF pROvISION NUmbER OF STUDENTS NUmbER OF COUNTRIES REpRESENTED OUT OF 14 (%)
TOp COUNTRIES
Distance, flexible and distributed learning
950 14 (100%) Brazil (340)Colombia (165)
Guyana (130)Chile (75)
Collaborative provision 75 11 (79%) Peru (35)Brazil (15)
Colombia (10)Guyana (10)Ecuador (5)
Studying for an award of the reporting provider
25 9 (64% Brazil (10)Colombia (5)
Ecuador (5)Argentina (5)
92% pOSTGRADUATE
8% UNDERGRADUATE
57 THE SCALE OF UK HIGHER EDUCATION TRANSNATIONAL EDUCATION 2015–16 South America
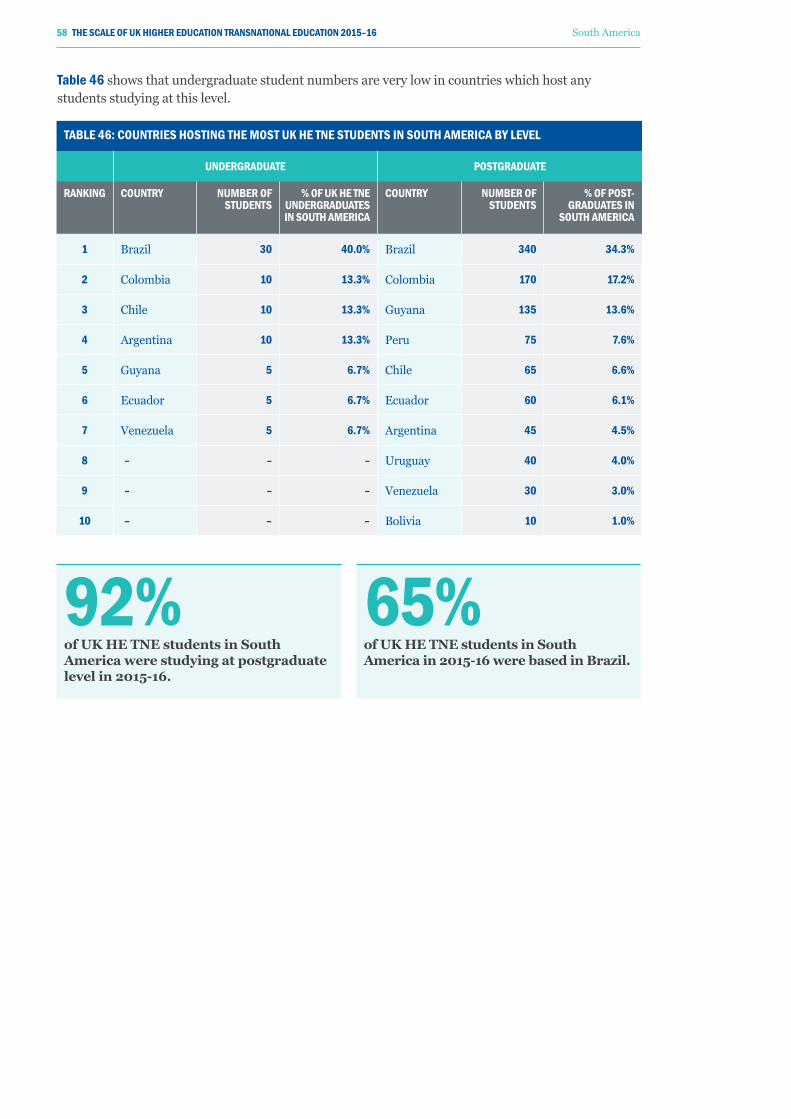
TAbLE 46: COUNTRIES HOSTING THE mOST UK HE TNE STUDENTS IN SOUTH AmERICA by LEvEL
UNDERGRADUATE pOSTGRADUATE
RANKING COUNTRy NUmbER OF STUDENTS
% OF UK HE TNE UNDERGRADUATES IN SOUTH AmERICA
COUNTRy NUmbER OF STUDENTS
% OF pOST-GRADUATES IN
SOUTH AmERICA
1 Brazil 30 40.0% Brazil 340 34.3%
2 Colombia 10 13.3% Colombia 170 17.2%
3 Chile 10 13.3% Guyana 135 13.6%
4 Argentina 10 13.3% Peru 75 7.6%
5 Guyana 5 6.7% Chile 65 6.6%
6 Ecuador 5 6.7% Ecuador 60 6.1%
7 Venezuela 5 6.7% Argentina 45 4.5%
8 – – – Uruguay 40 4.0%
9 – – – Venezuela 30 3.0%
10 – – – Bolivia 10 1.0%
92% of UK HE TNE students in South America were studying at postgraduate level in 2015-16.
65% of UK HE TNE students in South America in 2015-16 were based in Brazil.
Table 46 shows that undergraduate student numbers are very low in countries which host any students studying at this level.
58 THE SCALE OF UK HIGHER EDUCATION TRANSNATIONAL EDUCATION 2015–16 South America
5. CONCLUSION TNE is a crucial part of the UK’s increasingly international education offer. UK universities now provide qualifications to more students overseas than to international students in the UK.
With constantly shifting demographics, changing policy environments and increased competition from outside the UK, the sector is increasingly interested in infusing its strategic approach with analysis, tools and resources to shape its TNE priorities and destinations. This report seeks to act as one such tool.
Growth rates in institutions delivering TNE across types of provision and in host regions show an evolving picture. Although there have been year-on-year increases in UK HE TNE students since at least 2007-08, the year-on-year growth rate remained between 4%-7% between 2012- 13 and 2015-16. Recent figures released by HESA in January 20189 show that this rate dropped to 1% from 2015-16 to 2016-17. Without comprehensive data comparable to the data used to inform this report, it is not possible to extrapolate what the picture looks like when excluding the three main distance and blended providers. Indeed, since 2012-13 there have been instances where the overall student year-on-year growth rate has been either above or below the growth rate for the other institutions. This makes it impossible to project what the most recent growth means for institutions excluding the three main distance and blended providers.
Regardless of the modest overall increase from 2015-16 to 2016-17, steady rather than rapid growth between 2012-13 and 2015-16 may be the result of several factors. For example, some universities with large numbers of TNE students may be consolidating their TNE activity and may not have ambitions to grow. This report shows that 75% of students studied with just 11% of UK universities, that 80% of students were studying through universities which delivered TNE programmes to more than 5000 students and that the number of institutions delivering TNE increased to 138 in 2016-17. This signals that growth may be taking place most acutely among institutions delivering to small numbers of students and that growth among institutions delivering to large numbers of students is slowing.
As this report has outlined, there have been recent falls in student numbers in three of the five types of provision. Rapid growth in students studying through collaborative provision and at overseas campuses has off-set slight reductions in students studying through other types. It is not possible to identify a trend, however. While there have only been increases since 2007-08 in overseas campus-based students and students studying through collaborative provision, there has been a mixed picture across the other types of provision, with large growth between some years and reductions during others. Comprehensive data from 2016-17 will provide insights which may provide stronger signals about whether the reduction in students in the latter three types of provision is a trend, and if so whether increases in the other two will counterbalance enough to see continued increases in overall student numbers.
The picture is also different when comparing the eight regions included in this report. TNE expansion seems to have stabilised in traditional markets and is growing more rapidly in newer markets. Slowed rates and relatively low numbers in many cases reflect a lack of intelligence available to universities, or policy contexts which limit the volume and type of activity in-country, or domestic higher education systems which successfully meet demand.
19. HESA, January 11 2018. Higher Education Student Statistics: UK, 2016/17. Found here https://www.hesa.ac.uk/news/ 11-01-2018/sfr247-higher-education-studentstatistics/location
59 THE SCALE OF UK HIGHER EDUCATION TRANSNATIONAL EDUCATION 2015–16 Conclusion
We have seen that UK HE TNE student numbers are continuing to grow in Asia, the Middle East and the European Union (EU). Each of these regions has its own specific challenges, for example:
• UK HE TNE student numbers in Asia continue to grow but it is becoming an increasingly crowded market for TNE. Domestic provision, particularly in ASEAN countries, is also expanding. While this could challenge the sector to remain innovative and identify niche demand, it is also a solid foundation on which to build.
• several countries in the Middle East are actively seeking UK universities to establish branch campuses, while recognition issues and anxieties over political contexts remain in some countries.
• the EU comes with its own unique set of challenges as the UK’s relationship with the EU is set to change through Brexit. The ways in which this might have an impact upon existing and future partnerships are as yet unclear. Within this uncertain context, UK universities are seeking assurances that existing partnerships would not be affected and that mechanisms to create new partnerships will not be affected by Brexit.
Other regions present more of a mixed picture:
• With relatively high growth rates, Africa may be where UK universities increase their presence and partnerships most significantly; but this is characterised by strong growth in a few key countries, including Egypt and Mauritius. Africa hosts the relative majority of students studying through distance, flexible or distributed learning, which may provide an indication of the direction of travel for UK provision.
• South America, Australasia and North America have relatively low volumes of students, the majority of whom are postgraduates and studying through distance, flexible or distributed learning. In the case of the latter two this may be due to well established higher education systems. Countries in these regions with lower volumes of UK HE TNE students may present opportunities for the UK Government to work with partner governments to create conditions which would enable more diverse forms of TNE, beyond distance learning.
• UK HE TNE numbers are low in South America, but the shifts in growth over recent years suggest an openness of emerging TNE markets in the region. Lack of recognition and policy restrictions in some countries stand in the way of partnership expansio.
Changes across the globe in the relative enthusiasm to host TNE, and the recognition by several countries that they do not currently have capacity to deliver their higher education need, suggest that further new markets for TNE may open up to the UK. As such, the shifts reported here may change rapidly. To support universities and help inform policy to adapt, more country intelligence will be needed about operating environments and regulatory frameworks. Resources such as the British Council’s Global Gauge of Higher Education Policy,20 as well as government and British Council education experts, provide advice and guidance on the opportunities and operating conditions in key nascent markets.
This report is based on HESA AOR data which is provided by universities. The analysis is limited both by the data structure and the reliability of the student numbers captured within that record. Other information which is not currently readily available and would be valuable for future studies includes: which subject programmes are offered and where; student demographics; the economic and wider value of different types of TNE and in different locations; country-specific intelligence for nascent markets, and competitor analysis. More detailed data would allow for greater insights into granular trends in TNE which would better inform universities and the government of the direction and opportunities in TNE. This could, for example, shed light on what new models of TNE look like, how these relate to past models and what the trajectory of TNE delivered digitally has been.
20. https://www.britishcouncil.org/education/ihe/knowledge-centre/global-landscape/global-gauge.
60 THE SCALE OF UK HIGHER EDUCATION TRANSNATIONAL EDUCATION 2015–16 Conclusion
New approaches and innovative models continue to keep UK higher education at the cutting edge of TNE. The popularity of UK HE TNE globally is predicated on the UK’s reputation for providing quality higher education, and also having the frameworks in place to ensure these standards, such as the Quality Code. Sustaining and demonstrating this to global partners depends on continuing excellence in delivery and the involvement and support of relevant agencies and partners, including the QAA and the British Council. It also requires support from UK government departments and an understanding at a policy level of university operations and international priorities.
UK HE TNE has become a core component of many universities’ strategic approach to international growth. It is not a sole institutional endeavour however; the success or failure of TNE has an impact on not just an individual university, or the higher education sector, but our wider interactions and reputation around the world. TNE directly and indirectly cements and maintains bilateral education relations between the UK and its partners. While the UK government supports the sector by leveraging opportunities overseas, universities, their staff and TNE students are global ambassadors for UK higher education and play an important role in supporting and promoting its strong reputation.
Who studies through UK HE TNE, how, where and at what level is changing and these changes stand to influence approaches to TNE. Continuing to examine the UK’s HE TNE journey will provide universities and the government with evidence which informs how current and future stakeholders, including students, continue to benefit from relevant, high quality and context-relevant degrees delivered overseas.
61 THE SCALE OF UK HIGHER EDUCATION TRANSNATIONAL EDUCATION 2015–16

CONTACT USEmAIL [email protected] TEL +44 (0)20 7419 4111
Woburn House 20 Tavistock Square London, WC1H 9HQ
@UUKIntl Universities UK International