Embed Size (px)
Citation preview
The satellites behind the platformIoannis Papoutsis: Research Partner,
RECAP project
Outline
• A few words about Remote Sensing
• The problem RECAP aspires to address
• The RECAP Remote Sensing System
• Classification workflow• Classification workflow
• Some results!
Remote Sensing fundamentals
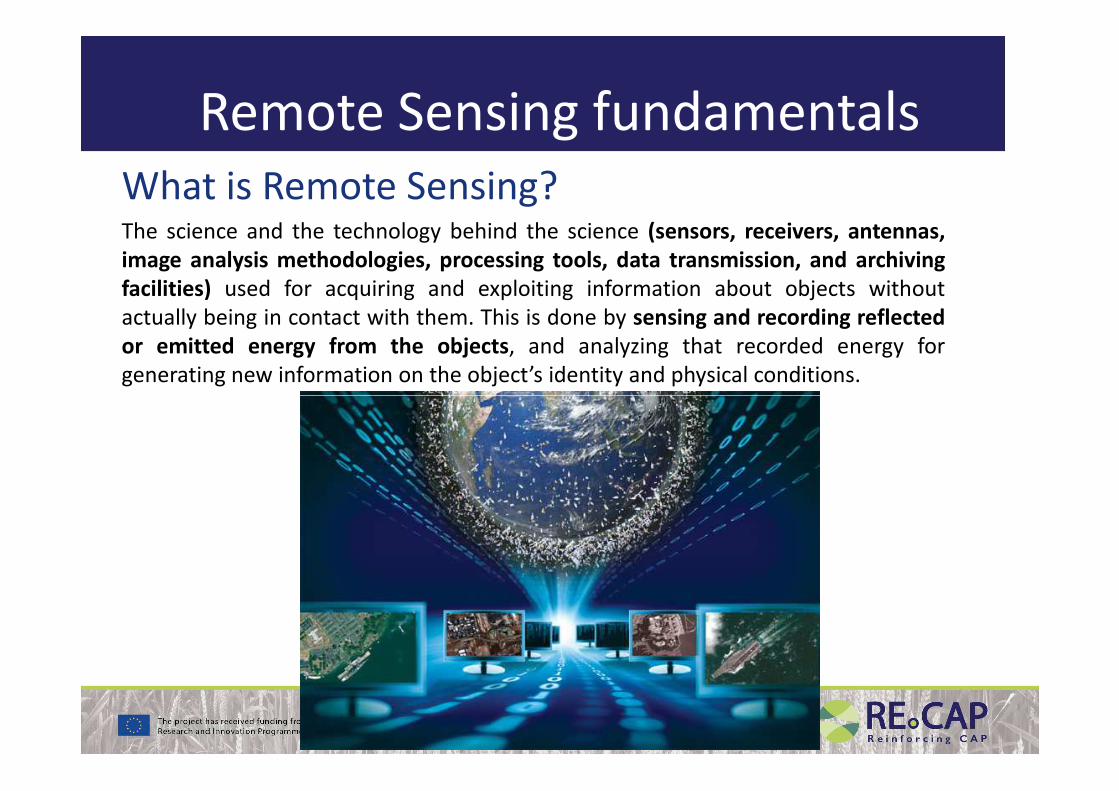
What is Remote Sensing?The science and the technology behind the science (sensors, receivers, antennas,
image analysis methodologies, processing tools, data transmission, and archiving
facilities) used for acquiring and exploiting information about objects without
actually being in contact with them. This is done by sensing and recording reflected
or emitted energy from the objects, and analyzing that recorded energy for
generating new information on the object’s identity and physical conditions.
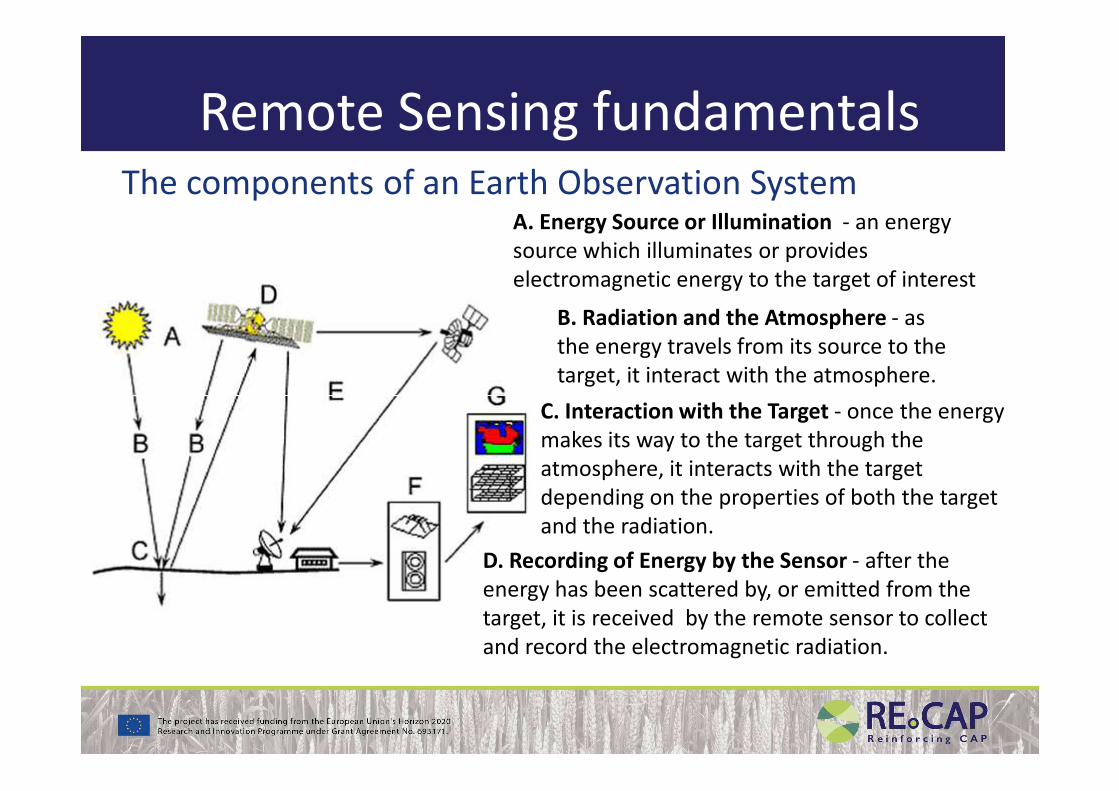
Remote Sensing fundamentalsThe components of an Earth Observation System
A. Energy Source or Illumination - an energy
source which illuminates or provides
electromagnetic energy to the target of interest
B. Radiation and the Atmosphere - as
the energy travels from its source to the
target, it interact with the atmosphere.
C. Interaction with the Target - once the energy
makes its way to the target through the
atmosphere, it interacts with the target
depending on the properties of both the target
and the radiation.
D. Recording of Energy by the Sensor - after the
energy has been scattered by, or emitted from the
target, it is received by the remote sensor to collect
and record the electromagnetic radiation.
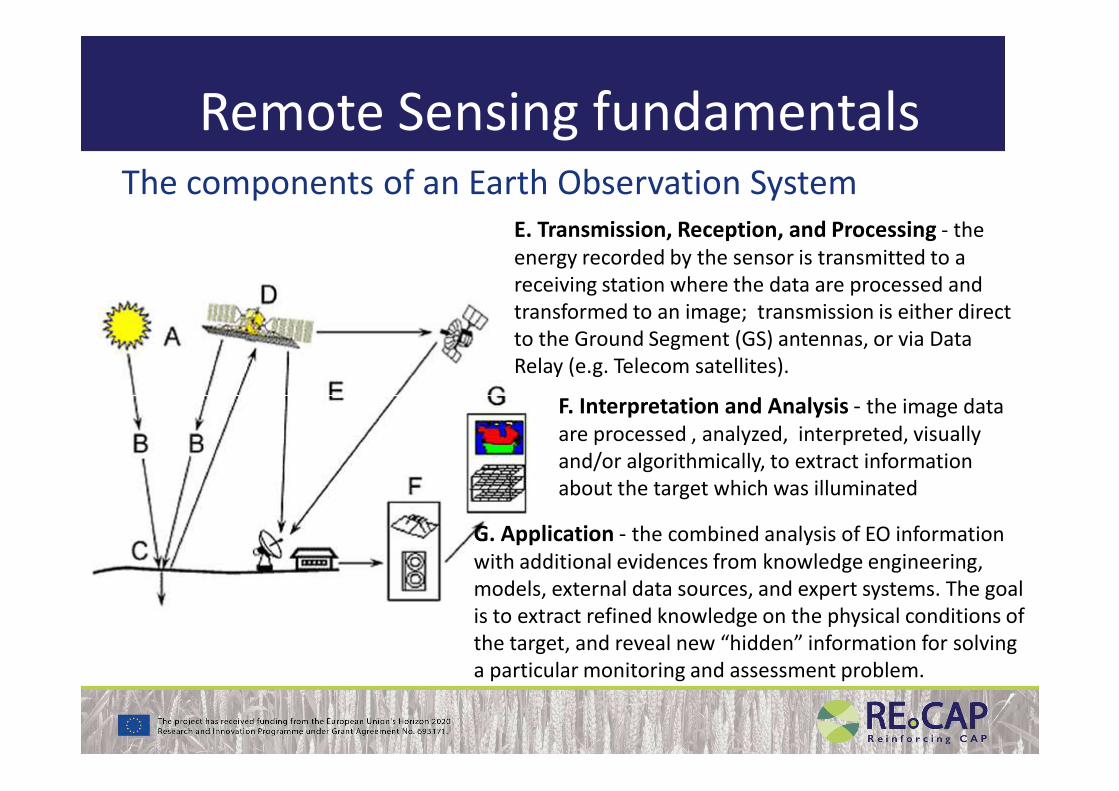
Remote Sensing fundamentalsThe components of an Earth Observation System
E. Transmission, Reception, and Processing - the
energy recorded by the sensor is transmitted to a
receiving station where the data are processed and
transformed to an image; transmission is either direct
to the Ground Segment (GS) antennas, or via Data
Relay (e.g. Telecom satellites).
F. Interpretation and Analysis - the image data F. Interpretation and Analysis - the image data
are processed , analyzed, interpreted, visually
and/or algorithmically, to extract information
about the target which was illuminated
G. Application - the combined analysis of EO information
with additional evidences from knowledge engineering,
models, external data sources, and expert systems. The goal
is to extract refined knowledge on the physical conditions of
the target, and reveal new “hidden” information for solving
a particular monitoring and assessment problem.
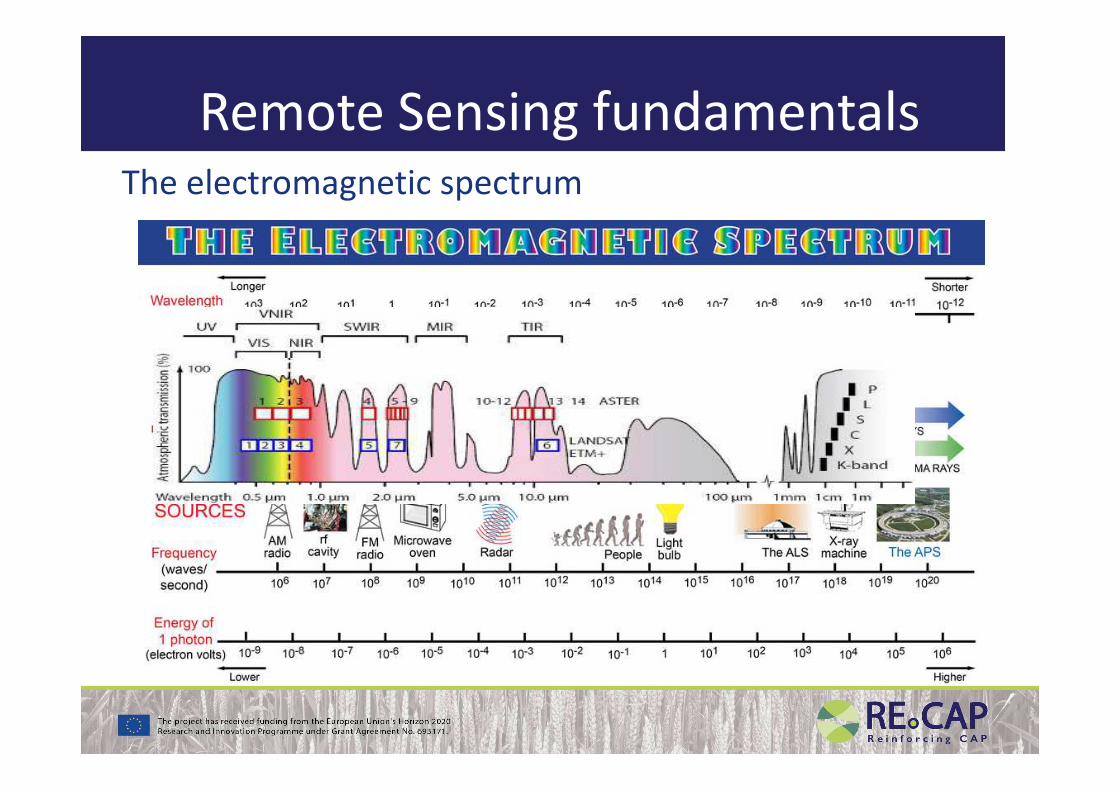
Remote Sensing fundamentalsThe electromagnetic spectrum
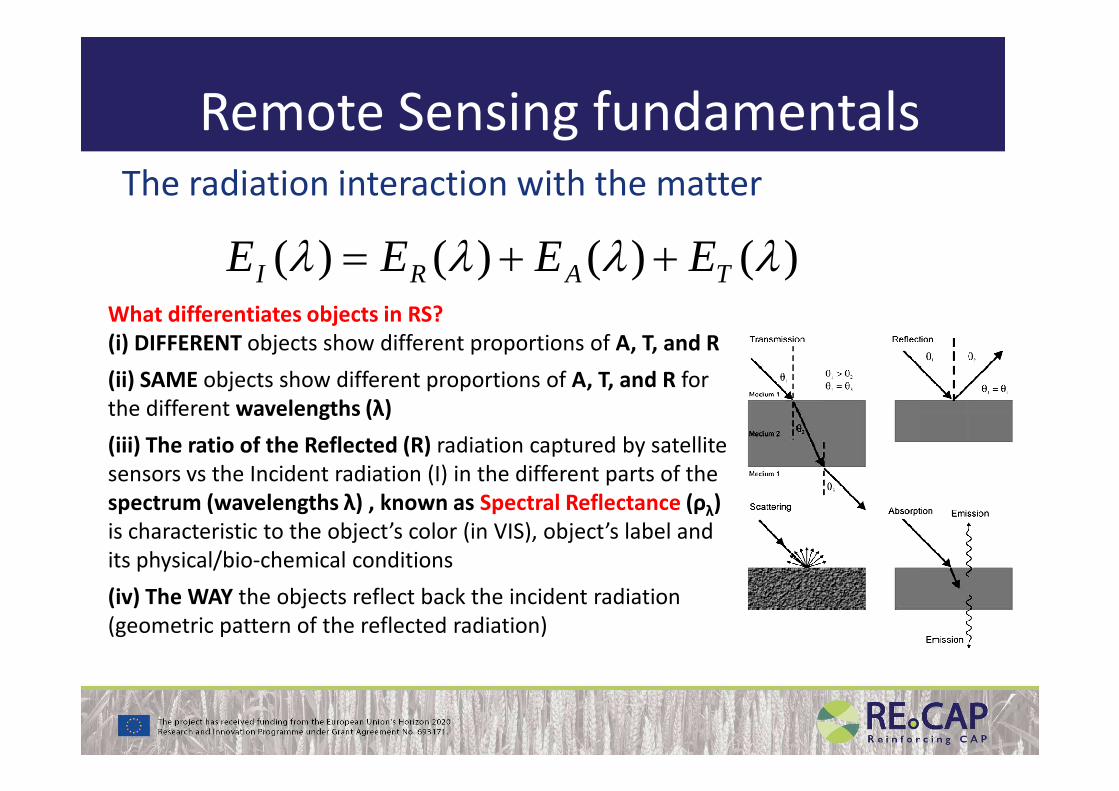
Remote Sensing fundamentalsThe radiation interaction with the matter
)()()()( λλλλ TARI EEEE ++=
What differentiates objects in RS?
(i) DIFFERENT objects show different proportions of A, T, and R
(ii) SAME objects show different proportions of A, T, and R for
the different wavelengths (λ)the different wavelengths (λ)
(iii) The ratio of the Reflected (R) radiation captured by satellite
sensors vs the Incident radiation (I) in the different parts of the
spectrum (wavelengths λ) , known as Spectral Reflectance (ρλ)
is characteristic to the object’s color (in VIS), object’s label and
its physical/bio-chemical conditions
(iv) The WAY the objects reflect back the incident radiation
(geometric pattern of the reflected radiation)
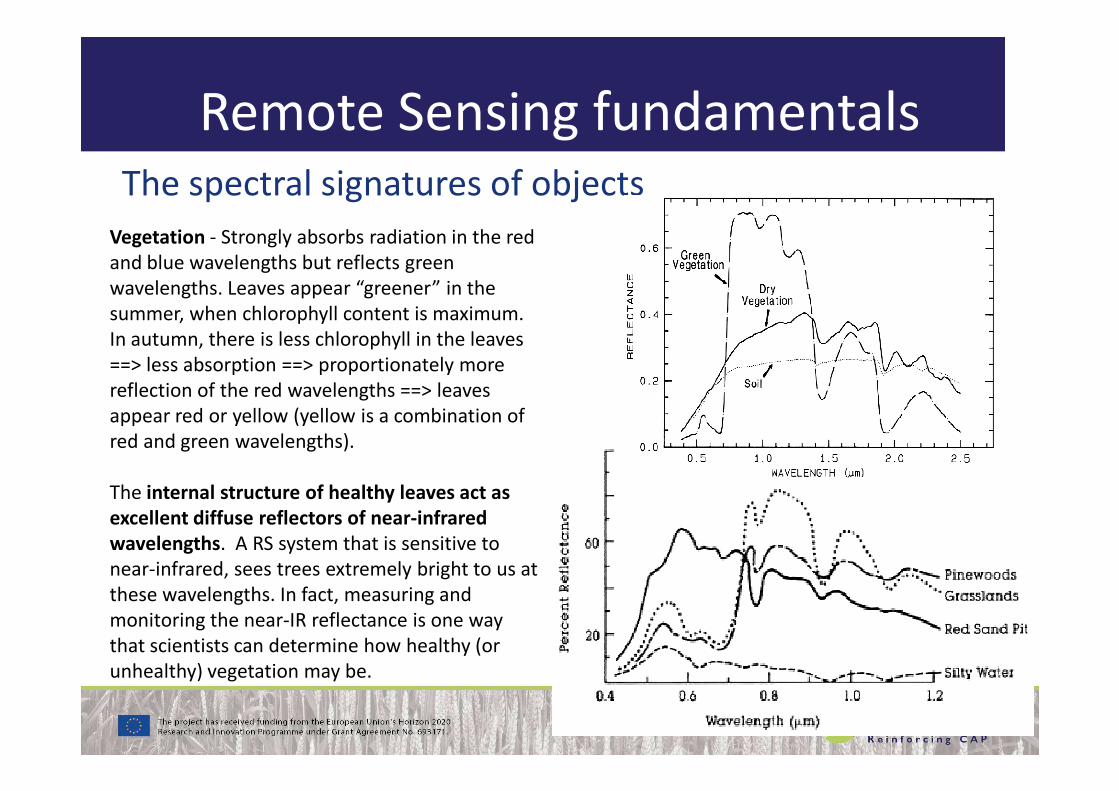
Remote Sensing fundamentalsThe spectral signatures of objects
Vegetation - Strongly absorbs radiation in the red
and blue wavelengths but reflects green
wavelengths. Leaves appear “greener” in the
summer, when chlorophyll content is maximum.
In autumn, there is less chlorophyll in the leaves
==> less absorption ==> proportionately more
reflection of the red wavelengths ==> leaves reflection of the red wavelengths ==> leaves
appear red or yellow (yellow is a combination of
red and green wavelengths).
The internal structure of healthy leaves act as
excellent diffuse reflectors of near-infrared
wavelengths. A RS system that is sensitive to
near-infrared, sees trees extremely bright to us at
these wavelengths. In fact, measuring and
monitoring the near-IR reflectance is one way
that scientists can determine how healthy (or
unhealthy) vegetation may be.
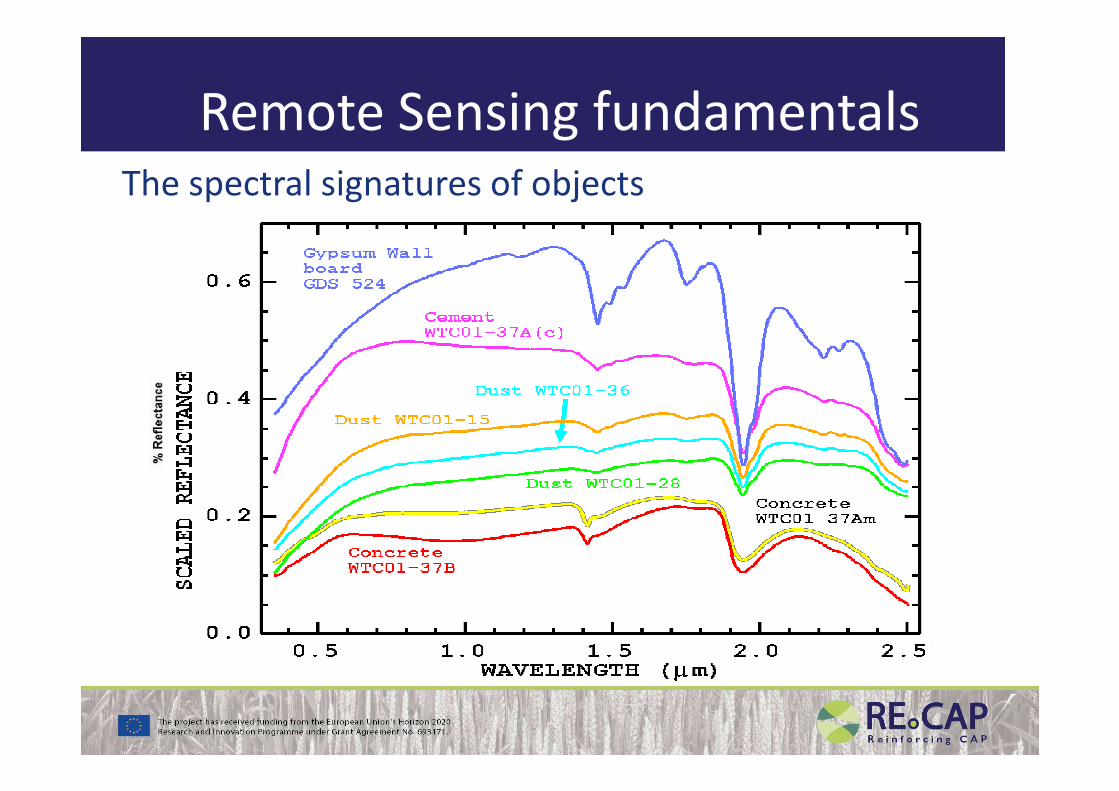
Remote Sensing fundamentalsThe spectral signatures of objects
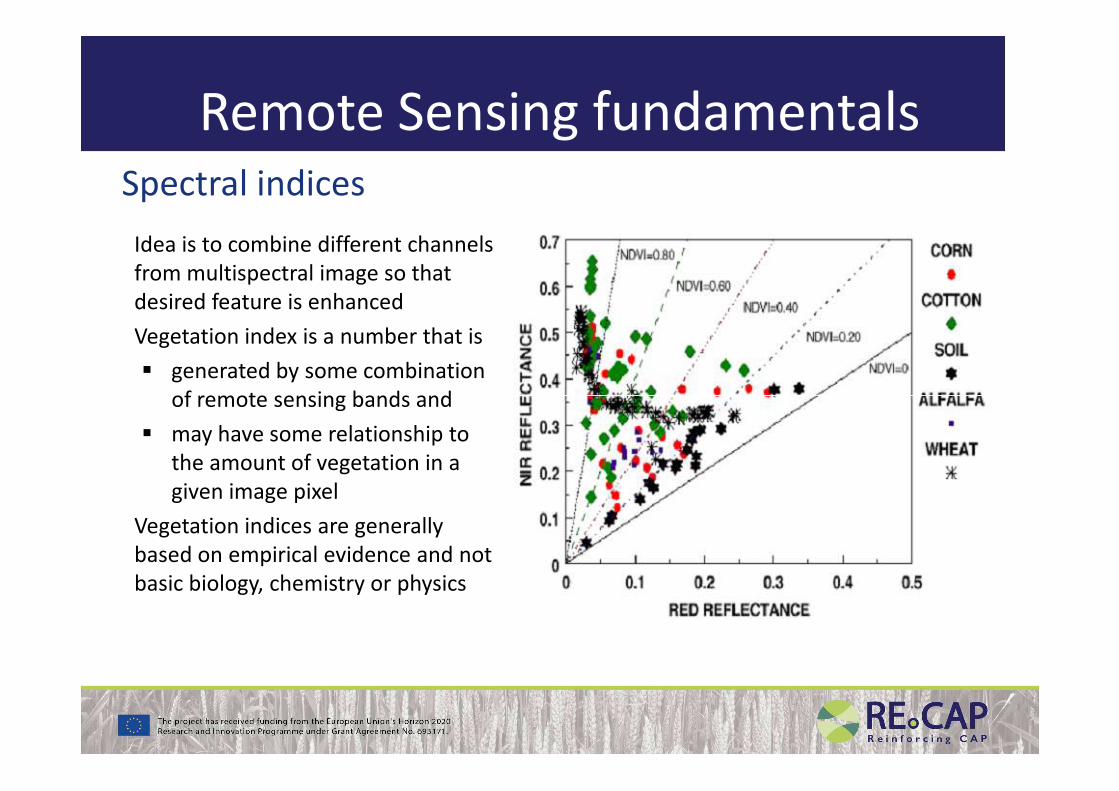
Remote Sensing fundamentalsSpectral indices
Idea is to combine different channels
from multispectral image so that
desired feature is enhanced
Vegetation index is a number that is
� generated by some combination
of remote sensing bands and of remote sensing bands and
� may have some relationship to
the amount of vegetation in a
given image pixel
Vegetation indices are generally
based on empirical evidence and not
basic biology, chemistry or physics
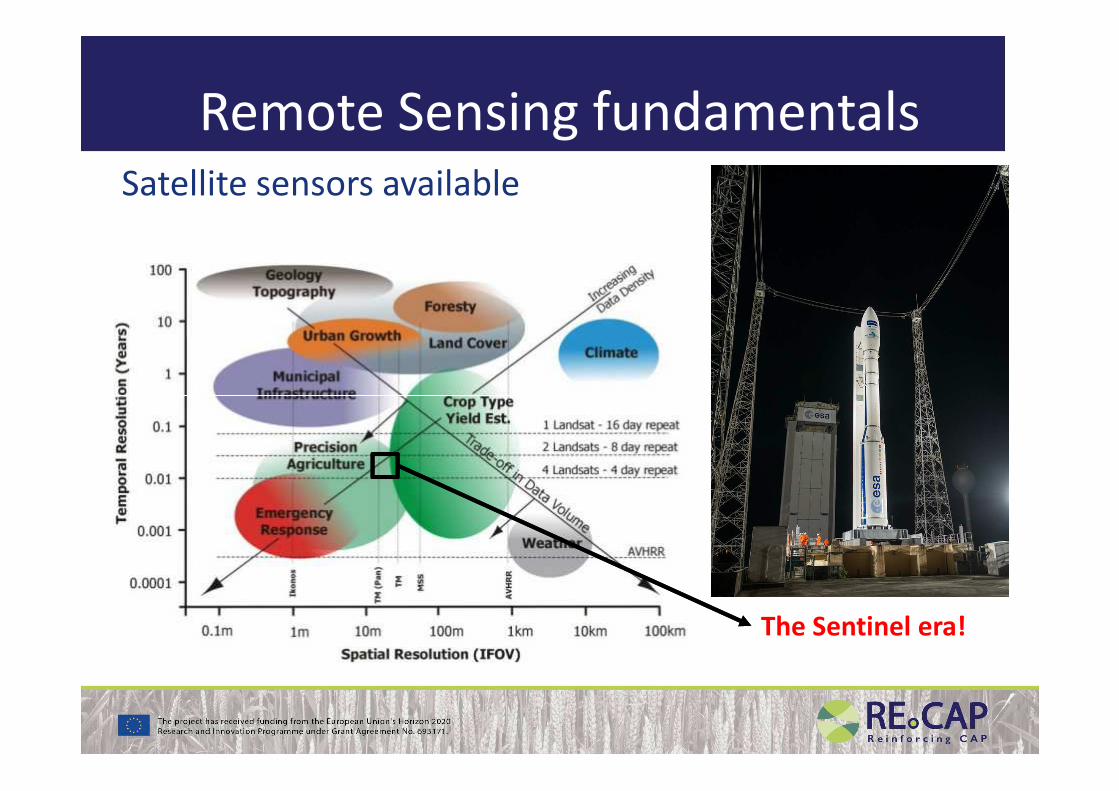
Remote Sensing fundamentalsSatellite sensors available
The Sentinel era!
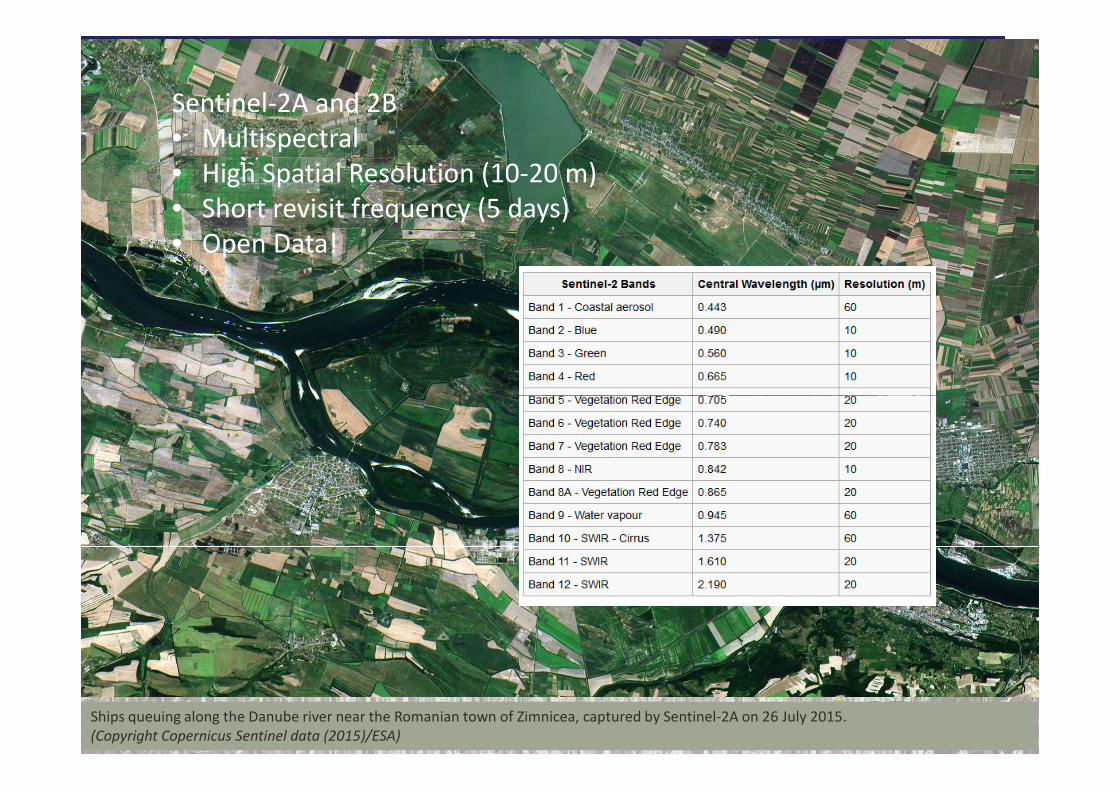
Sentinel-2A and 2B
• Multispectral
• High Spatial Resolution (10-20 m)
• Short revisit frequency (5 days)
• Open Data!
Ships queuing along the Danube river near the Romanian town of Zimnicea, captured by Sentinel-2A on 26 July 2015.
(Copyright Copernicus Sentinel data (2015)/ESA)
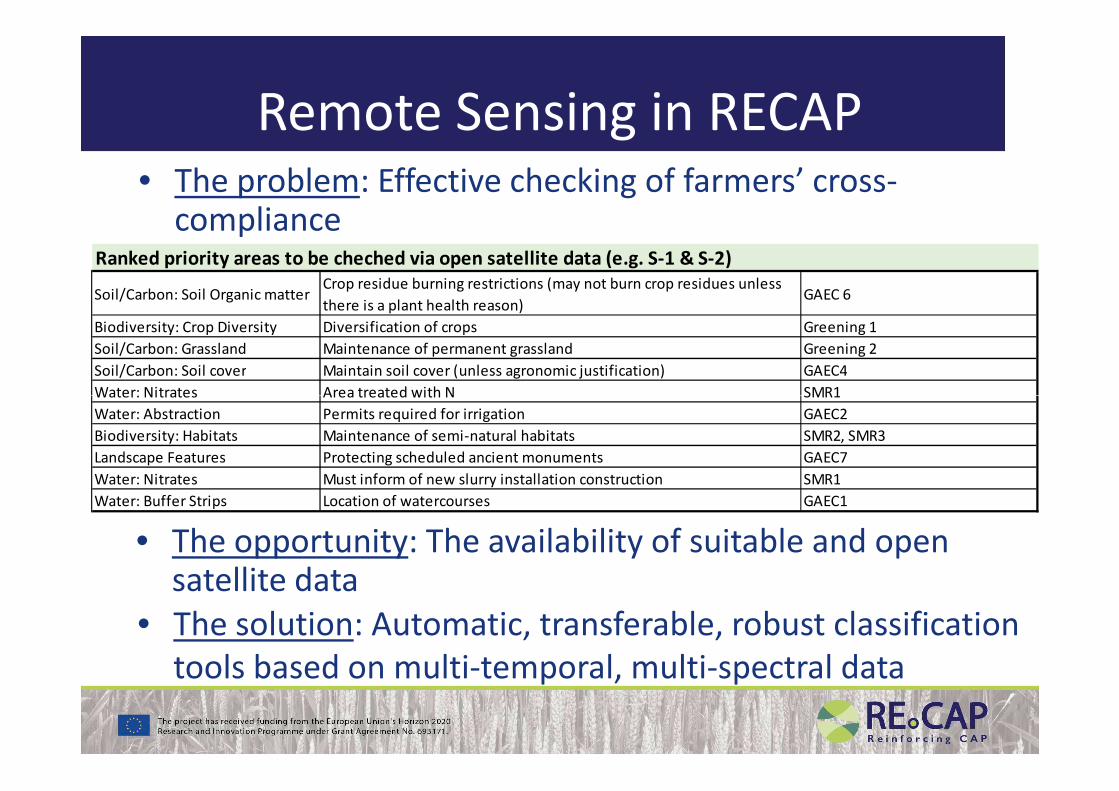
Remote Sensing in RECAP• The problem: Effective checking of farmers’ cross-
compliance
Soil/Carbon: Soil Organic matterCrop residue burning restrictions (may not burn crop residues unless
there is a plant health reason)GAEC 6
Biodiversity: Crop Diversity Diversification of crops Greening 1
Soil/Carbon: Grassland Maintenance of permanent grassland Greening 2
Soil/Carbon: Soil cover Maintain soil cover (unless agronomic justification) GAEC4
Water: Nitrates Area treated with N SMR1
Ranked priority areas to be cheched via open satellite data (e.g. S-1 & S-2)
Water: Nitrates Area treated with N SMR1
Water: Abstraction Permits required for irrigation GAEC2
Biodiversity: Habitats Maintenance of semi-natural habitats SMR2, SMR3
Landscape Features Protecting scheduled ancient monuments GAEC7
Water: Nitrates Must inform of new slurry installation construction SMR1
Water: Buffer Strips Location of watercourses GAEC1
• The opportunity: The availability of suitable and open satellite data
• The solution: Automatic, transferable, robust classification
tools based on multi-temporal, multi-spectral data
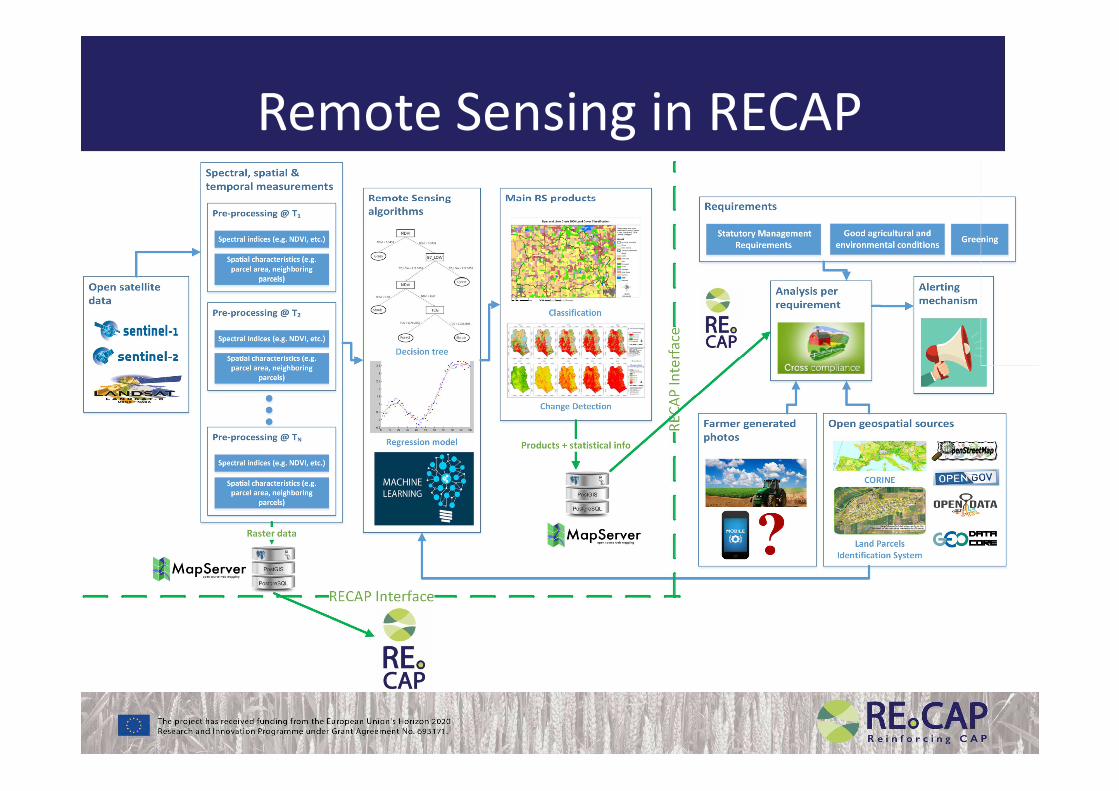
Remote Sensing in RECAP
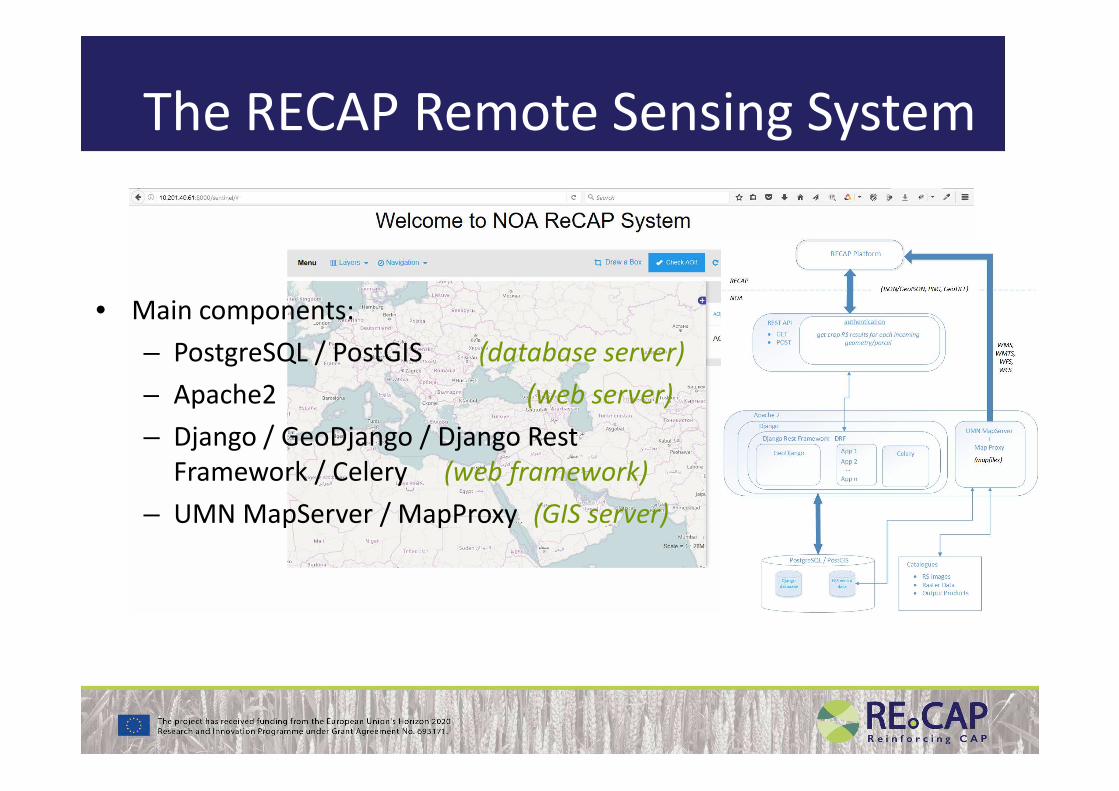
The RECAP Remote Sensing System
• Main components:
– PostgreSQL / PostGIS (database server)
– Apache2 (web server)– Apache2 (web server)
– Django / GeoDjango / Django Rest
Framework / Celery (web framework)
– UMN MapServer / MapProxy (GIS server)
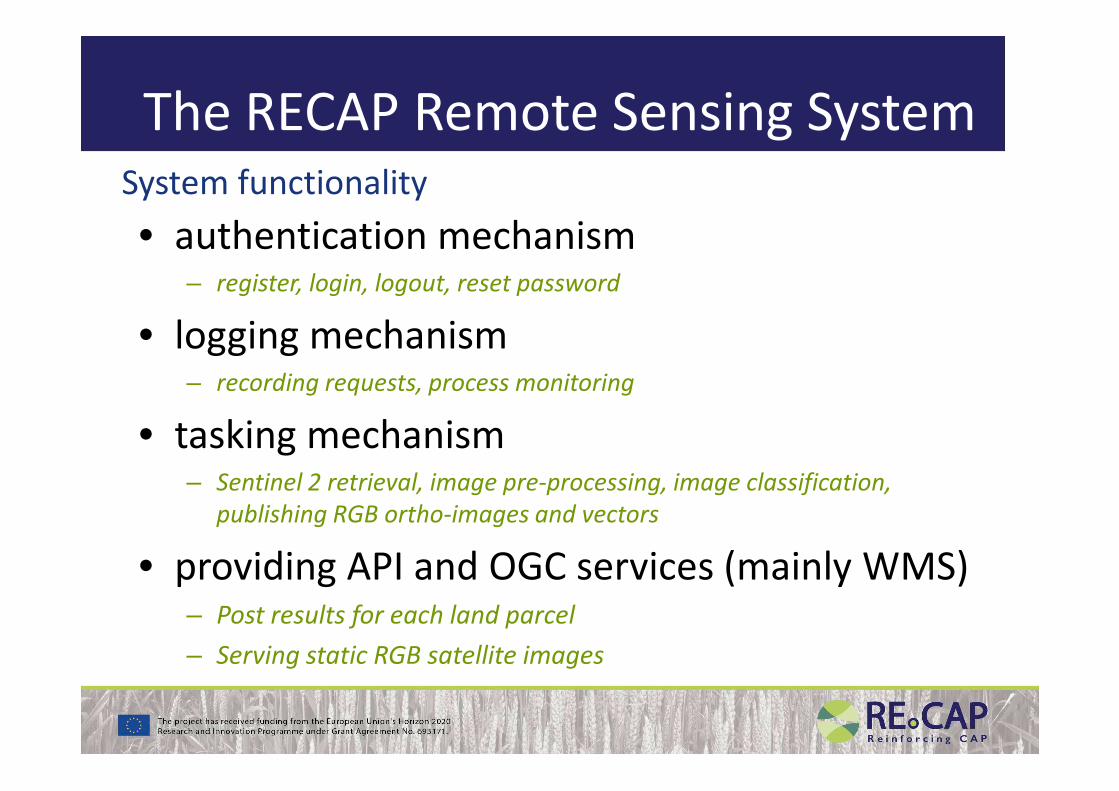
The RECAP Remote Sensing SystemSystem functionality
• authentication mechanism – register, login, logout, reset password
• logging mechanism – recording requests, process monitoring– recording requests, process monitoring
• tasking mechanism– Sentinel 2 retrieval, image pre-processing, image classification,
publishing RGB ortho-images and vectors
• providing API and OGC services (mainly WMS)– Post results for each land parcel
– Serving static RGB satellite images
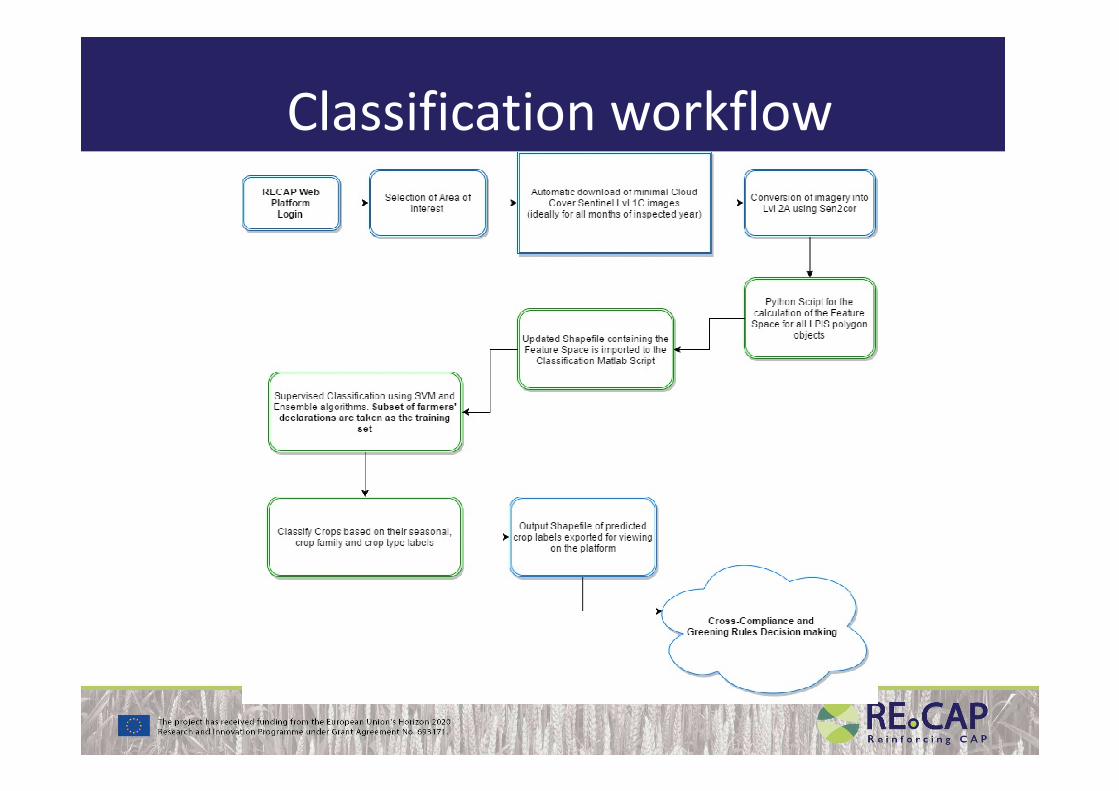
Classification workflow
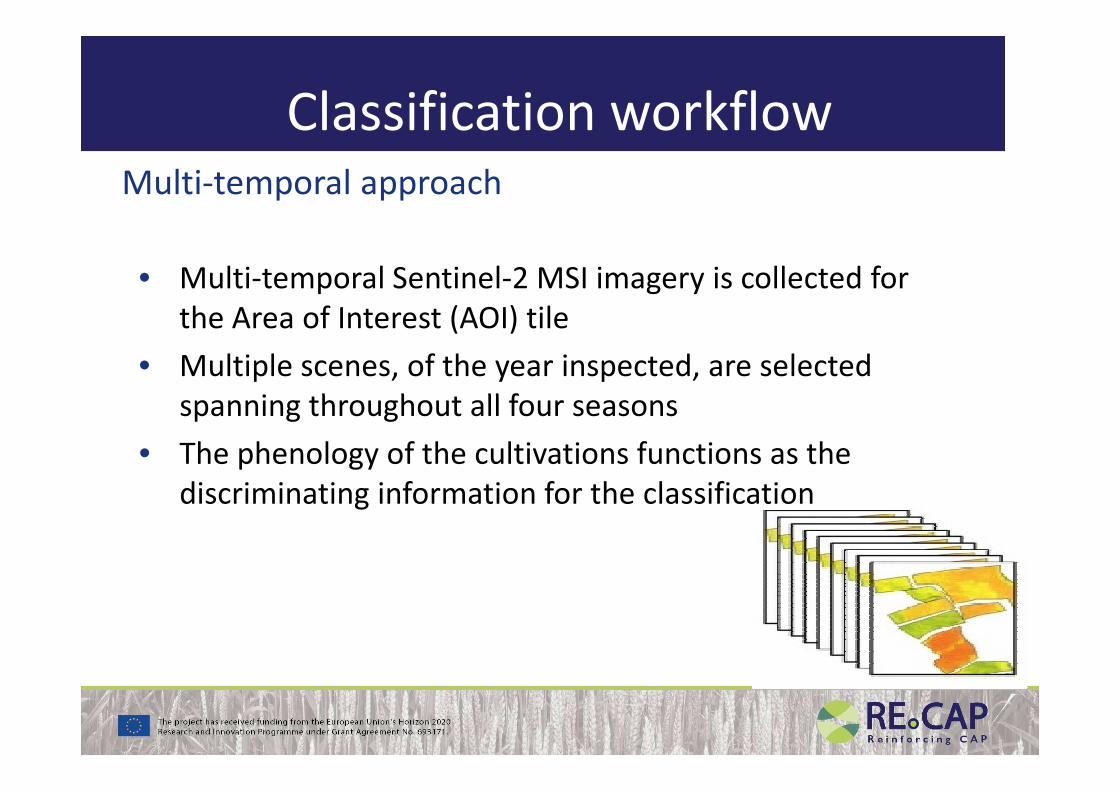
Classification workflowMulti-temporal approach
• Multi-temporal Sentinel-2 MSI imagery is collected for
the Area of Interest (AOI) tile
• Multiple scenes, of the year inspected, are selected
spanning throughout all four seasonsspanning throughout all four seasons
• The phenology of the cultivations functions as the
discriminating information for the classification
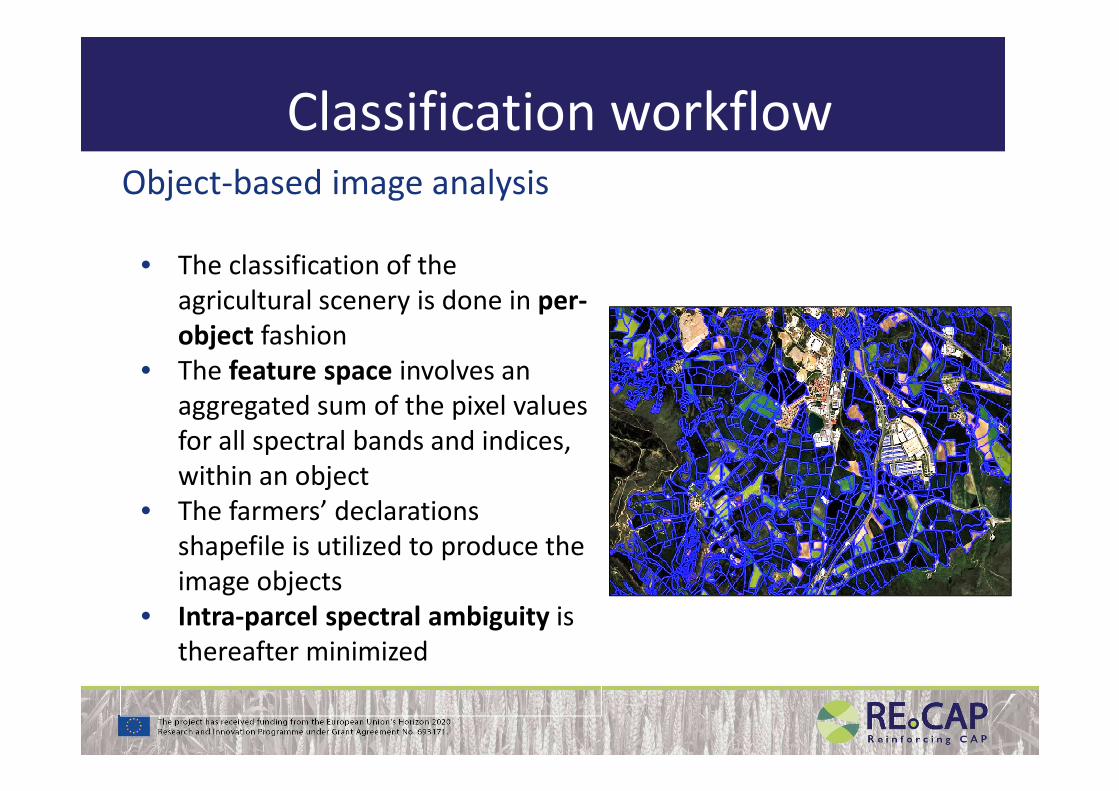
Classification workflowObject-based image analysis
• The classification of the
agricultural scenery is done in per-
object fashion
• The feature space involves an
aggregated sum of the pixel values aggregated sum of the pixel values
for all spectral bands and indices,
within an object
• The farmers’ declarations
shapefile is utilized to produce the
image objects
• Intra-parcel spectral ambiguity is
thereafter minimized
Classification workflowFeature space creation
• Implementation of python script to receive the pre-
processed stacked image of the AOI tile
• Segmentation based on the declarations’ shapefile and
feature extraction for the objectsfeature extraction for the objects
• The Feature Space is comprised from the RGB and NIR bands
of all scenes
• Vegetation Indices such as NDVI and PSRI are also utilized
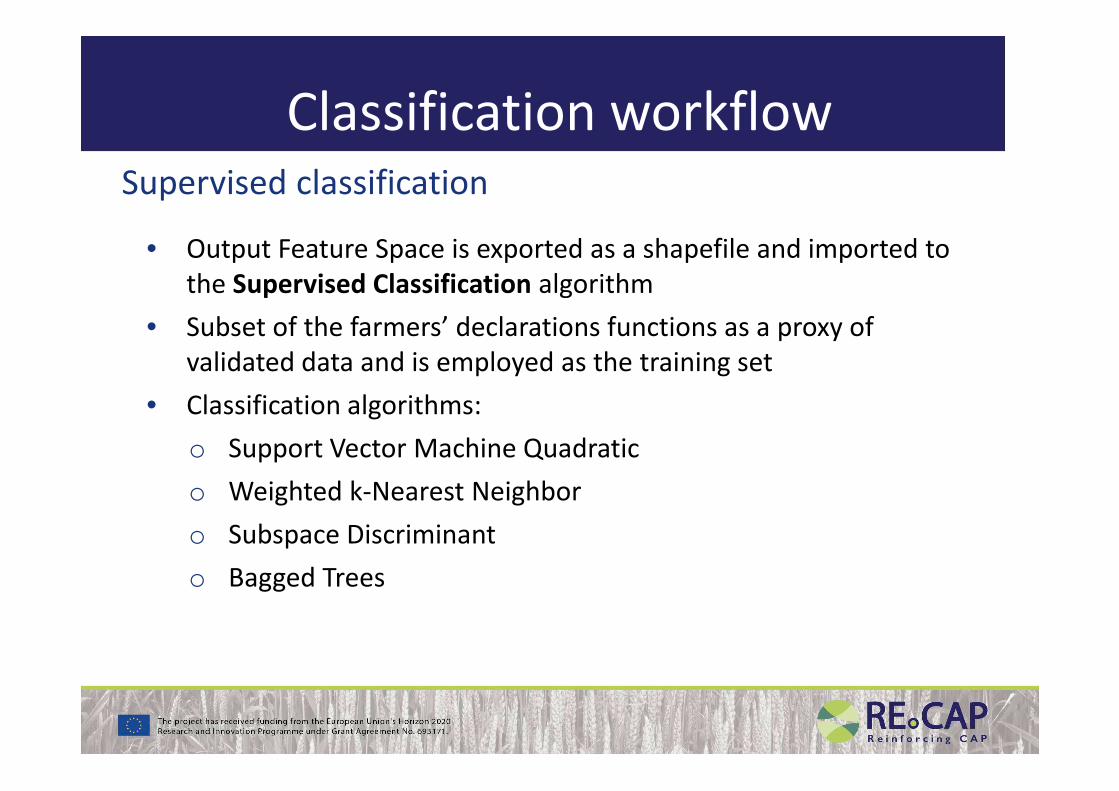
Classification workflowSupervised classification
• Output Feature Space is exported as a shapefile and imported to
the Supervised Classification algorithm
• Subset of the farmers’ declarations functions as a proxy of
validated data and is employed as the training set
• Classification algorithms:• Classification algorithms:
o Support Vector Machine Quadratic
o Weighted k-Nearest Neighbor
o Subspace Discriminant
o Bagged Trees
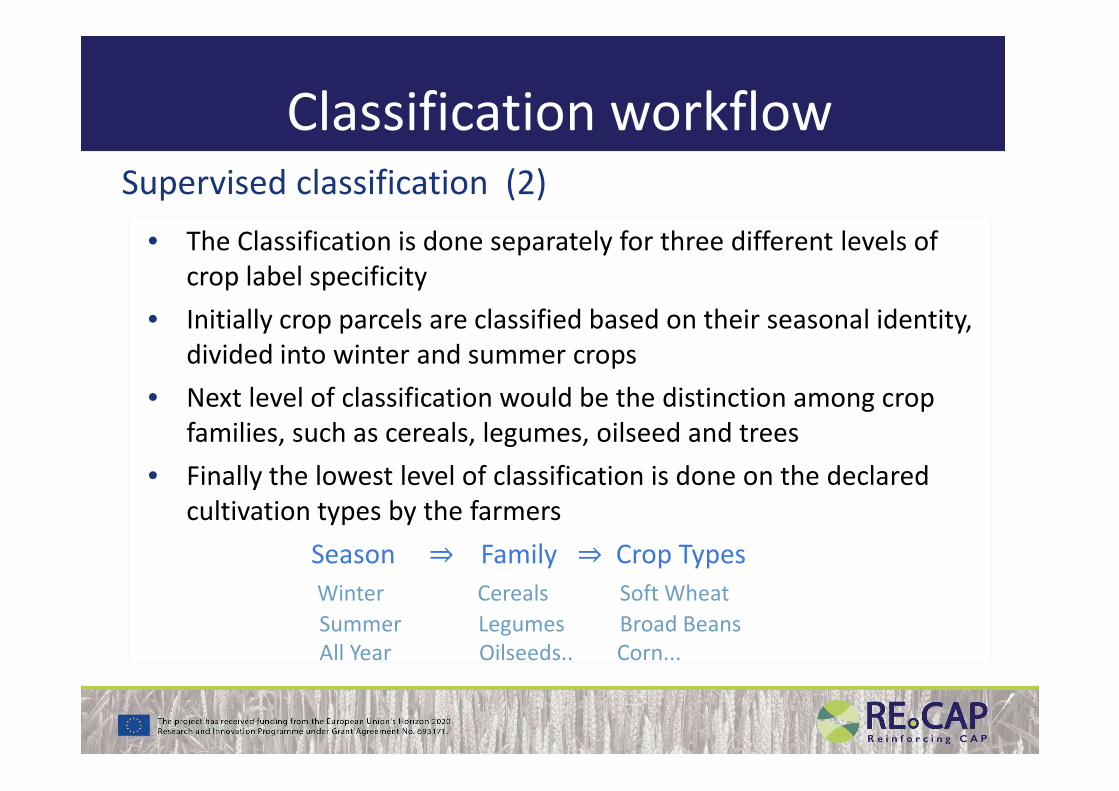
Classification workflowSupervised classification (2)
• The Classification is done separately for three different levels of
crop label specificity
• Initially crop parcels are classified based on their seasonal identity,
divided into winter and summer crops
• Next level of classification would be the distinction among crop • Next level of classification would be the distinction among crop
families, such as cereals, legumes, oilseed and trees
• Finally the lowest level of classification is done on the declared
cultivation types by the farmers
Season ⇒ Family ⇒ Crop Types
Winter Cereals Soft Wheat
Summer Legumes Broad Beans
All Year Oilseeds.. Corn...
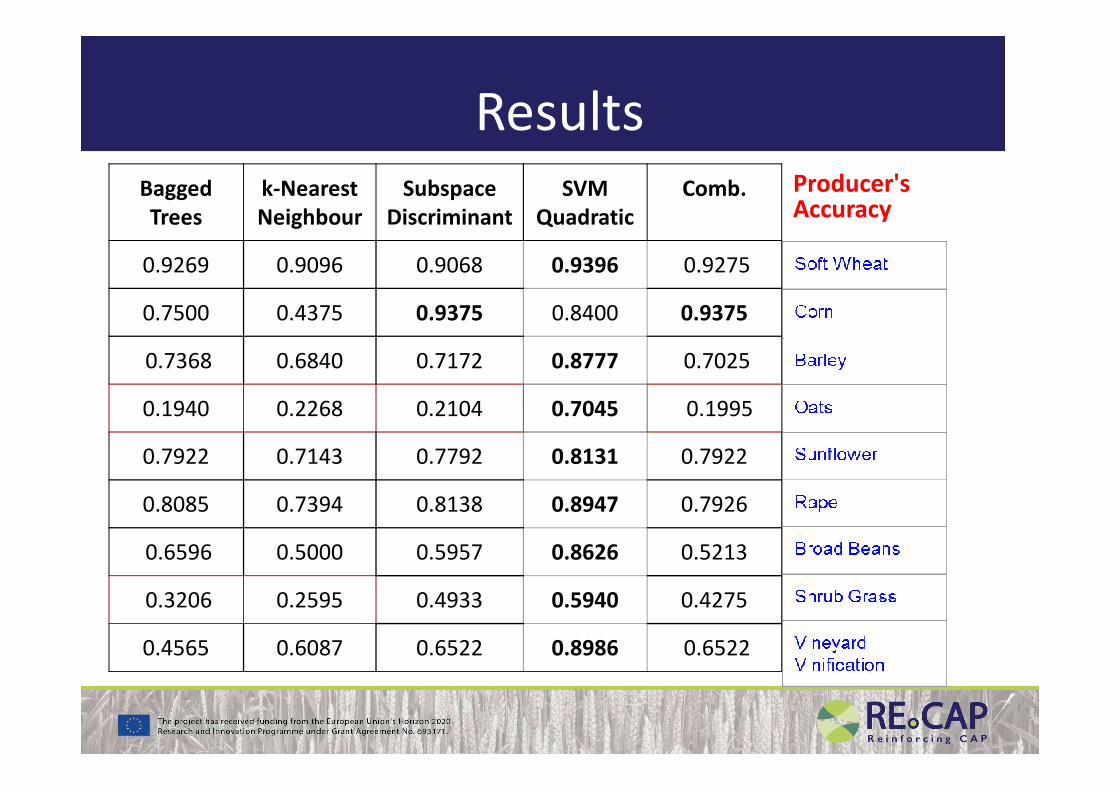
ResultsProducer's Accuracy
Bagged
Trees
k-Nearest
Neighbour
Subspace
Discriminant
SVM
Quadratic
Comb.
0.9269 0.9096 0.9068 0.9396 0.9275
0.7500 0.4375 0.9375 0.8400 0.9375
0.7368 0.6840 0.7172 0.8777 0.7025
0.1940 0.2268 0.2104 0.7045 0.19950.1940 0.2268 0.2104 0.7045 0.1995
0.7922 0.7143 0.7792 0.8131 0.7922
0.8085 0.7394 0.8138 0.8947 0.7926
0.6596 0.5000 0.5957 0.8626 0.5213
0.3206 0.2595 0.4933 0.5940 0.4275
0.4565 0.6087 0.6522 0.8986 0.6522
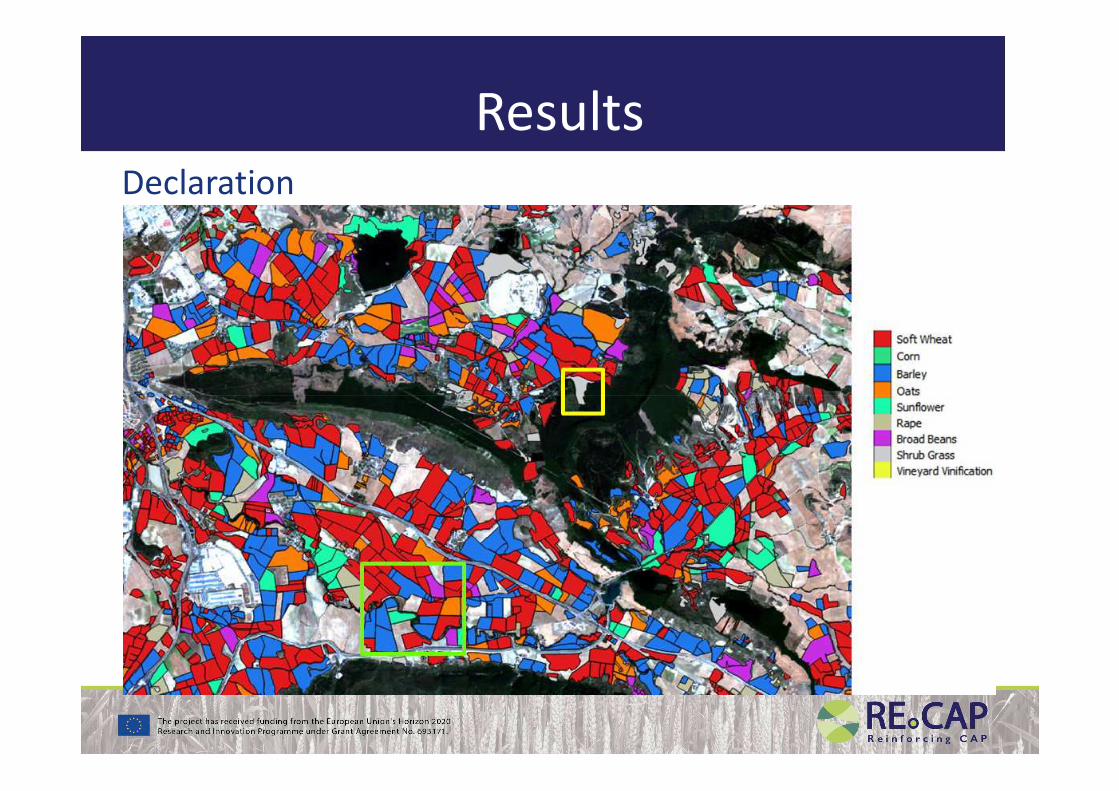
ResultsDeclaration
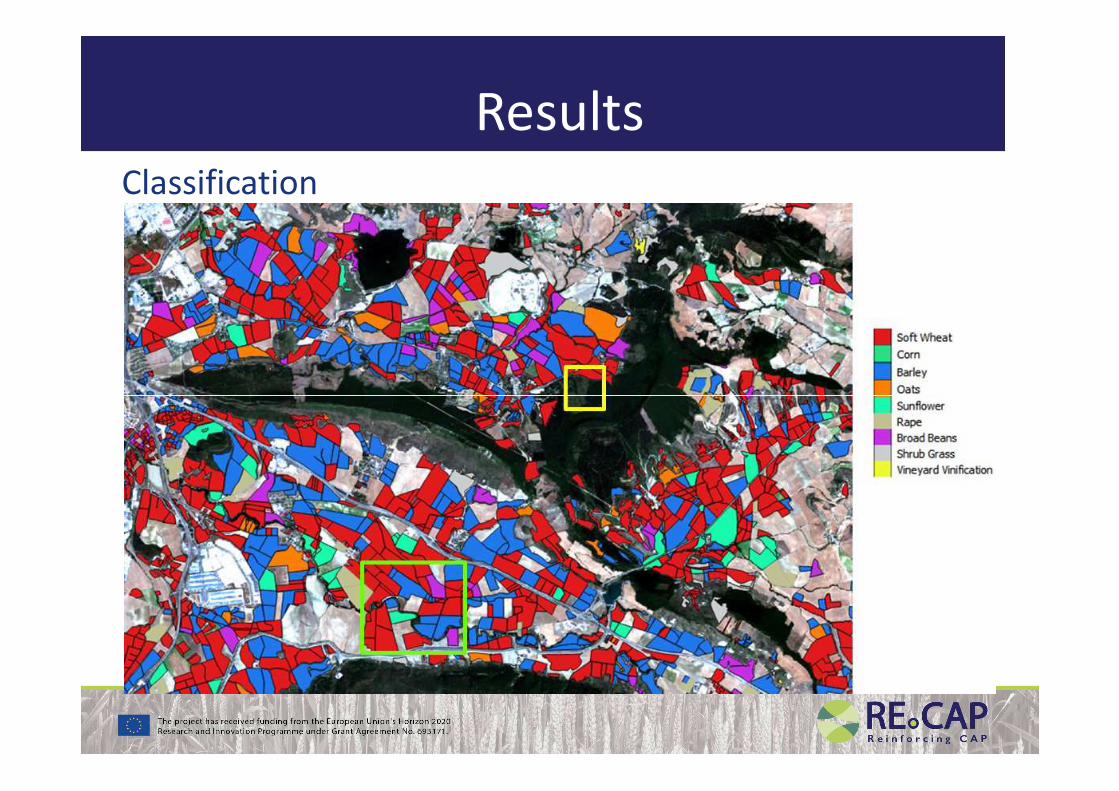
ResultsClassification
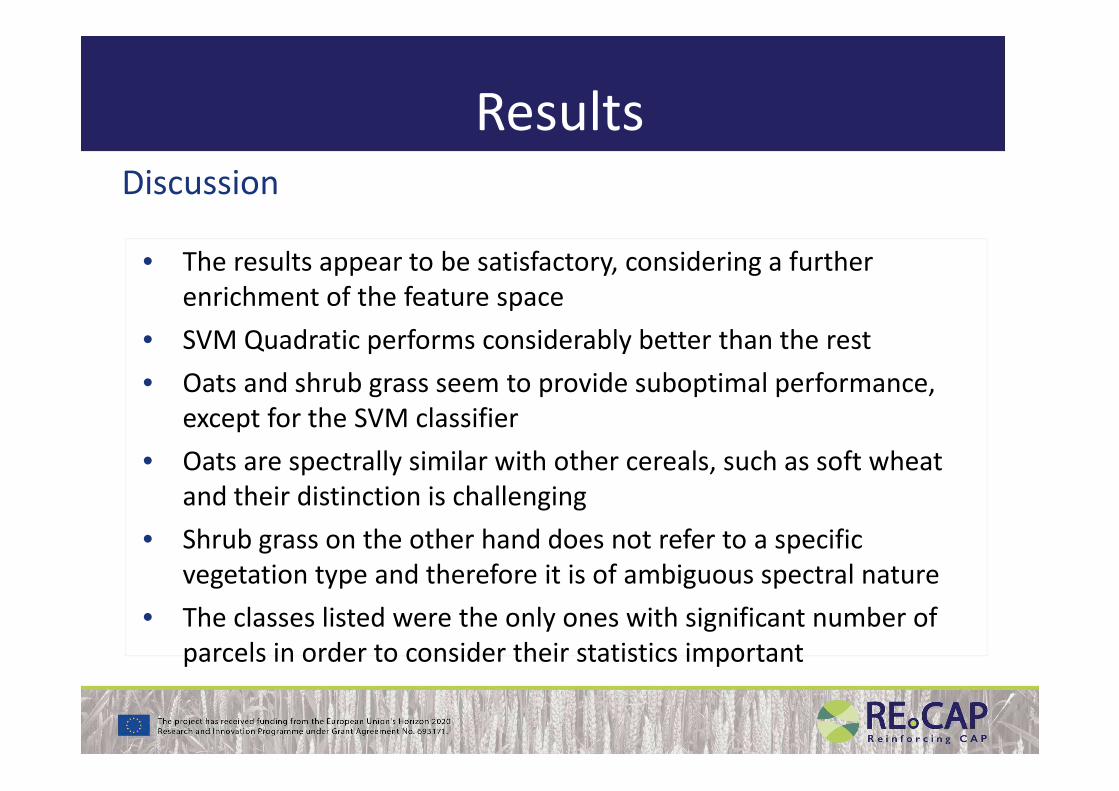
ResultsDiscussion
• The results appear to be satisfactory, considering a further
enrichment of the feature space
• SVM Quadratic performs considerably better than the rest
• Oats and shrub grass seem to provide suboptimal performance, • Oats and shrub grass seem to provide suboptimal performance,
except for the SVM classifier
• Oats are spectrally similar with other cereals, such as soft wheat
and their distinction is challenging
• Shrub grass on the other hand does not refer to a specific
vegetation type and therefore it is of ambiguous spectral nature
• The classes listed were the only ones with significant number of
parcels in order to consider their statistics important
Outlook
• The Remote Sensing Component of the RECAP platform
provides an automated workflow for the classification of the
agricultural scenery
• Addresses needs of Paying Agencies, farmers and agro-ICT
consultants
• The user decides on the area to be inspected and the
platform provides an on-demand classification product
• System design & implementation characteristics
⇒ User friendliness and flexibility
⇒⇒⇒⇒ Time-efficiency
⇒⇒⇒⇒ Geographic Transferability
⇒⇒⇒⇒ Scalability to higher data dimensions (Big Data)