Embed Size (px)
Citation preview
The Sarbanes-Oxley Act and Small Public Companies
Smrity Prakash Randhawa*
June 15th, 2009
ABSTRACT
This study constructs measures of costs as well as benefits of implementing Section 404 for small public companies. In this paper I provide a comprehensive measure of Section 404 costs by developing models of direct and indirect costs based on financial statement information. The results thus far indicate that implementing Section 404 of SOX was very costly for smaller public companies and therefore the non-accelerated filers that will become Section 404 compliant in the next few years need to be ready to pay a much higher cost for being public in the US. I further develop models to test the benefits of Sarbanes-Oxley. In particular, I construct tests to measure increase in quality and relevance of financial statements. The test results for earnings quality indicate that implementing Section 404 has increased the quality of earnings for small public companies.
* I would like to thank Maureen McNichols for her constant help and guidance. I would also like to thank Anat Admati, Bill Beaver, Robert Daines, George Foster, Charles Horngren, Alan Jagolinzer, Madhav Rajan, Ken Shotts and workshop participants at Stanford University for helpful comments and suggestions.
.
INTRODUCTION
The Sarbanes-Oxley (SOX) bill, signed into law on July 30th, 2002 is considered one of the most
far-reaching reforms of American business practices since the Securities Act of 19331. The Act
was passed in response to a number of major accounting scandals discovered during 2001-2002,
including Enron, Tyco International and WorldCom. Even five years after the passage of the
Act, there is considerable debate over whether smaller issuers2 should be subjected to Section
404 of the Act. Notably, research to date has not focused on smaller companies and therefore
provides limited guidance on the costs and benefits of the act for small firms. Therefore to shed
some light on this debate, I develop a comprehensive measure of costs as well as benefits of
SOX, in particular Section 404 in this paper. A major aim of this paper is to construct measures
of costs as well as benefits of implementing Section 404 for small public companies.
There are three different perspectives on whether smaller public companies should be subject to
Section 404 of SOX. The first perspective, advanced by Small Business Advocacy and the
Advisory committee on Smaller Public Companies,3 is that the costs of Section 404 compliance
are too high for smaller firms and therefore these firms should be exempted4 from becoming
Section 404 compliant. At a minimum it is argued that this requirement should be deferred until
it can be proven that these companies can become 404 compliant in a cost-effective manner.5
This view was also expressed in the recent article by Robert Grady in the Wall Street Journal.6
The second perspective, advanced by the Public Company Accounting Oversight Board
(PCAOB), is that Section 404 is an effective way of identifying companies with internal control 1 Elisabeth Bumiller: "Bush Signs Bill Aimed at Fraud in Corporations", The New York Times, July 31, 2002, page A1 2 Small issuers refers to non-accelerated filers 3 http://www.sec.gov/info/smallbus/acspc/acspc-finalreport_d.pdf 4 http://www.sec.gov/info/smallbus/acspc/acspc-finalreport_d.pdf 5 http://www.sba.gov/advo/laws/comments/sec06_0427.pdf 6 http://www.michiganvca.org/news_events/documents/TheSarboxMonster-WSJcom.pdf
problems and is therefore beneficial for shareholders. Therefore, it is important that all
companies should be subject to Section 404 regardless of size.7 Many pension funds have also
supported this view. The third perspective is that smaller firms should be subject to Section 404
but the requirements should be made less stringent for these firms.8 For now, based on the
SEC’s May 24th, 2007 filing, it seems that the SEC has accepted this view. The first group of
non-accelerated filers has to become Section 404 compliant on December 15th, 20099.
In this paper, I develop measures to provide evidence on the merit of these views using the
experience of smaller accelerated filers.10 In addition, this paper can help answer questions
about the costs and benefits of non-accelerated filers once they become Section 404 compliant.
As mentioned earlier, accounting research on direct costs of SOX to date has focused on larger
companies. For example, Griffin and Lont (2006) focus on the companies that were clients of
big four audit firms, while Elderidge and Keeley (2005) look at Fortune 500 companies. Most of
the substantial findings about benefits of SOX like Cohen et al. (2006) again focus on bigger
companies, and since they use Execucomp data, their sample is comprised of very large firms.
On the other hand, as discussed in Section 2.1, studies like Doyle et al. (2005), Engel et al.
(2005), Hostak et al. (2007) and Piotroski and Srinivasan (2006) have clearly demonstrated that
small companies were the ones who were most affected by the Act. Therefore, it is very
important to study the costs and benefits of Sarbanes-Oxley on smaller public companies.
7 http://www.sec.gov/news/press/4-511/ayerger050106.pdf 8http://www.nytimes.com/2007/05/24/business/24regs.html?ex=1337659200&en=a7df5799e28b806b&ei=5090&partner=rssuserland&emc=rss 9 http://accounting.smartpros.com/x60067.xml 10 Of course due to the new audit standard for internal control over financial reporting the costs estimates provided in this paper should be thought of as an upper bound for the costs that non-accelerated filers will have to pay. http://www.pcaobus.org/News_and_Events/News/2007/05-24.aspx
The contributions of this paper are threefold. First of all, my research provides a more
comprehensive measure of Section 404 costs by developing models of direct and indirect costs
based on financial statement information. Second, this is the first paper to test the benefits of
Section 404; in this paper I hypothesize that SOX will increase the quality and relevance of
financial statements. Third, this paper makes two important methodological contributions to
current SOX research. My study identifies an important control group for Section 404 studies,
namely the non-accelerated filers, which are small public companies that have not yet adopted
Section 404. My study also documents that the year of Section 404 compliance is not always
2004, as prior studies assume. I show that the year of compliance can be correctly identified by
using the existing data sources.
The rest of the paper is organized as follows: Section 2 reviews the existing literature on
Sarbanes-Oxley as well as other relevant literature on small businesses. Section 3 develops the
hypotheses while Section 4 develops the relevant tests. Section 5 discusses the results and
Section 6 concludes the paper and discusses the remaining work.
2. LITERATURE REVIEW
2.1 Sarbanes-Oxley Research11
A number of papers have tried to measure the net benefit of SOX indirectly by looking at market
reactions to important events that led to the passage of SOX. The findings of these papers have
varied depending on the date ranges they include in the analysis. For example, Razaee and Jain
(2003) and Li et al. (2004) report that SOX is beneficial to firms while Zhang (2005) concludes
that the costs of SOX surpass the benefits.
11 Please refer to Appendix A for a brief overview of the relevant literature on SOX
Griffin and Lont (2006), Elderidge and Keeley (2005) and Linck et al. (2007) are the first papers
to look at the direct costs of SOX. Griffin and Lont (2006) have demonstrated that SOX led to
an increase in audit costs for the public firms audited by “Big Four” auditors. They also show
that during 2004, which they assume is the year of Section 404 compliance for all firms, the
increase in audit fees is larger than that of the prior year. Similarly, Eldridge and Kealey (2005)
show that the audit fees of Fortune 1000 firms significantly increased in 2004 if the firm had
implemented Section 404 in that year. Linck et al. (2007) demonstrate that the cost of
maintaining corporate boards increased significantly after SOX came into effect in 2002 due to
increased D&O insurance premium and director fees. Though these studies are quite relevant to
this paper, a major difference is that these studies have focused on large public companies, where
the magnitude of SOX costs and benefits can be less significant, while in this paper I focus on
smaller businesses.
It is clear from prior research that small firms have faced high costs to remain public. Carney et
al. (2005) and Engel et al. (2006) show that a number of smaller firms chose to either terminate
reporting under the securities laws or go private. Similarly, Piotroski and Srinivasan (2006)
provide evidence that the passage of SOX has affected the flow of international listings in the
US. They show that the firms choosing to list on the LSE Alternative Investment Market (AIM)
over US markets are smaller and less profitable than the firms listed on US exchanges after SOX
was passed. Also, Hostak et al. (2007) demonstrate that foreign firms that delisted their
American Depositary Receipts (ADRs) in the US were smaller than the firms that did not delist
their ADRs.
A few papers have also demonstrated the effect of Sarbanes-Oxley on actual business practices
of firms. Cohen et al. (2006) find that accrual earnings management decreased significantly after
the passage of SOX, while real earnings management increased after the passage of the Act. In
another paper, Cohen et al. (2004) find a significant decline in the ratio of incentive
compensation to salary after the passage of SOX. According to the authors, this finding was a
result of firms trying to compensate the management for the additional liability imposed by
SOX.
DeFond et al. (2004) find that companies voluntarily appointed financial experts to their audit
committees. However, the market reacted positively to these announcements only if the financial
expert was an accounting financial expert and the reaction was higher for companies that had
better corporate governance. Also, Wagner and Dittmar (2006) in a recent Harvard Business
Review summarize the benefits of Sarbanes-Oxley that a few companies experienced. For
example, they provide evidence that Section 404 helped in strengthening the control
environment, standardizing processes, minimizing human error and exploiting convergence
opportunities across different departments within the same firm. These studies along with the
legislature’s belief that there are benefits to SOX lead me to hypothesize that there have been
benefits from SOX. Therefore, to gain a more complete picture of the consequences of SOX, it
is important to understand the cost and benefits of SOX.
2.2 Importance of Small Businesses
Prior literature has established that smaller businesses are an important driver of growth in the
US economy. According to Acs and Audretsch (1987 and 1988), Baldwin and Johnson (1991)
as well as Acs, Audretsch and Feldman (1994), small firms12 are an important source of
innovation in the economy. Also, according to Birch (1981) and Blackford (1991), small firms
12 These studies define small firms as firms that have less than 500 employees.
are an important source of employment for the economy and generated almost 40% of the new
jobs during 1970s and 1980s. Since innovation and job creation are two very important factors
that lead to growth of any economy small businesses are an important part of the US economy.
Therefore, legislation that leads to a decline in the growth of small businesses can seriously
hamper the growth of the economy.
2.3 Small Businesses and Accounting Problems
Prior research has shown that reporting and control problems are greater in smaller firms. For
example, Wells (2004) finds a disproportionate number of occupational frauds were committed
against small businesses. Kinney and McDaniel (1989) find that firms restating earnings are
normally smaller in size. Doyle et al. (2005) have shown that the firms reporting serious firm-
wide control issues normally are smaller in size. As a result, establishing better internal controls
as a result of Sarbanes-Oxley will improve reporting and therefore benefit the financial statement
users of these firms. However, since they do not have good controls in place already establishing
controls will be costly for these firms.
3. HYPOTHESIS DEVELOPMENT
Since small public companies are an important part of financial markets I focus on the effect of
SOX on these companies in my dissertation. According to the report by the Advisory Committee
for Smaller Public Companies, companies below 125 million USD in market capitalization form
1% of total US market capitalization and consist of 50% of total public companies. Given that
the Dow Jones Wilshire 500013 index had a market capitalization of 16,683 billion USD14 as of
13 The Dow Jones Wilshire 5000 Composite Index is a broad-based stock market index more than 6,700 publicly-traded companies and is often used to represent the entire United States stock market. 14 http://www.djindexes.com/mdsidx/downloads/fact_info/DJW5000_Facts.pdf
November 2006, this implies that the smaller companies are worth 166 billion USD. This is a
sizable amount of market capitalization in absolute terms. This absolute magnitude implies that
collectively small companies form a big group with substantial market share.
It can also be argued that small companies have a different institutional structure as compared to
larger companies. For example, smaller public companies are more likely to be audited by non-
Big Four auditing firms, and as a result the quality of their audited reports might be lower than
that of larger companies. Also, smaller companies tend to focus on one industry and technology,
which makes it easier for investors who want to bet on one technology to invest in one company.
Thus, if the company ceases to be public, they will have to invest in a greater number of
companies in order to create a portfolio with the same risk and return characteristics, or the
exposure to a certain business and its returns might be unavailable.
In this paper, I develop measures of costs as well as benefits of SOX. I expect that the sections
of SOX that are described below will have the greatest effect on costs and benefits of the Act. It
is also, important to recognize that the Act has been phased in over time, as shown in Appendix
B:
1. Section 302 – This section mandates that disclosure controls and procedures must be
maintained in a company and the effectiveness of their design and operation must be
evaluated. This section went into effect on August 29th, 2002. It requires that all Forms
10-K and 10-Q must:
i. Contain CEO/CFO certifications under §302 (review of report, no known material
misstatement or omission, no known failure to fairly present financial condition in
all material respects, responsibility for disclosure controls and procedures,
internal disclosure of deficiencies in internal controls or fraud, disclosure in report
of significant changes in internal controls); and
ii. Contain CEO’s/CFO’s conclusions regarding the effectiveness of the operation
and design of the company’s disclosure controls and procedures.
2. Section 404– This section has 2 components:
i. Management should maintain and assess Internal Controls15 over financial
reporting.
ii. Auditors have to assess whether the internal controls are effective or not.
This section went into effect on November 15th, 2004 for accelerated filers, and non-
accelerated filers are required to implement it by December 15th, 2007.16 (Note
accelerated filers who were not “large accelerated filers” got 45 extra days for their first
404 compliance report/audit). Section 404 is viewed as the most costly section of the
SOX and has led to a lot of debate about whether the requirements of this section should
be made less stringent to decrease the costs of the Act.
3. Section 409– This section has two main components:
a. Disclosure of Electronic Availability of Filings (effective Dec 15th, 2002)
15According to COSO, internal control as defined by SOX is a process, effected by an entity's board of directors, management and other personnel, designed to provide reasonable assurance regarding the reliability of financial reporting. Broader definition of internal controls can be found at COSO’s website. 16 Non-accelerated filers are defined as companies with less than 75 million in public float. Accelerated filers have more than 75 million and less than 700 million in public float. Large Accelerated filers have 700 million or more in public float. Appendix D gives a more precise description of accelerated and large accelerated filers.
b. Accelerated Filing of Periodic Reports (1st Step: Accelerated filing for accelerated
filers, reducing 10K filing time to 75 days and 10Q filing time to 40 days was
implemented on Dec 15th, 2003. 2nd Step: Reducing 10K filing time to 60 days
for large accelerated filers was implemented on Dec 15th, 2006)
Apart from these 3 sections other important sections of the Act are Sections 201, 202, 301, 401,
402, 403, 806 and 906.
3.1 Costs of SOX
In this paper I divide the costs that companies face as a result of becoming SOX compliant into
direct and indirect costs. The description of the two categories is as follows:
Direct Costs: Direct costs are the additional monetary expenses incurred as a result of becoming
SOX complaint. Audit costs are one of the major direct costs. Griffin and Lont (2006) as well
as Eldridge and Kealey (2005) provide evidence that SOX, and in particular Section 404 led to a
big increase in audit costs. In this paper, I compare the average increase in audit costs for
accelerated versus non-accelerated filers I expect there is a fixed cost associated with procuring
software, manpower etc. for becoming SOX compliant and an additional variable cost associated
with monitoring the higher level of sales, so overall cost is increasing in sales. Other direct costs
include the costs borne by the company to acquire and maintain internal control software,
increased employee hours to comply with SOX, increased D&O insurance premiums due to
increase in liability as a result of SOX, and increased directors’ fees as a result of greater time
commitment and responsibility. I reviewed a number of 10-K reports to analyze which line
items would be most affected by an increase in costs due to Sarbanes-Oxley. I found that these
costs were generally included in Selling General &Administrative (SG&A) expenses17 and as a
result, I design tests to detect increases in SG&A. Furthermore, I conjecture that the increase in
SG&A is greater for firms that disclose a material weakness in their Section 404 reports as
compared to firms that do not disclose a material weakness.18 I predict that a material weakness
will substantially increase the cost of Section 404 compliance because in order to remediate these
weaknesses the firm will have to establish more controls, which will require additional
documentation, software and manpower.
It is possible that some of these costs are reflected in the Cost of Goods Sold (COGS)19. For
example, the salary of the employee hired to oversee controls at the process level would be
reflected in the process overhead and can be allocated to the given product. This discussion of
direct costs suggests my first two hypotheses:
H1: Direct costs of accelerated filers increase in the year the filer became Section 404
compliant.
H2: Costs of filers increase in the year the filer finds a material weakness.
Indirect Costs:20 Indirect costs are incurred because, apart from monetary expenses, SOX
compliance requires resources such as management time and may have increased the risk
aversion of the management. These resources include the time spent by executives of the
company working on compliance problems and not on the long term strategies, which can affect 17 Please refer to Appendix C where I have included excerpts from three different 10-K filings which show that Section 404 costs were mostly included in SG&A expenses. 18 According to Standard 2, an internal control deficiency exists when the design or operation of a control does not allow for the timely prevention or detection of misstatements. A material weakness is said to exist if a significant deficiency or a combination of significant deficiencies can result in more than a remote likelihood that a material misstatement of the financial statements will not be prevented or detected. 19 I also ran regressions similar to SG&A expenses for COGS and did not find any evidence that Section 404 costs are included in COGS in this sample. 20 Indirect cost of SOX refers to opportunity cost of SOX
the long term as well as short term growth of the company. Cohen et al. (2004a) claim that SOX
increased risk aversion in managers leading to a decrease in R&D expenditures, as well as
CAPEX, and this could further affect the long term growth of the company. Also, there is some
evidence that implementation of Section 404 led to cutbacks in R&D because the companies had
to spend their limited funds on audits rather than on R&D21. For example, this excerpt from a
newspaper article describes the experience of a small public biotech company when it
implemented Section 404:
A small public biotech company spent over $500,000 on external substantiation of internal controls. This onerous exercise forced the company to reassign laboratory researchers to perform internal control work dictated by SOX, postpone the hiring of 5 to 10 additional researchers, and delay promising research and development programs.22
In this paper, I focus on testing whether there was a decrease in Capital Expenditure and R&D
Expenditures in the year the company became Section 404 compliant. The reason for this
prediction is that management time, which is a limited resource, would have been diverted
towards compliance with Section 404. As a result management would have less time to analyze
and approve investment projects. In order to understand this argument, consider a small
company A with the following cost and benefit analysis.
Before SOX:
At any given time t: NPV(Internal ControlPre-SOX) = A = Total future Benefit of implementing IC
– Total Cost of implementing IC
21 http://www.iht.com/articles/2006/09/20/business/sec.php 22 http://thehill.com/op-eds/scale-back-sarbanes-oxley-2007-01-23.html
Now if management at any given time can only implement n projects in order to give required
attention to all the projects and NPV(Internal ControlPre-SOX) >0, then the management might still
not choose to implement internal controls if:
If NPV(IC) < NPV(n) < NPV(n-1) < … < NPV(1)
Or in words, if the NPV of internal controls is lower than that of n other projects then
management will choose not to implement internal controls.
After SOX:
NPV(Internal ControlPost-SOX) = A + Benefit of being Public
So, NPV(Internal ControlPost-SOX) > NPV(Internal ControlPre-SOX)
As a result the probability of implementation of Internal Controls increased after SOX and as a
result the company would not undertake at least one of the projects that it would have invested in
without the implementation of SOX. Also, management would need to be more involved in
designing controls in case the company has a material weakness. As a result, indirect costs
would also be higher.
This discussion leads to my second hypothesis:
H3: Indirect costs of accelerated filers would increase in the year the filer became
Section 404 compliant.
3.2 Benefits of Sarbanes-Oxley
I believe that in order to understand the benefits of Sarbanes-Oxley it is important to assess
whether SOX increased the quality of financial reporting and the information content of financial
statements. In this section I explain why I expect Section 404 to increase the quality of financial
reporting. I also, describe how different sections of SOX in particular Sections 302, 404 and 409
increased the information content of financial statements.
I hypothesize that Sarbanes-Oxley, in particular Section 404, increased the quality of financial
reporting by requiring firms to maintain and assess internal control over financial reporting. I
expect that maintaining and assessing internal control over financial reporting will improve the
quality of financial reporting due to increase in managerial involvement, improvement in the
financial reporting process and decrease in earnings management.
First of all, I expect that Section 404 will increase in managerial involvement and responsibility
in the financial reporting process. SOX has increased the involvement of managers in the
financial reporting process by requiring them to maintain and assess internal controls as well as
by requiring CEOs and CFOs to certify the financial statements filed with SEC. All these
provisions of the Act have increased awareness about financial reporting processes23 and
increased the involvement of management in the financial reporting process. Managers now
certify that they are responsible for establishing and maintaining disclosure controls and
procedures to provide reasonable assurance that material information relating to the issuer is
made known to the investors. I expect this increase in responsibility and involvement of CEO
23 http://www.riskmanagementmagazine.com.au/articles/B6/0C0410B6.asp?Type=125&Category=1241
and CFO will increase the reliability of financial statements because it will dissuade employees
lower down the hierarchy from making mistakes or committing occupational frauds.
Secondly, there is evidence that Section 404 improved the financial reporting process. The Glass
Lewis study on material disclosures finds that the number of material weaknesses disclosed by
companies between $75 million to $749 million in market capital that have implemented Section
404 decreased by 45% (from 699 material weakness disclosures in 2005 to 379 disclosures in
2006). On the other hand, material weakness disclosures by non-accelerated filers increased by
18% (from 573 disclosures in 2005 to 677 disclosures in 2006). The decrease in material
weakness disclosures by Section 404 compliant firms suggests that Section 404 requirements are
effective in improving internal controls over financial reporting. Also, most of the material
weaknesses in Section 404 compliant firms were due to systems and procedures related issues.
These findings suggest tackling these issues increases the reliability of the process of financial
reporting.
Lastly, I expect that SOX will lead to a decrease in earnings management. Establishing internal
controls over reporting process will make sure that the information provided by the companies in
financial reports is correct and will make it harder for managers to manage reported earnings in
order to meet or beat analyst forecasts and as a result the quality of income would increase. For
example, Cohen et al. (2006) shows that Sarbanes-Oxley led to a decrease in accrual earnings
management. These reasons motivate my fourth hypothesis:
H4: Earnings quality of accelerated filers will increase after the filer becomes Section
404 compliant.
I plan to test for increase in financial reporting quality by looking at the quality of earnings as
defined in Dechow and Dichev (2002). Another way of testing financial quality would be to
look at the increase in earnings persistence after Section 404 came into effect24. I further predict
that SOX will increase informativeness of financial statements. There are three reasons for this
prediction.
First, I expect that SOX will increase the information content of the 10-K filing. Accounting
research has shown that adverse opinions/findings under Section 302 and Section 404 are value
relevant for investors. Hammersley et al. (2005) show that disclosure of a weakness under
Section 302 leads to a negative price reaction and increase in trading volume on average.
Similarly, Cheng et al. (2006) finds that firms announcing material weaknesses show negative
cumulative abnormal returns in the 3 day period surrounding the announcement day. Also,
Ashbaugh-Skaife et al. (2006) shows that the cost of capital is higher for firms reporting
deficiencies in internal control.
Secondly, SOX has increased the timeliness of the information provided in information
statements. Information is provided in a more timely manner to investors in the 10-K reports.
While adopting accelerated reporting in 2002, the SEC stated that they expected that periodic
reports filed under the Exchange Act contain valuable information for investors, and expressed
concern that an undue delay in making available the periodic report information may cause the
information to be less valuable. As a result, accelerating the filing of 10-Ks is a way of making
these reports more valuable to investors. Bryant-Kutcher et al. (2005) shows that firms that met
24 Testing if ERC increased after implementation of Section 404 would be one of the methods of measuring increased investor confidence in earnings quality.
the shortened deadline were able to provide higher quality information in a more timely manner.
Their measure of quality was absolute discretionary accruals measured using Jones modified
model25. So, if firms are providing better quality information in a timely manner because of
Section 409, it should increase the value of the information to the market.
Lastly, as discussed before, SOX increased the quality of financial statements. I expect that
higher quality financial statements are more informative. I plan to measure this benefit by
investor response during 10-K filing dates. A preliminary model for measuring this benefit is
developed in this paper.
H5: Informativeness of financial statements of accelerated filers will increase after the
filer becomes Section 404 compliant.
4. EMPIRICAL MODELS FOR TESTING HYPOTHESES
4.1 Measuring Costs of Section 404 Compliance
4.1.1 Direct Costs
There are two primary tests in this paper to measure the direct costs of Sarbanes-Oxley. The first
test looks at the increase in SG&A expenses when the firm becomes Section 404 compliant
while the second examines the increase in audit costs when the firm becomes Section 404
compliant.
25 Note I am not really convinced that lower discretionary accruals actually imply better information quality
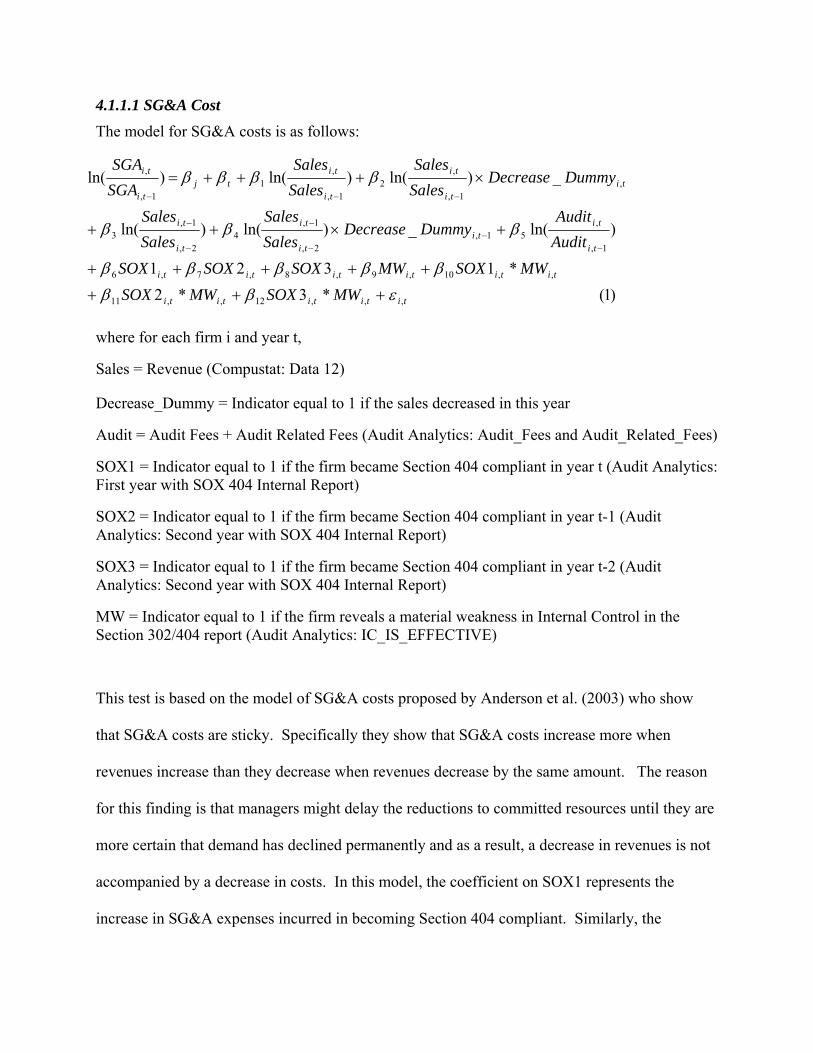
4.1.1.1 SG&A Cost The model for SG&A costs is as follows:
where for each firm i and year t,
Sales = Revenue (Compustat: Data 12)
Decrease_Dummy = Indicator equal to 1 if the sales decreased in this year
Audit = Audit Fees + Audit Related Fees (Audit Analytics: Audit_Fees and Audit_Related_Fees)
SOX1 = Indicator equal to 1 if the firm became Section 404 compliant in year t (Audit Analytics: First year with SOX 404 Internal Report)
SOX2 = Indicator equal to 1 if the firm became Section 404 compliant in year t-1 (Audit Analytics: Second year with SOX 404 Internal Report)
SOX3 = Indicator equal to 1 if the firm became Section 404 compliant in year t-2 (Audit Analytics: Second year with SOX 404 Internal Report)
MW = Indicator equal to 1 if the firm reveals a material weakness in Internal Control in the Section 302/404 report (Audit Analytics: IC_IS_EFFECTIVE)
This test is based on the model of SG&A costs proposed by Anderson et al. (2003) who show
that SG&A costs are sticky. Specifically they show that SG&A costs increase more when
revenues increase than they decrease when revenues decrease by the same amount. The reason
for this finding is that managers might delay the reductions to committed resources until they are
more certain that demand has declined permanently and as a result, a decrease in revenues is not
accompanied by a decrease in costs. In this model, the coefficient on SOX1 represents the
increase in SG&A expenses incurred in becoming Section 404 compliant. Similarly, the
)1(*3*2*1321
)ln(_)ln()ln(
_)ln()ln()ln(
,,,12,,11
,,10,9,8,7,6
1,
,51,
2,
1,4
2,
1,3
,1,
,2
1,
,1
1,
,
tititititi
titititititi
ti
titi
ti
ti
ti
ti
titi
ti
ti
titj
ti
ti
MWSOXMWSOXMWSOXMWSOXSOXSOX
AuditAudit
DummyDecreaseSalesSales
SalesSales
DummyDecreaseSalesSales
SalesSales
SGASGA
εβββββββ
βββ
ββββ
+++
+++++
+×++
×+++=
−−
−
−
−
−
−−−
coefficient on SOX2 represents the increase in SG&A expenses incurred by filers during the
second year of becoming Section 404 compliant, while the audit variable is a control for the
increase in auditing costs.
Hypothesis 1 predicts that the coefficient on SOX1 should be positive. If a component of costs
when firms became 404 compliant is fixed and will not recur in the following year, then the
coefficient on SOX2 will be negative. Since auditing takes place after the end of the financial
year, it is likely that costs of Section 404 costs are carried into the year after the firm becomes
404 compliant. Also, based on hypothesis 2, if the increase in SG&A is greater for firms that
disclose a material weakness in their Section 404 reports as compared to firms that do not
disclose material weaknesses, then the coefficient on MW*SOX1 should be positive.
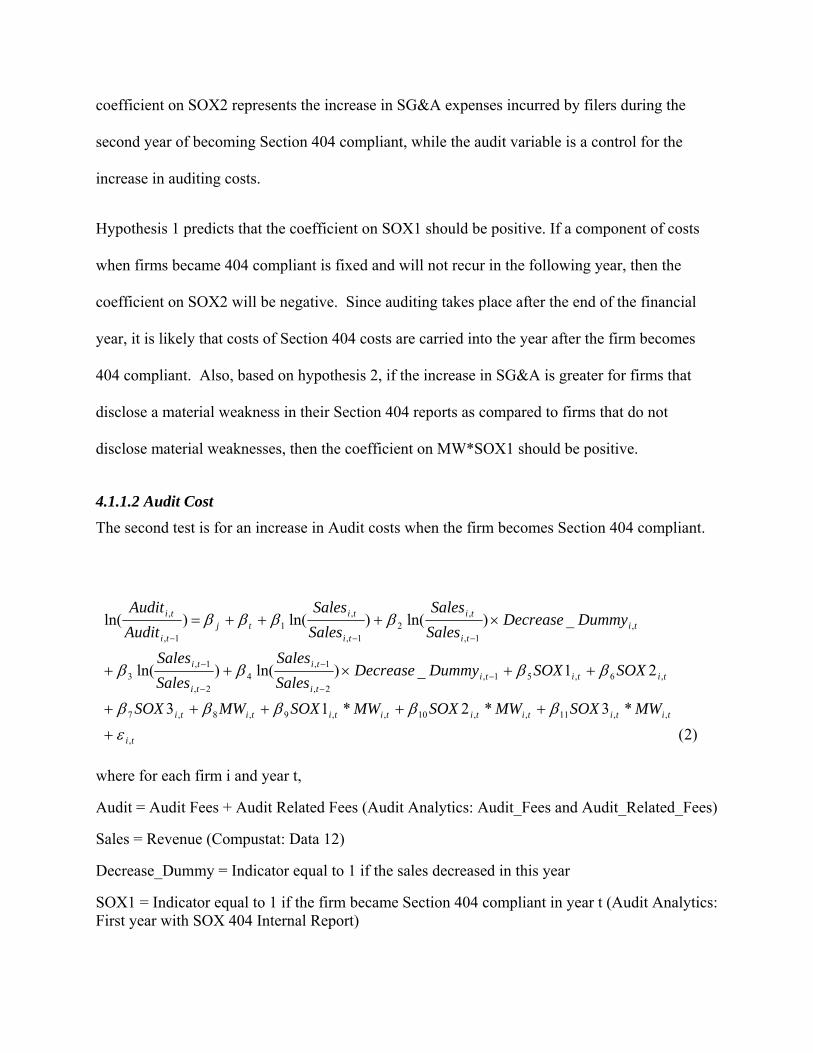
4.1.1.2 Audit Cost The second test is for an increase in Audit costs when the firm becomes Section 404 compliant.
where for each firm i and year t,
Audit = Audit Fees + Audit Related Fees (Audit Analytics: Audit_Fees and Audit_Related_Fees)
Sales = Revenue (Compustat: Data 12)
Decrease_Dummy = Indicator equal to 1 if the sales decreased in this year
SOX1 = Indicator equal to 1 if the firm became Section 404 compliant in year t (Audit Analytics: First year with SOX 404 Internal Report)
)2(*3*2*13
21_)ln()ln(
_)ln()ln()ln(
,
,,11,,10,,9,8,7
,6,51,2,
1,4
2,
1,3
,1,
,2
1,
,1
1,
,
ti
titititititititi
titititi
ti
ti
ti
titi
ti
ti
titj
ti
ti
MWSOXMWSOXMWSOXMWSOX
SOXSOXDummyDecreaseSalesSales
SalesSales
DummyDecreaseSalesSales
SalesSales
AuditAudit
εβββββ
ββββ
ββββ
+
+++++
++×++
×+++=
−−
−
−
−
−−−
SOX2 = Indicator equal to 1 if the firm became Section 404 compliant in year t-1 (Audit Analytics: Second year with SOX 404 Internal Report)
SOX3 = Indicator equal to 1 if the firm became Section 404 compliant in year t-2 (Audit Analytics: Second year with SOX 404 Internal Report)
MW = Indicator equal to 1 if the firm reveals a material weakness in Internal Control in the Section 302/404 report (Audit Analytics: IC_IS_EFFECTIVE)
This test is similar to the test for SG&A costs. In this model the coefficient on SOX1 represents
the increase in Audit costs incurred as a result of becoming Section 404 compliant. Similarly,
SOX2 denotes the increase in Audit Costs incurred by filers during the second year of becoming
Section 404 compliant. The coefficient on MW*SOX1 corresponds to additional increase in
audit costs for companies that disclose a material weakness in their Section 404 reports.
Based on Hypothesis 1, the coefficient on SOX1 should be positive. If a component of audit
costs in the year firms became 404 compliant is fixed and will not recur in the next year then, the
coefficient on SOX2 should be negative. Also, the coefficient on MW*SOX1 should be positive
if the audit costs of companies that disclose material weakness is higher based on hypothesis 2.
4.1.2 Indirect Costs
In order to measure the indirect costs of Sarbanes-Oxley, I plan to test whether a firm decreased
investment in a year in which it becomes Section 404 compliant. I test for this by looking at
changes in capital expenditures and R&D expenditures separately. All these expenditures are
important for the future growth of the company and a decrease in them due to diversion of
management time can negatively affect the future growth of the company.
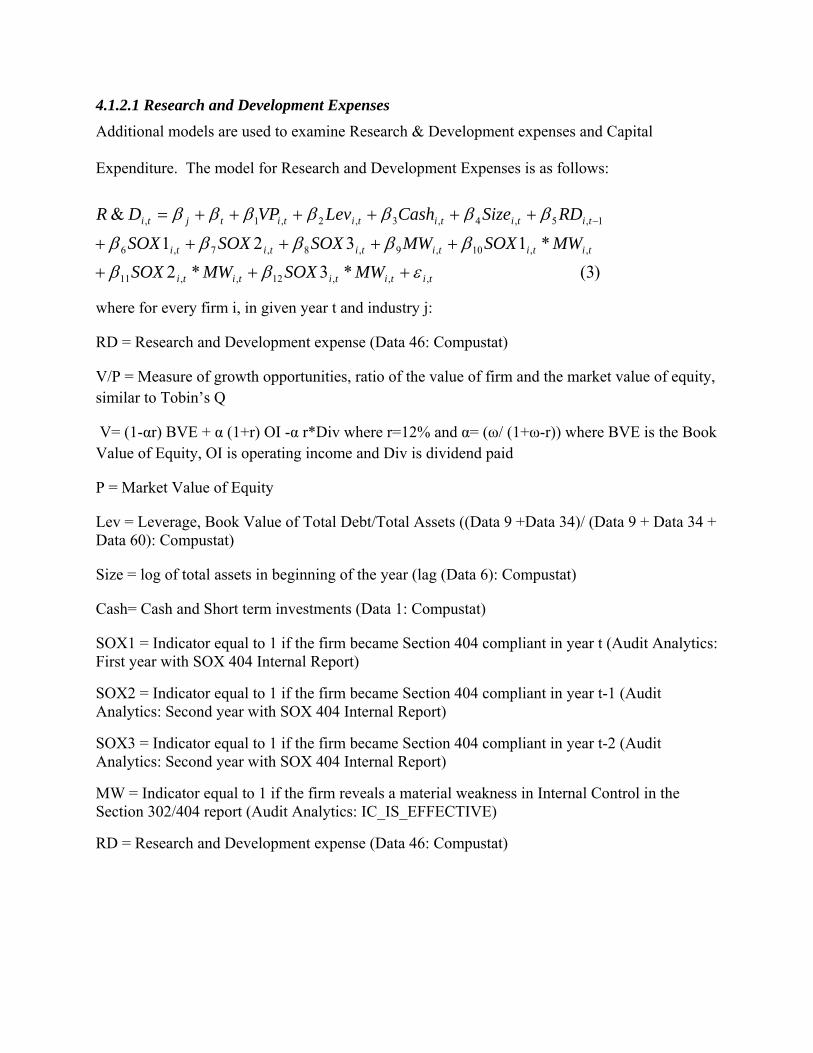
4.1.2.1 Research and Development Expenses Additional models are used to examine Research & Development expenses and Capital
Expenditure. The model for Research and Development Expenses is as follows:
where for every firm i, in given year t and industry j:
RD = Research and Development expense (Data 46: Compustat)
V/P = Measure of growth opportunities, ratio of the value of firm and the market value of equity, similar to Tobin’s Q
V= (1-αr) BVE + α (1+r) OI -α r*Div where r=12% and α= (ω/ (1+ω-r)) where BVE is the Book Value of Equity, OI is operating income and Div is dividend paid
P = Market Value of Equity
Lev = Leverage, Book Value of Total Debt/Total Assets ((Data 9 +Data 34)/ (Data 9 + Data 34 + Data 60): Compustat)
Size = log of total assets in beginning of the year (lag (Data 6): Compustat)
Cash= Cash and Short term investments (Data 1: Compustat)
SOX1 = Indicator equal to 1 if the firm became Section 404 compliant in year t (Audit Analytics: First year with SOX 404 Internal Report)
SOX2 = Indicator equal to 1 if the firm became Section 404 compliant in year t-1 (Audit Analytics: Second year with SOX 404 Internal Report)
SOX3 = Indicator equal to 1 if the firm became Section 404 compliant in year t-2 (Audit Analytics: Second year with SOX 404 Internal Report)
MW = Indicator equal to 1 if the firm reveals a material weakness in Internal Control in the Section 302/404 report (Audit Analytics: IC_IS_EFFECTIVE)
RD = Research and Development expense (Data 46: Compustat)
)3(*3*2*1321
&
,,,12,,11
,,10,9,8,7,6
1,5,4,3,2,1,
tititititi
titititititi
titititititjti
MWSOXMWSOXMWSOXMWSOXSOXSOX
RDSizeCashLevVPDR
εβββββββ
βββββββ
+++
+++++
++++++= −
This model measures the change in R&D in the year a firm becomes Section 404 compliant.
V/P26 is a measure of growth opportunities where the value of the firm is calculated using Ohlson
(1995) framework, which assumes that price is equal to discounted expected dividends, clean-
surplus relation hold and abnormal earnings follow an auto-regressive process and have a
persistence parameter equal to ω. This measure of book value of equity includes book value of
equity, earnings and dividends and as a result takes into account intangible assets and hence is a
better measure of the value of existing assets I use V/P as a variable in this model instead of
Tobin’s Q because I anticipate that the value of a firm calculated using Ohlson (1995)
framework takes the value of unrecognized intangible assets into account. As a result V/P would
be a better predictor of R&D expenditure which, in effect, is an expenditure on an unrecognized
intangible asset. Please refer to the description of model 3 in section 4.1.2.1 for a detailed
discussion of V/P.
Other control variables like cash level, leverage and size are included because prior studies such
as Hall (1992), Hall and Reenen(1999), Himmelberg and Petersen (1994) and Hubbard (1998)
have shown that these are important controls.27 In this model the coefficient on SOX1 represents
the change in R&D expenditure as a result of becoming Section 404 compliant. The coefficient
on MW*SOX1 corresponds to additional change in R&D expenditure incurred by companies
that disclose a material weakness in their internal control report.
Hypothesis 3 predicts that the coefficient on SOX1 should be negative. Similarly, it can be
assumed that it will harder for firms with material weaknesses to become 404 compliant and as a
26 V/P was used in Richardson (2006). 27 Note I did not include operating income, which is one of the common variables used in R&D regressions, into the equation because V/P is composed of operating income.
result their R&D expenditure could decrease even more in the year they become Section 404
compliant as predicted by Hypothesis 2.
I also consider the interaction of SOX with cash because, as discussed earlier, there is evidence
that some firms had to cut back on R&D expenditures due to cash constraints. As a result I
would expect that the cash constraint would become even more important in the year in which
the firm becomes Section 404 compliant, and therefore the coefficient on this term would be
positive.
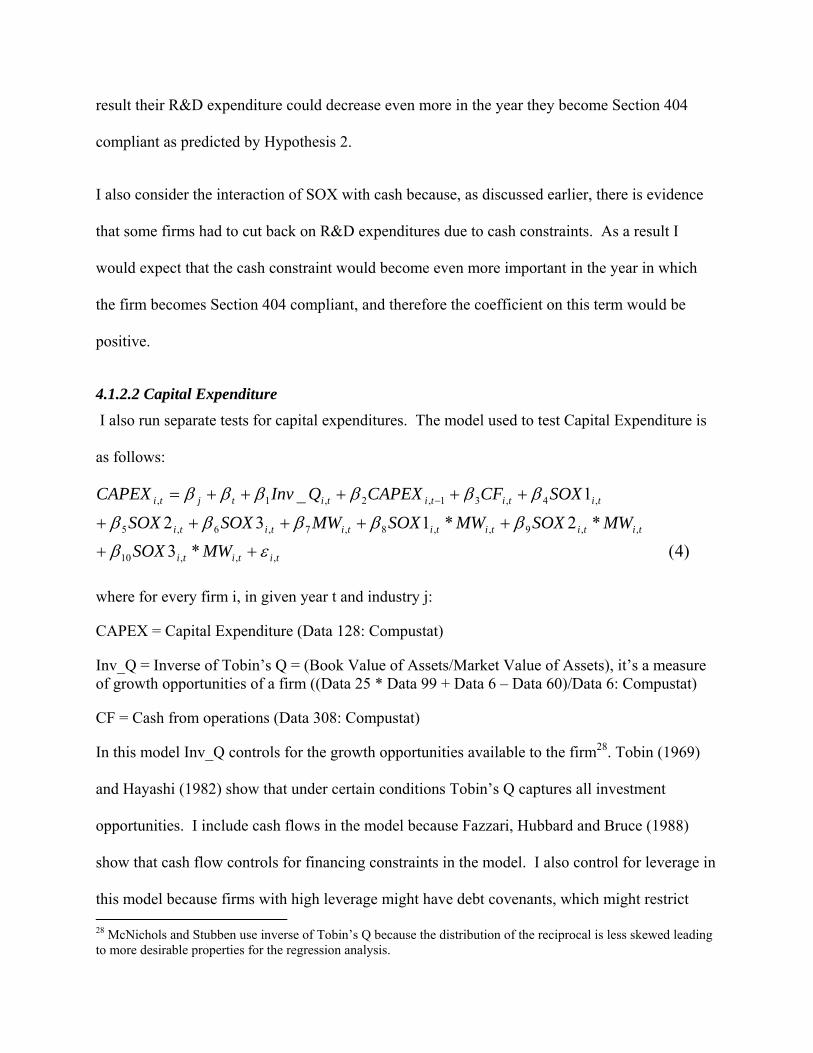
4.1.2.2 Capital Expenditure I also run separate tests for capital expenditures. The model used to test Capital Expenditure is
as follows:
where for every firm i, in given year t and industry j:
CAPEX = Capital Expenditure (Data 128: Compustat)
Inv_Q = Inverse of Tobin’s Q = (Book Value of Assets/Market Value of Assets), it’s a measure of growth opportunities of a firm ((Data 25 * Data 99 + Data 6 – Data 60)/Data 6: Compustat)
CF = Cash from operations (Data 308: Compustat)
In this model Inv_Q controls for the growth opportunities available to the firm28. Tobin (1969)
and Hayashi (1982) show that under certain conditions Tobin’s Q captures all investment
opportunities. I include cash flows in the model because Fazzari, Hubbard and Bruce (1988)
show that cash flow controls for financing constraints in the model. I also control for leverage in
this model because firms with high leverage might have debt covenants, which might restrict 28 McNichols and Stubben use inverse of Tobin’s Q because the distribution of the reciprocal is less skewed leading to more desirable properties for the regression analysis.
)4(*3*2*132
1_
,,,10
,,9,,8,7,6,5
,4,31,2,1,
tititi
tititititititi
tititititjti
MWSOXMWSOXMWSOXMWSOXSOX
SOXCFCAPEXQInvCAPEX
εββββββ
ββββββ
++
+++++
+++++= −
them from investing in some projects, and as a result I would expect that capital expenditure
would decrease with increase in leverage. In this model the coefficient on SOX1 represents the
change in capital expenditure as a result of becoming Section 404 compliant. The coefficient on
MW*SOX1 corresponds to additional change in capital expenditure incurred by companies that
disclose a material weakness in their internal control report.
Hypothesis 3 predicts that the coefficient on SOX1 should be negative. Similarly, it can be
expected that it will be harder for firms with material weaknesses to become Section 404
compliant and as a result their capital expenditure could decrease even more in the year they
become Section 404 compliant. On the other hand it is possible that becoming Section 404
compliant reduces the cost of capital for these firms because now their earnings are of higher
quality and also, because there is more information about firms in the financial statement, which
reduces information asymmetry. As a result these firms would be able to undertake more capital
expenditure projects. In this case I would expect that the coefficient on SOX1 would be positive.
4. 2 Measuring Benefits of SOX
4.2.1 Earnings Quality
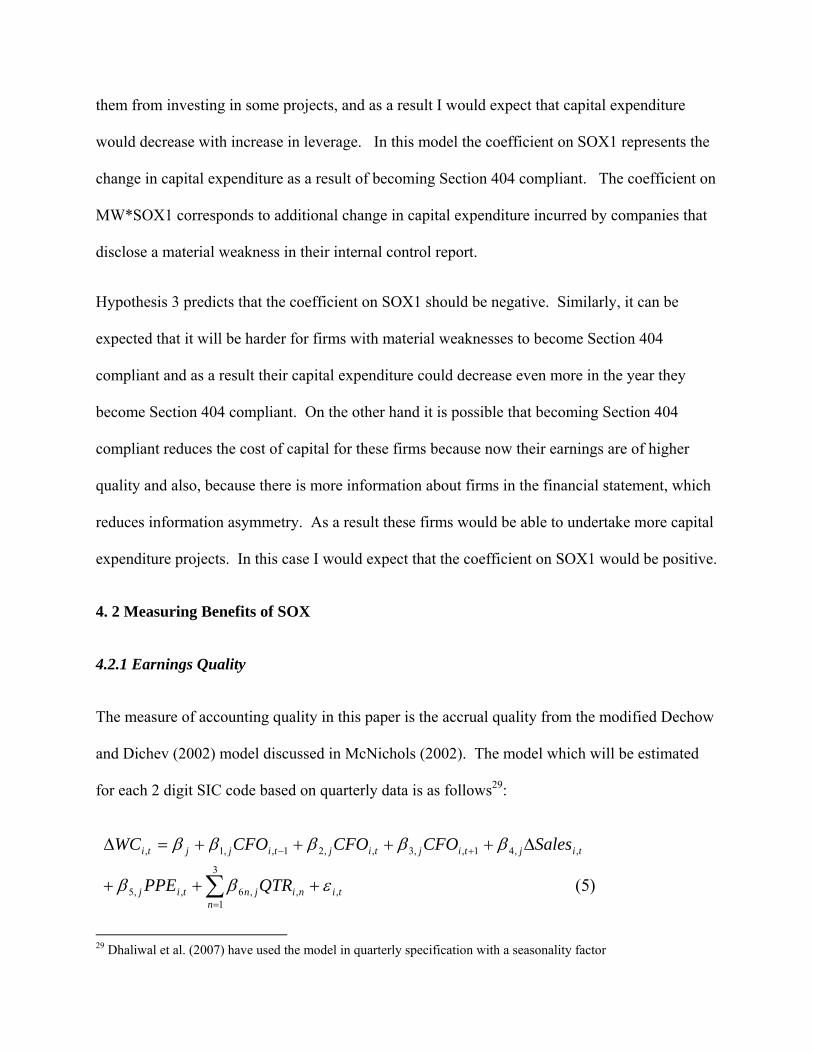
The measure of accounting quality in this paper is the accrual quality from the modified Dechow
and Dichev (2002) model discussed in McNichols (2002). The model which will be estimated
for each 2 digit SIC code based on quarterly data is as follows29:
29 Dhaliwal et al. (2007) have used the model in quarterly specification with a seasonality factor
)5(,
3
1,,6,,5
,,41,,3,,21,,1,
tin
nijntij
tijtijtijtijjti
QTRPPE
SalesCFOCFOCFOWC
εββ
βββββ
+++
Δ++++=Δ
∑=
+−
Where for every firm i, quarter t and industry j
ΔWC= Changes in working capital accounts
CFO= Cash from operations
ΔSales= Changes in sales
PPE= Property, plant and equipment
QTR = Indicator variable equal to 1 if the fiscal quarter equal to n
This model is similar to the quarterly model presented in Dhaliwal et al. (2007). According to
this model the quality of accruals depends on how closely the accruals are related to the past,
present and future cash flow realizations. The error term from the model represents the earnings
quality of the firm. The further it is from zero, the lower is the quality.
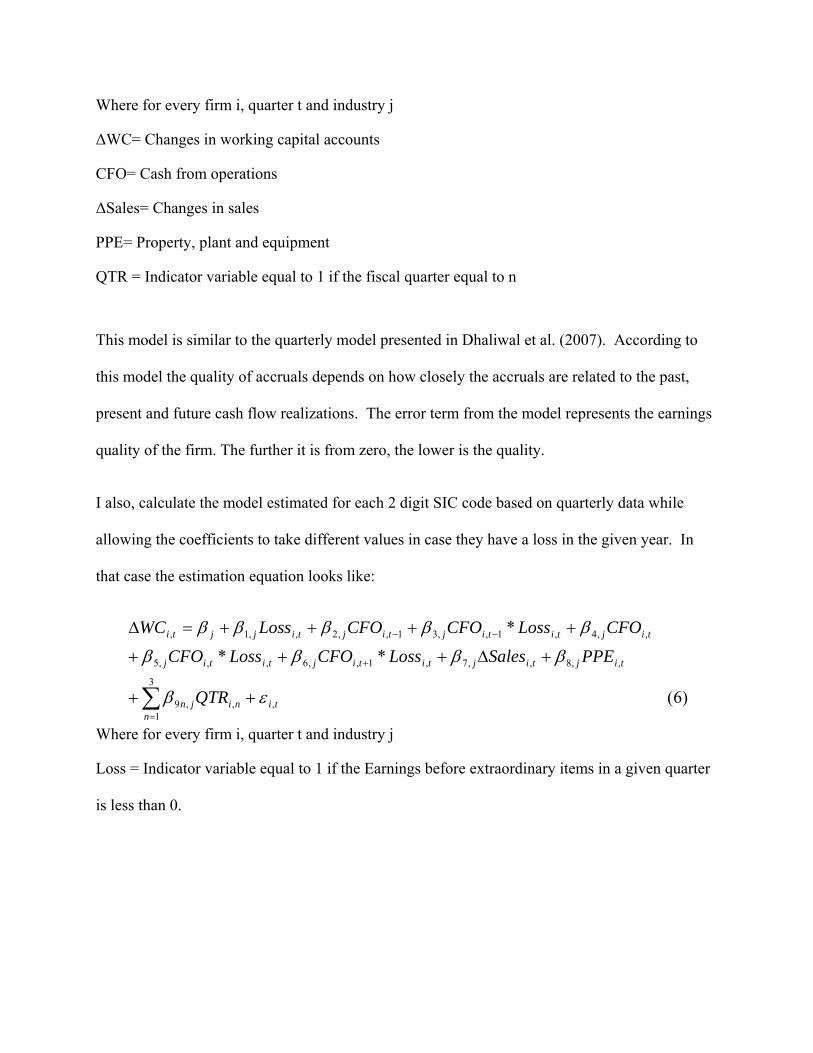
I also, calculate the model estimated for each 2 digit SIC code based on quarterly data while
allowing the coefficients to take different values in case they have a loss in the given year. In
that case the estimation equation looks like:
Where for every firm i, quarter t and industry j
Loss = Indicator variable equal to 1 if the Earnings before extraordinary items in a given quarter
is less than 0.
)6(
**
*
,
3
1,,9
,,8,,7,1,,6,,,5
,,4,1,,31,,2,,1,
tin
nijn
tijtijtitijtitij
tijtitijtijtijjti
QTR
PPESalesLossCFOLossCFO
CFOLossCFOCFOLossWC
εβ
ββββ
βββββ
++
+Δ+++
++++=Δ
∑=
+
−−
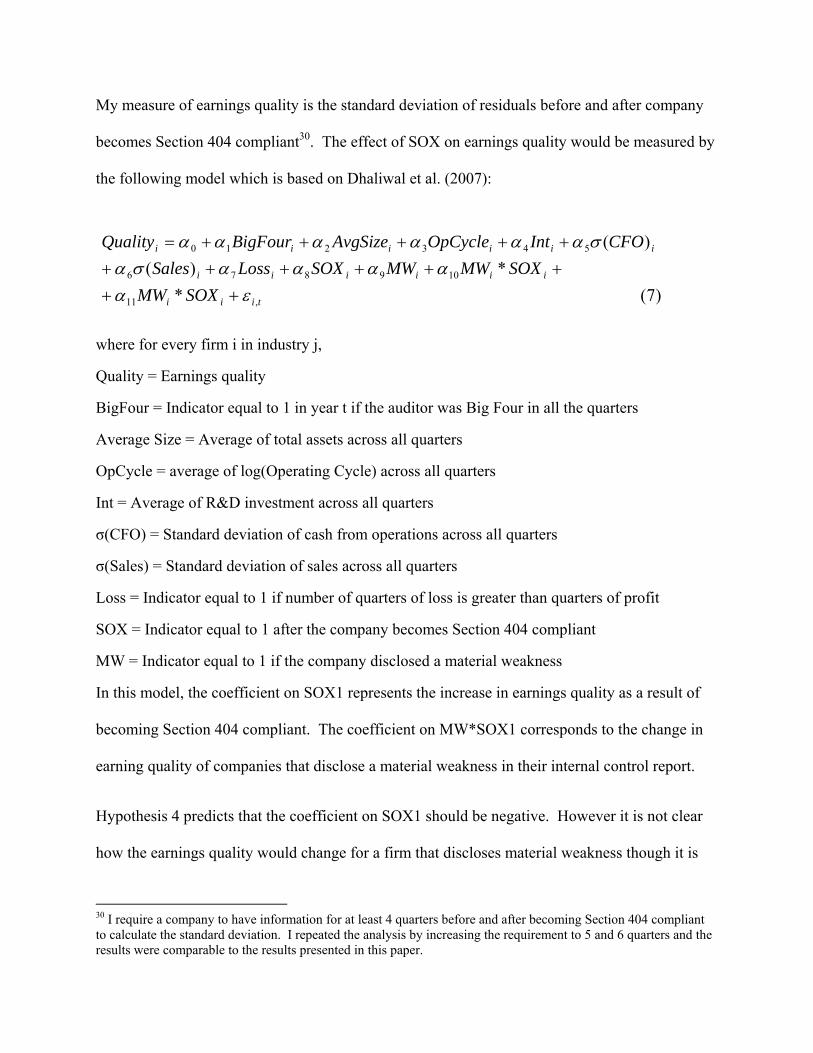
My measure of earnings quality is the standard deviation of residuals before and after company
becomes Section 404 compliant30. The effect of SOX on earnings quality would be measured by
the following model which is based on Dhaliwal et al. (2007):
where for every firm i in industry j,
Quality = Earnings quality
BigFour = Indicator equal to 1 in year t if the auditor was Big Four in all the quarters
Average Size = Average of total assets across all quarters
OpCycle = average of log(Operating Cycle) across all quarters
Int = Average of R&D investment across all quarters
σ(CFO) = Standard deviation of cash from operations across all quarters
σ(Sales) = Standard deviation of sales across all quarters
Loss = Indicator equal to 1 if number of quarters of loss is greater than quarters of profit
SOX = Indicator equal to 1 after the company becomes Section 404 compliant
MW = Indicator equal to 1 if the company disclosed a material weakness
In this model, the coefficient on SOX1 represents the increase in earnings quality as a result of
becoming Section 404 compliant. The coefficient on MW*SOX1 corresponds to the change in
earning quality of companies that disclose a material weakness in their internal control report.
Hypothesis 4 predicts that the coefficient on SOX1 should be negative. However it is not clear
how the earnings quality would change for a firm that discloses material weakness though it is
30 I require a company to have information for at least 4 quarters before and after becoming Section 404 compliant to calculate the standard deviation. I repeated the analysis by increasing the requirement to 5 and 6 quarters and the results were comparable to the results presented in this paper.
)7(**)(
)(
,11
109876
543210
tiii
iiiiii
iiiiii
SOXMWSOXMWMWSOXLossSales
CFOIntOpCycleAvgSizeBigFourQuality
εααααασα
σαααααα
+++++++++++++=
clear that earnings quality would increase for these firms once their internal controls become
effective.
This model includes controls for operating cycle, standard deviation of cash flow, standard
deviation of sales following Dechow and Dichev (2002), and controls for investment in
intangibles because Francis, Lafond, Olsson and Schipper (2004) find that increased investment
in intangibles decreases earnings quality.
4.2.2 Informativeness of Financial Statements
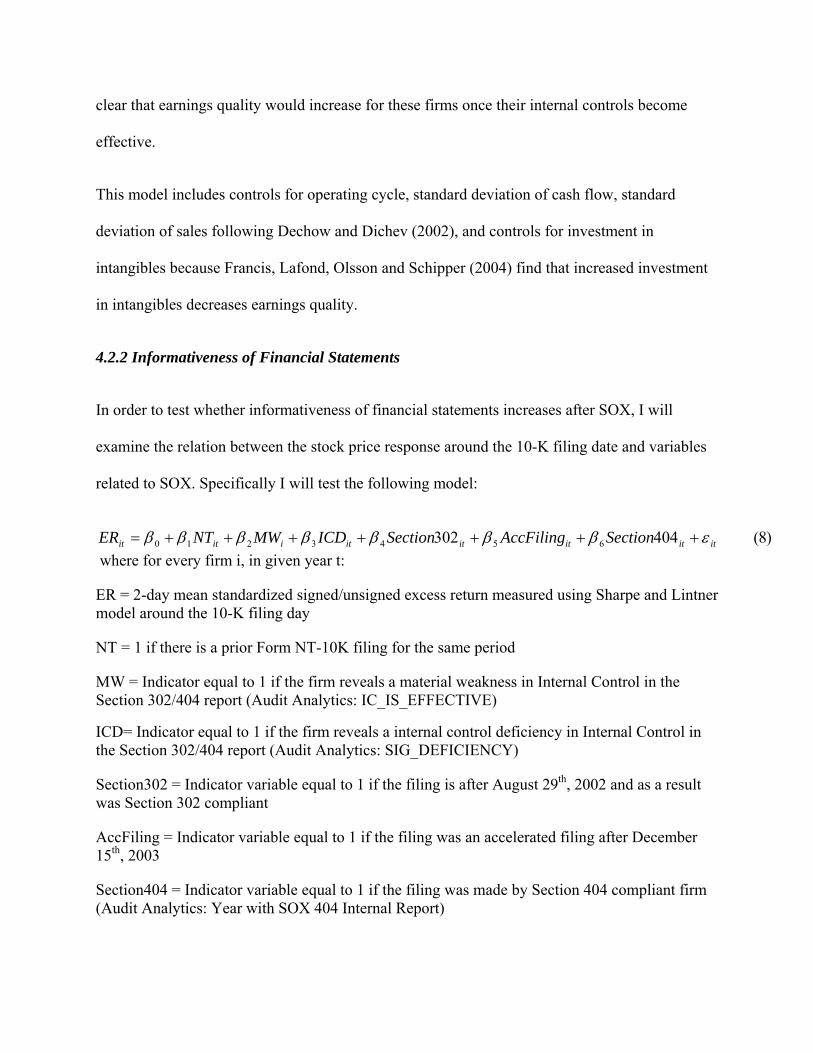
In order to test whether informativeness of financial statements increases after SOX, I will
examine the relation between the stock price response around the 10-K filing date and variables
related to SOX. Specifically I will test the following model:
)8(404302 6543210 itititititiitit SectionAccFilingSectionICDMWNTER εβββββββ +++++++= where for every firm i, in given year t:
ER = 2-day mean standardized signed/unsigned excess return measured using Sharpe and Lintner model around the 10-K filing day
NT = 1 if there is a prior Form NT-10K filing for the same period
MW = Indicator equal to 1 if the firm reveals a material weakness in Internal Control in the Section 302/404 report (Audit Analytics: IC_IS_EFFECTIVE)
ICD= Indicator equal to 1 if the firm reveals a internal control deficiency in Internal Control in the Section 302/404 report (Audit Analytics: SIG_DEFICIENCY)
Section302 = Indicator variable equal to 1 if the filing is after August 29th, 2002 and as a result was Section 302 compliant
AccFiling = Indicator variable equal to 1 if the filing was an accelerated filing after December 15th, 2003
Section404 = Indicator variable equal to 1 if the filing was made by Section 404 compliant firm (Audit Analytics: Year with SOX 404 Internal Report)
In this model, the dependent variable ER is similar to Beaver (1968) U-Statistic and it captures
the unusual price movement in the filing period. The coefficient on Section302 captures the
increase in 10-K informativeness as a result of Section 302 compliance. Similarly, the
coefficient on AccFiling reflects the increase in 10-K informativeness due to accelerated filing
and the coefficient on Section404 captures the increase in informativeness because of Section
404 compliance. This model assumes that investors believe that all the information in the filing
is relevant for firm valuation and hence respond to this information.
Even though I have presented this model for 10-K filings, similar analyses can be done for
earnings announcements because I expect that annual/quarterly earnings might be announced
earlier because of acceleration of financial statement filing dates. Also, increase in quality of
earnings will increase the informativeness of earnings disclosure.
5. SAMPLE AND RESULTS
5.1 Sample:
In this study I use 2 different samples to understand the effect of Sarbanes-Oxley on small public
companies. First I use the data from Audit Analytics and Compustat of companies that are
section 404 compliant and divide it into 3 different categories, namely small, medium and large
filers based on asset size in the year of SOX compliance. There are 753 companies with assets
between 1 million and 150 million USD in 2007 in this sample. Also, there are 1701 companies
between 150 million to 1 billion USD and 1381 companies above 1 billion USD in assets. Then I
run regressions individually on every group, to find if there is a different effect of SOX between
these groups. One disadvantage of using data only from accelerated filers is that it is hard to
control for macro-economic factors, in particular for the cost studies. Therefore I use a second
dataset where using Audit Analytics, I match the 753 companies with assets between 1 million
and 150 million USD in 2007 which are Section 404 compliant with 1000 companies between 1
million to 150 million USD in assets during 2007 which are not Section 404 compliant.
An important advantage of the second sample is that I exploit the definition of accelerated and
non-accelerated filers, to control for other macro-economic factors in the study. Since
accelerated and non-accelerated filers differ on the dimension of public float,31 there are non-
accelerated filers that match an accelerated filer on all dimensions other than public float. These
non-accelerated filers provide a good control group for this study because by matching smaller
accelerated filers with non-accelerated filers based on industry and size, I can control for
industry-related and macro-economic factors affecting firms in the period they implemented
SOX.
I choose companies based on total asset size because the size of a company is a better indicator
of its resources compared to market value of equity, and thus the difficulty it might encounter in
complying with Section 404. I chose the limit of 150 million because given the cost range of
900 thousand to 2.5 million, as estimated by the Advisory Committee for Smaller Public
Companies, for becoming compliant;32 SOX costs would have been a more significant financial
burden for these companies. I collected a matching sample of 428 firms that are accelerated
filers after combining data from Audit Analytics and Compustat.
Table 2 Panel A explains the sample derivation for the second dataset in detail. I determine the
first year of Section 404 compliance by the financial year in which the first Section 404 report is
31 Public float is the number of freely traded shares in the hands of the public. Float is calculated as Shares Outstanding minus Shares Owned by Insiders, 5% Owners, and Rule 144 Shares. Accelerated filers have public float between 75-700 million while non-accelerated filers have public float less than 75 million. 32 Advisory committee report on Smaller Public Companies
filed by the accelerated filer. This methodology differs from the previous literature which
assumes that all filers become Section 404 compliant in financial year 2004. As Table 2 panel C
shows, almost 42% of the first year of the compliance would have been misclassified for small
firms if I had assumed that all the accelerated filers became compliant in 2004, similarly 31%
and 26% of the first year of compliance for medium and large firms would have been
misclassified. Also, in case of the matched sample almost 33% of first year of compliance would
have been misclassified.
I match each accelerated filer with a non-accelerated filer with the same 3 digit SIC code and the
closest asset size. The mean (median) difference in asset size between accelerated filers and non-
accelerated filers is 27.85 million (1.4 million) and the mean (median) difference in market value
of equity is almost 135 million (100 million) in the year of compliance. The mean market capital
for non-accelerated filers is 43 million and for accelerated filers is 178 million. I obtained
SG&A, sales and investment from Compustat. The data on audit fees and audit related fees was
obtained from Audit Analytics. Table 1 provides the description and source for all the variables
used in the analysis.
Table 3 panel A presents the descriptive statistics for small firms, medium and large firms.
According to this table the average small, medium and large companies have 84 million, 430
million and 7 billion in sales and 88 million, 496 million, 19 billion in assets respectively. The
mean market value of equity for these firms is 195 million, 608 million, 9.6 billion respectively.
Also, small firms pay 370 thousand in audit fees while medium and large firms pay 690 thousand
and 3.4 million respectively.
According to the descriptive statistics in Table 3 Panel B for the matched sample, the average
accelerated filer in the sample has 81.1 million in assets and 98.1 million in sales while the
average non-accelerated filer has 108.9 million in assets and 143.5 million in sales. The average
market value of equity of the accelerated filer is 193 million and on average the audit fee of these
filers is 380 thousand while non-accelerated filers have market value of equity of 58.4 million
and pay 210 thousand in audit fees.
In both the samples, I deleted all the observations for the year in which the companies went
through merger, acquisition or any accounting change33. In order to examine the data for
outliers, I compared Pearson and Spearman correlation between all the variables and found they
were consistent.
Also, in order to make sure that filers were not actively choosing to stay below 75 USD million
in market float in the matched sample, I looked at the distribution of market float of firms not
filing Section 404 reports, which is presented in Appendix D and I found that the distribution
seems pretty continuous and there does not seem to be any discontinuity around 75 million dollar
mark. In further analysis not presented in this paper, I also, looked at differences in patterns of
repurchase of stocks by the non-accelerated and accelerated filers and did not find any difference
that would suggest that the non-accelerated filers are actively trying to maintain their status.
Table 4 presents the descriptive statistics of material weakness disclosures by the small, medium
and large firms. According to the data more than 32% of all the small firms had a material
weakness disclosure, while 30% of the medium firms and 17% of the large firms disclosed a
material weakness. Also, almost 10 to 20% of the firms with material weakness discovered the 33 It is really important to delete observations from these years otherwise these observations can lead to incorrect findings. For example, when I looked at COGS regressions with these observations, it seemed that those costs were also increasing but once I deleted those observations then all the coefficients became insignificant.
weakness before the first year of Section 404 filing. This implies that Section 404 auditing is
actually a very important step in analyzing internal controls of the firm.
5.2 Results
5.2.1 Direct Costs
Tables 5 and 6 present the estimation results for the direct costs. Table 5 Panel A presents the
results from estimating model 1 with industry fixed effects for SG&A expenses for all 3 groups.
Consistent with Hypothesis 1, the coefficient on SOX1 is positive and significant. The
coefficient on SOX1 around 0.055 for small firms and is statistically significant at 0.01 level,
while it is around 0.006 for medium firms and -0.008 large firms. This implies that Section 404
was costlier to implement for small firms compared to medium or large firms. Also, the finding
for large firms implies that they in general had internal controls in place before they underwent
Section 40434 auditing under SOX.
After taking into account the increase in audit fees and all the other variables, the coefficient of
SOX1 for small filers is 0.052, which implies that there is a 5.2% increase in SG&A in the year
the accelerated filers became Section 404 compliant and the coefficient on SOX2 is significant
which implies there an increase in SG&A in the second year of Section 404 compliance as well.
This implies that we need to control for macro-economic effects in order to find the actual
increase in SG&A costs due to Section 404 for small filer. Also, the coefficient on MW is not
statistically significant, which implies that just disclosing material weakness does not increase
SG&A for a firm. In addition, the coefficient on MW*SOX1 is around 2% and is marginally
significant at 0.10 level, implying companies with material weaknesses might have paid more in 34 It should be noted that companies are required to maintain internal control over financial reporting under the Foreign Corrupt Practices Act of 1977.
the year of Section 404 compliance than companies with no deficiencies but this paper does not
enough evidence to support this finding. Similarly, MW*SOX2 is positive and statistically
significant at 0.01 level implying that firms that disclosed material weakness in the second year
of Section 404 incurred additional expenses.
Table 5 Panel B presents the results for model 1 with year and fixed effects for the matched
sample. According to this table, increase in cost for small firms was around 5% of SG&A for
small firms in first year of Section 404 implementation and there was no increase in costs in the
second year of Section 404 implementation. This implies that the increase in second year of
Section 404 that was found in Panel A was due to macro-economic factors. According to this
table the actual increase in costs of small filers due to Section 404 after accounting for auditing
costs is around 3.94%. Because SG&A expenses average around 31 million dollars, this implies
average Section 404 compliance cost is approximately 1.2 million dollars every year.
Table 6 Panel A presents the estimation results for model 2 with industry fixed effects for
auditing costs of small, medium and large filers. The coefficient on SOX1 small filers is 0.51
and is statistically significant at 0.01 level. This indicates that there is an increase of at least 51%
in auditing costs in the first year in which the small filer became Section 404 compliant.
Similarly the coefficient for medium and large filers is 0.48 and 0.36 respectively. This implies
that increase in auditing costs for the small firms due to implementation of Section 404 was
much greater than the larger firms. Also, the coefficient on SOX2 is negative and statistically
significant at 0.01 level. The coefficient on SOX2 indicates almost a 19% decrease in auditing
costs in the second year for small filers with no material weakness in internal controls while
there was a 22% decrease in audit costs for both medium and large filers.
The coefficient on MW is positive and statistically insignificant at 0.01 level. This implies that
firms disclosing a material weakness might have higher costs but there is not enough evidence to
support this in our data. In addition, the coefficient on SOX1*MW is 0.30 and on SOX2*MW is
0.28 for small firms and they are statistically significant. This implies that firms disclosing a
material weakness in the first year or second year of Section 404 compliance incur additional
auditing costs. These findings indicate that audit costs increased by almost 150 thousand for
small filers when they became Section 404 compliant if they do not have any material weakness.
Also, the coefficient of MW in the first year indicates that the firm’s auditing costs increase by
an additional 100 thousand dollars if they have a material weakness in the first or second year of
Section 404 compliance. Also, the findings in Panel B support the findings in Panel A of the
table.
Since auditing costs are less than 2% of the total SG&A expenses, the estimates of 51% increase
in auditing costs explains only 1.02 % increase in SG&A expenses. Therefore a large portion of
the increase in SG&A expenses can be attributed to non-auditing costs incurred within the firm
due to Section 404. My findings are slightly lower than the 2 to 3 million dollar estimate of
Section 404 costs noted by Grady (2007). However, given the average market capital of the
small companies is less than 200 million, the fact that SOX related costs might not be a onetime
expense but a recurring expense might be a big cause of concern for these companies35.
5.2.2. Indirect Costs
Table 7 Panel A presents the results from the R&D model with fixed industry effects for small,
medium and large filers. The findings in Table 7 indicate that R&D expenses for small filers
35 Note that more years of data is needed to analyze how the costs for Section 404 implementation decreased for the small companies.
declined in the year of SOX compliance and are significant at 0.01 level, consistent with my
predictions. The coefficient of SOX1 for medium filer is negative and not statistically
significant while the coefficient for large filer is positive and not statistically significant. This
implies that the indirect cost of Section 404 was higher for small filers compared to large filers.
The average ratio of R&D expenses to Total Assets is around 11% and coefficients on SOX1 is
around -0.1 which implies that R&D declined around 1% of total assets in the year of Section
404 compliance. This finding is supported by the matched sample results in Panel B of table 7
though after taking into macro-economic factors this decrease seems to be around 0.5% of total
assets. Prior research by Griliches (1981), Pakes (1985), Jaffe (1986) and Salinger (1984) finds
that R&D expenditures are an important driver of future growth. Consequently, a decrease in
R&D can adversely affect the future growth of a firm and its value36. This is in line with the
discussion that companies that faced constraints because of Section 404 costs reduced on R&D
expenditures.
Even though this result can be explained by lack of managerial attention, there are several
alternative explanations for this finding. For example, earnings management to meet earnings
target can explain this finding since prior research like Bushee (1998) has shown that managers
can cut R&D to meet earnings target. From the earlier results in this paper we know that SG&A
increased in the year the small firms became Section 404 compliant therefore it is possible that
management cut their R&D budget in order to meet earnings targets.
Table 8 Panel A presents the estimated results for the capital expenditure model for small,
medium and large filers. The findings for this model imply that capital expenditure increased
36 Also, in further analysis the coefficient of the interaction of cash with SOX was found to be positive implying that change in cash became a bigger constraint for these companies when they become Section 404 compliant.
once the companies became Section 404 compliant. The coefficients of SOX1 and SOX2 for
CAPEX are positive and statistically significant for all filers indicating an increase in CAPEX in
the first and second year of Section 404 compliance. The coefficient on SOX1 ranges between
0.001 and 0.002 for small to large filers and the coefficient is between 0.012 and 0.026 for SOX2
for small to large filers, also the coefficients are statistically significant at 0.01 level. This
implies that capital expenditure increased by 2 to 3% in the first year of Section 404
implementation for all filers. There was a similar increase in capital expenditure in the second
year. This is not consistent with hypothesis 3 but is consistent with the discussion that cost of
equity might have reduced for these companies as a result of Section 404 compliance due to
increase in earnings quality37. The findings in Panel A for small filers are supported by similar
findings in Panel B for the matched sample of filers. These findings need to be explored further,
because I believe that cost of equity would decrease only after the firm complies with Section
404 and as a result the increase in capital expenditure in first year of Section 404 compliance
cannot be attributed to reduced cost of equity.
5.2.3 Earnings Quality38
Table 9 presents the descriptive statistics of the earnings quality variables. The mean of standard
deviation of residuals of the sample is 0.101 and 0.099 for small filers while it is around 0.047
for large filers. This implies that earnings quality of firms decrease with decrease in size. This
result is expected because different size firms are probably in different stages of product life
cycle and as a result they focus on different aspects of business to maximize shareholder value.
37 We know from Francis, Lafond, Olsson and Schipper (2004) that cost of equity for a firm with high accrual quality is lower than a firm with low accrual quality. 38 There are only 324 companies in the final sample for earnings quality because the other 61 companies were missing cash flow data.
Also, it is interesting to note that the probability of being audited by a Big Four auditor increases
with increase in firm size. The correlation matrix indicates that there is a decrease in standard
deviation of residuals or an increase in earnings quality for all firms after Section 404 came into
effect. Also, according to the results of regression of earnings quality in Table 10 it seems that
earnings quality increased after the firms became Section 404 compliant. The coefficient of
SOX is around -0.02 for small filers and is statistically significant at 0.01 level, which implies
almost a 20% decrease in standard deviation based on the mean of 0.10 for the sample. This
finding is in line with hypothesis 439. Also, there seems to be an increase in earnings quality for
medium and large filers as implied by coefficients around -0.012 and -0.008 respectively, all
coefficients are statistically significant at 0.01 level. Also, small filers have the highest increase
in absolute quality but the relative improvement in quality for medium filers (16%) and large
(17%) filers is pretty similar to small filers.
5.3 Sensitivity Analysis and Additional Tests
I repeated the analysis in this paper by matching the non-accelerated sample based on market
value of equity instead of asset size and found similar results. I have also looked at the changes
regressions for investment instead of levels regression and my findings were consistent with the
findings in this paper. All the results presented in this paper, except the earnings quality
regressions, are based on robust regression analysis40. According to Huber (1981) and
Rousseeuw and Leroy (1986) robust regression is robust with respect to outliers and does not
assume normality of errors. This regression comprises of three steps. In the first step the
algorithm selects an initial estimate of coefficients based on Ordinary Least Squares (OLS). In
39 I also, repeated this analysis on firm level and found similar results. 40 M-method is used in the results.
second step residual and associated weight from previous iteration is calculated. In the third step
the algorithm solves for the new weighted least square estimate. The second and third steps are
repeated till the estimated coefficients converge. The coefficients from the model can be
interpreted in the same way as OLS estimates.
I also ran regressions for change in SG&A, auditing costs and investment while allowing for
cross-sectional correlation and the results remained unchanged.
6. CONCLUSION
In this paper, I test the costs and benefits of SOX on smaller public companies. The results so far
indicate that implementing Section 404 of SOX was very costly for smaller public companies
and therefore the non-accelerated filers that will become Section 404 compliant in the next few
years need to be ready to pay a much higher cost for being public in the US. The higher costs
required to implement Section 404 are both direct and indirect. In addition, the tests for earnings
quality indicate that implementing Section 404 in fact increased the quality of earnings for all
public companies. This implies that even though costs of implementing Section 404 are really
high, there are some benefits as well and in order to completely understand the implications of
the Act it is important to study the benefits in more detail.
Some of the future work that remains to be done is as follows:
i) Develop a better understanding of the finding that capital expenditure increased in the
year of Section 404 compliance. I would like to understand if this increase is a result of
decrease in cost of capital due to better financial quality or if there are other reasons for
this finding.
ii) The new Auditing Standard 5 (AS5), which became effective in August, 2007 might
change the cost and benefit structure of Section 404. It would be interesting to test how
the costs and benefits of Section 404 are different under AS2 and AS5.
iii) Add information about corporate governance to the tests in this paper.
iv) It will be interesting to study if there is a decrease in costs of SOX, in particular auditing
costs, as auditing firms learnt more about Section 404 over time and therefore might
become more efficient in testing controls in new firms in 2006 than in 2005.

References:
Acs, Zoltan and Audretsch, David, 1987, “Innovation, Market Structure, and Firm Size,” The Review of Economics and Statistics 69: 567-574.
Acs, Zoltan and Audretsch, David, 1988, “Innovation in Large and Small Firms: An Empirical Analysis,” The American Economic Review 78: 678-690.
Acs, Zoltan, Audretsch, David and Maryann Feldman, 1994, “R&D Spillovers and Recipient Firm Size,” The Review of Economics and Statistics 76: 336-340.
Anderson, M., Banker, R.D. and Janakiraman, S.N, 2003, “Are Selling, General, and Administrative costs “sticky”? “Journal of Accounting Research 41 : 47-63.
Ashbaugh-Skaife, Hollis, Collins, Daniel W., Kinney, Jr., William R. and LaFond, Ryan, 2006, "The Effect of Internal Control Deficiencies on Firm Risk and Cost of Equity Capital" http://ssrn.com/abstract=896760.
Baldwin, John and Johnson, Joanne, 1991, “Entry, Innovation and Firm Growth,” Are Small Firms Important, Their Role and Impact 51-52.
W. Beaver, 1968, “The information content of annual earnings announcements,” Journal of Accounting Research 6: 67-92. Bhattacharya, U., P. Groznik, and B. Haslem, 2002, “Is CEO Certification Credible?” Regulation 26: 8-10 .
David Birch, 1981, “Who Creates Jobs?” The Public Interest 65: 3-14.
Mansel G. Blackford, 1991, “A History of Small Business in America,” Frederick A. Praeger Publishers
Botosan, C., 1997, “Disclosure Level and the Cost of Equity Capital.” The Accounting Review 72:323–350.
Brian J. Bushee, 1998, “The Influence of Institutional Investors on Myopic R&D Investment Behavior,” The Accounting Review 73: 305-333.
Bryant-Kutcher, Lisa, Peng, Emma Yan and Zvinakis, Kristina, 2005, "Timeliness and Quality of 10-K Filings: The Impact of the Accelerated Filing Deadline" http://ssrn.com/abstract=735583.
Carney, W., "The Costs of Being Public After Sarbanes-Oxley: The Irony of 'Going Private'" (February 2005). Emory Law and Economics Research Paper No. 05-4.
Chambers,A, E. and Penman,S, J. 1984, “Timeliness of Reporting and the Stock Price Reaction to Earnings Announcements” Journal of Accounting Research 22: 21-47.
Cheng, C.S. Agnes, Ho, Joanna L.Y. and Tian, Feng, 2006, “An Empirical Analysis of Value-relevance of Disclosure of Material Weaknesses under Section 404” http://ssrn.com/abstract=877015.
Cohen, D., A. Dey, and T. Lys, 2006, “Real and Accrual-based Earnings Management in the Pre- and Post-Sarbanes Oxley Periods,” Working paper, Northwestern University and University of Southern California.
Cohen, D, A. Dey, and T. Lys, 2004, “The Sarbanes Oxley Act of 2002: Implications for Compensation Structure and Risk-Taking Incentives of CEOs,” Working paper, Northwestern University and University of Southern California.
COSO Website: http://www.coso.org/
Dechow, P. M., and I. D. Dichev, 2002, “The Quality of Accruals and Earnings: The Role of Accrual Estimation Errors,” The Accounting Review 77: 35-59.
DeFond, M, R. Hann, and X. Hu, 2004, “Does the Market Value Financial Expertise on Audit Committees of Boards of Directors?” Working paper, University of Southern California.
Dhaliwal, D.S., V. Naiker and F. Navissi, 2007, "Audit Committee Financial Expertise, Corporate Governance and Accruals Quality: An Empirical Analysis," University of Arizona Working Paper
Diamond D. and R., 1991, Verrecchia “Disclosure, Liquidity, and the Cost of Capital” The Journal of Finance 46:1325-1359.
Doyle, J., W. Ge and S. McVay, 2005, “Determinants of weaknesses in internal control over financial reporting,” Working paper, University of Michigan.
Eldridge, S. W. and B. T. Kealey, 2005, "SOX Costs: Auditor Attestation under Section 404" http://ssrn.com/abstract=743285.
Engel, E., R.M. Hayes, and X. Wang, 2005, “The Sarbanes-Oxley Act and Firms’ Going-Private Decisions,” Working paper, University of Chicago.
Fazzari, S., R.G. Hubbard and B.C. Petersen, 1998, "Financing Constraints and Corporate Investment," Brookings Paper on Economic Activity 1:141-95.
Francis, J., R. LaFond, P. Olsson and K. Schipper, 2004, “Costs of Equity and Earnings Attributes,” Accounting Review 79:967-1010.
Ghosh, A, Z. Gu and P.C. Jain,2005, “Sustained Earnings and Revenue Growth, Earnings Quality, and Earnings Response Coefficients,” Review of Accounting Studies 10:33-57.
Griffin, Paul A., 2003, “Got Information? Investor Response to Form 10-K and Form 10-Q EDGAR Filings.” Review of Accounting Studies 8: 433-460.
Griffin, Paul A and D. Lont, 2006, “An Analysis of Audit Fees Following the Passage of Sarbanes-Oxley”, Working paper, University of California Davis.
Zvi Griliches, 1981, “Market Value, R&D and Patents,” Economic Letters 7: 183-187.
Mark Grothe, 2007, “The Materially Weak,” Glass Lewis & Co. Report.
Bronmyn Hall, 1992, "Investment and Research and Development at the Firm Level: Does the Source of Financing Matter?" NBER working paper
Hall, B.H. ., and J. van Reenen, 1999, “How effective are fiscal incentives for R&D? A review of the evidence,” NBER working paper.
Hammersley, Jacqueline S., Myers, Linda A. and Shakespeare, Catherine,2005, "Market Reactions to the Disclosure of Internal Control Weaknesses and to the Characteristics of those Weaknesses under Section 302 of the Sarbanes Oxley Act of 2002" http://ssrn.com/abstract=830848.
Handa, P and S. C. Linn, 1993, “Arbitrage Pricing with Estimation Risk,” The Journal of Financial and Quantitative Analysis 28: 81-100.
F. Hayashi, 1982, “Tobin’s marginal q and average q: a neoclassical interpretation,” Econometrica 50: 213–224. Himmelberg C.P. and BC Petersen, 1994, "R&D and Internal Finance: A Panel Study of Small Firms in High-Tech Industries," The Review of Economics and Statistics 76: 38-51
Hostak, Peter, Karaoglu, Emre Emre, Lys, Thomas and Yang, Yong George, 2007, "An Examination of the Impact of the Sarbanes-Oxley Act on the Attractiveness of US Capital Markets for Foreign Firms" http://ssrn.com/abstract=956020.
R.G.Hubbard , 1998, “Capital-market imperfections and investment,” Journal of Economic Literature 36: 193–225
P.J. Huber, 1981, Robust Statistics, John Wiley & Sons, New York.
Adam B. Jaffe, 1986, “Technological Opportunity and Spillovers of R&D: Evidence from firms’ patents, profits and market value,” American Economic Review 76: 984-1001.
Kinney, W. R., Jr. and L. S. McDaniel, 1989, “Characteristics of Firms Correcting Previously Reported Quarterly Earnings,” Journal of Accounting & Economics 11: 71-93.
Koh, K., D. Matsumoto, and S. Rajgopal, 2006, "Meeting Analyst Forecasts in the Post-Scandals World: Early Evidence on Stock Market Rewards and Managerial Actions” http://ssrn.com/abstract=879831
Li, H., M. Pincus, and S. Rego, 2004, “Market reaction to events surrounding the Sarbanes-Oxley Act of 2002,” Working paper, University of Iowa.
Linck, James S., Netter, Jeffry M. and Yang, Tina, 2007,"The Effects and Unintended Consequences of the Sarbanes-Oxley Act, and its Era, on the Supply and Demand for Directors" http://ssrn.com/abstract=902665.
Leuz, C. and R. Verrechia, 2000, “The Economic Consequences of Increased Disclosure,” Journal of Accounting Research, pp. 91-124.
Maureen F. McNichols, 2002, “Discussion of the Quality of Accruals and Earnings: The Role of Accrual Estimation Errors,” The Accounting Review 77: 61-69.
McNichols, M. and Manegold, J., 1983. “The Effect of the Information Environment on the Relationship between Financial Disclosure and Security Price Variability,” Journal of Accounting and Economics 5:49–74.
McNichols, M. and Stubben, S., 2005, “Does Earnings Management Affect Firms’ Investment Decisions?” Stanford University Working Paper.
Ogneva, Maria, Raghunandan, Kannan and Subramanyam, K.R., 2006, "Internal Control Weakness and Cost of Equity: Evidence from SOX Section 404 Disclosures" http://ssrn.com/abstract=766104 .
James A. Ohlson, 1995, “Earnings, Book Values, and Dividends in Equity Valuation,” Contemporary Accounting Research 11: 661–87.
Ariel Pakes, 1985, “On Patents, R & D, and the Stock Market Rate of Return,” The Journal of Political Economy 93: 390-409.
James M. Patell, 1976, “Corporate Forecasts of Earnings Per Share and Stock Price Behavior: Empirical Test,” Journal of Accounting Research 14:246-276.
Piotroski, Joseph D. and Srinivasan, Suraj, 2007, "The Sarbanes-Oxley Act and the Flow of International Listings” http://ssrn.com/abstract=956987.
Rezaee, Z. and P. Jain, 2003, “The Sarbanes-Oxley Act of 2002 and security market behavior: early evidence,” Working paper, University of Memphis.
Glenn Rifkin, February 9th, 2006, “Corporate Boards Call On the Expertise of Retired Executives,” The New York Times.
S. Richardson, 2006, “Over-investment of free cash flow,” Review of Accounting Studies 11: 159-189.
Rousseeuw, P.J. and A.M. Leroy, 1986, Robust Regression and Outlier Detection, John Wiley & Sons, New York.
Michael A. Salinger, 1984, “Tobin’s Q, Unionization, and the Concentration-Profits Relationship,” Rand Journal of Economics 15:159-170.
Gerald F Stussy, 2007, “Paving the Way for Non-Accelerated SOX Filers,” Pennsylvania CPA Journal, pages 36-39.
J. Tobin, 1969, “A General Equilibrium Approach to Monetary Theory,” Journal of Money, Credit and Banking 1: 15-29.
Wagner, S. and L. Dittmar, 2006, “The Unexpected Benefits of Sarbanes-Oxley,” Harvard Business Review 84: 133-40.
Joseph T. Wells, 2004, “Small Business, Big Losses,” Journal of Accountancy http://www.aicpa.org/pubs/jofa/dec2004/wells.htm.
Zhang, I., 2005 “Economic Consequences of the Sarbanes-Oxley Act of 2002,” Working paper, University of Rochester.
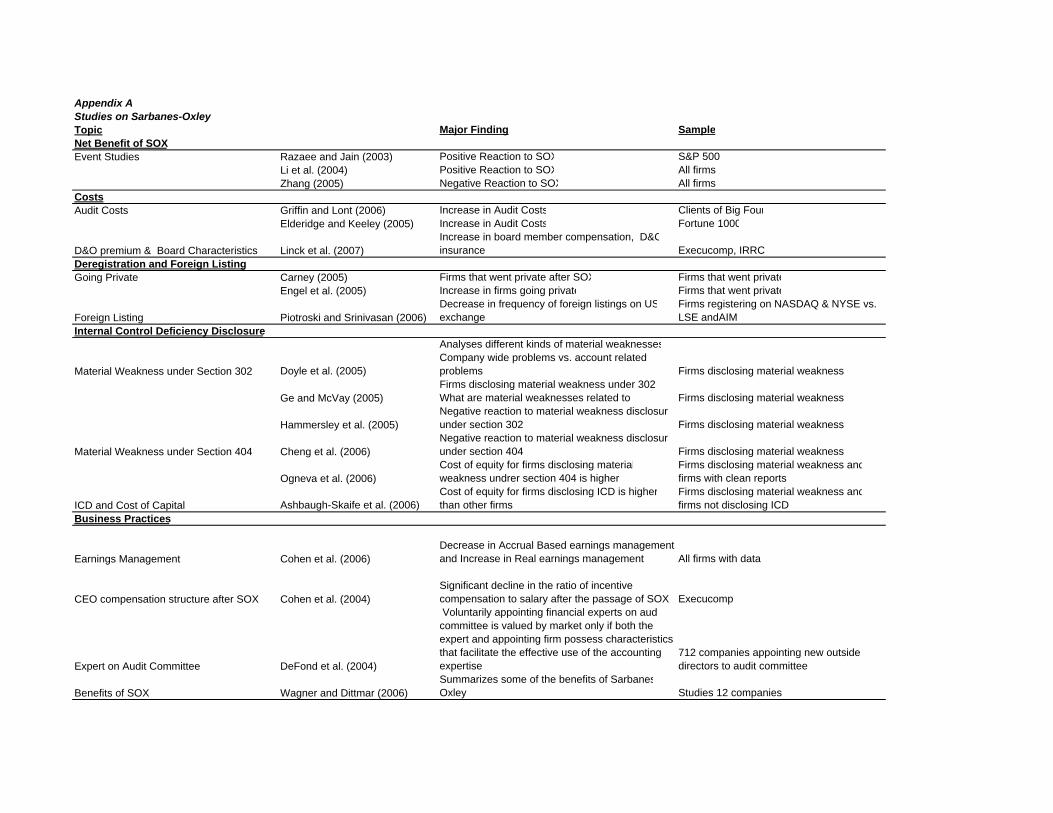
Appendix AStudies on Sarbanes-OxleyTopic Major Finding SampleNet Benefit of SOXEvent Studies Razaee and Jain (2003) Positive Reaction to SOX S&P 500
Li et al. (2004) Positive Reaction to SOX All firmsZhang (2005) Negative Reaction to SOX All firms
CostsAudit Costs Griffin and Lont (2006) Increase in Audit Costs Clients of Big Four
Elderidge and Keeley (2005) Increase in Audit Costs Fortune 1000
D&O premium & Board Characteristics Linck et al. (2007)Increase in board member compensation, D&Oinsurance Execucomp, IRRC
Deregistration and Foreign ListingGoing Private Carney (2005) Firms that went private after SOX Firms that went private
Engel et al. (2005) Increase in firms going private Firms that went private
Foreign Listing Piotroski and Srinivasan (2006) Decrease in frequency of foreign listings on USexchange
Firms registering on NASDAQ & NYSE vs. LSE andAIM
Internal Control Deficiency Disclosure
Material Weakness under Section 302 Doyle et al. (2005)
Analyses different kinds of material weaknessesCompany wide problems vs. account related problems Firms disclosing material weakness
Ge and McVay (2005)Firms disclosing material weakness under 302 -What are material weaknesses related to Firms disclosing material weakness
Hammersley et al. (2005)Negative reaction to material weakness disclosureunder section 302 Firms disclosing material weakness
Material Weakness under Section 404 Cheng et al. (2006) Negative reaction to material weakness disclosureunder section 404 Firms disclosing material weakness
Ogneva et al. (2006)Cost of equity for firms disclosing materialweakness undrer section 404 is higher
Firms disclosing material weakness andfirms with clean reports
ICD and Cost of Capital Ashbaugh-Skaife et al. (2006) Cost of equity for firms disclosing ICD is higherthan other firms
Firms disclosing material weakness andfirms not disclosing ICD
Business Practices
Earnings Management Cohen et al. (2006)Decrease in Accrual Based earnings management and Increase in Real earnings management All firms with data
CEO compensation structure after SOX Cohen et al. (2004)Significant decline in the ratio of incentive compensation to salary after the passage of SOX Execucomp
Expert on Audit Committee DeFond et al. (2004)
Voluntarily appointing financial experts on audcommittee is valued by market only if both the expert and appointing firm possess characteristics that facilitate the effective use of the accounting expertise
712 companies appointing new outside directors to audit committee
Benefits of SOX Wagner and Dittmar (2006)Summarizes some of the benefits of SarbanesOxley Studies 12 companies
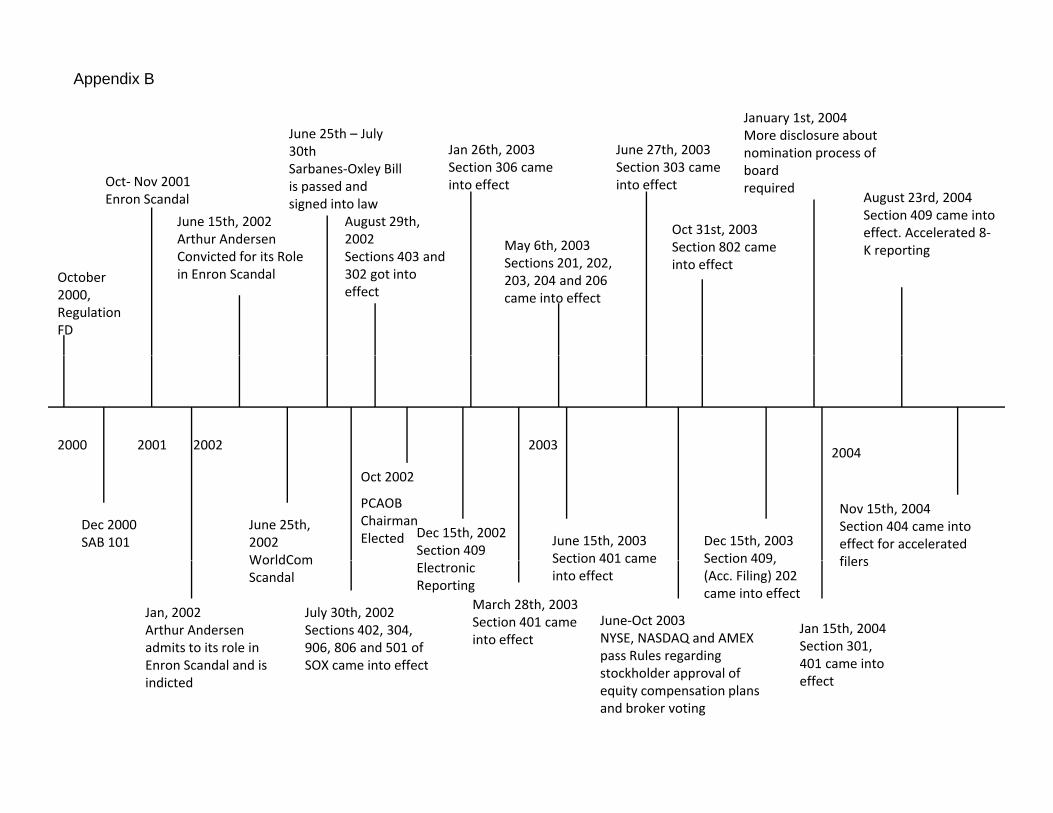
June 25th – July 30th Jan 26th 2003 June 27th 2003
January 1st, 2004More disclosure about
i ti f
Appendix B
Oct- Nov 2001Enron Scandal
June 15th, 2002Arthur Andersen C i t d f it R l
30th Sarbanes-Oxley Bill is passed and signed into law
August 29th, 2002S ti 403 d
Jan 26th, 2003Section 306 came into effect
May 6th, 2003
June 27th, 2003Section 303 came into effect
Oct 31st, 2003Section 802 came
nomination process of boardrequired
August 23rd, 2004Section 409 came into effect. Accelerated 8-K reporting
October 2000, Regulation FD
Convicted for its Role in Enron Scandal
Sections 403 and 302 got into effect
Sections 201, 202, 203, 204 and 206 came into effect
into effectK reporting
2001 20022000 2003 2004
Dec 2000SAB 101
June 25th, 2002WorldCom
Dec 15th, 2002Section 409
June 15th, 2003Section 401 came
Dec 15th, 2003Section 409
Nov 15th, 2004Section 404 came into effect for accelerated filers
Oct 2002
PCAOB Chairman Elected
Jan, 2002Arthur Andersen admits to its role in Enron Scandal and is
WorldCom Scandal
July 30th, 2002Sections 402, 304, 906, 806 and 501 of SOX came into effect
Electronic Reporting
March 28th, 2003Section 401 came into effect
Section 401 came into effect
June-Oct 2003NYSE, NASDAQ and AMEX pass Rules regarding
Section 409, (Acc. Filing) 202 came into effect
Jan 15th, 2004Section 301, 401 came into
filers
Enron Scandal and is indicted
SOX came into effect stockholder approval of equity compensation plans and broker voting
401 came intoeffect
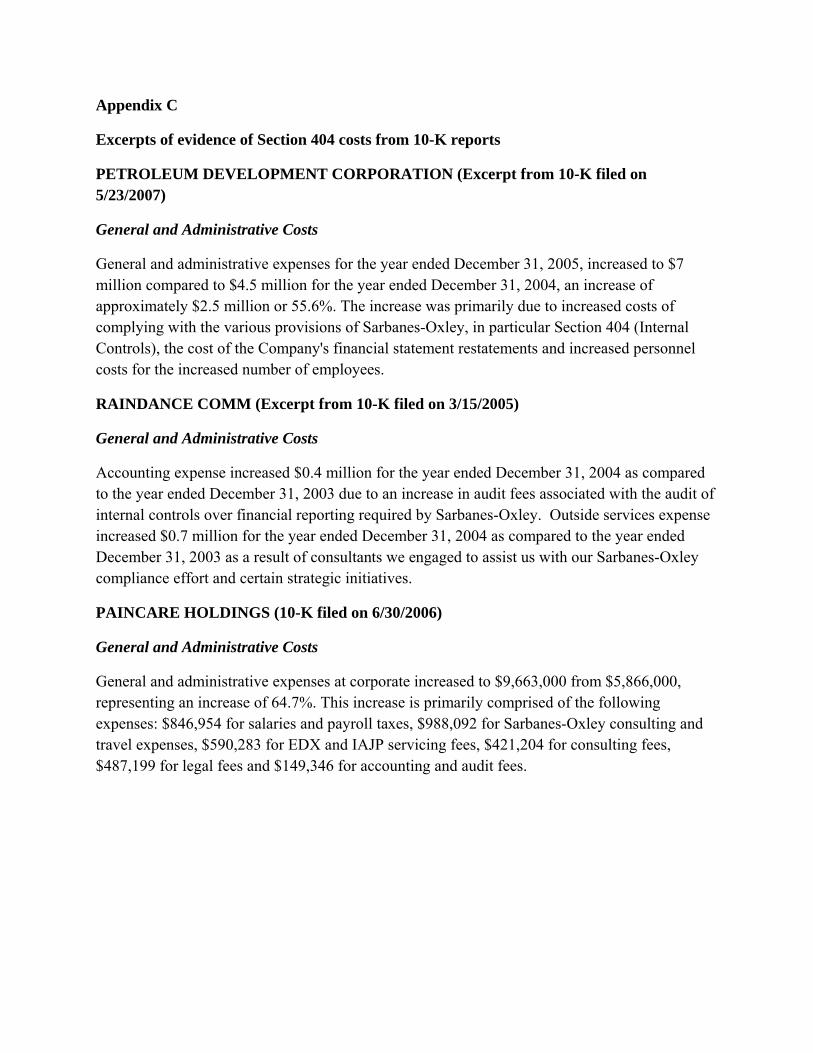
Appendix C
Excerpts of evidence of Section 404 costs from 10-K reports
PETROLEUM DEVELOPMENT CORPORATION (Excerpt from 10-K filed on 5/23/2007)
General and Administrative Costs
General and administrative expenses for the year ended December 31, 2005, increased to $7 million compared to $4.5 million for the year ended December 31, 2004, an increase of approximately $2.5 million or 55.6%. The increase was primarily due to increased costs of complying with the various provisions of Sarbanes-Oxley, in particular Section 404 (Internal Controls), the cost of the Company's financial statement restatements and increased personnel costs for the increased number of employees.
RAINDANCE COMM (Excerpt from 10-K filed on 3/15/2005)
General and Administrative Costs
Accounting expense increased $0.4 million for the year ended December 31, 2004 as compared to the year ended December 31, 2003 due to an increase in audit fees associated with the audit of internal controls over financial reporting required by Sarbanes-Oxley. Outside services expense increased $0.7 million for the year ended December 31, 2004 as compared to the year ended December 31, 2003 as a result of consultants we engaged to assist us with our Sarbanes-Oxley compliance effort and certain strategic initiatives.
PAINCARE HOLDINGS (10-K filed on 6/30/2006)
General and Administrative Costs
General and administrative expenses at corporate increased to $9,663,000 from $5,866,000, representing an increase of 64.7%. This increase is primarily comprised of the following expenses: $846,954 for salaries and payroll taxes, $988,092 for Sarbanes-Oxley consulting and travel expenses, $590,283 for EDX and IAJP servicing fees, $421,204 for consulting fees, $487,199 for legal fees and $149,346 for accounting and audit fees.
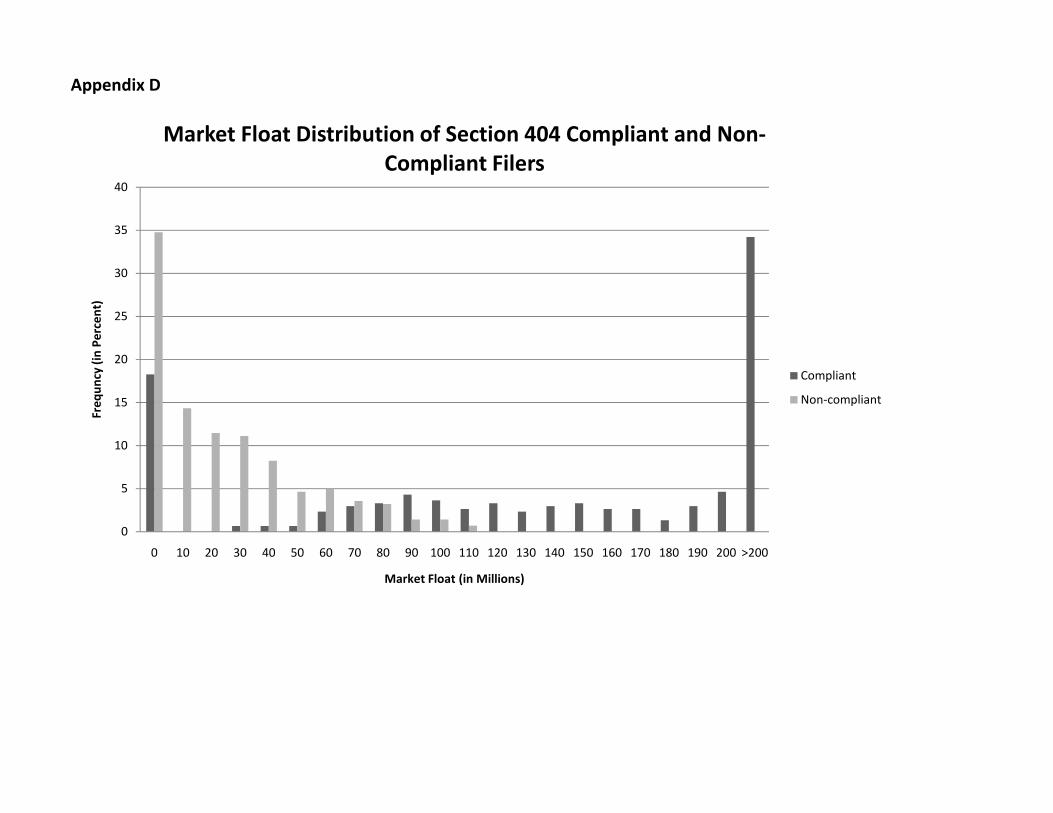
Appendix D
20
25
30
35
40
ncy (in
Percent)
Market Float Distribution of Section 404 Compliant and Non‐Compliant Filers
Compliant
0
5
10
15
0 10 20 30 40 50 60 70 80 90 100 110 120 130 140 150 160 170 180 190 200 >200
Freq
un
Market Float (in Millions)
p
Non-compliant
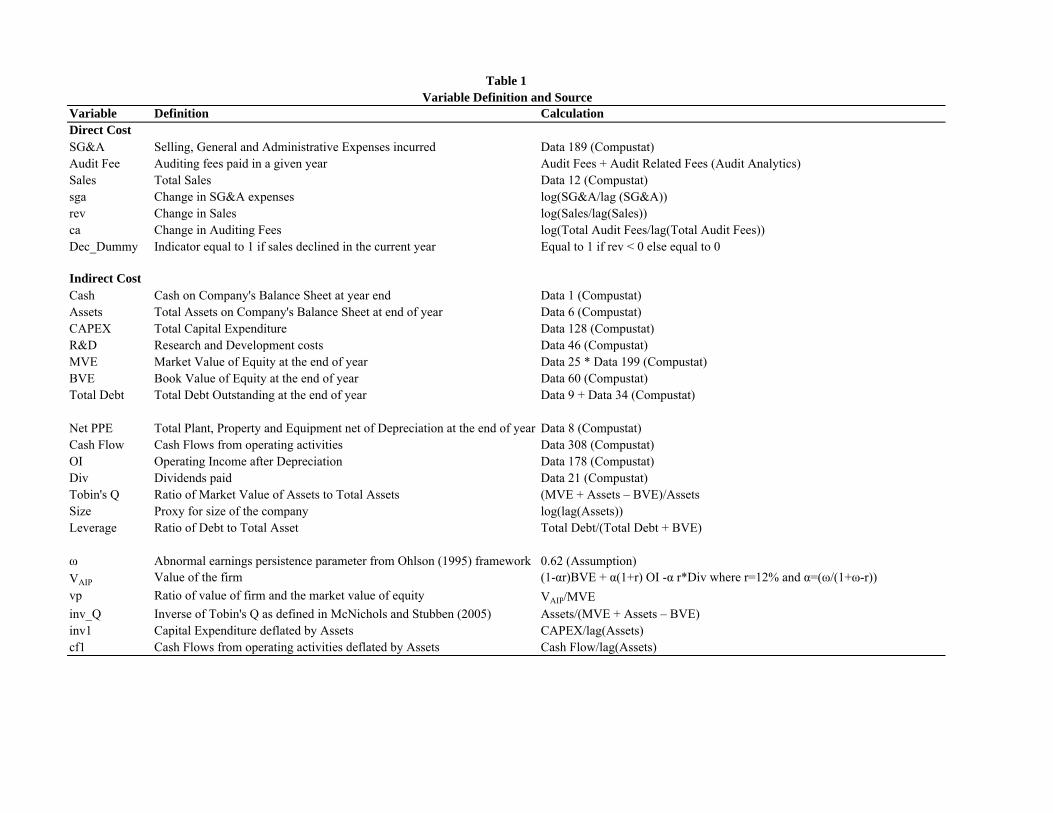
Variable Definition CalculationDirect CostSG&A Selling, General and Administrative Expenses incurred Data 189 (Compustat)Audit Fee Auditing fees paid in a given year Audit Fees + Audit Related Fees (Audit Analytics)Sales Total Sales Data 12 (Compustat)sga Change in SG&A expenses log(SG&A/lag (SG&A))rev Change in Sales log(Sales/lag(Sales))ca Change in Auditing Fees log(Total Audit Fees/lag(Total Audit Fees)) Dec_Dummy Indicator equal to 1 if sales declined in the current year Equal to 1 if rev < 0 else equal to 0
Indirect CostCash Cash on Company's Balance Sheet at year end Data 1 (Compustat)Assets Total Assets on Company's Balance Sheet at end of year Data 6 (Compustat)CAPEX Total Capital Expenditure Data 128 (Compustat)R&D Research and Development costs Data 46 (Compustat)MVE Market Value of Equity at the end of year Data 25 * Data 199 (Compustat)BVE Book Value of Equity at the end of year Data 60 (Compustat)Total Debt Total Debt Outstanding at the end of year Data 9 + Data 34 (Compustat)
Net PPE Total Plant, Property and Equipment net of Depreciation at the end of year Data 8 (Compustat)Cash Flow Cash Flows from operating activities Data 308 (Compustat) OI Operating Income after Depreciation Data 178 (Compustat)Div Dividends paid Data 21 (Compustat)Tobin's Q Ratio of Market Value of Assets to Total Assets (MVE + Assets – BVE)/AssetsSize Proxy for size of the company log(lag(Assets))Leverage Ratio of Debt to Total Asset Total Debt/(Total Debt + BVE)
ω Abnormal earnings persistence parameter from Ohlson (1995) framework 0.62 (Assumption)VAIP Value of the firm (1-αr)BVE + α(1+r) OI -α r*Div where r=12% and α=(ω/(1+ω-r))vp Ratio of value of firm and the market value of equity VAIP/MVEinv_Q Inverse of Tobin's Q as defined in McNichols and Stubben (2005) Assets/(MVE + Assets – BVE)inv1 Capital Expenditure deflated by Assets CAPEX/lag(Assets)cf1 Cash Flows from operating activities deflated by Assets Cash Flow/lag(Assets)
Table 1Variable Definition and Source
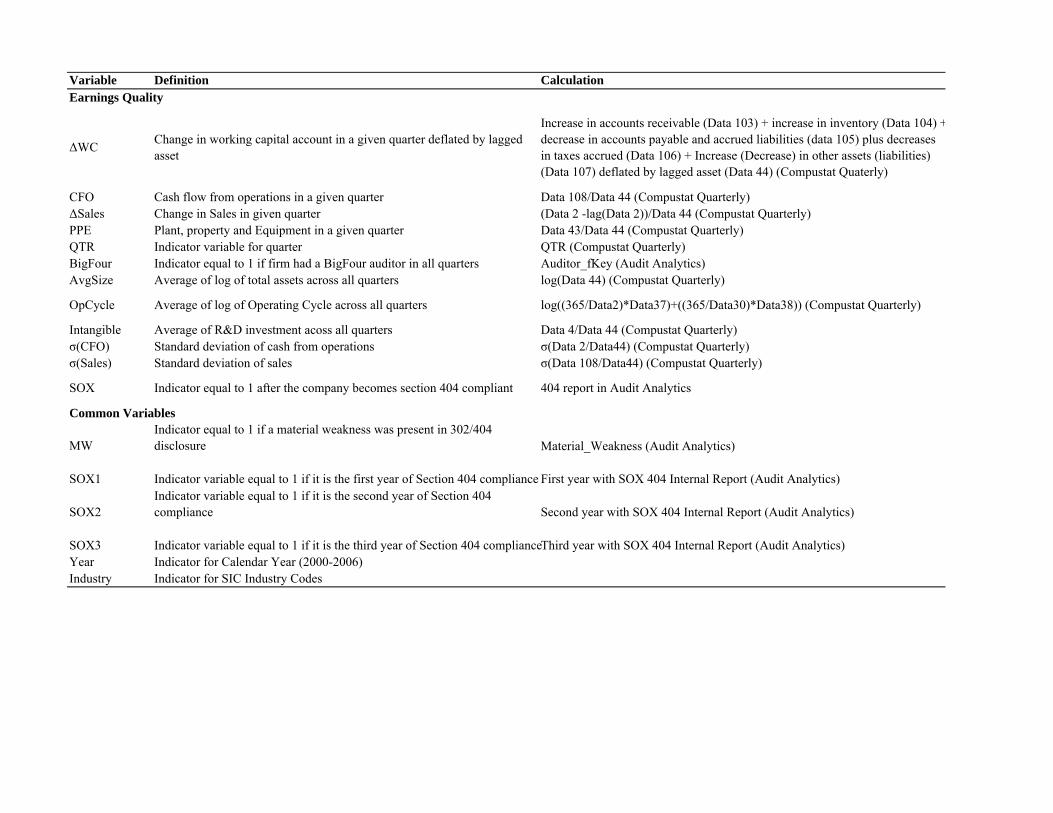
Variable Definition Calculation
ΔWC Change in working capital account in a given quarter deflated by lagged asset
Increase in accounts receivable (Data 103) + increase in inventory (Data 104) +decrease in accounts payable and accrued liabilities (data 105) plus decreases in taxes accrued (Data 106) + Increase (Decrease) in other assets (liabilities) (Data 107) deflated by lagged asset (Data 44) (Compustat Quaterly)
CFO Cash flow from operations in a given quarter Data 108/Data 44 (Compustat Quarterly)ΔSales Change in Sales in given quarter (Data 2 -lag(Data 2))/Data 44 (Compustat Quarterly)PPE Plant, property and Equipment in a given quarter Data 43/Data 44 (Compustat Quarterly)QTR Indicator variable for quarter QTR (Compustat Quarterly)BigFour Indicator equal to 1 if firm had a BigFour auditor in all quarters Auditor_fKey (Audit Analytics)AvgSize Average of log of total assets across all quarters log(Data 44) (Compustat Quarterly)
OpCycle Average of log of Operating Cycle across all quarters log((365/Data2)*Data37)+((365/Data30)*Data38)) (Compustat Quarterly)
Intangible Average of R&D investment acoss all quarters Data 4/Data 44 (Compustat Quarterly)σ(CFO) Standard deviation of cash from operations σ(Data 2/Data44) (Compustat Quarterly)σ(Sales) Standard deviation of sales σ(Data 108/Data44) (Compustat Quarterly)
SOX Indicator equal to 1 after the company becomes section 404 compliant 404 report in Audit Analytics
Common Variables
MWIndicator equal to 1 if a material weakness was present in 302/404 disclosure Material_Weakness (Audit Analytics)
SOX1 Indicator variable equal to 1 if it is the first year of Section 404 compliance First year with SOX 404 Internal Report (Audit Analytics)
SOX2Indicator variable equal to 1 if it is the second year of Section 404 compliance Second year with SOX 404 Internal Report (Audit Analytics)
SOX3 Indicator variable equal to 1 if it is the third year of Section 404 complianceThird year with SOX 404 Internal Report (Audit Analytics) Year Indicator for Calendar Year (2000-2006)Industry Indicator for SIC Industry Codes
Earnings Quality
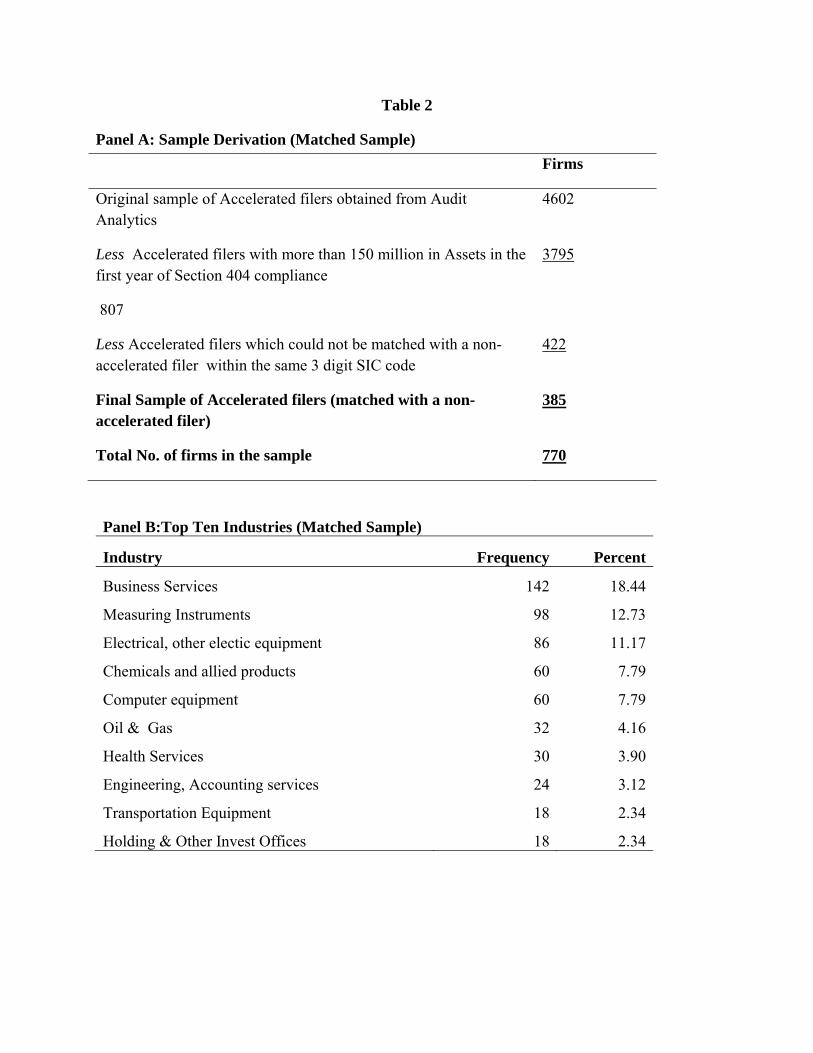
Table 2
Panel A: Sample Derivation (Matched Sample)
Panel B:Top Ten Industries (Matched Sample)
Industry Frequency Percent
Business Services 142 18.44
Measuring Instruments 98 12.73
Electrical, other electic equipment 86 11.17
Chemicals and allied products 60 7.79
Computer equipment 60 7.79
Oil & Gas 32 4.16
Health Services 30 3.90
Engineering, Accounting services 24 3.12
Transportation Equipment 18 2.34
Holding & Other Invest Offices 18 2.34
Firms
Original sample of Accelerated filers obtained from Audit Analytics
4602
Less Accelerated filers with more than 150 million in Assets in the first year of Section 404 compliance
3795
807
Less Accelerated filers which could not be matched with a non-accelerated filer within the same 3 digit SIC code
422
Final Sample of Accelerated filers (matched with a non-accelerated filer)
385
Total No. of firms in the sample 770
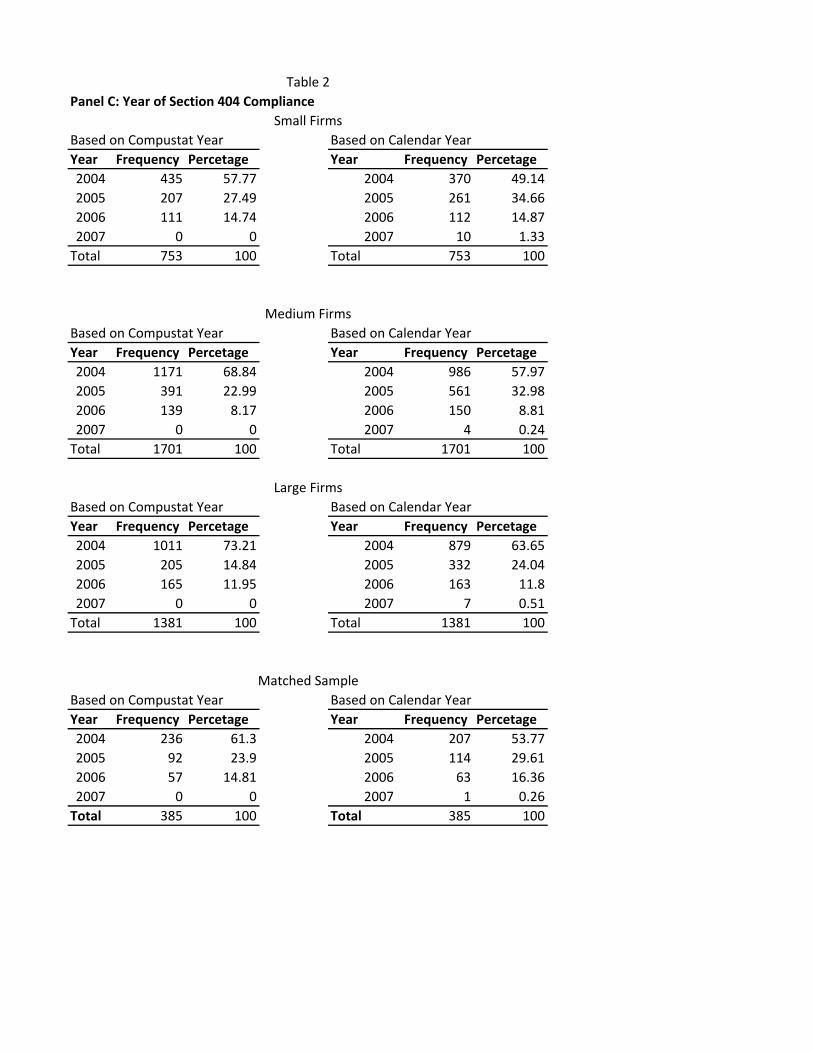
Based on Calendar YearYear Frequency Percetage Year Frequency Percetage2004 435 57.77 2004 370 49.142005 207 27.49 2005 261 34.662006 111 14.74 2006 112 14.872007 0 0 2007 10 1.33
Total 753 100 Total 753 100
Year Frequency Percetage Year Frequency Percetage2004 1171 68.84 2004 986 57.972005 391 22.99 2005 561 32.982006 139 8.17 2006 150 8.812007 0 0 2007 4 0.24
Total 1701 100 Total 1701 100
Based on Compustat YearYear Frequency Percetage Year Frequency Percetage2004 1011 73.21 2004 879 63.652005 205 14.84 2005 332 24.042006 165 11.95 2006 163 11.82007 0 0 2007 7 0.51
Total 1381 100 Total 1381 100
Year Frequency Percetage Year Frequency Percetage2004 236 61.3 2004 207 53.772005 92 23.9 2005 114 29.612006 57 14.81 2006 63 16.362007 0 0 2007 1 0.26Total 385 100 Total 385 100
Table 2
Large Firms
Matched Sample
Based on Calendar YearMedium Firms
Small FirmsPanel C: Year of Section 404 Compliance
Based on Compustat Year Based on Calendar Year
Based on Calendar Year
Based on Compustat Year
Based on Compustat Year
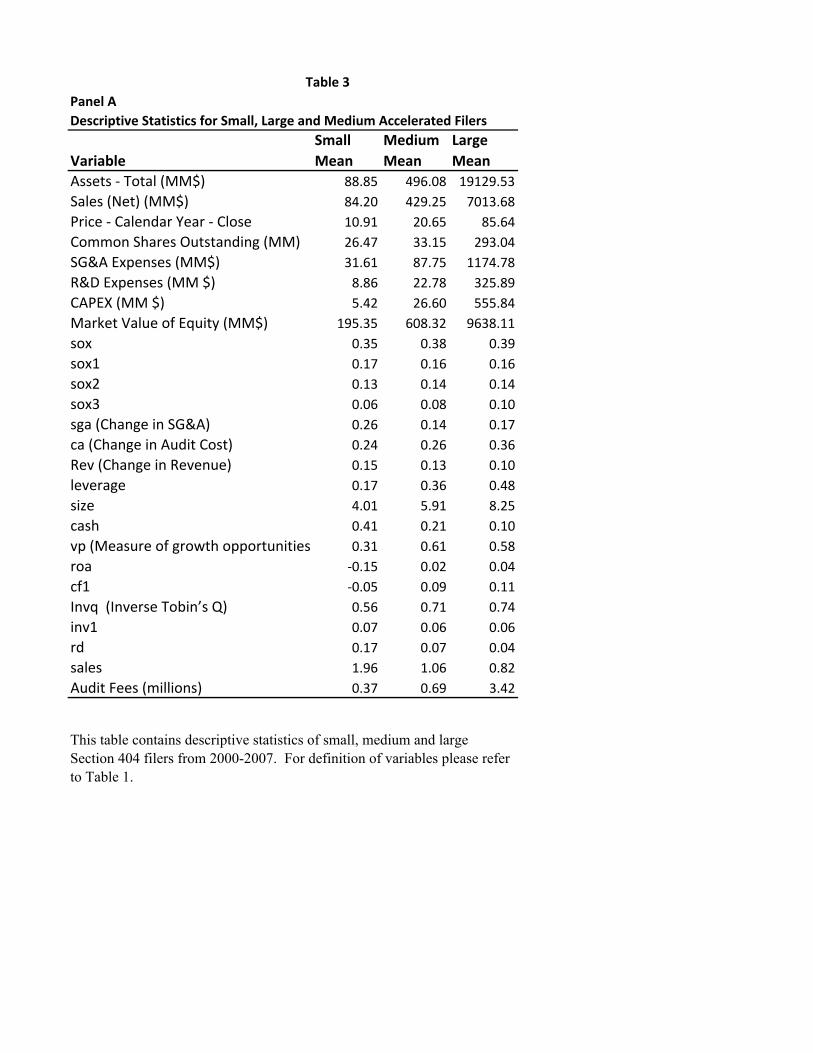
Panel A
VariableSmall Mean
MediumMean
Large Mean
Assets - Total (MM$) 88.85 496.08 19129.53Sales (Net) (MM$) 84.20 429.25 7013.68Price - Calendar Year - Close 10.91 20.65 85.64Common Shares Outstanding (MM) 26.47 33.15 293.04SG&A Expenses (MM$) 31.61 87.75 1174.78R&D Expenses (MM $) 8.86 22.78 325.89CAPEX (MM $) 5.42 26.60 555.84Market Value of Equity (MM$) 195.35 608.32 9638.11sox 0.35 0.38 0.39sox1 0.17 0.16 0.16sox2 0.13 0.14 0.14sox3 0.06 0.08 0.10sga (Change in SG&A) 0.26 0.14 0.17ca (Change in Audit Cost) 0.24 0.26 0.36Rev (Change in Revenue) 0.15 0.13 0.10leverage 0.17 0.36 0.48size 4.01 5.91 8.25cash 0.41 0.21 0.10vp (Measure of growth opportunities 0.31 0.61 0.58roa -0.15 0.02 0.04cf1 -0.05 0.09 0.11Invq (Inverse Tobin’s Q) 0.56 0.71 0.74inv1 0.07 0.06 0.06rd 0.17 0.07 0.04sales 1.96 1.06 0.82Audit Fees (millions) 0.37 0.69 3.42
Table 3
Descriptive Statistics for Small, Large and Medium Accelerated Filers
This table contains descriptive statistics of small, medium and large Section 404 filers from 2000-2007. For definition of variables please refer to Table 1.
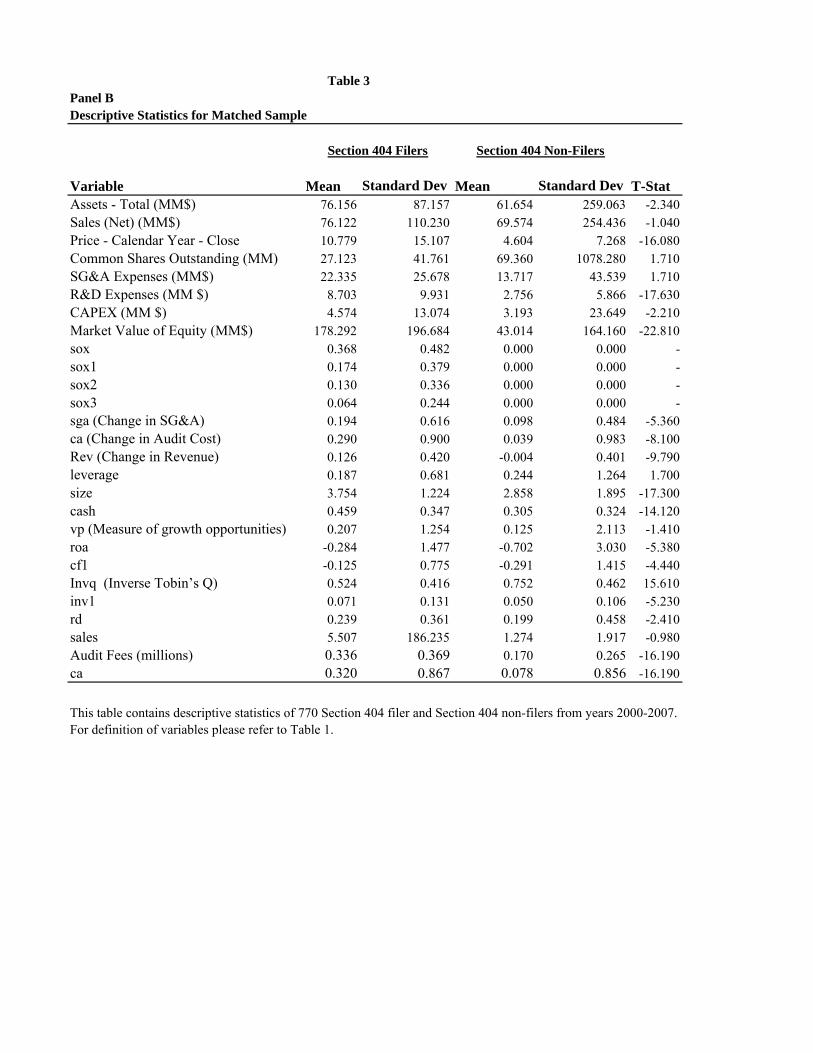
Panel B
Variable Mean Standard Dev Mean Standard DevAssets - Total (MM$) 76.156 87.157 61.654 259.063 -2.340Sales (Net) (MM$) 76.122 110.230 69.574 254.436 -1.040Price - Calendar Year - Close 10.779 15.107 4.604 7.268 -16.080Common Shares Outstanding (MM) 27.123 41.761 69.360 1078.280 1.710SG&A Expenses (MM$) 22.335 25.678 13.717 43.539 1.710R&D Expenses (MM $) 8.703 9.931 2.756 5.866 -17.630CAPEX (MM $) 4.574 13.074 3.193 23.649 -2.210Market Value of Equity (MM$) 178.292 196.684 43.014 164.160 -22.810sox 0.368 0.482 0.000 0.000 -sox1 0.174 0.379 0.000 0.000 -sox2 0.130 0.336 0.000 0.000 -sox3 0.064 0.244 0.000 0.000 -sga (Change in SG&A) 0.194 0.616 0.098 0.484 -5.360ca (Change in Audit Cost) 0.290 0.900 0.039 0.983 -8.100Rev (Change in Revenue) 0.126 0.420 -0.004 0.401 -9.790leverage 0.187 0.681 0.244 1.264 1.700size 3.754 1.224 2.858 1.895 -17.300cash 0.459 0.347 0.305 0.324 -14.120vp (Measure of growth opportunities) 0.207 1.254 0.125 2.113 -1.410roa -0.284 1.477 -0.702 3.030 -5.380cf1 -0.125 0.775 -0.291 1.415 -4.440Invq (Inverse Tobin’s Q) 0.524 0.416 0.752 0.462 15.610inv1 0.071 0.131 0.050 0.106 -5.230rd 0.239 0.361 0.199 0.458 -2.410sales 5.507 186.235 1.274 1.917 -0.980Audit Fees (millions) 0.336 0.369 0.170 0.265 -16.190ca 0.320 0.867 0.078 0.856 -16.190
Section 404 Non-FilersSection 404 Filers
Table 3
Descriptive Statistics for Matched Sample
This table contains descriptive statistics of 770 Section 404 filer and Section 404 non-filers from years 2000-2007. For definition of variables please refer to Table 1.
T-Stat
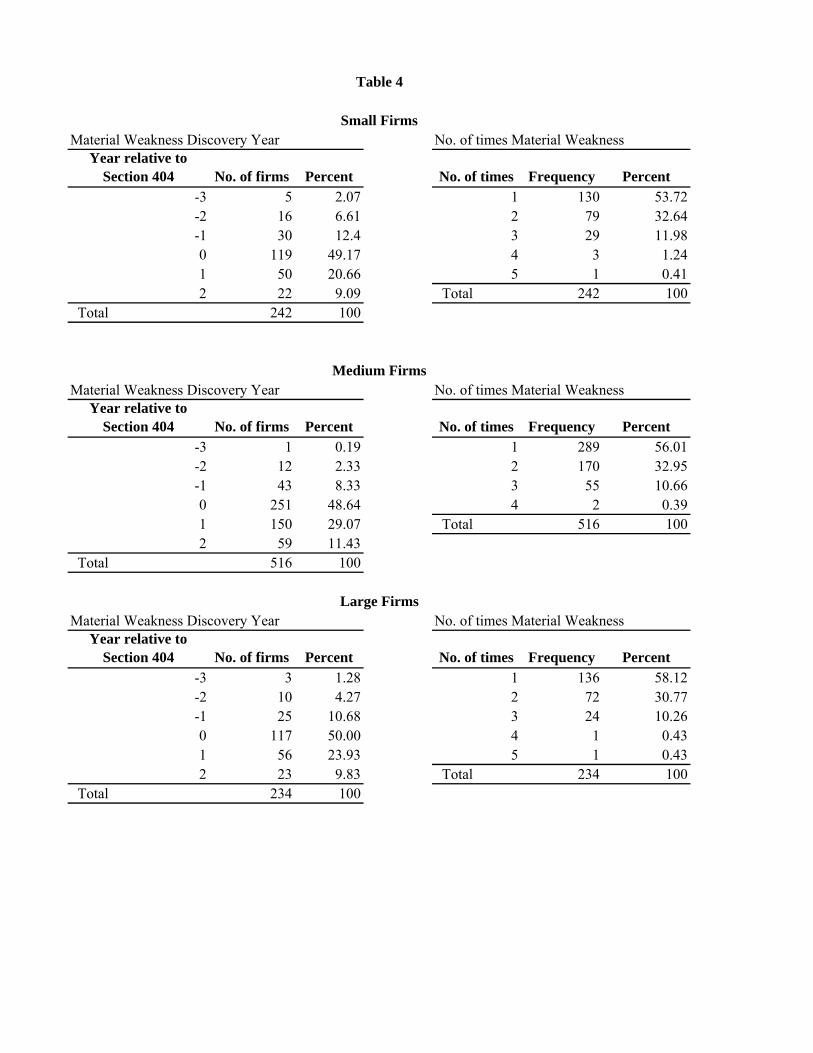
Year relative to Section 404 No. of firms Percent No. of times Frequency Percent
-3 5 2.07 1 130 53.72-2 16 6.61 2 79 32.64-1 30 12.4 3 29 11.980 119 49.17 4 3 1.241 50 20.66 5 1 0.412 22 9.09 Total 242 100
Total 242 100
Material Weakness Discovery YearYear relative to
Section 404 No. of firms Percent No. of times Frequency Percent-3 1 0.19 1 289 56.01-2 12 2.33 2 170 32.95-1 43 8.33 3 55 10.660 251 48.64 4 2 0.391 150 29.07 Total 516 1002 59 11.43
Total 516 100
Year relative to Section 404 No. of firms Percent No. of times Frequency Percent
-3 3 1.28 1 136 58.12-2 10 4.27 2 72 30.77-1 25 10.68 3 24 10.260 117 50.00 4 1 0.431 56 23.93 5 1 0.432 23 9.83 Total 234 100
Total 234 100
No. of times Material WeaknessLarge Firms
Medium Firms
Small Firms
Table 4
Material Weakness Discovery Year No. of times Material Weakness
No. of times Material Weakness
Material Weakness Discovery Year
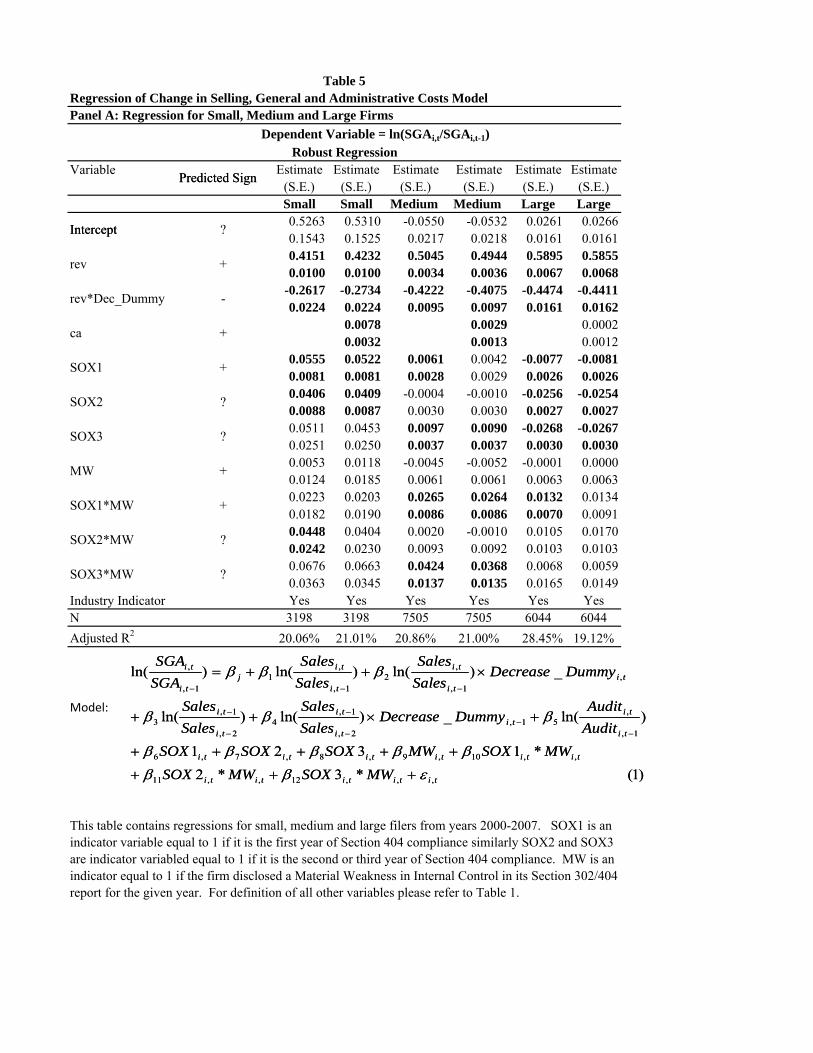
Variable Estimate Estimate Estimate Estimate Estimate Estimate(S.E.) (S.E.) (S.E.) (S.E.) (S.E.) (S.E.)Small Small Medium Medium Large Large0.5263 0.5310 -0.0550 -0.0532 0.0261 0.02660.1543 0.1525 0.0217 0.0218 0.0161 0.01610.4151 0.4232 0.5045 0.4944 0.5895 0.58550.0100 0.0100 0.0034 0.0036 0.0067 0.0068
-0.2617 -0.2734 -0.4222 -0.4075 -0.4474 -0.44110.0224 0.0224 0.0095 0.0097 0.0161 0.0162
0.0078 0.0029 0.00020.0032 0.0013 0.0012
0.0555 0.0522 0.0061 0.0042 -0.0077 -0.00810.0081 0.0081 0.0028 0.0029 0.0026 0.00260.0406 0.0409 -0.0004 -0.0010 -0.0256 -0.02540.0088 0.0087 0.0030 0.0030 0.0027 0.00270.0511 0.0453 0.0097 0.0090 -0.0268 -0.02670.0251 0.0250 0.0037 0.0037 0.0030 0.00300.0053 0.0118 -0.0045 -0.0052 -0.0001 0.00000.0124 0.0185 0.0061 0.0061 0.0063 0.00630 0223 0 0203 0 0265 0 0264 0 0132 0 0134
rev*Dec_Dummy
+rev
SOX3 ?
ca +
Table 5
Robust Regression
Panel A: Regression for Small, Medium and Large Firms
SOX2
MW +
+
?
-
Predicted Sign
SOX1
Intercept
Predicted Sign
Dependent Variable = ln(SGAi,t/SGAi,t-1)
?Intercept
Regression of Change in Selling, General and Administrative Costs Model
)1(*3*2*1321
)ln(_)ln()ln(
_)ln()ln()ln(
,,,12,,11
,,10,9,8,7,6
1,
,51,
2,
1,4
2,
1,3
,1,
,2
1,
,1
1,
,
tititititi
titititititi
ti
titi
ti
ti
ti
ti
titi
ti
ti
tij
ti
ti
MWSOXMWSOXMWSOXMWSOXSOXSOX
AuditAudit
DummyDecreaseSalesSales
SalesSales
DummyDecreaseSalesSales
SalesSales
SGASGA
εβββββββ
βββ
βββ
+++
+++++
+×++
×++=
−−
−
−
−
−
−−−
0.0223 0.0203 0.0265 0.0264 0.0132 0.01340.0182 0.0190 0.0086 0.0086 0.0070 0.00910.0448 0.0404 0.0020 -0.0010 0.0105 0.01700.0242 0.0230 0.0093 0.0092 0.0103 0.01030.0676 0.0663 0.0424 0.0368 0.0068 0.00590.0363 0.0345 0.0137 0.0135 0.0165 0.0149
Industry Indicator Yes Yes Yes Yes Yes YesN 3198 3198 7505 7505 6044 6044Adjusted R2 20.06% 21.01% 20.86% 21.00% 28.45% 19.12%
Model:
This table contains regressions for small, medium and large filers from years 2000-2007. SOX1 is an indicator variable equal to 1 if it is the first year of Section 404 compliance similarly SOX2 and SOX3 are indicator variabled equal to 1 if it is the second or third year of Section 404 compliance. MW is an indicator equal to 1 if the firm disclosed a Material Weakness in Internal Control in its Section 302/404 report for the given year. For definition of all other variables please refer to Table 1.
+SOX1*MW
SOX2*MW ?
SOX3*MW ?
)1(*3*2*1321
)ln(_)ln()ln(
_)ln()ln()ln(
,,,12,,11
,,10,9,8,7,6
1,
,51,
2,
1,4
2,
1,3
,1,
,2
1,
,1
1,
,
tititititi
titititititi
ti
titi
ti
ti
ti
ti
titi
ti
ti
tij
ti
ti
MWSOXMWSOXMWSOXMWSOXSOXSOX
AuditAudit
DummyDecreaseSalesSales
SalesSales
DummyDecreaseSalesSales
SalesSales
SGASGA
εβββββββ
βββ
βββ
+++
+++++
+×++
×++=
−−
−
−
−
−
−−−
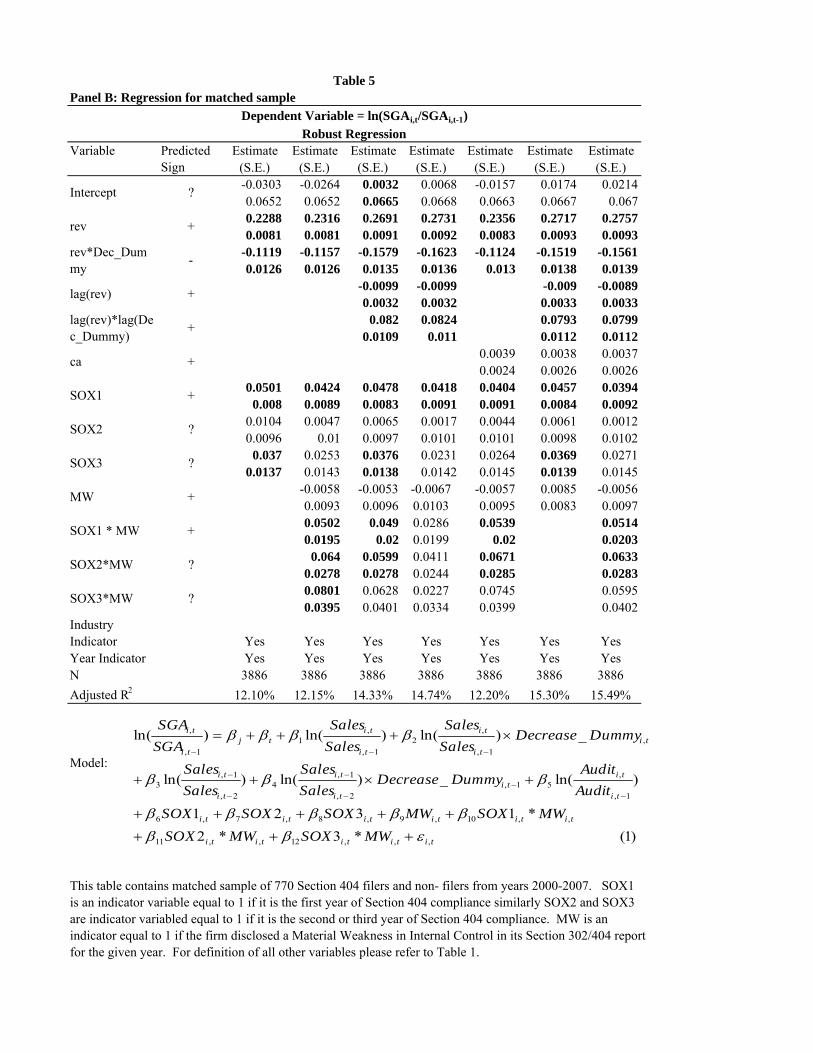
Variable Estimate Estimate Estimate Estimate Estimate Estimate Estimate(S.E.) (S.E.) (S.E.) (S.E.) (S.E.) (S.E.) (S.E.)-0.0303 -0.0264 0.0032 0.0068 -0.0157 0.0174 0.02140.0652 0.0652 0.0665 0.0668 0.0663 0.0667 0.0670.2288 0.2316 0.2691 0.2731 0.2356 0.2717 0.27570.0081 0.0081 0.0091 0.0092 0.0083 0.0093 0.0093
-0.1119 -0.1157 -0.1579 -0.1623 -0.1124 -0.1519 -0.15610.0126 0.0126 0.0135 0.0136 0.013 0.0138 0.0139
-0.0099 -0.0099 -0.009 -0.00890.0032 0.0032 0.0033 0.0033
0.082 0.0824 0.0793 0.07990.0109 0.011 0.0112 0.0112
0.0039 0.0038 0.00370.0024 0.0026 0.0026
0.0501 0.0424 0.0478 0.0418 0.0404 0.0457 0.03940.008 0.0089 0.0083 0.0091 0.0091 0.0084 0.0092
0.0104 0.0047 0.0065 0.0017 0.0044 0.0061 0.00120.0096 0.01 0.0097 0.0101 0.0101 0.0098 0.0102
0.037 0.0253 0.0376 0.0231 0.0264 0.0369 0.02710.0137 0.0143 0.0138 0.0142 0.0145 0.0139 0.0145
-0.0058 -0.0053 -0.0067 -0.0057 0.0085 -0.00560.0093 0.0096 0.0103 0.0095 0.0083 0.00970.0502 0.049 0.0286 0.0539 0.05140.0195 0.02 0.0199 0.02 0.0203
0.064 0.0599 0.0411 0.0671 0.06330.0278 0.0278 0.0244 0.0285 0.02830.0801 0.0628 0.0227 0.0745 0.05950.0395 0.0401 0.0334 0.0399 0.0402
Industry Indicator Yes Yes Yes Yes Yes Yes YesYear Indicator Yes Yes Yes Yes Yes Yes YesN 3886 3886 3886 3886 3886 3886 3886Adjusted R2 12.10% 12.15% 14.33% 14.74% 12.20% 15.30% 15.49%
Model:
Intercept
Dependent Variable = ln(SGAi,t/SGAi,t-1)
SOX3
+
?
Table 5
+
+
?
Panel B: Regression for matched sample
?
This table contains matched sample of 770 Section 404 filers and non- filers from years 2000-2007. SOX1 is an indicator variable equal to 1 if it is the first year of Section 404 compliance similarly SOX2 and SOX3 are indicator variabled equal to 1 if it is the second or third year of Section 404 compliance. MW is an indicator equal to 1 if the firm disclosed a Material Weakness in Internal Control in its Section 302/404 report for the given year. For definition of all other variables please refer to Table 1.
ca
SOX1
SOX2
SOX1 * MW
Robust Regression
SOX3*MW
+
-
+
?
lag(rev)*lag(Dec_Dummy)
Predicted Sign
lag(rev)
SOX2*MW
rev*Dec_Dummy
MW
+
+
?
rev
)1(*3*2*1321
)ln(_)ln()ln(
_)ln()ln()ln(
,,,12,,11
,,10,9,8,7,6
1,
,51,
2,
1,4
2,
1,3
,1,
,2
1,
,1
1,
,
tititititi
titititititi
ti
titi
ti
ti
ti
ti
titi
ti
ti
titj
ti
ti
MWSOXMWSOXMWSOXMWSOXSOXSOX
AuditAudit
DummyDecreaseSalesSales
SalesSales
DummyDecreaseSalesSales
SalesSales
SGASGA
εβββββββ
βββ
ββββ
+++
+++++
+×++
×+++=
−−
−
−
−
−
−−−
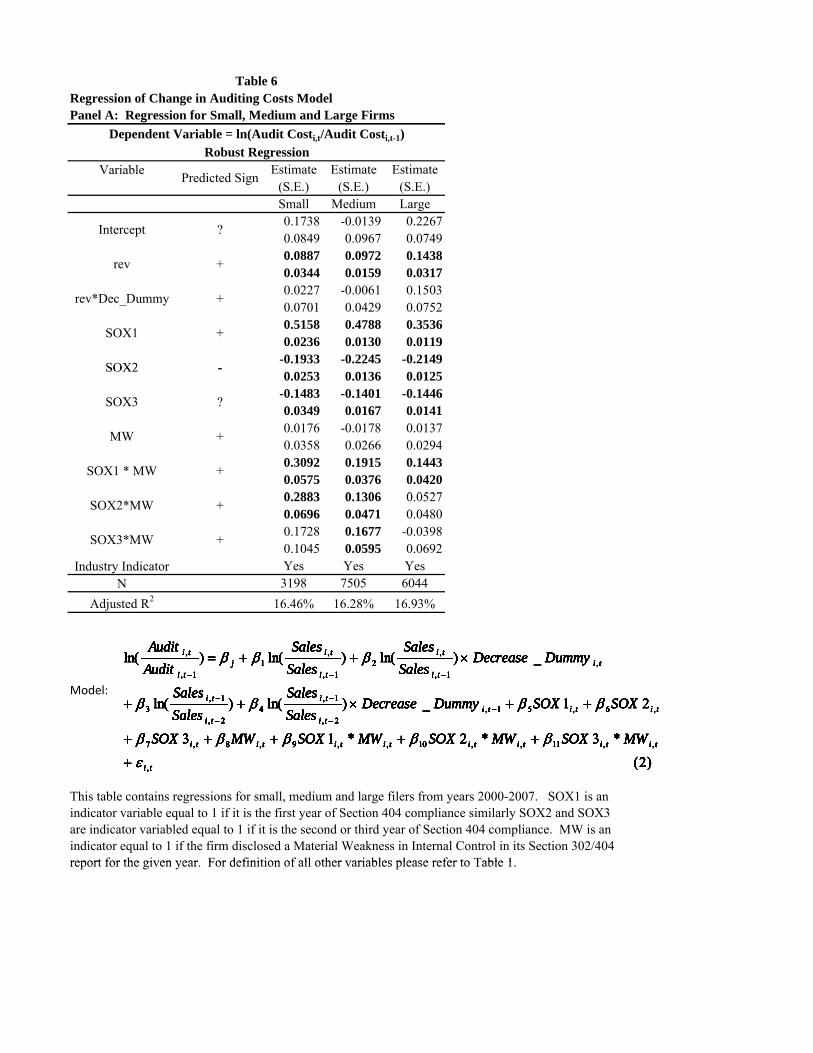
Panel A: Regression for Small, Medium and Large FirmsRegression of Change in Auditing Costs Model
Table 6
)2(*3*2*13
21_)ln()ln(
_)ln()ln()ln(
,
,,11,,10,,9,8,7
,6,51,2,
1,4
2,
1,3
,1,
,2
1,
,1
1,
,
ti
titititititititi
titititi
ti
ti
ti
titi
ti
ti
tij
ti
ti
MWSOXMWSOXMWSOXMWSOX
SOXSOXDummyDecreaseSalesSales
SalesSales
DummyDecreaseSalesSales
SalesSales
AuditAudit
εβββββ
ββββ
βββ
+
+++++
++×++
×++=
−−
−
−
−
−−−
Variable Estimate Estimate Estimate(S.E.) (S.E.) (S.E.)Small Medium Large0.1738 -0.0139 0.22670.0849 0.0967 0.0749
g , gDependent Variable = ln(Audit Costi,t/Audit Costi,t-1)
Robust Regression
Predicted Sign
Intercept ?
)2(*3*2*13
21_)ln()ln(
_)ln()ln()ln(
,
,,11,,10,,9,8,7
,6,51,2,
1,4
2,
1,3
,1,
,2
1,
,1
1,
,
ti
titititititititi
titititi
ti
ti
ti
titi
ti
ti
tij
ti
ti
MWSOXMWSOXMWSOXMWSOX
SOXSOXDummyDecreaseSalesSales
SalesSales
DummyDecreaseSalesSales
SalesSales
AuditAudit
εβββββ
ββββ
βββ
+
+++++
++×++
×++=
−−
−
−
−
−−−
0.0887 0.0972 0.14380.0344 0.0159 0.03170.0227 -0.0061 0.15030.0701 0.0429 0.07520.5158 0.4788 0.35360.0236 0.0130 0.0119
-0.1933 -0.2245 -0.2149
rev +
rev*Dec_Dummy +
SOX1 +
SOX2 -
)2(*3*2*13
21_)ln()ln(
_)ln()ln()ln(
,
,,11,,10,,9,8,7
,6,51,2,
1,4
2,
1,3
,1,
,2
1,
,1
1,
,
ti
titititititititi
titititi
ti
ti
ti
titi
ti
ti
tij
ti
ti
MWSOXMWSOXMWSOXMWSOX
SOXSOXDummyDecreaseSalesSales
SalesSales
DummyDecreaseSalesSales
SalesSales
AuditAudit
εβββββ
ββββ
βββ
+
+++++
++×++
×++=
−−
−
−
−
−−−
0.0253 0.0136 0.0125-0.1483 -0.1401 -0.14460.0349 0.0167 0.01410.0176 -0.0178 0.01370.0358 0.0266 0.02940.3092 0.1915 0.14430.0575 0.0376 0.04200 2883 0 1306 0 0527
SOX2 -
SOX3 ?
MW +
SOX1 * MW +
)2(*3*2*13
21_)ln()ln(
_)ln()ln()ln(
,
,,11,,10,,9,8,7
,6,51,2,
1,4
2,
1,3
,1,
,2
1,
,1
1,
,
ti
titititititititi
titititi
ti
ti
ti
titi
ti
ti
tij
ti
ti
MWSOXMWSOXMWSOXMWSOX
SOXSOXDummyDecreaseSalesSales
SalesSales
DummyDecreaseSalesSales
SalesSales
AuditAudit
εβββββ
ββββ
βββ
+
+++++
++×++
×++=
−−
−
−
−
−−−
0.2883 0.1306 0.05270.0696 0.0471 0.04800.1728 0.1677 -0.03980.1045 0.0595 0.0692
Industry Indicator Yes Yes YesN 3198 7505 6044
Adjusted R2 16.46% 16.28% 16.93%
SOX3*MW +
SOX2*MW +
)2(*3*2*13
21_)ln()ln(
_)ln()ln()ln(
,
,,11,,10,,9,8,7
,6,51,2,
1,4
2,
1,3
,1,
,2
1,
,1
1,
,
ti
titititititititi
titititi
ti
ti
ti
titi
ti
ti
tij
ti
ti
MWSOXMWSOXMWSOXMWSOX
SOXSOXDummyDecreaseSalesSales
SalesSales
DummyDecreaseSalesSales
SalesSales
AuditAudit
εβββββ
ββββ
βββ
+
+++++
++×++
×++=
−−
−
−
−
−−−
Model:
)2(*3*2*13
21_)ln()ln(
_)ln()ln()ln(
,
,,11,,10,,9,8,7
,6,51,2,
1,4
2,
1,3
,1,
,2
1,
,1
1,
,
ti
titititititititi
titititi
ti
ti
ti
titi
ti
ti
tij
ti
ti
MWSOXMWSOXMWSOXMWSOX
SOXSOXDummyDecreaseSalesSales
SalesSales
DummyDecreaseSalesSales
SalesSales
AuditAudit
εβββββ
ββββ
βββ
+
+++++
++×++
×++=
−−
−
−
−
−−−
This table contains regressions for small, medium and large filers from years 2000-2007. SOX1 is an indicator variable equal to 1 if it is the first year of Section 404 compliance similarly SOX2 and SOX3 are indicator variabled equal to 1 if it is the second or third year of Section 404 compliance. MW is an indicator equal to 1 if the firm disclosed a Material Weakness in Internal Control in its Section 302/404 report for the given year For definition of all other variables please refer to Table 1
)2(*3*2*13
21_)ln()ln(
_)ln()ln()ln(
,
,,11,,10,,9,8,7
,6,51,2,
1,4
2,
1,3
,1,
,2
1,
,1
1,
,
ti
titititititititi
titititi
ti
ti
ti
titi
ti
ti
tij
ti
ti
MWSOXMWSOXMWSOXMWSOX
SOXSOXDummyDecreaseSalesSales
SalesSales
DummyDecreaseSalesSales
SalesSales
AuditAudit
εβββββ
ββββ
βββ
+
+++++
++×++
×++=
−−
−
−
−
−−−
report for the given year. For definition of all other variables please refer to Table 1.
)2(*3*2*13
21_)ln()ln(
_)ln()ln()ln(
,
,,11,,10,,9,8,7
,6,51,2,
1,4
2,
1,3
,1,
,2
1,
,1
1,
,
ti
titititititititi
titititi
ti
ti
ti
titi
ti
ti
tij
ti
ti
MWSOXMWSOXMWSOXMWSOX
SOXSOXDummyDecreaseSalesSales
SalesSales
DummyDecreaseSalesSales
SalesSales
AuditAudit
εβββββ
ββββ
βββ
+
+++++
++×++
×++=
−−
−
−
−
−−−
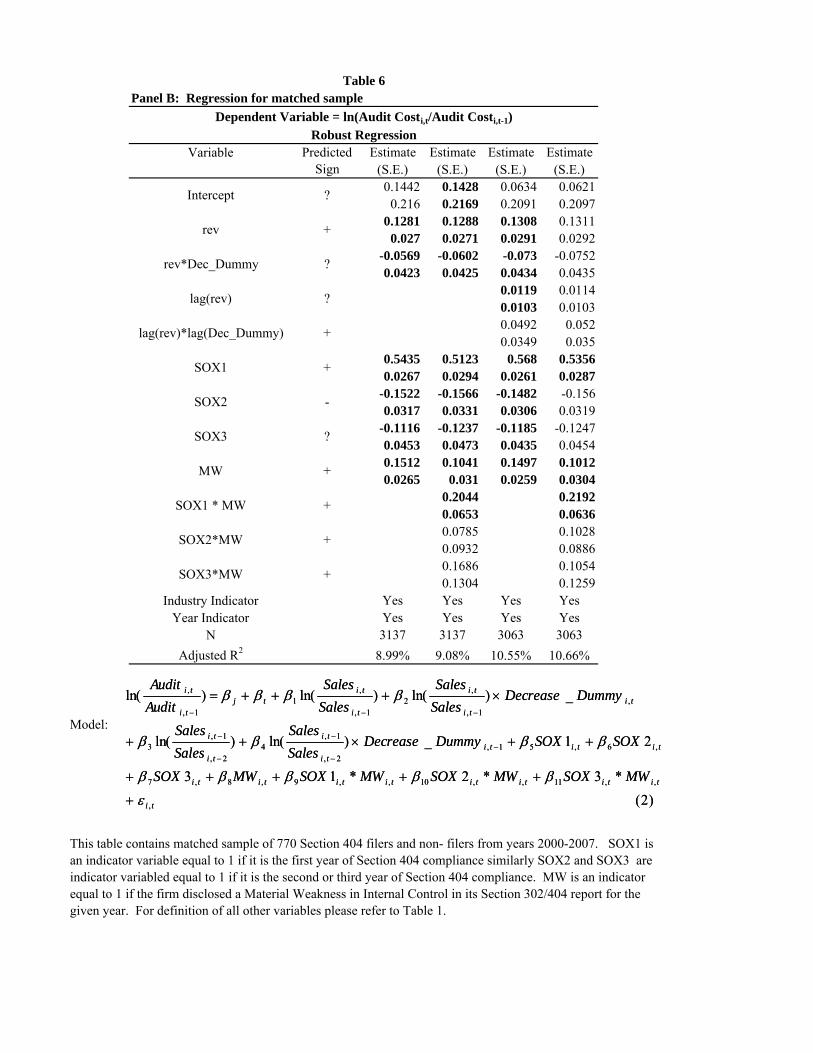
Variable Estimate Estimate Estimate Estimate(S.E.) (S.E.) (S.E.) (S.E.)0.1442 0.1428 0.0634 0.0621
0.216 0.2169 0.2091 0.20970.1281 0.1288 0.1308 0.1311
0.027 0.0271 0.0291 0.0292-0.0569 -0.0602 -0.073 -0.07520.0423 0.0425 0.0434 0.0435
0.0119 0.01140.0103 0.01030.0492 0.0520.0349 0.035
0.5435 0.5123 0.568 0.53560.0267 0.0294 0.0261 0.0287
-0.1522 -0.1566 -0.1482 -0.1560.0317 0.0331 0.0306 0.0319
-0.1116 -0.1237 -0.1185 -0.12470.0453 0.0473 0.0435 0.04540.1512 0.1041 0.1497 0.10120.0265 0.031 0.0259 0.0304
0 2044 0 2192
Panel B: Regression for matched sampleTable 6
Predicted Sign
?
+
SOX1
Dependent Variable = ln(Audit Costi,t/Audit Costi,t-1)
Intercept
rev
rev*Dec_Dummy
-
MW
lag(rev)
lag(rev)*lag(Dec_Dummy)
?
Robust Regression
?
+
SOX3
SOX2
+
?
+
)2(*3*2*13
21_)ln()ln(
_)ln()ln()ln(
,
,,11,,10,,9,8,7
,6,51,2,
1,4
2,
1,3
,1,
,2
1,
,1
1,
,
ti
titititititititi
titititi
ti
ti
ti
titi
ti
ti
titj
ti
ti
MWSOXMWSOXMWSOXMWSOX
SOXSOXDummyDecreaseSalesSales
SalesSales
DummyDecreaseSalesSales
SalesSales
AuditAudit
ε
βββββ
ββββ
ββββ
+
+++++
++×++
×+++=
−−
−
−
−
−−−
0.2044 0.21920.0653 0.06360.0785 0.10280.0932 0.08860.1686 0.10540.1304 0.1259
Industry Indicator Yes Yes Yes YesYear Indicator Yes Yes Yes Yes
N 3137 3137 3063 3063Adjusted R2 8.99% 9.08% 10.55% 10.66%
Model:
This table contains matched sample of 770 Section 404 filers and non- filers from years 2000-2007. SOX1 is an indicator variable equal to 1 if it is the first year of Section 404 compliance similarly SOX2 and SOX3 are indicator variabled equal to 1 if it is the second or third year of Section 404 compliance. MW is an indicator equal to 1 if the firm disclosed a Material Weakness in Internal Control in its Section 302/404 report for the given year. For definition of all other variables please refer to Table 1.
+
+SOX3*MW
SOX2*MW +
SOX1 * MW
)2(*3*2*13
21_)ln()ln(
_)ln()ln()ln(
,
,,11,,10,,9,8,7
,6,51,2,
1,4
2,
1,3
,1,
,2
1,
,1
1,
,
ti
titititititititi
titititi
ti
ti
ti
titi
ti
ti
titj
ti
ti
MWSOXMWSOXMWSOXMWSOX
SOXSOXDummyDecreaseSalesSales
SalesSales
DummyDecreaseSalesSales
SalesSales
AuditAudit
ε
βββββ
ββββ
ββββ
+
+++++
++×++
×+++=
−−
−
−
−
−−−
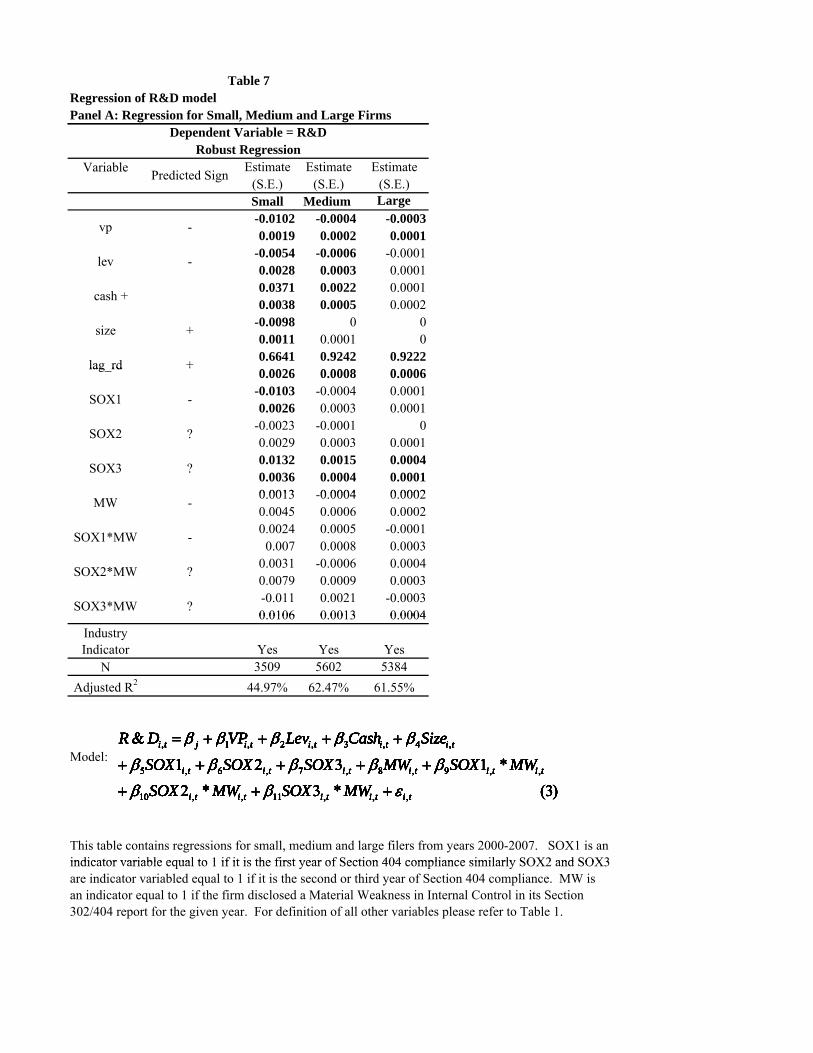
Table 7Regression of R&D modelPanel A: Regression for Small, Medium and Large Firms
)3(*3*2*1321
&
,,,11,,10
,,9,8,7,6,5
,4,3,2,1,
tititititi
titititititi
titititijti
MWSOXMWSOXMWSOXMWSOXSOXSOX
SizeCashLevVPDR
εβββββββ
βββββ
+++
+++++
++++=
Variable Estimate Estimate Estimate(S.E.) (S.E.) (S.E.)Small Medium Large-0.0102 -0.0004 -0.00030.0019 0.0002 0.0001
Predicted Sign
vp -
Robust RegressionDependent Variable = R&D
g , g
)3(*3*2*1321
&
,,,11,,10
,,9,8,7,6,5
,4,3,2,1,
tititititi
titititititi
titititijti
MWSOXMWSOXMWSOXMWSOXSOXSOX
SizeCashLevVPDR
εβββββββ
βββββ
+++
+++++
++++=
-0.0054 -0.0006 -0.00010.0028 0.0003 0.00010.0371 0.0022 0.00010.0038 0.0005 0.0002
-0.0098 0 00.0011 0.0001 00.6641 0.9242 0.92220 0026 0 0008 0 0006
lev -
size +
lag rd
cash +
+
)3(*3*2*1321
&
,,,11,,10
,,9,8,7,6,5
,4,3,2,1,
tititititi
titititititi
titititijti
MWSOXMWSOXMWSOXMWSOXSOXSOX
SizeCashLevVPDR
εβββββββ
βββββ
+++
+++++
++++=
0.0026 0.0008 0.0006-0.0103 -0.0004 0.00010.0026 0.0003 0.0001
-0.0023 -0.0001 00.0029 0.0003 0.00010.0132 0.0015 0.00040.0036 0.0004 0.00010 0013 0 0004 0 0002
SOX1 -
lag_rd +
SOX2 ?
SOX3 ?
)3(*3*2*1321
&
,,,11,,10
,,9,8,7,6,5
,4,3,2,1,
tititititi
titititititi
titititijti
MWSOXMWSOXMWSOXMWSOXSOXSOX
SizeCashLevVPDR
εβββββββ
βββββ
+++
+++++
++++=
0.0013 -0.0004 0.00020.0045 0.0006 0.00020.0024 0.0005 -0.0001
0.007 0.0008 0.00030.0031 -0.0006 0.00040.0079 0.0009 0.0003-0.011 0.0021 -0.00030 0106 0 0013 0 0004
SOX3*MW ?
SOX1*MW
SOX2*MW ?
-
MW -
)3(*3*2*1321
&
,,,11,,10
,,9,8,7,6,5
,4,3,2,1,
tititititi
titititititi
titititijti
MWSOXMWSOXMWSOXMWSOXSOXSOX
SizeCashLevVPDR
εβββββββ
βββββ
+++
+++++
++++=
0.0106 0.0013 0.0004Industry Indicator Yes Yes Yes
N 3509 5602 5384Adjusted R2 44.97% 62.47% 61.55%
)3(*3*2*1321
&
,,,11,,10
,,9,8,7,6,5
,4,3,2,1,
tititititi
titititititi
titititijti
MWSOXMWSOXMWSOXMWSOXSOXSOX
SizeCashLevVPDR
εβββββββ
βββββ
+++
+++++
++++=Model:
This table contains regressions for small, medium and large filers from years 2000-2007. SOX1 is an indicator variable equal to 1 if it is the first year of Section 404 compliance similarly SOX2 and SOX3
)3(*3*2*1321
&
,,,11,,10
,,9,8,7,6,5
,4,3,2,1,
tititititi
titititititi
titititijti
MWSOXMWSOXMWSOXMWSOXSOXSOX
SizeCashLevVPDR
εβββββββ
βββββ
+++
+++++
++++=
indicator variable equal to 1 if it is the first year of Section 404 compliance similarly SOX2 and SOX3 are indicator variabled equal to 1 if it is the second or third year of Section 404 compliance. MW is an indicator equal to 1 if the firm disclosed a Material Weakness in Internal Control in its Section 302/404 report for the given year. For definition of all other variables please refer to Table 1.
)3(*3*2*1321
&
,,,11,,10
,,9,8,7,6,5
,4,3,2,1,
tititititi
titititititi
titititijti
MWSOXMWSOXMWSOXMWSOXSOXSOX
SizeCashLevVPDR
εβββββββ
βββββ
+++
+++++
++++=
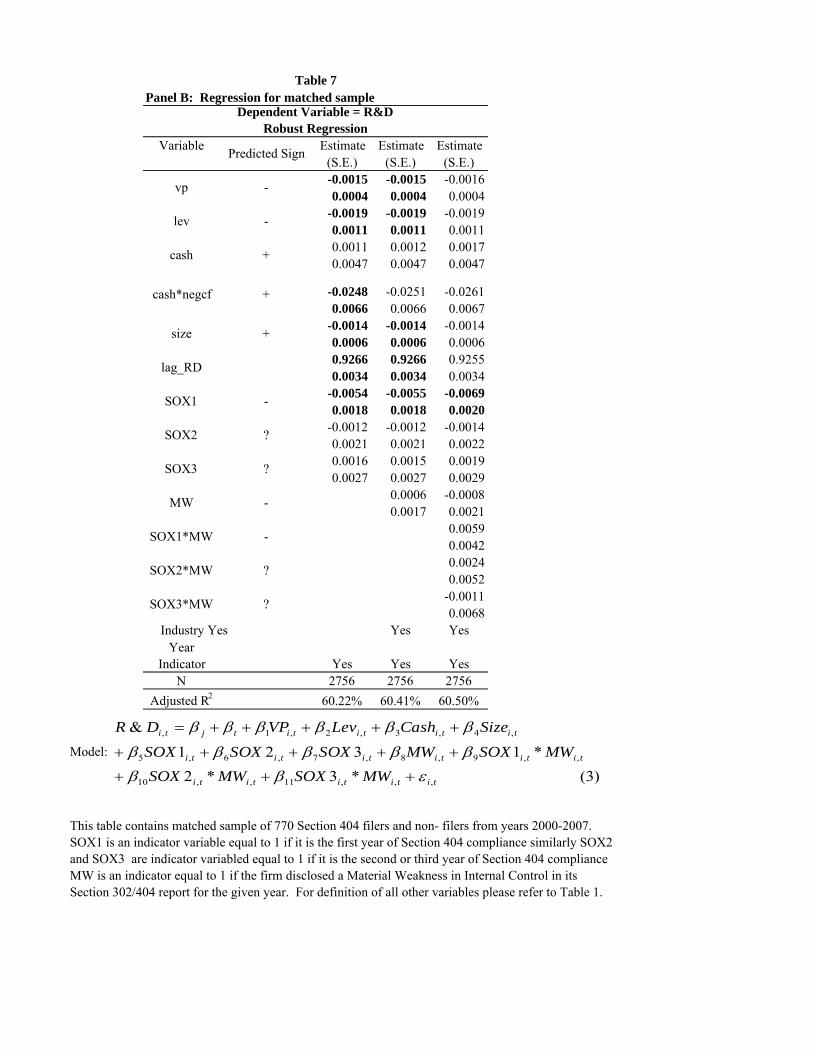
Variable Estimate Estimate Estimate(S.E.) (S.E.) (S.E.)-0.0015 -0.0015 -0.00160.0004 0.0004 0.0004
-0.0019 -0.0019 -0.00190.0011 0.0011 0.00110.0011 0.0012 0.00170.0047 0.0047 0.0047
-0.0248 -0.0251 -0.02610.0066 0.0066 0.0067
-0.0014 -0.0014 -0.00140.0006 0.0006 0.00060.9266 0.9266 0.92550.0034 0.0034 0.0034
-0.0054 -0.0055 -0.00690.0018 0.0018 0.0020
-0.0012 -0.0012 -0.00140.0021 0.0021 0.00220.0016 0.0015 0.00190.0027 0.0027 0.0029
0.0006 -0.00080.0017 0.0021
0.00590.00420.00240.0052
-0.00110.0068
Industry Yes Yes YesYear
Indicator Yes Yes YesN 2756 2756 2756
Adjusted R2 60.22% 60.41% 60.50%
Model:
Panel B: Regression for matched sampleTable 7
-
lag_RD
Dependent Variable = R&D Robust Regression
cash*negcf
size
Predicted Sign
+
+
vp -
-
-
lev
cash
SOX1
SOX3
+
MW
SOX2
?
?
This table contains matched sample of 770 Section 404 filers and non- filers from years 2000-2007. SOX1 is an indicator variable equal to 1 if it is the first year of Section 404 compliance similarly SOX2 and SOX3 are indicator variabled equal to 1 if it is the second or third year of Section 404 complianceMW is an indicator equal to 1 if the firm disclosed a Material Weakness in Internal Control in its Section 302/404 report for the given year. For definition of all other variables please refer to Table 1.
-
?
SOX1*MW
SOX3*MW
SOX2*MW ?
)3(*3*2*1321
&
,,,11,,10
,,9,8,7,6,5
,4,3,2,1,
tititititi
titititititi
tititititjti
MWSOXMWSOXMWSOXMWSOXSOXSOX
SizeCashLevVPDR
εβββββββ
ββββββ
+++
+++++
+++++=
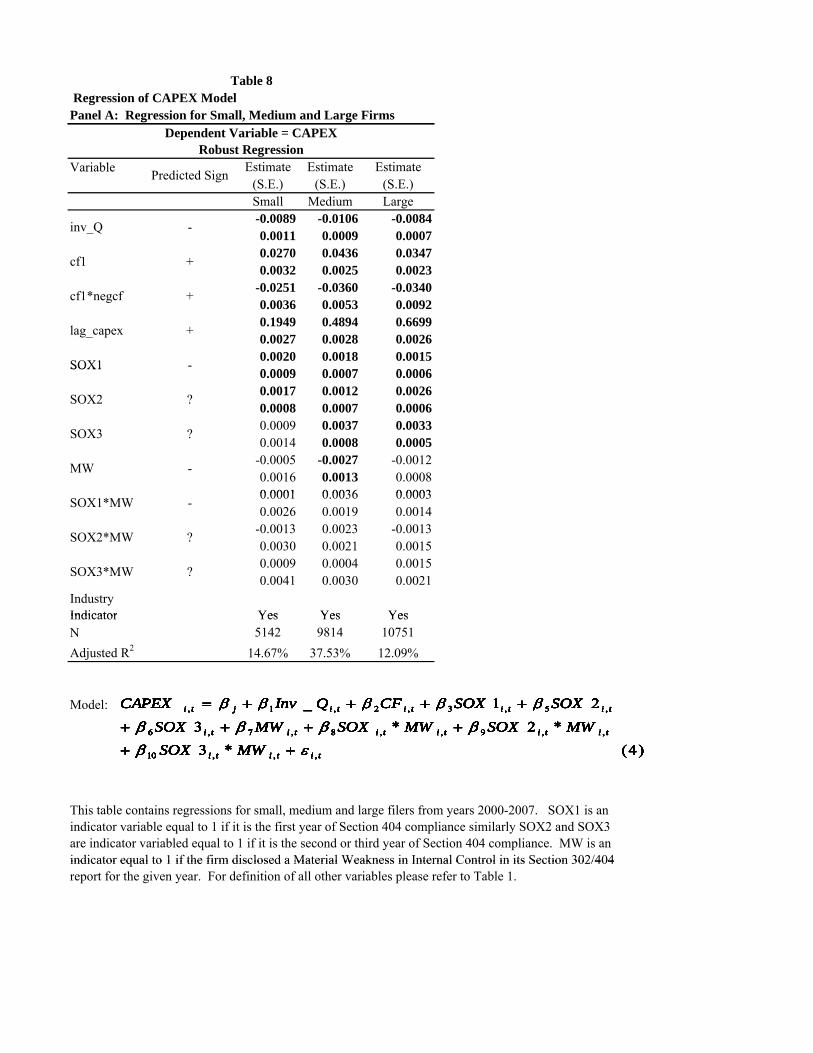
Panel A: Regression for Small, Medium and Large Firms Regression of CAPEX Model
Table 8
)4(*3*2*3
21_
,,,10
,,9,,8,7,6
,5,3,2,1,
tititi
titititititi
titititijti
MWSOXMWSOXMWSOXMWSOX
SOXSOXCFQInvCAPEX
εβββββ
βββββ
++
++++
++++=
Variable Estimate Estimate Estimate(S.E.) (S.E.) (S.E.)Small Medium Large-0.0089 -0.0106 -0.00840.0011 0.0009 0.0007
inv_Q
g , gDependent Variable = CAPEX
Robust Regression
Predicted Sign
-
)4(*3*2*3
21_
,,,10
,,9,,8,7,6
,5,3,2,1,
tititi
titititititi
titititijti
MWSOXMWSOXMWSOXMWSOX
SOXSOXCFQInvCAPEX
εβββββ
βββββ
++
++++
++++=
0.0270 0.0436 0.03470.0032 0.0025 0.0023
-0.0251 -0.0360 -0.03400.0036 0.0053 0.00920.1949 0.4894 0.66990.0027 0.0028 0.00260.0020 0.0018 0.00150 0009 0 0007 0 0006
lag_capex +
+
cf1
cf1*negcf
SOX1 -
+
)4(*3*2*3
21_
,,,10
,,9,,8,7,6
,5,3,2,1,
tititi
titititititi
titititijti
MWSOXMWSOXMWSOXMWSOX
SOXSOXCFQInvCAPEX
εβββββ
βββββ
++
++++
++++=
0.0009 0.0007 0.00060.0017 0.0012 0.00260.0008 0.0007 0.00060.0009 0.0037 0.00330.0014 0.0008 0.0005
-0.0005 -0.0027 -0.00120.0016 0.0013 0.00080 0001 0 0036 0 0003
SOX3 ?
MW -
SOX2 ?
SOX1
)4(*3*2*3
21_
,,,10
,,9,,8,7,6
,5,3,2,1,
tititi
titititititi
titititijti
MWSOXMWSOXMWSOXMWSOX
SOXSOXCFQInvCAPEX
εβββββ
βββββ
++
++++
++++=
0.0001 0.0036 0.00030.0026 0.0019 0.0014
-0.0013 0.0023 -0.00130.0030 0.0021 0.00150.0009 0.0004 0.00150.0041 0.0030 0.0021
Industry Indicator Yes Yes Yes
SOX3*MW ?
SOX1*MW -
SOX2*MW ?
)4(*3*2*3
21_
,,,10
,,9,,8,7,6
,5,3,2,1,
tititi
titititititi
titititijti
MWSOXMWSOXMWSOXMWSOX
SOXSOXCFQInvCAPEX
εβββββ
βββββ
++
++++
++++=
Indicator Yes Yes YesN 5142 9814 10751Adjusted R2 14.67% 37.53% 12.09%
Model:
)4(*3*2*3
21_
,,,10
,,9,,8,7,6
,5,3,2,1,
tititi
titititititi
titititijti
MWSOXMWSOXMWSOXMWSOX
SOXSOXCFQInvCAPEX
εβββββ
βββββ
++
++++
++++=
This table contains regressions for small, medium and large filers from years 2000-2007. SOX1 is an indicator variable equal to 1 if it is the first year of Section 404 compliance similarly SOX2 and SOX3 are indicator variabled equal to 1 if it is the second or third year of Section 404 compliance. MW is an indicator equal to 1 if the firm disclosed a Material Weakness in Internal Control in its Section 302/404
)4(*3*2*3
21_
,,,10
,,9,,8,7,6
,5,3,2,1,
tititi
titititititi
titititijti
MWSOXMWSOXMWSOXMWSOX
SOXSOXCFQInvCAPEX
εβββββ
βββββ
++
++++
++++=
indicator equal to 1 if the firm disclosed a Material Weakness in Internal Control in its Section 302/404 report for the given year. For definition of all other variables please refer to Table 1.
)4(*3*2*3
21_
,,,10
,,9,,8,7,6
,5,3,2,1,
tititi
titititititi
titititijti
MWSOXMWSOXMWSOXMWSOX
SOXSOXCFQInvCAPEX
εβββββ
βββββ
++
++++
++++=
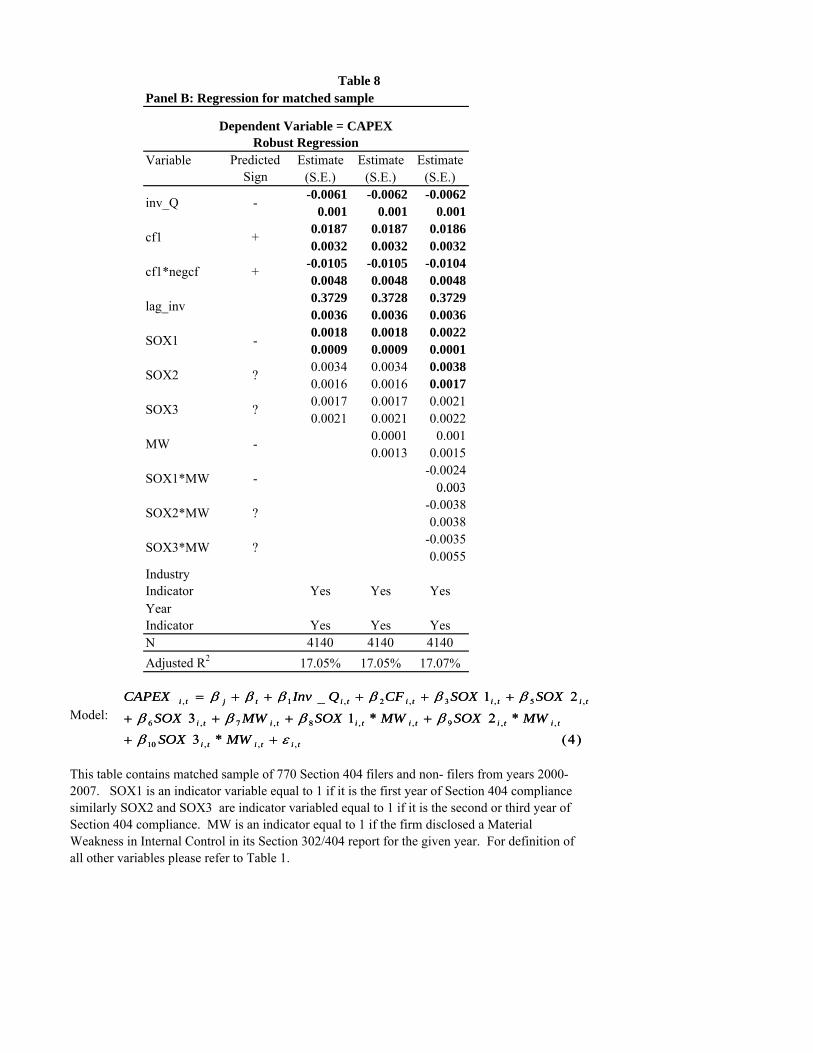
Variable Estimate Estimate Estimate(S.E.) (S.E.) (S.E.)-0.0061 -0.0062 -0.0062
0.001 0.001 0.0010.0187 0.0187 0.01860.0032 0.0032 0.0032
-0.0105 -0.0105 -0.01040.0048 0.0048 0.00480.3729 0.3728 0.37290.0036 0.0036 0.00360.0018 0.0018 0.00220.0009 0.0009 0.00010.0034 0.0034 0.00380.0016 0.0016 0.00170.0017 0.0017 0.00210.0021 0.0021 0.0022
0.0001 0.0010.0013 0.0015
-0.00240.003
Panel B: Regression for matched sampleTable 8
Dependent Variable = CAPEX Robust Regression
SOX3
?
-
Predicted Sign
-
?
-MW
cf1*negcf
lag_inv
inv_Q
+
+
SOX1*MW
SOX1
SOX2
-
cf1
)4(*3*2*13
21_
,,,10
,,9,,8,7,6
,5,3,2,1,
tititi
titititititi
tititititjti
MWSOXMWSOXMWSOXMWSOX
SOXSOXCFQInvCAPEX
εβββββ
ββββββ
++
++++
+++++=
0.003-0.00380.0038
-0.00350.0055
Industry Indicator Yes Yes YesYear Indicator Yes Yes YesN 4140 4140 4140Adjusted R2 17.05% 17.05% 17.07%
Model:
This table contains matched sample of 770 Section 404 filers and non- filers from years 2000-2007. SOX1 is an indicator variable equal to 1 if it is the first year of Section 404 compliance similarly SOX2 and SOX3 are indicator variabled equal to 1 if it is the second or third year of Section 404 compliance. MW is an indicator equal to 1 if the firm disclosed a Material Weakness in Internal Control in its Section 302/404 report for the given year. For definition of all other variables please refer to Table 1.
SOX2*MW
SOX3*MW ?
?
)4(*3*2*13
21_
,,,10
,,9,,8,7,6
,5,3,2,1,
tititi
titititititi
tititititjti
MWSOXMWSOXMWSOXMWSOX
SOXSOXCFQInvCAPEX
εβββββ
ββββββ
++
++++
+++++=
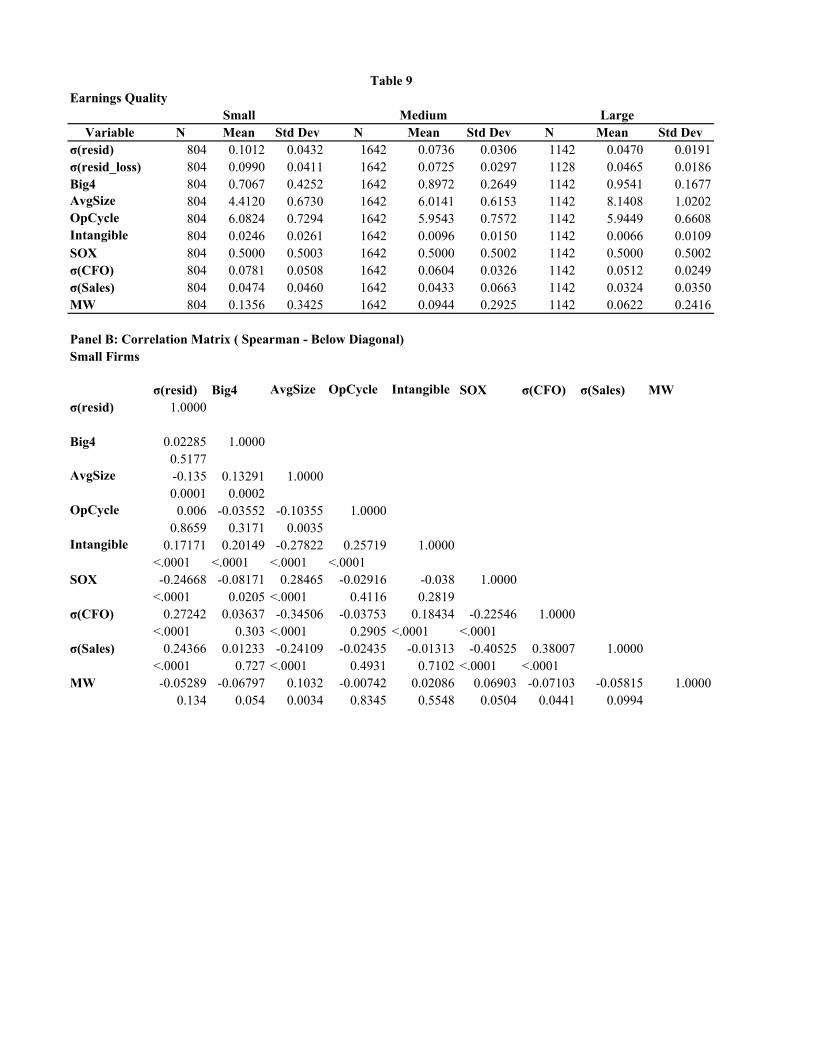
Variable N Mean Std Dev N Mean Std Dev N Mean Std Devσ(resid) 804 0.1012 0.0432 1642 0.0736 0.0306 1142 0.0470 0.0191σ(resid_loss) 804 0.0990 0.0411 1642 0.0725 0.0297 1128 0.0465 0.0186Big4 804 0.7067 0.4252 1642 0.8972 0.2649 1142 0.9541 0.1677AvgSize 804 4.4120 0.6730 1642 6.0141 0.6153 1142 8.1408 1.0202OpCycle 804 6.0824 0.7294 1642 5.9543 0.7572 1142 5.9449 0.6608Intangible 804 0.0246 0.0261 1642 0.0096 0.0150 1142 0.0066 0.0109SOX 804 0.5000 0.5003 1642 0.5000 0.5002 1142 0.5000 0.5002σ(CFO) 804 0.0781 0.0508 1642 0.0604 0.0326 1142 0.0512 0.0249σ(Sales) 804 0.0474 0.0460 1642 0.0433 0.0663 1142 0.0324 0.0350MW 804 0.1356 0.3425 1642 0.0944 0.2925 1142 0.0622 0.2416
Small Firms
σ(resid) Big4 AvgSize OpCycle Intangible SOX σ(CFO) σ(Sales) MWσ(resid) 1.0000
Big4 0.02285 1.00000.5177
AvgSize -0.135 0.13291 1.00000.0001 0.0002
OpCycle 0.006 -0.03552 -0.10355 1.00000.8659 0.3171 0.0035
Intangible 0.17171 0.20149 -0.27822 0.25719 1.0000<.0001 <.0001 <.0001 <.0001
SOX -0.24668 -0.08171 0.28465 -0.02916 -0.038 1.0000<.0001 0.0205 <.0001 0.4116 0.2819
σ(CFO) 0.27242 0.03637 -0.34506 -0.03753 0.18434 -0.22546 1.0000<.0001 0.303 <.0001 0.2905 <.0001 <.0001
σ(Sales) 0.24366 0.01233 -0.24109 -0.02435 -0.01313 -0.40525 0.38007 1.0000<.0001 0.727 <.0001 0.4931 0.7102 <.0001 <.0001
MW -0.05289 -0.06797 0.1032 -0.00742 0.02086 0.06903 -0.07103 -0.05815 1.00000.134 0.054 0.0034 0.8345 0.5548 0.0504 0.0441 0.0994
Panel B: Correlation Matrix ( Spearman - Below Diagonal)
Small Medium LargeEarnings Quality
Table 9
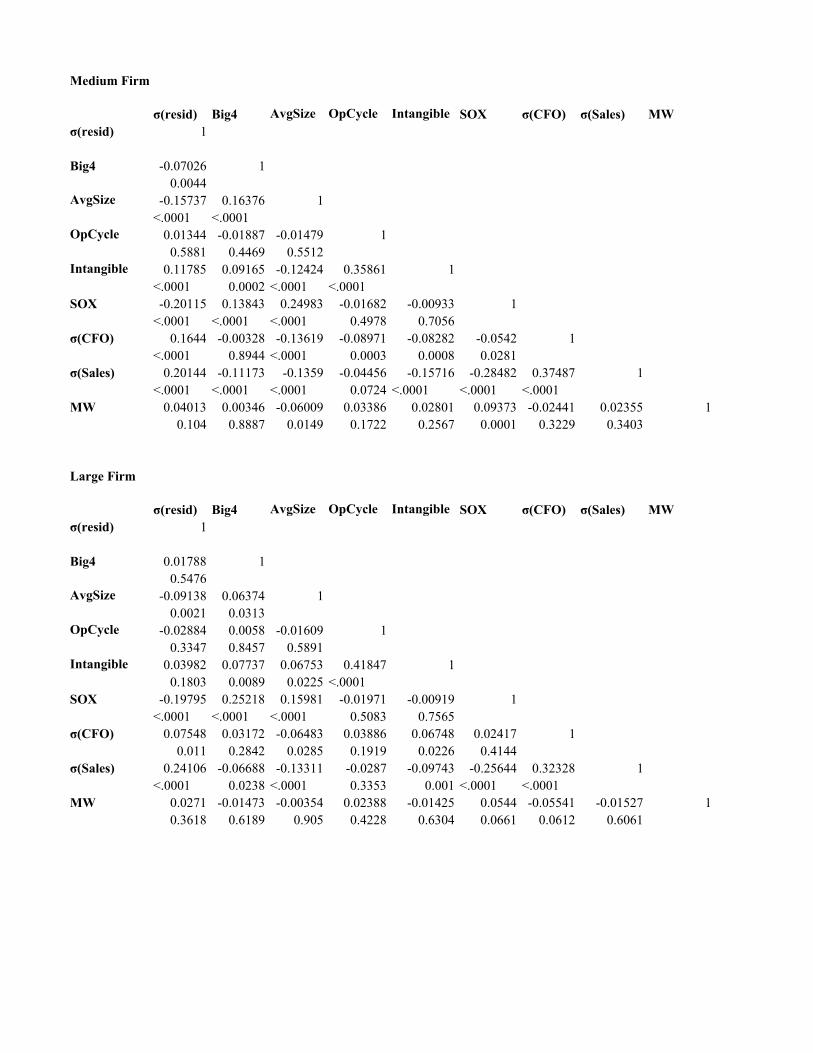
Medium Firm
σ(resid) Big4 AvgSize OpCycle Intangible SOX σ(CFO) σ(Sales) MWσ(resid) 1
Big4 -0.07026 10.0044
AvgSize -0.15737 0.16376 1<.0001 <.0001
OpCycle 0.01344 -0.01887 -0.01479 10.5881 0.4469 0.5512
Intangible 0.11785 0.09165 -0.12424 0.35861 1<.0001 0.0002 <.0001 <.0001
SOX -0.20115 0.13843 0.24983 -0.01682 -0.00933 1<.0001 <.0001 <.0001 0.4978 0.7056
σ(CFO) 0.1644 -0.00328 -0.13619 -0.08971 -0.08282 -0.0542 1<.0001 0.8944 <.0001 0.0003 0.0008 0.0281
σ(Sales) 0.20144 -0.11173 -0.1359 -0.04456 -0.15716 -0.28482 0.37487 1<.0001 <.0001 <.0001 0.0724 <.0001 <.0001 <.0001
MW 0.04013 0.00346 -0.06009 0.03386 0.02801 0.09373 -0.02441 0.02355 10.104 0.8887 0.0149 0.1722 0.2567 0.0001 0.3229 0.3403
Large Firm
σ(resid) Big4 AvgSize OpCycle Intangible SOX σ(CFO) σ(Sales) MWσ(resid) 1
Big4 0.01788 10.5476
AvgSize -0.09138 0.06374 10.0021 0.0313
OpCycle -0.02884 0.0058 -0.01609 10.3347 0.8457 0.5891
Intangible 0.03982 0.07737 0.06753 0.41847 10.1803 0.0089 0.0225 <.0001
SOX -0.19795 0.25218 0.15981 -0.01971 -0.00919 1<.0001 <.0001 <.0001 0.5083 0.7565
σ(CFO) 0.07548 0.03172 -0.06483 0.03886 0.06748 0.02417 10.011 0.2842 0.0285 0.1919 0.0226 0.4144
σ(Sales) 0.24106 -0.06688 -0.13311 -0.0287 -0.09743 -0.25644 0.32328 1<.0001 0.0238 <.0001 0.3353 0.001 <.0001 <.0001
MW 0.0271 -0.01473 -0.00354 0.02388 -0.01425 0.0544 -0.05541 -0.01527 10.3618 0.6189 0.905 0.4228 0.6304 0.0661 0.0612 0.6061
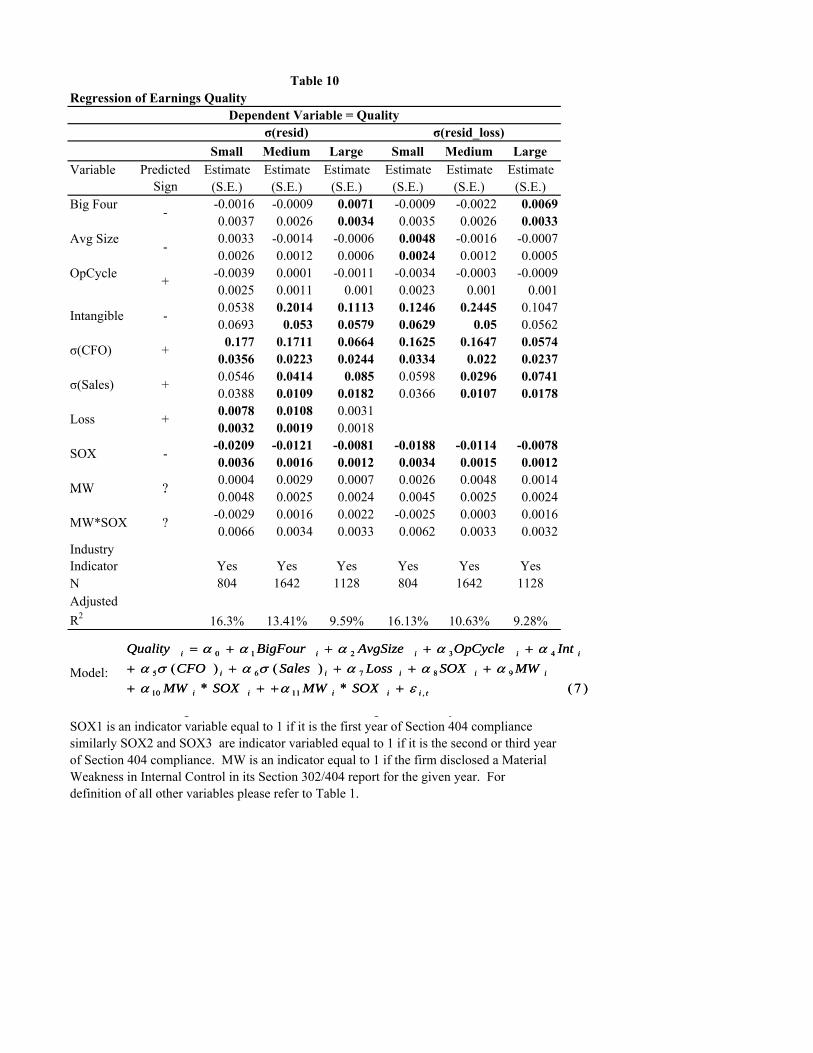
Small Medium Large Small Medium LargeVariable Estimate Estimate Estimate Estimate Estimate Estimate
(S.E.) (S.E.) (S.E.) (S.E.) (S.E.) (S.E.)Big Four -0.0016 -0.0009 0.0071 -0.0009 -0.0022 0.0069
0.0037 0.0026 0.0034 0.0035 0.0026 0.0033Avg Size 0.0033 -0.0014 -0.0006 0.0048 -0.0016 -0.0007
0.0026 0.0012 0.0006 0.0024 0.0012 0.0005OpCycle -0.0039 0.0001 -0.0011 -0.0034 -0.0003 -0.0009
0.0025 0.0011 0.001 0.0023 0.001 0.0010.0538 0.2014 0.1113 0.1246 0.2445 0.10470.0693 0.053 0.0579 0.0629 0.05 0.0562
0.177 0.1711 0.0664 0.1625 0.1647 0.05740.0356 0.0223 0.0244 0.0334 0.022 0.02370.0546 0.0414 0.085 0.0598 0.0296 0.07410.0388 0.0109 0.0182 0.0366 0.0107 0.01780.0078 0.0108 0.00310.0032 0.0019 0.0018
-0.0209 -0.0121 -0.0081 -0.0188 -0.0114 -0.00780.0036 0.0016 0.0012 0.0034 0.0015 0.00120.0004 0.0029 0.0007 0.0026 0.0048 0.00140 0048 0 0025 0 0024 0 0045 0 0025 0 0024
Regression of Earnings Quality
Predicted Sign
-
-
+
Table 10
Intangible -
σ(CFO) +
σ(Sales) +
Loss +
Dependent Variable = Quality σ(resid) σ(resid_loss)
SOX -
MW ?
)7(**)()(
,1110
98765
43210
tiiiii
iiiii
iiiii
SOXMWSOXMWMWSOXLossSalesCFO
IntOpCycleAvgSizeBigFourQuality
εααααασασα
ααααα
+++++++++
++++=
0.0048 0.0025 0.0024 0.0045 0.0025 0.0024-0.0029 0.0016 0.0022 -0.0025 0.0003 0.00160.0066 0.0034 0.0033 0.0062 0.0033 0.0032
Industry Indicator Yes Yes Yes Yes Yes YesN 804 1642 1128 804 1642 1128Adjusted R2 16.3% 13.41% 9.59% 16.13% 10.63% 9.28%
Model:
MW*SOX ?
g , g ySOX1 is an indicator variable equal to 1 if it is the first year of Section 404 compliance similarly SOX2 and SOX3 are indicator variabled equal to 1 if it is the second or third year of Section 404 compliance. MW is an indicator equal to 1 if the firm disclosed a Material Weakness in Internal Control in its Section 302/404 report for the given year. For definition of all other variables please refer to Table 1.
MW ?
)7(**)()(
,1110
98765
43210
tiiiii
iiiii
iiiii
SOXMWSOXMWMWSOXLossSalesCFO
IntOpCycleAvgSizeBigFourQuality
εααααασασα
ααααα
+++++++++
++++=