Embed Size (px)
Citation preview
Galaxy Masses as Constraints of Formation ModelsProceedings IAU Symposium No. 311, 2014M. Cappellari & S. Courteau, eds.
c© International Astronomical Union 2015doi:10.1017/S1743921315003488
The SAMI Galaxy Survey: early data releaseand first science
Scott M. Croom1,2, James T. Allen1,2, Luca Cortese3, Lisa Fogarty1,2,I-Ting Ho4 and the SAMI Galaxy Survey Team5
1 Sydney Institute for Astronomy (SIfA), School of Physics, The University of Sydney, NSW2006, Australia
2 ARC Centre of Excellence for All-sky Astrophysics (CAASTRO)3 Centre for Astrophysics & Supercomputing, Swinburne University of Technology, Hawthorn,
Vic 3122, Australia4 Institute for Astronomy, University of Hawaii, 2680 Woodlawn Drive, Honolulu, HI 96822,
USA5 Full list of team members is available at http://sami-survey.org/members
Email: [email protected]
Abstract. The Sydney–AAO Multi-object Integral field spectrograph (SAMI) Galaxy Surveyis an ongoing project to obtain spatially resolved spectroscopic observations of ∼3400 galaxiesby mid-2016. To date, a total of ∼1000 galaxies have been observed, making the SAMI GalaxySurvey the largest integral field survey in existence. In July 2014 the early data release for theSAMI galaxy Survey occurred, with over 100 galaxies available to the community. The richnessof the SAMI dataset allows a vast array of science. We highlight some of the early science resultsfrom the project, including the discovery and analysis of galactic winds, the distribution of fastand slow rotating early type galaxies, and the unification of galaxy scaling relations.
Keywords. galaxies: evolution – galaxies: kinematics and dynamics – galaxies: structure –techniques: imaging spectroscopy
1. IntroductionHighly multiplexed spectroscopic galaxy surveys, such as the 2dF Galaxy Survey (Col-
less et al. 2001), the Sloan Digital Sky Survey (SDSS; York et al. 2000) and the GalaxyAnd Mass Assembly (GAMA; Driver et al. 2011) survey, are powerful tools for investi-gating galaxy evolution. However, they are limited by only observing a single aperturein the centre of each galaxy, so are inherently unable to investigate the spatially dis-tributed properties of galaxies. Integral field spectrographs (IFSs) provide this missinginformation. The spatially resolved spectroscopic data produced by an IFS can be usedto measure an enormous range of quantities, including the kinematics of gas and stars,spatially varying ionization states, stellar age and metallicity distributions, the locationof current star formation and much more. Until recently, technical limitations made IFSobservations of large samples time-consuming, as each object was targeted one at a time.Despite this, spectacular scientific progress has been made with samples such as ATLAS-3D (Cappellari et al. 2011) and CALIFA (Sanchez et al. 2012).
A major leap forward is now possible due to instruments that can make IFS obser-vations of multiple objects at once. The Sydney–AAO Multi-object Integral field spec-trograph (SAMI) is one of the first instruments in this class, with thirteen 15′′diameterintegral field units (IFUs) deployed across a 1-degree field (Croom et al. 2012). EachIFU consists of a bundle of 61 optical fibres lightly fused to have a high (∼75%) fillingfactor (Bryant et al. 2014a). SAMI is installed on the 3.9-m Anglo-Australian Telescope,feeding the existing AAOmega spectrograph (Sharp et al. 2006).
104
https://www.cambridge.org/core/terms. https://doi.org/10.1017/S1743921315003488Downloaded from https://www.cambridge.org/core. IP address: 65.21.228.167, on 12 Feb 2022 at 11:47:35, subject to the Cambridge Core terms of use, available at
The SAMI Galaxy Survey: early data release and first science 105
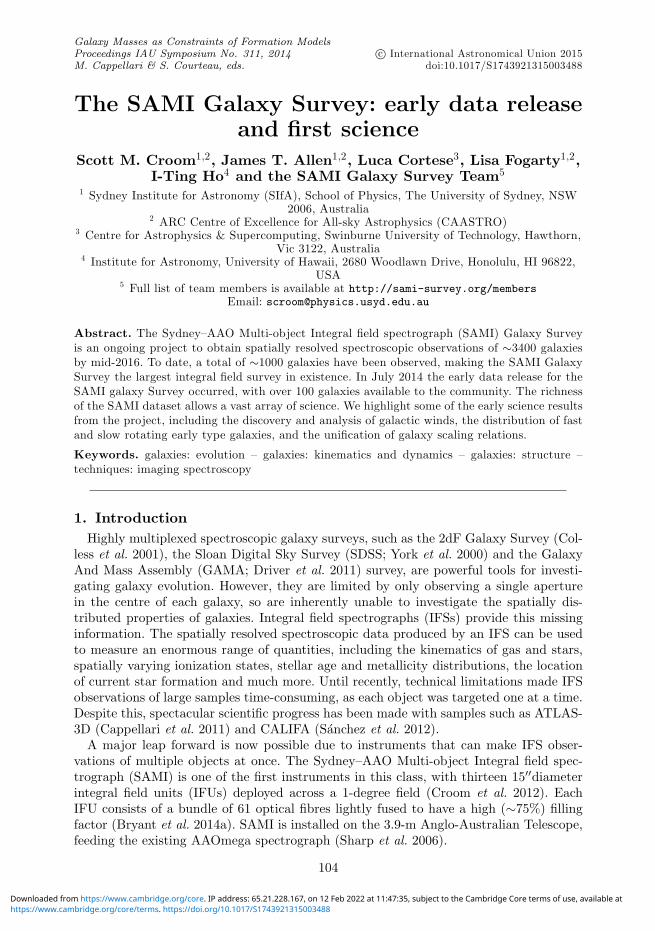
Figure 1. Stellar mass and redshift for all galaxies in the GAMA regions of the SAMI GalaxySurvey (black points) and those in the EDR sample (red circles). The area above the blueboundary indicates the primary sample, while the shaded regions indicate lower-priority targets.
2. The SAMI Galaxy SurveyThe SAMI Galaxy Survey will obtain integral field spectroscopic data for ∼3400 galax-
ies, with an expected completion date of mid-2016. At the time of writing, ∼1000 galaxieshave been observed, including the pilot survey of ∼100 galaxies. The overarching sciencequestions for the project are:• What are the primary physical mechanisms causing environmental suppression of
star formation and morphological changes in galaxies?• How common are inflows and outflows of gas and how do they influence galaxy
properties?• How is angular momentum distributed in the galaxy population and how is mass
built up?AAOmega is a double-beam spectrograph, and for our project we use a 580V grat-
ing in the blue arm, giving a resolution R ∼ 1700 over 3700–5700A, while the 1000Rgrating in the red arm results in R ∼ 4500 over 6300–7400A. This setup provides anexcellent balance, accessing the many emission and absorption features in the blue, butalso providing enhanced resolution around the Hα and [N II] emission lines in the red.
The target galaxies for the SAMI Galaxy Survey are split into two samples: a volume-limited field and group sample from the Galaxy And Mass Assembly (GAMA; Driveret al. 2011) survey G09, G12 and G15 fields (see Fig. 1), and a cluster sample from a setof eight galaxy clusters. The inclusion of a dedicated cluster sample extends the rangeof environmental densities to higher values than a simple mass- or luminosity-selectedsample of galaxies would provide. Full details of the target selection are provided byBryant et al. (2014b).
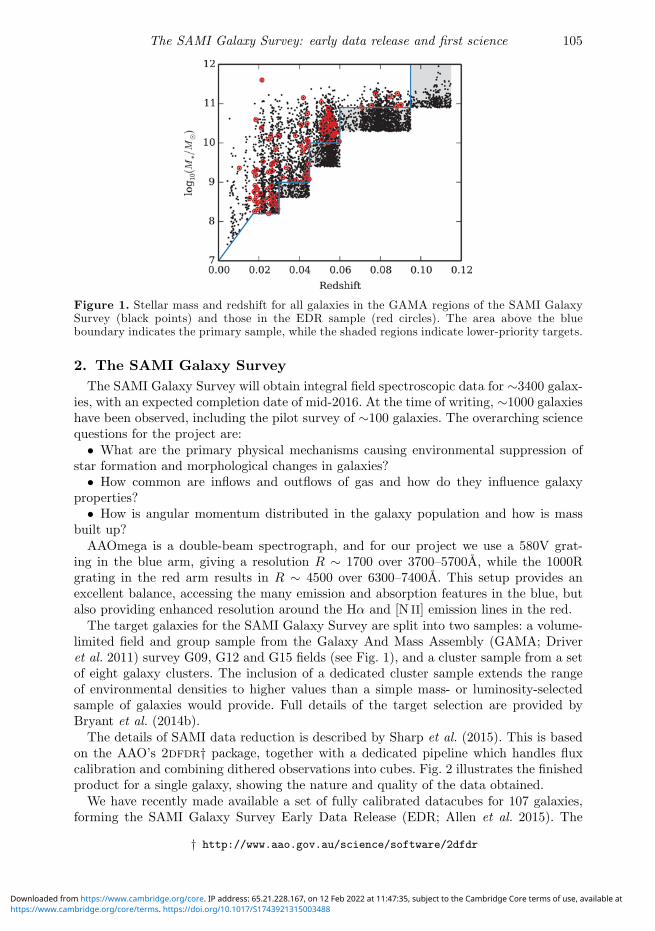
The details of SAMI data reduction is described by Sharp et al. (2015). This is basedon the AAO’s 2dfdr† package, together with a dedicated pipeline which handles fluxcalibration and combining dithered observations into cubes. Fig. 2 illustrates the finishedproduct for a single galaxy, showing the nature and quality of the data obtained.
We have recently made available a set of fully calibrated datacubes for 107 galaxies,forming the SAMI Galaxy Survey Early Data Release (EDR; Allen et al. 2015). The
† http://www.aao.gov.au/science/software/2dfdr
https://www.cambridge.org/core/terms. https://doi.org/10.1017/S1743921315003488Downloaded from https://www.cambridge.org/core. IP address: 65.21.228.167, on 12 Feb 2022 at 11:47:35, subject to the Cambridge Core terms of use, available at
106 S. M. Croom et al.
Figure 2. Example SAMI data for the galaxy 511867, with z = 0.05523 and M∗ = 1010 .68M�.Upper panel: flux for a central spaxel (blue) and one 4” to the North (red). Lower panels, fromleft to right: SDSS gri image; continuum flux map (10−16 erg s−1 cm−2 A−1 ); stellar velocityfield (km s−1 ); Hα flux map (10−16 erg s−1 cm−2 ); Hα velocity field (km s−1 ). The two velocityfields are each scaled individually. Each panel is 18′′ square, with North up and East to the left.The grey circle in the second panel shows the FWHM of the PSF.
galaxies were selected from the GAMA regions of the survey. Also available are thedatacubes of the corresponding secondary standard stars and a table of ancillary dataincluding quantities such as stellar mass, effective radius and surface brightness. All datacan be downloaded from the SAMI Galaxy Survey EDR website‡.
3. First ScienceEarly science investigations have included studies such as detailed diagnostics of galac-
tic winds (Fogarty et al. 2012; Ho et al. 2014), study of the kinematic morphology–densityrelation in clusters (Fogarty et al. 2014), star formation in dwarf galaxies (Richards et al.2014) and new analysis of galaxy scaling relations (Cortese et al. 2014). Other ongoingwork includes studies of spatially resolved star formation and how it is modulated withenvironment, dynamical mass estimates and the fundamental plane, radial age gradientsand much more. Here we highlight just a few of the recent results.
3.1. Decomposing a star-burst driven windThe high spectral resolution of SAMI data in the red arm of AAOmega makes it anexcellent probe of complex kinematic structure. Recently Ho et al. (2014) demonstratedthis, using SAMI to discover and analyse a star-burst driven wind in an isolated diskgalaxy. There are multiple kinematics components within this galaxy, which shows (1)a narrow kinematic component consistent with HII regions, (2) a broad kinematic com-ponent consistent with shock excitation, and (3) an intermediate component consistentwith shock and photoionisation mixing. The three kinematic components have distinctvelocity fields, velocity dispersions, line ratios, and electron densities (see Fig. 3). Thebipolar galactic winds introduce shock excitation and cause the elevated line ratios and
‡ http://sami-survey.org/edr
https://www.cambridge.org/core/terms. https://doi.org/10.1017/S1743921315003488Downloaded from https://www.cambridge.org/core. IP address: 65.21.228.167, on 12 Feb 2022 at 11:47:35, subject to the Cambridge Core terms of use, available at

The SAMI Galaxy Survey: early data release and first science 107
log([NII]/ )−1.0
−0.8
−0.6
−0.4
−0.2
0.0
0.2
0.4
0.6
0.8
log([O
III]/H
β)
100km/s
160km/s
200km/s
300km/s
Shock frac.0%20%40%60%80%100%
c1c2c3
log([SII]/Hα)
100km/s
160km/s
200km/s
300km/s
log([OI]/Hα)
100km/s
160km/s
200km/s
300km/s
−1.0 −0.5 0.0 0.5
log([NII]/Hα)
0
50
100
150
200
250
300
350
400
Veloc
itydisp
ersion
[km
s−1 ]
100km/s
160km/s200km/s
300km/s
−1.0 −0.5 0.0 0.5
log([SII]/Hα)
100km/s
160km/s200km/s
300km/s
−2.5 −2.0 −1.5 −1.0 −0.5
log([OI]/Hα)
100km/s
160km/s200km/s
300km/s
Figure 3. Top: The three standard BPT (Baldwin, Phillips & Terlevich 1981) diagrams for asingle galaxy from Ho et al. (2014) Bottom: The three line ratios vs. velocity dispersion. Theblue, orange, and red points denote the three distinct kinematic components fit. The pointsconnected by lines are shock/photoionization model grids from MAPPINGS (Dopita et al. 2013).The lines connect models of a given shock fraction with changing shock velocities. The purephotoionization (zero shock fraction) is at the bottom left.
velocity dispersion in the broad kinematic component. Building on this analysis we arenow assessing the frequency of winds and outflows throughout the full SAMI sample.
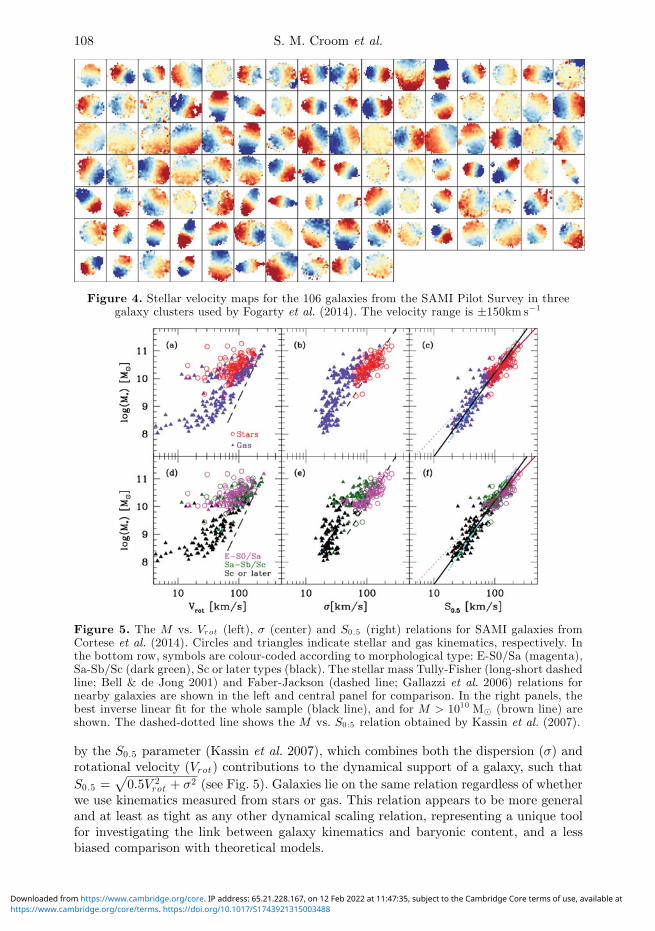
3.2. Kinematic morphology in clustersUnderstanding how the distribution of stellar angular momentum is built up is a key fo-cus of the SAMI Galaxy Survey. To do this we are measuring the specific stellar angularmomentum (quantified using the λr parameter, where λr = 〈R|Vrot |〉/〈R
√V 2
rot + σ2〉;Emsellem et al. 2011) and identifying rotation supported galaxies and dispersion sup-ported galaxies. With the large sample size of SAMI we are then able to study howtrends in angular momentum vary with galaxy environment, mass and other charac-teristics. Fogarty et al. (2014) find that slow rotators are distributed across a range ofenvironments within clusters, and also find evidence that groups in-falling into clusterscontain slow rotators.
3.3. Galaxy scaling relationsGalaxy scaling relations such as the Tully-Fisher (1977) relation for spirals, or the Faber-Jackson (1976) relation for early types provide fundamental insights into galaxy structure.Until now, such relations have always been formed from a subset of galaxies, selectedon morphology, inclination and other properties. We have taken advantage of the datafrom the SAMI Galaxy Survey to investigate the relation between the kinematics of gasand stars, and stellar mass in a comprehensive sample of nearby galaxies, regardlessof morphology (Cortese et al. 2014). We find that regardless of their morphology, allgalaxies lie on a tight relation linking stellar mass (M∗) to internal velocity quantified
https://www.cambridge.org/core/terms. https://doi.org/10.1017/S1743921315003488Downloaded from https://www.cambridge.org/core. IP address: 65.21.228.167, on 12 Feb 2022 at 11:47:35, subject to the Cambridge Core terms of use, available at
108 S. M. Croom et al.
Figure 4. Stellar velocity maps for the 106 galaxies from the SAMI Pilot Survey in threegalaxy clusters used by Fogarty et al. (2014). The velocity range is ±150km s−1
Figure 5. The M vs. Vrot (left), σ (center) and S0 .5 (right) relations for SAMI galaxies fromCortese et al. (2014). Circles and triangles indicate stellar and gas kinematics, respectively. Inthe bottom row, symbols are colour-coded according to morphological type: E-S0/Sa (magenta),Sa-Sb/Sc (dark green), Sc or later types (black). The stellar mass Tully-Fisher (long-short dashedline; Bell & de Jong 2001) and Faber-Jackson (dashed line; Gallazzi et al. 2006) relations fornearby galaxies are shown in the left and central panel for comparison. In the right panels, thebest inverse linear fit for the whole sample (black line), and for M > 1010 M� (brown line) areshown. The dashed-dotted line shows the M vs. S0:5 relation obtained by Kassin et al. (2007).
by the S0.5 parameter (Kassin et al. 2007), which combines both the dispersion (σ) androtational velocity (Vrot) contributions to the dynamical support of a galaxy, such thatS0.5 =
√0.5V 2
rot + σ2 (see Fig. 5). Galaxies lie on the same relation regardless of whetherwe use kinematics measured from stars or gas. This relation appears to be more generaland at least as tight as any other dynamical scaling relation, representing a unique toolfor investigating the link between galaxy kinematics and baryonic content, and a lessbiased comparison with theoretical models.
https://www.cambridge.org/core/terms. https://doi.org/10.1017/S1743921315003488Downloaded from https://www.cambridge.org/core. IP address: 65.21.228.167, on 12 Feb 2022 at 11:47:35, subject to the Cambridge Core terms of use, available at
The SAMI Galaxy Survey: early data release and first science 109
4. ConclusionsBy completion in 2016 the SAMI Galaxy Survey will have collected integral field data
for ∼ 3400 galaxies in the local Universe, enabling a vast array of science. We are trulyentering an era when integral field observations will be central to our understandingof galaxies. Major new projects are now starting, including MaNGA (see Bundy et al.in this proceedings) to extend sample sizes to ∼ 10, 000 in the local Universe. At highredshift KMOS (see Davies et al., in this proceedings) will drive our understanding ofgalaxy evolution with thousands of galaxies at z � 1− 2. Next generation facilities, suchas Hector (Bland-Hawthorn 2014), will push our understanding in new directions bybuilding samples of ∼ 100, 000 galaxies.
AcknowledgementsThe SAMI Galaxy Survey is based on observation made at the Anglo-Australian Tele-scope. The Sydney-AAO Multi-object Integral field spectrograph was developed jointlyby the University of Sydney and the Australian Astronomical Observatory. The SAMIinput catalogue is based on data taken from the Sloan Digital Sky Survey, the GAMASurvey and the VST ATLAS Survey. The SAMI Galaxy Survey is funded by the Aus-tralian Research Council Centre of Excellence for All-sky Astrophysics, through projectnumber CE110001020, and other participating institutions. The SAMI Galaxy Surveywebsite is http://sami-survey.org/.
ReferencesAllen, J. T., et al. 2015, MNRAS, 446, 1567Baldwin, J. A., Phillips, M. M., & Terlevich, R., 1981, PASP, 93, 5Bell, E. & de Jong, R., 2001, ApJ, 550, 212Bland-Hawthorn, J., 2014, in B. L. Ziegler, F. Combes, H. Dannerbauer, M. Verdugo, eds, Proc.
IAU Symp. 309, Galaxies in 3D across the Universe. Cambridge Univ. Press, CambridgeBryant, J. J., Bland-Hawthorn, J., Fogarty, L. M. R., Lawrence, J. S., & Croom, S. M., 2014a,
MNRAS, 438, 869Bryant, J. J., et al., 2014b, MNRAS submitted, arXiv:1407.7335Cappellari, M., et al., 2011, MNRAS, 416, 1680Colless, M. M., et al., 2001, MNRAS, 328, 1039Cortese, L., et al. 2014, ApJ, 795, LL37Croom, S. M., et al., 2012, MNRAS, 421, 872Dopita, M. A., et al., 2013, ApJS, 208, 10Driver, S. P., et al., 2011, MNRAS, 413, 971Emsellem, E., et al., 2007, MNRAS, 379, 401Faber, S. M. & Jackson R. E., 1976, ApJ, 204, 668Fogarty, L. M. R., et al., 2012, ApJ, 761, 169Fogarty, L. M. R., et al., 2014, MNRAS, 443, 485Gallazzi, A., Charlot, S., Brinchmann, J., & White, S. D. M., 2006, MNRAS, 370, 1106Ho, I.-T., et al., 2014, MNRAS, 444, 3894Kassin, S., et al., 2007, ApJ, 660, L35Richards, S., et al., 2014, MNRAS, 445, 1104Sanchez, S. F., et al., 2012, A&A, 538, A8Sharp, R., et al., 2006, in SPIE Conference Series Vol. 6269Sharp, R., et al. 2015, MNRAS, 446, 1551Tully, R. B. & Fisher J. R., 1977, A&A, 54, 661York, D. G., et al., 2000, AJ, 120, 1579
https://www.cambridge.org/core/terms. https://doi.org/10.1017/S1743921315003488Downloaded from https://www.cambridge.org/core. IP address: 65.21.228.167, on 12 Feb 2022 at 11:47:35, subject to the Cambridge Core terms of use, available at