Embed Size (px)
Citation preview
THE SALT EFFECT ON THE HEMOGLOBIN-OXYGEN EQUILIBRIUM
BY A. E. SIDWELL, JR., R. H. MUNCH, E. S. GUZMAN BARRON, AND T. R. HOGNESS
(From the George Herbert Jones Chemical Laboratory and the Lasker Foundation for Medical Research, Department of Medicine of the
University of Chicago, Chicago)
(Received for publication, December 17, 1937)
The equilibrium between hemoglobin and oxygen seemed to have been satisfactorily analyzed by the work of Henderson (1) and Peters and Van Slyke (2). Under the influence of Hender- son’s theory, that this equilibrium depends on the difference in the strength of the acid dissociation constants of hemoglobin and oxyhemoglobin, the specific effect of the added salts was ignored and any inhibition was usually attributed to the hydrogen ion concentration. As a consequence many investigators of this problem were often overzealous in having their solutions well buffered. The discovery of Henriques (3) of the probable exist- ence of “carbhemoglobin” was followed by a number of inves- tigations demonstrating the existence of carbamino compounds of hemoglobin and oxyhemoglobin. The carbamate equilibrium was thus given an important function in CO2 transport (Ferguson and Roughton (4), Stadie and O’Brien (5)). But up to the pres- ent time the effect of electrolytes has received scanty attention. Barcroft and Camis (6) and Barcroft and Roberts (7), as early as 1909, reported that sodium chloride and potassium chloride in- creased the affinity of hemoglobin for oxygen. More recently Green and Talbot (8) in a preliminary note stated that, “the oxy- gen dissociation curves of horse hemoglobin moved symmetrically to the right with increasing sodium chloride concentrations,” and Kono (9) has reported that in low hemoglobin concentrations neutral salts have no influence on the oxygen dissociation, while in high hemoglobin concentrations these salts depress the dissocia-
335
by guest on August 22, 2018
http://ww
w.jbc.org/
Dow
nloaded from
Hemoglobin-Oxygen Equilibrium
tion equally when isotonic solutions are used. Clearly it is essen- tial for a comprehensive treatment of the hemoglobin-oxygen equilibrium to restudy the problem of the effect of electrolytes. Such a study is presented in this paper which, it is believed, sup- ports the opinion that hemoglobin combines with some anions, effecting the hemoglobin-oxygen equilibrium.
EXPERIMENTAL
Preparation of Hemoglobin Solutions-Defibrinated human blood was centrifuged four times and washed with 0.9 per cent sodium chloride solution. To the remaining cell suspensions 1.5 volumes of water and 0.1 volume of diethyl ether were added. The mix- ture was thoroughly shaken and then centrifuged again for 30 minutes. The thick mass containing the cell debris was discarded. To the remaining solution 0.2 volume of a colloidal suspension of aluminum hydroxide was added. This mixture was shaken, carefully filtered, and the excess ether removed by blowing a stream of oxygen over the surface of the solution contained in a bottle which was slowly rotated. The resulting solution of hemo- globin was placed in a cellophane bag (porous enough to let hemin diffuse out slowly) which was then introduced into a cylinder in which triple distilled water was kept flowing continuously for 36 hours. Usually, 20 liters of water were used in this process. In the final preparation for the spectroscopic determination the dialyzed human hemoglobin was centrifuged once more. No potassium, sodium, or chloride ion could be detected in these samples. Each step in the procedure was carried out in a cold room maintained at 3”, and solutions were stored at a temperature of 3-5”. Each sample was saturated with oxygen in a tonometer, and the concentrations of oxyhemoglobin present in these solu- tions were determined on 2 cc. samples in triplicate by the Van Slyke manometric method.
After some experience with these solutions we established the criterion that a well dialyzed solution should be saturated to the extent of 50 per cent at 25’ with an oxygen pressure of 1 mm. Many samples which did not fulfil this condition were rejected. In no case was a sample obtained which was saturated to a greater extent, under these specified conditions.
Preparation of Gas Mixtures-Gas mixtures of known composi-
by guest on August 22, 2018
http://ww
w.jbc.org/
Dow
nloaded from
&dwell, Munch, Barron, and Hogness 337
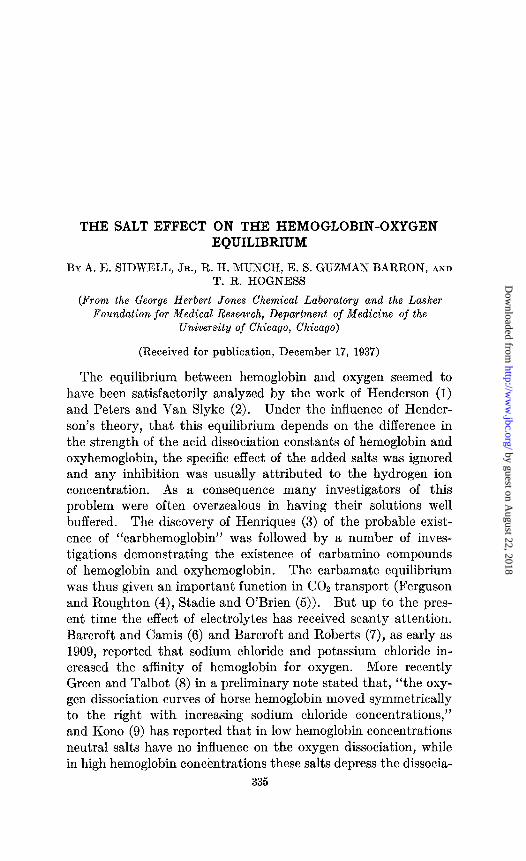
tion for subsequent equilibration determinations were prepared and manipulated in a glass system which could be evacuated thoroughly by means of a mercury vapor pump. The apparatus
D
aTO H
TO L
FIG. 1. Apparatus for controlling gas mixtures
employcrJ to purify and measure the gases used appears schemat- ically in Fig. 1. The 2-way stop-cock (A) served to allow com- mercial tar&r hydrogen or commercial “water-pumped” nitrogen
by guest on August 22, 2018
http://ww
w.jbc.org/
Dow
nloaded from
338 Hemoglobin-Oxygen Equilibrium
to pass over copper pellets maintained at 450-500” within the Pyrex tube in the furnace (B). The S-way stop-cock (C) con- nected through one branch with the drying tubes (D), which were filled with soda lime and phosphorus pentoxide; the other branch (C) functioned as a convenient by-pass for water vapor during reactivation of the copper surface, or for purified undried nitrogen. The dried nitrogen was allowed to escape into the air through one branch of the 3-way stop-cock (E), or could be ad- mitted to the gas-mixing chamber (F).
Commercial medicinal oxygen was also passed over soda lime and phosphorus pentoxide through stop-cock I. The oxygen- drying tubes (G) were connected to the mixing chamber (8’) in the same manner, through H, as for nitrogen, and stop-cock I made undried oxygen available.
Commercial carbon dioxide was freed of oxygen and other con- taminants by adsorption upon activated charcoal contained in a trap (J) cooled with acetone and solid carbon dioxide. Prior to adsorption of the carbon dioxide the adsorption trap and phos- phorus pentoxide drying chamber (K) were evacuated through stop-cock N’ by the pumps. The charcoal was degassed by heat- ing with a furnace to 500’ in a high vacuum. The evolution of the carbon dioxide from the characoal surface was controlled by lowering the cooling bath around trap J. The dried gas was ad- mitted to the mixing chamber through the 3-way stop-cock L.
The gas-mixing chamber (F) consisted of one 6 liter and two 12 liter flasks connected, but made independent of each other by means of stop-cocks M and M’. One (or more) of these flasks could be evacuated through stop-cock N, to a pressure of 10e5 mm. of mercury. The pressure of oxygen in the gas mixtures used was determined directly by the use of the McLeod gage (0) calibrated to measure pressures accurately over the range of 1O-3 mm. to 20 mm. of Hg. Higher pressures were read directly from the closed end manometer at P.
The final mixture was made by first admitting the oxygen (and carbon dioxide) to a definite pressure, and then adding the diluent gas until the pressure in the chamber was atmospheric. The mix- ture was then allowed to reach equilibrium temperature and the final pressure was recorded. Portions of the equilibrium mixture of gas were then passed through the Toepler pumps (Q) and
by guest on August 22, 2018
http://ww
w.jbc.org/
Dow
nloaded from
Sidwell, Mmch? Barron, and Hogness 339
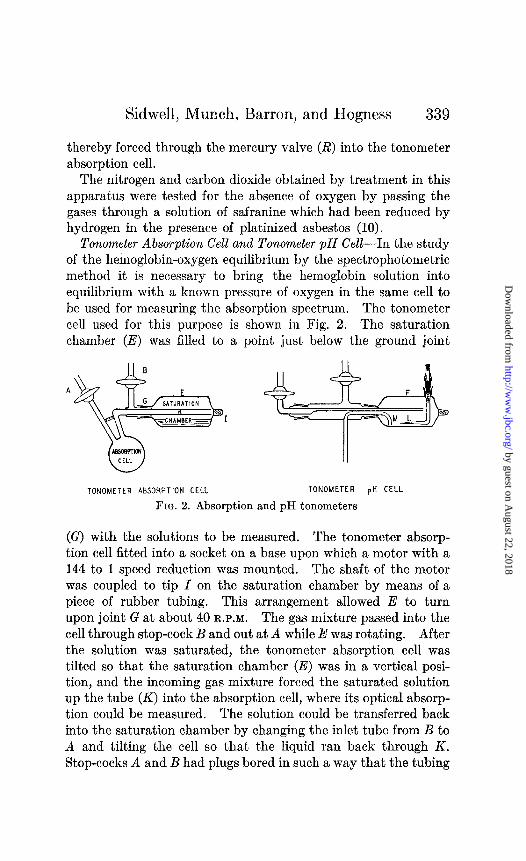
thereby forced through the mercury valve (R) into the tonometer absorption cell.
The nitrogen and carbon dioxide obtained by treatment in this apparatus were tested for the absence of oxygen by passing the gases through a solution of safranine which had been reduced by hydrogen in the presence of platinized asbestos (10).
Tonometer Absorption Cell and Tonometer pH Cell---In the study of the hemoglobin-oxygen equilibrium by the spectrophotometric method it is necessary to bring the hemoglobin solution into equilibrium with a known pressure of oxygen in the same cell to be used for measuring the absorption spectrum. The tonometer cell used for this purpose is shown in Fig. 2. The saturation chamber (E) was filled to a point just below the ground joint
TONOMETER ABSORPTION CELL TONOMETER pH CELL
FIG. 2. Absorption and pH tonometers
(G) with the solutions to be measured. The tonometer absorp- tion cell fitted into a socket on a base upon which a motor with a 144 to 1 speed reduction was mounted. The shaft of the motor was coupled to tip I on the saturation chamber by means of a piece of rubber tubing. This arrangement allowed E to turn upon joint G at about 40 R.P.M. The gas mixture passed into the cell through stop-cock B and out at A while E was rotating. After the solution was saturated, the tonometer absorption cell was tilted so that the saturation chamber (E) was in a vertical posi- tion, and the incoming gas mixture forced the saturated solution up the tube (K) into the absorption cell, where its optical absorp- tion could be measured. The solution could be transferred back into the saturation chamber by changing the inlet tube from B to A and tilting the cell so that the liquid ran back through K. Stop-cocks A and B had plugs bored in such a way that the tubing
by guest on August 22, 2018
http://ww
w.jbc.org/
Dow
nloaded from
340 Hemoglobin-Oxygen Equilibrium
up to the stop-cock could be swept out with the gas mixture, thus preventing contamination of the contents of the cell with the air originally present.
The tonometer pH cell consisted of a saturation chamber (E’) which contained a capillary glass electrode (L) and an agar- potassium chloride bridge (M). It was manipulated in a manner similar to that for the tonometer absorption cell. The saturating gas mixture was passed, first through the tonometer absorption cell, and then through the tonometer pH cell as both saturation chambers were being rotated. While the optical absorption was being measured, the pH was measured in the other cell. The electrical measurements involving the glass electrode were made in the usual manner with an amplifier circuit which contained an FP-54 pliotron.
A Freas air thermostat contained the speed-reducing motor, the tonometer cells, a calomel electrode, and a gas-washing tube which could be filled with water or a suitable solution to prevent loss of water from the tonometer cells on passage of the gases. This thermostat controlled the temperature of the air within *0.5” at 25”. The gases employed were led into the thermostat by means of seamless copper tubing sealed to glass at one end by wax joints. Short lengths of seasoned rubber tubing served to connect the tonometer cell stop-cocks with the copper tube.
Absorption Measurements-The photoelectric spectrophotom- eter and the general method employed here to determine the spectroscopic constants and the relative amounts of hemoglobin and oxyhemoglobin in solution have been described in an earlier paper (11). Absorption cells with crystal quartz windows were used in a light-tight cell chamber fitted with an electrically driven fan, heating coil, water-cooled coils, and a mercury-filled thermo- regulator which interrupted the current through a relay control- ling the heating current. The absorption cells were thus held at constant temperature; in this case, 25”.
The absorption coefficients, as calculated from Beer’s law, are defined by the equation:
10 log,, - = ad
1,
where lo = relative intensity of light of wave-length X passing through solvent
by guest on August 22, 2018
http://ww
w.jbc.org/
Dow
nloaded from
Sidwell, Munch, Barron, and Hogness 341
I, = relative intensity of light of wave-length X passing through solution to be studied
(Y = absorption coefficient C = concentration in moles per liter (based on total oxygen capa-
city) 1 = length of absorbing medium; i.e., length of absorption cell
in cm.
The concentration employed in the calculation of the relative absorption coefficients was that of the total oxygen capacity in moles of oxygen per liter of the solution studied; i.e., the oxygen capacity of the initial solution as determined by the Van Slyke manometric method, multiplied by the appropriate dilution factor. Thus the absolute values of the absorption coefficients may be calculated from the figures given, only when the number of oxygen molecules per molecule of oxyhemoglobin is definitely known (very probably 4).
Absorption Spectrum of Human Dialyzed Hemoglobin
Numerous reports have been published on the absorption spec- trum of hemoglobin (copious information on the literature will be found in Drabkin and Austin’s paper (12)). Few of them (Newcomer (13), Suhrmann and Kollath (14)) examined it at the same time in the ultraviolet and visible regions of the spec- trum. Adams (15), who made the most recent report on the ultraviolet spectrum of hemoglobin, stated that no difference was found between hemoglobin and oxyhemogl!bin with respect to the position of the Soret band (around 4000 A.), although, accord- ing to him, “The exact centre of the band is difficult to locate.”
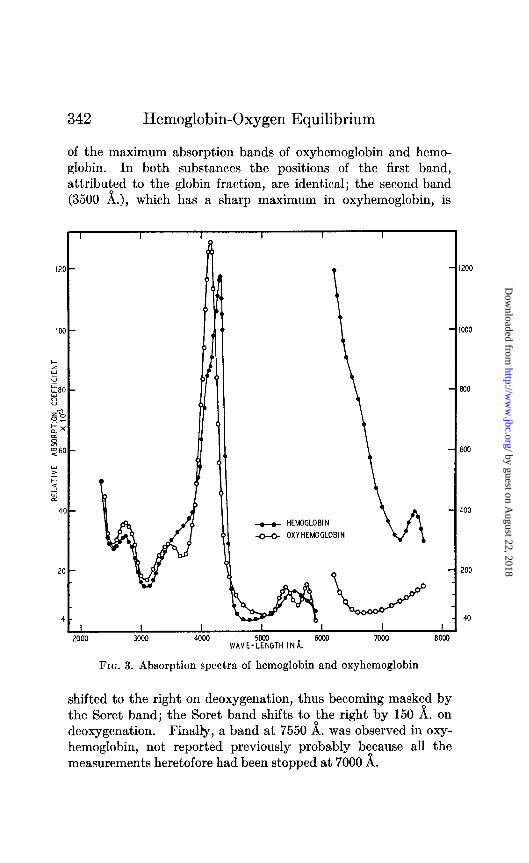
Dialyzed human hemoglobin solutions prepared as described above were examined in the ultraviolet and visible regions of the spectrum. The absorption spectrum was determined with cells open to the air, or in the tonometer absorption cell with an atmos- phere of oxygen. Solutions of purified but undialyzed oxyhemo- globin in acetate, bicarbonate, phosphate, and Verona1 buffers, respectively, were studied in the same manner. No differences in the spectra so determined were found. For the absorption spec- trum of hemoglobin, the solutions were deoxygenated with puri- fied nitrogen, hydrogen, or carbon dioxide. Dialyzed hemoglobin and hemoglobin in the presence of the buffers mentioned above gave identical spectra (Fig. 3). In Table I is given the position
by guest on August 22, 2018
http://ww
w.jbc.org/
Dow
nloaded from
342 Hemoglobin-Oxygen Equilibrium
of the maximum absorption bands of oxyhemoglobin and hemo- globin. In both substances the positions of the first band, attribuied to the globin fraction, are identical; the second band (3500 A.), which has a sharp maximum in oxyhemoglobin, is
- HEMOGLOEI N
-0~ OXYHEMOGLOBIN
I I I I I I I 000 3000 4000 WE-%GTH
INi. 6ool 7000 601
- 1200
- IO00
- 800
- 600
- 400
- 200
- 40 d
M
FIG. 3. Absorption spectra of hemoglobin and oxyhemoglobin
shifted to the right on deoxygenation, thus becoming masktd by the Soret band; the Soret band shifts to the right by 150 A. on deoxygenation. Finally, a band at 7550 A. was observed in oxy- hemoglobin, not reported previously probably because all the measurements heretofore had been stopped at 7000 A.
by guest on August 22, 2018
http://ww
w.jbc.org/
Dow
nloaded from
Sidwell, Munch, Barron, and Hogness 343
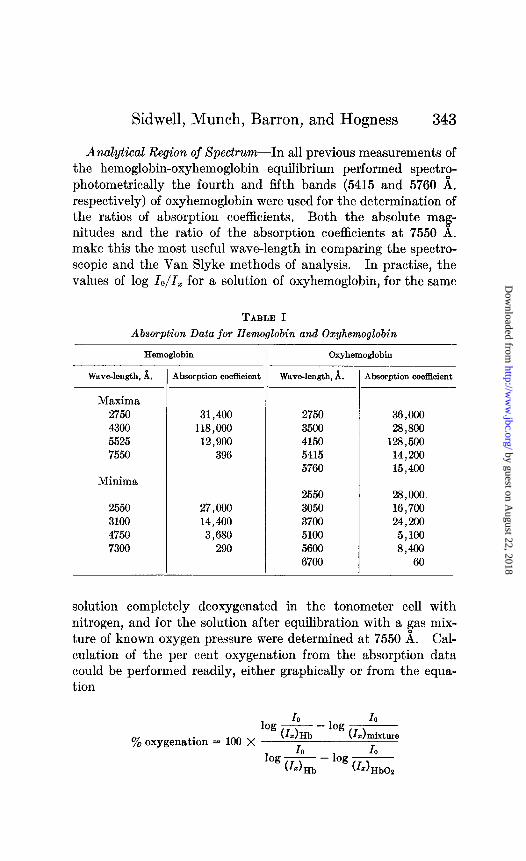
Analyytical Region of Spectrum--In all previous measurements of the hemoglobin-oxyhemoglobin equilibrium performed spectro- photometrically the fourth and fifth bands (5415 and 5760 A. respectively) of oxyhemoglobin were used for the determination of the ratios of absorption coefficients. Both the absolute ma - nitudes and the ratio of the absorption coefficients at 7550 1 . make this the most useful wave-length in comparing the spectro- scopic and the Van Slyke methods of analysis. In practise, the values of log lo/l, for a solution of oxyhemoglobin, for the same
TABLE I
Absorption Data for Hemoglobin and Oxyhemoglobin
Hemoglobin
Wav.A3ngth, A.
Maxima 2750 4300 5525 7550
31,400 118,000
12,900 396
Minima
2550 27,000 3100 14,400 4750 3,680 7300 290
- Absorption coefficient Wave-length, A.
Oxyhemoglobin
Absorption coefficient
2750 36,000 3500 28,800 4150 128,500 5415 14,200 5760 15,400
2550 28,000 3050 16,700 3700 24,200 5100 5,100 5600 8,400 6700 60
solution completely deoxygenated in the tonometer cell with nitrogen, and for the solution after equilibration with a fas mix- ture of known oxygen pressure were determined at 7550 A. Cal- culation of the per cent oxygenation from the absorption data could be performed readily, either graphically or from the equa- tion
IO
log &)Hb
IO
y0 oxygenation = 100 X - log u~)mixt,e
lo IO
log t&Z&,, - log (1Z),,,,
by guest on August 22, 2018
http://ww
w.jbc.org/
Dow
nloaded from
344 Hemoglobin-Oxygen Equilibrium
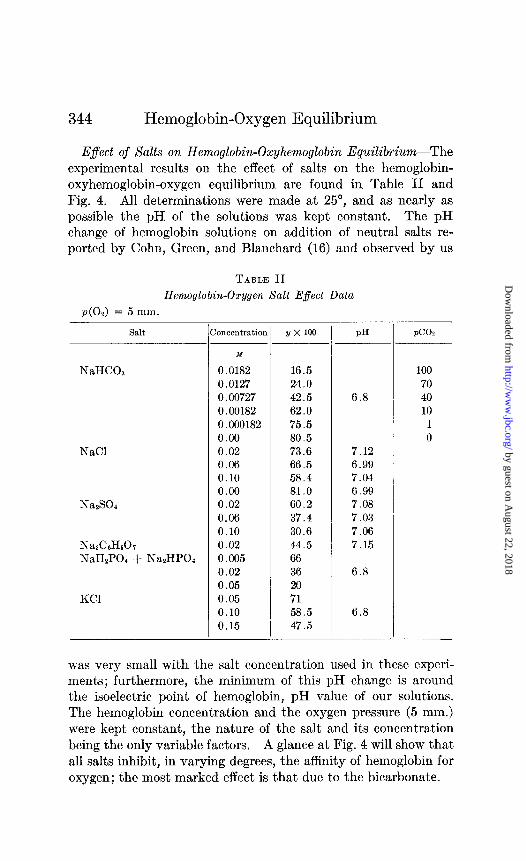
E$ect of Salts on Hemoglobin-Oxyhemoglobin Equilibrium--The experimental results on the effect of salts on the hemoglobin- oxyhemoglobin-oxygen equilibrium are found in Table II and Fig. 4. All determinations were made at 25”, and as nearly as possible the pH of the solutions was kept constant. The pH change of hemoglobin solutions on addition of neutral salts re- ported by Cohn, Green, and Blanchard (16) and observed by us
TABLE II
Hemoglobin-Oxygen Salt Effect Data
~(0~) = 5 mm.
Salt
NaHCOs
NaCl
NazSOa
NadAHkh NaHzPOl + NazHP04
KC1
PH PC02 hncentratior Y x 100
M
0.0182 16.5 100 0.0127 24.0 70 0.00727 42.5 6.8 40 0.00182 62.0 10 0.000182 75.5 1 0.00 80.5 0 0.02 73.6 7.12 0.06 66.5 6.99 0.10 58.4 7.04 0.00 81.0 6.99 0.02 60.2 7.08 0.06 37.4 7.03 0.10 30.6 7.06 0.02 44.5 7.15 0.005 66 0.02 36 6.8 0.05 20 0.05 71 0.10 58.5 6.8 0.15 47.5
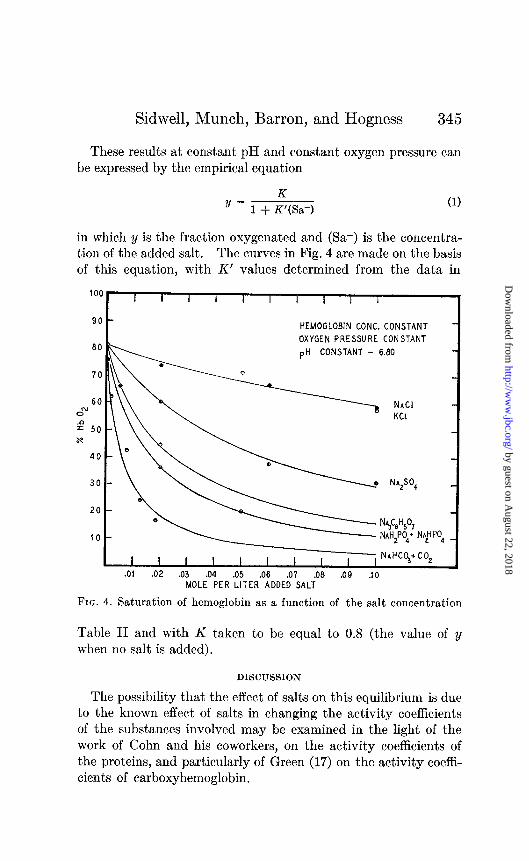
was very small with the salt concentration used in these experi- ments; furthermore, the minimum of this pH change is around the isoelectric point of hemoglobin, pH value of our solutions. The hemoglobin concentration and the oxygen pressure (5 mm.) were kept constant, the nature of the salt and its concentration being the only variable factors. A glance at Fig. 4 will show that all salts inhibit, in varying degrees, the affinity of hemoglobin for oxygen; the most marked effect is that due to the bicarbonate.
by guest on August 22, 2018
http://ww
w.jbc.org/
Dow
nloaded from
Sidwell, Munch, Barron, and Hogness 345
These results at constant pH and constant oxygen pressure can be expressed by the empirical equation
K y=m+K’(Sa-) (1)
in which y is the fraction oxygenated and (Sa-) is the concentra- tion of the added salt. The curves in Fig. 4 are made on the basis of this equation, with K’ values determined from the data in
HEMOGLOBIN CONC.CONSTANT
OXYGEN PRESSURE CONSTANT
pH CONSTANT - 6.80
I I I I I I I I I NAHCO~+CO~
.Ol .OE .03 .04 .05 .06 .07 .08 .09 .10 MOLE PER LITER ADDED SALT
FIG. 4. Saturation of hemoglobin as a function of the salt concentration
Table II and with K taken to be equal to 0.8 (the value of y when no salt is added).
DISCUSSION
The possibility that the effect of salts on this equilibrium is due to the known effect of salts in changing the activity coefficients of the substances involved may be examined in the light of the work of Cohn and his coworkers, on the activity coefficients of the proteins, and particularly of Green (17) on the activity coeffi- cients of carboxyhemoglobin.
by guest on August 22, 2018
http://ww
w.jbc.org/
Dow
nloaded from
346 Hemoglobin-Oxygen Equilibrium
If we assume that 4 oxygen molecules combine stepwise with hemoglobin, and if we take activity coefficients into account, the fractional amount of hemoglobin oxygenated (y) may be expressed by the equation
Kxop+2KKYOp’f3KKKYOp~f4KKKKYOp4 1 1 2 1 2 3 1 2 3 4 Yl YZ Y3 Y4
Y/= 4 1+K11-0p+KKY--O~2+KKK21-0pa+KKKKY-Op4
[
(2)
ly1 1 2
y-2 1 2 3
y3 1 2 3 4
74 3
where K1, Kz, KS, and K4 refer to the association constants for each of the steps of oxygen combination, p, the pressure of the oxygen, and YO, 71, ~2, ~3, and y4 are the activity coefficients of unoxygenated hemoglobin and each of the oxygenated species respectively. The depressing effect of salts would then be a function of yo/yz (yz referring to any of the oxygenated species) and yo/yx should have a value less than 1.
Green (17) from solubility studies found that the activity coeffi- cient for carboxyhemoglobin could be expressed by the equation
--logy = Ki& - Kop (3)
in which p is the ionic strength of the solution, and Ki and K, are the salting-in and salting-out constants, respectively. “Kc is characteristic of the protein and K, varies with the electrolyte.” From Equation 3 it follows that
-log ‘0 = AK&- - AKolr (4) Yz
If K, were only a function of the salt as Green postulates, the last term in Equation 4 would be equal to 0 and it might be argued that yo/yz should have a value very nearly equal to 1, and that the salt effect is due rather to compound formation between the hemoglobin and the anion. However, the application of Equa- tion 3 (developed for strong electrolytes) to proteins is very doubtful and any conclusion regarding compound formation must be made with some reserve.
By analogy to the activity coefficients of other proteins as determined by solubility measurements we may represent the activity coefficients of hemoglobin and oxyhemoglobin graphically (Fig. 5) as a function of the ionic strength. We are dealing with
by guest on August 22, 2018
http://ww
w.jbc.org/
Dow
nloaded from
Sidwell, Munch, Barron, and Hogness 347
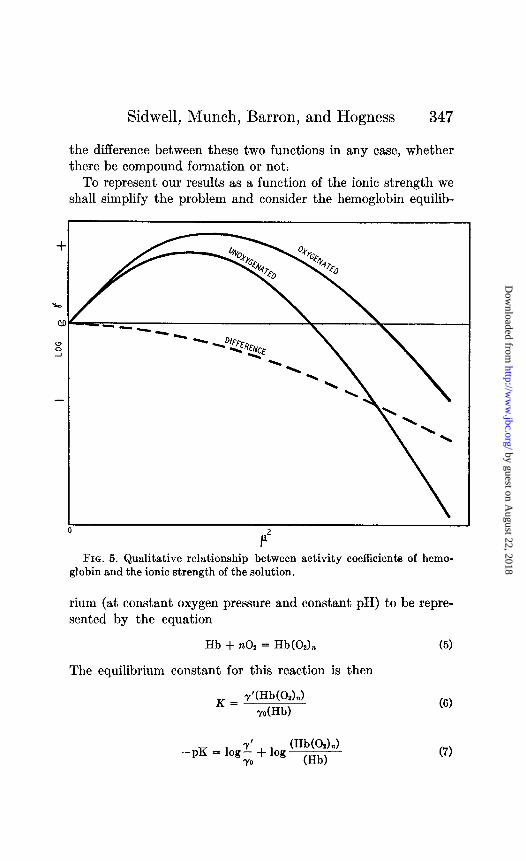
the difference between these two functions in any case, whether there be compound formation or not.
To represent our results as a function of the ionic strength we shall simplify the problem and consider the hemoglobin equilib-
FIG. 5. Qualitative relationship between activity coefficients of hemo- globin and the ionic strength of the solution.
rium (at constant oxygen pressure and constant pH) to be repre- sented by the equation
Hb + nOz = Hb(O,), (5)
The equilibrium constant for this reaction is then
I
--PK = lo&o + log (Hb(OAJ
(HbI
(6)
(7)
by guest on August 22, 2018
http://ww
w.jbc.org/
Dow
nloaded from
348 Hemoglobin-Oxygen Equilibrium
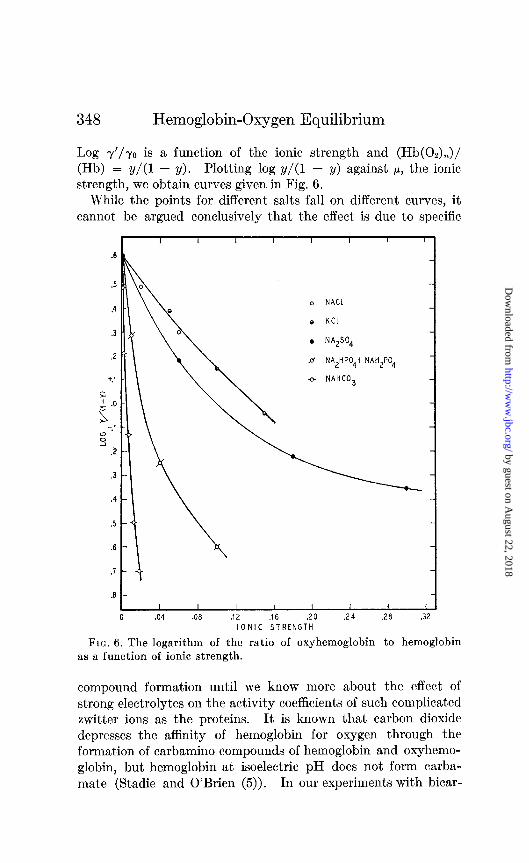
Log y’/yo is a function of the ionic strength and (Hb(02),)/ (Hb) = y/(1 - y). Plotting log y/(1 - y) against p, the ionic strength, we obtain curves given in Fig. 6.
While the points for different salts fall on different curves, it cannot be argued conclusively that the effect is due to specific
.6
.5
.4
3
.2
+.I
2
5” -.t
5 .2
.3
.4
.5
.6
.7
.6
I , 1 1 I I I I
o NACL 0
e KCL 0
. NA2S04
.d NA2HP04+NAH2P04
o NAHC03
r:::
.04 .06 .12 .16 .20 .24 .20 .32 IONIC STRENGTH
FIG. 6. The logarithm of the ratio of oxyhemoglobin to hemoglobin as a function of ionic strength.
compound formation until we know more about the effect of strong electrolytes on the activity coefficients of such complicated twitter ions as the proteins. It is known that carbon dioxide depresses the aflinity of hemoglobin for oxygen through the formation of carbamino compounds of hemoglobin and oxyhemo- globin, but hemoglobin at isoelectric pH does not form carba- mate (Stadie and O’Brien (5)). In our experiments with bicar-
by guest on August 22, 2018
http://ww
w.jbc.org/
Dow
nloaded from
Sidwell, Munch, Barron, and Hogness 349
bonate, where the pH of the solution was kept at 6.8 (isoelectric point of hemoglobin pH 6.78 (18, 19)), this depressing effect of the bicarbonate-carbon dioxide mixture cannot therefore be attributed to carbamate formation. Nevertheless, we might reasonably sup- pose that no theory of interaction between negative ions and hemo- globin will account for the great difference between the bicarbonate and chloride ions, and therefore compound formation takes place between the bicarbonate and the hemoglobin. The same argu- ment might also apply to the phosphate.
It is impossible to isolate the effect of the monohydrogen phos- phate and dihydrogen phosphate ions without changing the pH of the solution, for at constant pH the activities of these two ions remain in a constant ratio to each other. The same condition holds for the bicarbonate ion, carbonate ion, carbonic acid, and carbon dioxide. The effects of the individual species can only be analyzed after we have a knowledge of the isolated effect of the hydrogen ion on the hemoglobin-oxygen equilibrium in dialyzed solution.
The empirical Equation 1 can be deduced on the assumption that one negative ion combines with unoxygenated hemoglobin to decrease its tendency to combine with oxygen to such an ex- tent that only an inappreciable amount of oxygen combines with the salt form. However, in view of our concept of proteins as zwitter ions, such an assumption does not seem to be a reasonable one.
Throughout the whole of this work we have assumed that the absorption spectrum of one oxygenated heme is not dependent on the oxygenation of another heme on the same molecule; that the interaction energy between the heme groups on the hemoglobin molecule is not very large. We have found no evidence con- tradicting this assumption. In no case did we find an absorption region which failed to increase or decrease proportionately with increasing oxygenation, as would be expected if this assumption were not a valid one.
Preliminary analysis of the curve for dialyzed hemoglobin has shown that the interpretation of these data is by no means as simple as that with undialyzed solutions (if the salt effect is neglected). Log y against log p plots (Ferry and Green (20)) are no longer straight lines.
The fact that bicarbonate and phosphate have the greatest
by guest on August 22, 2018
http://ww
w.jbc.org/
Dow
nloaded from
350 Hemoglobin-Oxygen Equilibrium
effect may have a physiological significance in that these salts increase the oxygen tension in the blood when it is in closest con- tact with respiring tissue.
SUMMARY
The addition of salts (NaCl, KCl, Na2S04, Na3CeH507, NaH2P04 + Na2HP04, NaHC08 + CO,) at different concentrations to di- alyzed human hemoglobin inhibits the oxygenation of hemo- globin. The inhibiting effect increases with the nature of the salts in the order described. In some cases this inhibiting effect is very probably not due to an ionic strength effect but to the combination of anions with hemoglobin.
The spectra of hemoglobin and oxyhemoglobin in the ultra- violet and visible regions of the spectrum up to 7700 d. have been determined.
BIBLIOGRAPHY
1. Henderson, L. J., Blood, A study in general physiology, New Haven (1928).
2. Peters, J. P., and Van Slyke, D. D., Quantitative clinical chemistry, Interpretations, Baltimore (1931).
3. Henriques, 0. M., Biochem. Z., 269, 1 (1928). 4. Ferguson, J. K. W., and Roughton, F. J. W., J. Physiol., 83, 68, 87
(1934). 5. S&die, W. C., and O’Brien, H., J. BioE. Chem., 117, 439 (1937). 6. Barcroft, J., and Camis, M., J. Physiol., 39, 118 (1909-10). 7. Barcroft, J., and Roberts, F., J. Physiol., 39, 143 (1909-10). 8. Green, A. A., and Talbot, J. H., Proc. Am. Sot. Biol. Chem., J. Biol.
Chem., 166, p. 1 (1933). 9. Kono, H., Japan J. Med. Xc., Biophysic., 2, 1 (1931).
10. Barron, E. S. G., Biol. Bull., 62,42 (1932). 11. Hogness, T. R., ‘Zscheile, F. P., and Sidwell, A. E., Jr., J. Physic.
Chem., 41, 379 (1937). 12. Drabkin, D. L., and Austin, J. H., J. Biol. Chem., 98,719 (1932). 13. Newcomer, H. S., J. Biol. Chem., 37, 465 (1919). 14. Suhrmann, R., and Kollath, W., Biochem. Z., 184, 216 (1927). 15. Adams, G. A., Biochem. J., 30, 2016 (1936). 16. Cohn, E. J., Green, A. A., and Blanchard, M. H., J. Am. Chem. Xoc.,
69, 509 (1937)., 17. Green, A. A., J. Biol. Chem., 96,47 (1932). 18. Ferry, R. M., J. Biol. Chem., 6’7, 819 (1923). 19. Michaelis, L., and Bien, Z., Biochem. Z., 67, 198 (1914). 20. Ferry, R. M., and Green, A. A., J. Biol. Chem., 81, 175 (1929).
by guest on August 22, 2018
http://ww
w.jbc.org/
Dow
nloaded from
Barron and T. R. HognessA. E. Sidwell, Jr., R. H. Munch, E. S. Guzman
EQUILIBRIUMHEMOGLOBIN-OXYGEN
THE SALT EFFECT ON THE
1938, 123:335-350.J. Biol. Chem.
http://www.jbc.org/content/123/1/335.citation
Access the most updated version of this article at
Alerts:
When a correction for this article is posted•
When this article is cited•
alerts to choose from all of JBC's e-mailClick here
tml#ref-list-1
http://www.jbc.org/content/123/1/335.citation.full.haccessed free atThis article cites 0 references, 0 of which can be by guest on A
ugust 22, 2018http://w
ww
.jbc.org/D
ownloaded from