Embed Size (px)
Citation preview
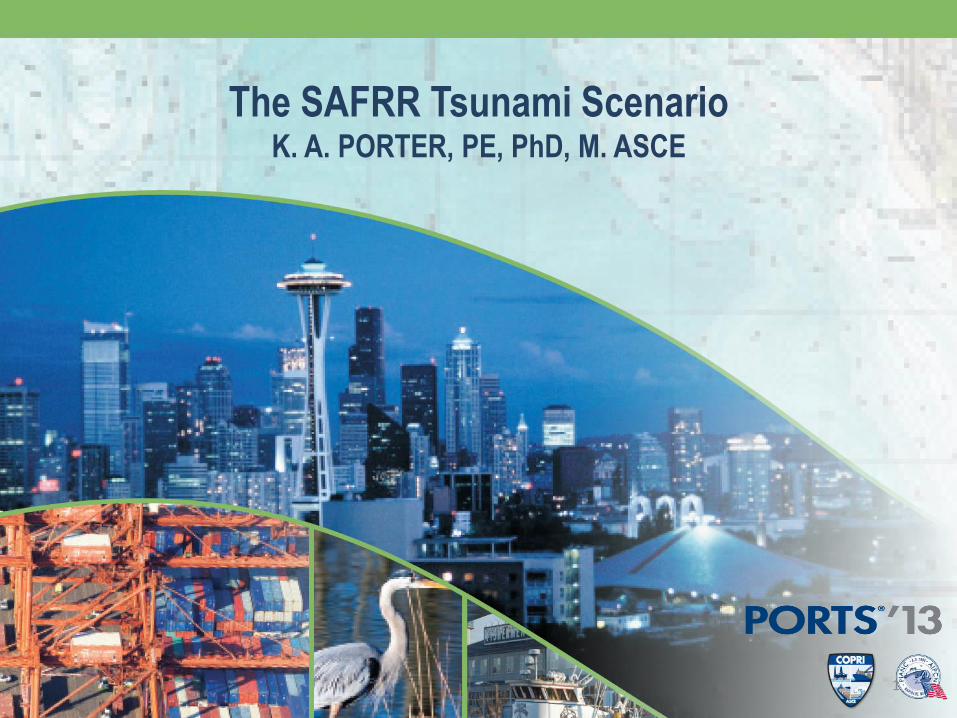
The SAFRR Tsunami Scenario K. A. PORTER, PE, PhD, M. ASCE
1
Coauthors
L Jones, S Ross, J Borrero, J Bwarie, D Dykstra, EL Geist, L Johnson, S Kirby, K Long, P Lynett, K Miller, C Mortensen, S Perry, G Plumlee, C Real, L Ritchie, C Scawthorn, HK Thio, A Wein, P Whitmore, R Wilson, N Wood
USGS, California Geological Survey, Cal Office of Emergency Services, and NOAA
2
Science Application for Risk Reduction
SAFRR’s mission: innovate and apply hazard science for the safety, security, and economic well-being of the nation
What is your science need?
3
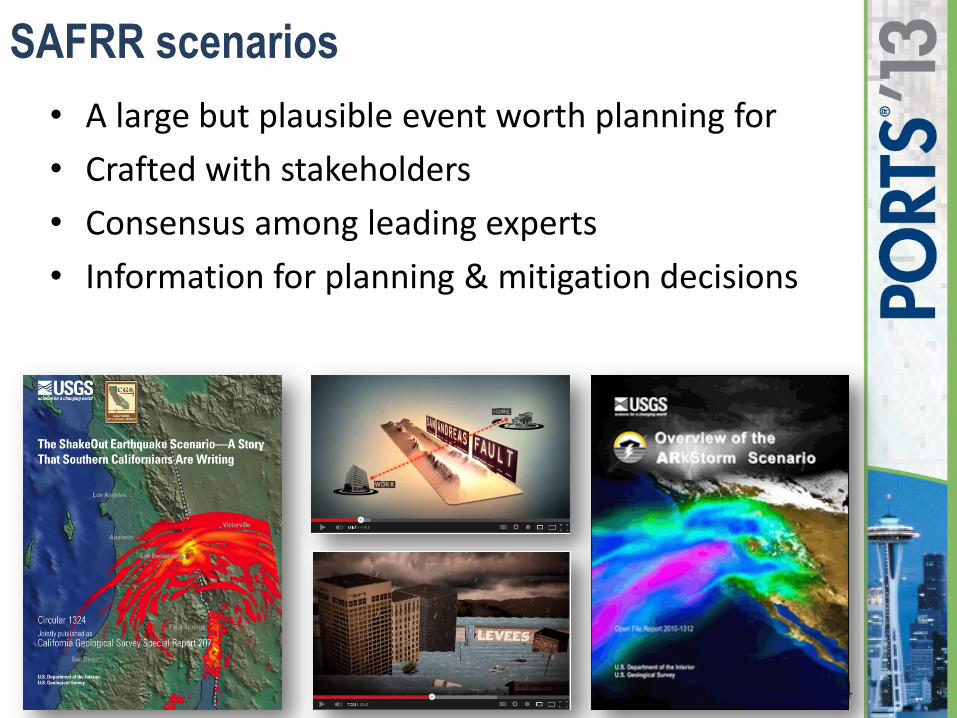
SAFRR scenarios
• A large but plausible event worth planning for
• Crafted with stakeholders
• Consensus among leading experts
• Information for planning & mitigation decisions
4
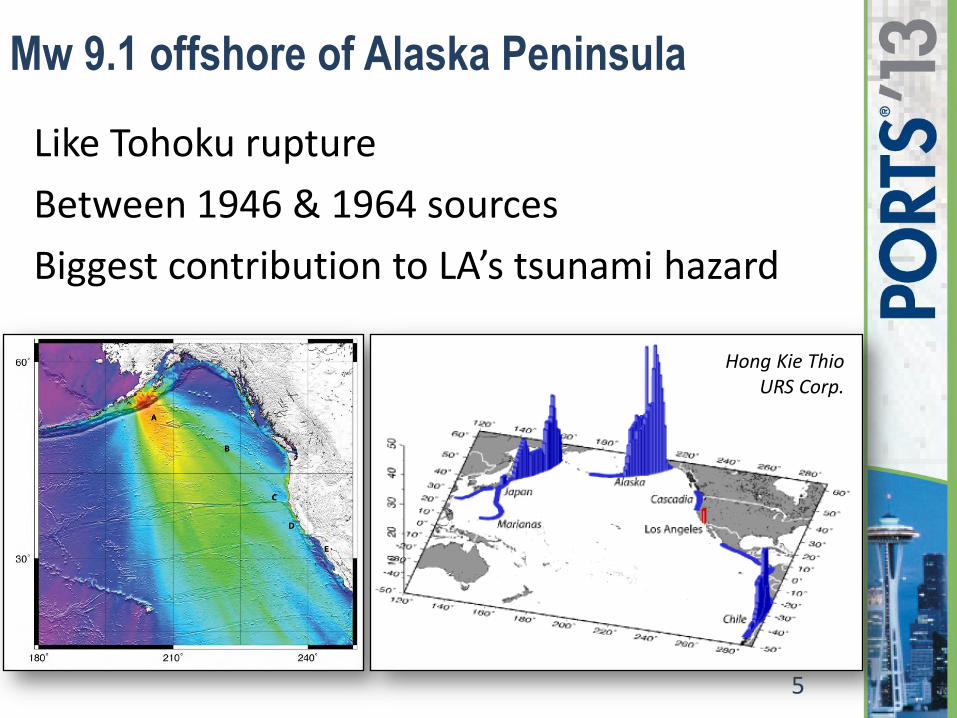
Mw 9.1 offshore of Alaska Peninsula
Like Tohoku rupture
Between 1946 & 1964 sources
Biggest contribution to LA’s tsunami hazard
5
Hong Kie Thio URS Corp.
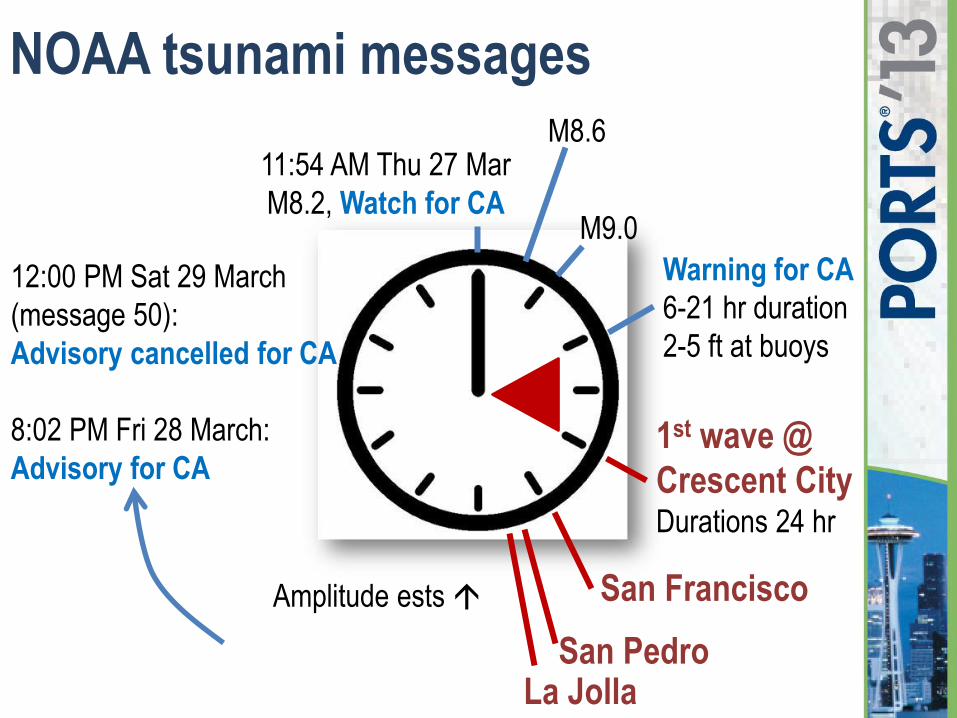
NOAA tsunami messages
6
San Pedro La Jolla
M8.6
M9.0
12:00 PM Sat 29 March
(message 50):
Advisory cancelled for CA
8:02 PM Fri 28 March:
Advisory for CA
11:54 AM Thu 27 Mar
M8.2, Watch for CA
Warning for CA
6-21 hr duration
2-5 ft at buoys
Amplitude ests San Francisco
1st wave @
Crescent City Durations 24 hr
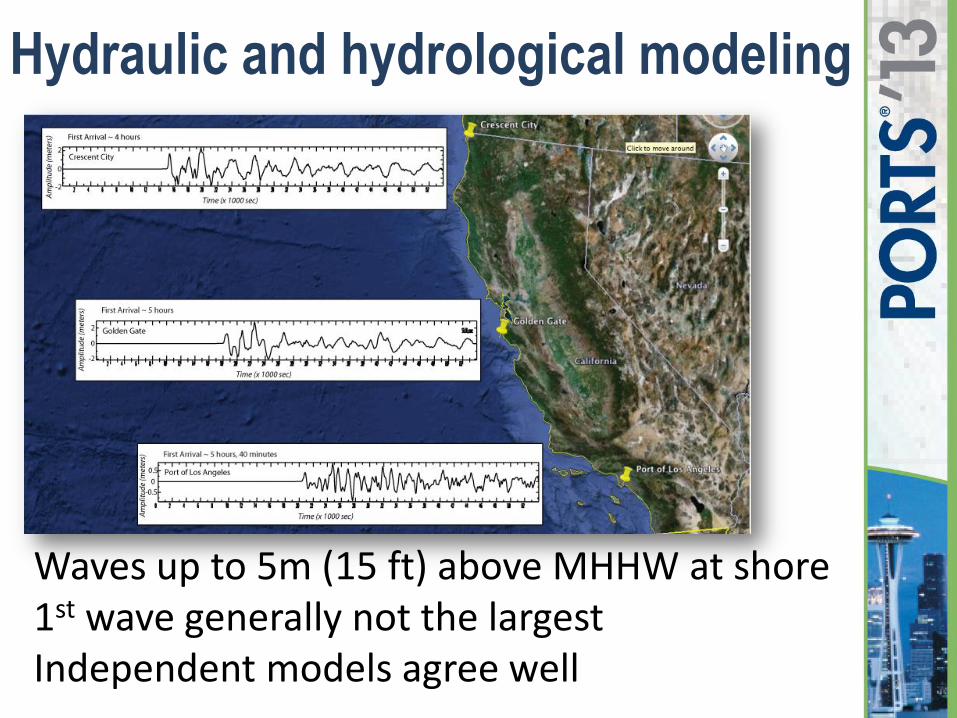
Hydraulic and hydrological modeling
7
Waves up to 5m (15 ft) above MHHW at shore 1st wave generally not the largest Independent models agree well
Physical damages chapter
• Buildings, ports, marinas, roads, bridges, fire…
• Describe asset, history, scenario damage, recovery, & resilience opportunities
• Lean toward cautious (optimistically low)
• Draw lessons from past tsunamis & H. Sandy
• 32 peer reviewers – 2+ experts per topic
– Professionals, scholars, stakeholder experts
– Peer review was longer than the damage chapter
8
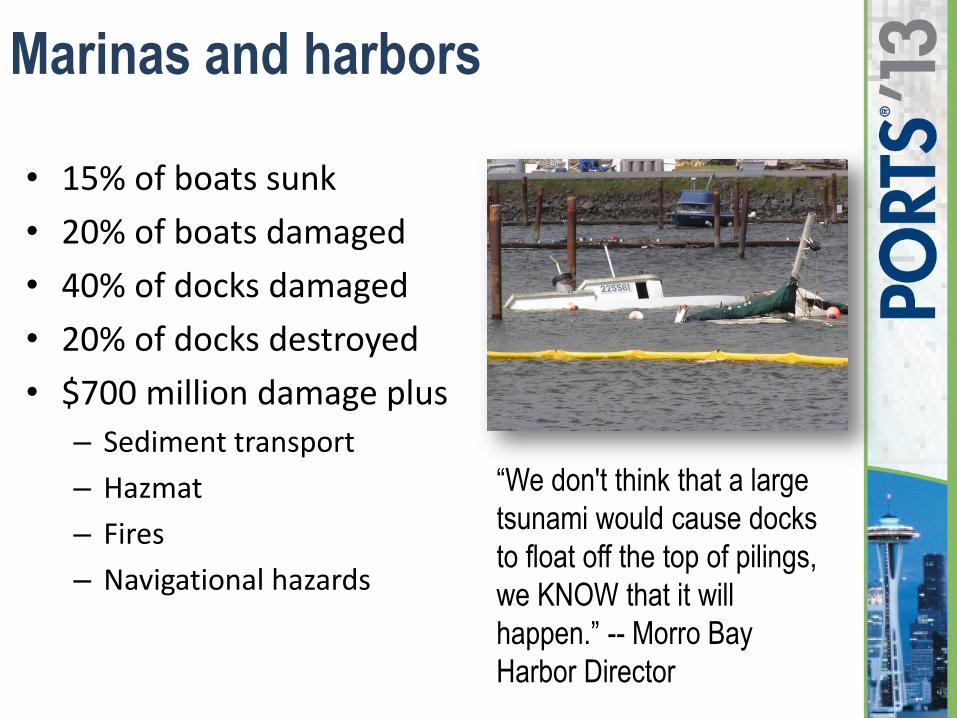
Marinas and harbors
• 15% of boats sunk
• 20% of boats damaged
• 40% of docks damaged
• 20% of docks destroyed
• $700 million damage plus
– Sediment transport
– Hazmat
– Fires
– Navigational hazards
9
“We don't think that a large
tsunami would cause docks
to float off the top of pilings,
we KNOW that it will
happen.” -- Morro Bay
Harbor Director
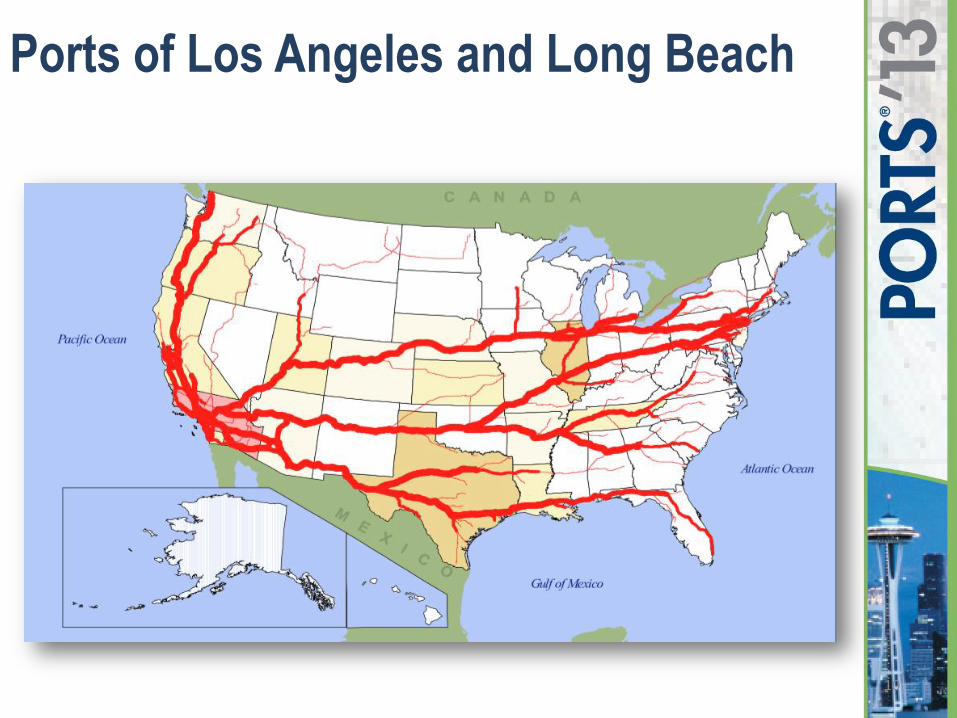
Ports of Los Angeles and Long Beach
10
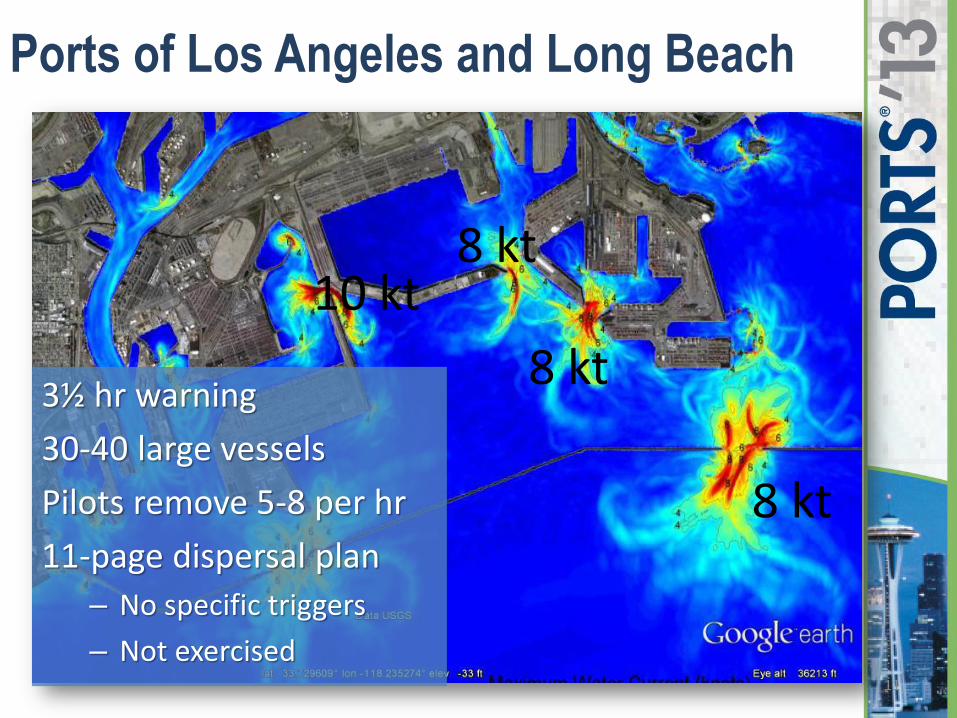
3½ hr warning
30-40 large vessels
Pilots remove 5-8 per hr
11-page dispersal plan
– No specific triggers
– Not exercised
Ports of Los Angeles and Long Beach
11
10 kt
8 kt
8 kt
8 kt
Ports of Los Angeles and Long Beach
12
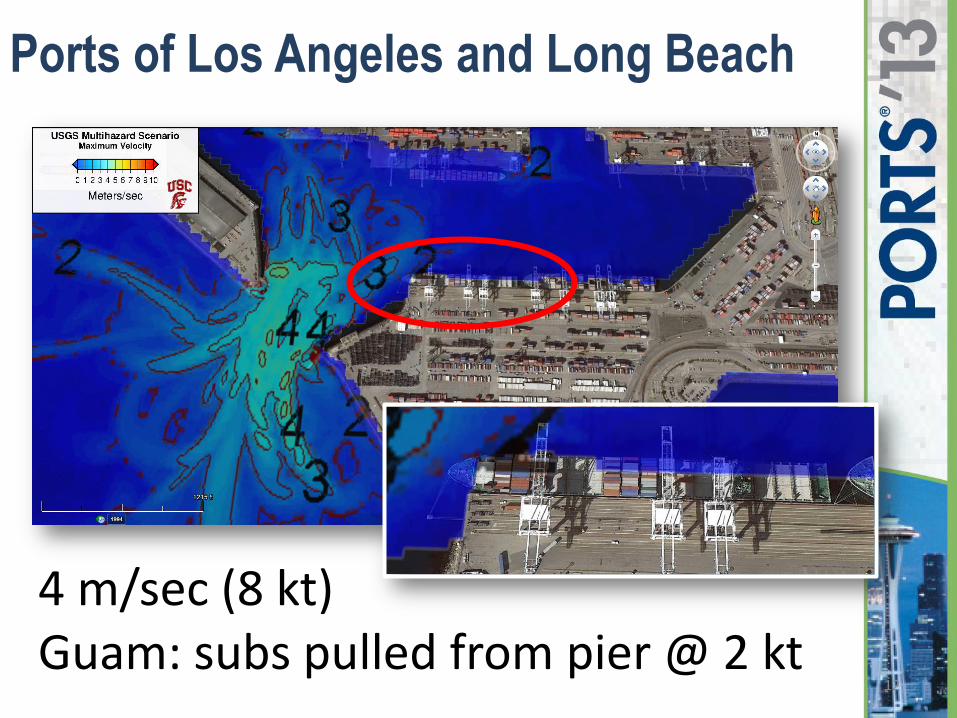
4 m/sec (8 kt) Guam: subs pulled from pier @ 2 kt
Ports of Los Angeles and Long Beach
13
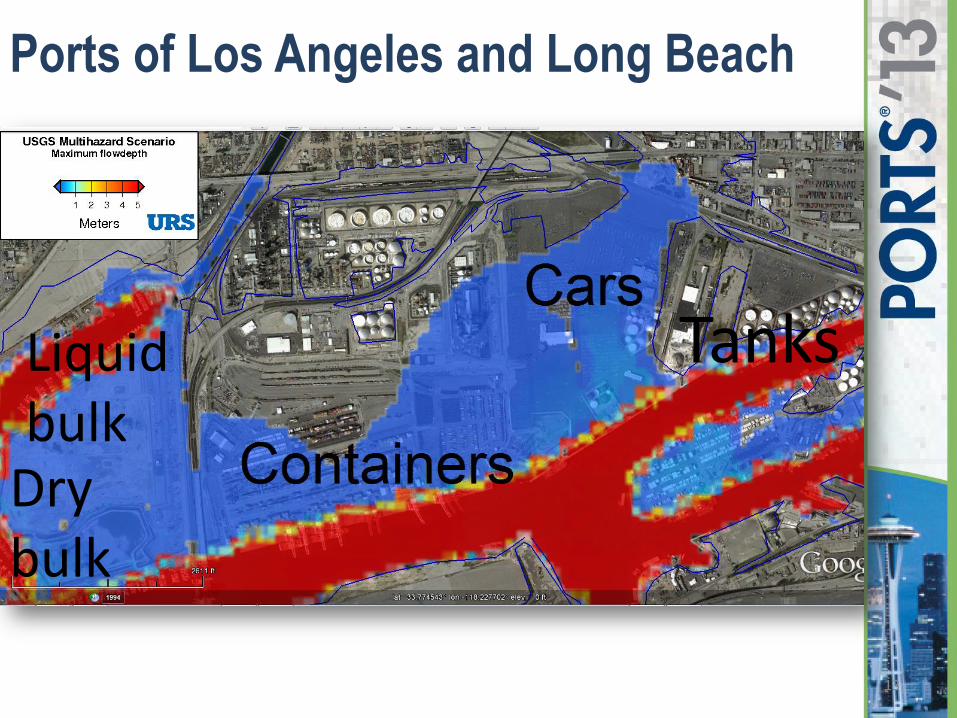
Tanks
Dry bulk
Liquid bulk
Ports of Los Angeles and Long Beach
Moffatt & Nichol estimate: $100 M damage
• 2,650 cars
• 1,040 TEUs
• Moorings, warehouses, equipment…
• 2-3 days downtime
Likely damage to other ports
Port Elizabeth: PANYNJ “need to stay out of the habit of only reacting to the last event.”
14
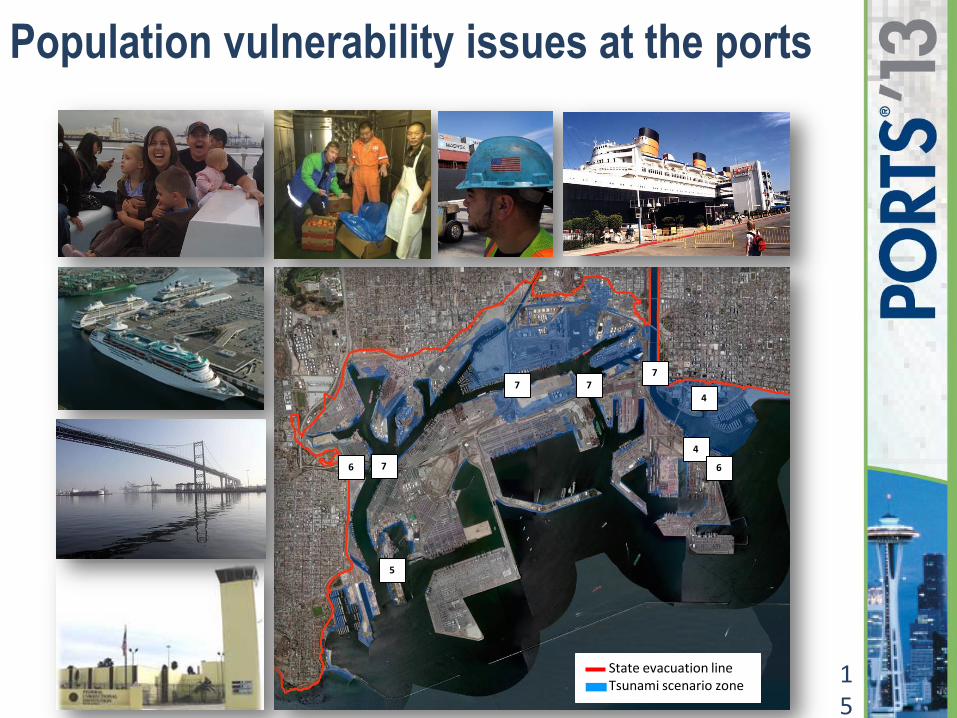
Population vulnerability issues at the ports
15
4
4 7
7
7
State evacuation line Tsunami scenario zone
6 6
5
7
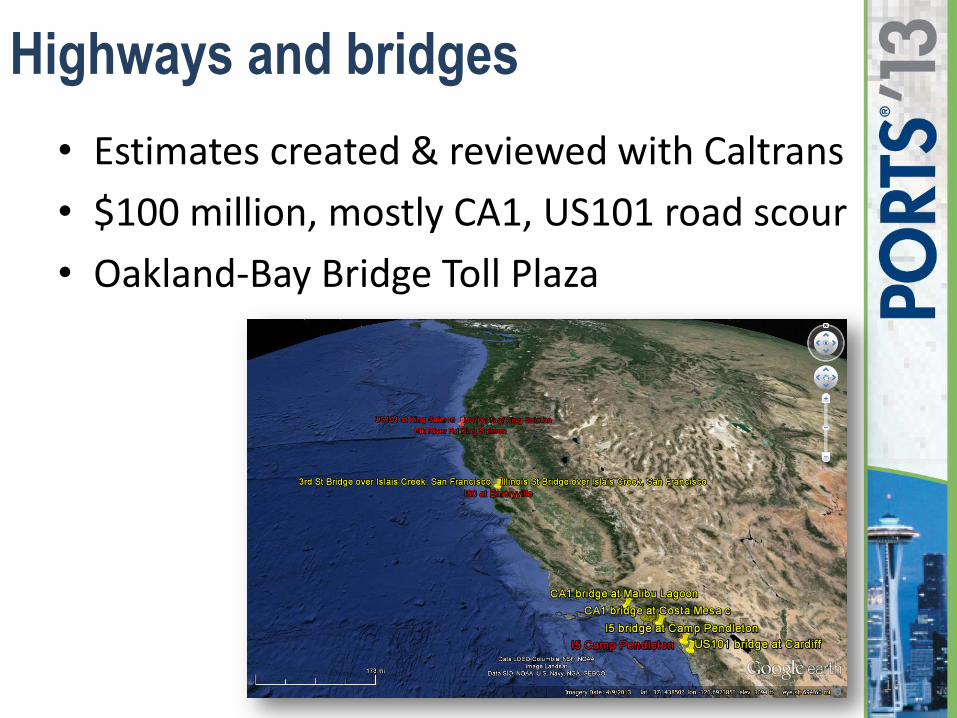
Highways and bridges
• Estimates created & reviewed with Caltrans
• $100 million, mostly CA1, US101 road scour
• Oakland-Bay Bridge Toll Plaza
16
Coastal homes & businesses
Wetted
• 13 counties, 1840 census blocks, 103 million sf (≈70,000 dwellings), $31B value
• 40% of property in Cal OES max inund. zone
Repair cost
• Using HAZUS (not “in” HAZUS)
• $2.6B, mostly contents
17
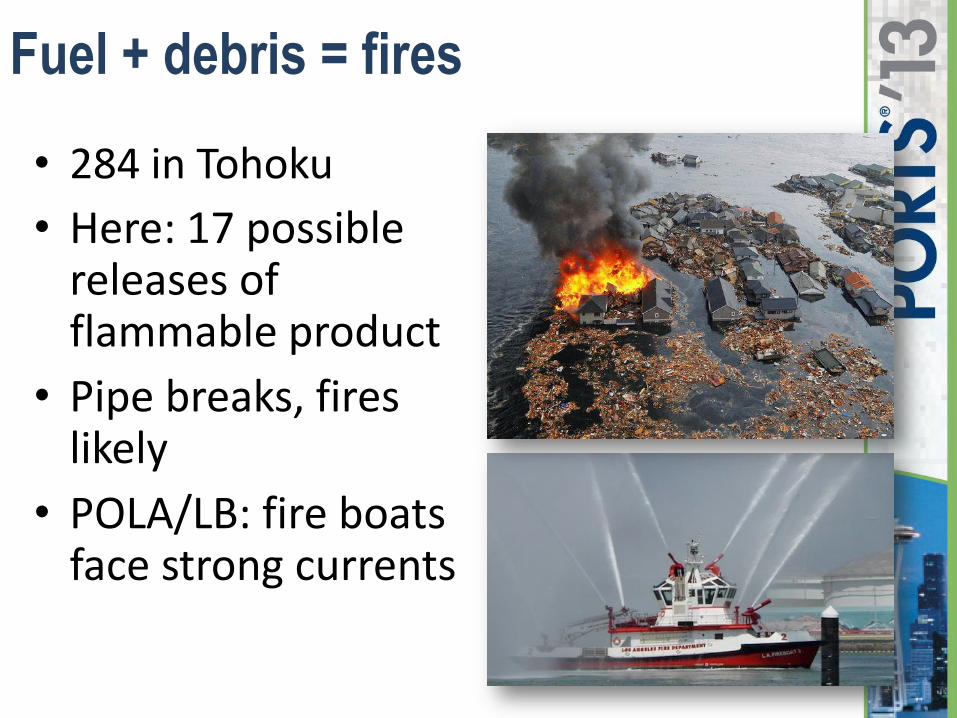
Fuel + debris = fires
• 284 in Tohoku
• Here: 17 possible releases of flammable product
• Pipe breaks, fires likely
• POLA/LB: fire boats face strong currents
18
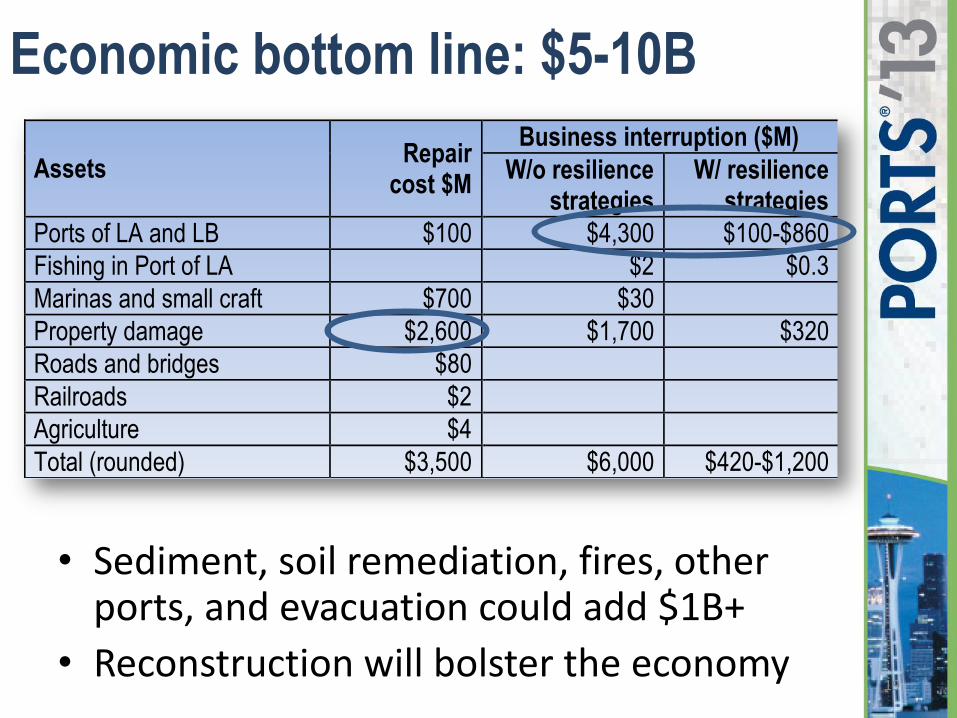
Economic bottom line: $5-10B
19
• Sediment, soil remediation, fires, other ports, and evacuation could add $1B+
• Reconstruction will bolster the economy
Assets Repair
cost $M
Business interruption ($M)
W/o resilience strategies
W/ resilience strategies
Ports of LA and LB $100 $4,300 $100-$860
Fishing in Port of LA $2 $0.3
Marinas and small craft $700 $30
Property damage $2,600 $1,700 $320
Roads and bridges $80
Railroads $2
Agriculture $4
Total (rounded) $3,500 $6,000 $420-$1,200
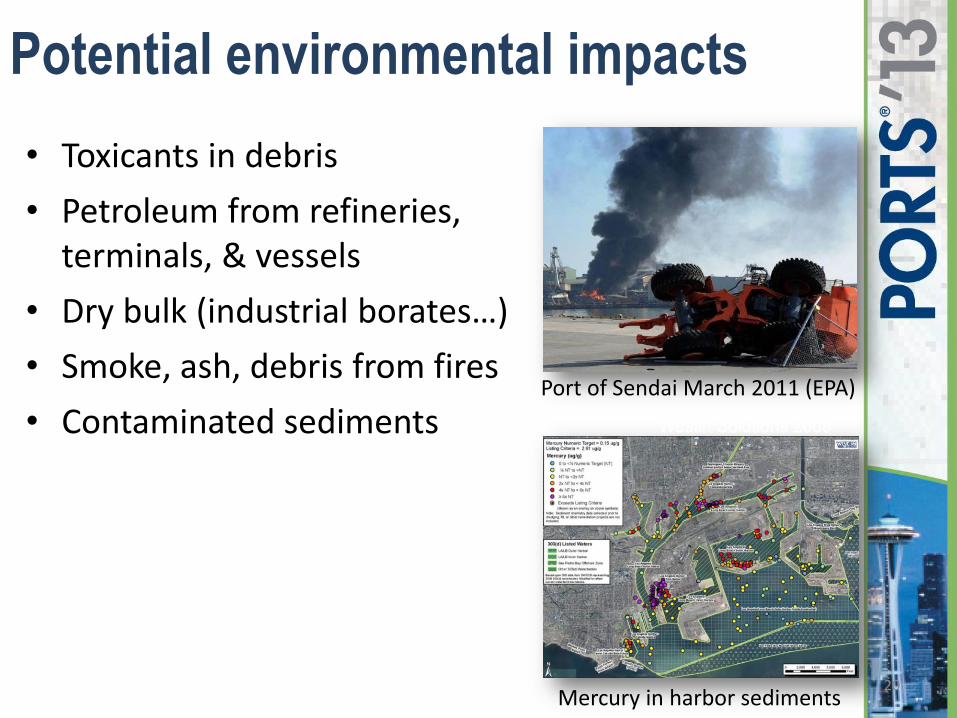
Potential environmental impacts
• Toxicants in debris
• Petroleum from refineries, terminals, & vessels
• Dry bulk (industrial borates…)
• Smoke, ash, debris from fires
• Contaminated sediments
20
Port of Sendai March 2011 (EPA)
Mercury in harbor sediments
Westin Solutions 2009
Public policy
• Federal and state tsunami-management policy is less developed than for other hazards
• Risk awareness gaps (public & coastal sectors) may undermine disaster management in a big tsunami
• Some maritime policy priorities:
– More detailed analyses to identify high-hazard areas & safer facility & passageways locations
– Port dispersal planning, training & exercise
– Review regulations to facilitate port recovery and reduce BI, e.g., dredging
21
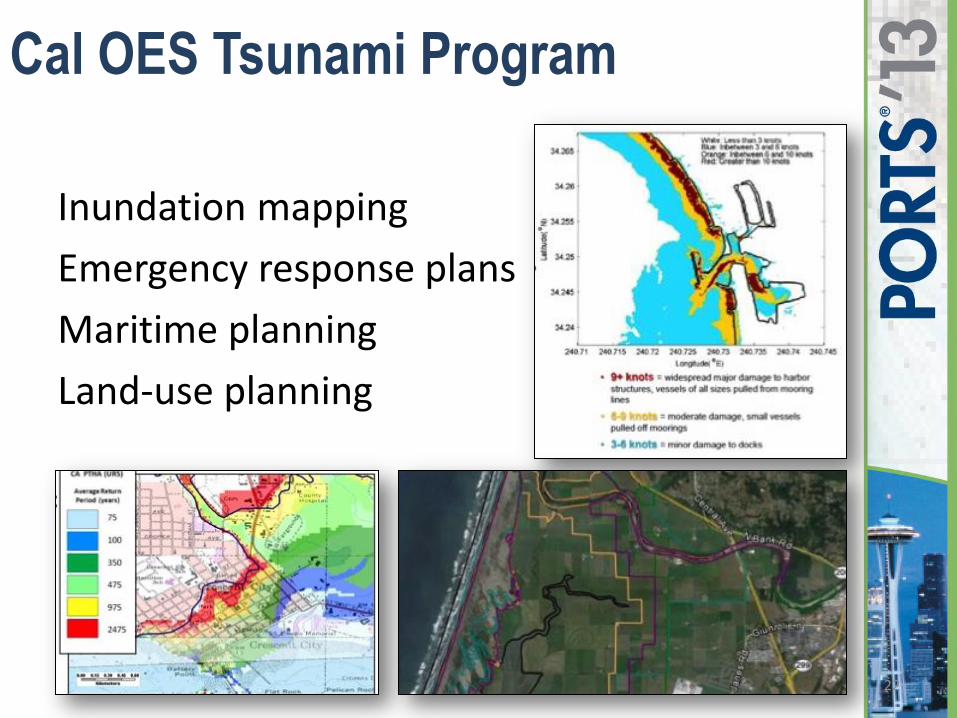
Cal OES Tsunami Program
22
Inundation mapping
Emergency response plans
Maritime planning
Land-use planning
Stakeholder survey & interviews
4 agencies, 37 respondents:
• Found presenters well qualified, realistic scenario, well-thought-out findings
• Using SAFRR info to improve preparedness
• Understand tsunamis better, more able to plan
• Improved networking, better understand other organizations
Challenges
• Info overload, organizational confidentiality 23
Conclusions
• Realistic, worth planning for
• Much more severe than 2010 & 2011
• CA lucky with tides in past tsunamis
• Affects the entire CA coast: ports, marinas, communities, transit, tourism, …
• Causes fires, hazmat, ecological damage
• Resilience strategies can make a big difference
• What are your science needs?
24
Learn more
CA county emergency managers
Workshops next 2 weeks throughout CA
Open file report September 2013
http://www.usgs.gov/natural_hazards/safrr
626-233-9758
25