Embed Size (px)
Citation preview

The Rural Economy of the East of Scotland
ESEP SeminarFraserburgh Lighthouse
Museum29 September 2003

Presentation
• the ESEP labour market service• defining the rural area• review of economic and labour
market data
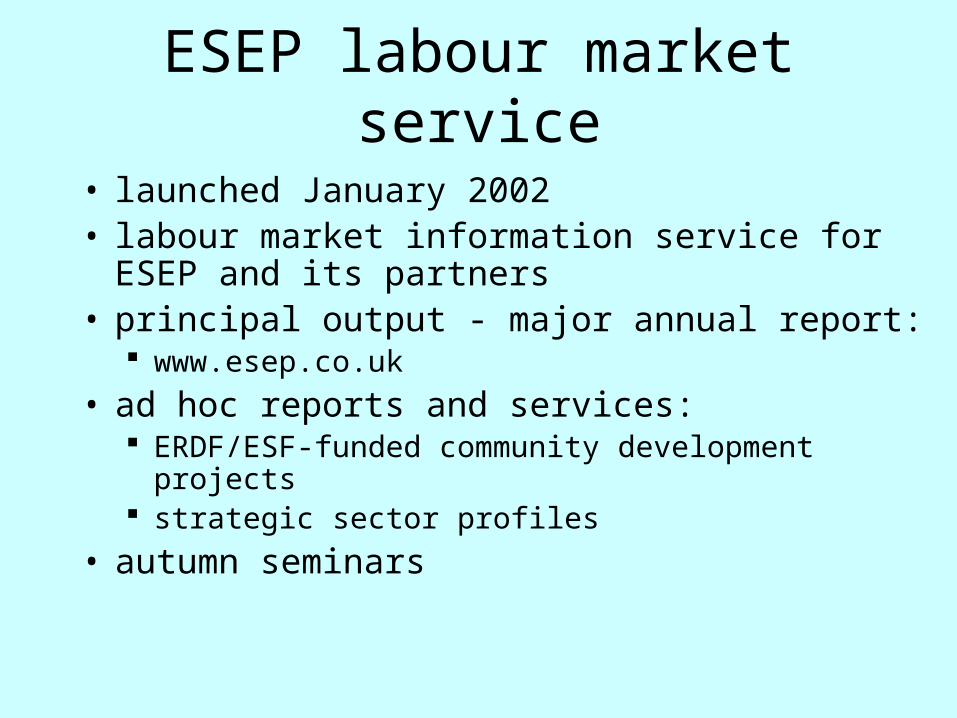
ESEP labour market service
• launched January 2002 • labour market information service for ESEP
and its partners• principal output - major annual report:
www.esep.co.uk
• ad hoc reports and services: ERDF/ESF-funded community development
projects strategic sector profiles
• autumn seminars

East of Scotland Programme Area
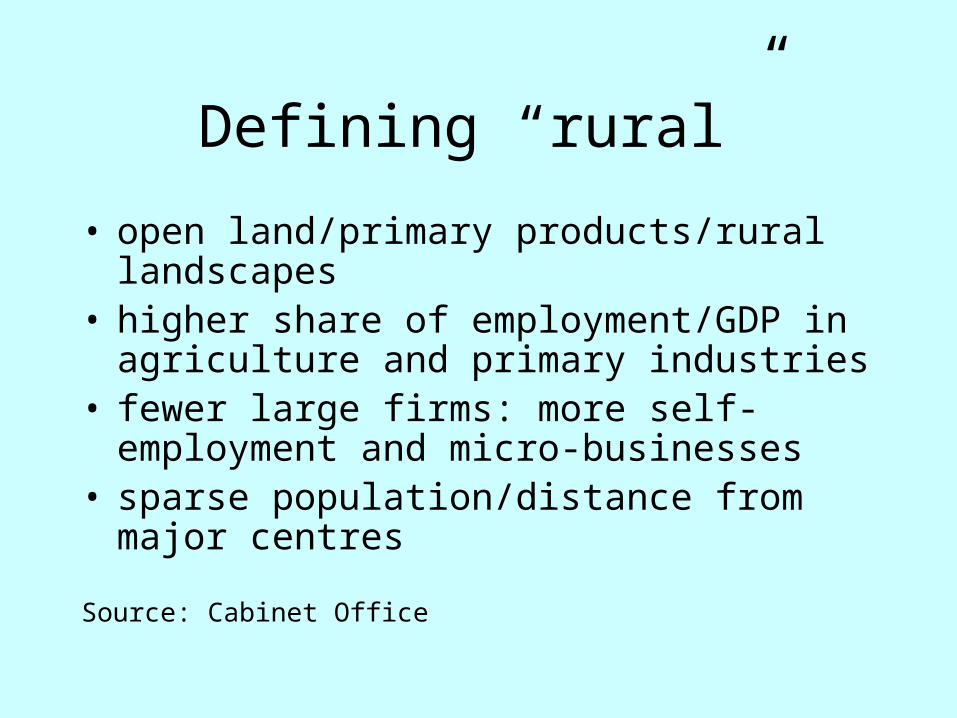
Defining “rural”
• open land/primary products/rural landscapes
• higher share of employment/GDP in agriculture and primary industries
• fewer large firms: more self-employment and micro-businesses
• sparse population/distance from major centres
Source: Cabinet Office

East of Scotland rural areas
• Aberdeenshire• Angus• Moray• Perth & Kinross• Stirling• …but that’s not the extent of it
– Clackmannanshire– Fife– Lothians
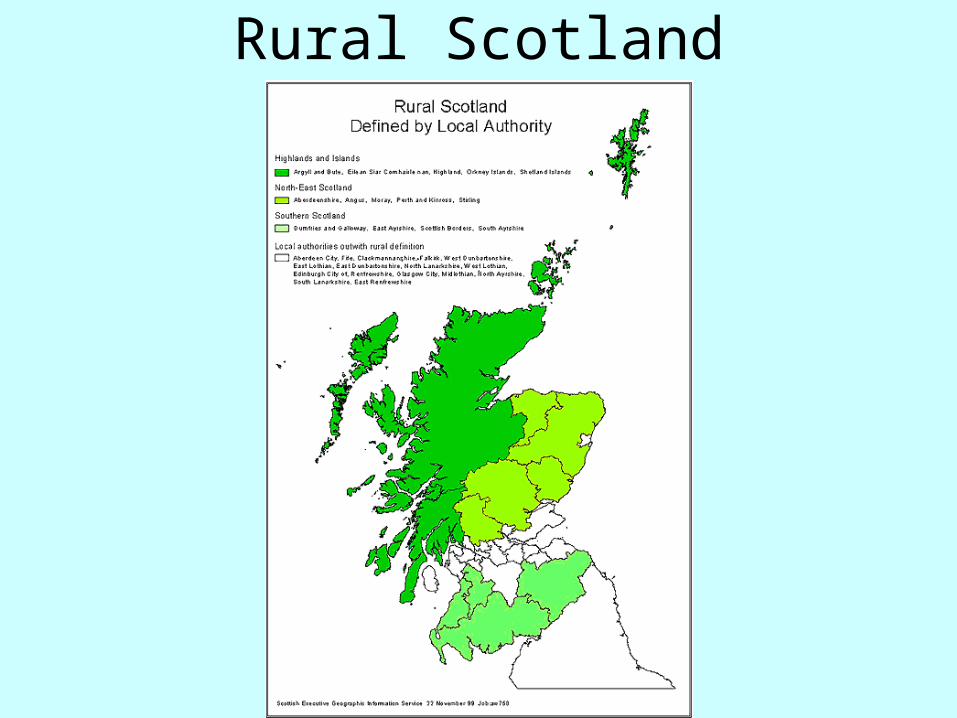
Rural Scotland
insert rural Scotland map

Degrees of rurality
• suburbia• city fringe• rurban commuter belt• accessible countryside• deep rural areas
– market towns– seaside resorts– industrial towns and villages

Scotland: urban-rural classification
insert 6-fold classification map

East of Scotland Objective 2/3 Programmes
• Priority 1 Strategic economic development– 1.1 SMEs– 1.2 Risk capital– 1.3 Technology/knowledge transfer
• Priority 2 Strategic locations & sectors– 2.1 Locations– 2.2 Locations and sectors
• Priority 3 Community economic development– 3.1 Community engagement and capacity building– 3.2 Social infrastructure– 3.3 Thematic community development
• Objective 3– Measure 2.3 Rural exclusion

The statistics
• the five Council areas compared:– with each other– with the rest of the Programme area– with rural Scotland– with Scotland
• health warning!
Population change 1991-2011
96%
97%
98%
99%
100%
101%
102%
103%
104%
1991 2001 2011
Source: General Registrar's Office
Ind
ex
sc
ale
19
91
=1
00
SCOTLAND ESEP Rural ESEP Rural Scotland

Population change 1991-2011
85%
90%
95%
100%
105%
110%
115%
1991 2001 2011
Source: General Registrar's Office
Ind
ex
sc
ale
19
91
=1
00
Aberdeenshire Angus Moray Perth & Kinross Stirling

The 10 towns: population change 1991-2001
1%
8%
4%
10%
5%
1%1%
-3% -3%-3%
14%
-6%
-4%
-2%
0%
2%
4%
6%
8%
10%
12%
14%
16%
Ba
nff
Ma
cd
uff
Inv
eru
rie
Ca
rno
us
tie
Mo
ntr
os
e
Elg
in
Ke
ith
Pe
rth
Pit
loc
hry
Sti
rlin
g
Ca
llan
de
r
Source: General Registrar's Office

Demographic change
• population growth in rural EoS outstrips rest of Scotland
• growth in the accessible countryside outstrips remote areas
• strong growth in:– Elgin, Inverurie, small cities
• decline in:– Banff, Keith, Montrose

Employee jobs change 1996-2001 (%)
10%9%
6%5%
0%
2%
4%
6%
8%
10%
12%
Scotland ESEP Local authorities ESEP RURAL LAs Rural Scotland LAs
Employee jobs change 1996-2001(%)
-3%
10%
7%
13%15%
-4%
-2%
0%
2%
4%
6%
8%
10%
12%
14%
16%
Aberdeenshire Angus Moray Perth & Kinross Stirling
Source: Annual Employment Survey/Annual Business Inquiry
Employee jobs change by type, 1996-2001(%)
9%8%
4%3%
13%11% 11%
10%
0%
2%
4%
6%
8%
10%
12%
14%
Scotland ESEP Local authorities ESEP Rural LAs Rural Scotland LAs
Source: Annual Employment Survey/Annual Business Inquiry
Full-time workers Part-time workers

Employee jobs change by type, 1996-2001(%)
0%
5%3% 4%
14%
-9%
19%15%
31%
15%
-10%
-5%
0%
5%
10%
15%
20%
25%
30%
35%
Aberdeenshire Angus Moray Perth and Kinross Stirling
Source: Annual Employment Survey/Annual Business Inquiry
Full-time workers Part-time workers
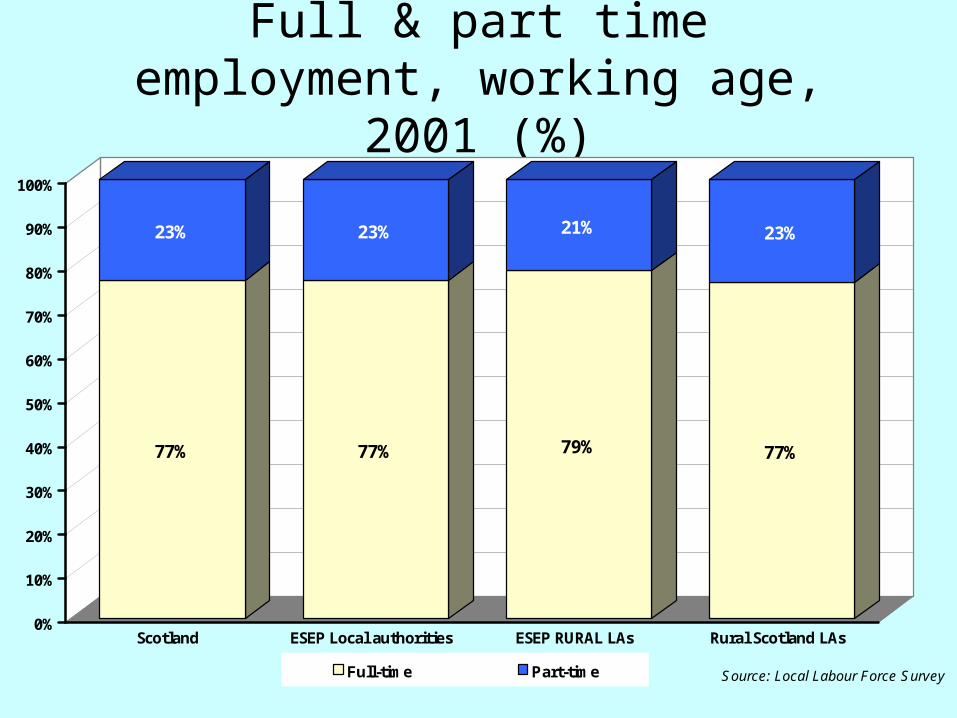
Full & part time employment, working age, 2001 (%)
77%
23%
77%
23%
79%
21%
77%
23%
0%
10%
20%
30%
40%
50%
60%
70%
80%
90%
100%
Scotland ESEP Local authorities ESEP RURAL LAs Rural Scotland LAs
Source: Local Labour Force SurveyFull-time Part-time

Full & part time employment, working age, 2001(%)
79%
21%
79%
21%
84%
16%
78%
22%
78%
22%
0%
10%
20%
30%
40%
50%
60%
70%
80%
90%
100%
Aberdeenshire Angus Moray Perthshire & Kinross Stirling
Source: Local Labour Force Survey Full-time Part-time
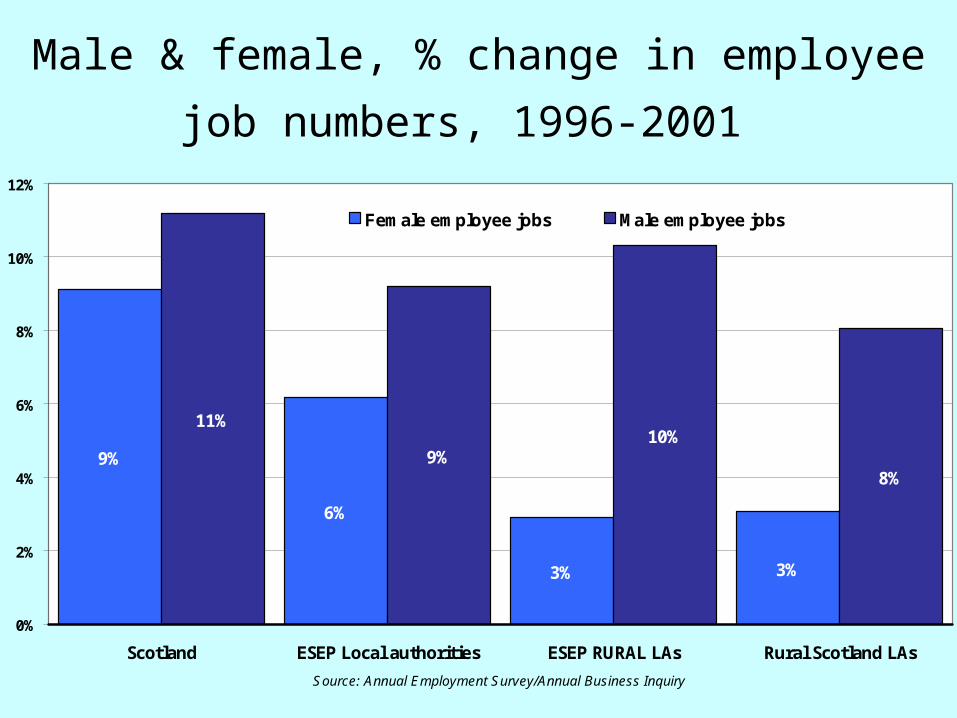
Male & female, % change in employee job
numbers, 1996-2001
9%
6%
3% 3%
11%
9%10%
8%
0%
2%
4%
6%
8%
10%
12%
Scotland ESEP Local authorities ESEP RURAL LAs Rural Scotland LAs
Source: Annual Employment Survey/Annual Business Inquiry
Female employee jobs Male employee jobs
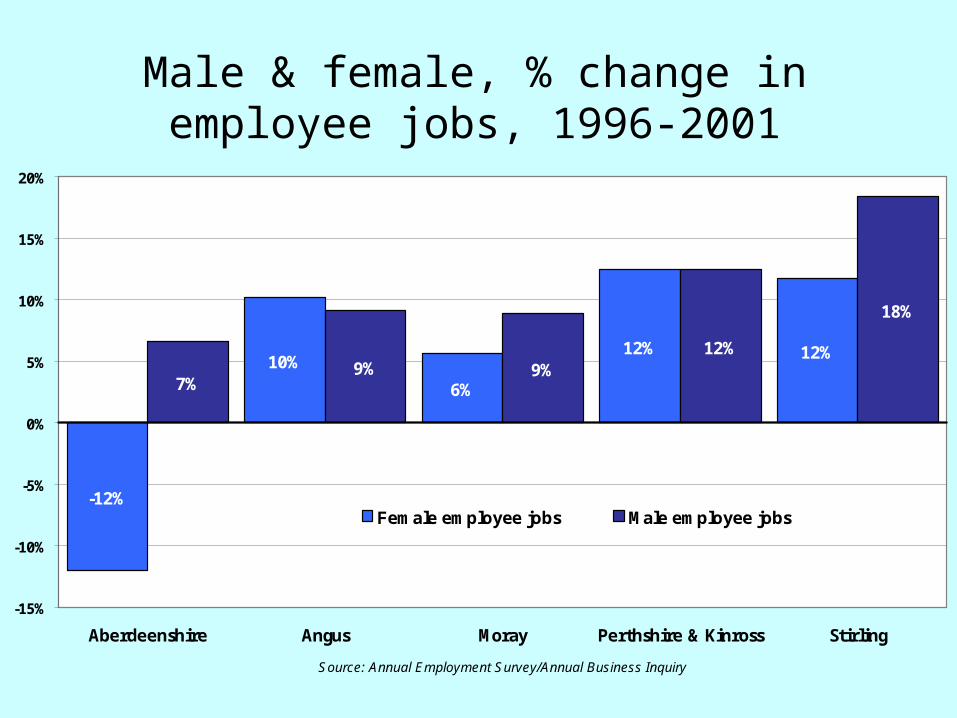
Male & female, % change in employee jobs, 1996-2001
-12%
10%
6%
12% 12%
7%9% 9%
12%
18%
-15%
-10%
-5%
0%
5%
10%
15%
20%
Aberdeenshire Angus Moray Perthshire & Kinross Stirling
Source: Annual Employment Survey/Annual Business Inquiry
Female employee jobs Male employee jobs

Employment trends• employment growth 96-01 slower in rural
areas than urban– east held back by Aberdeenshire figures
• strong employment growth in Stirling and Perth & Kinross– mostly in the cities?
• growth in P/T employment in P&K and Moray– but Moray still has low P/T employment
• strong increase in male employment– especially in Stirling

Agricultural workforce, Scotland, 1982-2002
0
10,000
20,000
30,000
40,000
50,000
60,000
70,000
80,000
90,000
1982
1983
1984
1985
1986
1987
1988
1989
1990
1991
1992
1993
1994
1995
1996
1997
1998
1999
2000
2001
2002
Source: Census of Agriculture, Scottish Executive
Full-time Part-time Casual and seasonal
1982 Total
76,2952002 Total
68,301

Forth Valley 8% Lothian
11% Fife 10%
Tayside 25%
NE Scotland* 46%
Source: Scottish Executive Agricultural Census (June 2002). Total agricultural employment: 26,100 (38% Scottish total). * NE Scotland comprises Grampian and Moray
Distribution of Agricultural Employment, 2002 (%)
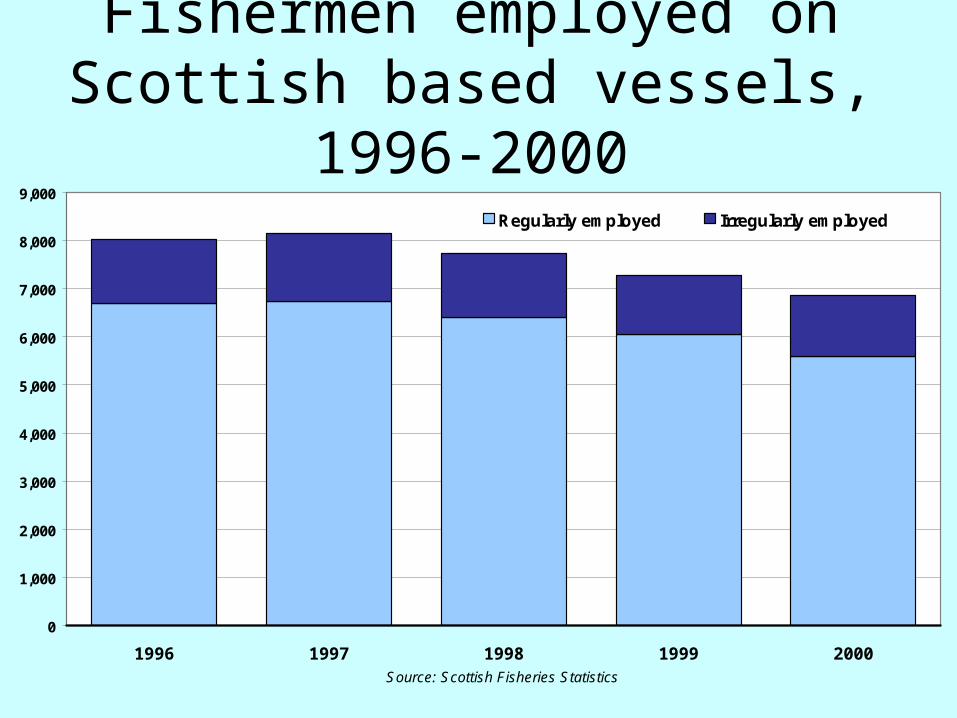
Fishermen employed on Scottish based vessels, 1996-
2000
0
1,000
2,000
3,000
4,000
5,000
6,000
7,000
8,000
9,000
1996 1997 1998 1999 2000Source: Scottish Fisheries Statistics
Regularly employed Irregularly employed

Fisheries employment by district & type, 2000
0
200
400
600
800
1000
1200
1400
Eyem
ou
th
Pit
ten
weem
Ab
erd
een
Pete
rhead
Fra
serb
urg
h
Bu
ckie
Scr
ab
ster
Ork
ney
Sh
etl
an
d
Sto
rnow
ay
Kin
loch
berv
ie
Loch
inver
Ull
ap
ool
Mall
aig
Port
ree
Ob
an
Cam
pb
elt
ow
n
Ayr
Source: Scotish Fisheries Statistics 2000
Regularly employed Irregularly employed

Agriculture and fishing• long-term decline in agricultural
workforce– big shift from f/t to p/t– 26,000 employed in EoS– of which 46% Grampian/Moray, 25% Tayside
• sharp decline in Scottish fisheries employment to <7,000– Fraserburgh top with 1,200– Peterhead 600– Buckie 400

Company base by firm size
Rural ESEP
0%
83%
14%3%
Scotland
4%
79%
1%
16%
1-10 employees 11-49 employees 50-199 employees 200+ employees

Employment by firm sizeESEP rural LAs
30%
25%
19%
26%
Scotland
25%
25%
31%
19%
1-10 employees 11-49 employees 50-199 employees 200 or more employees
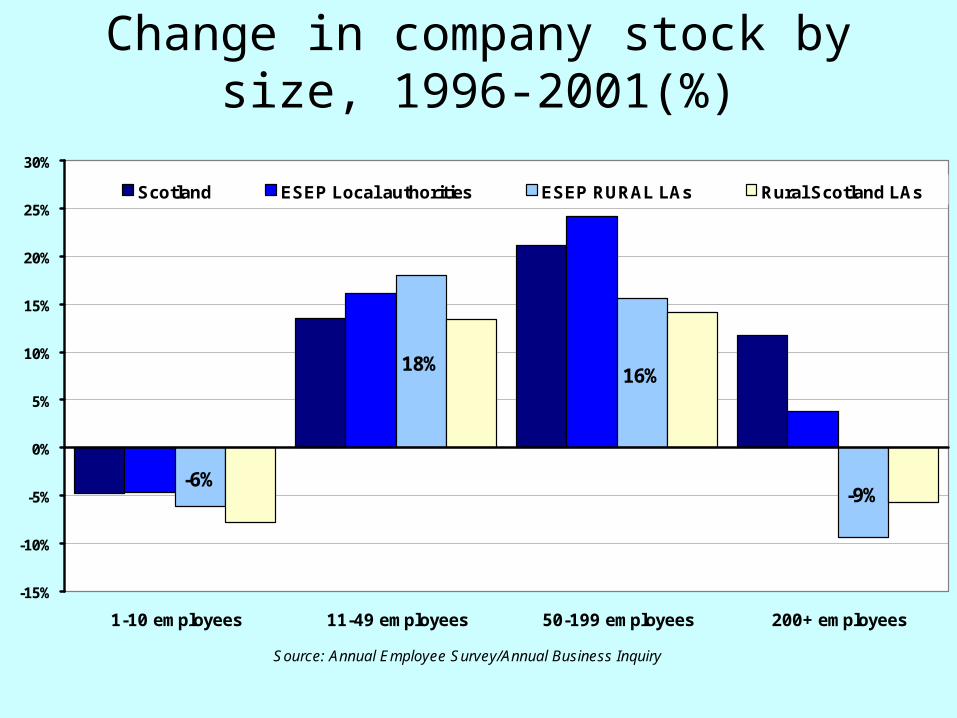
Change in company stock by size, 1996-2001(%)
-6%
18%16%
-9%
-15%
-10%
-5%
0%
5%
10%
15%
20%
25%
30%
1-10 employees 11-49 employees 50-199 employees 200+ employees
Source: Annual Employee Survey/Annual Business Inquiry
Scotland ESEP Local authorities ESEP RURAL LAs Rural Scotland LAs

0%
5%
10%
15%
20%
25%
Agri
cult
ure
, hunti
ng &
fore
str
y Fis
hin
g
Min
ing &
quarr
yin
g
Manufa
cturi
ng
Ele
ctri
city
, gas &
wate
rsupply
Constr
uct
ion
Whole
sale
/reta
il t
rade;
repair,
etc
Hote
ls &
resta
ura
nts
Transport
, sto
rage &
com
munic
ati
on
Fin
anci
al
inte
rmedia
tion
Real
esta
te,r
enti
ng,b
usin
ess
act
ivit
ies
Public
adm
in/d
efe
nce
;soci
al secu
rity
Educa
tion
Healt
h &
soci
al w
ork
Oth
er
com
munit
y,soci
al/pers
onal serv
ice
Source: Annual Business Inquiry/Annual Employment Survey
Scotland ESEP Local authorities ESEP RURAL LAs Rural Scotland LAs
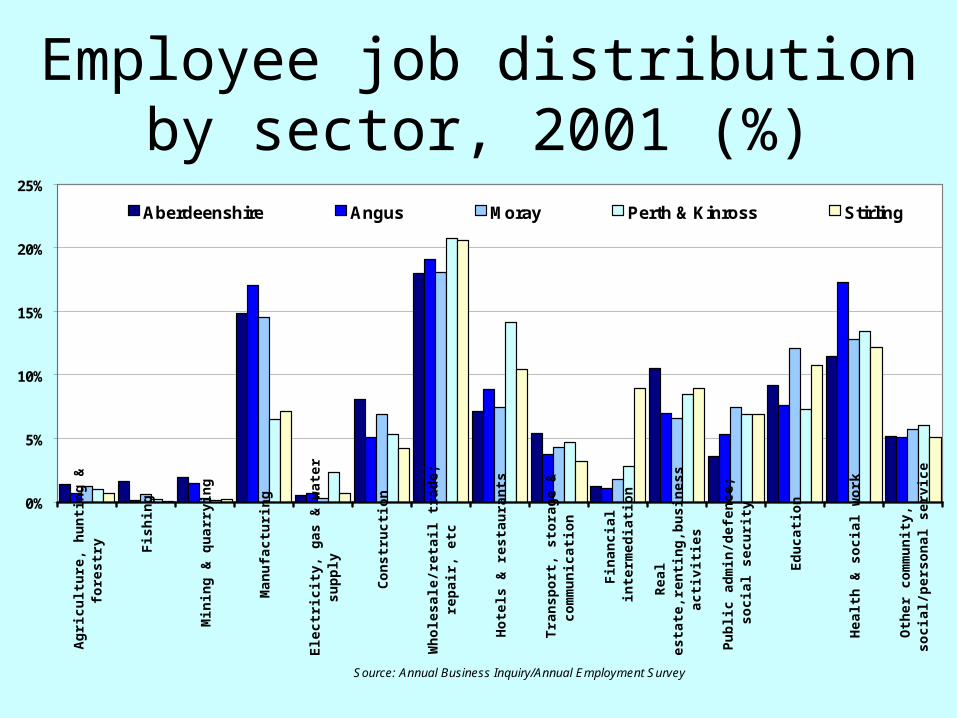
Employee job distribution by sector, 2001 (%)

Compared to Scotland, ESEP rural areas have…
• a higher proportion of jobs in– construction– wholesale, retail, repair– hotels and restaurants– health and social work
• a lower proportion of jobs in– financial services– business services
0%
5%
10%
15%
20%
25%
Ag
ricu
ltu
re,
hu
nti
ng
&fo
restr
y Fis
hin
g
Min
ing
& q
uarr
yin
g
Man
ufa
ctu
rin
g
Ele
ctr
icit
y,
gas &
wate
rsu
pp
ly
Con
str
ucti
on
Wh
ole
sale
/reta
il t
rad
e;
rep
air,
etc
Hote
ls &
resta
ura
nts
Tra
nsp
ort
, sto
rag
e &
com
mu
nic
ati
on
Fin
an
cia
lin
term
ed
iati
on
Real
esta
te,r
en
tin
g,b
usin
ess
acti
vit
ies
Pu
blic a
dm
in/d
efe
nce;
socia
l secu
rity
Ed
ucati
on
Healt
h &
socia
l w
ork
Oth
er
com
mu
nit
y,
socia
l/p
ers
on
al serv
ice
Source: Annual Business Inquiry/Annual Employment Survey
Aberdeenshire Angus Moray Perth & Kinross Stirling
Employee job distribution by sector, 2001 (%)

Differences between rural areas
• P&K and Stirling have:– much less manufacturing– more wholesale/retail and hotel/rest and
financial services
• Aberdeenshire has:– more construction and business services
• Moray has:– more education
• Angus has:– more health and social work

Sector performance/regional share (Scotland)
Employment Analysis Scotland: Local Share (2001), National Trends (1998-2001)
-15%
-10%
-5%
0%
5%
10%
15%
20%
0.0 0.5 1.0 1.5 2.0 2.5 3.0
Manufacturing Agriculture, hunting and forestry
Public admin, defence, social security
Mining and quarrying3.7/- 3%
Financial intermediation
Electricity, gas and water supply
Real estate, renting, business activities
Transport, storage and communication Health and social work
Hotels and restaurants
Education
Community, social/personal services
ConstructionWholesale/retail trade: repair, etc
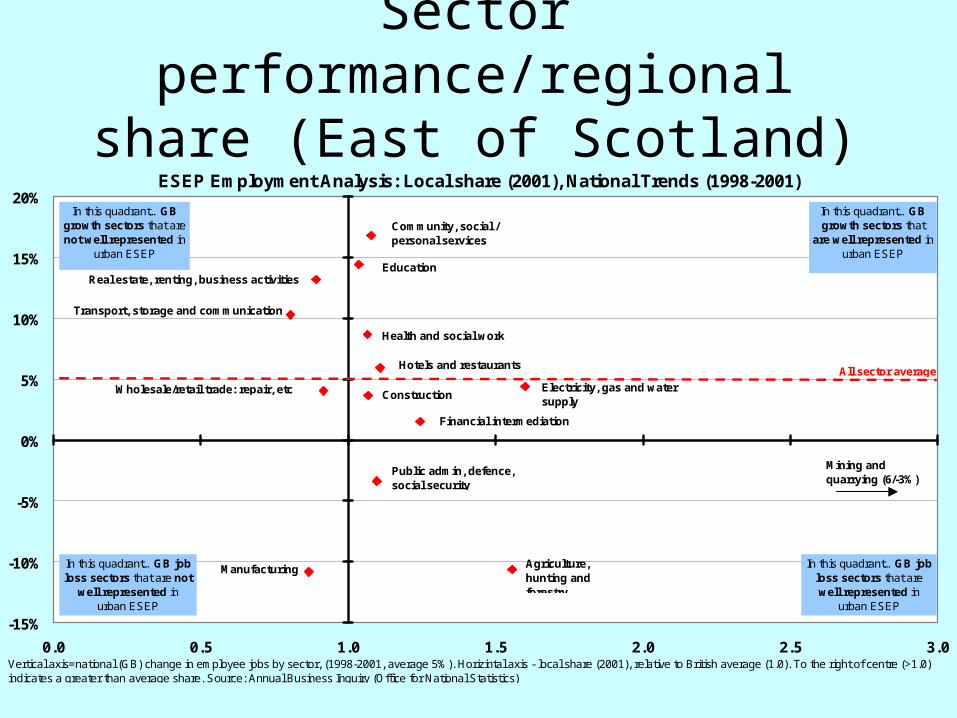
In this quadrant…GB growth sectors that are well
represented in rural ESEP
In this quadrant…GB job loss sectors that are well
represented in rural ESEP
In this quadrant…GB job loss sectors that are not well
represented in rural ESEP
In this quadrant…GB growth sectors that are not well
represented in rural ESEP
Vertical axis=national (GB) change in employee jobs by sector, (1998-2001, average 5%). Horizintal axis - local share (2001), relative to British average (1.0). To the right of centre (>1.0) indicates a greater than average share. Source: Annual Business Inquiry (Office for National Statistics)
All sector average
ESEP Employment Analysis: Local share (2001), National Trends (1998-2001)
-15%
-10%
-5%
0%
5%
10%
15%
20%
0.0 0.5 1.0 1.5 2.0 2.5 3.0
Agriculture, hunting and forestry
Manufacturing
Public admin, defence, social security
Mining and quarrying (6/-3%)
Financial intermediation
Electricity, gas and water supply
Real estate, renting, business activities
Transport, storage and communication
Health and social work
Hotels and restaurants
Education
Community, social / personal services
ConstructionWholesale/retail trade: repair, etc
In this quadrant…GB growth sectors that
are well represented in urban ESEP
In this quadrant…GB growth sectors that are not well represented in
urban ESEP
In this quadrant…GB job loss sectors that are not
well represented in urban ESEP
In this quadrant…GB job loss sectors that are well represented in
urban ESEP
Vertical axis=national (GB) change in employee jobs by sector, (1998-2001, average 5%). Horizintal axis - local share (2001), relative to British average (1.0). To the right of centre (>1.0) indicates a greater than average share. Source: Annual Business Inquiry (Office for National Statistics)
All sector average
Sector performance/regional share (East of Scotland)

Sector performance/regional share (5 rural areas)
Employment Analysis Rural ESEP: Local Share (2001), National Trends (1998-2001)
-15%
-10%
-5%
0%
5%
10%
15%
20%
0.0 0.5 1.0 1.5 2.0 2.5 3.0
Manufacturing Agriculture, hunting and forestry
Public admin, defence, social securityMining and quarrying
Financial intermediation
Electricity, gas and water supply
Real estate, renting, business activities
Transport, storage and communication
Health and social work
Hotels and restaurants
Education
Community, social/personal services
Construction
Wholesale/retail trade: repair, etc
In this quadrant…GB growth sectors that are well
represented in rural ESEP
In this quadrant…GB job loss sectors that are well
represented in rural ESEP
In this quadrant…GB job loss sectors that are not well
represented in rural ESEP
In this quadrant…GB growth sectors that are not well
represented in rural ESEP
Vertical axis=national (GB) change in employee jobs by sector, (1998-2001, average 5%). Horizintal axis - local share (2001), relative to British average (1.0). To the right of centre (>1.0) indicates a greater than average share. Source: Annual Business Inquiry (Office for National Statistics)
All sector average

The shape of the East of Scotland rural economy
• well-represented growth sectors– personal services, education, health/social,
hotel/catering, construction, wholesale/retail
• under-represented growth sectors– business services, financial services, transport/comm
• over-represented declining sectors– public admin, extractive, agriculture, fishing
• under-represented declining industries– manufacturing
• low-wage industries• public sector and caring• weak in tradeable services• doesn’t include most agri/fishing• big local variations

Sector performance/regional share (Scotland rural areas)
Employment Analysis Rural Scotland: Local Share (2001), National Trends (1998-2001)
-15%
-10%
-5%
0%
5%
10%
15%
20%
0.0 0.5 1.0 1.5 2.0 2.5 3.0
Manufacturing
Agriculture, hunting and forestry
Public admin, defence, social security Mining and quarrying
Financial intermediation
Electricity, gas and water supply
Real estate, renting, business activities
Transport, storage and communication Health and social work
Hotels and restaurants
EducationCommunity, social/personal services
ConstructionWholesale/retail trade: repair, etc
In this quadrant…GB growth sectors that are well
represented in rural ESEP
In this quadrant…GB job loss sectors that are well
represented in rural ESEP
In this quadrant…GB job loss sectors that are not well
represented in rural ESEP
In this quadrant…GB growth sectors that are not well
represented in rural ESEP
Vertical axis=national (GB) change in employee jobs by sector, (1998-2001, average 5%). Horizintal axis - local share (2001), relative to British average (1.0). To the right of centre (>1.0) indicates a greater than average share. Source: Annual Business Inquiry (Office for National Statistics)
All sector average

Change in VAT registered businesses, 1996-2001 (%)
0.3%
-0.3%
2.5%
0.8%
-0.5%
0.0%
0.5%
1.0%
1.5%
2.0%
2.5%
3.0%
Scotland ESEP Local authorities ESEP RURAL LAs Rural Scotland LAs
Source: Office of National Statistics

Change in VAT registered businesses, 1996-2001 (%)
-1.7%
-3.3%
9.2%
0.2%
-0.4%
-4%
-2%
0%
2%
4%
6%
8%
10%
Aberdeenshire Angus Moray Perthshire & Kinross Stirling
Source: Office of National Statistics

Change in number of self employed, 1997-2003 (%)
3% 5% 4%
-7%
-20%
-15%
-10%
-5%
0%
5%
10%
15%
20%
25%
Scotland ESEP Local authorities ESEP RURAL LAs Rural Scotland LAs
Source: Labour Force Survey - figures based on a rolling average.
Change 97-00 Change 00-03 Change 97-03

Self employed as % of all in employment, 1997-
2003
0%
2%
4%
6%
8%
10%
12%
14%
16%
18%
Scotland ESEP Local authorities ESEP RURAL LAs Rural Scotland LAs
Source: Labour Force Survey (Figures based on a rolling average of previous quarters)
year to May 97 year to May 03
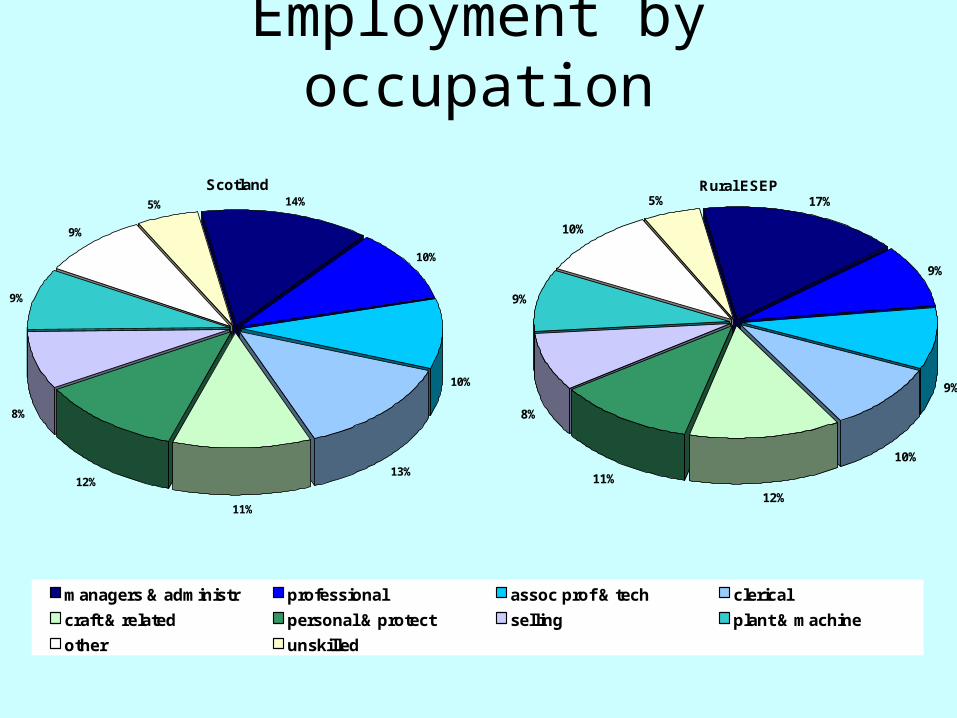
Employment by occupation
Rural ESEP17%
9%
9%
10%
12%
11%
8%
9%
10%
5%Scotland
14%
10%
10%
13%
11%
12%
8%
9%
9%
5%
14%10%10%13%11%12%
8%9%9%5%managers & administr professional assoc prof & tech clerical
craft & related personal & protect selling plant & machine
other unskilled
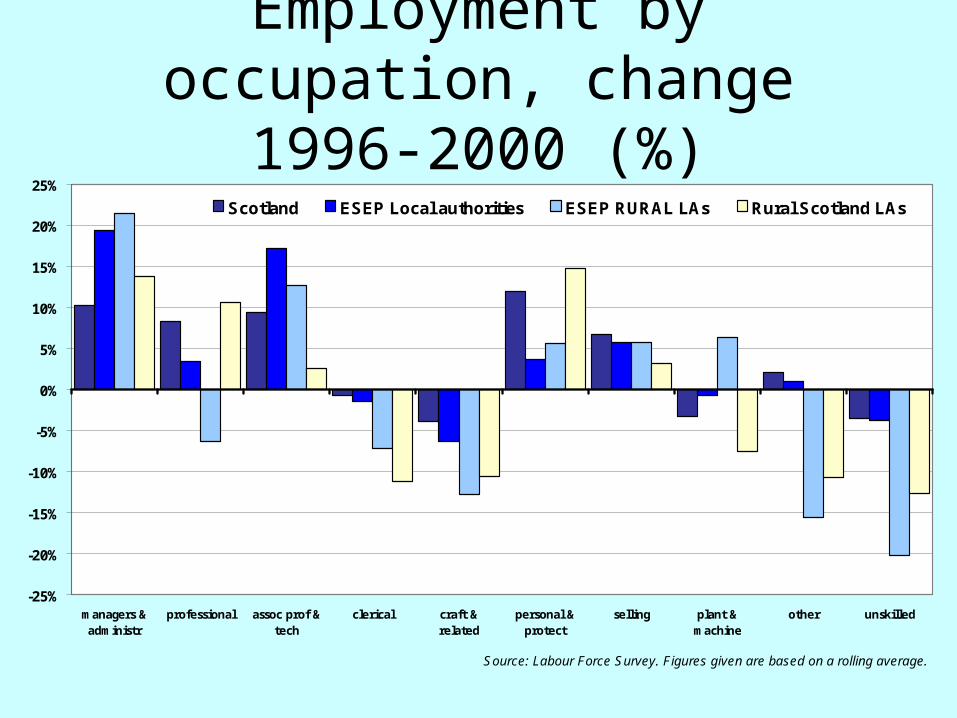
Employment by occupation, change 1996-
2000 (%)
-25%
-20%
-15%
-10%
-5%
0%
5%
10%
15%
20%
25%
managers &administr
professional assoc prof &tech
clerical craft &related
personal &protect
selling plant &machine
other unskilled
Source: Labour Force Survey. Figures given are based on a rolling average.
Scotland ESEP Local authorities ESEP RURAL LAs Rural Scotland LAs
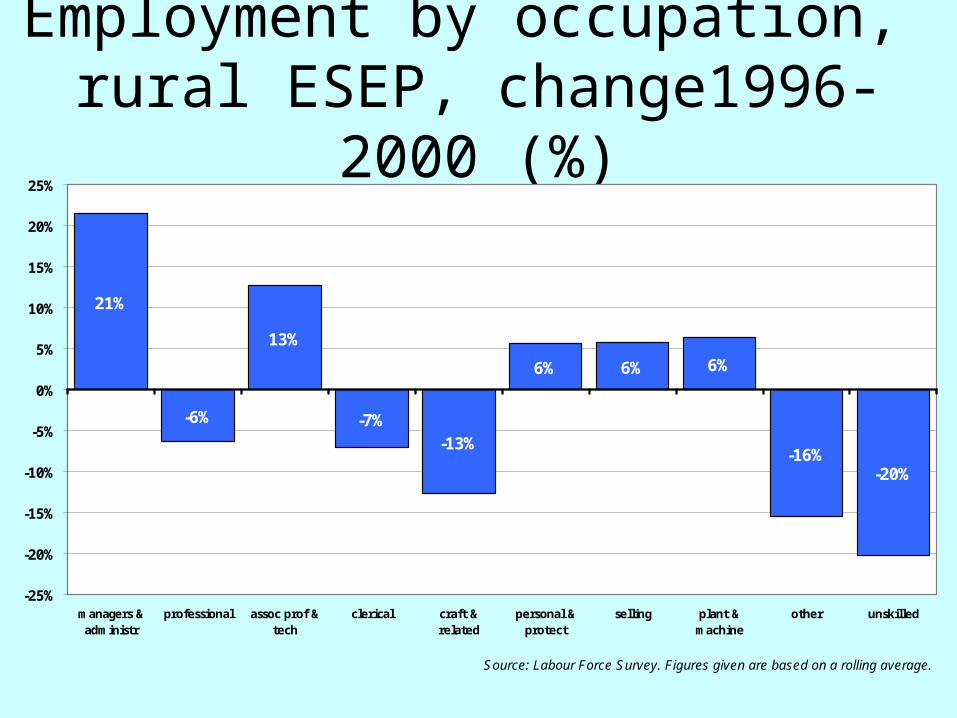
Employment by occupation, rural ESEP, change1996-2000
(%)
21%
-6%
13%
-7%-13%
6% 6% 6%
-16%-20%
-25%
-20%
-15%
-10%
-5%
0%
5%
10%
15%
20%
25%
managers &administr
professional assoc prof &tech
clerical craft &related
personal &protect
selling plant &machine
other unskilled
Source: Labour Force Survey. Figures given are based on a rolling average.
Occupational mix
• labour force composition in line with Scotland
• change 1996-2000 patchy, but EoS has seen:– strong growth in managerial/professional/
technician– sharp decline in craft and unskilled jobs

Average gross weekly wage,
1999-2002 (£/%)
£0
£50
£100
£150
£200
£250
£300
£350
£400
Scotland ESEP Local authorities ESEP RURAL LAs Rural Scotland LAs
Source: New Earnings Survey
1999 2002
14%
13%15%
16%

Average gross weekly wage,1999-2002 (£/%)
£0
£50
£100
£150
£200
£250
£300
£350
£400
Aberdeenshire Angus Moray Perthshire &Kinross
Stirling
Source: New Earnings Survey
1999 2002
19% 26%12%
6%6%

Average earnings
• EoS 5 lag behind urban Scotland– no sign of gap closing
• earnings significantly higher in accessible countryside than remote

Economic activity rates, working age, 1996-2001
(%)
82%84%81%79%
0
10
20
30
40
50
60
70
80
90
100
Scotland ESEP Local authorities ESEP RURAL LAs Rural Scotland LAs
Source: Local Labour Force Survey (Office of National Statistics)
1996 1997 1998 1999 2000 2001

Economic activity rates, working age, 1996-2001
(%)
84% 86% 83% 85%78%
0
10
20
30
40
50
60
70
80
90
100
Aberdeenshire Angus Moray Perthshire & Kinross Stirling
Source: Local Labour Force Survey (Office of National Statistics)
1996 1997 1998 1999 2000 2001

The 10 towns: economic activity rates, aged 16-74,
2001(%)
0%
10%
20%
30%
40%
50%
60%
70%
80%
90%
100%
Ba
nff
Ma
cd
uff
Inv
eru
rie
Ca
rno
us
tie
Mo
ntr
os
e
Elg
in
Ke
ith
Pe
rth
Pit
loc
hry
Sti
rlin
g
Ca
llan
de
r
Source: Census 2001
Scottish average

Economic activity
• activity rates in the EoS 5 higher than in urban areas– …except Stirling– local variations
• unemployment rates consistently low– especially in remote rural areas

Change in number of claimants, June 1984-03 (%)
20%
40%
60%
80%
100%
120%
140%
year
to J
une 8
4
year
to J
une 8
6
year
to J
une 8
8
year
to J
une 9
0
year
to J
une 9
2
year
to J
une 9
4
year
to J
une 9
6
year
to J
une 9
8
year
to J
une 0
0
year
to J
une 0
2
Ind
ex s
cale
Ju
ne
1984
=100
Scotland ESEP Local authorities ESEP RURAL LAs Rural Scotland LAs

Claimant count rate as proportion of working age residents, 1998-2003
(%)
0
0.5
1
1.5
2
2.5
3
3.5
4
4.5
5
Jul-
98
Sep-9
8
Nov-9
8
Jan-9
9
Mar-
99
May-9
9
Jul-
99
Sep-9
9
Nov-9
9
Jan-0
0
Mar-
00
May-0
0
Jul-
00
Sep-0
0
Nov-0
0
Jan-0
1
Mar-
01
May-0
1
Jul-
01
Sep-0
1
Nov-0
1
Jan-0
2
Mar-
02
May-0
2
Jul-
02
Sep-0
2
Nov-0
2
Jan-0
3
Mar-
03
May-0
3
Jul-
03
Scotland ESEP Local authorities ESEP RURAL LAs Rural Scotland LAs

Change in number of claimants, June 1984-03 (%)
20%
40%
60%
80%
100%
120%
140%
160%
year
to J
une 8
4
year
to J
une 8
6
year
to J
une 8
8
year
to J
une 9
0
year
to J
une 9
2
year
to J
une 9
4
year
to J
une 9
6
year
to J
une 9
8
year
to J
une 0
0
year
to J
une 0
2
Ind
ex
sc
ale
Ju
ne
19
84
=1
00
Aberdeenshire Angus Moray Perthshire & Kinross Stirling
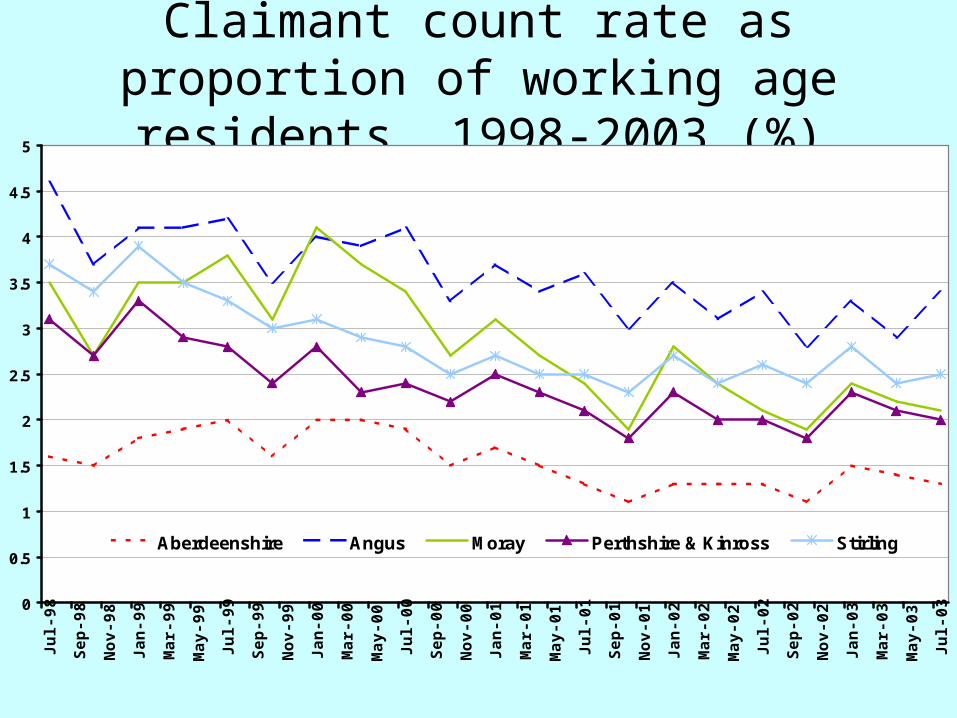
Claimant count rate as proportion of working age residents, 1998-
2003 (%)
0
0.5
1
1.5
2
2.5
3
3.5
4
4.5
5
Jul-
98
Sep-9
8
Nov-9
8
Jan-9
9
Mar-
99
May-9
9
Jul-
99
Sep-9
9
Nov-9
9
Jan-0
0
Mar-
00
May-0
0
Jul-
00
Sep-0
0
Nov-0
0
Jan-0
1
Mar-
01
May-0
1
Jul-
01
Sep-0
1
Nov-0
1
Jan-0
2
Mar-
02
May-0
2
Jul-
02
Sep-0
2
Nov-0
2
Jan-0
3
Mar-
03
May-0
3
Jul-
03
Aberdeenshire Angus Moray Perthshire & Kinross Stirling
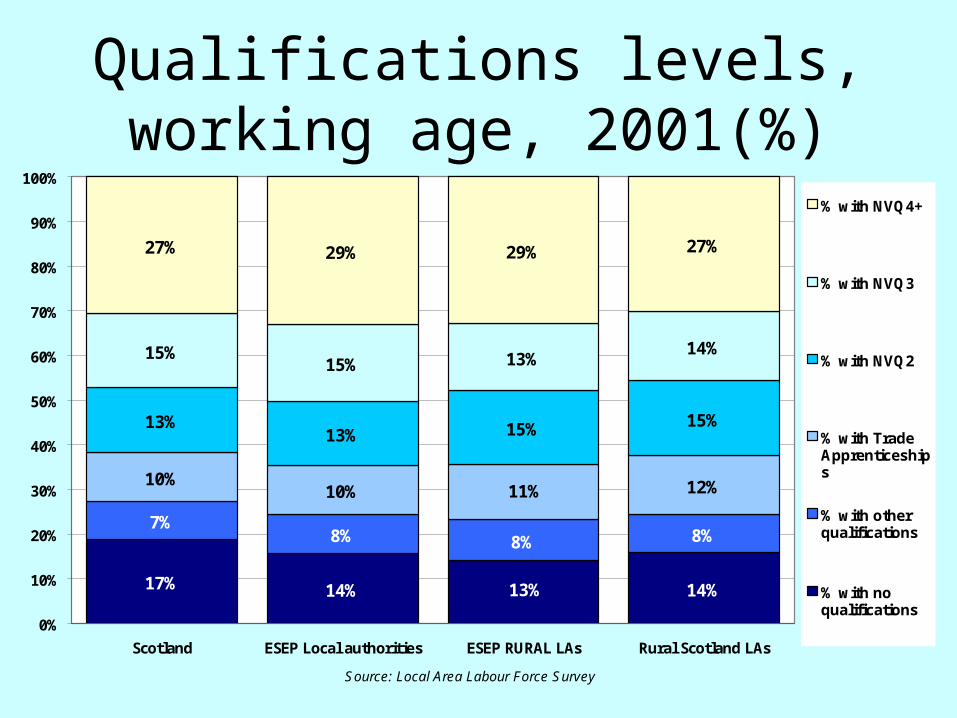
Qualifications levels, working age, 2001(%)
14%13%14%17%
8%8%8%7%
12%11%10%10%
15%15%13%13%
14%13%15%
15%
27%29%29%27%
0%
10%
20%
30%
40%
50%
60%
70%
80%
90%
100%
Scotland ESEP Local authorities ESEP RURAL LAs Rural Scotland LAs
Source: Local Area Labour Force Survey
% with NVQ4+
% with NVQ3
% with NVQ2
% with TradeApprenticeships
% with otherqualifications
% with noqualifications
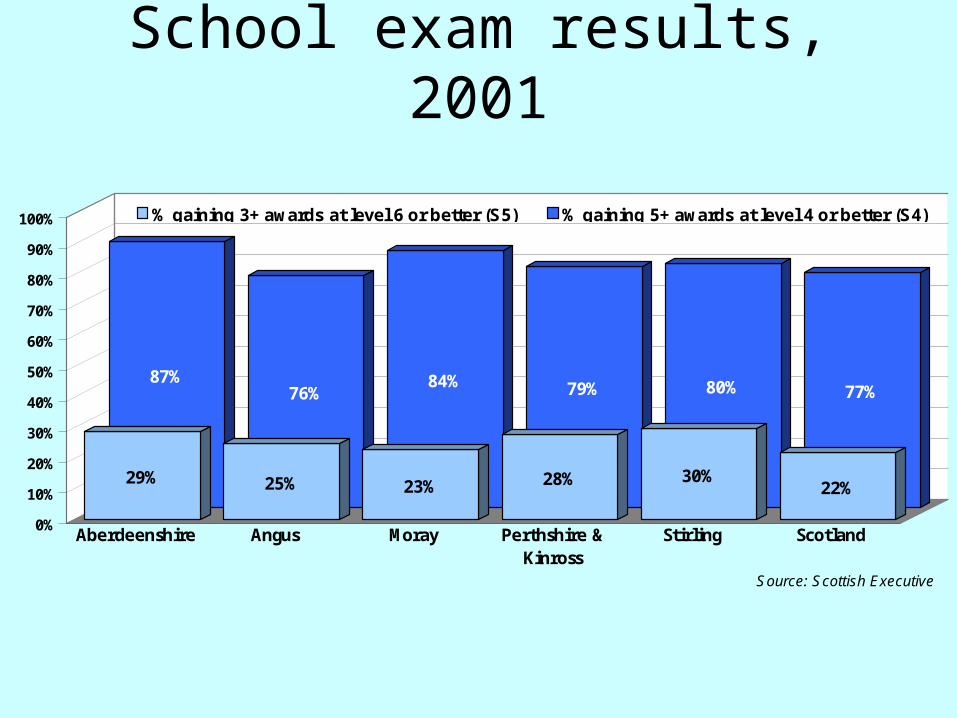
School exam results, 2001
87%76%
84% 79% 80% 77%
29% 25% 23% 28% 30%22%
0%
10%
20%
30%
40%
50%
60%
70%
80%
90%
100%
Aberdeenshire Angus Moray Perthshire &Kinross
Stirling Scotland
Source: Scottish Executive
% gaining 3+ awards at level 6 or better (S5) % gaining 5+ awards at level 4 or better (S4)
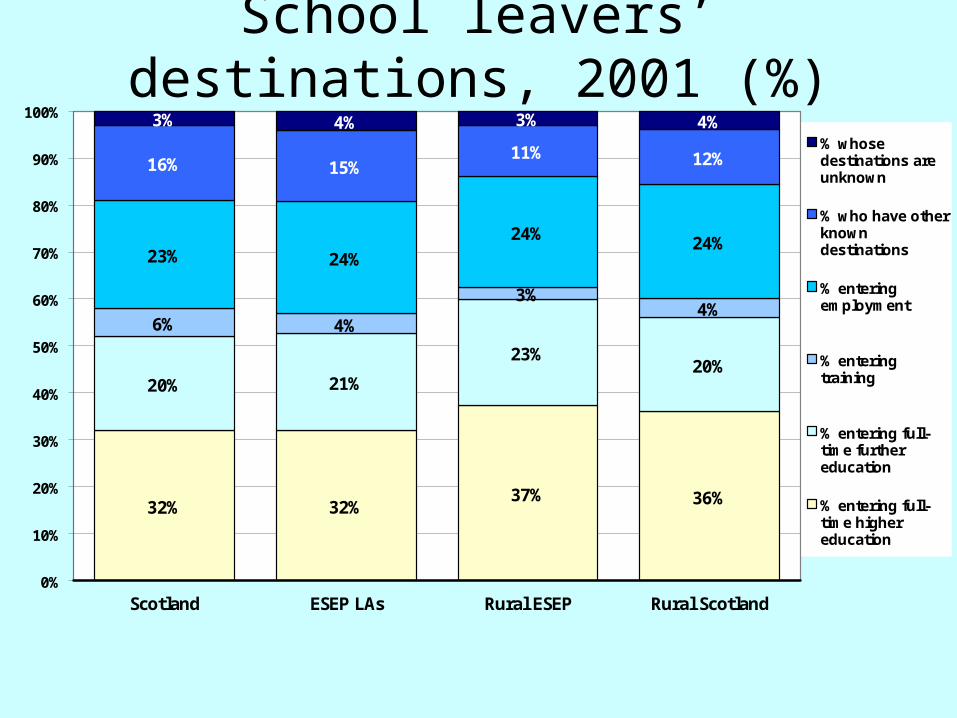
School leavers’ destinations, 2001 (%)
32% 32%37% 36%
20% 21%
23%20%
6% 4%
3%4%
23% 24%
24% 24%
16% 15%11% 12%
3% 4% 3% 4%
0%
10%
20%
30%
40%
50%
60%
70%
80%
90%
100%
Scotland ESEP LAs Rural ESEP Rural Scotland
% whosedestinations areunknown
% who have otherknowndestinations
% enteringemployment
% enteringtraining
% entering full-time furthereducation
% entering full-time highereducation

School leavers’ destinations, 2001 (%)
41%34% 31%
40% 36%
25%30%
23%
17%14%
4%
2%3%
7%
24% 17%32% 25%
22%
7% 13% 10% 12% 18%
3% 2% 3% 4% 3%
0%
10%
20%
30%
40%
50%
60%
70%
80%
90%
100%
Aberdeenshire Angus Moray Perthshire &Kinross
Stirling
% whosedestinations areunknown
% who have otherknowndestinations
% enteringemployment
% enteringtraining
% entering full-time furthereducation
% entering full-time highereducation

School qualifications, 2001
%S4 gaining 5+ awards at level 4 or better

School qualifications, 2001
%S5 gaining 3+ awards at level 6


Summing up
• on the face of it, the rural economy is less different than you might expect
• …there is still a divide between remote and accessible rural areas
• …and an east-west divide – rural and urban
• digging deeper, there are issues about:– industry structure– self-employment– manual jobs– low wages– high activity rates/low unemployment– rural poverty
Commentary
Professor Mark ShucksmithArkleton Centre for Rural
Development,University of Aberdeen

Commentary
• what are the forces underlying these trends, and what will they be in future?
• how do these trends relate to deprivation and social exclusion?
• low incomes, low pay, unemployment• barriers to labour market inclusion?• some issues for discussion

Forces for change - markets
• globalisation of production and moves towards flexible specialisation and the new economy: how does this affect rural areas?
• global capital or local capital?• future prosperity reflects, perhaps,
– sense of regional identity and social cohesion
– entrepreneurial climate– level of education– attractive cultural and natural environment

Conceptualising social exclusion & inclusion
• “exclusion is an idea which poses the right kind of questions.” (Donnison 1998)
• a dynamic, multi-dimensional process• the “intersection of history and biography”
What are the processes by which individuals or groups gain resources (economic, social, cultural &
symbolic), and so are integrated into or excluded from participation in our society?
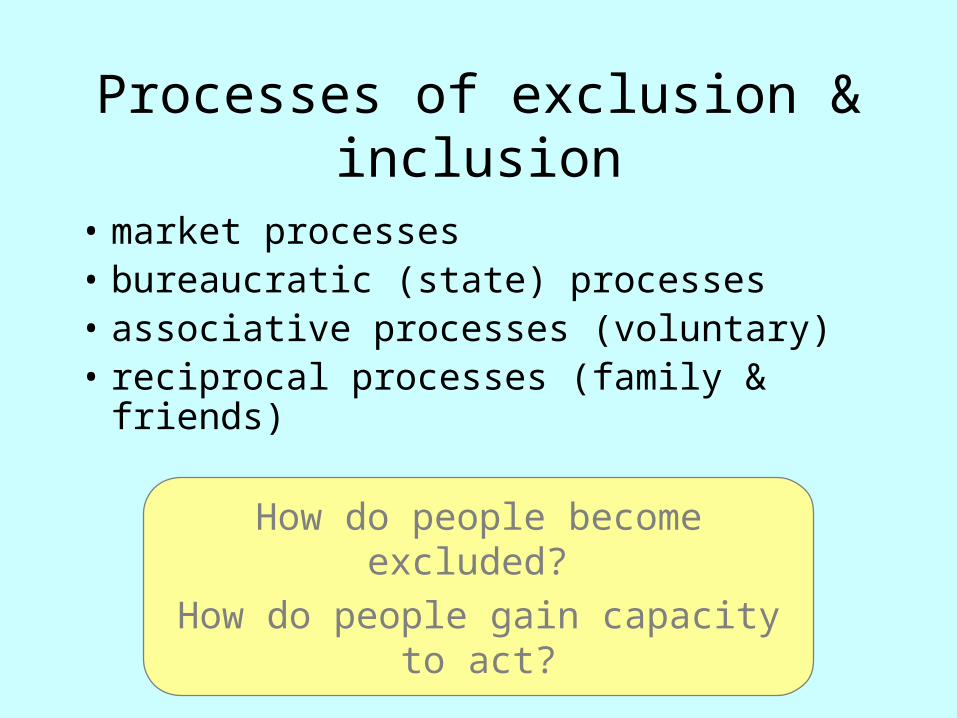
• market processes• bureaucratic (state) processes• associative processes (voluntary)• reciprocal processes (family & friends)
Processes of exclusion & inclusion
How do people become excluded?
How do people gain capacity to act?

Market
ReciprocalAssociative
R ob sonE con om ic
Jon esS oc ia l
P o lsonP o lit ica l
S m ithP res id en t
Authority
High Capacity = Agility with all systems
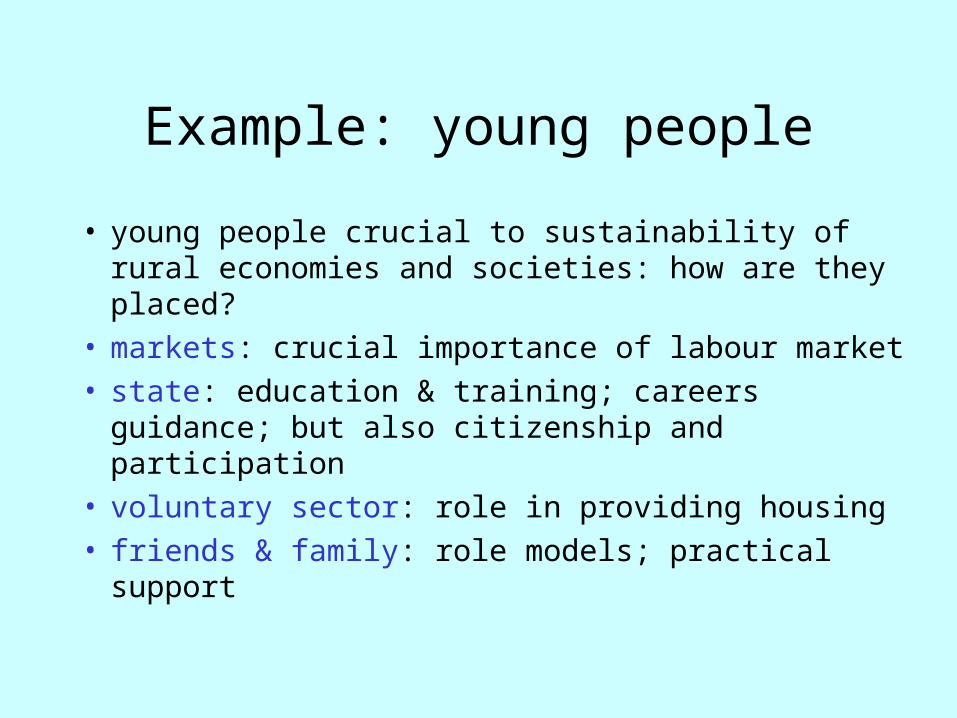
Example: young people
• young people crucial to sustainability of rural economies and societies: how are they placed?
• markets: crucial importance of labour market• state: education & training; careers guidance;
but also citizenship and participation• voluntary sector: role in providing housing• friends & family: role models; practical support
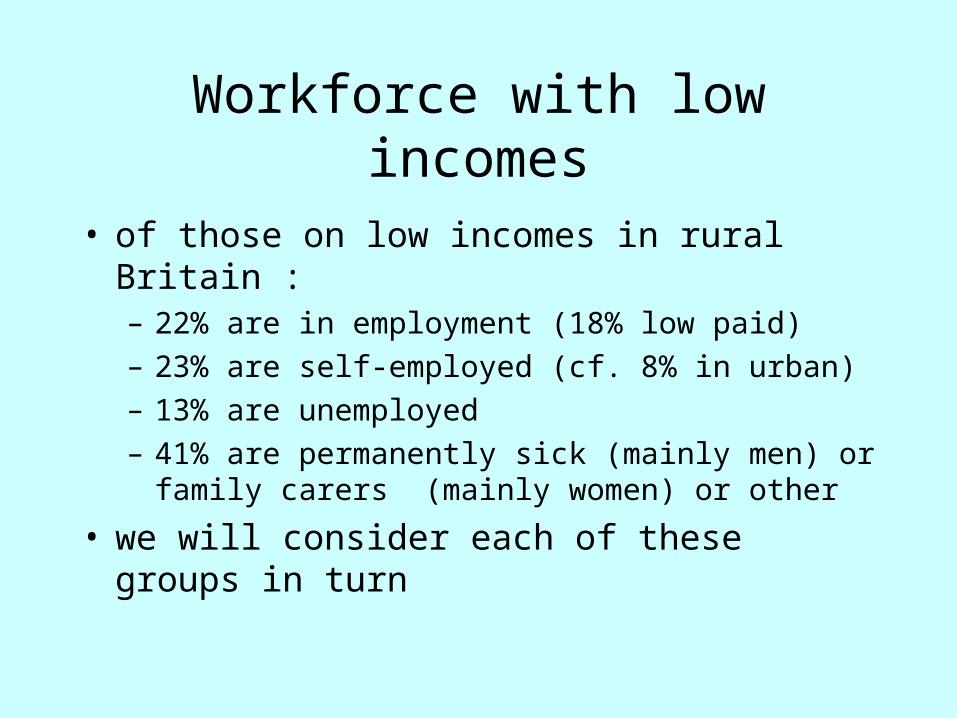
Workforce with low incomes
• of those on low incomes in rural Britain :– 22% are in employment (18% low paid)– 23% are self-employed (cf. 8% in urban)– 13% are unemployed– 41% are permanently sick (mainly men) or
family carers (mainly women) or other
• we will consider each of these groups in turn
Low pay• low pay is more prevalent in rural areas• furthermore, low pay is also more persistent
in rural areas, even after taking into account other characteristics of the workforce
• low pay in rural areas is associated with education levels, gender, industrial structure and with the typically small size of firm
• agriculture etc and tourism account for 43% of male and 46% of female low pay
• how to provide better-paying jobs?
Unemployment
• unemployment rates were lower in rural areas than non-rural in 1991, but by 1996 there was little difference
• persistent unemployment is less likely in rural areas, except in a few places. spells without work tend to be shorter
• evidence of hidden unemployment• new jobs from within, or from outwith?

Self-employment
• higher proportion of self-employed in rural areas, and much more likely to be poor
• qualitative evidence that people become self-employed in rural areas because of a lack of alternatives rather than because of greater entrepreneurial spirit
• often it is really disguised unemployment• how might self-employed people in rural
areas be encouraged to grow businesses?

Detachment from labour markets
• 41% of poor people of working age in rural areas are long-term sick, family carers, etc
• other research has drawn attention to a substantial number of males in their 50s who expect never to work again: how might they contribute to rural society and economy?
• the role of women carers has been less well researched : to what extent are they making up for deficiencies of rural care services ? should this not be rewarded as ‘work’ ?

Barriers to labour market participation in rural areas
• ‘word of mouth’ and informal recruitment, and other aspects of employers’ behaviour
• structure of local labour markets - mismatches between jobs and skills.
• accessibility between home and workplace - the fundamental importance of transport
• the costs of participating in the labour market (car, childcare, benefits foregone, etc)

Childcare in rural areas
• most common strategies are to work only in school hours, for the spouse to look after the children (and not work, or work shifts), or for a relative to look after the children
• the first is more likely in rural areas, and the other two have grown since 1991
• relative lack of formal childcare provision• fewer use childminders, friends,
neighbours• need for family-friendly employers, for
flexible working, and for more childcare?

Issues for discussion• how to be a core locality with better-paid,
secure, fulfilling employment?• how do we respond to persistent low pay,
low skills, lack of good quality jobs, detachment from labour markets, poverty in self-employment, and unemployment?
• transport, childcare and eldercare issues?• need for demand-side measures, as well
as for the current supply-side initiatives?• are different measures required in rural
areas?