Embed Size (px)
Citation preview
Submitted 30 October 2018Accepted 19 December 2018Published 12 February 2019
Corresponding authorChristopher K. Basu, [email protected]
Academic editorPhilip Cox
Additional Information andDeclarations can be found onpage 18
DOI 10.7717/peerj.6312
Copyright2019 Basu et al.
Distributed underCreative Commons CC-BY 4.0
OPEN ACCESS
The running kinematics of free-roaminggiraffes, measured using a low costunmanned aerial vehicle (UAV)Christopher K. Basu1, Francois Deacon2, John R. Hutchinson1,* andAlan M. Wilson1,*
1 Structure & Motion Laboratory, Royal Veterinary College, Hatfield, United Kingdom2 Faculty of Natural and Agricultural Sciences, Department of Animal, Wildlife and Grassland Sciences,University of the Free State, Bloemfontein, South Africa
*These authors contributed equally to this work.
ABSTRACTThe study of animal locomotion can be logistically challenging, especially in the caseof large or unhandleable animals in uncontrolled environments. Here we demonstratethe utility of a low cost unmanned aerial vehicle (UAV) in measuring two-dimensionalrunning kinematics from free-roaming giraffes (Giraffa camelopardalis giraffa) in theFree State Province, South Africa. We collected 120 Hz video of running giraffes,and calibrated each video frame using metatarsal length as a constant object of scale.We tested a number of methods to measure metatarsal length. The method with theleast variation used close range photography and a trigonometric equation to spatiallycalibrate the still image, and derive metatarsal length. In the absence of this option, aspatially calibrated surfacemodel of the study terrainwas used to estimate topographicaldimensions in video footage of interest. Data for the terrain models were collectedusing the same equipment, during the same study period. We subsequently validatedthe accuracy of the UAV method by comparing similar speed measurements of ahuman subject running on a treadmill, with treadmill speed. At 8 m focal distancewe observed an error of 8% between the two measures of speed. This error was greaterat a shorter focal distance, and when the subject was not in the central field of view. Werecommend that future users maximise the camera focal distance, and keep the subjectin the central field of view. The studied giraffes used a grounded rotary gallop witha speed range of 3.4–6.9 ms−1 (never cantering, trotting or pacing), and lower dutyfactors when compared with other cursorial quadrupeds. As this pattern might resultin adverse increases in peak vertical limb forces with speed, it was notable to find thatcontralateral limbs became more in-phase with speed. Considering the latter patternand the modest maximal speed of giraffes, we speculate that tissue safety factors aremaintained within tolerable bounds this way. Furthermore, the angular kinematics ofthe neck were frequently isolated from the pitching of the body during running; thismay be a result of the large mass of the head and neck. Further field experiments andbiomechanical models are needed to robustly test these speculations.
Subjects Biophysics, Zoology, KinesiologyKeywords Artiodactyla, Giraffes, Biomechanics, Dynamic similarity, Kinematics, Field research,Unmanned aerial vehicles
How to cite this article Basu CK, Deacon F, Hutchinson JR, Wilson AM. 2019. The running kinematics of free-roaming giraffes, mea-sured using a low cost unmanned aerial vehicle (UAV). PeerJ 7:e6312 http://doi.org/10.7717/peerj.6312
INTRODUCTIONMeasuring gait parameters outside of the laboratoryBiomechanical measurements of animal locomotion are commonly performed underlaboratory conditions. Under these circumstances, confounding variables may bemeasuredand/or controlled. When studying animals, particularly undomesticated animals usuallyliving in natural habitats, the laboratory itself can become a confounding variable. Naturalbehaviours are less likely to be expressed, and it is difficult to replicate the interactionsbetween the animal and its natural environment (e.g., temperature, light, substrateproperties). In many cases it is not logistically possible or safe to study animals in alaboratory setting.
In recent years, the increasing availability of remote sensing has broadened the focusof locomotor research to include more field-based data collection. Accelerometers andGlobal Positioning System (GPS) devices have been used to derive three-dimensionaltemporospatial parameters in a variety of human (Tao et al., 2012) and non-humanlocomotor studies (Daley et al., 2016; Hubel et al., 2016). Whilst these methods are anexcellent solution to study locomotor behaviours over an extended period of time, onechallenge is that physical access to each study subject is required. This inevitably requiresan instance of either manual or chemical restraint.
If two-dimensional (2D) temporospatial kinematics are required, a low-cost alternativeis to use an unmanned aerial vehicle (UAV) to gather spatially calibrated video footage ofthe locomotor behaviour in question. In this study, we demonstrate the utility of a singlelow-cost UAV in measuring the 2D kinematic gait parameters of free-ranging runninggiraffes (Giraffa camelopardalis giraffa). We use these data to question whether giraffes’running gait is specialised when compared with other mammalian quadrupeds.
Gait dynamics in giraffes and other quadrupedal mammalsQuadrupeds typically use asymmetrical gaits at faster speeds. In asymmetrical gaits thefore- and hindfeet each act as functional pairs, where each pair of feet can strike the groundsimultaneously, or may have a time lag between the footfall of the left and right side, inwhich case there is a leading and a trailing foot. Galloping gaits may be further defined bythe pattern of the leading limbs. In a transverse gallop, the leading limbs of the fore and hindquarters are on the same side of the body, versus a rotary gallop where the leading limbs areon the opposite sides of the body. In either case, both a gathered and extended aerial phasecan be present, where all feet are airborne (Biancardi & Minetti, 2012; Hildebrand, 1977).
At walking speeds, giraffes use a lateral sequence walk, which is dynamically similar tothe slow gaits of other mammalian quadrupeds (Basu, Wilson & Hutchinson, 2019). Thetheory of dynamic similarity predicts that geometrically similar animals move with similardimensionless stride parameters at equivalent dimensionless speeds. Dimensionless speedis expressed here as Froude number (Eq. (1)), where u = speed (ms−1), h = shoulderheight (m) and g = acceleration due to gravity (9.81 ms−2).
Fr =u2
gh. (1)
Basu et al. (2019), PeerJ, DOI 10.7717/peerj.6312 2/21

Giraffes appear to diverge from the predictions of dynamic similarity at faster thanwalking speeds. Based on observations of other mammalian quadrupedal gaits (Hildebrand,1976) and predictive modelling of quadrupedal footfall sequences (Cartmill, Lemelin &Schmitt, 2002), giraffes are expected to select a running pace as their intermediate gait. Astudy involving simulations of quadrupedal gaits also suggested that giraffes will select apacing gait at intermediate speeds (Suzuki et al., 2016); however this model inaccuratelypredicted that giraffes use a diagonal sequence walk at slow speeds, contrasting with theexperimentally observed lateral sequence walk (Basu, Wilson & Hutchinson, 2019). Giraffesinstead seemingly transition consistently from a walk to a rotary gallop (Dagg & Vos,1968; Maxwell, 1924). The restricted choice of gait is in contrast to most other cursorialquadrupeds (Heglund & Taylor, 1988; Hildebrand, 1976), but not exclusive to giraffes; forexample elephants use the lateral sequence walk across their entire speed range (Hutchinsonet al., 2006). At near-maximal running speeds, giraffes are thought to use lower mean stridefrequencies (and consequently higher stride lengths) than is expected for an ungulate oftheir body mass; an ability that may be facilitated by their elongate limbs (Alexander,Langman & Jayes, 1977).
Giraffes’ long neck may have functional consequences with respect to the locomotorsystem. Evolutionary elongation of giraffes’ cervical vertebrae has effectively lengthenedtheir horizontal axis (Badlangana, Adams & Manger, 2009). In other galloping quadrupeds,the horizontal axis of the skeleton is dynamic, where fluctuations in neck angle and bodypitch occur during walking and running (Dunbar, 2004; Dunbar et al., 2008). Such angularfluctuations may serve to stabilise these axial body segments in world space. In giraffes,Dagg (1962) noted the periodic angular fluctuations of the neck, and found this to be largerin magnitude during the gallop than in the walk. One way to define this effect of neck andpitching angles on the horizontal axis is to determine the phase relationship between thekinematics of the trunk and the neck (Basu, Wilson & Hutchinson, 2019).
Our aims in this study are to (1) validate the use of a UAV in measuring temporospatialgait parameters and suggest recommendations for optimising data quality; (2) determinewhich running gait(s) the giraffes select across their speed range, (3) determine how strideparameters change within the running gait, (4) assess whether giraffes’ running gait isspecialised compared to other cursorial quadrupeds, and finally (5) measure the angularkinematics of the neck and body, and predict how their phase relationship contributes tobody segment stability.
MATERIALS & METHODSVideo data of giraffes’ running gait were recorded from three field sites in the Free StateProvince, South Africa. A total of 35 giraffes were available for study; these varied in age,size and sex (Table 1). The experimental protocol varied between the field sites, and wasdependent on the giraffes’ degree of familiarity with people. A Phantom 4 UAV (DJI,Guangdong, China) was used to film giraffes’ locomotion from a lateral viewpoint, at 120Hz, 1,920 × 1,080 pixel resolution, with a 20 mm lens. This was the maximum possibleframe rate and image resolution of any low-cost UAV (<£1,000) at the time the study wasconducted.
Basu et al. (2019), PeerJ, DOI 10.7717/peerj.6312 3/21
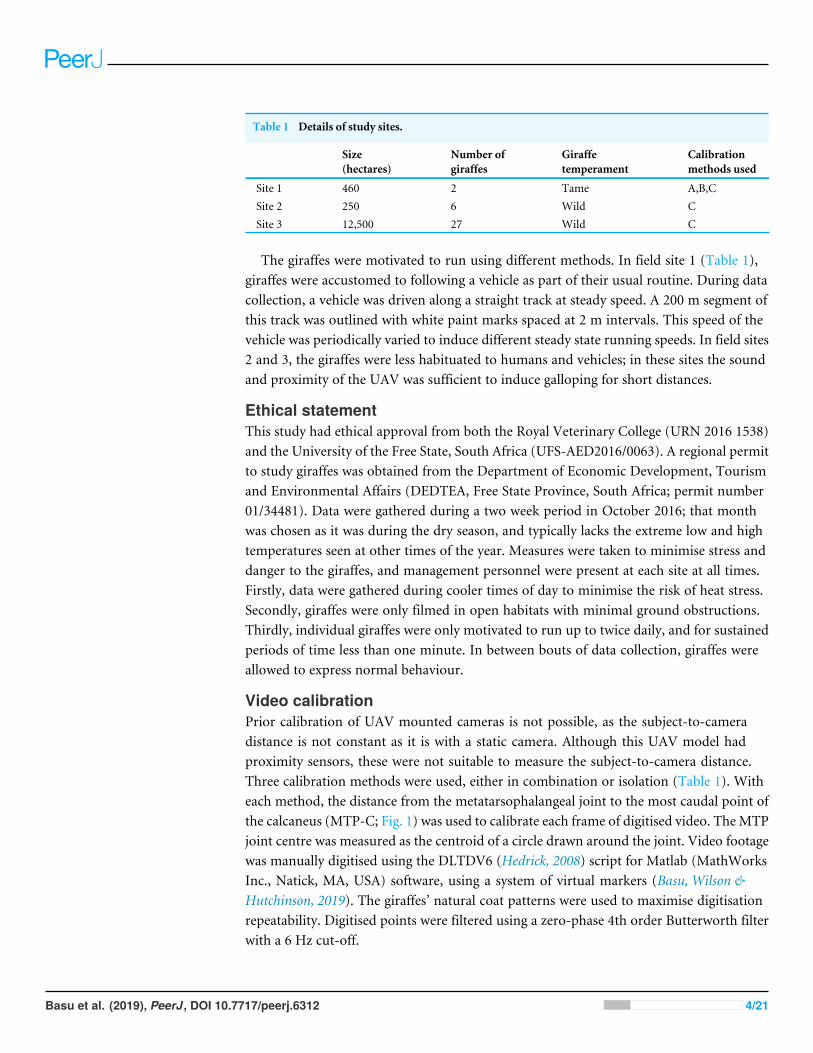
Table 1 Details of study sites.
Size(hectares)
Number ofgiraffes
Giraffetemperament
Calibrationmethods used
Site 1 460 2 Tame A,B,CSite 2 250 6 Wild CSite 3 12,500 27 Wild C
The giraffes were motivated to run using different methods. In field site 1 (Table 1),giraffes were accustomed to following a vehicle as part of their usual routine. During datacollection, a vehicle was driven along a straight track at steady speed. A 200 m segment ofthis track was outlined with white paint marks spaced at 2 m intervals. This speed of thevehicle was periodically varied to induce different steady state running speeds. In field sites2 and 3, the giraffes were less habituated to humans and vehicles; in these sites the soundand proximity of the UAV was sufficient to induce galloping for short distances.
Ethical statementThis study had ethical approval from both the Royal Veterinary College (URN 2016 1538)and the University of the Free State, South Africa (UFS-AED2016/0063). A regional permitto study giraffes was obtained from the Department of Economic Development, Tourismand Environmental Affairs (DEDTEA, Free State Province, South Africa; permit number01/34481). Data were gathered during a two week period in October 2016; that monthwas chosen as it was during the dry season, and typically lacks the extreme low and hightemperatures seen at other times of the year. Measures were taken to minimise stress anddanger to the giraffes, and management personnel were present at each site at all times.Firstly, data were gathered during cooler times of day to minimise the risk of heat stress.Secondly, giraffes were only filmed in open habitats with minimal ground obstructions.Thirdly, individual giraffes were only motivated to run up to twice daily, and for sustainedperiods of time less than one minute. In between bouts of data collection, giraffes wereallowed to express normal behaviour.
Video calibrationPrior calibration of UAV mounted cameras is not possible, as the subject-to-cameradistance is not constant as it is with a static camera. Although this UAV model hadproximity sensors, these were not suitable to measure the subject-to-camera distance.Three calibration methods were used, either in combination or isolation (Table 1). Witheach method, the distance from the metatarsophalangeal joint to the most caudal point ofthe calcaneus (MTP-C; Fig. 1) was used to calibrate each frame of digitised video. TheMTPjoint centre was measured as the centroid of a circle drawn around the joint. Video footagewas manually digitised using the DLTDV6 (Hedrick, 2008) script for Matlab (MathWorksInc., Natick, MA, USA) software, using a system of virtual markers (Basu, Wilson &Hutchinson, 2019). The giraffes’ natural coat patterns were used to maximise digitisationrepeatability. Digitised points were filtered using a zero-phase 4th order Butterworth filterwith a 6 Hz cut-off.
Basu et al. (2019), PeerJ, DOI 10.7717/peerj.6312 4/21
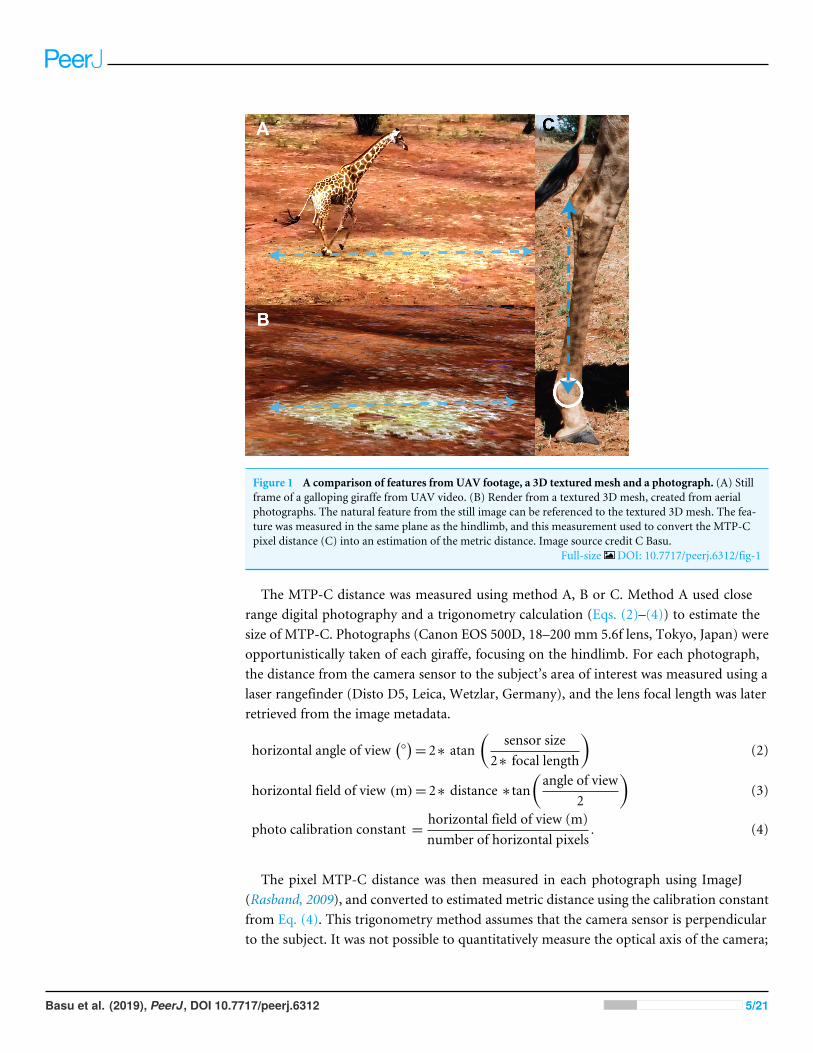
Figure 1 A comparison of features fromUAV footage, a 3D textured mesh and a photograph. (A) Stillframe of a galloping giraffe from UAV video. (B) Render from a textured 3D mesh, created from aerialphotographs. The natural feature from the still image can be referenced to the textured 3D mesh. The fea-ture was measured in the same plane as the hindlimb, and this measurement used to convert the MTP-Cpixel distance (C) into an estimation of the metric distance. Image source credit C Basu.
Full-size DOI: 10.7717/peerj.6312/fig-1
The MTP-C distance was measured using method A, B or C. Method A used closerange digital photography and a trigonometry calculation (Eqs. (2)–(4)) to estimate thesize of MTP-C. Photographs (Canon EOS 500D, 18–200 mm 5.6f lens, Tokyo, Japan) wereopportunistically taken of each giraffe, focusing on the hindlimb. For each photograph,the distance from the camera sensor to the subject’s area of interest was measured using alaser rangefinder (Disto D5, Leica, Wetzlar, Germany), and the lens focal length was laterretrieved from the image metadata.
horizontal angle of view(◦)= 2∗ atan
(sensor size
2∗ focal length
)(2)
horizontal field of view (m)= 2∗ distance ∗ tan(angle of view
2
)(3)
photo calibration constant =horizontal field of view (m)number of horizontal pixels
. (4)
The pixel MTP-C distance was then measured in each photograph using ImageJ(Rasband, 2009), and converted to estimated metric distance using the calibration constantfrom Eq. (4). This trigonometry method assumes that the camera sensor is perpendicularto the subject. It was not possible to quantitatively measure the optical axis of the camera;
Basu et al. (2019), PeerJ, DOI 10.7717/peerj.6312 5/21
therefore, parallax errors may have affected the resulting calculations. To offset this error,the mean estimate was used to calibrate video footage. Due to the close-range nature ofthe photographs, this method was only suitable in field site 1, which had a more controlledand predictable environment.
In Method B, 2 m ground markers were used to calibrate 10 still frames from videofootage of each giraffe, as they moved parallel with the markers. MTP-C distance wasestimated from these frames, and the mean value used to calibrate subsequent video data.This method was only possible in field site 1, where the giraffes could be led along the 200m track.
Method C was used where the giraffes’ locations and locomotion trajectories couldnot be anticipated (field sites 2 and 3). After recording video data, a textured 3D mesh ofthe terrain was produced using aerial photographs taken from the UAV during an aerialsurvey at 40 m altitude. The derived models were created using the software package Pix4D(Lausanne, Switzerland), which takes GPS stamped photographs as an input, and outputsscaled and textured 3D meshes of the corresponding terrain, using a photogrammetrymethod. These models were used to identify and measure prominent ground features,which could be cross-referenced with features in digitised video, and subsequently used tomeasure MTP-C distance. The criteria for suitable ground features were that they had tobe within the sagittal plane of the giraffe, and be distinguishable on the 3D mesh and thevideo (Fig. 1).
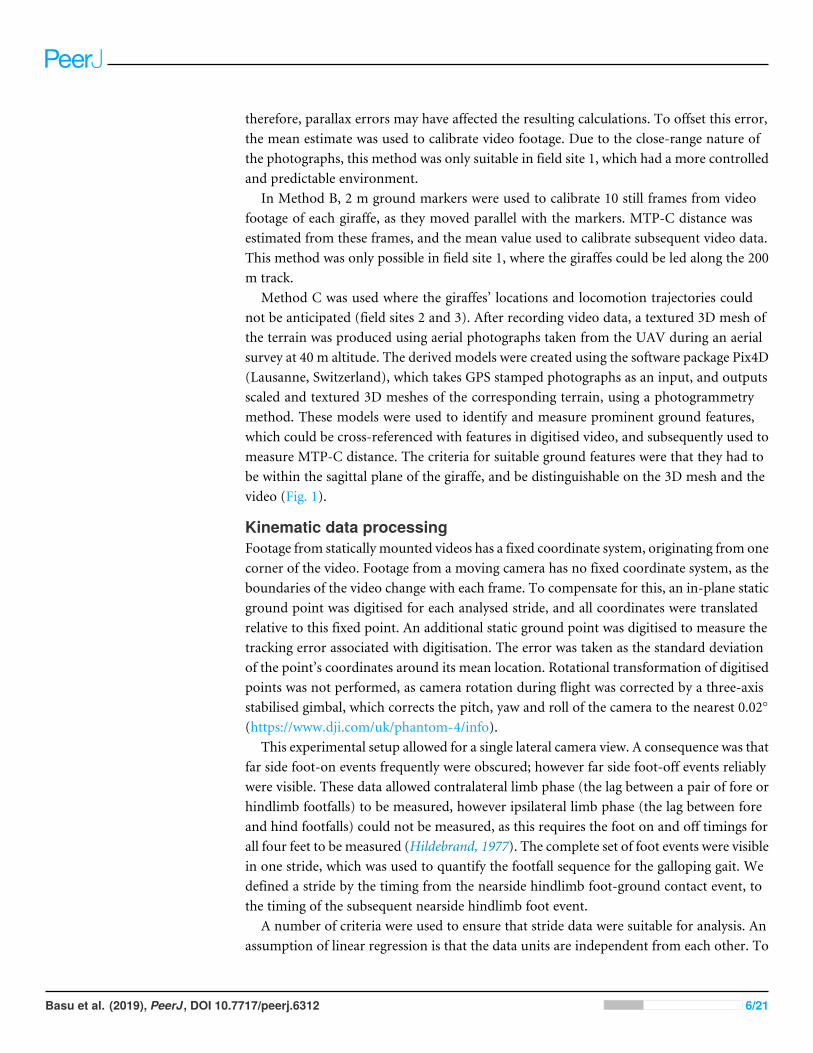
Kinematic data processingFootage from statically mounted videos has a fixed coordinate system, originating from onecorner of the video. Footage from a moving camera has no fixed coordinate system, as theboundaries of the video change with each frame. To compensate for this, an in-plane staticground point was digitised for each analysed stride, and all coordinates were translatedrelative to this fixed point. An additional static ground point was digitised to measure thetracking error associated with digitisation. The error was taken as the standard deviationof the point’s coordinates around its mean location. Rotational transformation of digitisedpoints was not performed, as camera rotation during flight was corrected by a three-axisstabilised gimbal, which corrects the pitch, yaw and roll of the camera to the nearest 0.02◦
(https://www.dji.com/uk/phantom-4/info).This experimental setup allowed for a single lateral camera view. A consequence was that
far side foot-on events frequently were obscured; however far side foot-off events reliablywere visible. These data allowed contralateral limb phase (the lag between a pair of fore orhindlimb footfalls) to be measured, however ipsilateral limb phase (the lag between foreand hind footfalls) could not be measured, as this requires the foot on and off timings forall four feet to be measured (Hildebrand, 1977). The complete set of foot events were visiblein one stride, which was used to quantify the footfall sequence for the galloping gait. Wedefined a stride by the timing from the nearside hindlimb foot-ground contact event, tothe timing of the subsequent nearside hindlimb foot event.
A number of criteria were used to ensure that stride data were suitable for analysis. Anassumption of linear regression is that the data units are independent from each other. To
Basu et al. (2019), PeerJ, DOI 10.7717/peerj.6312 6/21
ensure that this assumption was met, only one stride from a sequence of consecutive strideswas used in the analyses. A sequence of consecutive strides was defined as being boundedby either a change in gait, or an obvious change in steady state speed. Only steady-statestrides were analysed; strides which featured a 20% or greater change in speed over theircourse were excluded. Speed was subsequently measured as the horizontal displacement ofthe giraffes’ withers over the course of one stride (m), divided by the time interval (s).
Strides were manually segmented. Ideally a velocity threshold method provides arepeatable method of detecting foot contact events (Starke & Clayton, 2015), but could notbe used in this instance due to excessive measurement noise. A custom-written Matlabscript then applied the pixel calibrations and transformations to the raw data. The followingparameters were calculated: running speed (ms−1), stride length (m), stride frequency (Hz),footfall timings, contralateral limb phase (the fraction of the stride between footfalls ofleading and non-leading limbs), stride duration (s), stance duration (s), duty factor (thefraction of the stride that a given foot is in contact with the ground), neck angle and bodypitch angle (◦).
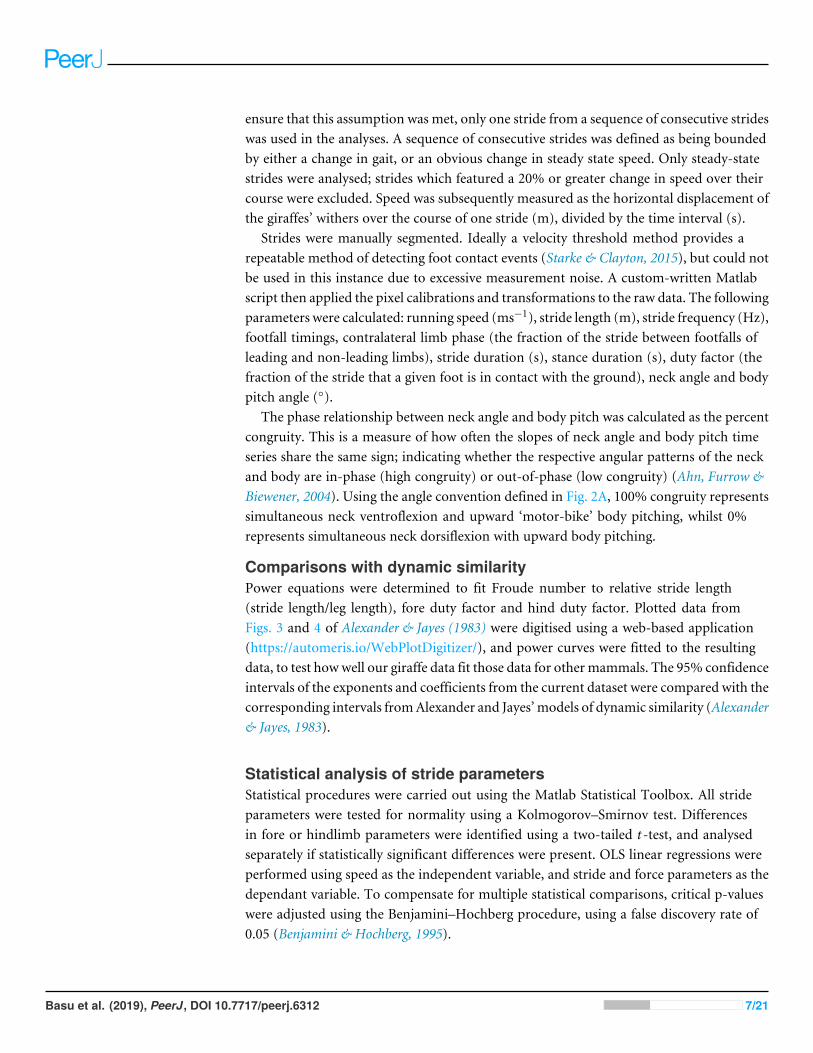
The phase relationship between neck angle and body pitch was calculated as the percentcongruity. This is a measure of how often the slopes of neck angle and body pitch timeseries share the same sign; indicating whether the respective angular patterns of the neckand body are in-phase (high congruity) or out-of-phase (low congruity) (Ahn, Furrow &Biewener, 2004). Using the angle convention defined in Fig. 2A, 100% congruity representssimultaneous neck ventroflexion and upward ‘motor-bike’ body pitching, whilst 0%represents simultaneous neck dorsiflexion with upward body pitching.
Comparisons with dynamic similarityPower equations were determined to fit Froude number to relative stride length(stride length/leg length), fore duty factor and hind duty factor. Plotted data fromFigs. 3 and 4 of Alexander & Jayes (1983) were digitised using a web-based application(https://automeris.io/WebPlotDigitizer/), and power curves were fitted to the resultingdata, to test howwell our giraffe data fit those data for other mammals. The 95% confidenceintervals of the exponents and coefficients from the current dataset were compared with thecorresponding intervals fromAlexander and Jayes’ models of dynamic similarity (Alexander& Jayes, 1983).
Statistical analysis of stride parametersStatistical procedures were carried out using the Matlab Statistical Toolbox. All strideparameters were tested for normality using a Kolmogorov–Smirnov test. Differencesin fore or hindlimb parameters were identified using a two-tailed t -test, and analysedseparately if statistically significant differences were present. OLS linear regressions wereperformed using speed as the independent variable, and stride and force parameters as thedependant variable. To compensate for multiple statistical comparisons, critical p-valueswere adjusted using the Benjamini–Hochberg procedure, using a false discovery rate of0.05 (Benjamini & Hochberg, 1995).
Basu et al. (2019), PeerJ, DOI 10.7717/peerj.6312 7/21
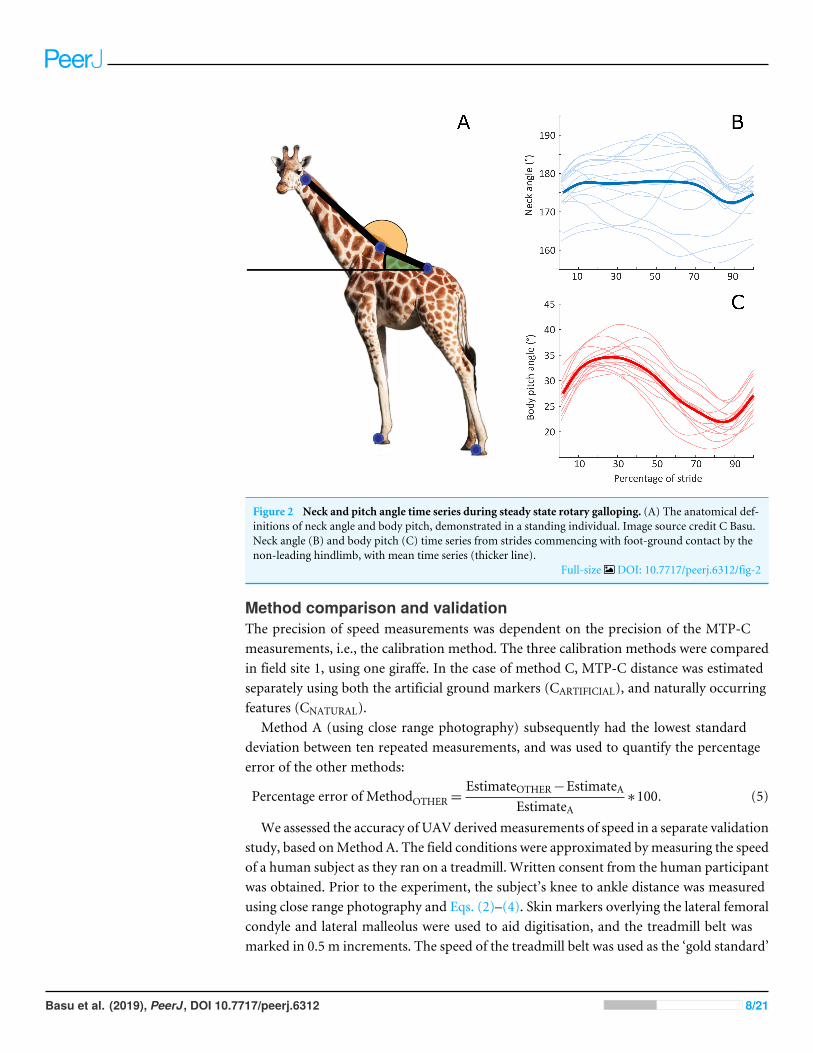
Figure 2 Neck and pitch angle time series during steady state rotary galloping. (A) The anatomical def-initions of neck angle and body pitch, demonstrated in a standing individual. Image source credit C Basu.Neck angle (B) and body pitch (C) time series from strides commencing with foot-ground contact by thenon-leading hindlimb, with mean time series (thicker line).
Full-size DOI: 10.7717/peerj.6312/fig-2
Method comparison and validationThe precision of speed measurements was dependent on the precision of the MTP-Cmeasurements, i.e., the calibration method. The three calibration methods were comparedin field site 1, using one giraffe. In the case of method C, MTP-C distance was estimatedseparately using both the artificial ground markers (CARTIFICIAL), and naturally occurringfeatures (CNATURAL).
Method A (using close range photography) subsequently had the lowest standarddeviation between ten repeated measurements, and was used to quantify the percentageerror of the other methods:
Percentage error of MethodOTHER=EstimateOTHER−EstimateA
EstimateA∗100. (5)
We assessed the accuracy of UAV derivedmeasurements of speed in a separate validationstudy, based onMethod A. The field conditions were approximated bymeasuring the speedof a human subject as they ran on a treadmill. Written consent from the human participantwas obtained. Prior to the experiment, the subject’s knee to ankle distance was measuredusing close range photography and Eqs. (2)–(4). Skin markers overlying the lateral femoralcondyle and lateral malleolus were used to aid digitisation, and the treadmill belt wasmarked in 0.5 m increments. The speed of the treadmill belt was used as the ‘gold standard’
Basu et al. (2019), PeerJ, DOI 10.7717/peerj.6312 8/21
8 m distancecentral axis
0.04
0.06
0.08
0.1
0.12
0.14
0.16
0.18
0.2
0.22
Perc
enta
ge
erro
r
4 m distancecentral axis
4 m distanceoffset axis
Figure 3 Box and whisker plot showing percentage error of UAV derived speed measurements com-pared to treadmill speed, with overlying data points.Human running speed measured by the UAV wasmost accurate when the subject was furthest distance, and when they were centred in the field of view.
Full-size DOI: 10.7717/peerj.6312/fig-3
NLHLLHL
NLFL
LFL
0% stride 100% stride
0 s 0.88 s
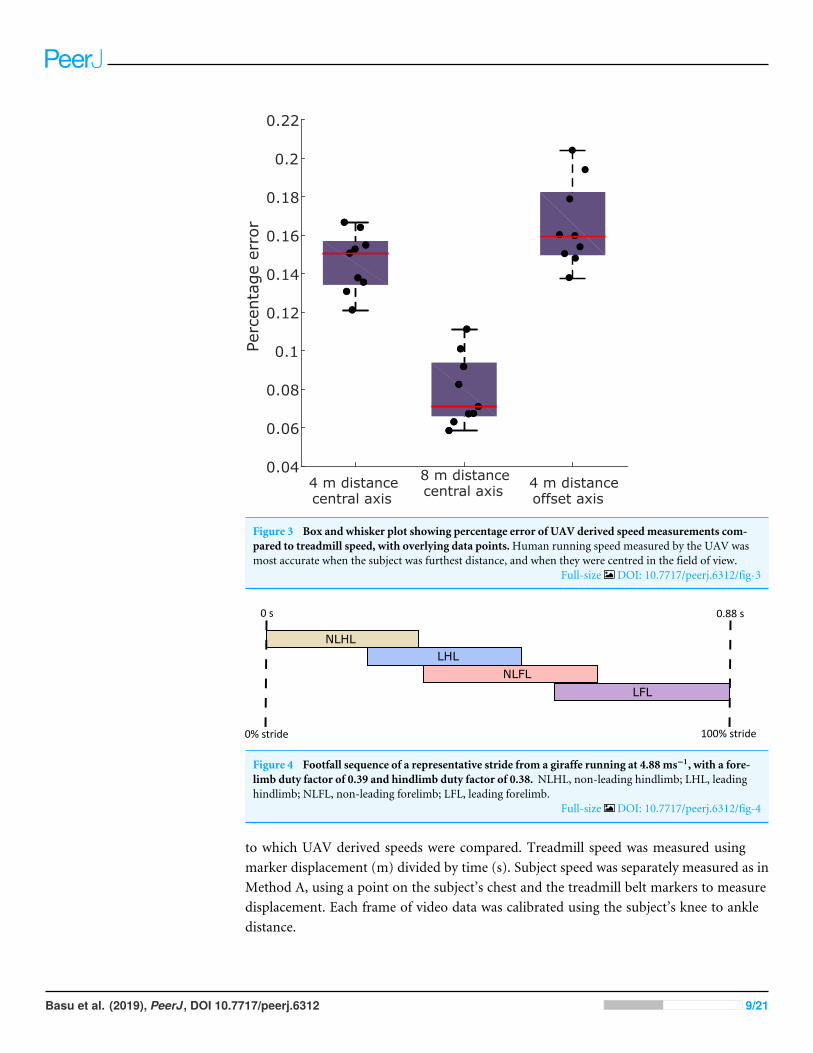
Figure 4 Footfall sequence of a representative stride from a giraffe running at 4.88 ms−1, with a fore-limb duty factor of 0.39 and hindlimb duty factor of 0.38. NLHL, non-leading hindlimb; LHL, leadinghindlimb; NLFL, non-leading forelimb; LFL, leading forelimb.
Full-size DOI: 10.7717/peerj.6312/fig-4
to which UAV derived speeds were compared. Treadmill speed was measured usingmarker displacement (m) divided by time (s). Subject speed was separately measured as inMethod A, using a point on the subject’s chest and the treadmill belt markers to measuredisplacement. Each frame of video data was calibrated using the subject’s knee to ankledistance.
Basu et al. (2019), PeerJ, DOI 10.7717/peerj.6312 9/21
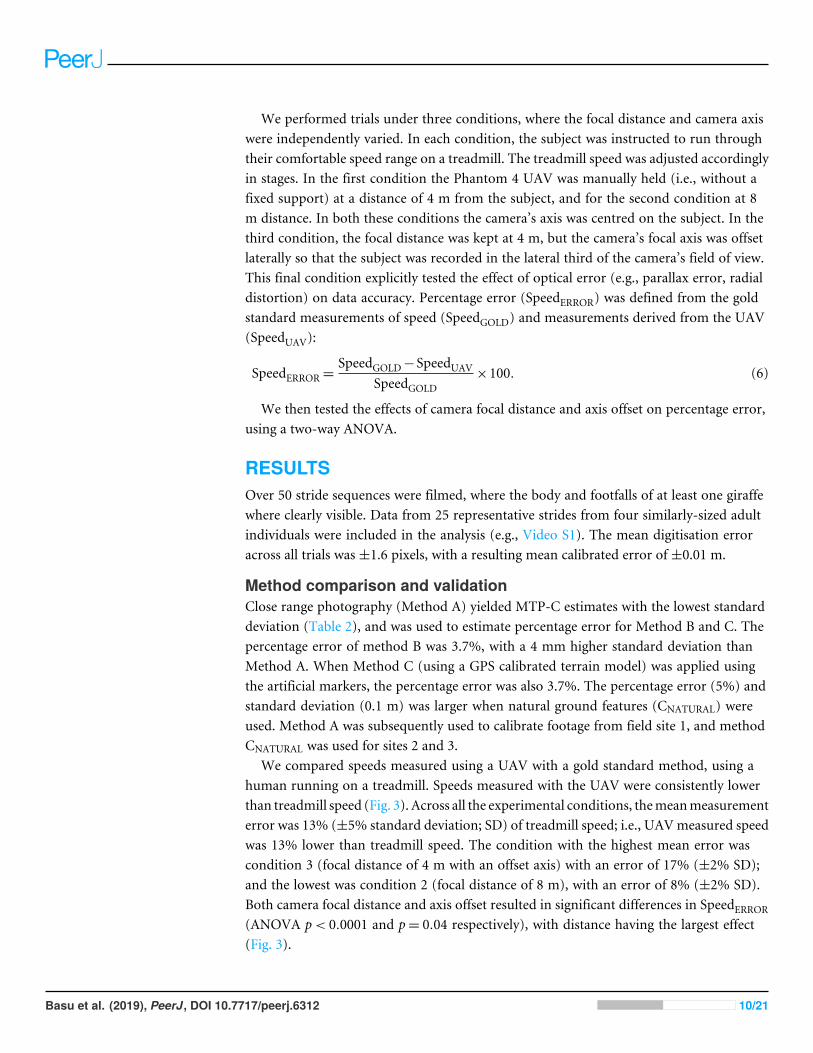
We performed trials under three conditions, where the focal distance and camera axiswere independently varied. In each condition, the subject was instructed to run throughtheir comfortable speed range on a treadmill. The treadmill speed was adjusted accordinglyin stages. In the first condition the Phantom 4 UAV was manually held (i.e., without afixed support) at a distance of 4 m from the subject, and for the second condition at 8m distance. In both these conditions the camera’s axis was centred on the subject. In thethird condition, the focal distance was kept at 4 m, but the camera’s focal axis was offsetlaterally so that the subject was recorded in the lateral third of the camera’s field of view.This final condition explicitly tested the effect of optical error (e.g., parallax error, radialdistortion) on data accuracy. Percentage error (SpeedERROR) was defined from the goldstandard measurements of speed (SpeedGOLD) and measurements derived from the UAV(SpeedUAV):
SpeedERROR=SpeedGOLD−SpeedUAV
SpeedGOLD×100. (6)
We then tested the effects of camera focal distance and axis offset on percentage error,using a two-way ANOVA.
RESULTSOver 50 stride sequences were filmed, where the body and footfalls of at least one giraffewhere clearly visible. Data from 25 representative strides from four similarly-sized adultindividuals were included in the analysis (e.g., Video S1). The mean digitisation erroracross all trials was ±1.6 pixels, with a resulting mean calibrated error of ±0.01 m.
Method comparison and validationClose range photography (Method A) yielded MTP-C estimates with the lowest standarddeviation (Table 2), and was used to estimate percentage error for Method B and C. Thepercentage error of method B was 3.7%, with a 4 mm higher standard deviation thanMethod A. When Method C (using a GPS calibrated terrain model) was applied usingthe artificial markers, the percentage error was also 3.7%. The percentage error (5%) andstandard deviation (0.1 m) was larger when natural ground features (CNATURAL) wereused. Method A was subsequently used to calibrate footage from field site 1, and methodCNATURAL was used for sites 2 and 3.
We compared speeds measured using a UAV with a gold standard method, using ahuman running on a treadmill. Speeds measured with the UAV were consistently lowerthan treadmill speed (Fig. 3). Across all the experimental conditions, themeanmeasurementerror was 13% (±5% standard deviation; SD) of treadmill speed; i.e., UAVmeasured speedwas 13% lower than treadmill speed. The condition with the highest mean error wascondition 3 (focal distance of 4 m with an offset axis) with an error of 17% (±2% SD);and the lowest was condition 2 (focal distance of 8 m), with an error of 8% (±2% SD).Both camera focal distance and axis offset resulted in significant differences in SpeedERROR(ANOVA p< 0.0001 and p= 0.04 respectively), with distance having the largest effect(Fig. 3).
Basu et al. (2019), PeerJ, DOI 10.7717/peerj.6312 10/21
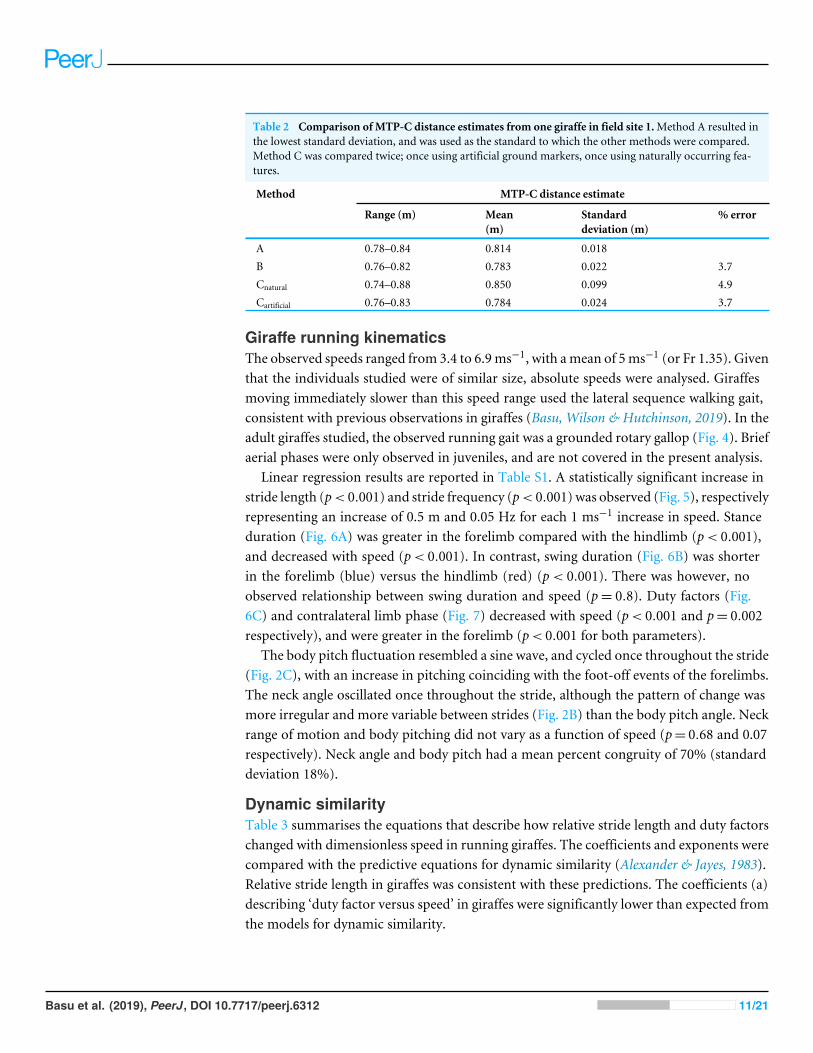
Table 2 Comparison of MTP-C distance estimates from one giraffe in field site 1.Method A resulted inthe lowest standard deviation, and was used as the standard to which the other methods were compared.Method C was compared twice; once using artificial ground markers, once using naturally occurring fea-tures.
Method MTP-C distance estimate
Range (m) Mean(m)
Standarddeviation (m)
% error
A 0.78–0.84 0.814 0.018B 0.76–0.82 0.783 0.022 3.7Cnatural 0.74–0.88 0.850 0.099 4.9Cartificial 0.76–0.83 0.784 0.024 3.7
Giraffe running kinematicsThe observed speeds ranged from 3.4 to 6.9ms−1, with amean of 5ms−1 (or Fr 1.35). Giventhat the individuals studied were of similar size, absolute speeds were analysed. Giraffesmoving immediately slower than this speed range used the lateral sequence walking gait,consistent with previous observations in giraffes (Basu, Wilson & Hutchinson, 2019). In theadult giraffes studied, the observed running gait was a grounded rotary gallop (Fig. 4). Briefaerial phases were only observed in juveniles, and are not covered in the present analysis.
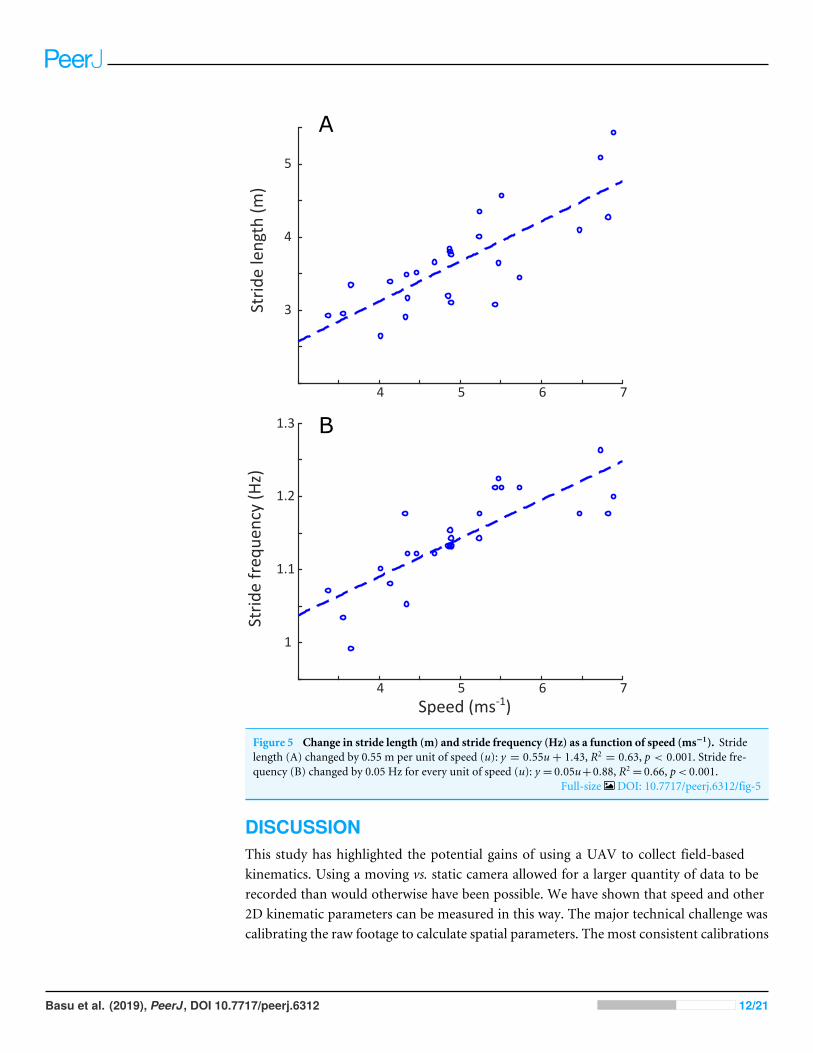
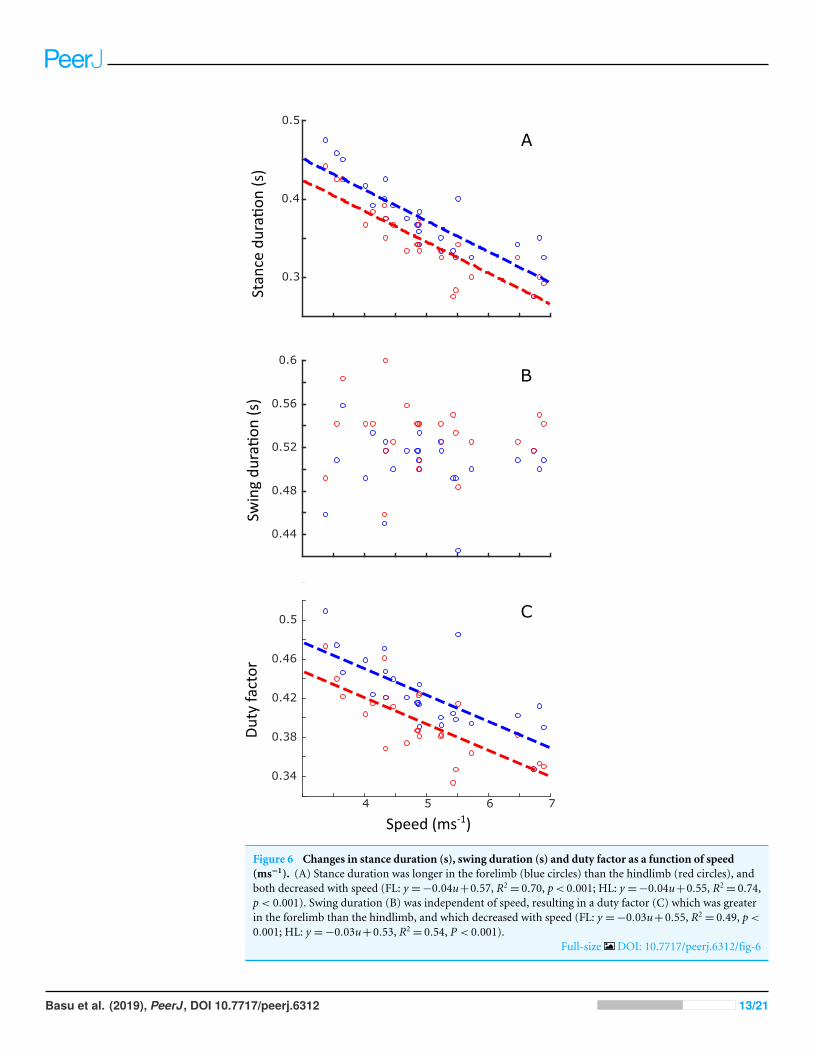
Linear regression results are reported in Table S1. A statistically significant increase instride length (p< 0.001) and stride frequency (p< 0.001) was observed (Fig. 5), respectivelyrepresenting an increase of 0.5 m and 0.05 Hz for each 1 ms−1 increase in speed. Stanceduration (Fig. 6A) was greater in the forelimb compared with the hindlimb (p< 0.001),and decreased with speed (p< 0.001). In contrast, swing duration (Fig. 6B) was shorterin the forelimb (blue) versus the hindlimb (red) (p< 0.001). There was however, noobserved relationship between swing duration and speed (p= 0.8). Duty factors (Fig.6C) and contralateral limb phase (Fig. 7) decreased with speed (p< 0.001 and p= 0.002respectively), and were greater in the forelimb (p< 0.001 for both parameters).
The body pitch fluctuation resembled a sine wave, and cycled once throughout the stride(Fig. 2C), with an increase in pitching coinciding with the foot-off events of the forelimbs.The neck angle oscillated once throughout the stride, although the pattern of change wasmore irregular and more variable between strides (Fig. 2B) than the body pitch angle. Neckrange of motion and body pitching did not vary as a function of speed (p= 0.68 and 0.07respectively). Neck angle and body pitch had a mean percent congruity of 70% (standarddeviation 18%).
Dynamic similarityTable 3 summarises the equations that describe how relative stride length and duty factorschanged with dimensionless speed in running giraffes. The coefficients and exponents werecompared with the predictive equations for dynamic similarity (Alexander & Jayes, 1983).Relative stride length in giraffes was consistent with these predictions. The coefficients (a)describing ‘duty factor versus speed’ in giraffes were significantly lower than expected fromthe models for dynamic similarity.
Basu et al. (2019), PeerJ, DOI 10.7717/peerj.6312 11/21
4 5 6 7
1
1.1
1.2
1.3
4 5 6 7
3
4
5
Stri
de
freq
uen
cy (
Hz)
Speed (ms-1)
Stri
de
len
gth
(m
)
A
B
Figure 5 Change in stride length (m) and stride frequency (Hz) as a function of speed (ms−1). Stridelength (A) changed by 0.55 m per unit of speed (u): y = 0.55u+ 1.43, R2
= 0.63, p < 0.001. Stride fre-quency (B) changed by 0.05 Hz for every unit of speed (u): y = 0.05u+0.88, R2
= 0.66, p< 0.001.Full-size DOI: 10.7717/peerj.6312/fig-5
DISCUSSIONThis study has highlighted the potential gains of using a UAV to collect field-basedkinematics. Using a moving vs. static camera allowed for a larger quantity of data to berecorded than would otherwise have been possible. We have shown that speed and other2D kinematic parameters can be measured in this way. The major technical challenge wascalibrating the raw footage to calculate spatial parameters. The most consistent calibrations
Basu et al. (2019), PeerJ, DOI 10.7717/peerj.6312 12/21
0.3
0.4
0.5
4 5 6 7
0.34
0.38
0.42
0.46
0.5
Swin
g d
ura�
on
(s)
Stan
ced
ura�
on
(s)
0.44
0.48
0.52
0.56
0.6
4 5 6 7
0.34
0.38
0.42
0.46
0.5 C
Speed (ms-1)
B
A
Du
ty f
acto
r
Figure 6 Changes in stance duration (s), swing duration (s) and duty factor as a function of speed(ms−1). (A) Stance duration was longer in the forelimb (blue circles) than the hindlimb (red circles), andboth decreased with speed (FL: y =−0.04u+0.57, R2
= 0.70, p< 0.001; HL: y =−0.04u+0.55, R2= 0.74,
p< 0.001). Swing duration (B) was independent of speed, resulting in a duty factor (C) which was greaterin the forelimb than the hindlimb, and which decreased with speed (FL: y =−0.03u+0.55, R2
= 0.49, p<
0.001; HL: y =−0.03u+0.53, R2= 0.54, P < 0.001).
Full-size DOI: 10.7717/peerj.6312/fig-6
Basu et al. (2019), PeerJ, DOI 10.7717/peerj.6312 13/21
4 5 6 7
0.2
0.3
0.4
Speed (ms-1)
Ph
ase
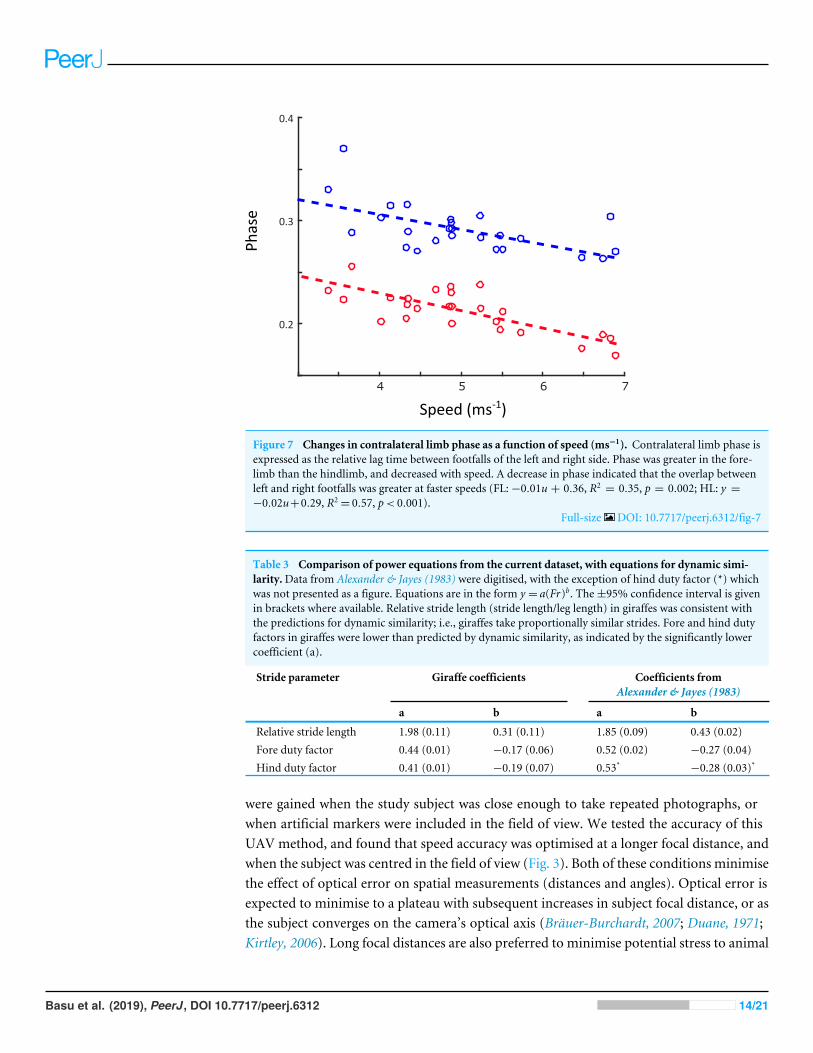
Figure 7 Changes in contralateral limb phase as a function of speed (ms−1). Contralateral limb phase isexpressed as the relative lag time between footfalls of the left and right side. Phase was greater in the fore-limb than the hindlimb, and decreased with speed. A decrease in phase indicated that the overlap betweenleft and right footfalls was greater at faster speeds (FL:−0.01u + 0.36, R2
= 0.35, p = 0.002; HL: y =−0.02u+0.29, R2
= 0.57, p< 0.001).Full-size DOI: 10.7717/peerj.6312/fig-7
Table 3 Comparison of power equations from the current dataset, with equations for dynamic simi-larity.Data from Alexander & Jayes (1983) were digitised, with the exception of hind duty factor (*) whichwas not presented as a figure. Equations are in the form y = a(Fr)b. The±95% confidence interval is givenin brackets where available. Relative stride length (stride length/leg length) in giraffes was consistent withthe predictions for dynamic similarity; i.e., giraffes take proportionally similar strides. Fore and hind dutyfactors in giraffes were lower than predicted by dynamic similarity, as indicated by the significantly lowercoefficient (a).
Stride parameter Giraffe coefficients Coefficients fromAlexander & Jayes (1983)
a b a b
Relative stride length 1.98 (0.11) 0.31 (0.11) 1.85 (0.09) 0.43 (0.02)Fore duty factor 0.44 (0.01) −0.17 (0.06) 0.52 (0.02) −0.27 (0.04)Hind duty factor 0.41 (0.01) −0.19 (0.07) 0.53* −0.28 (0.03)*
were gained when the study subject was close enough to take repeated photographs, orwhen artificial markers were included in the field of view. We tested the accuracy of thisUAV method, and found that speed accuracy was optimised at a longer focal distance, andwhen the subject was centred in the field of view (Fig. 3). Both of these conditions minimisethe effect of optical error on spatial measurements (distances and angles). Optical error isexpected to minimise to a plateau with subsequent increases in subject focal distance, or asthe subject converges on the camera’s optical axis (Bräuer-Burchardt, 2007; Duane, 1971;Kirtley, 2006). Long focal distances are also preferred to minimise potential stress to animal
Basu et al. (2019), PeerJ, DOI 10.7717/peerj.6312 14/21
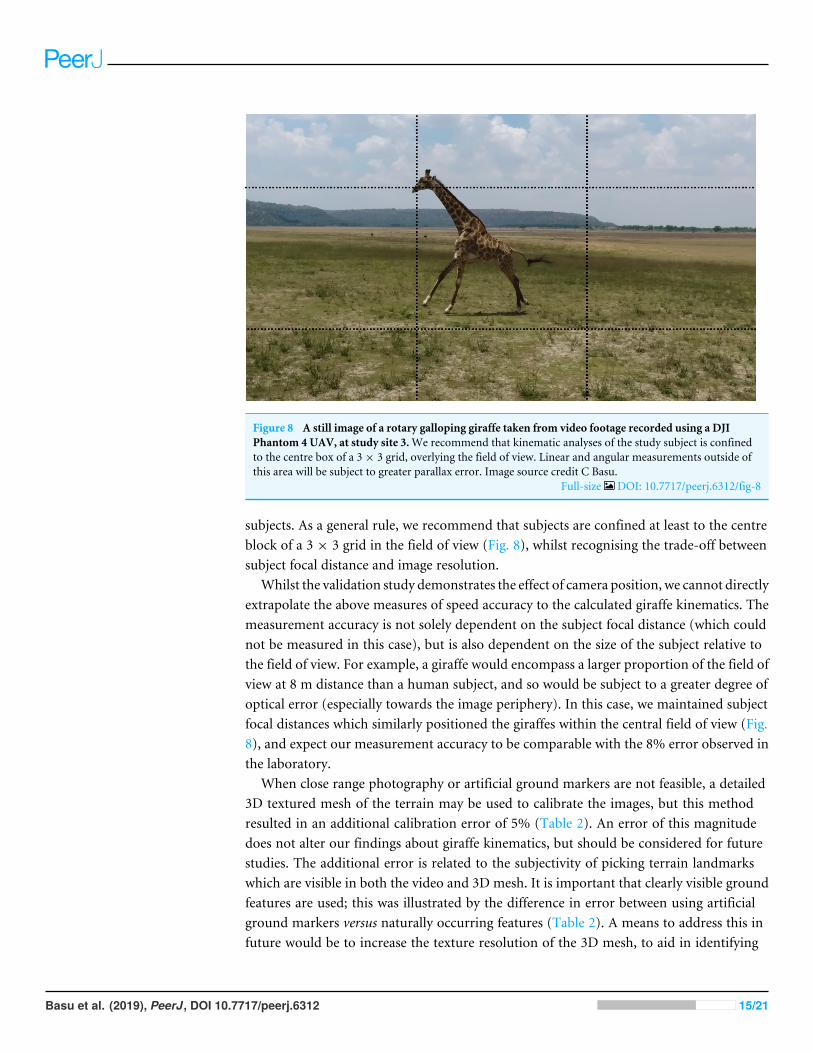
Figure 8 A still image of a rotary galloping giraffe taken from video footage recorded using a DJIPhantom 4 UAV, at study site 3.We recommend that kinematic analyses of the study subject is confinedto the centre box of a 3× 3 grid, overlying the field of view. Linear and angular measurements outside ofthis area will be subject to greater parallax error. Image source credit C Basu.
Full-size DOI: 10.7717/peerj.6312/fig-8
subjects. As a general rule, we recommend that subjects are confined at least to the centreblock of a 3 × 3 grid in the field of view (Fig. 8), whilst recognising the trade-off betweensubject focal distance and image resolution.
Whilst the validation study demonstrates the effect of camera position, we cannot directlyextrapolate the above measures of speed accuracy to the calculated giraffe kinematics. Themeasurement accuracy is not solely dependent on the subject focal distance (which couldnot be measured in this case), but is also dependent on the size of the subject relative tothe field of view. For example, a giraffe would encompass a larger proportion of the field ofview at 8 m distance than a human subject, and so would be subject to a greater degree ofoptical error (especially towards the image periphery). In this case, we maintained subjectfocal distances which similarly positioned the giraffes within the central field of view (Fig.8), and expect our measurement accuracy to be comparable with the 8% error observed inthe laboratory.
When close range photography or artificial ground markers are not feasible, a detailed3D textured mesh of the terrain may be used to calibrate the images, but this methodresulted in an additional calibration error of 5% (Table 2). An error of this magnitudedoes not alter our findings about giraffe kinematics, but should be considered for futurestudies. The additional error is related to the subjectivity of picking terrain landmarkswhich are visible in both the video and 3D mesh. It is important that clearly visible groundfeatures are used; this was illustrated by the difference in error between using artificialground markers versus naturally occurring features (Table 2). A means to address this infuture would be to increase the texture resolution of the 3D mesh, to aid in identifying
Basu et al. (2019), PeerJ, DOI 10.7717/peerj.6312 15/21
ground points. This can be done by conducting the aerial survey closer to the ground, butas a trade-off, this demands more images per area, resulting in longer flight times. As UAVbattery life improves, this trade-off will become less important.
Camera sampling rate was also a limitation. 120 Hz was the standard for low-costUAV technology at the time of data collection. Whilst this was sufficient for measuringdisplacement and speed across the stride, measuring the velocity or acceleration duringfoot contact events (for the purpose of stride segmentation) resulted in excessive noise. Infuture, an interpolation approach could be used to artificially increase the sampling rate.
Using this methodology, we were able to measure temporospatial parameters infree-roaming giraffes without any physical contact. We found that giraffes’ lack of anintermediate speed gait (e.g., trot/pace) was compensated for by their rotary gallopinggait, in that the walk-gallop transition speed of approximately 3.4 ms−1 fell close to themass-specificminimum trotting speed observed in othermammalian quadrupeds (Heglund& Taylor, 1988). For example, using Eq. (7), a giraffe weighing 700 kg would be expectedto have a minimum trotting speed of 3 ms−1.
Minimum trotting speed = 0.593(body mass0.249). (7)
In absolute terms, giraffes can be thought of as being slow gallopers (without routinelyusing a cantering gait). Beyond the walk-to-gallop transition, increases in gallopingspeed were almost exclusively achieved by increases in stride length; contrasting withthe conserved range of stride frequencies. This pattern is consistent in a wide rangeof quadrupedal running animals, and is thought to reduce mass-specific energy costs(Heglund & Taylor, 1988).
The giraffes in this study galloped with lower duty factors than predicted by dynamicsimilarity (Table 3). It is tempting to suggest that giraffes experience similarly higher thanexpected vertical peak ground reaction forces (GRFs) at equivalent speeds, because peakvertical GRF is usually inversely associated with duty factor (Alexander, 1984; Witte, Knill& Wilson, 2004). Unfortunately in giraffes it may not be possible to accurately predict peakGRF from duty factor alone. In our previous work peak vertical GRF during walking wasspeed-independent; a finding which may be related to limb compliance (Basu, Wilson &Hutchinson, 2019). This could be explored in future with a giraffe musculoskeletal modeland a forward dynamics simulation in which peak GRFs are simulated as a function ofspeed, as experimental data collection from giraffes galloping over force plates may belogistically impossible. Such findings would have implications for muscle power demandsand tissue safety factors in giraffes.
Contralateral limb phase decreased with speed (Fig. 7), resulting in a greater degree ofoverlap between lead and non-lead footfalls. This is consistent with a peak GRF-minimisingstrategy, where bodyweight is evenly distributed over two limbs during a greater proportionof the stride. Such a mechanism would be particularly advantageous to giraffes, whichpossess a disproportionately slender appendicular skeleton, and so may be sensitive to largeskeletal compressive and bending stresses (Biewener, 1983;McMahon, 1975).
The phase relationship between body pitch and neck angle was variable between trials,with a mean congruity of 70%. Given that 100% congruity would represent in-phase neck
Basu et al. (2019), PeerJ, DOI 10.7717/peerj.6312 16/21
ventroflexion and positive body pitching, we speculate that the giraffe neck is inertiallystabilised with respect to a world frame, and is effectively decoupled from the motionsof the trunk during running; a similar situation to the energy-conserving mechanismobserved during walking (Basu, Wilson & Hutchinson, 2019). A method of testing thisidea in the future would be to examine the effect of ground incline, net acceleration andhigh-speed turning on neck kinematics. Topography generated by the 3D terrain mappingmethod used in this study would be particularly useful for this purpose. Alternatively, thevariation between strides with respect to phase, as well as the variation in neck angle (Fig.2B), may indicate an additional or different effect. Variation in angular neck kinematicsduring galloping has also been noted by Dagg (1962). Defining neck kinematics using asingle angle may partly explain this issue, as the cervical vertebral series is far from rigid,and displays varying degrees of curvature over the course of a single stride (Video S1). Aspline-based analysis may yield a more robust parameter with which to investigate giraffes’neck kinematics.
The giraffes were studied in their natural habitat, meaning any conclusions can be moreconfidently applied to giraffes as a wild species, compared with a laboratory setting whereconclusions are confined to a specific set of conditions. The drawback is that controlledexperimental conditions were not strictly possible. The effects of confounding variableswere kept to a minimum by only collecting data from relatively flat terrain, avoidingextremes of weather conditions and comparing giraffes of similar size. Textured terrainmodels can be used in future to quantify elevation, substrate type and other random effects.Such terrain parameters may useful in investigating giraffes’ athletic abilities and energeticcosts.
CONCLUSIONSThis study was a novel application of a UAV system, and has highlighted the gains andtechnical challenges of this method. We recommend that UAV users minimise kinematicmeasurement error by maximising the focal distance and confining the study subject tothe centre of the field of view. Giraffes’ lack of an intermediate gait was compensated forby their rotary galloping gait; giraffes are slow gallopers. Duty factors were lower thanpredicted by dynamic similarity, suggesting that galloping giraffes may experience highpeak ground reaction forces. However, a speed-dependent reduction in contralateral limbphase, and modest maximal speed may maintain appropriate tissue safety factors.
ACKNOWLEDGEMENTSWe thankWoodlands HillsWildlife Estate, the Free State Nature Conservation (FSDETEA)and Mangaung Municipality for kindly permitting us to conduct this study on theirproperties. We appreciated the help of reserve managers William Killian and Rudi Virtue,as well as Ellen Holding for their assistance during the fieldwork. We thank the NaturalWildlife Bridge (Texas, USA), theHighlandsNature Club (Eastern Free State, South Africa),and the University of the Free State (South Africa) for providing logistical support. Thankyou to Alice Morrell and Emily Sparkes for assisting with laboratory-based data collection.
Basu et al. (2019), PeerJ, DOI 10.7717/peerj.6312 17/21
Finally, we thank two reviewers, Carlo Massimo Biancardi and Christofer Clemente, fortheir helpful comments.
ADDITIONAL INFORMATION AND DECLARATIONS
FundingThis work was funded by NERC (PhD studentship for Christopher Basu; grant no.NE/K004751/1 to John Hutchinson), ERC (Advanced grant AD-G 323041 to AlanWilson),National Research Foundation (South African project no. V106005 to Francois Deacon),Society for Experimental Biology student travel grant (Christopher Basu), and a Companyof Biologists Travelling Fellowship (Christopher Basu). The funders had no role in studydesign, data collection and analysis, decision to publish, or preparation of the manuscript.
Grant DisclosuresThe following grant information was disclosed by the authors:NERC: NE/K004751/1.ERC: AD-G 323041.National Research Foundation: V106005.Society for Experimental Biology.Company of Biologists Travelling Fellowship.
Competing InterestsJohn R. Hutchinson is an Academic Editor for PeerJ.
Author Contributions• Christopher K. Basu conceived and designed the experiments, performed theexperiments, analyzed the data, prepared figures and/or tables, authored or revieweddrafts of the paper, approved the final draft.• Francois Deacon conceived and designed the experiments, performed the experiments,contributed reagents/materials/analysis tools, approved the final draft.• John R. Hutchinson conceived and designed the experiments, approved the final draft.• Alan M. Wilson conceived and designed the experiments, contributed reagents/materi-als/analysis tools, approved the final draft.
Human EthicsThe following information was supplied relating to ethical approvals (i.e., approving bodyand any reference numbers):
This study had ethical approval from the Royal Veterinary College (URN 2016 1538) tocarry out the study on giraffes and humans within its facilities and in fieldwork.
Animal EthicsThe following information was supplied relating to ethical approvals (i.e., approving bodyand any reference numbers):
Basu et al. (2019), PeerJ, DOI 10.7717/peerj.6312 18/21
Both the Royal Veterinary College (URN 2016 1538) and the University of the Free State,South Africa (UFS-AED2016/0063) provided full approval for this observational researchon giraffes.
Field Study PermissionsThe following information was supplied relating to field study approvals (i.e., approvingbody and any reference numbers):
Field experiments were approved by the Free State Province Department of EconomicDevelopment, Tourism and Environmental Affairs (permit number 01/34481).
Data AvailabilityThe following information was supplied regarding data availability:
The kinematic measurements and statistical analyses (in .xlsx format) are available asSupplementary Files. A video of a representative stride is also available (Video S1).
Supplemental InformationSupplemental information for this article can be found online at http://dx.doi.org/10.7717/peerj.6312#supplemental-information.
REFERENCESAhn AN, Furrow E, Biewener AA. 2004.Walking and running in the red-legged
running frog, Kassina maculata. Journal of Experimental Biology 207:399–410DOI 10.1242/jeb.00761.
Alexander RM. 1984. The gaits of bipedal and quadrupedal animals. The InternationalJournal of Robotics Research 3:49–59 DOI 10.1177/027836498400300205.
Alexander R, Jayes A. 1983. A dynamic similarity hypothesis for the gaits of quadrupedalmammals. Journal of Zoology 201:135–152.
Alexander RM, Langman VA, Jayes AS. 1977. Fast locomotion of some African ungu-lates. Journal of Zoology 183:291–300 DOI 10.1111/j.1469-7998.1977.tb04188.x.
Badlangana N, Adams JW,Manger PR. 2009. The giraffe cervical vertebral column: aheuristic example in understanding evolutionary processes? Zoological Journal of theLinnean Society 155:736–757 DOI 10.1111/j.1096-3642.2008.00458.x.
Basu C,Wilson AM, Hutchinson JR. 2019. The locomotor kinematics and groundreaction forces of walking giraffes. Journal of Experimental Biology 222(2):Articlejeb159277 DOI 10.1242/jeb.159277.
Benjamini Y, Hochberg Y. 1995. Controlling the false discovery rate: a practical andpowerful approach to multiple testing. Journal of the Royal Statistical Society SeriesB (Methodological) 57(1):289–300.
Biancardi CM,Minetti AE. 2012. Biomechanical determinants of transverse and rotarygallop in cursorial mammals. Journal of Experimental Biology 215:4144–4156DOI 10.1242/jeb.073031.
Biewener AA. 1983. Allometry of quadrupedal locomotion: the scaling of duty factor,bone curvature and limb orientation to body size. Journal of Experimental Biology105:147–171.
Basu et al. (2019), PeerJ, DOI 10.7717/peerj.6312 19/21
Bräuer-Burchardt C. 2007. The influence of target distance to lens distortion variation.In: Optical metrology. Bellingham: SPIE, 11.
Cartmill M, Lemelin P, Schmitt D. 2002. Support polygons and symmetrical-gaits in mammals. Zoological Journal of the Linnean Society 136:401–420DOI 10.1046/j.1096-3642.2002.00038.x.
Dagg AI. 1962. The role of the neck in the movements of the giraffe. Journal of Mammal-ogy 43:88–97 DOI 10.2307/1376883.
Dagg AI, Vos AD. 1968. The walking gaits of some species of Pecora. Journal of Zoology155:103–110.
Daley MA, Channon AJ, Nolan GS, Hall J. 2016. Preferred gait and walk–run transitionspeeds in ostriches measured using GPS-IMU sensors. Journal of ExperimentalBiology 219:3301–3308 DOI 10.1242/jeb.142588.
Duane CB. 1971. Close-range camera calibration. Photogrammetric Engineering37:855–866.
Dunbar DC. 2004. Stabilization and mobility of the head and trunk in vervet monkeys(Cercopithecus aethiops) during treadmill walks and gallops. Journal of ExperimentalBiology 207:4427–4438 DOI 10.1242/jeb.01282.
Dunbar DC, Macpherson JM, Simmons RW, Zarcades A. 2008. Stabilization andmobility of the head, neck and trunk in horses during overground locomotion:comparisons with humans and other primates. Journal of Experimental Biology211:3889–3907 DOI 10.1242/jeb.020578.
Hedrick TL. 2008. Software techniques for two- and three-dimensional kinematicmeasurements of biological and biomimetic systems. Bioinspiration & Biomimetics3:Article 034001 DOI 10.1088/1748-3182/3/3/034001.
Heglund NC, Taylor CR. 1988. Speed, stride frequency and energy cost per stride: howdo they change with body size and gait? Journal of Experimental Biology 138:301–318.
HildebrandM. 1976. Analysis of tetrapod gaits: general considerations and symmetricalgaits. Neural Control of Locomotion 18:203–206 DOI 10.1007/978-1-4757-0964-3_9.
HildebrandM. 1977. Analysis of asymmetrical gaits. Journal of Mammalogy 58(2):131–156DOI 10.2307/1379571.
Hubel TY, Myatt JP, Jordan NR, Dewhirst OP, McNutt JW,Wilson AM. 2016. Additiveopportunistic capture explains group hunting benefits in African wild dogs. NatureCommunications 7:Article 11033 DOI 10.1038/ncomms11033.
Hutchinson JR, Schwerda D, Famini DJ, Dale RH, Fischer MS, Kram R. 2006. Thelocomotor kinematics of Asian and African elephants: changes with speed and size.Journal of Experimental Biology 209:3812–3827 DOI 10.1242/jeb.02443.
Kirtley C. 2006. Clinical gait analysis: theory and practice. Philadelphia: Elsevier HealthSciences.
Maxwell M. 1924. Stalking big game with a camera in equatorial Africa: with a monographon the African elephant. London: William Heinemann.
McMahon TA. 1975. Allometry and biomechanics: limb bones in adult ungulates. TheAmerican Naturalist 109:547–563 DOI 10.1086/283026.
RasbandW. 2009. ImageJ. Bethesda: US National Institutes of Health. 1997–2006.
Basu et al. (2019), PeerJ, DOI 10.7717/peerj.6312 20/21
Starke SD, Clayton HM. 2015. A universal approach to determine footfall tim-ings from kinematics of a single foot marker in hoofed animals. PeerJ 3:e783DOI 10.7717/peerj.783.
Suzuki S, Owaki D, Fukuhara A, Ishiguro A. 2016. Quadruped gait transition from walkto pace to rotary gallop by exploiting head movement. In: Conference on biomimeticand biohybrid systems. Springer, 532–539.
TaoW, Liu T, Zheng R, Feng H. 2012. Gait analysis using wearable sensors. Sensors12:2255–2283 DOI 10.3390/s120202255.
Witte T, Knill K, Wilson A. 2004. Determination of peak vertical ground reaction forcefrom duty factor in the horse (Equus caballus). Journal of Experimental Biology207:3639–3648 DOI 10.1242/jeb.01182.
Basu et al. (2019), PeerJ, DOI 10.7717/peerj.6312 21/21