Embed Size (px)
Citation preview
THE RP-2000 MORTALITY TABLES
Chapter PageExecutive Summary 1
1 Background and Collection of Data 42 Validation of Data and Final Data Set 83 Construction of Basic Table 204 RP-2000 Tables 305 Relative Mortality 436 Differences in Mortality Rates by Plan within Industry 587 Projections of Mortality Improvement after 2000 628 Comparison of RP-2000 to Other Tables 69
Table Description Page
2-1 Exposures Excluded from RP-2000 Base Tables 92-2 Distribution of Exposures by Industry 102-3 Male Employee Basic Data 112-4 Female Employee Basic Data 122-5 Male Retiree Basic Data 132-6 Female Retiree Basic Data 142-7 Male Beneficiary Basic Data 152-8 Female Beneficiary Basic Data 162-9 Male Disabled Annuitant Basic Data 172-10 Female Disabled Annuitant Basic Data 182-11 Summary of Basic Data 193-1 1992 Base Year Rates 274-1 Annualized Recent Mortality Improvement Trends – Male 314-2 Annualized Recent Mortality Improvement Trends – Female 324-3 Male Employee and Healthy Retiree Mortality Improvement Factors
Projection of Study Rates To 200033
4-4 Weighting Factors to Produce Combined Healthy Participant Table 344-5 Male RP-2000 Rates 354-6 Female RP-2000 Rates 385-1 Relative Amount – Weighted Mortality by Collar and Amount
Male Healthy Annuitants, Ages 65 to 6944
5-2 Relative Mortality by Size of Pension 455-3 Relative Mortality by Blue or White Collar 455-4 Relative Mortality for Healthy Annuitants by Industry Code 46

5-5 Ratio of Graduated Mortality Rates by Collar to Overall Mortalityfor Employees
49
5-6 Ratio of Graduated Mortality Rates by Collar and Amount to OverallMortality for Healthy Annuitants – Male Lives
50
5-7 Ratio of Graduated Mortality Rates by Collar and Amount to OverallMortality for Healthy Annuitants – Female Lives
51
6-1 Variation of Mortality by Plan Within Industry - 23 Plans in 4Industries
59
6-2 Variation of Mortality by Plan Within Industry - 9 Plans withAmount Information In One Industry
61
7-1 Annualized Long Term Mortality Improvement Trends – Male 637-2 Annualized Long Term Mortality Improvement Trends – Female 647-3 Mortality Projection Scale AA 668-1 Comparison of GAM-83, UP-94, UP-94 Projected to 2000, and
RP-2000 Annuity Values - 5% Interest70
8-2 Comparison of GAM-83, UP-94, UP-94 Projected to 2000, andRP-2000 Annuity Values - 7% Interest
71
8-3 Comparison of GAM-83, UP-94, UP-94 Projected to 2000, andRP-2000 Annuity Values - 9% Interest
72
8-4 Comparison of Current Liabilities Using PIMS Census Assuming 50%Male 50% Female
74
8-5 Comparison of Current Liabilities Using PIMS Census Assuming 75%Male 25% Female
75
8-6 Comparison of Current Liabilities Using PIMS Census Assuming 75%Female 25% Male
75
B-1 Volume Summary 84B-2 Raw Employee Death Rates 85B-3 Raw Healthy Retiree Death Rates 85B-4 Raw Beneficiary Death Rates 86B-5 Raw Disabled Retiree Death Rates 86C-1 Ratios of Multiemployer Mortality to RP-2000 Base – Healthy
Annuitants87
F-1 Mortality Comparison for Males Age 60-64 92F-2 Mortality Comparison for Males Age 65-69 92F-3 Mortality Comparison for Males Age 70-74 93F-4 Mortality Comparison for Males Age 75-79 93F-5 Mortality Comparison for Females Age 60-64 94F-6 Mortality Comparison for Females Age 65-69 94F-7 Mortality Comparison for Females Age 70-74 95F-8 Mortality Comparison for Females Age 75-79 95
Figure Description Page3-1 Female Retiree Raw and Graduated Amount Adjustment Factors 223-2 Male Retiree Raw and Graduated Amount Adjustment Factors 234-1 Comparison of RP-2000 Mortality Rates by Participant Status – Males
Ages 50-6941
4-2 Comparison of RP-2000 Mortality Rates by Participant Status –Females Ages 50-69
42
5-1 Relative Mortality by Collar for Male Employees 525-2 Relative Mortality by Collar for Male Retirees 535-3 Relative Mortality by Collar for Female Employees 545-4 Relative Mortality by Collar for Female Retirees 555-5 Relative Mortality by Amount for Male Retirees 565-6 Relative Mortality by Amount for Female Retirees 57C-1 Ratios of Multiemployer Mortality to RP-2000 Base – Healthy
Annuitants88
Appendix Description PageA Letter Requesting Data with Instructions 76B Effect of Auto Manufacturers Data 84C Multiemployer Mortality Rates 87D Ratios of Graduated Mortality Rates for Beneficiaries and Retirees to
All Healthy Annuitants89
E Determination and Blending of Mortality Rates 90F Mortality Comparisons by Collar and Amount 92G RP-2000 Projected 10 Years Using Scale AA 96

The RP-2000 Mortality Tables
Executive Summary
The Retirement Protection Act of 1994 (RPA) established mortality assumptions to be used whencalculating Current Liabilities for pension plans. This was the first time that standard tables had beenmandated for this purpose. The Secretary of the Treasury has the authority to promulgate a new table inthe year 2000. The Society of Actuaries (SoA) conducted this study of uninsured pension plan mortality inresponse to RPA and to ensure that the Treasury Department would have current and thorough informationavailable when it considers updating the mandatory mortality table. The SoA charged the Retirement PlansExperience Committee (RPEC) with the responsibility for conducting this study.
The purpose of this report is to provide actuaries with all of the significant findings of the RPEC alongwith full explanation of when and how these should be used in reviewing or setting mortality rates forspecific plans. The report does not recommend specific tables to the Secretary of Treasury to adopt inconformance to RPA. The SoA believes it is appropriately the role of the American Academy ofActuaries to recommend tables to the Secretary based on this mortality study and other pertinentinformation.
This report presents the RP-2000 Tables, new graduated basic amount-adjusted mortality tablesprojected to the year 2000, and explains how the tables were developed. Scale AA is recommendedfor projecting the proposed mortality rates beyond the year 2000. The report compares experience bytype of employment, amount of annuity, and industry. Actuaries should keep in mind that these tableswere developed from experience on mortality for uninsured pension plans and are only recommendedfor use for those types of plans.
The final database used for this study reflects nearly 11 million life-years of exposure and more than190,000 deaths, all from uninsured pension plans subject to RPA Current Liability rules. More than100 pension plans submitted data in response to the request from the RPEC for experience from planyears 1990 through 1994. The RPEC determined that this volume of data was sufficient to producevalid mortality tables.
The contributors were asked to provide data defined by several characteristics including StandardIndustrial Classification (SIC) and amount. The contributors indicated whether the plan covered hourlyor salaried workers, and whether the plan was collectively bargained or not. Based on this information,plans were categorized as blue collar, white collar, or mixed collar. The data contributors summarizedtheir mortality experience into cells by age, gender, and status (employees, retirees, disableds, andbeneficiaries).
For each cell, the RPEC asked the submitter to provide the number of participants on the valuationdate, the amounts of annual pay or annuities, the number of deaths during the year following thevaluation date, and the amounts associated with those deaths. While all data contributors included thenumber of participants and the number of deaths, many did not provide information on amounts. About60 percent of the exposed employee lives and 40 percent of the exposed annuitant lives included

information about amounts. The RPEC used data from plans providing amounts to adjust the lives-based mortality for the entire database to an amount-adjusted basis.
The RPEC generated separate tables by gender for employees, healthy annuitants, and disabledretirees. The RPEC agreed that there was sufficient data for credible tables for these groups and thatthe mortality among the groups differed sufficiently to justify use of separate tables. Where unisex tablesare desirable, the RPEC recommends that the actuary should construct blended tables based on theproportion of each gender in the plan population.
The healthy annuitant table combines experience of healthy retirees and beneficiaries. A combinedemployee and healthy annuitant table was also produced as a more direct comparison to earlier tablesand for actuaries to use if a combined table is needed. The RPEC encourages use of the separateemployee and healthy annuitant tables.
Using the RP-2000 mortality table for healthy annuitants may overstate plan liabilities if used to valuebenefits for both healthy and disabled annuitants. However, the RP-2000 mortality table for disabledretirees may not be appropriate for valuing benefits of disabled annuitants in all cases. This table isbased on the experience of all disabled annuitants whether or not they were eligible to receive SocialSecurity disability benefits. Actuaries should use professional judgment when applying this table if theplan’s definition of disability is particularly strict or liberal.
The central year of the data for these tables was estimated as 1992 and the tables were projected to thebase year 2000. Three sources of data were reviewed to study recent trends in mortality. These wereSocial Security, Federal Civil Service, and the data collected for this study. The RPEC developedmortality improvement factors to project from 1992 to 2000 based on analysis of these sources. Tostudy long-term trends in mortality the RPEC examined data from four sources: Social Security, FederalCivil Service, the Railroad Retirement Board, and the SoA group annuity mortality studies. The RPECdecided to recommend the use of Scale AA for projecting mortality rates beyond the year 2000. ScaleAA was developed for use with the Group Annuity Reserving 1994 table. The RPEC recommendsprojection of mortality rates and encourages the use of generational mortality projection. In caseswhere it is not material or cost effective to incorporate generational mortality projection, the actuaryshould project mortality improvement on a comparable static basis.
Statistical analysis of the data showed that collar type and amount are both significant predictors ofmortality for this data set. For example, for male annuitants age 65 to 69 the small amount mortalitywas 77 percent greater than the large amount mortality and blue collar mortality was 43 percent greaterthan white collar mortality. By comparison, male annuitant mortality was 31 percent greater than femalemortality at age 67. Collar type is defined as blue or white depending on the characteristics of thegroup. Amount is defined as low, medium, or high based on the individual’s annuity. SIC was notfound to be a consistently significant predictor of mortality.

The RPEC found that both collar and amount can bear a relationship to the underlying mortalitycharacteristics of a retirement plan. The RPEC recommends that the individual characteristics andexperience of a retirement plan be considered in selecting the mortality table. In certain cases eithercollar or amount may be appropriate factors to consider, subject to the theoretical concerns outlined inChapter 5. While either factor was found to be a statistically significant indicator of differences inmortality, the RPEC recognizes that for the majority of plans subject to RPA legislation, adjustment ofthe standard mortality tables in a manner consistent with the data collection method and results of thisstudy will be considerably more practical if the collar factor is used.
An analysis of the variability of mortality experience among plans in the same industry showed thatdifferences were statistically significant in most cases tested. Actual deaths by plan ranged from about20 percent below industry average to 30 percent above industry average. Significant differences werefound even after adjusting for collar type and annuity size group.
Annuity values based on the RP-2000 Tables were calculated and compared to annuity values based onthe GAM-83 and UP-94 tables. In general, the RP-2000 values are between two and nine percenthigher for males and between three and five percent lower for females than the GAM-83 values. TheRP-2000 values for males under age 80 are within two percent of the values based on the UP-94 tableprojected to 2000. For males at ages 80 and 90 the RP-2000 values are substantially lower than theprojected UP-94 values. For females the RP-2000 values are lower than the projected UP-94 valuesby about two to four percent.

Chapter 1 - Background and Collection of Data
Reason for New Study
The Retirement Plans Experience Committee (RPEC) initiated the study in 1995 at the request of theCommittee on Retirement Systems Research of the Society of Actuaries (SoA). This study is inresponse to provisions of the Retirement Protection Act of 1994 (RPA) which was passed as part ofthe General Agreement on Tariffs and Trade (GATT). The GATT legislation [PL 103-465] was signedby President Clinton on December 8, 1994.
The RPA changed the Current Liability provisions of the minimum funding standards in several ways.The change relevant to this study concerns the mortality assumptions used to calculate a plan’s CurrentLiability [IRC section 412(l)(7)(C)(ii)]. Through 1999, such plans must use the 1983 Group AnnuityMortality (GAM-83) tables for healthy lives as specified in Internal Revenue Service (IRS) RevenueRuling 95-28 and disabled lives as specified in Revenue Ruling 96-7. The latter Revenue Rulingprovides for separate gender-distinct mortality tables for annuitants who became disabled after 1994and who are receiving Social Security disability benefits. The ruling also provides for separate gender-distinct mortality tables for annuitants who became disabled before 1995, regardless of their eligibilityfor Social Security disability benefits. The Secretary of the Treasury may, but is not required to,promulgate a new table in 2000. Thereafter, the Secretary will be able to change the mortality standardevery five years. IRS Announcement 2000-7 (January 21, 2000) states that the IRS and the TreasuryDepartment “anticipate that in no event would there be any change in the mortality tables for plan yearsbeginning before January 1, 2001.”
The Group Annuity Reserving 1994 (GAR-94) and Uninsured Pensioner 1994 (UP-94) tables hadrecently been published when GATT was passed. However, the SoA believed that there was sufficientinterest in the RPA provisions to call for a new study of pension plan mortality. Since sufficient datawere submitted to produce a set of new mortality tables, the RPEC asked the SoA for authorization toproduce a set of mortality tables based on the experience submitted. The SoA approved the request.
Role of the RPEC
Initially the RPEC had two goals for its work on the new mortality data. The first was the traditionalrole of performing a complete mortality study for actuaries to use in determining the best mortality ratesfor an individual plan. The second was to recommend a table or set of tables for the Secretary ofTreasury to adopt in conformance with GATT legislation.
It soon became clear that these two goals could not both be met in one study. The RPEC could notproduce a single report that both (1) presents the full range of tables and modifications that should beconsidered by actuaries in selecting the most appropriate mortality rate for a pension plan, and (2)presents a more narrow set of tables to be recommended to the Secretary of the Treasury for adoptionin conformance with RPA.

We discussed this issue with officials of the Society of Actuaries and agreed that our report should focuson the traditional role of providing full information with appropriate caveats on the source and potentialuse of the mortality tables. This report is not a recommendation to the Secretary of the Treasury fortables to adopt in conformance with RPA. The SoA believes it is appropriately the role of theAmerican Academy of Actuaries to recommend tables to the Secretary based on this mortality studyand other pertinent information.
RPEC Process
All of the RPEC meetings have been open. Representatives of the four government agencies with apotential interest in the work were kept informed of the meetings throughout and often attended themeetings. The four agencies are the Office of Tax Policy of the Treasury Department, the InternalRevenue Service (IRS), the Pension Benefit Guaranty Corporation (PBGC), and the Pension andWelfare Benefits Administration (PWBA) of the Department of Labor. Other interested parties,including representatives of the American Academy of Actuaries and other committees of the SoA haveattended meetings. The minutes of all of the meetings have been published in the Pension SectionNews.
RPEC Membership
The members of the RPEC are Vincent Amoroso, Kevin Binder, John Kalnberg, Lindsay Malkiewich,Julie Pope, Barthus Prien, Gregory Schlappich, and Diane Storm. The Chair is Edwin Hustead and theVice-Chair is Michael Virga. Four of the members had participated in the committees that haddeveloped the UP-94 and GAR-94 mortality tables.
Call for Data
The RPEC developed a set of data submission instructions, along with an explanatory cover letterrequesting the data (see Appendix A). These were sent to all members of the Pension Section of theSociety of Actuaries on September 29, 1995. A letter from representatives of four large industrialcompanies to many of their colleagues encouraged participation in the study.
The original deadline for submissions of December 31, 1995 was extended twice to allow for thesubmission of major sets of data that were being prepared. Eventually data collection was closed onJune 1, 1996.
Data Requested
For each plan, actuaries were asked to provide a plan number assigned by the submitter, the plansponsor’s Standard Industrial Classification (SIC) code, and the type of participants (salaried, hourly,union, non-union, or a combination). If the participants were not all of one type, the submitter wasasked to estimate the percentage of each type in the plan. Submitters were also asked to provide a

brief summary of eligibility and benefit formulas, the disability provisions, and any other information thatwould be helpful in interpreting the data.

Actuaries were asked to submit data celled according to the following characteristics:
• Valuation date• Age nearest valuation date• Gender• Participant status - employee, non-disabled retiree, disabled retiree, or beneficiary• Annuity size for retirees and beneficiaries - small (annuity of less than $6,000 a year),
medium ($6,000 to $14,400 a year) or large (more than $14,400 a year)
For each cell, the submitter was asked to provide the following information:
• The number of participants on the valuation date• Total annual pay for employees• Total annual benefit for retirees and beneficiaries• Number and annual pay for deaths among employees during the year following the valuation
date• Number and annual benefit for deaths among retirees and beneficiaries during the year
following the valuation date
The preferred period of measurement was plan years ending in 1990 through 1994.
Data Collection Process
To ensure confidentiality, submissions were first received by Tom Edwalds, FSA, of the Society ofActuaries. The SoA staff checked that each submission contained both a computer diskette and hardcopy of the data, along with a description of pertinent plan benefits. The three automobile industrysubmitters were concerned about confidentiality and asked for special processing of their data. Theautomobile industry submitted data split up into many small files in order to mask the identity of thecontributor. The SoA staff verified that all of the small files used identical formats, that the hard copiesall had the same appearance, and that the sum of the exposures and deaths by gender, collar, and statusfor the files submitted by each company matched the control totals provided. The small files were thencopied onto four diskettes in such a way that each diskette contained some of the files submitted byeach manufacturer. The hard copies of the data were placed into binders in the same order as the smallfiles were organized on the diskettes. The list of plan numbers used by each manufacturer has beenkept strictly confidential by SoA staff.
The data were then forwarded to the research team contracted to code, review, and summarize thedata. The research team consisted of Kathleen S. Elder, FSA, and Laxman Hegde, Ph.D., at FrostburgState University. Ms. Elder is an Associate Professor of Actuarial Science with over 14 yearsexperience in the pension field. Dr. Hegde is a statistician with extensive consulting experience instatistical analysis and expertise in major statistical software.
Development of Data Base

Elder consolidated the type categories into blue or white collar. The type was set as blue collar if morethan 70 percent of the participants were hourly or union. The type was set as white collar if more than70 percent of the participants were salaried and non-union. If the type could not be determined fromthe available information, Elder called the submitting actuary to determine if one of the two types couldbe assigned. If the type still could not be determined, it was set as mixed collar.
Annuity size was coded as small, medium, or large based on the designation by the submitter using thedefinition provided by the RPEC. Other data were coded as unknown amount. Submitters were askedto use the straight-life equivalents of annuities, if possible. Only one plan submitted data that werespecifically converted to the straight-life equivalent and most of the other submitters stated that theconversion was not made. The RPEC decided that combining all amounts as reported would notsignificantly distort the analysis.
In order to maintain the confidentiality of the data, Elder then stripped the plan identifiers from thedatabase prepared for the RPEC. Every cell accessible to the RPEC contained data from at least twoplans, so the RPEC had no way of analyzing data by plan or of identifying or reconstructing theexperience of any plan.
Industry code was the initial two digits of the SIC code. Since there was only one plan in SIC 35xx(machinery except electrical) it was merged with the plans in industry code 36 (electrical and electronicmachinery) to preserve confidentiality. After this combination and the exclusion of plans in two othercodes for the reasons discussed in Chapter 2, there remained 35 industry codes in the data set.
Thirty-eight percent of the submissions, including 58 percent of the exposure years, were for all planyears from 1990 through 1994. The rest covered a mix of years with some plans providing fewer thanfive years and others using a period that extended up to a year before or after the 1990 through 1994plan years. The RPEC deemed a midpoint of 1992 to be appropriate for the combined data.
A summary of plan provisions, including eligibility for early retirement and disability benefits, wassubmitted for almost all of the plans. This information was used to check for data inconsistencies suchas retirees who were too young to retire under the plan provisions.
Chapter 2 - Validation of Data and Final Data Set
The members of the RPEC and the research team reviewed all data for reasonableness. Elderdiscussed questions concerning potential errors with the submitters. Questions about the automobileindustry data were relayed through Edwalds.
Reasonableness checks were applied to the data received for each pension plan, including:
• aging of participant population by category from year to year
• significant increase/decrease in participant count by category from year to year
• unusual ages (e.g. “old” employees or “young” retirees)
• proportions of population in various groups (e.g. male/female, active/retiree)
• increases in salary from year to year
After the initial review, the number of deaths in each of the individual pension plans was compared tothe expected number of deaths based on the total experience of the entire group by category as definedby participant gender, collar, and status. Submitters of pension plans with data outside a 95 percentconfidence interval were contacted to determine if a correction should be made. Some of the data setswere accepted as valid based on explanations by the submitters. Other data sets were corrected by thesubmitters. This procedure was used for all data contributions, including the auto manufacturers data.The reasonableness checks on the automobile data were performed by Edwalds because of theconfidentiality agreement. All questioned data were corrected to the satisfaction of the RPEC.
One of the auto manufacturers was among those who decided to resubmit corrected data. In order tomaintain the confidentiality of all of the automobile contributors, Edwalds stripped the valuation datefrom the corrected submission and the submissions of the other firms from the automobile industry andcombined them before forwarding the corrected data to the researchers. The RPEC voted to acceptthe auto manufacturers’ data, as corrected, into the final data set. Results were later compared with andwithout the auto manufacturers’ data. The RPEC found that the raw quinquennial death rates werequite similar both ways. Appendix B shows the effect of the auto manufacturers data.
Some data were submitted with ages based on attained age rather than nearest age on respectivevaluation dates. These data were adjusted to an age nearest birthday basis by assigning one-half of theexposures and deaths to the age shown and one-half of exposures and deaths to the next age.
Exclusions
The primary reason for excluding data was incomplete information. Data submissions that combined allinactive statuses (healthy retirees, beneficiaries, and/or disability retirees) or combined active employees
with one or more inactive statuses were excluded. Data submitted in 5-year groups rather than singleages were also excluded. Data with unknown participant status were excluded.
One plan was excluded because the measurement period for the deaths did not match the measurementperiod for the corresponding valuation cells of exposure. In other words, deaths reported by that planincluded persons who were not in the exposure at the beginning of the year or who were included in theexposure at the end of the year of death.
Records of retirees under age 28 and active employees under age 16 were excluded from the database.
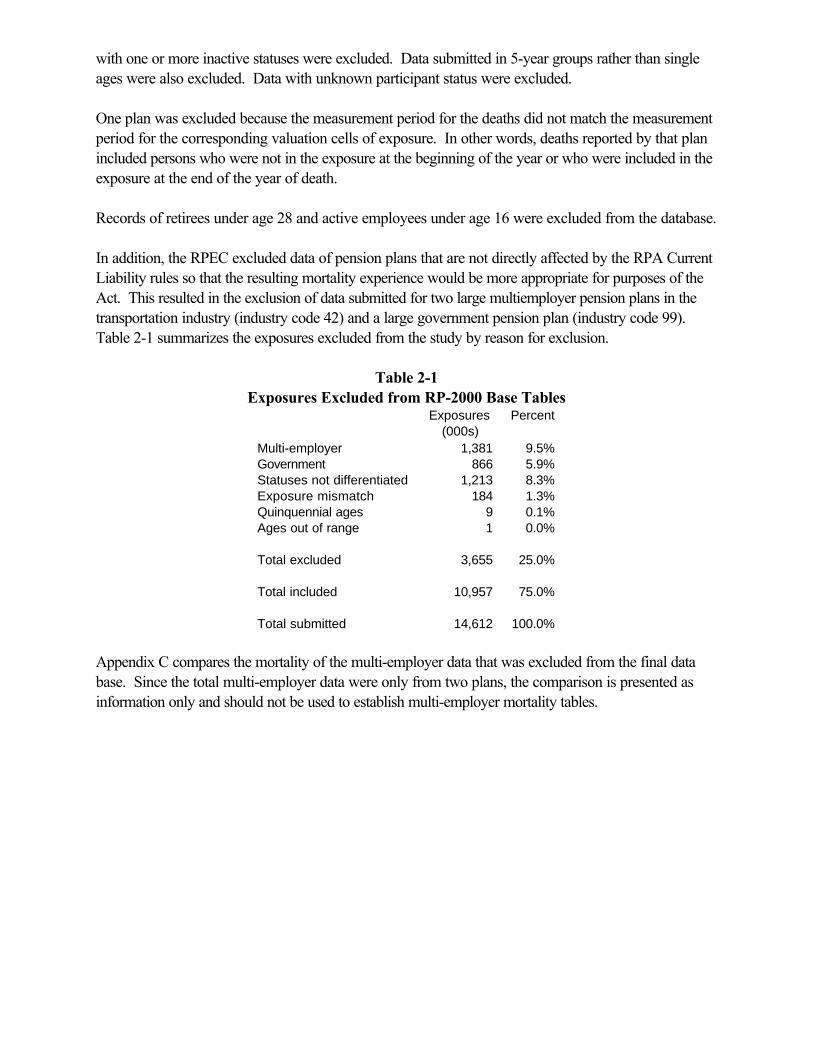
In addition, the RPEC excluded data of pension plans that are not directly affected by the RPA CurrentLiability rules so that the resulting mortality experience would be more appropriate for purposes of theAct. This resulted in the exclusion of data submitted for two large multiemployer pension plans in thetransportation industry (industry code 42) and a large government pension plan (industry code 99).Table 2-1 summarizes the exposures excluded from the study by reason for exclusion.
Table 2-1Exposures Excluded from RP-2000 Base Tables
Exposures(000s)
Percent
Multi-employer 1,381 9.5%Government 866 5.9%Statuses not differentiated 1,213 8.3%Exposure mismatch 184 1.3%Quinquennial ages 9 0.1%Ages out of range 1 0.0%
Total excluded 3,655 25.0%
Total included 10,957 75.0%
Total submitted 14,612 100.0%
Appendix C compares the mortality of the multi-employer data that was excluded from the final database. Since the total multi-employer data were only from two plans, the comparison is presented asinformation only and should not be used to establish multi-employer mortality tables.
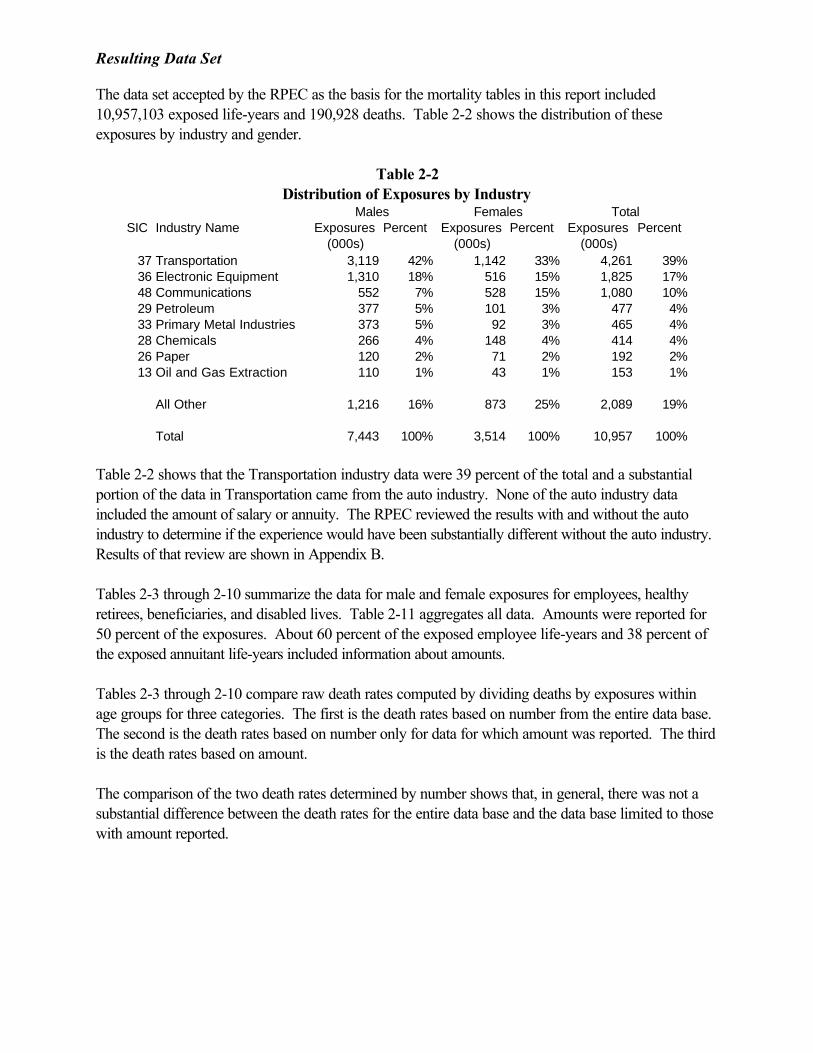
Resulting Data Set
The data set accepted by the RPEC as the basis for the mortality tables in this report included10,957,103 exposed life-years and 190,928 deaths. Table 2-2 shows the distribution of theseexposures by industry and gender.
Table 2-2Distribution of Exposures by Industry
Males Females TotalSIC Industry Name Exposures
(000s)Percent Exposures
(000s)Percent Exposures
(000s)Percent
37 Transportation 3,119 42% 1,142 33% 4,261 39%36 Electronic Equipment 1,310 18% 516 15% 1,825 17%48 Communications 552 7% 528 15% 1,080 10%29 Petroleum 377 5% 101 3% 477 4%33 Primary Metal Industries 373 5% 92 3% 465 4%28 Chemicals 266 4% 148 4% 414 4%26 Paper 120 2% 71 2% 192 2%13 Oil and Gas Extraction 110 1% 43 1% 153 1%
All Other 1,216 16% 873 25% 2,089 19%
Total 7,443 100% 3,514 100% 10,957 100%
Table 2-2 shows that the Transportation industry data were 39 percent of the total and a substantialportion of the data in Transportation came from the auto industry. None of the auto industry dataincluded the amount of salary or annuity. The RPEC reviewed the results with and without the autoindustry to determine if the experience would have been substantially different without the auto industry.Results of that review are shown in Appendix B.
Tables 2-3 through 2-10 summarize the data for male and female exposures for employees, healthyretirees, beneficiaries, and disabled lives. Table 2-11 aggregates all data. Amounts were reported for50 percent of the exposures. About 60 percent of the exposed employee life-years and 38 percent ofthe exposed annuitant life-years included information about amounts.
Tables 2-3 through 2-10 compare raw death rates computed by dividing deaths by exposures withinage groups for three categories. The first is the death rates based on number from the entire data base.The second is the death rates based on number only for data for which amount was reported. The thirdis the death rates based on amount.
The comparison of the two death rates determined by number shows that, in general, there was not asubstantial difference between the death rates for the entire data base and the data base limited to thosewith amount reported.
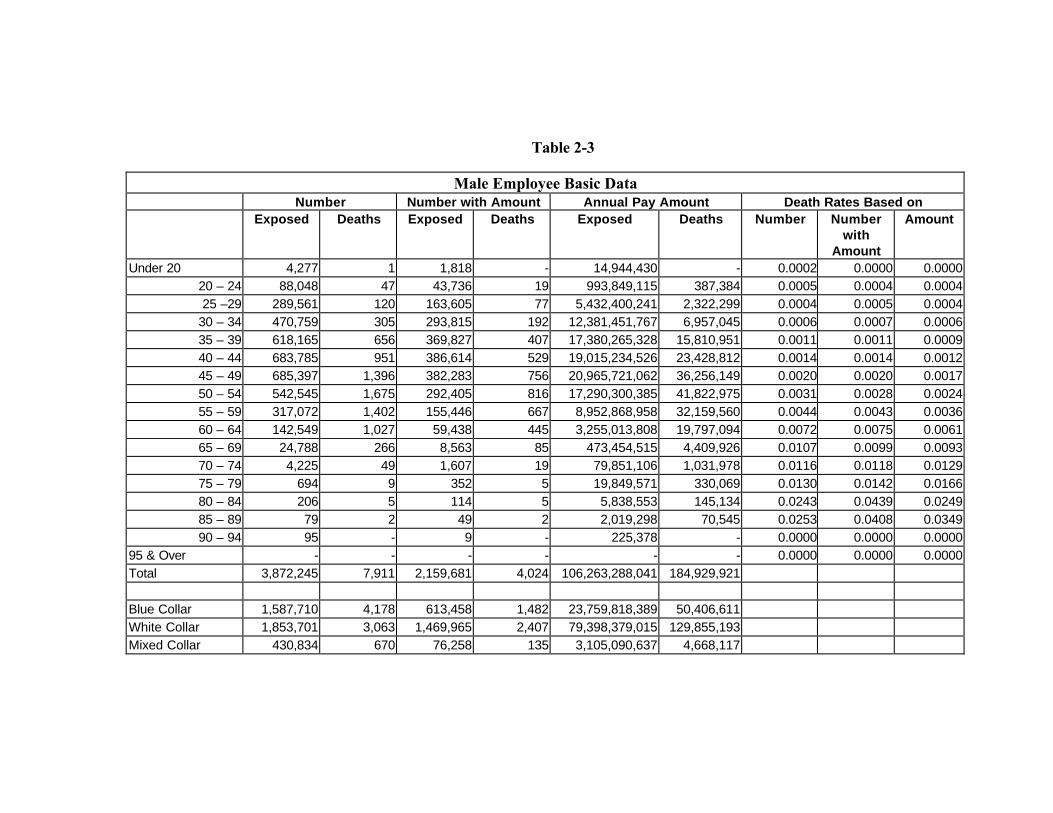
Table 2-3
Male Employee Basic DataNumber Number with Amount Annual Pay Amount Death Rates Based on
Exposed Deaths Exposed Deaths Exposed Deaths Number Numberwith
Amount
Amount
Under 20 4,277 1 1,818 - 14,944,430 - 0.0002 0.0000 0.000020 – 24 88,048 47 43,736 19 993,849,115 387,384 0.0005 0.0004 0.000425 –29 289,561 120 163,605 77 5,432,400,241 2,322,299 0.0004 0.0005 0.0004
30 – 34 470,759 305 293,815 192 12,381,451,767 6,957,045 0.0006 0.0007 0.000635 – 39 618,165 656 369,827 407 17,380,265,328 15,810,951 0.0011 0.0011 0.000940 – 44 683,785 951 386,614 529 19,015,234,526 23,428,812 0.0014 0.0014 0.001245 – 49 685,397 1,396 382,283 756 20,965,721,062 36,256,149 0.0020 0.0020 0.001750 – 54 542,545 1,675 292,405 816 17,290,300,385 41,822,975 0.0031 0.0028 0.002455 – 59 317,072 1,402 155,446 667 8,952,868,958 32,159,560 0.0044 0.0043 0.003660 – 64 142,549 1,027 59,438 445 3,255,013,808 19,797,094 0.0072 0.0075 0.006165 – 69 24,788 266 8,563 85 473,454,515 4,409,926 0.0107 0.0099 0.009370 – 74 4,225 49 1,607 19 79,851,106 1,031,978 0.0116 0.0118 0.012975 – 79 694 9 352 5 19,849,571 330,069 0.0130 0.0142 0.016680 – 84 206 5 114 5 5,838,553 145,134 0.0243 0.0439 0.024985 – 89 79 2 49 2 2,019,298 70,545 0.0253 0.0408 0.034990 – 94 95 - 9 - 225,378 - 0.0000 0.0000 0.0000
95 & Over - - - - - - 0.0000 0.0000 0.0000Total 3,872,245 7,911 2,159,681 4,024 106,263,288,041 184,929,921
Blue Collar 1,587,710 4,178 613,458 1,482 23,759,818,389 50,406,611White Collar 1,853,701 3,063 1,469,965 2,407 79,398,379,015 129,855,193Mixed Collar 430,834 670 76,258 135 3,105,090,637 4,668,117
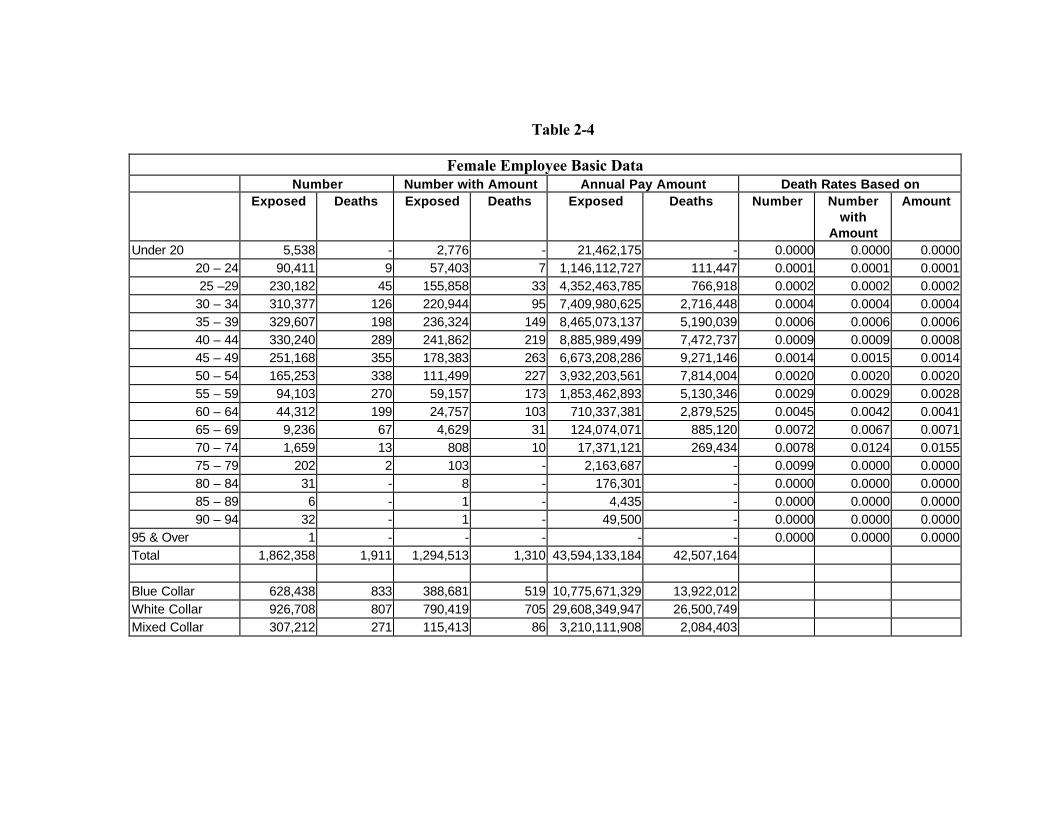
Table 2-4
Female Employee Basic DataNumber Number with Amount Annual Pay Amount Death Rates Based on
Exposed Deaths Exposed Deaths Exposed Deaths Number Numberwith
Amount
Amount
Under 20 5,538 - 2,776 - 21,462,175 - 0.0000 0.0000 0.000020 – 24 90,411 9 57,403 7 1,146,112,727 111,447 0.0001 0.0001 0.000125 –29 230,182 45 155,858 33 4,352,463,785 766,918 0.0002 0.0002 0.0002
30 – 34 310,377 126 220,944 95 7,409,980,625 2,716,448 0.0004 0.0004 0.000435 – 39 329,607 198 236,324 149 8,465,073,137 5,190,039 0.0006 0.0006 0.000640 – 44 330,240 289 241,862 219 8,885,989,499 7,472,737 0.0009 0.0009 0.000845 – 49 251,168 355 178,383 263 6,673,208,286 9,271,146 0.0014 0.0015 0.001450 – 54 165,253 338 111,499 227 3,932,203,561 7,814,004 0.0020 0.0020 0.002055 – 59 94,103 270 59,157 173 1,853,462,893 5,130,346 0.0029 0.0029 0.002860 – 64 44,312 199 24,757 103 710,337,381 2,879,525 0.0045 0.0042 0.004165 – 69 9,236 67 4,629 31 124,074,071 885,120 0.0072 0.0067 0.007170 – 74 1,659 13 808 10 17,371,121 269,434 0.0078 0.0124 0.015575 – 79 202 2 103 - 2,163,687 - 0.0099 0.0000 0.000080 – 84 31 - 8 - 176,301 - 0.0000 0.0000 0.000085 – 89 6 - 1 - 4,435 - 0.0000 0.0000 0.000090 – 94 32 - 1 - 49,500 - 0.0000 0.0000 0.0000
95 & Over 1 - - - - - 0.0000 0.0000 0.0000Total 1,862,358 1,911 1,294,513 1,310 43,594,133,184 42,507,164
Blue Collar 628,438 833 388,681 519 10,775,671,329 13,922,012White Collar 926,708 807 790,419 705 29,608,349,947 26,500,749Mixed Collar 307,212 271 115,413 86 3,210,111,908 2,084,403
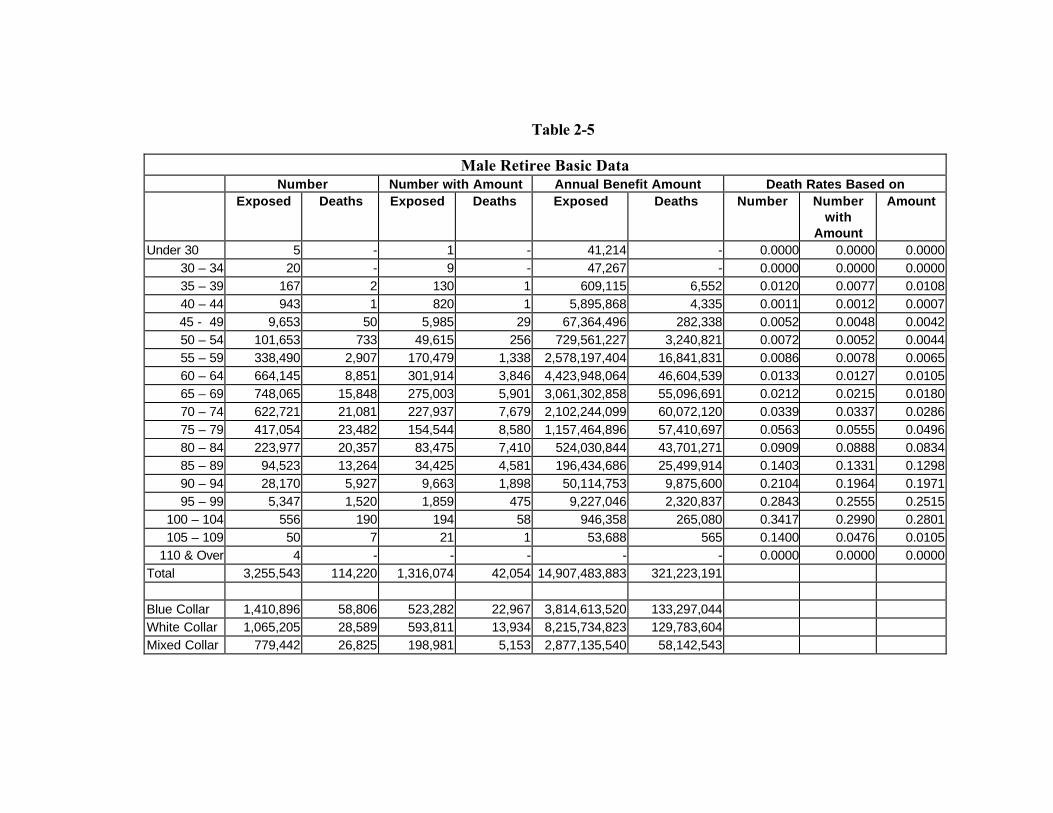
Table 2-5
Male Retiree Basic DataNumber Number with Amount Annual Benefit Amount Death Rates Based on
Exposed Deaths Exposed Deaths Exposed Deaths Number Numberwith
Amount
Amount
Under 30 5 - 1 - 41,214 - 0.0000 0.0000 0.000030 – 34 20 - 9 - 47,267 - 0.0000 0.0000 0.000035 – 39 167 2 130 1 609,115 6,552 0.0120 0.0077 0.010840 – 44 943 1 820 1 5,895,868 4,335 0.0011 0.0012 0.000745 - 49 9,653 50 5,985 29 67,364,496 282,338 0.0052 0.0048 0.004250 – 54 101,653 733 49,615 256 729,561,227 3,240,821 0.0072 0.0052 0.004455 – 59 338,490 2,907 170,479 1,338 2,578,197,404 16,841,831 0.0086 0.0078 0.006560 – 64 664,145 8,851 301,914 3,846 4,423,948,064 46,604,539 0.0133 0.0127 0.010565 – 69 748,065 15,848 275,003 5,901 3,061,302,858 55,096,691 0.0212 0.0215 0.018070 – 74 622,721 21,081 227,937 7,679 2,102,244,099 60,072,120 0.0339 0.0337 0.028675 – 79 417,054 23,482 154,544 8,580 1,157,464,896 57,410,697 0.0563 0.0555 0.049680 – 84 223,977 20,357 83,475 7,410 524,030,844 43,701,271 0.0909 0.0888 0.083485 – 89 94,523 13,264 34,425 4,581 196,434,686 25,499,914 0.1403 0.1331 0.129890 – 94 28,170 5,927 9,663 1,898 50,114,753 9,875,600 0.2104 0.1964 0.197195 – 99 5,347 1,520 1,859 475 9,227,046 2,320,837 0.2843 0.2555 0.2515
100 – 104 556 190 194 58 946,358 265,080 0.3417 0.2990 0.2801105 – 109 50 7 21 1 53,688 565 0.1400 0.0476 0.0105
110 & Over 4 - - - - - 0.0000 0.0000 0.0000Total 3,255,543 114,220 1,316,074 42,054 14,907,483,883 321,223,191
Blue Collar 1,410,896 58,806 523,282 22,967 3,814,613,520 133,297,044White Collar 1,065,205 28,589 593,811 13,934 8,215,734,823 129,783,604Mixed Collar 779,442 26,825 198,981 5,153 2,877,135,540 58,142,543
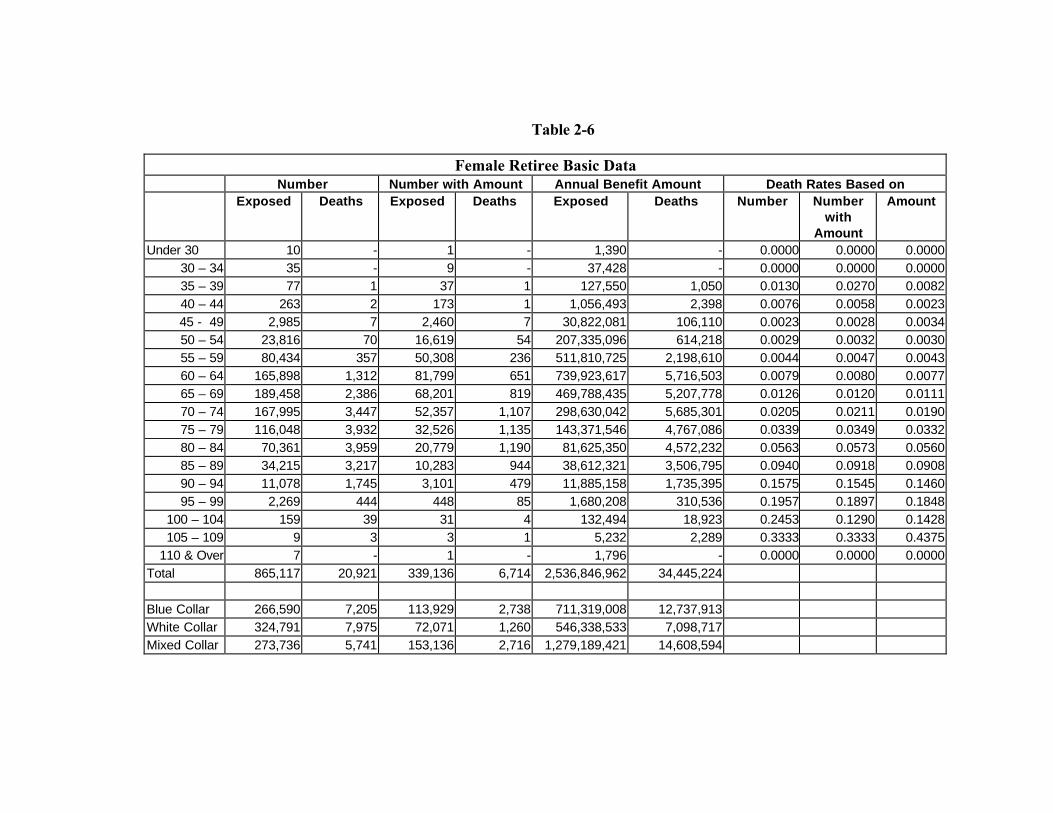
Table 2-6
Female Retiree Basic DataNumber Number with Amount Annual Benefit Amount Death Rates Based on
Exposed Deaths Exposed Deaths Exposed Deaths Number Numberwith
Amount
Amount
Under 30 10 - 1 - 1,390 - 0.0000 0.0000 0.000030 – 34 35 - 9 - 37,428 - 0.0000 0.0000 0.000035 – 39 77 1 37 1 127,550 1,050 0.0130 0.0270 0.008240 – 44 263 2 173 1 1,056,493 2,398 0.0076 0.0058 0.002345 - 49 2,985 7 2,460 7 30,822,081 106,110 0.0023 0.0028 0.003450 – 54 23,816 70 16,619 54 207,335,096 614,218 0.0029 0.0032 0.003055 – 59 80,434 357 50,308 236 511,810,725 2,198,610 0.0044 0.0047 0.004360 – 64 165,898 1,312 81,799 651 739,923,617 5,716,503 0.0079 0.0080 0.007765 – 69 189,458 2,386 68,201 819 469,788,435 5,207,778 0.0126 0.0120 0.011170 – 74 167,995 3,447 52,357 1,107 298,630,042 5,685,301 0.0205 0.0211 0.019075 – 79 116,048 3,932 32,526 1,135 143,371,546 4,767,086 0.0339 0.0349 0.033280 – 84 70,361 3,959 20,779 1,190 81,625,350 4,572,232 0.0563 0.0573 0.056085 – 89 34,215 3,217 10,283 944 38,612,321 3,506,795 0.0940 0.0918 0.090890 – 94 11,078 1,745 3,101 479 11,885,158 1,735,395 0.1575 0.1545 0.146095 – 99 2,269 444 448 85 1,680,208 310,536 0.1957 0.1897 0.1848
100 – 104 159 39 31 4 132,494 18,923 0.2453 0.1290 0.1428105 – 109 9 3 3 1 5,232 2,289 0.3333 0.3333 0.4375
110 & Over 7 - 1 - 1,796 - 0.0000 0.0000 0.0000Total 865,117 20,921 339,136 6,714 2,536,846,962 34,445,224
Blue Collar 266,590 7,205 113,929 2,738 711,319,008 12,737,913White Collar 324,791 7,975 72,071 1,260 546,338,533 7,098,717Mixed Collar 273,736 5,741 153,136 2,716 1,279,189,421 14,608,594
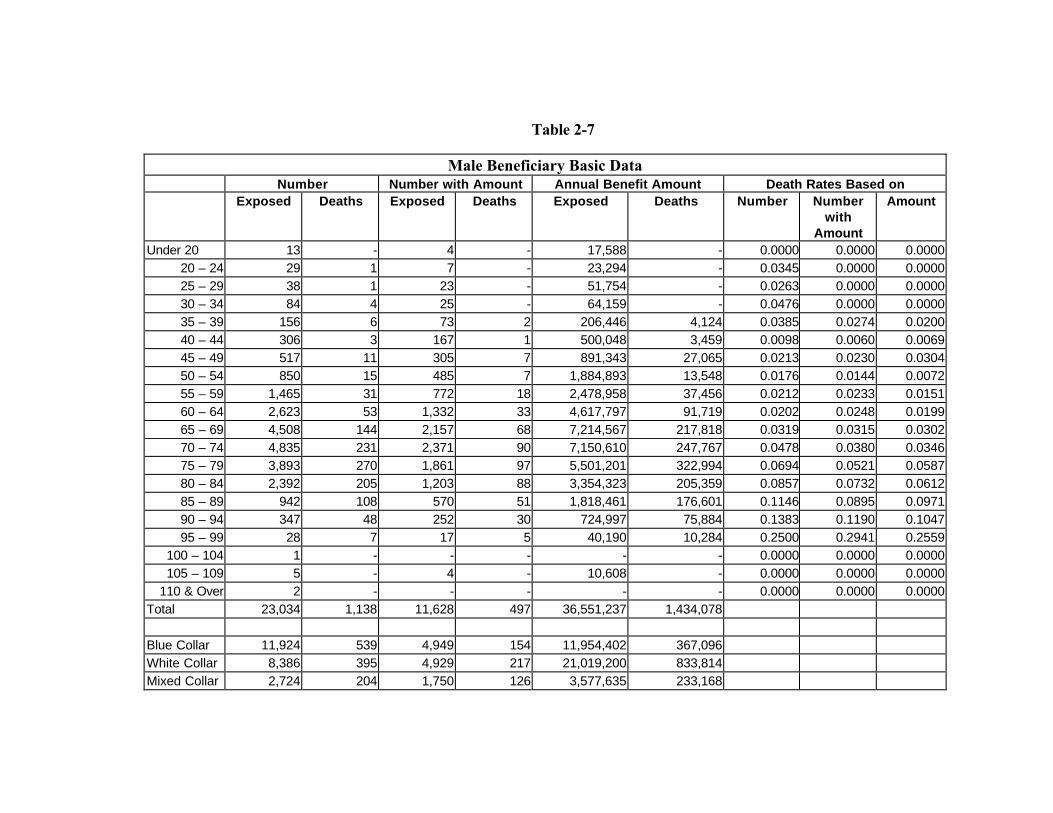
Table 2-7
Male Beneficiary Basic DataNumber Number with Amount Annual Benefit Amount Death Rates Based on
Exposed Deaths Exposed Deaths Exposed Deaths Number Numberwith
Amount
Amount
Under 20 13 - 4 - 17,588 - 0.0000 0.0000 0.000020 – 24 29 1 7 - 23,294 - 0.0345 0.0000 0.000025 – 29 38 1 23 - 51,754 - 0.0263 0.0000 0.000030 – 34 84 4 25 - 64,159 - 0.0476 0.0000 0.000035 – 39 156 6 73 2 206,446 4,124 0.0385 0.0274 0.020040 – 44 306 3 167 1 500,048 3,459 0.0098 0.0060 0.006945 – 49 517 11 305 7 891,343 27,065 0.0213 0.0230 0.030450 – 54 850 15 485 7 1,884,893 13,548 0.0176 0.0144 0.007255 – 59 1,465 31 772 18 2,478,958 37,456 0.0212 0.0233 0.015160 – 64 2,623 53 1,332 33 4,617,797 91,719 0.0202 0.0248 0.019965 – 69 4,508 144 2,157 68 7,214,567 217,818 0.0319 0.0315 0.030270 – 74 4,835 231 2,371 90 7,150,610 247,767 0.0478 0.0380 0.034675 – 79 3,893 270 1,861 97 5,501,201 322,994 0.0694 0.0521 0.058780 – 84 2,392 205 1,203 88 3,354,323 205,359 0.0857 0.0732 0.061285 – 89 942 108 570 51 1,818,461 176,601 0.1146 0.0895 0.097190 – 94 347 48 252 30 724,997 75,884 0.1383 0.1190 0.104795 – 99 28 7 17 5 40,190 10,284 0.2500 0.2941 0.2559
100 – 104 1 - - - - - 0.0000 0.0000 0.0000105 – 109 5 - 4 - 10,608 - 0.0000 0.0000 0.0000
110 & Over 2 - - - - - 0.0000 0.0000 0.0000Total 23,034 1,138 11,628 497 36,551,237 1,434,078
Blue Collar 11,924 539 4,949 154 11,954,402 367,096White Collar 8,386 395 4,929 217 21,019,200 833,814Mixed Collar 2,724 204 1,750 126 3,577,635 233,168
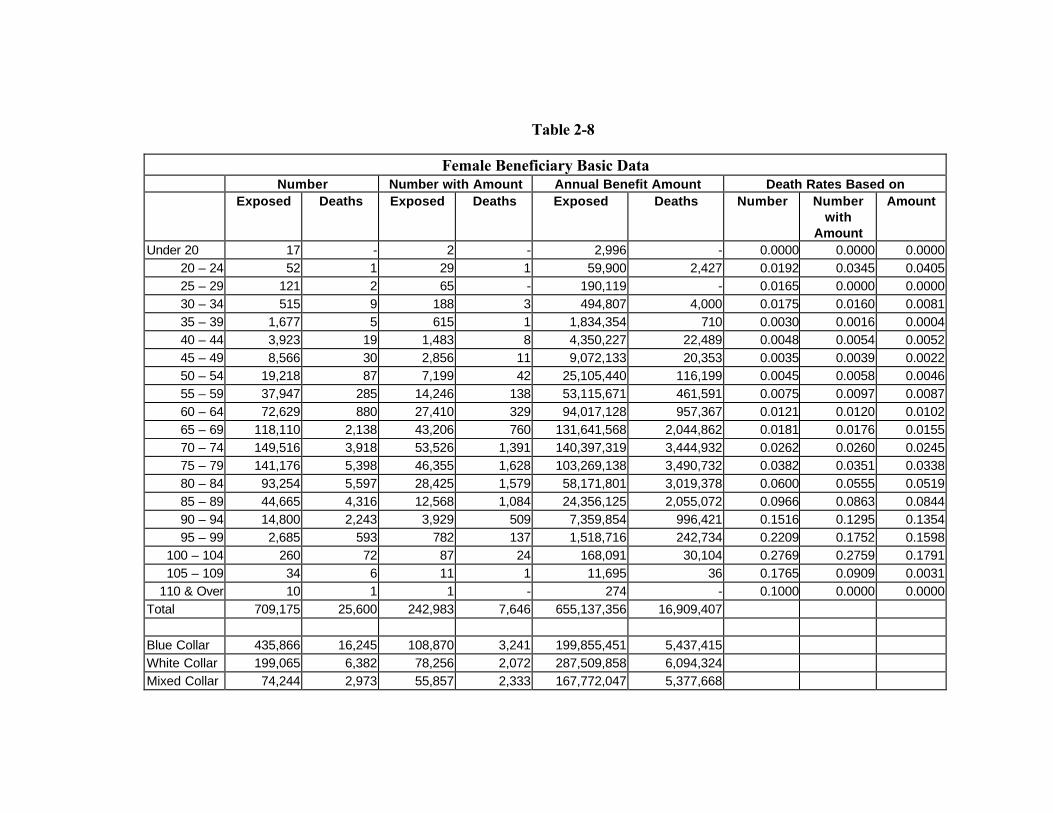
Table 2-8
Female Beneficiary Basic DataNumber Number with Amount Annual Benefit Amount Death Rates Based on
Exposed Deaths Exposed Deaths Exposed Deaths Number Numberwith
Amount
Amount
Under 20 17 - 2 - 2,996 - 0.0000 0.0000 0.000020 – 24 52 1 29 1 59,900 2,427 0.0192 0.0345 0.040525 – 29 121 2 65 - 190,119 - 0.0165 0.0000 0.000030 – 34 515 9 188 3 494,807 4,000 0.0175 0.0160 0.008135 – 39 1,677 5 615 1 1,834,354 710 0.0030 0.0016 0.000440 – 44 3,923 19 1,483 8 4,350,227 22,489 0.0048 0.0054 0.005245 – 49 8,566 30 2,856 11 9,072,133 20,353 0.0035 0.0039 0.002250 – 54 19,218 87 7,199 42 25,105,440 116,199 0.0045 0.0058 0.004655 – 59 37,947 285 14,246 138 53,115,671 461,591 0.0075 0.0097 0.008760 – 64 72,629 880 27,410 329 94,017,128 957,367 0.0121 0.0120 0.010265 – 69 118,110 2,138 43,206 760 131,641,568 2,044,862 0.0181 0.0176 0.015570 – 74 149,516 3,918 53,526 1,391 140,397,319 3,444,932 0.0262 0.0260 0.024575 – 79 141,176 5,398 46,355 1,628 103,269,138 3,490,732 0.0382 0.0351 0.033880 – 84 93,254 5,597 28,425 1,579 58,171,801 3,019,378 0.0600 0.0555 0.051985 – 89 44,665 4,316 12,568 1,084 24,356,125 2,055,072 0.0966 0.0863 0.084490 – 94 14,800 2,243 3,929 509 7,359,854 996,421 0.1516 0.1295 0.135495 – 99 2,685 593 782 137 1,518,716 242,734 0.2209 0.1752 0.1598
100 – 104 260 72 87 24 168,091 30,104 0.2769 0.2759 0.1791105 – 109 34 6 11 1 11,695 36 0.1765 0.0909 0.0031
110 & Over 10 1 1 - 274 - 0.1000 0.0000 0.0000Total 709,175 25,600 242,983 7,646 655,137,356 16,909,407
Blue Collar 435,866 16,245 108,870 3,241 199,855,451 5,437,415White Collar 199,065 6,382 78,256 2,072 287,509,858 6,094,324Mixed Collar 74,244 2,973 55,857 2,333 167,772,047 5,377,668
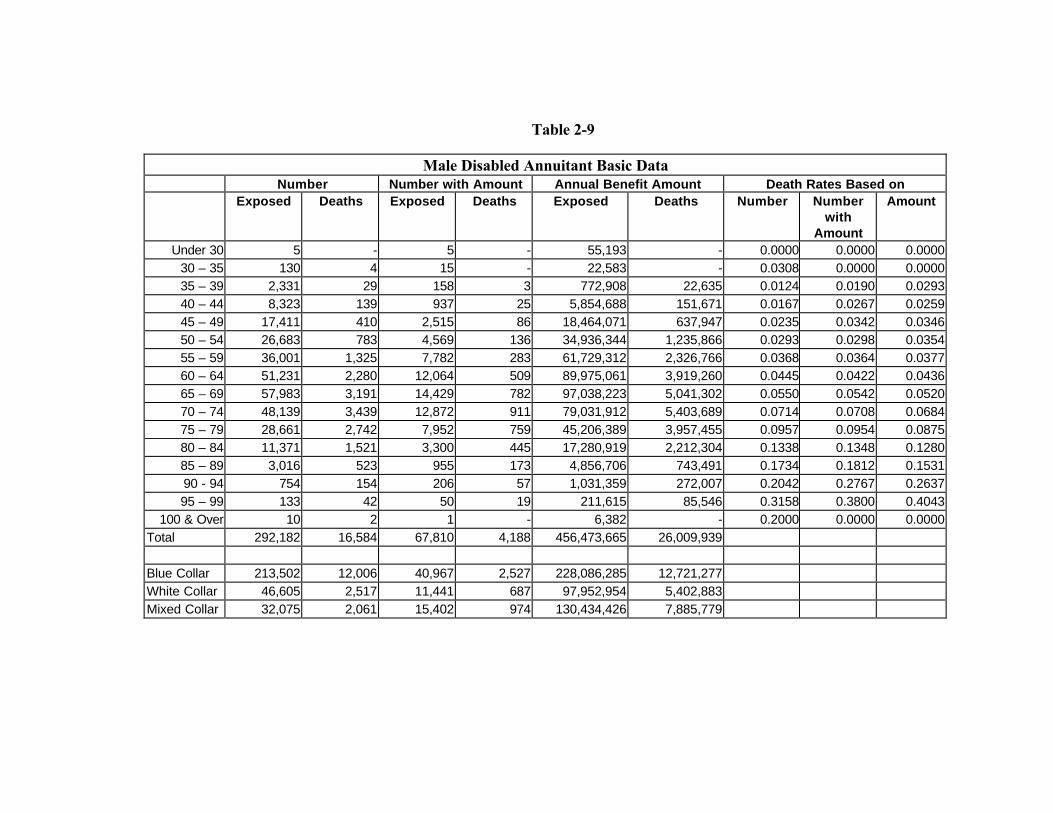
Table 2-9
Male Disabled Annuitant Basic DataNumber Number with Amount Annual Benefit Amount Death Rates Based on
Exposed Deaths Exposed Deaths Exposed Deaths Number Numberwith
Amount
Amount
Under 30 5 - 5 - 55,193 - 0.0000 0.0000 0.000030 – 35 130 4 15 - 22,583 - 0.0308 0.0000 0.000035 – 39 2,331 29 158 3 772,908 22,635 0.0124 0.0190 0.029340 – 44 8,323 139 937 25 5,854,688 151,671 0.0167 0.0267 0.025945 – 49 17,411 410 2,515 86 18,464,071 637,947 0.0235 0.0342 0.034650 – 54 26,683 783 4,569 136 34,936,344 1,235,866 0.0293 0.0298 0.035455 – 59 36,001 1,325 7,782 283 61,729,312 2,326,766 0.0368 0.0364 0.037760 – 64 51,231 2,280 12,064 509 89,975,061 3,919,260 0.0445 0.0422 0.043665 – 69 57,983 3,191 14,429 782 97,038,223 5,041,302 0.0550 0.0542 0.052070 – 74 48,139 3,439 12,872 911 79,031,912 5,403,689 0.0714 0.0708 0.068475 – 79 28,661 2,742 7,952 759 45,206,389 3,957,455 0.0957 0.0954 0.087580 – 84 11,371 1,521 3,300 445 17,280,919 2,212,304 0.1338 0.1348 0.128085 – 89 3,016 523 955 173 4,856,706 743,491 0.1734 0.1812 0.153190 - 94 754 154 206 57 1,031,359 272,007 0.2042 0.2767 0.263795 – 99 133 42 50 19 211,615 85,546 0.3158 0.3800 0.4043
100 & Over 10 2 1 - 6,382 - 0.2000 0.0000 0.0000Total 292,182 16,584 67,810 4,188 456,473,665 26,009,939
Blue Collar 213,502 12,006 40,967 2,527 228,086,285 12,721,277White Collar 46,605 2,517 11,441 687 97,952,954 5,402,883Mixed Collar 32,075 2,061 15,402 974 130,434,426 7,885,779
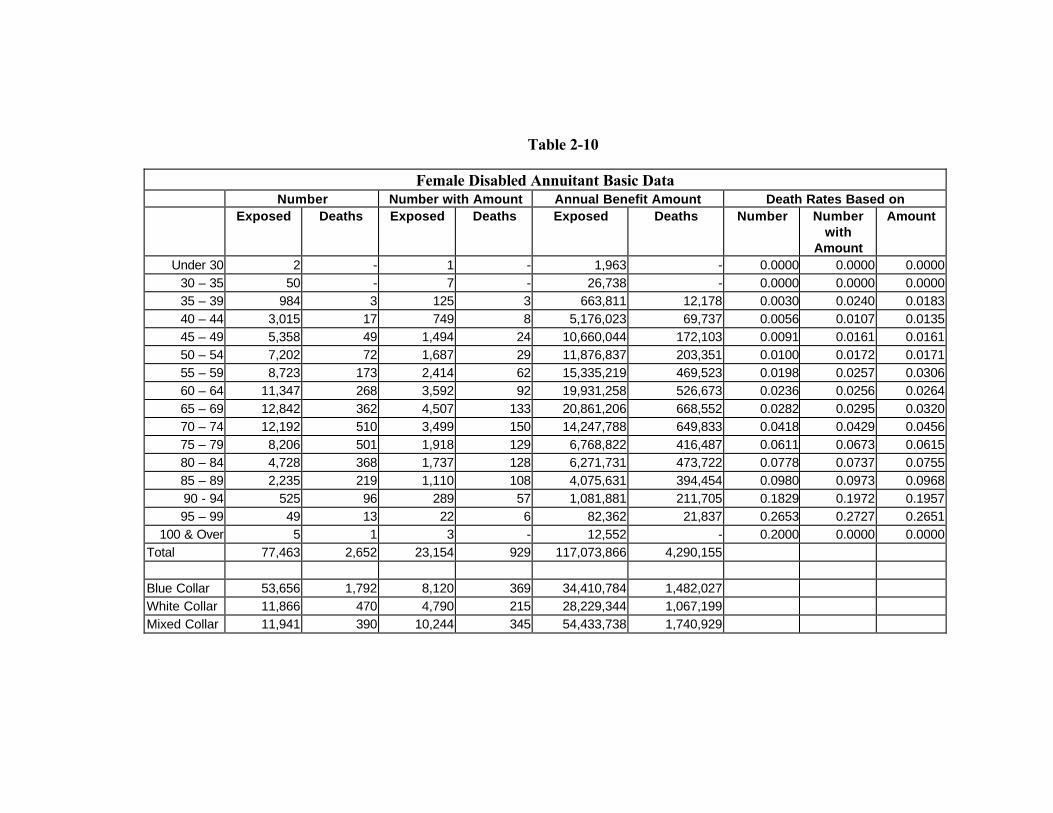
Table 2-10
Female Disabled Annuitant Basic DataNumber Number with Amount Annual Benefit Amount Death Rates Based on
Exposed Deaths Exposed Deaths Exposed Deaths Number Numberwith
Amount
Amount
Under 30 2 - 1 - 1,963 - 0.0000 0.0000 0.000030 – 35 50 - 7 - 26,738 - 0.0000 0.0000 0.000035 – 39 984 3 125 3 663,811 12,178 0.0030 0.0240 0.018340 – 44 3,015 17 749 8 5,176,023 69,737 0.0056 0.0107 0.013545 – 49 5,358 49 1,494 24 10,660,044 172,103 0.0091 0.0161 0.016150 – 54 7,202 72 1,687 29 11,876,837 203,351 0.0100 0.0172 0.017155 – 59 8,723 173 2,414 62 15,335,219 469,523 0.0198 0.0257 0.030660 – 64 11,347 268 3,592 92 19,931,258 526,673 0.0236 0.0256 0.026465 – 69 12,842 362 4,507 133 20,861,206 668,552 0.0282 0.0295 0.032070 – 74 12,192 510 3,499 150 14,247,788 649,833 0.0418 0.0429 0.045675 – 79 8,206 501 1,918 129 6,768,822 416,487 0.0611 0.0673 0.061580 – 84 4,728 368 1,737 128 6,271,731 473,722 0.0778 0.0737 0.075585 – 89 2,235 219 1,110 108 4,075,631 394,454 0.0980 0.0973 0.096890 - 94 525 96 289 57 1,081,881 211,705 0.1829 0.1972 0.195795 – 99 49 13 22 6 82,362 21,837 0.2653 0.2727 0.2651
100 & Over 5 1 3 - 12,552 - 0.2000 0.0000 0.0000Total 77,463 2,652 23,154 929 117,073,866 4,290,155
Blue Collar 53,656 1,792 8,120 369 34,410,784 1,482,027White Collar 11,866 470 4,790 215 28,229,344 1,067,199Mixed Collar 11,941 390 10,244 345 54,433,738 1,740,929
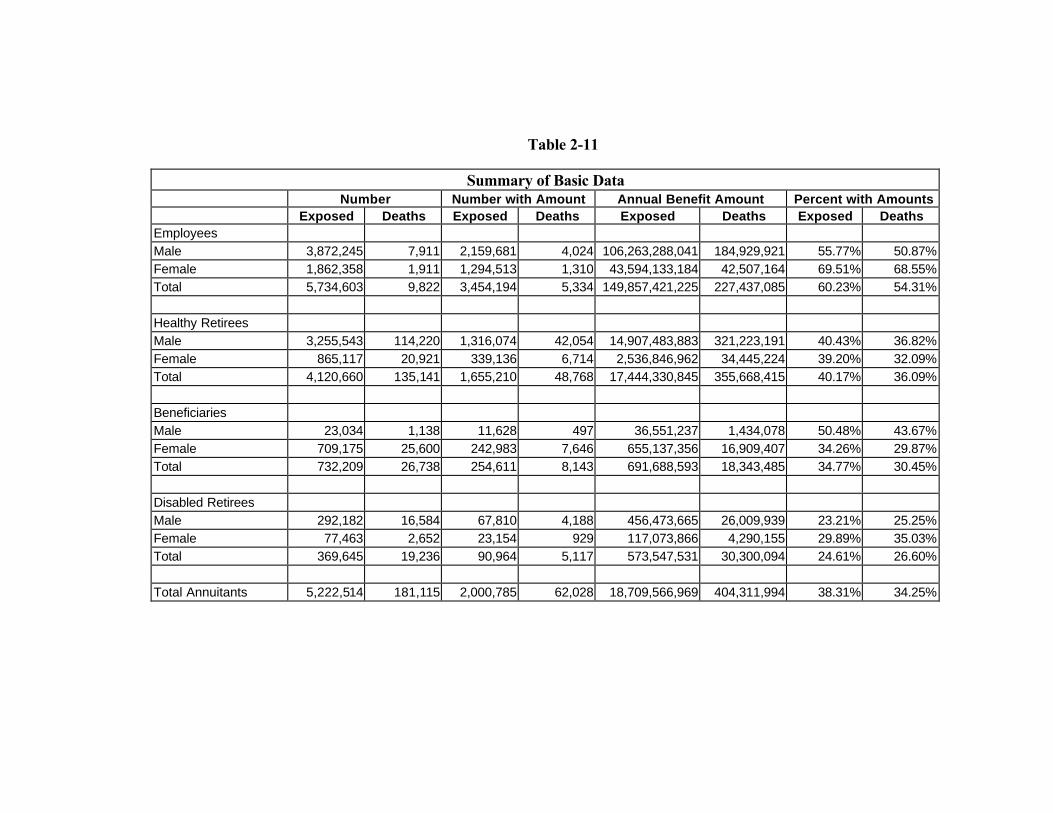
Table 2-11
Summary of Basic DataNumber Number with Amount Annual Benefit Amount Percent with Amounts
Exposed Deaths Exposed Deaths Exposed Deaths Exposed DeathsEmployeesMale 3,872,245 7,911 2,159,681 4,024 106,263,288,041 184,929,921 55.77% 50.87%Female 1,862,358 1,911 1,294,513 1,310 43,594,133,184 42,507,164 69.51% 68.55%Total 5,734,603 9,822 3,454,194 5,334 149,857,421,225 227,437,085 60.23% 54.31%
Healthy RetireesMale 3,255,543 114,220 1,316,074 42,054 14,907,483,883 321,223,191 40.43% 36.82%Female 865,117 20,921 339,136 6,714 2,536,846,962 34,445,224 39.20% 32.09%Total 4,120,660 135,141 1,655,210 48,768 17,444,330,845 355,668,415 40.17% 36.09%
BeneficiariesMale 23,034 1,138 11,628 497 36,551,237 1,434,078 50.48% 43.67%Female 709,175 25,600 242,983 7,646 655,137,356 16,909,407 34.26% 29.87%Total 732,209 26,738 254,611 8,143 691,688,593 18,343,485 34.77% 30.45%
Disabled RetireesMale 292,182 16,584 67,810 4,188 456,473,665 26,009,939 23.21% 25.25%Female 77,463 2,652 23,154 929 117,073,866 4,290,155 29.89% 35.03%Total 369,645 19,236 90,964 5,117 573,547,531 30,300,094 24.61% 26.60%
Total Annuitants 5,222,514 181,115 2,000,785 62,028 18,709,566,969 404,311,994 38.31% 34.25%

Chapter 3 - Construction of Basic Table
Selection and Production of Basic Tables
The primary tables produced by the RPEC are the following gender distinct tables:
EmployeesHealthy Annuitants (healthy retirees and beneficiaries combined)Disabled Retirees
The RPEC elected to publish separate tables for healthy annuitants and employees because thedata for ages with substantial experience from both data sets indicated that mortality issignificantly lower for employees than for healthy annuitants. The RPEC found that there was asignificant difference between the mortality for female beneficiaries and healthy female retirees.However, the RPEC decided that there was not enough data on male beneficiaries to determinemale beneficiary mortality rates. While separate tables could have been produced for femaleretirees and beneficiaries, the RPEC believes that the practicing actuary need not use distincttables for these groups.
For the purpose of calculating Current Liabilities, RR 96-7 mandates the use of the samemortality table for healthy annuitants and disabled annuitants when Social Security disabilitystatus is unknown and the disabilities occurred after 1994. This precludes the use of separatemortality tables for disabled annuitants in that case. The data contributors for this study did notprovide information on the subgroup of disabled retirees who were also receiving SocialSecurity benefits. Therefore, the RP-2000 mortality table for disabled annuitants presented inthis report is not appropriate to predict the mortality of either of the post-1994 disabledsubgroups specified in RR 96-7 but it may be appropriate for mortality of those disabled before1995. However, using the RP-2000 mortality table for healthy annuitants may overstate planliabilities if used to value benefits for both healthy and disabled annuitants.
The tables were produced through the following steps, described in this chapter:
• The raw qxs were determined based on lives
• Amount-adjusted qxs were determined by applying amount adjustment factors
• Healthy retiree and beneficiary rates were blended to produce healthy annuitantrates
• The amount-adjusted qxs were graduated

• Tables were extended to extreme ages
Selection of Graduation Methods
Selection of an appropriate graduation method is critical to the production of an actuarialmortality table. In this case, as for previous published tables, the final rates were graduated toproduce a set of rates that change continuously to reflect underlying mortality patterns.Graduation was also used to determine the amount-adjusted qxs.
The selection of a graduation method involves a compromise between smoothness and fit. Thetask of the RPEC was to use methods that produced reasonably smooth tables but did notmask major underlying characteristics of mortality. For instance, the use of a Gompertz orMakeham formula creates very smooth rates but masks the deceleration of mortality increasesat the very old ages.
The two methods used by the actuarial profession in the United States have been Whittaker-Henderson Type B and Karup-King. Whittaker-Henderson Type B is more precise for largebodies of data. Since the data set was very large, the RPEC decided to use the Whittaker-Henderson Type B graduation method for all graduation purposes. The key parameters for thismethod are the number of differences, and the h value. In particular, higher values of h result ingreater smoothness. [London, Dick. 1985. Graduation: The Revision of Estimates]
Figures 3-1 and 3-2 show the raw amount adjustment factors (ratios of average amount fordeaths to average amount exposed) and two different graduations of the raw rates. Thishighlights the differences between using the “regular” graduation that is often used for finalsmoothing and “heavy” graduation. The heavy graduation (achieved with fewer differences andhigher h values) produces very smooth results but masks some of the key underlying trends. Inthe graph, the regular graduation uses third differences and an h value of 1,000,000. The heavygraduation uses second differences and an h value of 100,000,000.
The RPEC reviewed graduation tables within all of the reasonable ranges of h values anddifferences to select the graduation method most appropriate to each purpose and each set ofdata. Rates for healthy annuitants needed little graduation so the lightest variables wereselected. At the other extreme, since graduation for amount-adjustment purposes was only toestablish a smooth range of relative factors, a much heavier graduation was used.
The RPEC used the following criteria in selection of Whittaker-Henderson variables for the finalgraduation process:
• There should be no or a minimum number of occurrences of qx <0• There should be no or a minimum number of occurrences of qx >1• There should be no or a minimum number of occurrences of qx > qx+1
• Variation between the smoothed qxs and the ungraduated qxs should be minimized
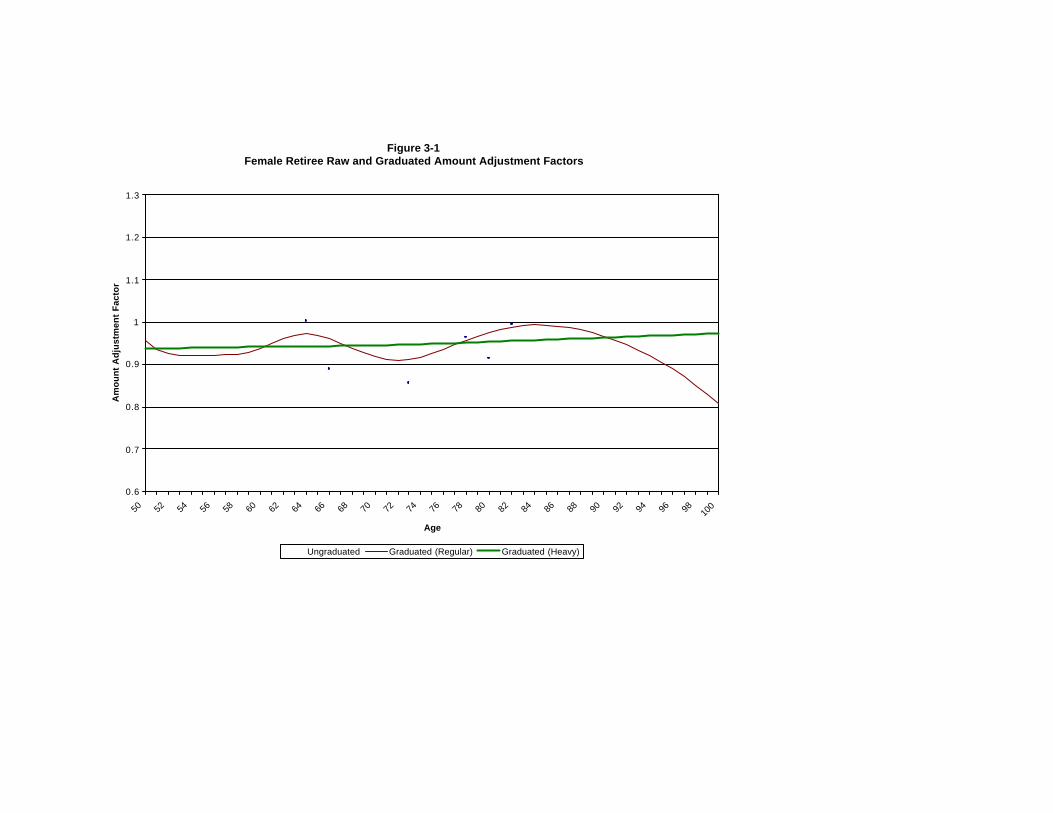
Figure 3-1Female Retiree Raw and Graduated Amount Adjustment Factors
0.6
0.7
0.8
0.9
1
1.1
1.2
1.3
50 52 54 56 58 60 62 64 66 68 70 72 74 76 78 80 82 84 86 88 90 92 94 96 98 100
Age
Am
ou
nt
Ad
just
men
t F
acto
r
Ungraduated Graduated (Regular) Graduated (Heavy)
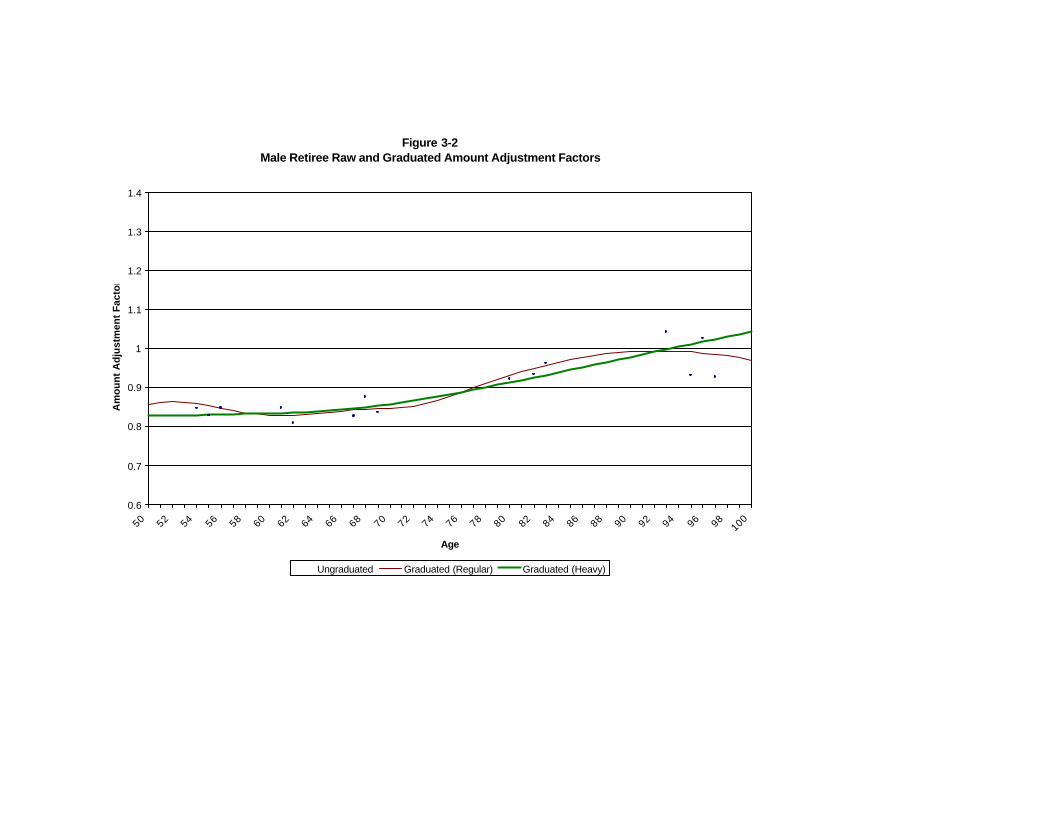
Figure 3-2Male Retiree Raw and Graduated Amount Adjustment Factors
0.6
0.7
0.8
0.9
1
1.1
1.2
1.3
1.4
50 52 54 56 58 60 62 64 66 68 70 72 74 76 78 80 82 84 86 88 90 92 94 96 98100
Age
Am
ount
Adj
ustm
ent
Fact
or
Ungraduated Graduated (Regular) Graduated (Heavy)
Determination of Raw qxs for Lives
For each age the number of deaths was divided by the number of life-years exposed to producethe raw qx value. Separate tables were produced by gender and status.
Amount-adjusted qxs
As with mortality tables for life insurance, the GAM-83, GAR-94, and UP-94 mortality tableswere developed using amounts rather than lives, i.e. they were determined by dividing totalannuity amounts for those who died by total annuity amounts for all exposed by age. Thisapproach is equivalent to liability weighting. Liability-weighted mortality has been the generalpractice in developing mortality tables for the measurement of actuarial liabilities. Life insurancetables, for instance, are developed based on face amount of insurance as the base rather thannumber of individuals. The reason for using liability-weighted measures can be seen through anexample.
Assume that a plan covers two groups of 1,000 annuitants age 65. The members of the firstgroup all have a monthly annuity of $100 and the members of the second group all have amonthly annuity of $1,000. If the true present value of an annuity of $1 per year is 10.0 formembers of the first group and 12.0 for members of the second group (resulting from lowermortality) then the total liability for the plan will be $156 million. A table that was not adjustedfor differences in amount would produce an average present value factor of 11.0, which wouldresult in an estimated liability of $145 million, thereby understating plan liabilities by $11 millionor 7 percent. A liability-weighted present value factor of 11.81 applied to the entire groupwould produce the correct liability of $156 million.
Since the data for previous mortality studies were gathered predominately from group annuitydata supplied by insurance companies, amount data were readily available. The data for thecurrent study presented a new problem. A substantial portion of the submitters supplied onlythe number of lives exposed and the number of deaths and did not supply information onamounts.
As with previous studies, the current data set shows significantly higher mortality based onnumber of lives than based on amount of benefits for retirees or amount of salary for employees.Liabilities for pension plans are automatically weighted by amounts. Therefore, the RPECdecided to determine the mortality rates based on amounts.
The amount of salary was included for 60 percent of the employees but only 54 percent ofemployee deaths. The amount of benefit was included for 38 percent of the annuitants but only34 percent of annuitant deaths. In total, information about amounts was included for 50 percentof participants and 35 percent of deaths.
For the submissions that provided information on amounts, the RPEC determined:

a) Amount-based qxs, which are the total annuity amounts for deaths divided by total annuityamounts exposed, and
b) Life-based qxs, which are numbers of deaths divided by numbers of life-years exposed.

The RPEC assumed that the relationship between (a) and (b) for the subset of submissions thatsupplied information on amounts was representative of the entire data set (including submissionsthat did not provide information on amounts). After a thorough review of the data, the RPECbelieved this assumption to be practical and plausible. Accordingly the RPEC adjusted the datafor submissions which did not provide information on amounts.
The quotient of (a) divided by (b) is the "amount adjustment factor." The amount adjustmentfactor represents the difference of analyzing pension mortality data based on amounts versusanalyzing only the number of deaths and exposures. Amount adjustment factors by age weredetermined separately for employees, healthy retirees, survivors, and disabled lives. For thesubmissions that only supplied the number of deaths and exposures, mortality rates weremultiplied by the amount adjustment factors.
Since there was considerable variation in amount adjustment factors from one age to the next,the RPEC decided to first graduate these factors separately before applying them to the qx
values for lives. The amount adjustment factors were graduated using the Whittaker-Hendersonmethod with second differences and an h value of 100,000,000.
The ungraduated mortality rates based on number of lives were then multiplied by the graduatedamount adjustment factors to produce ungraduated amount-adjusted mortality rates.
Blending of Healthy Retiree and Beneficiary Data
The graduated amount adjustment factors and ungraduated amount-adjusted mortality rateswere determined separately for healthy retirees and beneficiaries. The RPEC decided tocombine the healthy retiree and beneficiary rates into one “healthy annuitant” table. There werenot sufficient data for a separate male beneficiary table but there were sufficient data for aseparate female beneficiary table. However, the RPEC believed that a separate femalebeneficiary table would have added unnecessary complexity to valuations without substantiallyincreasing validity. Appendix D shows the ratios of the graduated mortality rates forbeneficiaries and retirees to the graduated mortality rates for retirees and beneficiariescombined.
The ungraduated amount-adjusted mortality rates for healthy retirees and beneficiariescombined were then determined as a weighted average of the corresponding amount-adjustedmortality rates.
The weights for healthy retirees and beneficiaries, respectively, at each age were the product ofthe total number of lives exposed at that age times the average amount exposed for those plansthat did provide data on amounts.
An example of how this blended rate is determined is given in Appendix E.
Graduation of Amount-adjusted qxs
The resulting amount-adjusted mortality rates for employees, healthy annuitants, and disabledannuitants were graduated using Whittaker-Henderson with third differences and h values of1,000,000 for healthy annuitants and 10,000,000 for employees and disabled lives.
Mortality rates for disabled annuitants were set equal to the mortality rates for healthy annuitantsat and after the point at which the graduated rates for disabled annuitants dropped below thosefor healthy annuitants. This occurred at age 89 for males and 91 for females.
Extension to Extreme Ages
The above process produced mortality rates between the following ages:
Employee ages 30 through 70Healthy annuitant ages 50 through 100Disabled retiree ages 45 through 100
Mortality rates for employees were extended below age 30 to blend with the UP-94 table.Rates for ages 1 through 10 were set equal to the UP-94 table. Rates for ages 11 through 29were interpolated from the UP-94 rate at age 10 to the current study rates at age 30 using cubicinterpolation formulas that were designed to reproduce the general shape of the 1990 U.S. Lifetable at these ages.
The RPEC did not find any reliable data for mortality rates over age 100. However, theyagreed with the developers of the GAR-94 and UP-94 tables that the mortality curvedecelerates at the older ages resulting in a limiting mortality rate below 1.00.
The rate of increase in the qxs diminishes after age 90 but the qxs are still increasing in the late90s. The RPEC decided that there should be an upper limit to the mortality rate that would bethe same for males and females and that would form a reasonable extrapolation of the rate ofincrease after age 95. A limiting qx of 0.4 fit these criteria. A cubic polynomial was selected foreach gender such that the polynomial reproduced the value of qx at age 99 and 100 andattained the limiting value of .4 at an age where the slope was 0, with no inflection pointsbetween age 100 and that age. This resulted in rates that hit the 0.4 limit at age 106 for malesand 115 for females.
Since there was no discernible pattern of mortality rates for disabled retirees below age 45,these rates for disabled retirees from ages 21 to 44 were set equal to the rate at age 45. Othersets of data show that the mortality rates for young disabled retirees sometimes decline as ageincreases. However, this effect is usually related to the number of years after disability ratherthan age. As a result, the RPEC agreed that a table that used the same rate at all ages under 45would be reasonable.

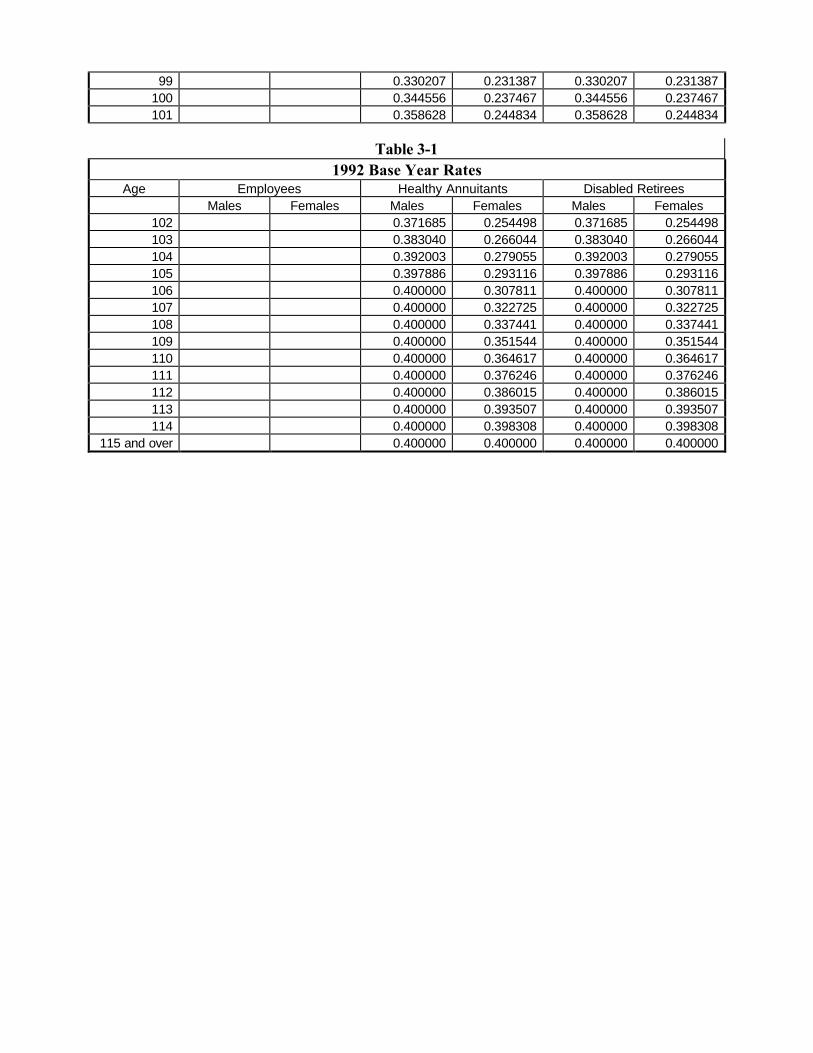
Table 3-1 shows the resulting mortality rates by age, gender, and status.
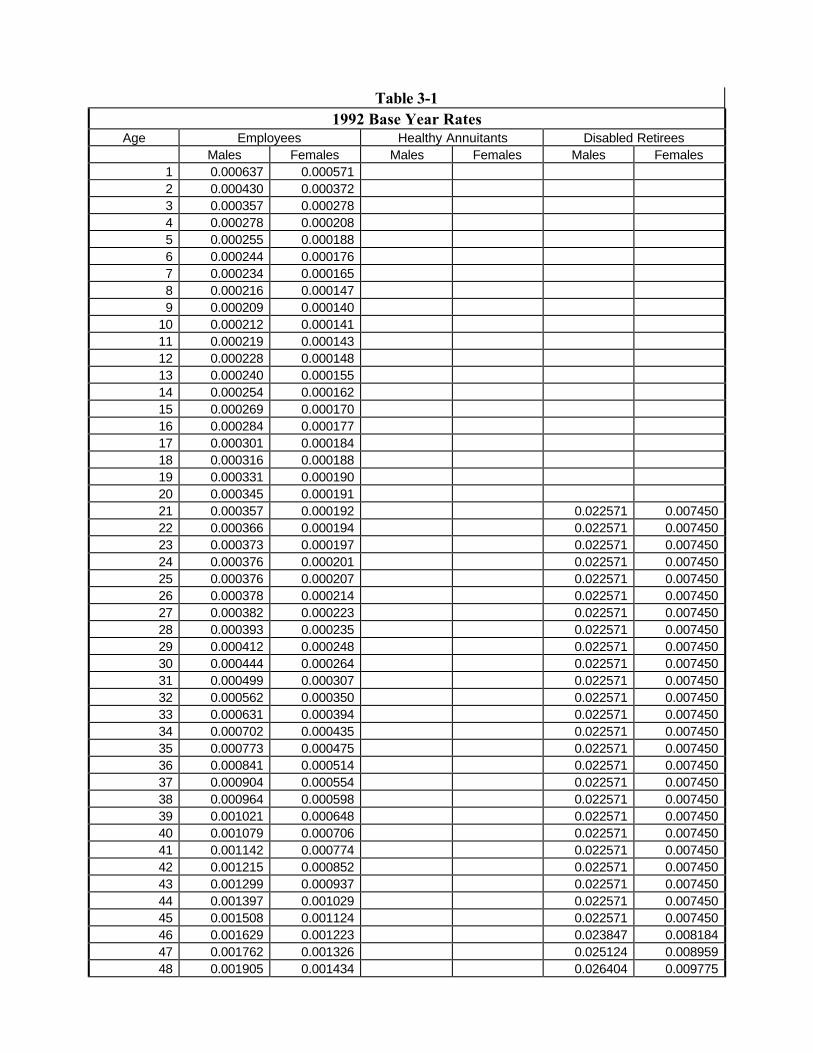
Table 3-11992 Base Year Rates
Age Employees Healthy Annuitants Disabled RetireesMales Females Males Females Males Females
1 0.000637 0.0005712 0.000430 0.0003723 0.000357 0.0002784 0.000278 0.0002085 0.000255 0.0001886 0.000244 0.0001767 0.000234 0.0001658 0.000216 0.0001479 0.000209 0.000140
10 0.000212 0.00014111 0.000219 0.00014312 0.000228 0.00014813 0.000240 0.00015514 0.000254 0.00016215 0.000269 0.00017016 0.000284 0.00017717 0.000301 0.00018418 0.000316 0.00018819 0.000331 0.00019020 0.000345 0.00019121 0.000357 0.000192 0.022571 0.00745022 0.000366 0.000194 0.022571 0.00745023 0.000373 0.000197 0.022571 0.00745024 0.000376 0.000201 0.022571 0.00745025 0.000376 0.000207 0.022571 0.00745026 0.000378 0.000214 0.022571 0.00745027 0.000382 0.000223 0.022571 0.00745028 0.000393 0.000235 0.022571 0.00745029 0.000412 0.000248 0.022571 0.00745030 0.000444 0.000264 0.022571 0.00745031 0.000499 0.000307 0.022571 0.00745032 0.000562 0.000350 0.022571 0.00745033 0.000631 0.000394 0.022571 0.00745034 0.000702 0.000435 0.022571 0.00745035 0.000773 0.000475 0.022571 0.00745036 0.000841 0.000514 0.022571 0.00745037 0.000904 0.000554 0.022571 0.00745038 0.000964 0.000598 0.022571 0.00745039 0.001021 0.000648 0.022571 0.00745040 0.001079 0.000706 0.022571 0.00745041 0.001142 0.000774 0.022571 0.00745042 0.001215 0.000852 0.022571 0.00745043 0.001299 0.000937 0.022571 0.00745044 0.001397 0.001029 0.022571 0.00745045 0.001508 0.001124 0.022571 0.00745046 0.001629 0.001223 0.023847 0.00818447 0.001762 0.001326 0.025124 0.00895948 0.001905 0.001434 0.026404 0.009775

49 0.002060 0.001550 0.027687 0.01063450 0.002225 0.001676 0.005566 0.002344 0.028975 0.011535
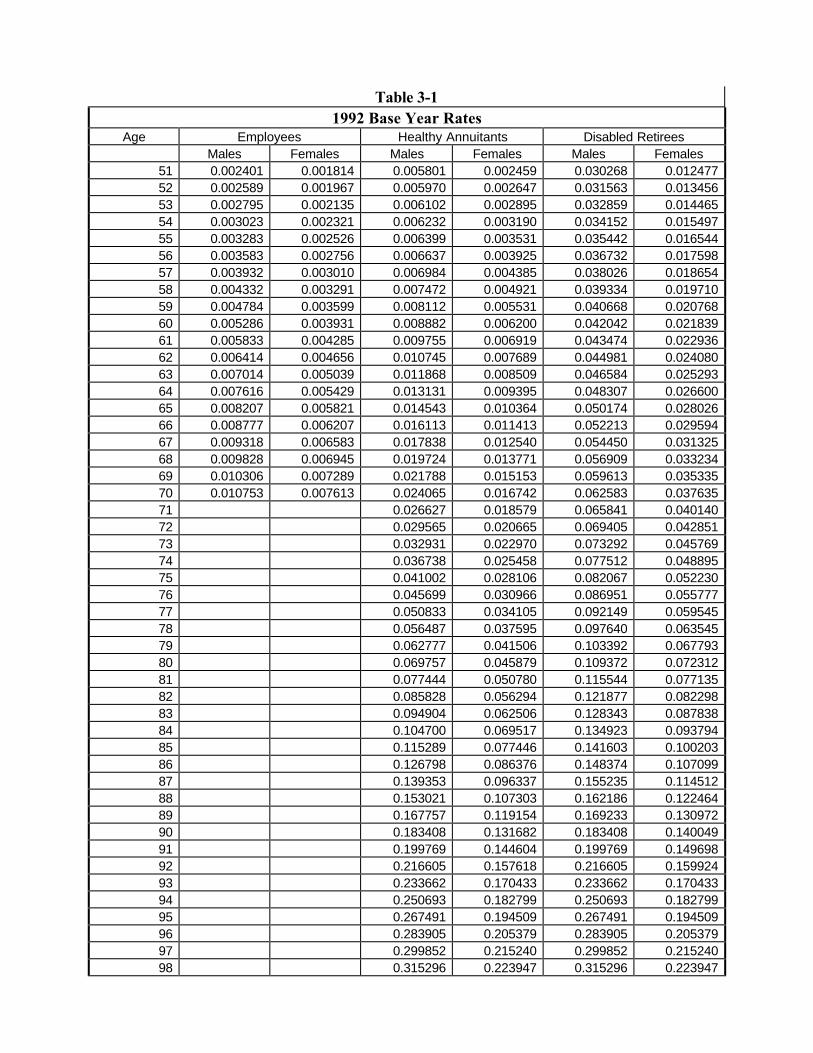
Table 3-11992 Base Year Rates
Age Employees Healthy Annuitants Disabled RetireesMales Females Males Females Males Females
51 0.002401 0.001814 0.005801 0.002459 0.030268 0.01247752 0.002589 0.001967 0.005970 0.002647 0.031563 0.01345653 0.002795 0.002135 0.006102 0.002895 0.032859 0.01446554 0.003023 0.002321 0.006232 0.003190 0.034152 0.01549755 0.003283 0.002526 0.006399 0.003531 0.035442 0.01654456 0.003583 0.002756 0.006637 0.003925 0.036732 0.01759857 0.003932 0.003010 0.006984 0.004385 0.038026 0.01865458 0.004332 0.003291 0.007472 0.004921 0.039334 0.01971059 0.004784 0.003599 0.008112 0.005531 0.040668 0.02076860 0.005286 0.003931 0.008882 0.006200 0.042042 0.02183961 0.005833 0.004285 0.009755 0.006919 0.043474 0.02293662 0.006414 0.004656 0.010745 0.007689 0.044981 0.02408063 0.007014 0.005039 0.011868 0.008509 0.046584 0.02529364 0.007616 0.005429 0.013131 0.009395 0.048307 0.02660065 0.008207 0.005821 0.014543 0.010364 0.050174 0.02802666 0.008777 0.006207 0.016113 0.011413 0.052213 0.02959467 0.009318 0.006583 0.017838 0.012540 0.054450 0.03132568 0.009828 0.006945 0.019724 0.013771 0.056909 0.03323469 0.010306 0.007289 0.021788 0.015153 0.059613 0.03533570 0.010753 0.007613 0.024065 0.016742 0.062583 0.03763571 0.026627 0.018579 0.065841 0.04014072 0.029565 0.020665 0.069405 0.04285173 0.032931 0.022970 0.073292 0.04576974 0.036738 0.025458 0.077512 0.04889575 0.041002 0.028106 0.082067 0.05223076 0.045699 0.030966 0.086951 0.05577777 0.050833 0.034105 0.092149 0.05954578 0.056487 0.037595 0.097640 0.06354579 0.062777 0.041506 0.103392 0.06779380 0.069757 0.045879 0.109372 0.07231281 0.077444 0.050780 0.115544 0.07713582 0.085828 0.056294 0.121877 0.08229883 0.094904 0.062506 0.128343 0.08783884 0.104700 0.069517 0.134923 0.09379485 0.115289 0.077446 0.141603 0.10020386 0.126798 0.086376 0.148374 0.10709987 0.139353 0.096337 0.155235 0.11451288 0.153021 0.107303 0.162186 0.12246489 0.167757 0.119154 0.169233 0.13097290 0.183408 0.131682 0.183408 0.14004991 0.199769 0.144604 0.199769 0.14969892 0.216605 0.157618 0.216605 0.15992493 0.233662 0.170433 0.233662 0.17043394 0.250693 0.182799 0.250693 0.18279995 0.267491 0.194509 0.267491 0.19450996 0.283905 0.205379 0.283905 0.20537997 0.299852 0.215240 0.299852 0.21524098 0.315296 0.223947 0.315296 0.223947
99 0.330207 0.231387 0.330207 0.231387100 0.344556 0.237467 0.344556 0.237467101 0.358628 0.244834 0.358628 0.244834
Table 3-11992 Base Year Rates
Age Employees Healthy Annuitants Disabled RetireesMales Females Males Females Males Females
102 0.371685 0.254498 0.371685 0.254498103 0.383040 0.266044 0.383040 0.266044104 0.392003 0.279055 0.392003 0.279055105 0.397886 0.293116 0.397886 0.293116106 0.400000 0.307811 0.400000 0.307811107 0.400000 0.322725 0.400000 0.322725108 0.400000 0.337441 0.400000 0.337441109 0.400000 0.351544 0.400000 0.351544110 0.400000 0.364617 0.400000 0.364617111 0.400000 0.376246 0.400000 0.376246112 0.400000 0.386015 0.400000 0.386015113 0.400000 0.393507 0.400000 0.393507114 0.400000 0.398308 0.400000 0.398308
115 and over 0.400000 0.400000 0.400000 0.400000
Chapter 4 - RP-2000 Tables
Projection to 2000
The rates of Table 3-1 were projected to 2000 based on a review of three sets of data. Thesewere Social Security data, federal retiree data, and the study data.
The RPEC analyzed the data Social Security actuaries used to prepare Actuarial Study 110,“Social Security Area Population Projections 1996” from the Office of the Actuary of theSocial Security Administration (SSA) 1. Mortality rates by gender and five-year age groupsthrough 1994 were available. The RPEC used the Social Security data covering 1990 to 1994because that was the subset of rates that centered on 1992, the mid-year of the experienceperiod, and ended with 1994, the latest year in the data set.
The Federal Office of Personnel Management (OPM) provided mortality experience forFederal Civil Service annuitants through 1996. These data have the advantages of spanning along time period and containing a large number of exposures confined to pension planparticipants only. The RPEC used the Federal Civil Service data covering 1988 to 1996because that was the subset of rates that centered on 1992, the mid-year of the experienceperiod, and ended with 1996, the latest year in the data set.
The RPEC analyzed the data collected for this study for trends in mortality rates for employees,beneficiaries, and healthy retirees separately, as well as all data combined, including only datafor plans that submitted data for all five years. There were not sufficient consistent data toanalyze trends for disabled retirees. The subset of study data that encompassed all years from1990 through 1994 was approximately 8,000,000 exposures.
Even for very large data sets, such as Social Security data, clear mortality trends are difficult toobserve from raw year-to-year data. To better observe the trends, the RPEC calculated least-squares regression lines through the logarithms of the raw mortality rates by year for eachquinquennial age group for each gender for each data set. The best-fit log-linear mortalityimprovement trends were calculated using the slopes of these regression lines. For eachregression line, the best-fit log-linear mortality improvement trend equals one minus the antilogof the slope.
Tables 4-1 and 4-2 compare the best-fit log-linear mortality improvement trends by data source.These tables compare recent mortality improvement from the data collected for this study onemployees and healthy annuitants combined (1990-1994), from Social Security data (1990-1994),and from Federal Civil Service data (1988-1996). For illustrative purposes, these tables alsoinclude the comparable factors used to construct the GAR-94 table. As with the current study, the 1 Death rates for ages under 65 were calculated using the number of deaths as tabulated in VitalStatistics of the United States and using the latest census estimates of the population. For ages 65and over, records of the Medicare program were used to determine the rates by age and gender.
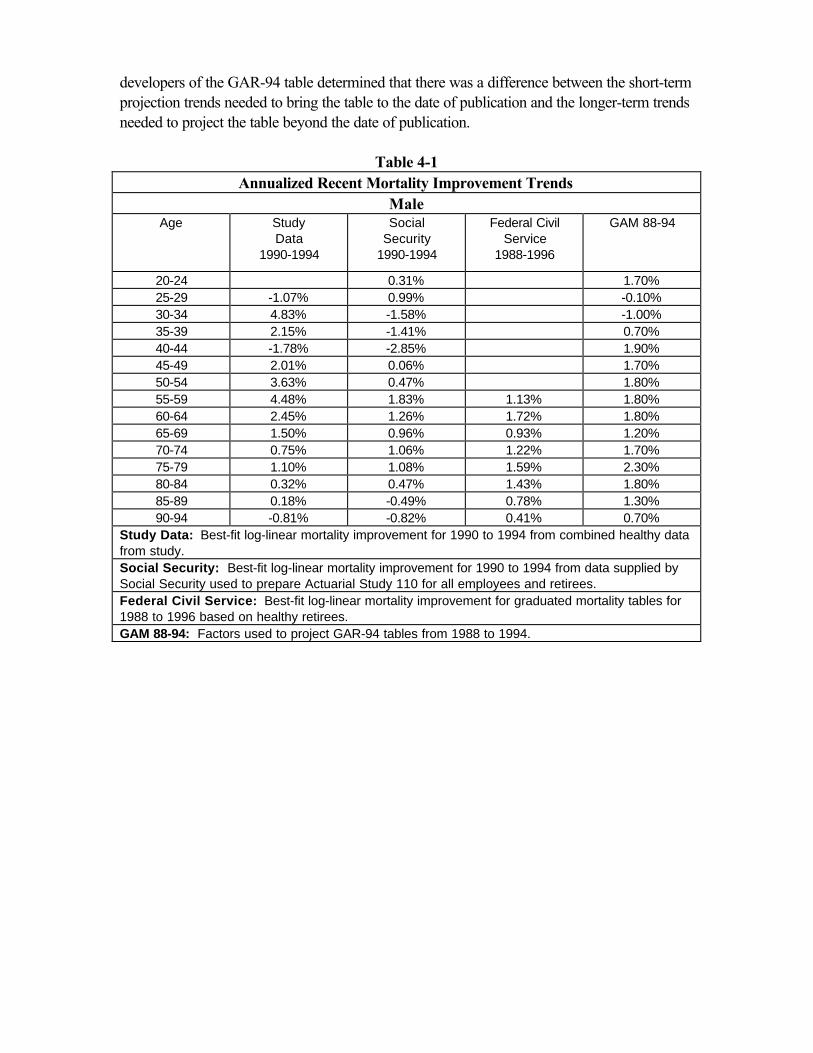
developers of the GAR-94 table determined that there was a difference between the short-termprojection trends needed to bring the table to the date of publication and the longer-term trendsneeded to project the table beyond the date of publication.
Table 4-1Annualized Recent Mortality Improvement Trends
MaleAge Study
Data1990-1994
SocialSecurity
1990-1994
Federal CivilService
1988-1996
GAM 88-94
20-24 0.31% 1.70%25-29 -1.07% 0.99% -0.10%30-34 4.83% -1.58% -1.00%35-39 2.15% -1.41% 0.70%40-44 -1.78% -2.85% 1.90%45-49 2.01% 0.06% 1.70%50-54 3.63% 0.47% 1.80%55-59 4.48% 1.83% 1.13% 1.80%60-64 2.45% 1.26% 1.72% 1.80%65-69 1.50% 0.96% 0.93% 1.20%70-74 0.75% 1.06% 1.22% 1.70%75-79 1.10% 1.08% 1.59% 2.30%80-84 0.32% 0.47% 1.43% 1.80%85-89 0.18% -0.49% 0.78% 1.30%90-94 -0.81% -0.82% 0.41% 0.70%
Study Data: Best-fit log-linear mortality improvement for 1990 to 1994 from combined healthy datafrom study.Social Security: Best-fit log-linear mortality improvement for 1990 to 1994 from data supplied bySocial Security used to prepare Actuarial Study 110 for all employees and retirees.Federal Civil Service: Best-fit log-linear mortality improvement for graduated mortality tables for1988 to 1996 based on healthy retirees.GAM 88-94: Factors used to project GAR-94 tables from 1988 to 1994.
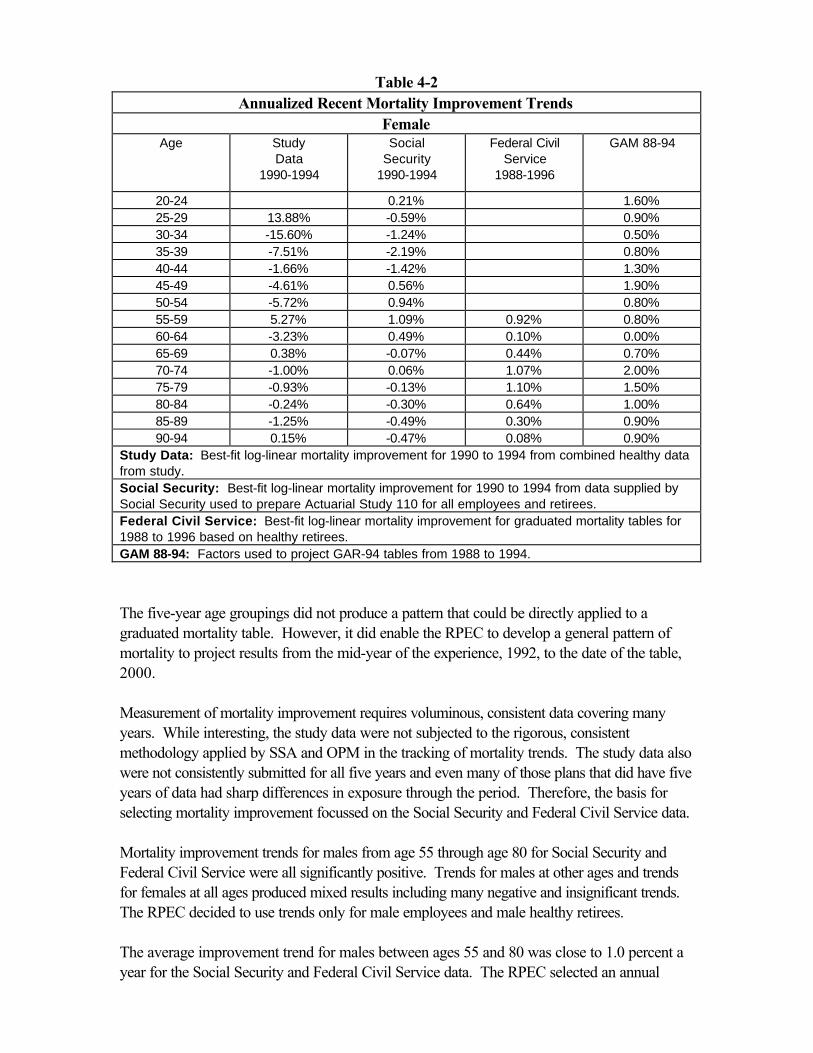
Table 4-2Annualized Recent Mortality Improvement Trends
FemaleAge Study
Data1990-1994
SocialSecurity
1990-1994
Federal CivilService
1988-1996
GAM 88-94
20-24 0.21% 1.60%25-29 13.88% -0.59% 0.90%30-34 -15.60% -1.24% 0.50%35-39 -7.51% -2.19% 0.80%40-44 -1.66% -1.42% 1.30%45-49 -4.61% 0.56% 1.90%50-54 -5.72% 0.94% 0.80%55-59 5.27% 1.09% 0.92% 0.80%60-64 -3.23% 0.49% 0.10% 0.00%65-69 0.38% -0.07% 0.44% 0.70%70-74 -1.00% 0.06% 1.07% 2.00%75-79 -0.93% -0.13% 1.10% 1.50%80-84 -0.24% -0.30% 0.64% 1.00%85-89 -1.25% -0.49% 0.30% 0.90%90-94 0.15% -0.47% 0.08% 0.90%
Study Data: Best-fit log-linear mortality improvement for 1990 to 1994 from combined healthy datafrom study.Social Security: Best-fit log-linear mortality improvement for 1990 to 1994 from data supplied bySocial Security used to prepare Actuarial Study 110 for all employees and retirees.Federal Civil Service: Best-fit log-linear mortality improvement for graduated mortality tables for1988 to 1996 based on healthy retirees.GAM 88-94: Factors used to project GAR-94 tables from 1988 to 1994.
The five-year age groupings did not produce a pattern that could be directly applied to agraduated mortality table. However, it did enable the RPEC to develop a general pattern ofmortality to project results from the mid-year of the experience, 1992, to the date of the table,2000.
Measurement of mortality improvement requires voluminous, consistent data covering manyyears. While interesting, the study data were not subjected to the rigorous, consistentmethodology applied by SSA and OPM in the tracking of mortality trends. The study data alsowere not consistently submitted for all five years and even many of those plans that did have fiveyears of data had sharp differences in exposure through the period. Therefore, the basis forselecting mortality improvement focussed on the Social Security and Federal Civil Service data.
Mortality improvement trends for males from age 55 through age 80 for Social Security andFederal Civil Service were all significantly positive. Trends for males at other ages and trendsfor females at all ages produced mixed results including many negative and insignificant trends.The RPEC decided to use trends only for male employees and male healthy retirees.
The average improvement trend for males between ages 55 and 80 was close to 1.0 percent ayear for the Social Security and Federal Civil Service data. The RPEC selected an annual

improvement factor of 1.0 percent for male employees and healthy retirees aged 55 through 80.Some of the improvement trends calculated for ages in that range are greater than 1.0 but theRPEC believed that use of factors that varied within that set of ages would give a false sense ofprecision. The 1.0 percent factor was graded down to zero below age 46 and above age 89 toavoid a discontinuity in the projected rates. The complete set of factors is shown in Table 4-3.
The improvement factors discussed here are only to project the data to the year 2000 based onrecent short-term experience. Chapter 7 discusses projection beyond the year 2000 based onlong-term experience. Thus the improvement factors in Table 4-3 are different from theimprovement factors in Table 7-3.
Table 4-3Male Employee and Healthy Retiree Mortality Improvement Factors
Projection of Study Rates to 2000Age Annual Improvement
RateAge Annual Improvement
RateUnder 46 0% 81 .9%
46 .1% 82 .8%47 .2% 83 .7%48 .3% 84 .6%49 .4% 85 .5%50 .5% 86 .4%51 .6% 87 .3%52 .7% 88 .2%53 .8% 89 .1%54 .9% Over 89 0%
55 to 80 1.0%
Combined Healthy Participant Table
The RPEC also produced a combined Healthy Participant Table by blending the employee andhealthy annuitant tables, primarily to permit a direct comparison to previously published tablesincluding the UP-94 table. Comparisons of liabilities are shown at the end of Chapter 8. TheRPEC was also concerned that some computer programs and systems could not readily adoptseparate employee and annuitant tables. The RPEC encourages use of the separate employeeand healthy annuitant tables when possible. For employees over the age of 70, healthy annuitantmortality rates should be used.
Since many contributors submitted retiree data but no employee data, direct use of all of thestudy data would have weighted retiree data too heavily. Therefore, the RPEC determined theweighting factors using the subset of data for which both active and retired experience had beensubmitted. The resulting weights are shown in Table 4-4.
Where unisex tables are desirable, the RPEC recommends that the actuary should constructblended tables based on the proportion of each gender in the plan population.
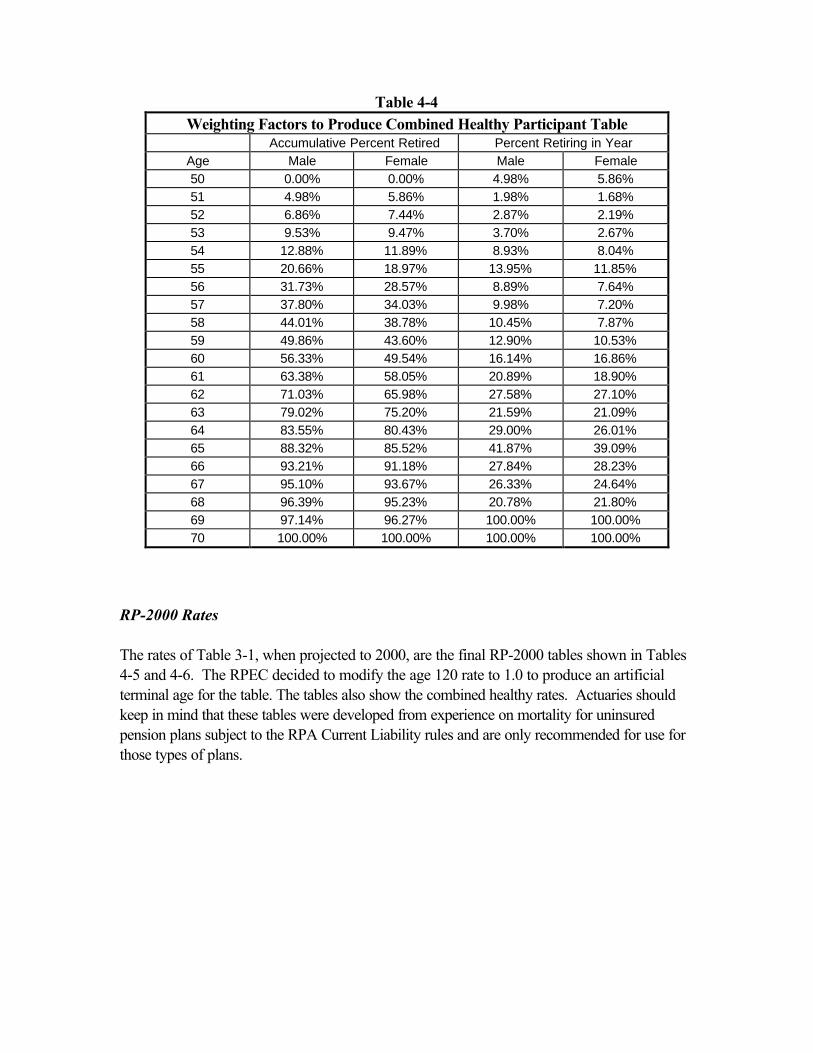
Table 4-4Weighting Factors to Produce Combined Healthy Participant Table
Accumulative Percent Retired Percent Retiring in YearAge Male Female Male Female50 0.00% 0.00% 4.98% 5.86%51 4.98% 5.86% 1.98% 1.68%52 6.86% 7.44% 2.87% 2.19%53 9.53% 9.47% 3.70% 2.67%54 12.88% 11.89% 8.93% 8.04%55 20.66% 18.97% 13.95% 11.85%56 31.73% 28.57% 8.89% 7.64%57 37.80% 34.03% 9.98% 7.20%58 44.01% 38.78% 10.45% 7.87%59 49.86% 43.60% 12.90% 10.53%60 56.33% 49.54% 16.14% 16.86%61 63.38% 58.05% 20.89% 18.90%62 71.03% 65.98% 27.58% 27.10%63 79.02% 75.20% 21.59% 21.09%64 83.55% 80.43% 29.00% 26.01%65 88.32% 85.52% 41.87% 39.09%66 93.21% 91.18% 27.84% 28.23%67 95.10% 93.67% 26.33% 24.64%68 96.39% 95.23% 20.78% 21.80%69 97.14% 96.27% 100.00% 100.00%70 100.00% 100.00% 100.00% 100.00%
RP-2000 Rates
The rates of Table 3-1, when projected to 2000, are the final RP-2000 tables shown in Tables4-5 and 4-6. The RPEC decided to modify the age 120 rate to 1.0 to produce an artificialterminal age for the table. The tables also show the combined healthy rates. Actuaries shouldkeep in mind that these tables were developed from experience on mortality for uninsuredpension plans subject to the RPA Current Liability rules and are only recommended for use forthose types of plans.
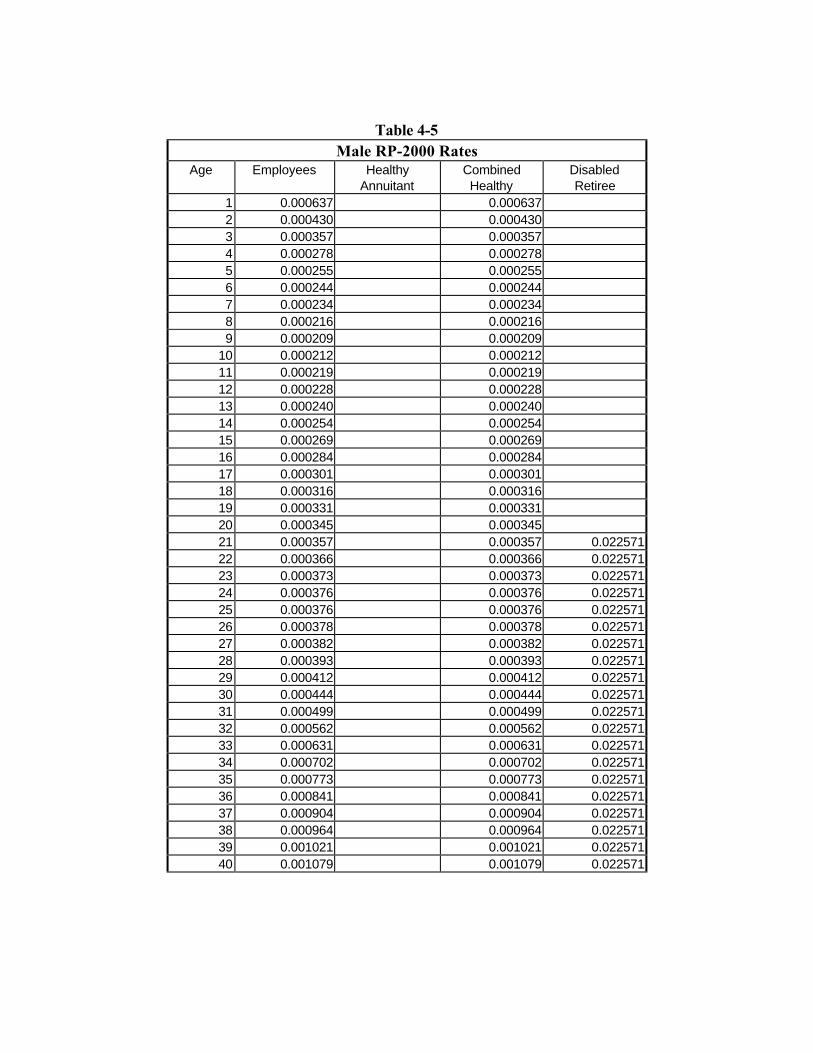
Table 4-5Male RP-2000 Rates
Age Employees HealthyAnnuitant
CombinedHealthy
DisabledRetiree
1 0.000637 0.0006372 0.000430 0.0004303 0.000357 0.0003574 0.000278 0.0002785 0.000255 0.0002556 0.000244 0.0002447 0.000234 0.0002348 0.000216 0.0002169 0.000209 0.000209
10 0.000212 0.00021211 0.000219 0.00021912 0.000228 0.00022813 0.000240 0.00024014 0.000254 0.00025415 0.000269 0.00026916 0.000284 0.00028417 0.000301 0.00030118 0.000316 0.00031619 0.000331 0.00033120 0.000345 0.00034521 0.000357 0.000357 0.02257122 0.000366 0.000366 0.02257123 0.000373 0.000373 0.02257124 0.000376 0.000376 0.02257125 0.000376 0.000376 0.02257126 0.000378 0.000378 0.02257127 0.000382 0.000382 0.02257128 0.000393 0.000393 0.02257129 0.000412 0.000412 0.02257130 0.000444 0.000444 0.02257131 0.000499 0.000499 0.02257132 0.000562 0.000562 0.02257133 0.000631 0.000631 0.02257134 0.000702 0.000702 0.02257135 0.000773 0.000773 0.02257136 0.000841 0.000841 0.02257137 0.000904 0.000904 0.02257138 0.000964 0.000964 0.02257139 0.001021 0.001021 0.02257140 0.001079 0.001079 0.022571
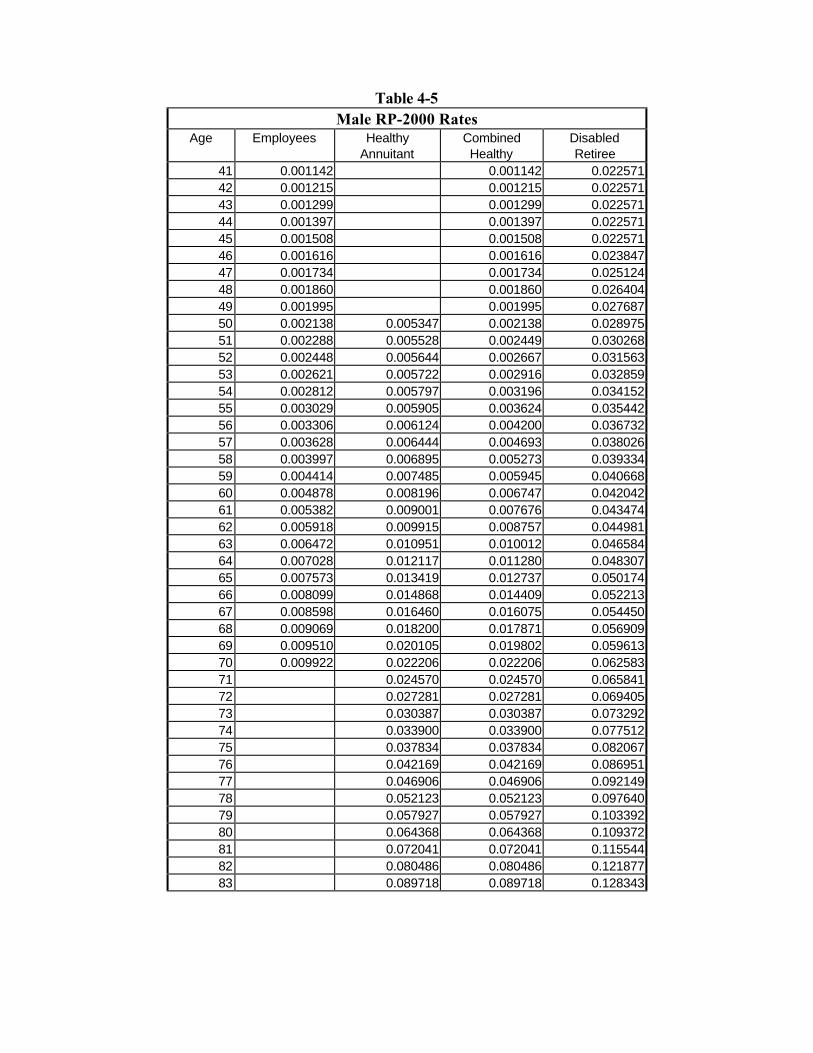
Table 4-5Male RP-2000 Rates
Age Employees HealthyAnnuitant
CombinedHealthy
DisabledRetiree
41 0.001142 0.001142 0.02257142 0.001215 0.001215 0.02257143 0.001299 0.001299 0.02257144 0.001397 0.001397 0.02257145 0.001508 0.001508 0.02257146 0.001616 0.001616 0.02384747 0.001734 0.001734 0.02512448 0.001860 0.001860 0.02640449 0.001995 0.001995 0.02768750 0.002138 0.005347 0.002138 0.02897551 0.002288 0.005528 0.002449 0.03026852 0.002448 0.005644 0.002667 0.03156353 0.002621 0.005722 0.002916 0.03285954 0.002812 0.005797 0.003196 0.03415255 0.003029 0.005905 0.003624 0.03544256 0.003306 0.006124 0.004200 0.03673257 0.003628 0.006444 0.004693 0.03802658 0.003997 0.006895 0.005273 0.03933459 0.004414 0.007485 0.005945 0.04066860 0.004878 0.008196 0.006747 0.04204261 0.005382 0.009001 0.007676 0.04347462 0.005918 0.009915 0.008757 0.04498163 0.006472 0.010951 0.010012 0.04658464 0.007028 0.012117 0.011280 0.04830765 0.007573 0.013419 0.012737 0.05017466 0.008099 0.014868 0.014409 0.05221367 0.008598 0.016460 0.016075 0.05445068 0.009069 0.018200 0.017871 0.05690969 0.009510 0.020105 0.019802 0.05961370 0.009922 0.022206 0.022206 0.06258371 0.024570 0.024570 0.06584172 0.027281 0.027281 0.06940573 0.030387 0.030387 0.07329274 0.033900 0.033900 0.07751275 0.037834 0.037834 0.08206776 0.042169 0.042169 0.08695177 0.046906 0.046906 0.09214978 0.052123 0.052123 0.09764079 0.057927 0.057927 0.10339280 0.064368 0.064368 0.10937281 0.072041 0.072041 0.11554482 0.080486 0.080486 0.12187783 0.089718 0.089718 0.128343
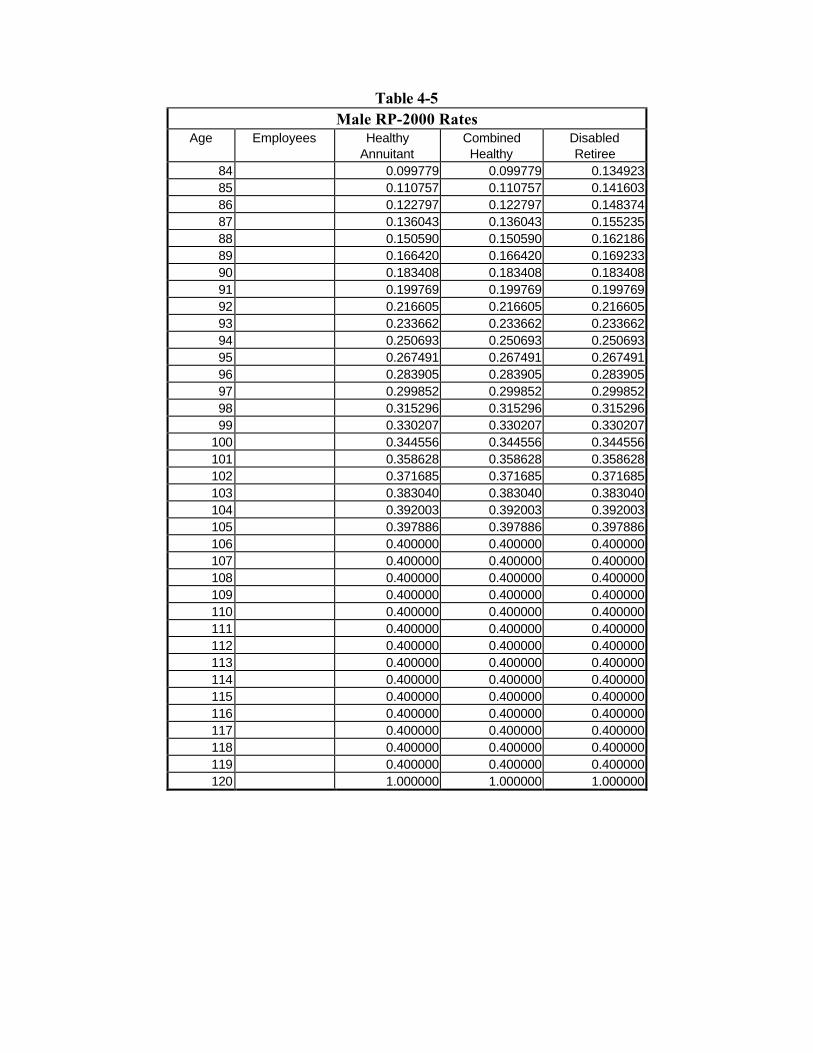
Table 4-5Male RP-2000 Rates
Age Employees HealthyAnnuitant
CombinedHealthy
DisabledRetiree
84 0.099779 0.099779 0.13492385 0.110757 0.110757 0.14160386 0.122797 0.122797 0.14837487 0.136043 0.136043 0.15523588 0.150590 0.150590 0.16218689 0.166420 0.166420 0.16923390 0.183408 0.183408 0.18340891 0.199769 0.199769 0.19976992 0.216605 0.216605 0.21660593 0.233662 0.233662 0.23366294 0.250693 0.250693 0.25069395 0.267491 0.267491 0.26749196 0.283905 0.283905 0.28390597 0.299852 0.299852 0.29985298 0.315296 0.315296 0.31529699 0.330207 0.330207 0.330207
100 0.344556 0.344556 0.344556101 0.358628 0.358628 0.358628102 0.371685 0.371685 0.371685103 0.383040 0.383040 0.383040104 0.392003 0.392003 0.392003105 0.397886 0.397886 0.397886106 0.400000 0.400000 0.400000107 0.400000 0.400000 0.400000108 0.400000 0.400000 0.400000109 0.400000 0.400000 0.400000110 0.400000 0.400000 0.400000111 0.400000 0.400000 0.400000112 0.400000 0.400000 0.400000113 0.400000 0.400000 0.400000114 0.400000 0.400000 0.400000115 0.400000 0.400000 0.400000116 0.400000 0.400000 0.400000117 0.400000 0.400000 0.400000118 0.400000 0.400000 0.400000119 0.400000 0.400000 0.400000120 1.000000 1.000000 1.000000
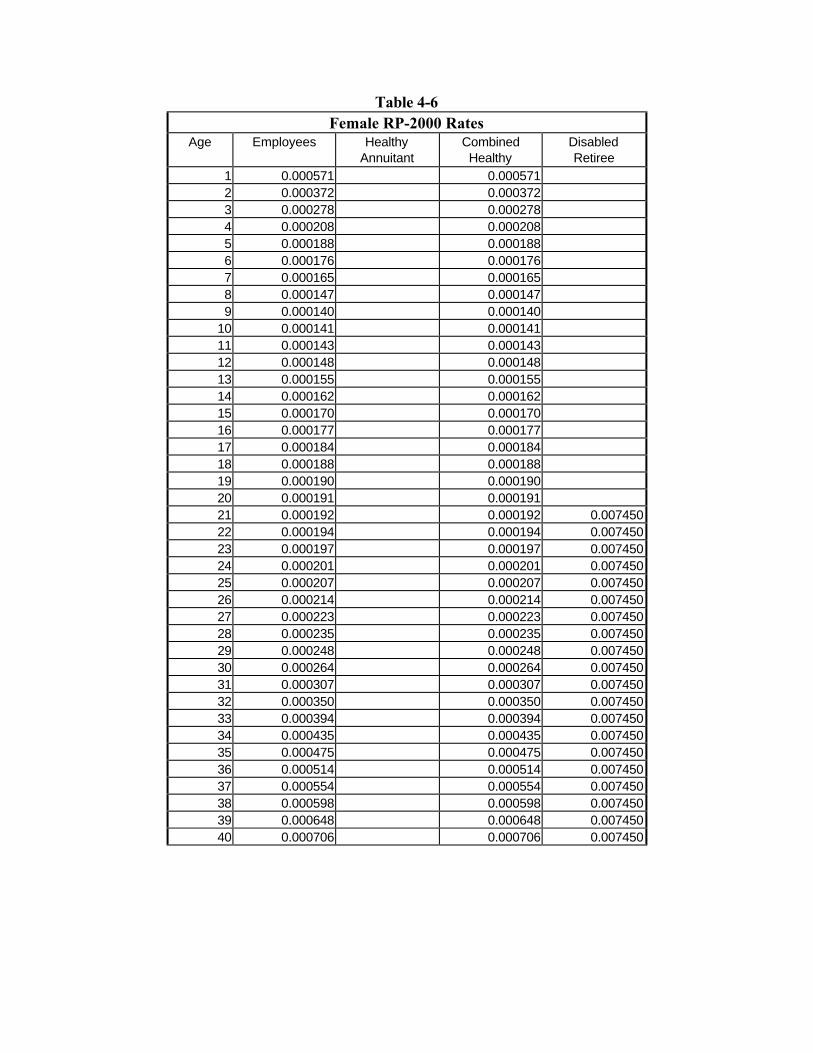
Table 4-6Female RP-2000 Rates
Age Employees HealthyAnnuitant
CombinedHealthy
DisabledRetiree
1 0.000571 0.0005712 0.000372 0.0003723 0.000278 0.0002784 0.000208 0.0002085 0.000188 0.0001886 0.000176 0.0001767 0.000165 0.0001658 0.000147 0.0001479 0.000140 0.000140
10 0.000141 0.00014111 0.000143 0.00014312 0.000148 0.00014813 0.000155 0.00015514 0.000162 0.00016215 0.000170 0.00017016 0.000177 0.00017717 0.000184 0.00018418 0.000188 0.00018819 0.000190 0.00019020 0.000191 0.00019121 0.000192 0.000192 0.00745022 0.000194 0.000194 0.00745023 0.000197 0.000197 0.00745024 0.000201 0.000201 0.00745025 0.000207 0.000207 0.00745026 0.000214 0.000214 0.00745027 0.000223 0.000223 0.00745028 0.000235 0.000235 0.00745029 0.000248 0.000248 0.00745030 0.000264 0.000264 0.00745031 0.000307 0.000307 0.00745032 0.000350 0.000350 0.00745033 0.000394 0.000394 0.00745034 0.000435 0.000435 0.00745035 0.000475 0.000475 0.00745036 0.000514 0.000514 0.00745037 0.000554 0.000554 0.00745038 0.000598 0.000598 0.00745039 0.000648 0.000648 0.00745040 0.000706 0.000706 0.007450
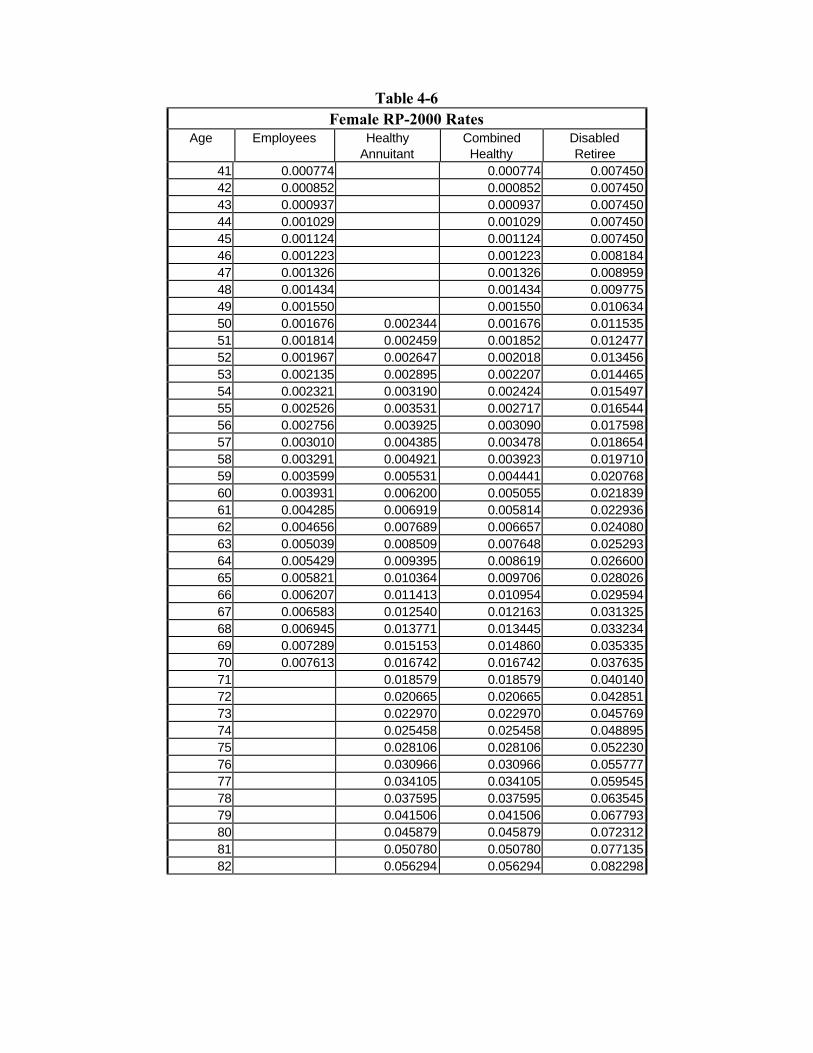
Table 4-6Female RP-2000 Rates
Age Employees HealthyAnnuitant
CombinedHealthy
DisabledRetiree
41 0.000774 0.000774 0.00745042 0.000852 0.000852 0.00745043 0.000937 0.000937 0.00745044 0.001029 0.001029 0.00745045 0.001124 0.001124 0.00745046 0.001223 0.001223 0.00818447 0.001326 0.001326 0.00895948 0.001434 0.001434 0.00977549 0.001550 0.001550 0.01063450 0.001676 0.002344 0.001676 0.01153551 0.001814 0.002459 0.001852 0.01247752 0.001967 0.002647 0.002018 0.01345653 0.002135 0.002895 0.002207 0.01446554 0.002321 0.003190 0.002424 0.01549755 0.002526 0.003531 0.002717 0.01654456 0.002756 0.003925 0.003090 0.01759857 0.003010 0.004385 0.003478 0.01865458 0.003291 0.004921 0.003923 0.01971059 0.003599 0.005531 0.004441 0.02076860 0.003931 0.006200 0.005055 0.02183961 0.004285 0.006919 0.005814 0.02293662 0.004656 0.007689 0.006657 0.02408063 0.005039 0.008509 0.007648 0.02529364 0.005429 0.009395 0.008619 0.02660065 0.005821 0.010364 0.009706 0.02802666 0.006207 0.011413 0.010954 0.02959467 0.006583 0.012540 0.012163 0.03132568 0.006945 0.013771 0.013445 0.03323469 0.007289 0.015153 0.014860 0.03533570 0.007613 0.016742 0.016742 0.03763571 0.018579 0.018579 0.04014072 0.020665 0.020665 0.04285173 0.022970 0.022970 0.04576974 0.025458 0.025458 0.04889575 0.028106 0.028106 0.05223076 0.030966 0.030966 0.05577777 0.034105 0.034105 0.05954578 0.037595 0.037595 0.06354579 0.041506 0.041506 0.06779380 0.045879 0.045879 0.07231281 0.050780 0.050780 0.07713582 0.056294 0.056294 0.082298
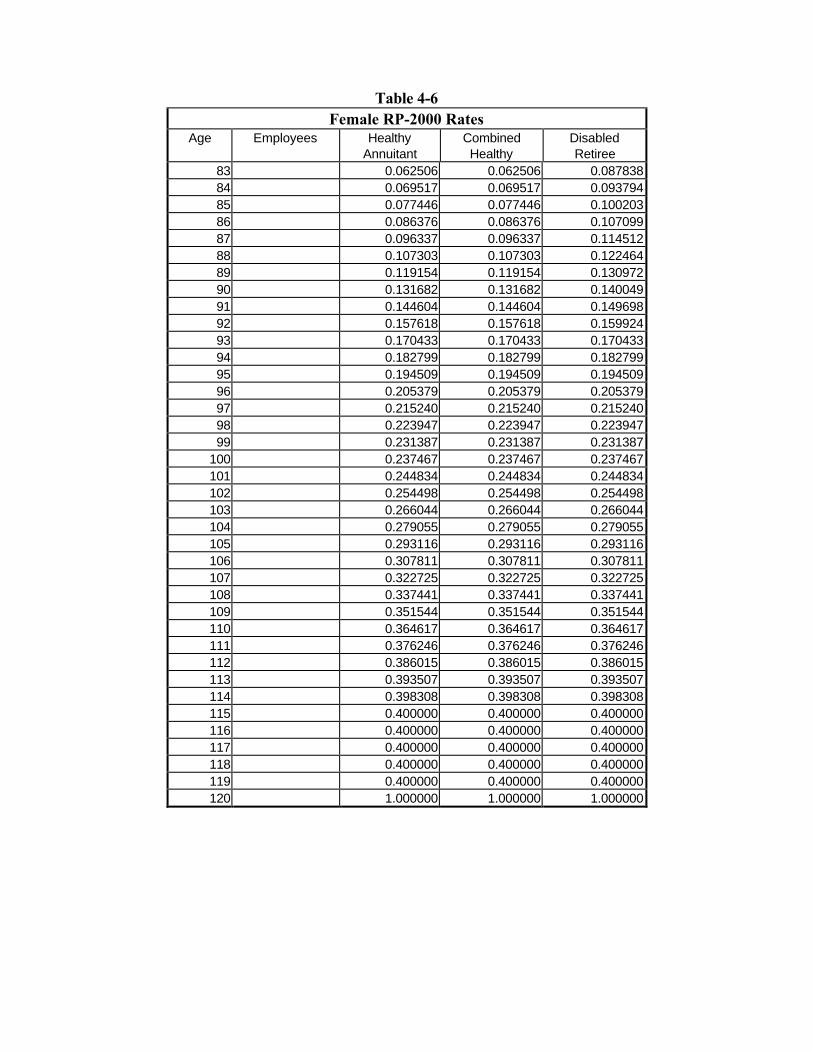
Table 4-6Female RP-2000 Rates
Age Employees HealthyAnnuitant
CombinedHealthy
DisabledRetiree
83 0.062506 0.062506 0.08783884 0.069517 0.069517 0.09379485 0.077446 0.077446 0.10020386 0.086376 0.086376 0.10709987 0.096337 0.096337 0.11451288 0.107303 0.107303 0.12246489 0.119154 0.119154 0.13097290 0.131682 0.131682 0.14004991 0.144604 0.144604 0.14969892 0.157618 0.157618 0.15992493 0.170433 0.170433 0.17043394 0.182799 0.182799 0.18279995 0.194509 0.194509 0.19450996 0.205379 0.205379 0.20537997 0.215240 0.215240 0.21524098 0.223947 0.223947 0.22394799 0.231387 0.231387 0.231387
100 0.237467 0.237467 0.237467101 0.244834 0.244834 0.244834102 0.254498 0.254498 0.254498103 0.266044 0.266044 0.266044104 0.279055 0.279055 0.279055105 0.293116 0.293116 0.293116106 0.307811 0.307811 0.307811107 0.322725 0.322725 0.322725108 0.337441 0.337441 0.337441109 0.351544 0.351544 0.351544110 0.364617 0.364617 0.364617111 0.376246 0.376246 0.376246112 0.386015 0.386015 0.386015113 0.393507 0.393507 0.393507114 0.398308 0.398308 0.398308115 0.400000 0.400000 0.400000116 0.400000 0.400000 0.400000117 0.400000 0.400000 0.400000118 0.400000 0.400000 0.400000119 0.400000 0.400000 0.400000120 1.000000 1.000000 1.000000
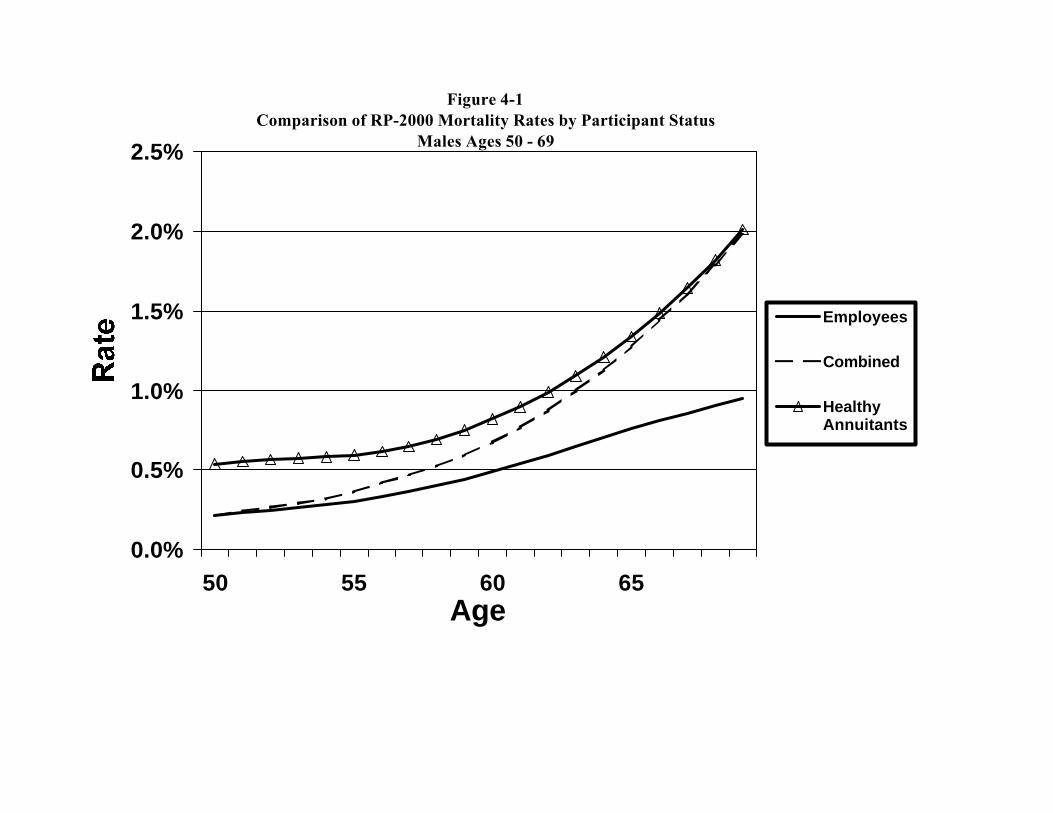
Figure 4-1Comparison of RP-2000 Mortality Rates by Participant Status
Males Ages 50 - 69
0.0%
0.5%
1.0%
1.5%
2.0%
2.5%
50 55 60 65Age
Employees
Combined
HealthyAnnuitants
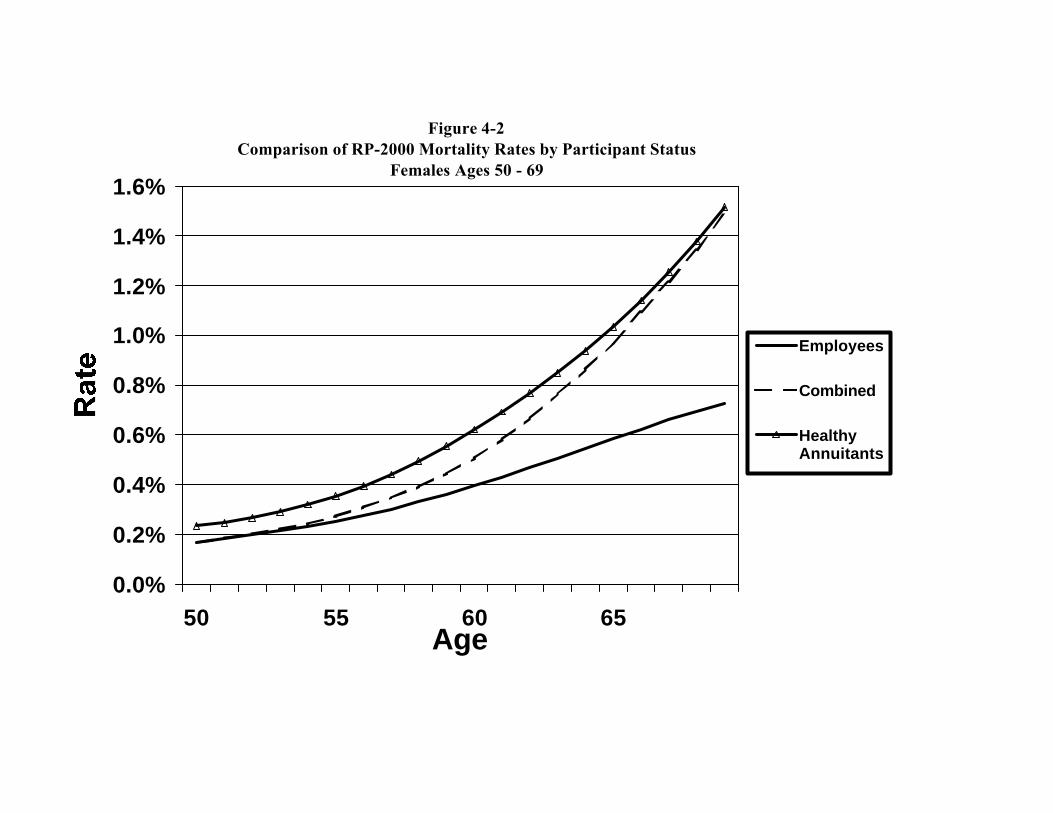
Figure 4-2Comparison of RP-2000 Mortality Rates by Participant Status
Females Ages 50 - 69
0.0%
0.2%
0.4%
0.6%
0.8%
1.0%
1.2%
1.4%
1.6%
50 55 60 65Age
Employees
Combined
HealthyAnnuitants

Chapter 5 - Relative Mortality
Differences by Collar and Amount
The RPEC performed a number of analyses that showed a significant difference in mortality bycollar type and amount of annuity, but found that industry code (first two digits of SIC) was nota consistent predictor of differences. The RPEC defined collar type based on information fromthe data contributors about whether participants were hourly or salaried and union or non-union.If more than 70 percent of the participants were hourly or union then the type was set as bluecollar. If more than 70 percent of the participants were salaried and non-union then the typewas set as white collar. If the type could not be determined, either by these rules or bycontacting the submitting actuary, it was set as mixed collar. Data contributors were asked tostratify their annuitant data by amount of annuity. The RPEC defined small amounts to be lessthan $6,000 a year and large amounts to be more than $14,400 a year. Contributors split theirannuitant data into separate cells for large, medium, and small amounts based on this definition.
The RPEC was not able to either determine the correlation between collar and amount or toproduce a practical approach to using the two factors together to adjust mortality. As a result,the RPEC contracted with a research team from the University of Connecticut to analyze thestatistical relationship between mortality and the characteristics of plan beneficiaries. Theirinvestigation considered collar type, annuity amount group, and industry code.
The researchers confirmed that both collar type and annuity amount groupings are statisticallysignificant indicators of differences in annuitant mortality experience and that industry is not aconsistent indicator of differences. The researchers were unable to find a practical model toapply the combined effect of collar and amount. The RPEC recommends that the Society ofActuaries conduct further research on multivariate models for variations in mortality. [See“Multivariate Analysis of Pension Plan Mortality Data” by G. Rasoanaivo, N. Ravishankar, J.Vadiveloo, and C. Vinsonhaler, North American Actuarial Journal, Volume 4, Number 4,October 2000.]
The RPEC reviewed extensive data on mortality controlled for amount and collar variables.Appendix F shows, by gender, for quinquennial age groups from 60 to 79, the ratios of mortalityrates by collar (white, blue, and mixed) and by annuity amount group (small, medium, and large) tothe mortality rate for the entire healthy annuitant population. It also shows for each cell the averageamount of the annuity, the total number of lives exposed, and the percentage of exposure byamounts. These tables are based on data for all healthy annuitants from plans with amountsreported. The percentage of exposure by amounts for each cell is shown to better indicate therelative degree to which the mortality for each cell is reflected in the overall mortality rate for theentire age group.
As an example, Table 5-1 compares the amount-weighted mortality for male healthy annuitantsages 65 to 69 by amount and collar. The table illustrates the correlation of large amounts withwhite collar and smaller amounts with blue collar. Large annuities account for 68 percent of theexposure by amounts for healthy white collar annuitants compared to 26 percent of the

exposure by amounts for healthy blue collar annuitants. Only 5 percent of the exposure byamounts for healthy white collar annuitants is for small annuities compared to 15 percent forhealthy blue collar annuitants. Similarly, healthy white collar annuitants account for 64 percentof the exposure by amount for large annuities but only 34 percent of the exposure by amount forsmall annuities. Healthy blue collar annuitants account for only 15 percent of the exposure byamount for large annuities yet account for 56 percent of the exposure by amount for smallannuities.
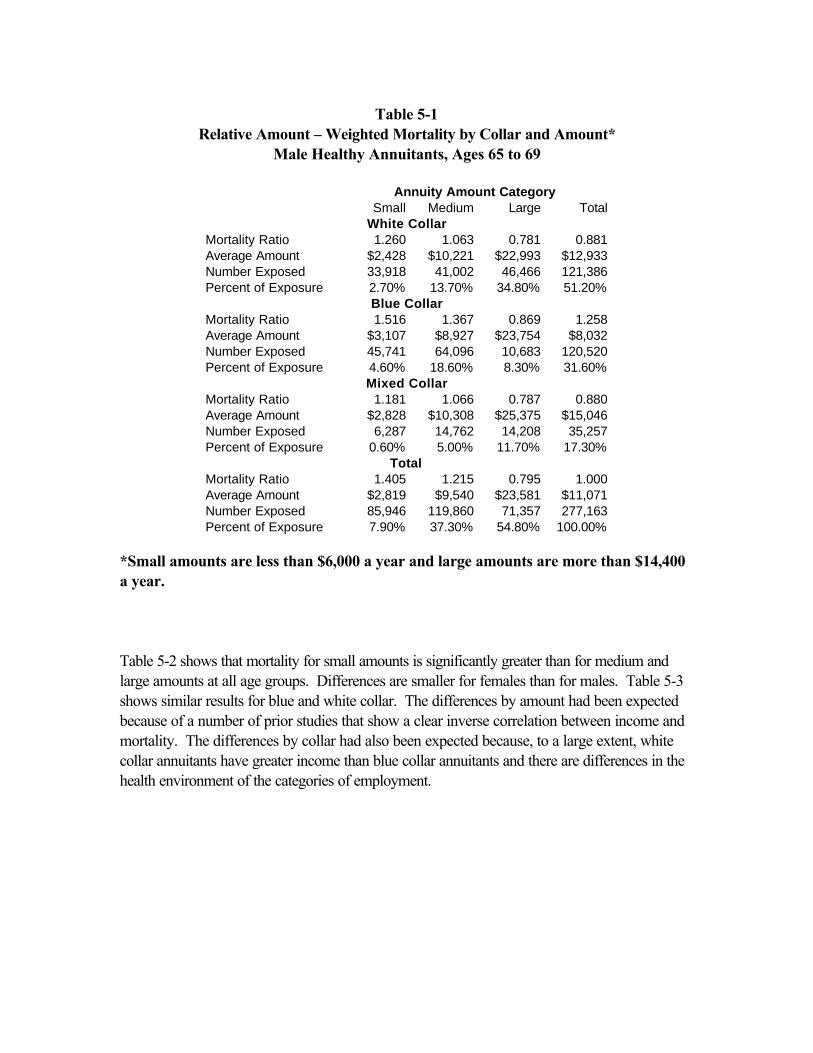
Table 5-1Relative Amount – Weighted Mortality by Collar and Amount*
Male Healthy Annuitants, Ages 65 to 69
Annuity Amount CategorySmall Medium Large Total
White CollarMortality Ratio 1.260 1.063 0.781 0.881Average Amount $2,428 $10,221 $22,993 $12,933Number Exposed 33,918 41,002 46,466 121,386Percent of Exposure 2.70% 13.70% 34.80% 51.20%
Blue CollarMortality Ratio 1.516 1.367 0.869 1.258Average Amount $3,107 $8,927 $23,754 $8,032Number Exposed 45,741 64,096 10,683 120,520Percent of Exposure 4.60% 18.60% 8.30% 31.60%
Mixed CollarMortality Ratio 1.181 1.066 0.787 0.880Average Amount $2,828 $10,308 $25,375 $15,046Number Exposed 6,287 14,762 14,208 35,257Percent of Exposure 0.60% 5.00% 11.70% 17.30%
TotalMortality Ratio 1.405 1.215 0.795 1.000Average Amount $2,819 $9,540 $23,581 $11,071Number Exposed 85,946 119,860 71,357 277,163Percent of Exposure 7.90% 37.30% 54.80% 100.00%
*Small amounts are less than $6,000 a year and large amounts are more than $14,400a year.
Table 5-2 shows that mortality for small amounts is significantly greater than for medium andlarge amounts at all age groups. Differences are smaller for females than for males. Table 5-3shows similar results for blue and white collar. The differences by amount had been expectedbecause of a number of prior studies that show a clear inverse correlation between income andmortality. The differences by collar had also been expected because, to a large extent, whitecollar annuitants have greater income than blue collar annuitants and there are differences in thehealth environment of the categories of employment.
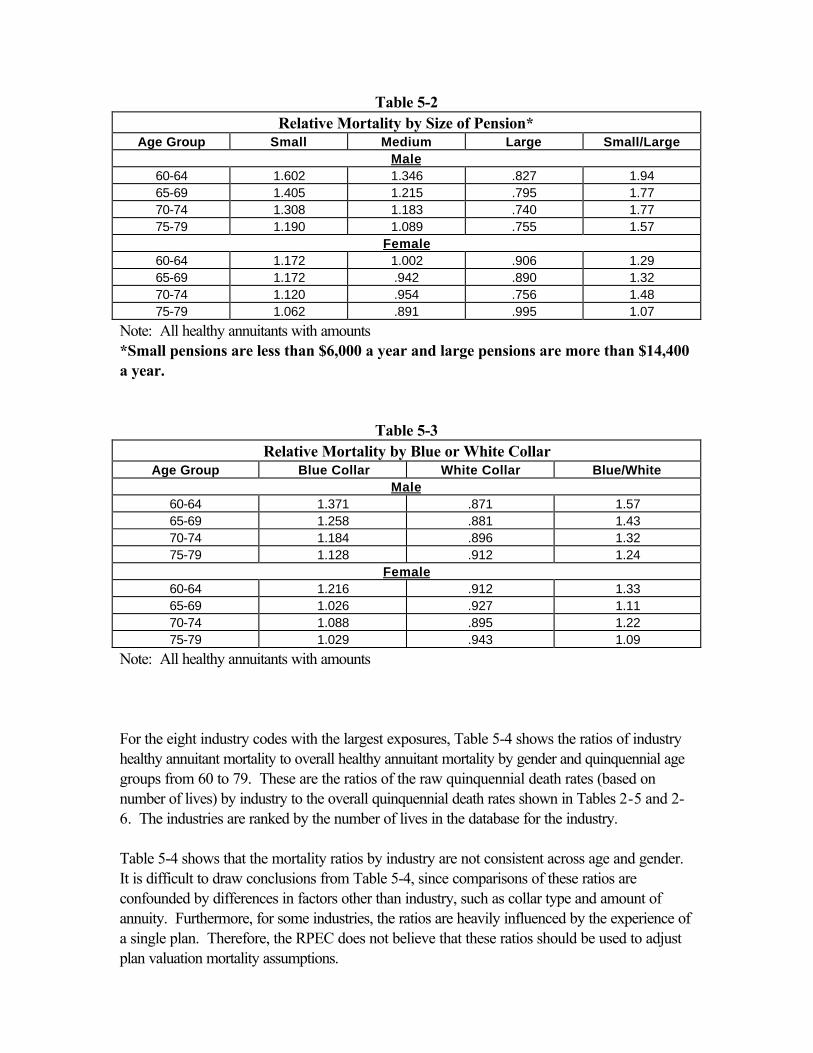
Table 5-2Relative Mortality by Size of Pension*
Age Group Small Medium Large Small/LargeMale
60-64 1.602 1.346 .827 1.9465-69 1.405 1.215 .795 1.7770-74 1.308 1.183 .740 1.7775-79 1.190 1.089 .755 1.57
Female60-64 1.172 1.002 .906 1.2965-69 1.172 .942 .890 1.3270-74 1.120 .954 .756 1.4875-79 1.062 .891 .995 1.07
Note: All healthy annuitants with amounts*Small pensions are less than $6,000 a year and large pensions are more than $14,400a year.
Table 5-3Relative Mortality by Blue or White Collar
Age Group Blue Collar White Collar Blue/WhiteMale
60-64 1.371 .871 1.5765-69 1.258 .881 1.4370-74 1.184 .896 1.3275-79 1.128 .912 1.24
Female60-64 1.216 .912 1.3365-69 1.026 .927 1.1170-74 1.088 .895 1.2275-79 1.029 .943 1.09
Note: All healthy annuitants with amounts
For the eight industry codes with the largest exposures, Table 5-4 shows the ratios of industryhealthy annuitant mortality to overall healthy annuitant mortality by gender and quinquennial agegroups from 60 to 79. These are the ratios of the raw quinquennial death rates (based onnumber of lives) by industry to the overall quinquennial death rates shown in Tables 2-5 and 2-6. The industries are ranked by the number of lives in the database for the industry.
Table 5-4 shows that the mortality ratios by industry are not consistent across age and gender.It is difficult to draw conclusions from Table 5-4, since comparisons of these ratios areconfounded by differences in factors other than industry, such as collar type and amount ofannuity. Furthermore, for some industries, the ratios are heavily influenced by the experience ofa single plan. Therefore, the RPEC does not believe that these ratios should be used to adjustplan valuation mortality assumptions.
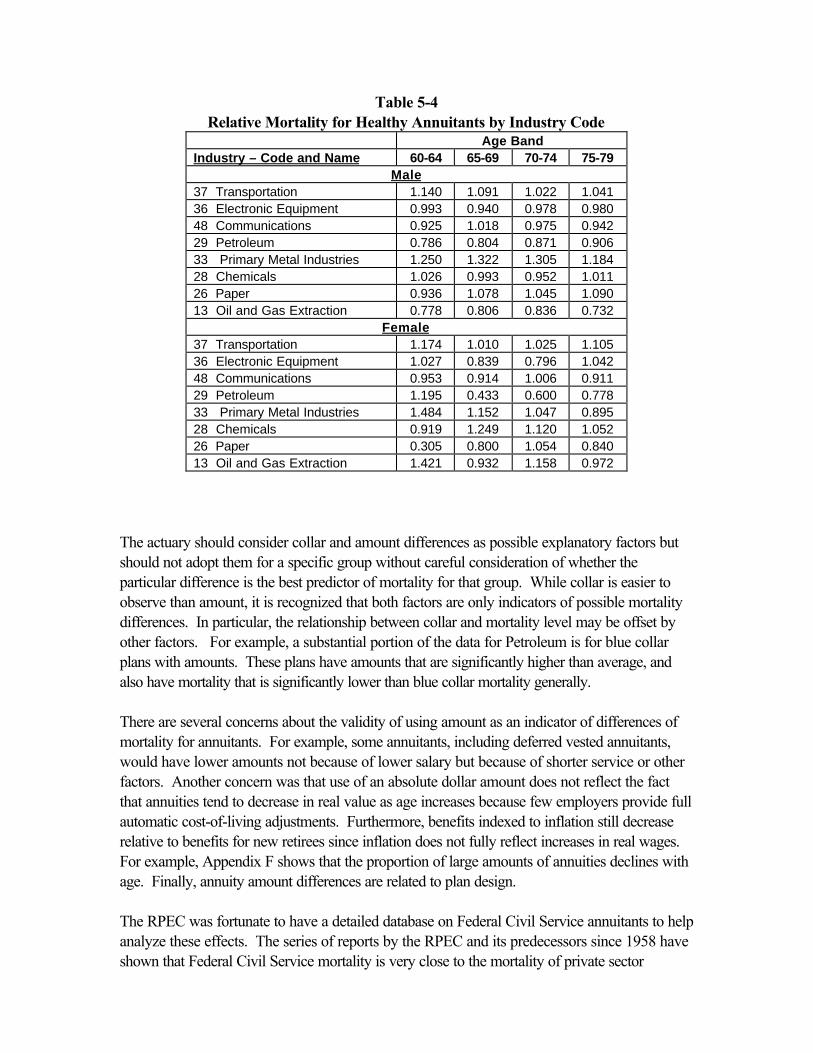
Table 5-4Relative Mortality for Healthy Annuitants by Industry Code
Age BandIndustry – Code and Name 60-64 65-69 70-74 75-79
Male37 Transportation 1.140 1.091 1.022 1.04136 Electronic Equipment 0.993 0.940 0.978 0.98048 Communications 0.925 1.018 0.975 0.94229 Petroleum 0.786 0.804 0.871 0.90633 Primary Metal Industries 1.250 1.322 1.305 1.18428 Chemicals 1.026 0.993 0.952 1.01126 Paper 0.936 1.078 1.045 1.09013 Oil and Gas Extraction 0.778 0.806 0.836 0.732
Female37 Transportation 1.174 1.010 1.025 1.10536 Electronic Equipment 1.027 0.839 0.796 1.04248 Communications 0.953 0.914 1.006 0.91129 Petroleum 1.195 0.433 0.600 0.77833 Primary Metal Industries 1.484 1.152 1.047 0.89528 Chemicals 0.919 1.249 1.120 1.05226 Paper 0.305 0.800 1.054 0.84013 Oil and Gas Extraction 1.421 0.932 1.158 0.972
The actuary should consider collar and amount differences as possible explanatory factors butshould not adopt them for a specific group without careful consideration of whether theparticular difference is the best predictor of mortality for that group. While collar is easier toobserve than amount, it is recognized that both factors are only indicators of possible mortalitydifferences. In particular, the relationship between collar and mortality level may be offset byother factors. For example, a substantial portion of the data for Petroleum is for blue collarplans with amounts. These plans have amounts that are significantly higher than average, andalso have mortality that is significantly lower than blue collar mortality generally.
There are several concerns about the validity of using amount as an indicator of differences ofmortality for annuitants. For example, some annuitants, including deferred vested annuitants,would have lower amounts not because of lower salary but because of shorter service or otherfactors. Another concern was that use of an absolute dollar amount does not reflect the factthat annuities tend to decrease in real value as age increases because few employers provide fullautomatic cost-of-living adjustments. Furthermore, benefits indexed to inflation still decreaserelative to benefits for new retirees since inflation does not fully reflect increases in real wages.For example, Appendix F shows that the proportion of large amounts of annuities declines withage. Finally, annuity amount differences are related to plan design.
The RPEC was fortunate to have a detailed database on Federal Civil Service annuitants to helpanalyze these effects. The series of reports by the RPEC and its predecessors since 1958 haveshown that Federal Civil Service mortality is very close to the mortality of private sector

uninsured pensioners. When short service and duration since retirement were controlled forusing this data set, the RPEC found that very significant differences in mortality by amount werestill observed. [See “Earn More, Live Longer – Variation in Mortality by Income Level” by M.Virga, Pension Section News, Number 28, March 1996.] This extensive analysis convincedthe RPEC that mortality does differ by amount throughout the retirement years until the veryoldest ages. At the oldest ages, mortality differences based on any variable except gender (e.g.health, amount, or collar) tend to disappear.
Table 5-5 shows ratios of graduated mortality rates by collar to overall mortality rates foremployees from age 30 to age 70 separately for males and females. Comparable ratios byamount could not be calculated since the RPEC did not collect stratified data by amount foremployees.
Tables 5-6 and 5-7 show ratios of graduated mortality rates by collar and amount categories tooverall mortality rates for healthy annuitants from age 50 to age 95. Each of the sets of datawas graduated separately by the method used for the entire table and explained in Chapter 3.The table shows that white collar mortality is generally below average except at the youngestages. Blue collar mortality is generally above average except at the oldest ages for males andyoungest ages for females. The greatest differences are observed for males in the 60s withwhite collar almost 20 percent below average and blue collar almost 30 percent above average.
The mortality ratios for white and blue collar can both be less than 1.000 for two reasons: First,there is also a mixed collar category for which results are not shown. Second, the rates aregraduated so the relationships at one age can be affected by relationships at other ages. This isespecially due to the “heavy” graduation of the amount adjustment factors. Since the exposuresare small at the youngest and oldest ages, the graduated amount adjustment factors areinfluenced by trends at the middle ages where the exposures are much larger. The exposures atthe very youngest and oldest ages may be too small to provide statistically significant results.
The mortality ratios for small, medium, and large amounts can all be less than 1.000 because ofthe graduation as explained above and also because the mortality rates for small, medium, andlarge amounts are only based on data for plans that provided amounts. As shown in Table 2-11, the plans that provided amounts accounted for only 40% of exposures for healthyannuitants. The overall amount-adjusted mortality rates for these plans could be less than theamount-adjusted mortality rates for all healthy annuitants.
Large amount mortality is below average at all points and small amount mortality is aboveaverage except at the older ages. For males in the 50s and early 60s, the large amount mortalityis between 18% and 41% below average and small amount mortality is between 34% and 53%above average. Large amount female mortality is between 4% and 20% below average andsmall amount female mortality is between 9% and 92% above average at ages in the 50s and60s.
Conclusion

The RPEC recommends that the individual characteristics and experience of a retirement planbe considered in selecting the mortality table. In certain cases either collar or amount may beappropriate factors to consider subject to the theoretical concerns outlined earlier in thischapter. The RPEC's research has found that both factors are statistically significant indicatorsof differences in mortality for this data set. Use of either of these indicators may beinappropriate for certain plans. In the absence of a rigorous but practical multivariate model,approximation methods could be used to reflect differences in mortality by plan.
The RPEC recognizes that for the majority of the plans subject to RPA legislation, adjustment ofthe standard mortality tables in a manner consistent with the data collection method and resultsof this study will be considerably more practical if the collar factor is used. An adjustment of thestandard mortality tables to reflect the collar factor would be to multiply the standard rates bythe adjustment factors in Tables 5-5 through 5-7.
An adjustment of the standard mortality tables to reflect the level of a plan's annuities in amanner consistent with the data collection method and results of this study would beconsiderably more complex. It would require stratification of the underlying data as well aspotential adjustments of that data for items such as retirement dates, plan formulas, and inflationlevels.
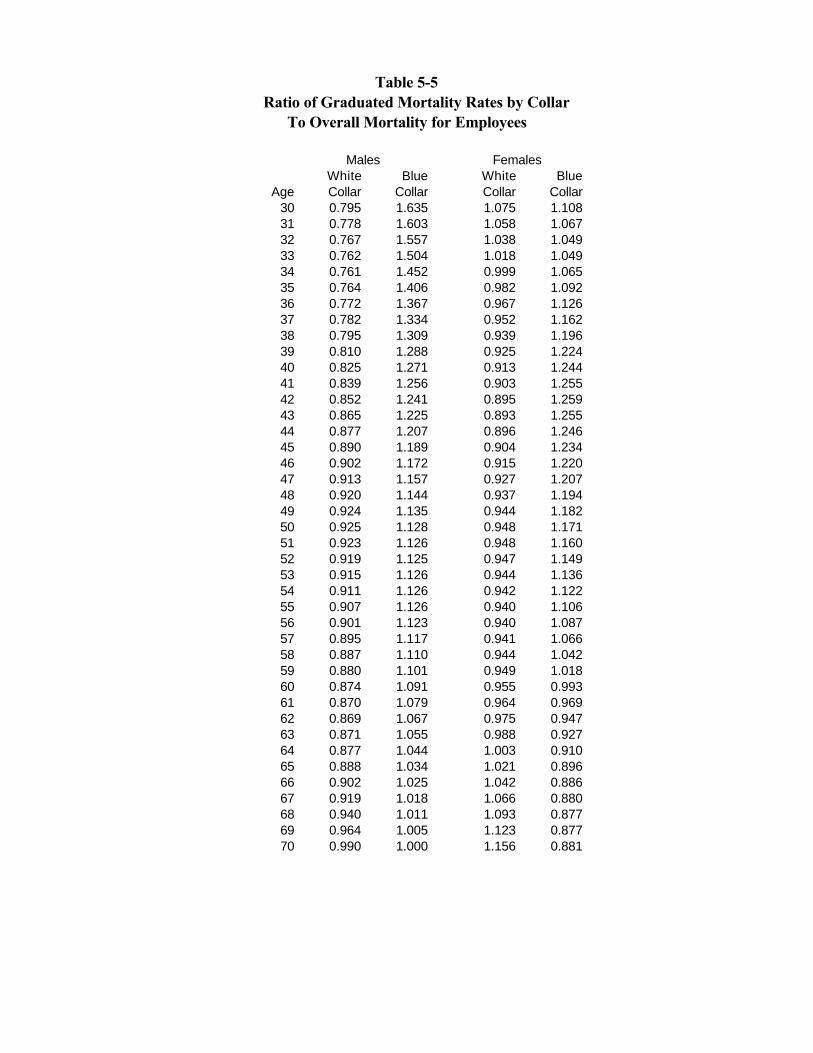
Table 5-5Ratio of Graduated Mortality Rates by Collar
To Overall Mortality for Employees
Males FemalesWhite Blue White Blue
Age Collar Collar Collar Collar30 0.795 1.635 1.075 1.10831 0.778 1.603 1.058 1.06732 0.767 1.557 1.038 1.04933 0.762 1.504 1.018 1.04934 0.761 1.452 0.999 1.06535 0.764 1.406 0.982 1.09236 0.772 1.367 0.967 1.12637 0.782 1.334 0.952 1.16238 0.795 1.309 0.939 1.19639 0.810 1.288 0.925 1.22440 0.825 1.271 0.913 1.24441 0.839 1.256 0.903 1.25542 0.852 1.241 0.895 1.25943 0.865 1.225 0.893 1.25544 0.877 1.207 0.896 1.24645 0.890 1.189 0.904 1.23446 0.902 1.172 0.915 1.22047 0.913 1.157 0.927 1.20748 0.920 1.144 0.937 1.19449 0.924 1.135 0.944 1.18250 0.925 1.128 0.948 1.17151 0.923 1.126 0.948 1.16052 0.919 1.125 0.947 1.14953 0.915 1.126 0.944 1.13654 0.911 1.126 0.942 1.12255 0.907 1.126 0.940 1.10656 0.901 1.123 0.940 1.08757 0.895 1.117 0.941 1.06658 0.887 1.110 0.944 1.04259 0.880 1.101 0.949 1.01860 0.874 1.091 0.955 0.99361 0.870 1.079 0.964 0.96962 0.869 1.067 0.975 0.94763 0.871 1.055 0.988 0.92764 0.877 1.044 1.003 0.91065 0.888 1.034 1.021 0.89666 0.902 1.025 1.042 0.88667 0.919 1.018 1.066 0.88068 0.940 1.011 1.093 0.87769 0.964 1.005 1.123 0.87770 0.990 1.000 1.156 0.881
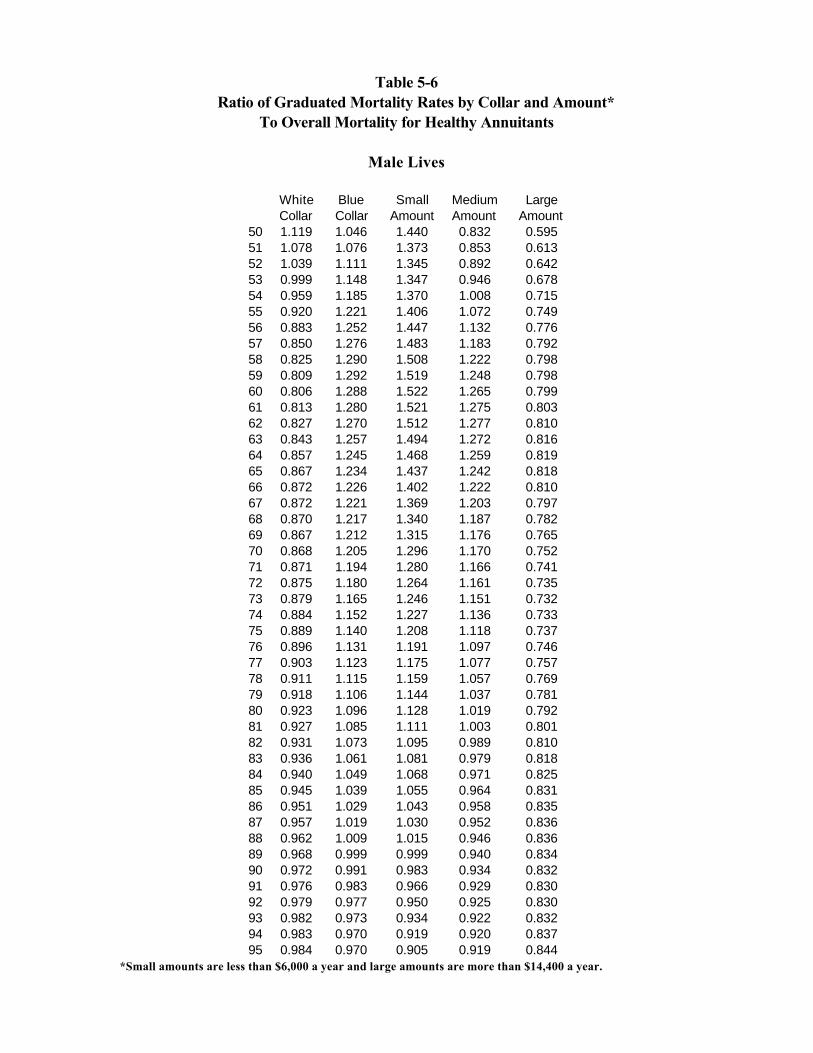
Table 5-6Ratio of Graduated Mortality Rates by Collar and Amount*
To Overall Mortality for Healthy Annuitants
Male Lives
White Blue Small Medium LargeCollar Collar Amount Amount Amount
50 1.119 1.046 1.440 0.832 0.59551 1.078 1.076 1.373 0.853 0.61352 1.039 1.111 1.345 0.892 0.64253 0.999 1.148 1.347 0.946 0.67854 0.959 1.185 1.370 1.008 0.71555 0.920 1.221 1.406 1.072 0.74956 0.883 1.252 1.447 1.132 0.77657 0.850 1.276 1.483 1.183 0.79258 0.825 1.290 1.508 1.222 0.79859 0.809 1.292 1.519 1.248 0.79860 0.806 1.288 1.522 1.265 0.79961 0.813 1.280 1.521 1.275 0.80362 0.827 1.270 1.512 1.277 0.81063 0.843 1.257 1.494 1.272 0.81664 0.857 1.245 1.468 1.259 0.81965 0.867 1.234 1.437 1.242 0.81866 0.872 1.226 1.402 1.222 0.81067 0.872 1.221 1.369 1.203 0.79768 0.870 1.217 1.340 1.187 0.78269 0.867 1.212 1.315 1.176 0.76570 0.868 1.205 1.296 1.170 0.75271 0.871 1.194 1.280 1.166 0.74172 0.875 1.180 1.264 1.161 0.73573 0.879 1.165 1.246 1.151 0.73274 0.884 1.152 1.227 1.136 0.73375 0.889 1.140 1.208 1.118 0.73776 0.896 1.131 1.191 1.097 0.74677 0.903 1.123 1.175 1.077 0.75778 0.911 1.115 1.159 1.057 0.76979 0.918 1.106 1.144 1.037 0.78180 0.923 1.096 1.128 1.019 0.79281 0.927 1.085 1.111 1.003 0.80182 0.931 1.073 1.095 0.989 0.81083 0.936 1.061 1.081 0.979 0.81884 0.940 1.049 1.068 0.971 0.82585 0.945 1.039 1.055 0.964 0.83186 0.951 1.029 1.043 0.958 0.83587 0.957 1.019 1.030 0.952 0.83688 0.962 1.009 1.015 0.946 0.83689 0.968 0.999 0.999 0.940 0.83490 0.972 0.991 0.983 0.934 0.83291 0.976 0.983 0.966 0.929 0.83092 0.979 0.977 0.950 0.925 0.83093 0.982 0.973 0.934 0.922 0.83294 0.983 0.970 0.919 0.920 0.83795 0.984 0.970 0.905 0.919 0.844
*Small amounts are less than $6,000 a year and large amounts are more than $14,400 a year.
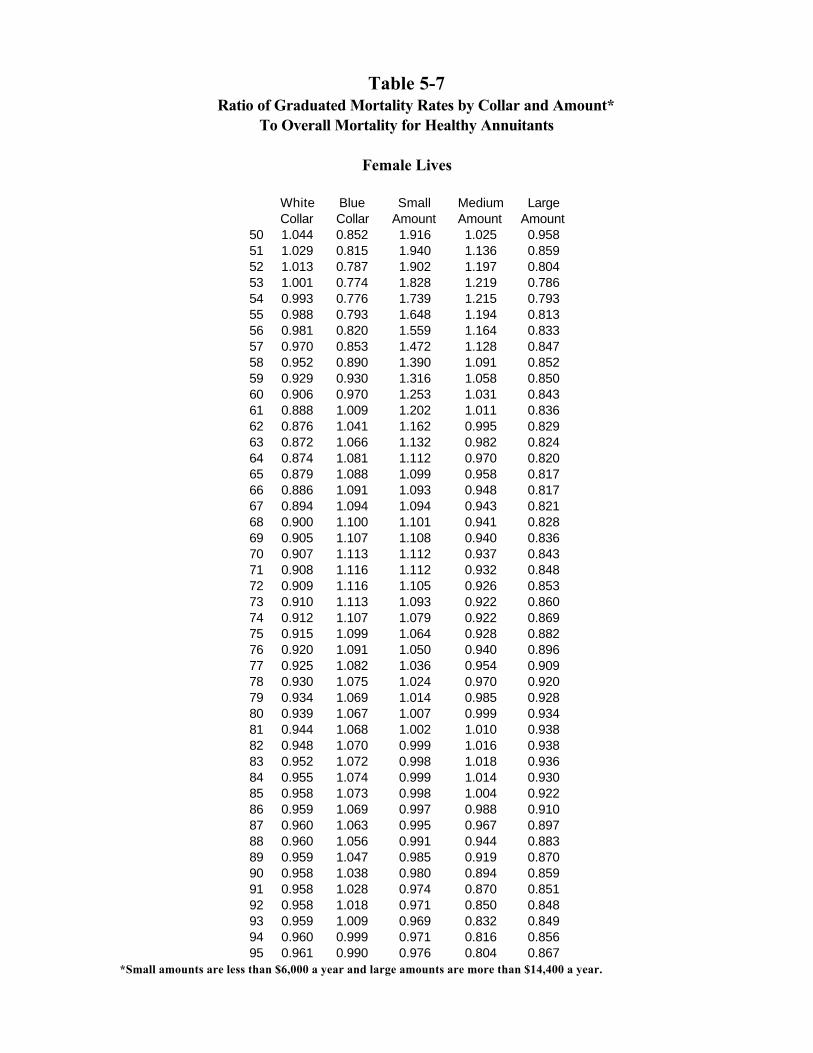
Table 5-7Ratio of Graduated Mortality Rates by Collar and Amount*
To Overall Mortality for Healthy Annuitants
Female Lives
White Blue Small Medium LargeCollar Collar Amount Amount Amount
50 1.044 0.852 1.916 1.025 0.95851 1.029 0.815 1.940 1.136 0.85952 1.013 0.787 1.902 1.197 0.80453 1.001 0.774 1.828 1.219 0.78654 0.993 0.776 1.739 1.215 0.79355 0.988 0.793 1.648 1.194 0.81356 0.981 0.820 1.559 1.164 0.83357 0.970 0.853 1.472 1.128 0.84758 0.952 0.890 1.390 1.091 0.85259 0.929 0.930 1.316 1.058 0.85060 0.906 0.970 1.253 1.031 0.84361 0.888 1.009 1.202 1.011 0.83662 0.876 1.041 1.162 0.995 0.82963 0.872 1.066 1.132 0.982 0.82464 0.874 1.081 1.112 0.970 0.82065 0.879 1.088 1.099 0.958 0.81766 0.886 1.091 1.093 0.948 0.81767 0.894 1.094 1.094 0.943 0.82168 0.900 1.100 1.101 0.941 0.82869 0.905 1.107 1.108 0.940 0.83670 0.907 1.113 1.112 0.937 0.84371 0.908 1.116 1.112 0.932 0.84872 0.909 1.116 1.105 0.926 0.85373 0.910 1.113 1.093 0.922 0.86074 0.912 1.107 1.079 0.922 0.86975 0.915 1.099 1.064 0.928 0.88276 0.920 1.091 1.050 0.940 0.89677 0.925 1.082 1.036 0.954 0.90978 0.930 1.075 1.024 0.970 0.92079 0.934 1.069 1.014 0.985 0.92880 0.939 1.067 1.007 0.999 0.93481 0.944 1.068 1.002 1.010 0.93882 0.948 1.070 0.999 1.016 0.93883 0.952 1.072 0.998 1.018 0.93684 0.955 1.074 0.999 1.014 0.93085 0.958 1.073 0.998 1.004 0.92286 0.959 1.069 0.997 0.988 0.91087 0.960 1.063 0.995 0.967 0.89788 0.960 1.056 0.991 0.944 0.88389 0.959 1.047 0.985 0.919 0.87090 0.958 1.038 0.980 0.894 0.85991 0.958 1.028 0.974 0.870 0.85192 0.958 1.018 0.971 0.850 0.84893 0.959 1.009 0.969 0.832 0.84994 0.960 0.999 0.971 0.816 0.85695 0.961 0.990 0.976 0.804 0.867
*Small amounts are less than $6,000 a year and large amounts are more than $14,400 a year.
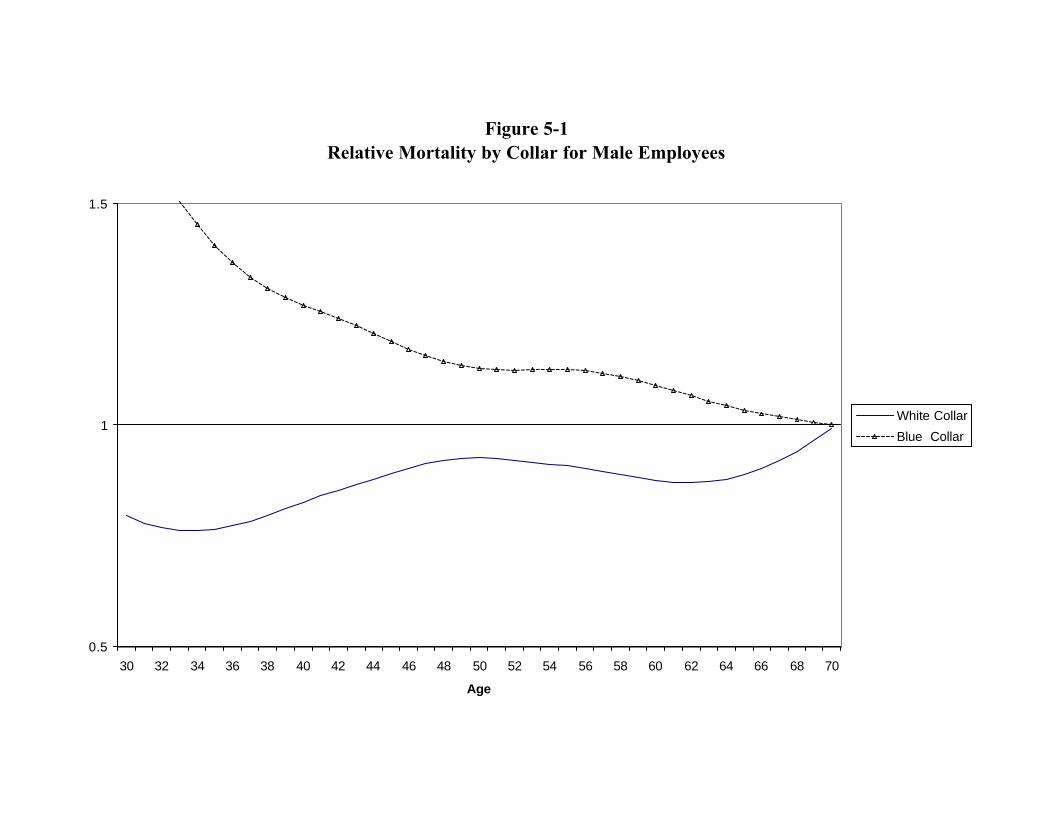
Figure 5-1Relative Mortality by Collar for Male Employees
0.5
1
1.5
30 32 34 36 38 40 42 44 46 48 50 52 54 56 58 60 62 64 66 68 70
Age
White Collar
Blue Collar
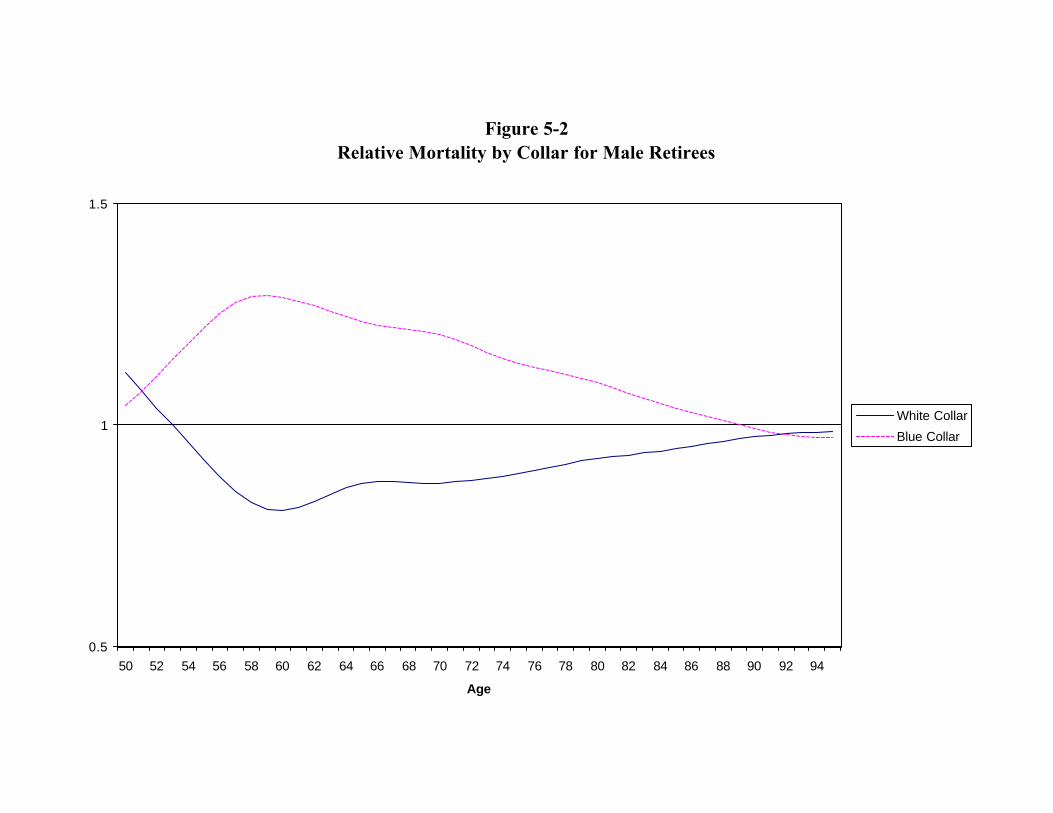
Figure 5-2Relative Mortality by Collar for Male Retirees
0.5
1
1.5
50 52 54 56 58 60 62 64 66 68 70 72 74 76 78 80 82 84 86 88 90 92 94
Age
White Collar
Blue Collar
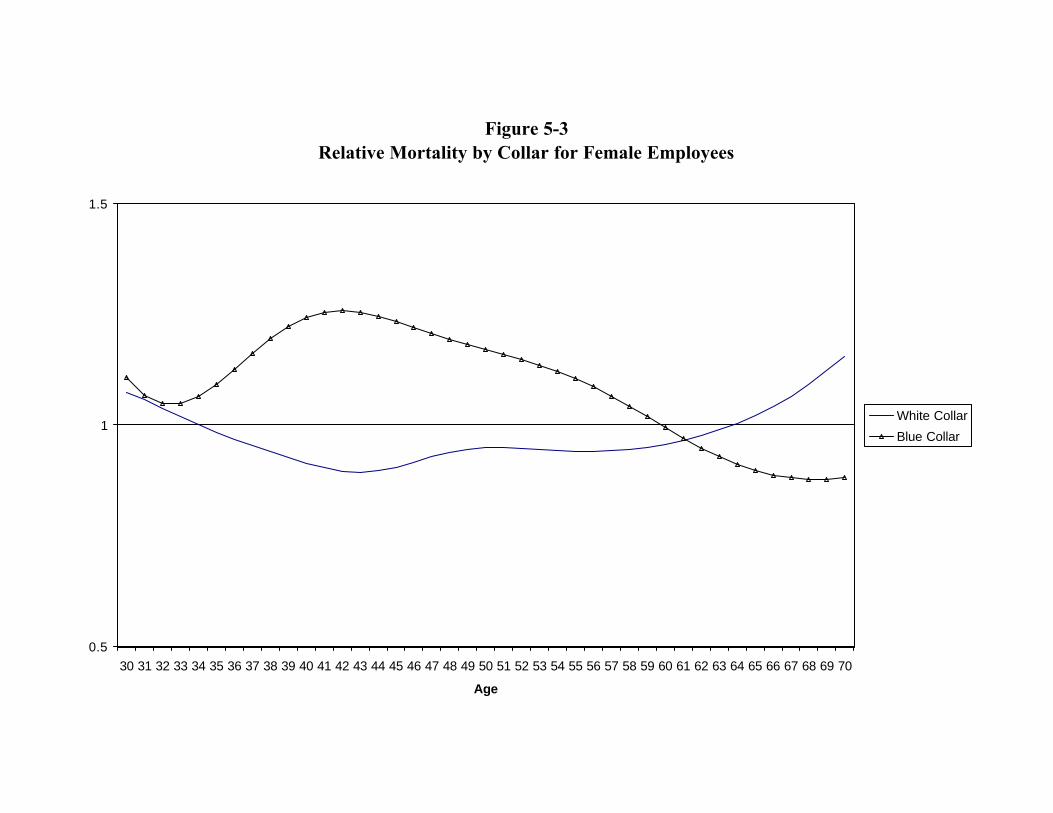
Figure 5-3Relative Mortality by Collar for Female Employees
0.5
1
1.5
30 31 32 33 34 35 36 37 38 39 40 41 42 43 44 45 46 47 48 49 50 51 52 53 54 55 56 57 58 59 60 61 62 63 64 65 66 67 68 69 70
Age
White Collar
Blue Collar
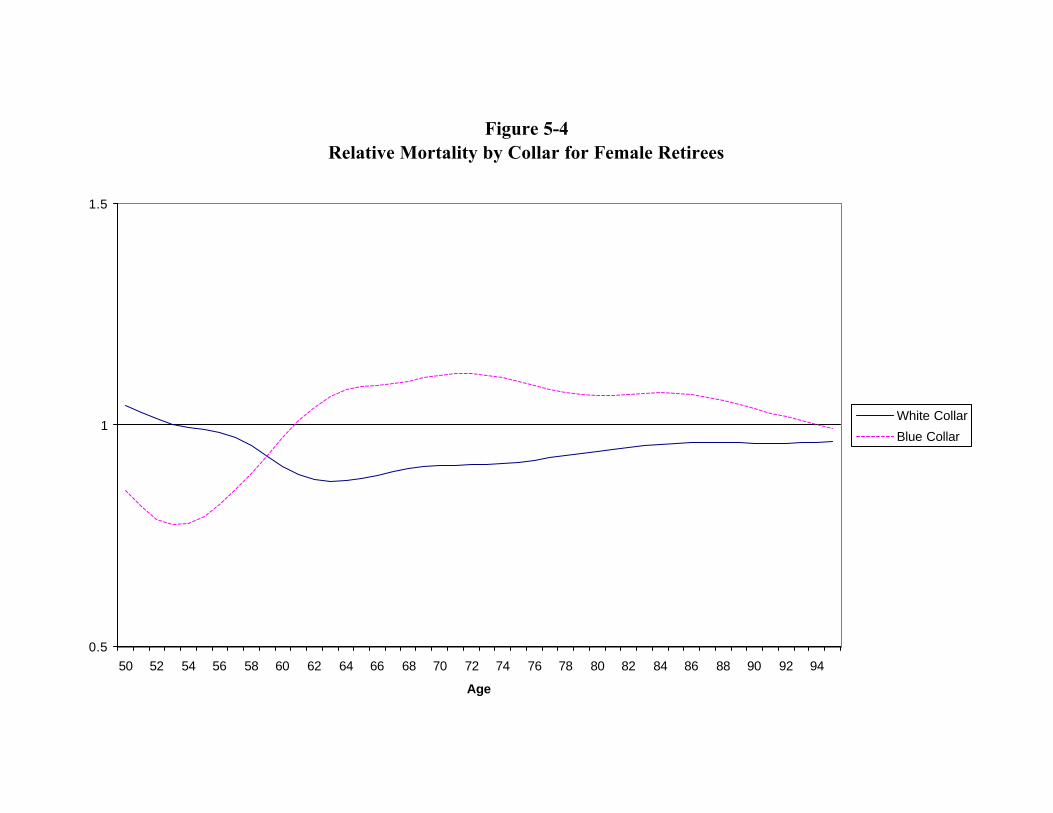
Figure 5-4Relative Mortality by Collar for Female Retirees
0.5
1
1.5
50 52 54 56 58 60 62 64 66 68 70 72 74 76 78 80 82 84 86 88 90 92 94
Age
White Collar
Blue Collar
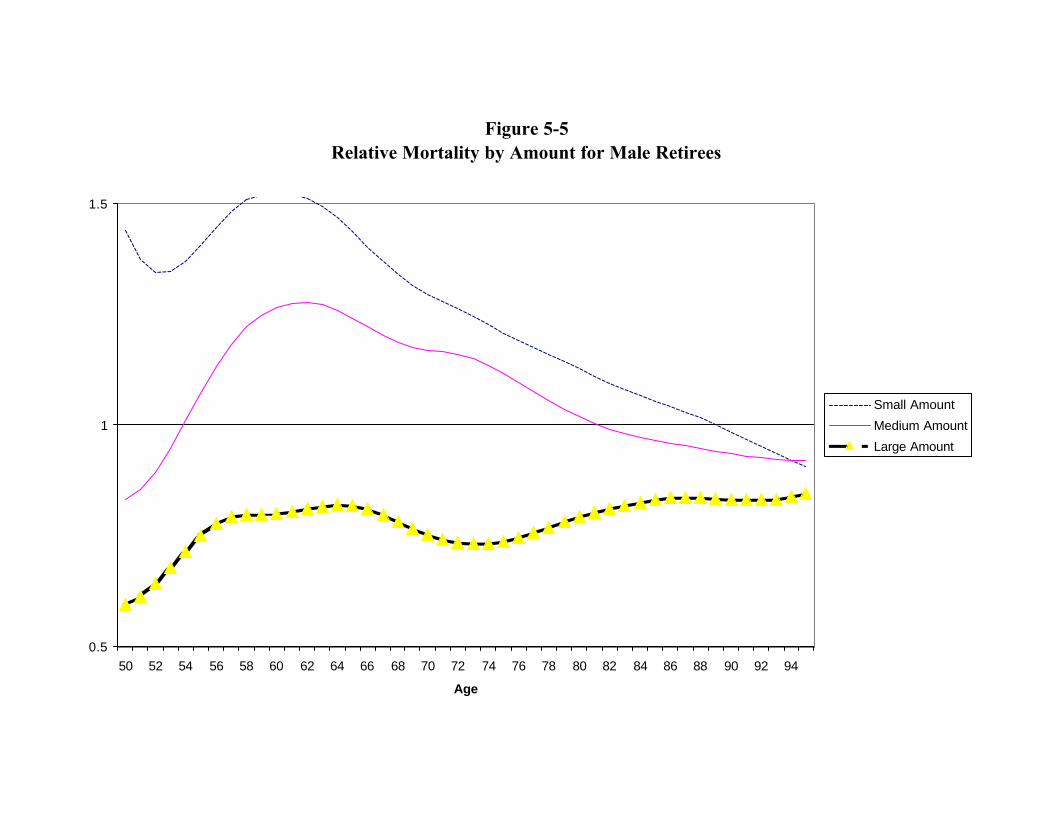
Figure 5-5Relative Mortality by Amount for Male Retirees
0.5
1
1.5
50 52 54 56 58 60 62 64 66 68 70 72 74 76 78 80 82 84 86 88 90 92 94
Age
Small Amount
Medium Amount
Large Amount
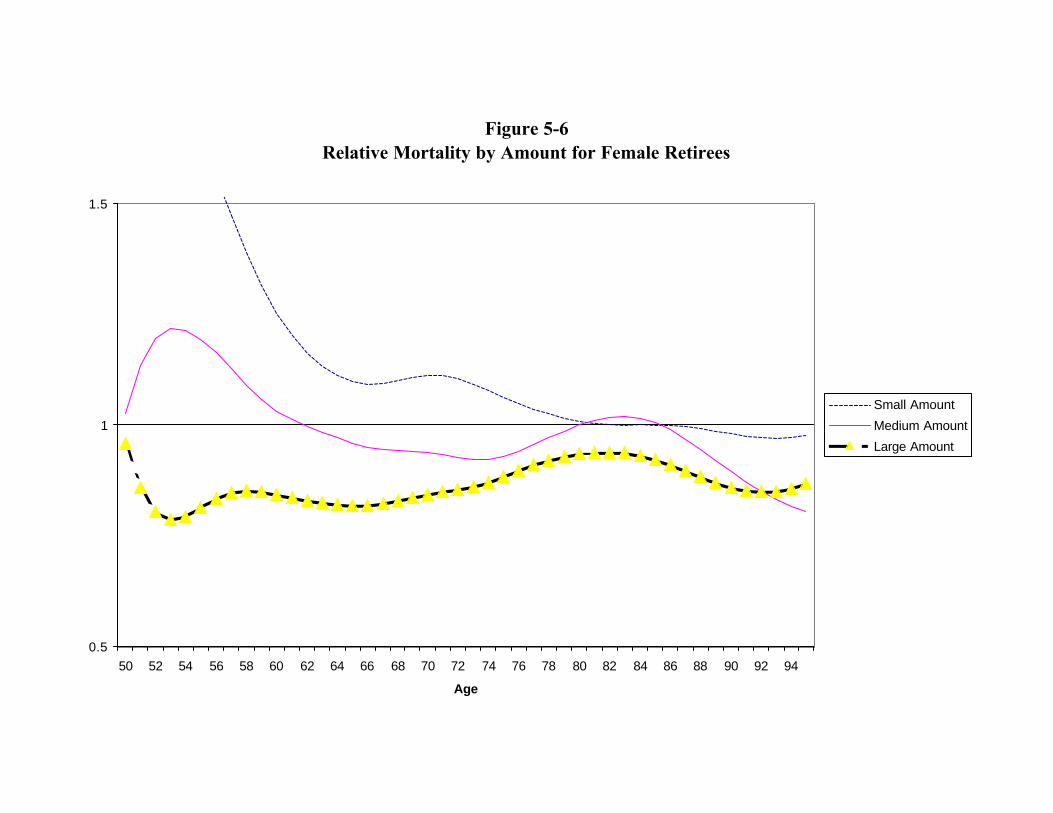
Figure 5-6Relative Mortality by Amount for Female Retirees
0.5
1
1.5
50 52 54 56 58 60 62 64 66 68 70 72 74 76 78 80 82 84 86 88 90 92 94
Age
Small Amount
Medium Amount
Large Amount

Chapter 6 - Differences in Mortality Rates by Plan within Industry
The RPEC also investigated the question of whether or not plans in the same industry couldhave significantly different mortality. Statistically significant differences were found betweenplans in each of four industries investigated. These differences could not be explained by thecollar types of the plans or any other available variables. Due to the confidentiality agreementswith the data contributors, this investigation was done by Society of Actuaries (SoA) staff.
Process
SoA staff extracted the data for four SIC codes from the database collected for the PensionPlan Mortality Study: 3710 (motor vehicle manufacturing), 3725 (aircraft and missilemanufacturing), 4210 (trucking), and 4825 (telephone, telegraph, and other communicationsservices). These SIC codes were selected because each of them included data from at leasttwo very large employers. SoA staff reassembled the data for the auto manufacturers into sixplans, a blue collar and a white collar plan for each of the Big Three. The resulting dataset had23 plans with the number of plans in each industry varying from two to eleven. All 23 planswere clearly identified as either white collar or blue collar; there were no mixed collar plans inthis dataset.
For each industry the exposures and deaths were summed by age, gender, and participantstatus (healthy annuitants, employees, and disabled) to create six raw mortality tables. Theexposures and deaths for each industry were also subtotaled by collar type, resulting in 18 rawexperience mortality tables for each industry. No attempt was made to graduate the 72 rawtables in any way.
The mortality experience of each plan was then compared to the average experience for its ownindustry. Expected deaths were calculated by applying the raw qx values from the appropriateraw experience mortality tables to the exposures of the plan by gender and participant status.The variance of the expected deaths at each age was calculated by multiplying the expecteddeaths by the corresponding value of px. The expected deaths and their variance were summedfor each plan, with subtotals by gender and participant status. This process was repeated usingthe collar-specific raw experience mortality tables for the industry instead of the overall averageraw experience mortality tables for the industry.
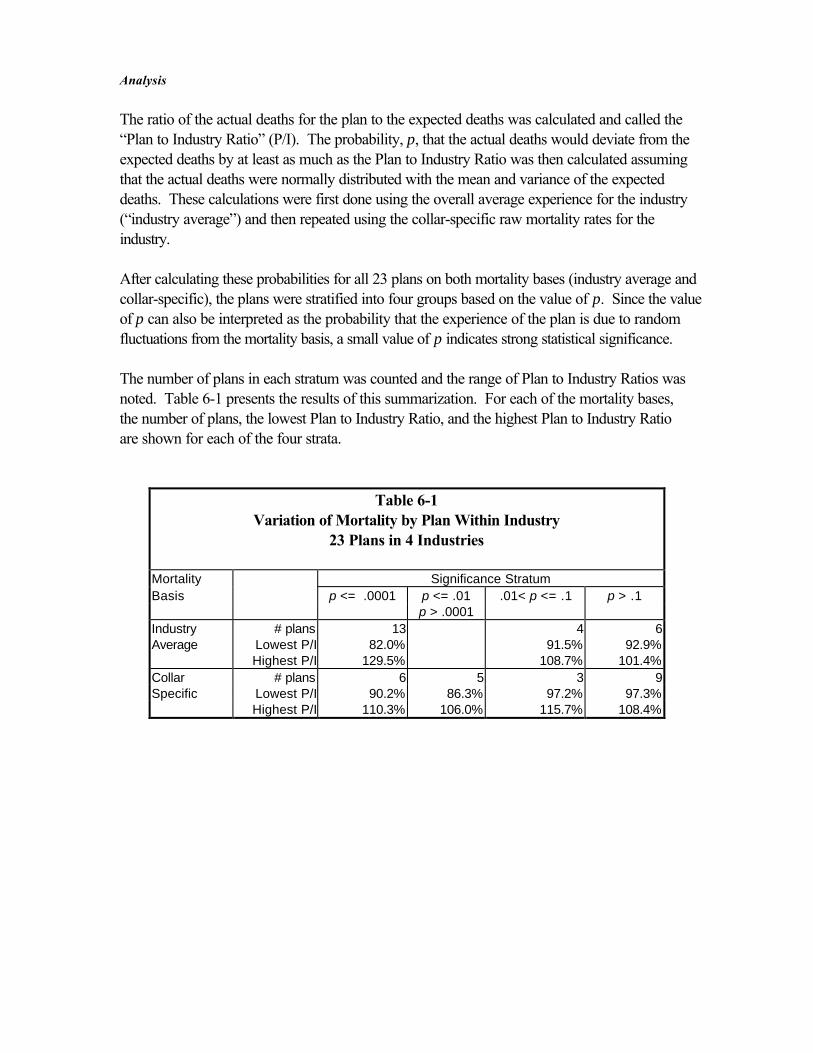
Analysis
The ratio of the actual deaths for the plan to the expected deaths was calculated and called the“Plan to Industry Ratio” (P/I). The probability, p, that the actual deaths would deviate from theexpected deaths by at least as much as the Plan to Industry Ratio was then calculated assumingthat the actual deaths were normally distributed with the mean and variance of the expecteddeaths. These calculations were first done using the overall average experience for the industry(“industry average”) and then repeated using the collar-specific raw mortality rates for theindustry.
After calculating these probabilities for all 23 plans on both mortality bases (industry average andcollar-specific), the plans were stratified into four groups based on the value of p. Since the valueof p can also be interpreted as the probability that the experience of the plan is due to randomfluctuations from the mortality basis, a small value of p indicates strong statistical significance.
The number of plans in each stratum was counted and the range of Plan to Industry Ratios wasnoted. Table 6-1 presents the results of this summarization. For each of the mortality bases,the number of plans, the lowest Plan to Industry Ratio, and the highest Plan to Industry Ratioare shown for each of the four strata.
Table 6-1Variation of Mortality by Plan Within Industry
23 Plans in 4 Industries
Mortality Significance StratumBasis p <= .0001 p <= .01 .01< p <= .1 p > .1
p > .0001Industry # plans 13 4 6Average Lowest P/I 82.0% 91.5% 92.9%
Highest P/I 129.5% 108.7% 101.4%Collar # plans 6 5 3 9Specific Lowest P/I 90.2% 86.3% 97.2% 97.3%
Highest P/I 110.3% 106.0% 115.7% 108.4%

It is worth noting here that these calculations assumed that the raw experience mortality tablesrepresent the true underlying mortality for each plan. In fact these raw experience mortalitytables are actually only estimates of the true underlying mortality. For any given plan, theexperience of the plan was combined with the experience of other plans from the same industryto calculate this estimate of the true underlying mortality. This results in “overfitting” the modelto the data. Therefore, the calculations tend to overstate the probability that actual deathswould deviate from expected by as much as it did and therefore understate the statisticalsignificance of the difference.
Table 6-1 shows that there is less than a 10% probability that the mortality experience of 17 ofthe 23 plans was due to random fluctuations from the industry average. For 13 of these plans,the probability of the differences being random was less than 0.01%. Even when collar-specificraw experience mortality tables are used, for 14 of the 23 plans the probability that thedifferences are purely random is less than 10% and for 6 of the plans this probability is less than0.01%. Using collar-specific tables narrows the range of Plan to Industry Ratios from 82-130% to 86-116%.
This provides very strong evidence that mortality does vary substantially by plan within industry,and that this variation is not purely random. Even mortality tables that are specific for the collartype and industry of the plan are unlikely to match the true underlying mortality of the plan.
Effect of Size of Annuity
Most of the plans in this extract did not provide information on annuity amounts. However, inone of the industries there were nine plans (five white collar, four blue collar) that providedcomplete information on annuity amounts. For this industry, the exposures and deaths ofannuitants from these plans were subtotaled by annuity size group (small, medium, and large)and the healthy annuitants were separated into beneficiaries and retirees. This resulted in arefined mortality basis for comparing the experience of the plans. The mean and variance of theexpected deaths for these plans were then calculated using these refined raw experiencemortality tables. The results of this analysis are shown in Table 6-2.
The comments made above concerning “overfitting” apply here as well, and the magnitude ofthe potential overstatement of p is even greater. Furthermore the difference between actual andexpected deaths on the industry average basis was significant for only four of the nine plans inthis extract. Therefore, the fact that two of these nine plans show significant differencesbetween actual and expected deaths on this refined “fully adjusted” basis is noteworthy.
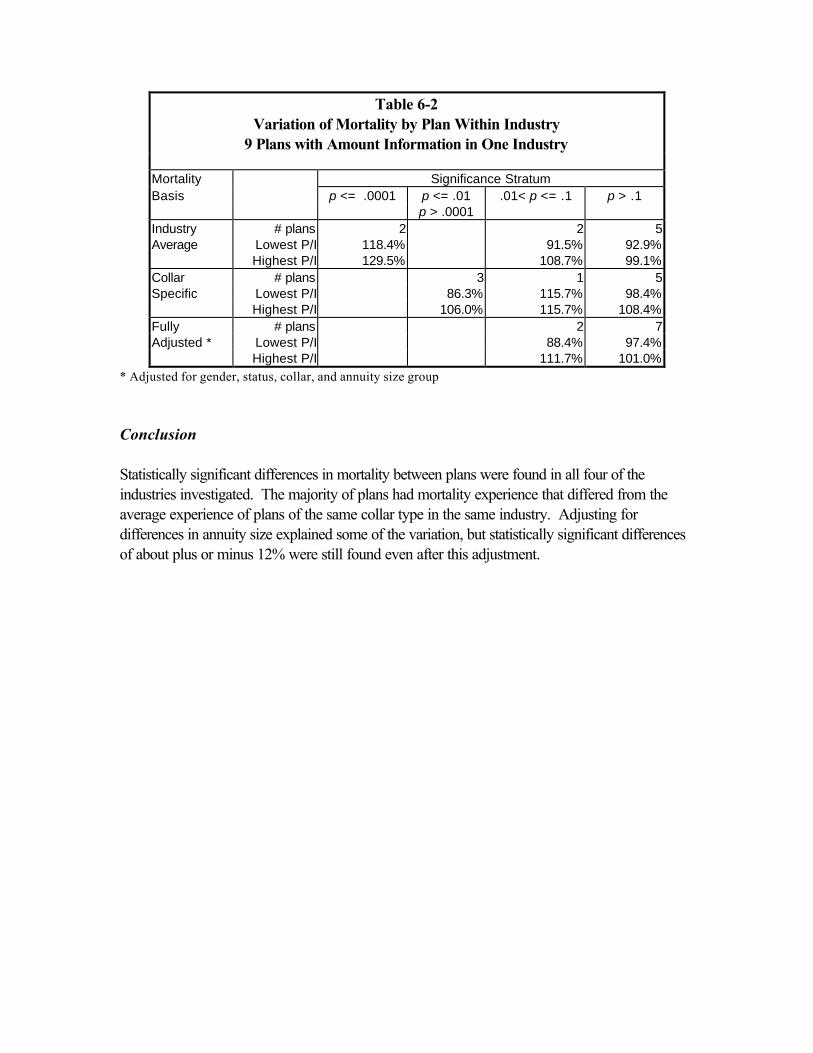
Table 6-2Variation of Mortality by Plan Within Industry
9 Plans with Amount Information in One Industry
Mortality Significance StratumBasis p <= .0001 p <= .01 .01< p <= .1 p > .1
p > .0001Industry # plans 2 2 5Average Lowest P/I 118.4% 91.5% 92.9%
Highest P/I 129.5% 108.7% 99.1%Collar # plans 3 1 5Specific Lowest P/I 86.3% 115.7% 98.4%
Highest P/I 106.0% 115.7% 108.4%Fully # plans 2 7Adjusted * Lowest P/I 88.4% 97.4%
Highest P/I 111.7% 101.0%* Adjusted for gender, status, collar, and annuity size group
Conclusion
Statistically significant differences in mortality between plans were found in all four of theindustries investigated. The majority of plans had mortality experience that differed from theaverage experience of plans of the same collar type in the same industry. Adjusting fordifferences in annuity size explained some of the variation, but statistically significant differencesof about plus or minus 12% were still found even after this adjustment.

Chapter 7 - Projections of Mortality Improvement after 2000
Chapter 4 discusses short term projection to the year 2000 based on recent experience. Thischapter discusses projection beyond the year 2000 based on long-term experience. Thus theimprovement factors observed and recommended in Chapter 4 are different from theimprovement factors observed and recommended in this chapter.
Data Sources
The RPEC examined available data on long term trends in non-disabled mortality rates fromfour sources as bases for projecting future mortality improvements. These trends werecompared with Scale AA which had been used to create the GAR-94 generational tables andrecommended by the UP-94 Committee for projections of mortality from the basic tables. Theresults, shown in Table 7-1, are from the following sources:
• Federal Civil Service healthy retiree mortality, 1980 through 1997
• Social Security, all lives, 1980 through 1994
• Railroad Retirement healthy annuitant mortality, 1979 through 1994
• Healthy annuitant and employee mortality from the SoA group annuity mortalitystudies, 1981 through 1994, based on number of lives
• Healthy annuitant and employee mortality from the SoA group annuity mortalitystudies, 1981 through 1994, based on amount of benefits
• Scale AA
The Social Security, Railroad Retirement, and SoA group annuity mortality study trends werecomputed directly using the data for each five-year age group. The underlying Federal CivilService improvement trends were for individual ages, but were averaged into five-year agegroups using a weighted average of the trends for individual ages, where the weights are theexpected deaths at the individual ages using Federal Civil Service mortality rates and exposures.Scale AA trend rates were averaged into 5 year age groups beginning at age 20 using aweighted average of the trends for individual ages, where the weights are the number of deathsthat would occur for a closed group under the UP-94 mortality table.
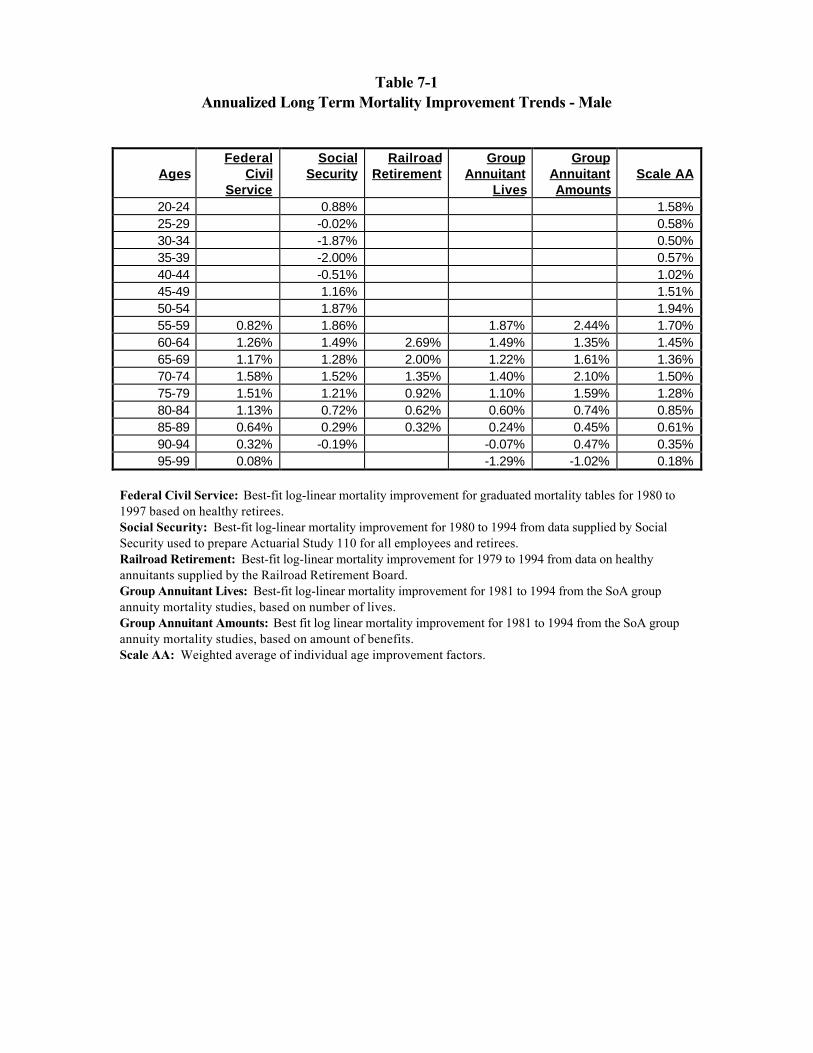
Table 7-1Annualized Long Term Mortality Improvement Trends - Male
AgesFederal
CivilService
SocialSecurity
RailroadRetirement
GroupAnnuitant
Lives
GroupAnnuitantAmounts
Scale AA
20-24 0.88% 1.58%25-29 -0.02% 0.58%30-34 -1.87% 0.50%35-39 -2.00% 0.57%40-44 -0.51% 1.02%45-49 1.16% 1.51%50-54 1.87% 1.94%55-59 0.82% 1.86% 1.87% 2.44% 1.70%60-64 1.26% 1.49% 2.69% 1.49% 1.35% 1.45%65-69 1.17% 1.28% 2.00% 1.22% 1.61% 1.36%70-74 1.58% 1.52% 1.35% 1.40% 2.10% 1.50%75-79 1.51% 1.21% 0.92% 1.10% 1.59% 1.28%80-84 1.13% 0.72% 0.62% 0.60% 0.74% 0.85%85-89 0.64% 0.29% 0.32% 0.24% 0.45% 0.61%90-94 0.32% -0.19% -0.07% 0.47% 0.35%95-99 0.08% -1.29% -1.02% 0.18%
Federal Civil Service: Best-fit log-linear mortality improvement for graduated mortality tables for 1980 to1997 based on healthy retirees.Social Security: Best-fit log-linear mortality improvement for 1980 to 1994 from data supplied by SocialSecurity used to prepare Actuarial Study 110 for all employees and retirees.Railroad Retirement: Best-fit log-linear mortality improvement for 1979 to 1994 from data on healthyannuitants supplied by the Railroad Retirement Board.Group Annuitant Lives: Best-fit log-linear mortality improvement for 1981 to 1994 from the SoA groupannuity mortality studies, based on number of lives.Group Annuitant Amounts: Best fit log linear mortality improvement for 1981 to 1994 from the SoA groupannuity mortality studies, based on amount of benefits.Scale AA: Weighted average of individual age improvement factors.
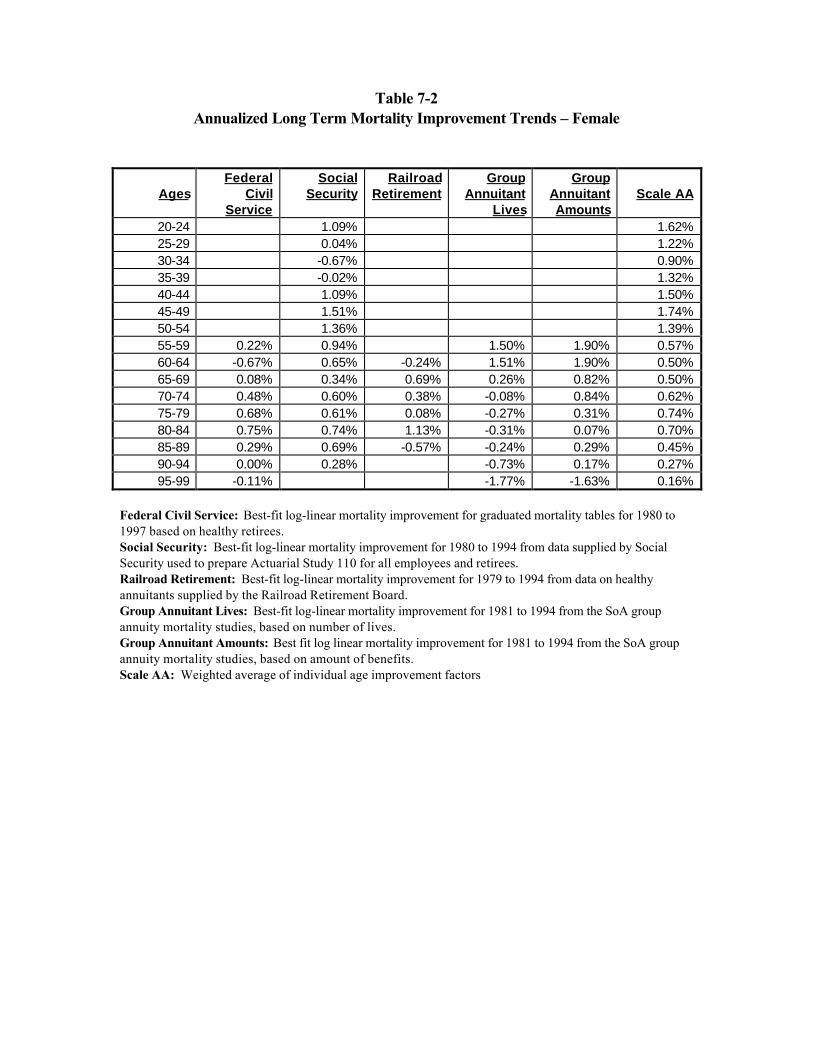
Table 7-2Annualized Long Term Mortality Improvement Trends – Female
AgesFederal
CivilService
SocialSecurity
RailroadRetirement
GroupAnnuitant
Lives
GroupAnnuitantAmounts
Scale AA
20-24 1.09% 1.62%25-29 0.04% 1.22%30-34 -0.67% 0.90%35-39 -0.02% 1.32%40-44 1.09% 1.50%45-49 1.51% 1.74%50-54 1.36% 1.39%55-59 0.22% 0.94% 1.50% 1.90% 0.57%60-64 -0.67% 0.65% -0.24% 1.51% 1.90% 0.50%65-69 0.08% 0.34% 0.69% 0.26% 0.82% 0.50%70-74 0.48% 0.60% 0.38% -0.08% 0.84% 0.62%75-79 0.68% 0.61% 0.08% -0.27% 0.31% 0.74%80-84 0.75% 0.74% 1.13% -0.31% 0.07% 0.70%85-89 0.29% 0.69% -0.57% -0.24% 0.29% 0.45%90-94 0.00% 0.28% -0.73% 0.17% 0.27%95-99 -0.11% -1.77% -1.63% 0.16%
Federal Civil Service: Best-fit log-linear mortality improvement for graduated mortality tables for 1980 to1997 based on healthy retirees.Social Security: Best-fit log-linear mortality improvement for 1980 to 1994 from data supplied by SocialSecurity used to prepare Actuarial Study 110 for all employees and retirees.Railroad Retirement: Best-fit log-linear mortality improvement for 1979 to 1994 from data on healthyannuitants supplied by the Railroad Retirement Board.Group Annuitant Lives: Best-fit log-linear mortality improvement for 1981 to 1994 from the SoA groupannuity mortality studies, based on number of lives.Group Annuitant Amounts: Best fit log linear mortality improvement for 1981 to 1994 from the SoA groupannuity mortality studies, based on amount of benefits.Scale AA: Weighted average of individual age improvement factors

Scale AA had been based on a blend of Federal Civil Service and Social Security experiencefrom 1977 through 1993, with the following adjustments in addition to smoothing the trends:
• A minimum improvement trend of 0.5 percent per year before age 85.• A maximum improvement trend of 2.0 percent per year.• Trend graded to 0.1 percent at age 100
The RPEC noted that Scale AA mortality improvement trends are close to the Social Securitytrends and reasonably consistent with the data for the other groups. The RPEC questioned thevalidity of a trend greater than zero at ages older than 95, but decided that the data were toolimited to make an accurate assessment at these ages. While minor adjustments could havebeen made, the RPEC concluded that these adjustments were not significant enough to justify anew mortality improvement scale, especially since Scale AA was fairly new. Scale AA isreproduced on the next page as Table 7-3.
The RPEC recommends that, in view of the long history of improvement in non-disabledmortality rates in all of these sets of data, pension valuations should take trends in long termmortality improvement into account. From a theoretical standpoint, the RPEC believes that theuse of generational mortality improvement, as in the GAR-94 table, is an appropriate way ofreflecting this improvement. In cases where it is not material or cost effective to incorporategenerational mortality improvement into a calculation, the actuary should project mortalityimprovement on a comparable static basis.
The production of a generational table is performed by selecting values from a series of statictables. The static table for year 2000 is the base table shown in this report. The static table foryear 2001 is the base table projected one year by Scale AA, and so forth. Mortality rates areselected from the series of static tables based on the year in which an individual reaches thespecified age. For example, the mortality rate for an annuitant reaching age 80 in 2010 wouldbe the rate defined by those two parameters. A fuller explanation of the generational mortalityprocess can be found in the report on the 1994 Group Annuity Mortality Table and 1994Group Annuity Reserving Table in Volume XLVII of the Transactions of the Society ofActuaries.
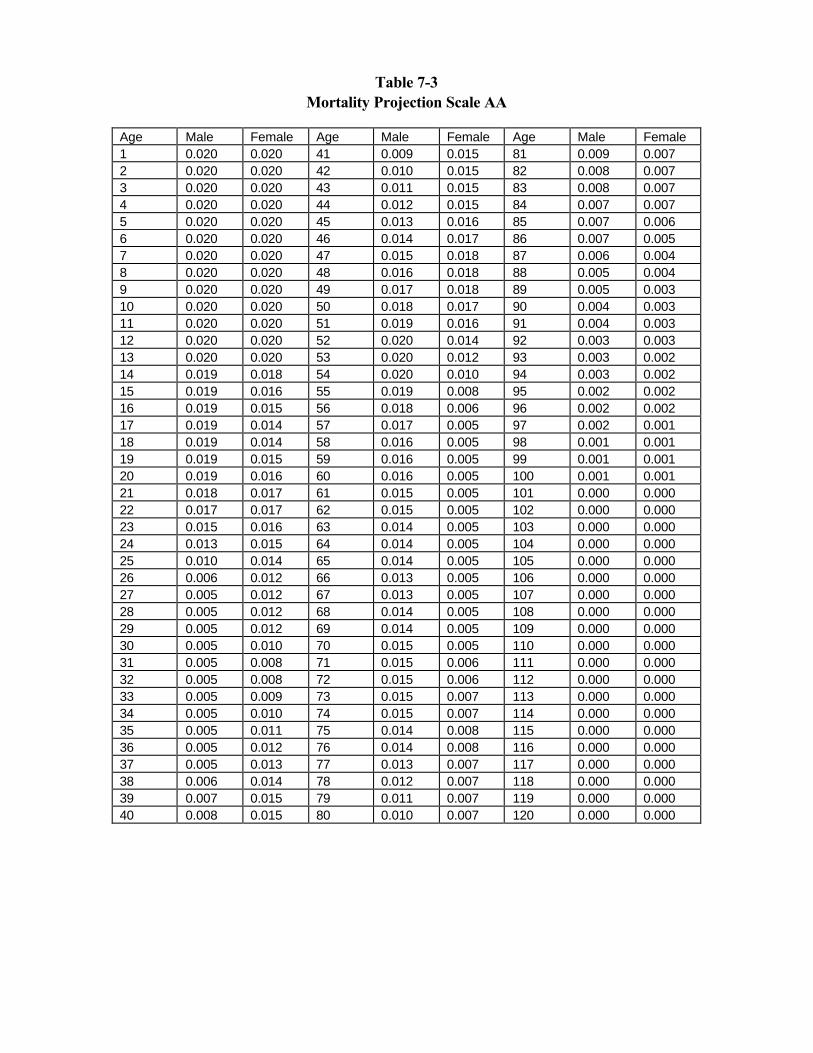
Table 7-3Mortality Projection Scale AA
Age Male Female Age Male Female Age Male Female1 0.020 0.020 41 0.009 0.015 81 0.009 0.0072 0.020 0.020 42 0.010 0.015 82 0.008 0.0073 0.020 0.020 43 0.011 0.015 83 0.008 0.0074 0.020 0.020 44 0.012 0.015 84 0.007 0.0075 0.020 0.020 45 0.013 0.016 85 0.007 0.0066 0.020 0.020 46 0.014 0.017 86 0.007 0.0057 0.020 0.020 47 0.015 0.018 87 0.006 0.0048 0.020 0.020 48 0.016 0.018 88 0.005 0.0049 0.020 0.020 49 0.017 0.018 89 0.005 0.00310 0.020 0.020 50 0.018 0.017 90 0.004 0.00311 0.020 0.020 51 0.019 0.016 91 0.004 0.00312 0.020 0.020 52 0.020 0.014 92 0.003 0.00313 0.020 0.020 53 0.020 0.012 93 0.003 0.00214 0.019 0.018 54 0.020 0.010 94 0.003 0.00215 0.019 0.016 55 0.019 0.008 95 0.002 0.00216 0.019 0.015 56 0.018 0.006 96 0.002 0.00217 0.019 0.014 57 0.017 0.005 97 0.002 0.00118 0.019 0.014 58 0.016 0.005 98 0.001 0.00119 0.019 0.015 59 0.016 0.005 99 0.001 0.00120 0.019 0.016 60 0.016 0.005 100 0.001 0.00121 0.018 0.017 61 0.015 0.005 101 0.000 0.00022 0.017 0.017 62 0.015 0.005 102 0.000 0.00023 0.015 0.016 63 0.014 0.005 103 0.000 0.00024 0.013 0.015 64 0.014 0.005 104 0.000 0.00025 0.010 0.014 65 0.014 0.005 105 0.000 0.00026 0.006 0.012 66 0.013 0.005 106 0.000 0.00027 0.005 0.012 67 0.013 0.005 107 0.000 0.00028 0.005 0.012 68 0.014 0.005 108 0.000 0.00029 0.005 0.012 69 0.014 0.005 109 0.000 0.00030 0.005 0.010 70 0.015 0.005 110 0.000 0.00031 0.005 0.008 71 0.015 0.006 111 0.000 0.00032 0.005 0.008 72 0.015 0.006 112 0.000 0.00033 0.005 0.009 73 0.015 0.007 113 0.000 0.00034 0.005 0.010 74 0.015 0.007 114 0.000 0.00035 0.005 0.011 75 0.014 0.008 115 0.000 0.00036 0.005 0.012 76 0.014 0.008 116 0.000 0.00037 0.005 0.013 77 0.013 0.007 117 0.000 0.00038 0.006 0.014 78 0.012 0.007 118 0.000 0.00039 0.007 0.015 79 0.011 0.007 119 0.000 0.00040 0.008 0.015 80 0.010 0.007 120 0.000 0.000

Approximation of Generational Mortality
One method for approximating the effect of full generational mortality improvement is to projectthe current table for a specified number of years and use the resulting table without furtherprojection. In order to arrive at a similar liability amount, the number of years of projection isapproximately equal to (a) the years to the valuation date plus (b) the duration of the liabilities.The “duration” of the liabilities is the negative of the first derivative of the liability with respect tothe valuation interest rate, divided by the liability. It can be approximated by the followingformula:
Duration ≈ pvb(i) - pvb(i+.001), pvb(i) x .001
where pvb(i) is the present value of benefits at the valuation interest rate i, and pvb(i+.001) isthe present value of benefits determined with the interest rate increased by one-tenth of onepercentage point, that is, by ten basis points. This calculation should be done separately formale and female.
While a direct theoretical connection between duration of liabilities and mortality projectionunder Scale AA has not been established, the duration of liabilities for different plans moves inthe same direction as the years for projecting mortality. For example, if participants are youngwith mainly deferred annuities, the duration will be higher than for an older, longer-servicegroup. This corresponds to the additional number of years of mortality improvement that ayounger group will experience before receiving benefits. Similarly, a retired group withimmediate annuity payments will not experience as many years of mortality improvement as anemployee group.
The effect of future mortality will also vary inversely with the investment return rate. In a lowinterest environment, the impact of future mortality improvement is greater, due to smallerdiscounts for deferred payments. On the other hand, increasing payments, such as under anautomatic COLA plan or post-retirement medical plan, greatly increase the effect of mortalityimprovement.
When projecting the RP-2000 base table using Scale AA, use of this approximation techniqueinvolving duration generally results in present values that are within 0.5 percent of the valuesusing full generational mortality improvement. Although this particular approximation techniqueworks fairly well for Scale AA, it may not be as accurate for other mortality improvementscales, or for populations with very unusual age distributions.
Use of this static projection method would normally result in the need to project the mortalitytable a different number of years each time the valuation is performed. To avoid this, it wouldbe appropriate for the actuary to consider how long the table is expected to be in use after2000, and, for purposes of the static projection, to assume a valuation date that is the midpointof this period.

For example, suppose that a valuation is done each year for a group of retired lives, where theduration of liabilities is 7 years. Assume that the actuary expects to use the RP-2000 Table forvaluations to be done in the years 2001 through 2005. The midpoint of this period is 2003,which is three years beyond 2000. Assuming that the composition of the group is not expectedto change significantly over this period, the duration of liabilities would remain about the same.The RP-2000 Table could be projected on a static basis for the duration of seven years plus thethree years period, or a total of ten years, and this projected table would then be used for thevaluations for each year, 2001 through 2005. Appendix G contains a projection of the RP-2000 table for ten years using Scale AA.
April 25, 2001 P. 68B
Chapter 8 - Comparison of RP-2000 to Other Tables
Comparison to GAM-83 and UP-94 Tables
Tables 8-1 through 8-3 compare annuity values at ten-year age intervals from age 30 to age 90,and at age 65, for the GAM-83, UP-94 without projection, UP-94 projected to 2000, and the RP-2000 with and without projection. Tables 8-1A through 8-3A use the RP2000 combined healthytable. Tables 8-1B through 8-3B use the RP-2000 employee table for ages below 65 and thehealthy annuitant tables for ages 65 and older. The lower section of each table gives thepercentage change in the annuity values if the mortality assumption for non-disabled lives waschanged to the RP-2000 table without projection. Comparisons are also made between the RP-2000 without projection and the RP-2000 with generational projection. The annuities in the tableare annuities due, paid monthly. Before age 65, the annuities are deferred to age 65. At andabove age 65, the annuities are immediate. Values are presented at 5, 7, and 9 percent interestrates.
In general, the RP-2000 values are between 2 and 11 percent higher for males and between 3 and5 percent lower for females than the GAM-83 values. The RP-2000 values for males under age80 are within 4 percent of the values based on the UP-94 table projected to 2000. For males atages 80 and 90 the RP-2000 values are substantially lower than the projected UP-94 values. Forfemales the RP-2000 values are lower than the projected UP-94 values by about 2 to 4 percent.On average, the male mortality experience used to develop the RP-2000 Table is similar to thatof the UP-94 table with projection Scale AA. The female mortality is higher than the projectedUP-94 table. This suggests that the mortality improvement predicted by Scale AA between themid-point of the two female tables did not occur.
The GAM-83 table included a 10 percent margin for mortality improvement so the differencesbetween GAM-83 and RP-2000 are lower than would be produced by applying the full mortalityimprovement for the 17 years between the two tables. Also, the GAM-83 female mortality rateswere estimated based on relatively little actual experience so these are not as comparable to theRP-2000 tables as are the male rates.
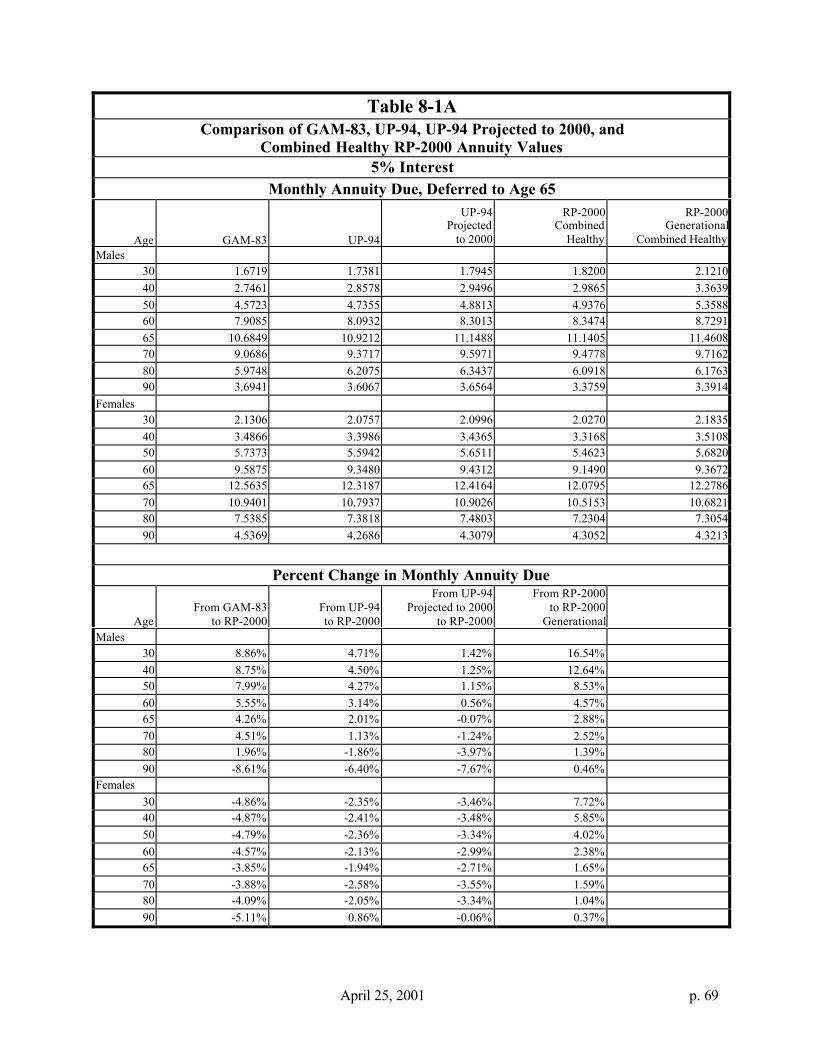
April 25, 2001 p. 69
Table 8-1AComparison of GAM-83, UP-94, UP-94 Projected to 2000, and
Combined Healthy RP-2000 Annuity Values5% Interest
Monthly Annuity Due, Deferred to Age 65
Age GAM-83 UP-94
UP-94Projected to 2000
RP-2000Combined
Healthy
RP-2000Generational
Combined HealthyMales
30 1.6719 1.7381 1.7945 1.8200 2.121040 2.7461 2.8578 2.9496 2.9865 3.363950 4.5723 4.7355 4.8813 4.9376 5.358860 7.9085 8.0932 8.3013 8.3474 8.729165 10.6849 10.9212 11.1488 11.1405 11.460870 9.0686 9.3717 9.5971 9.4778 9.716280 5.9748 6.2075 6.3437 6.0918 6.176390 3.6941 3.6067 3.6564 3.3759 3.3914
Females30 2.1306 2.0757 2.0996 2.0270 2.183540 3.4866 3.3986 3.4365 3.3168 3.510850 5.7373 5.5942 5.6511 5.4623 5.682060 9.5875 9.3480 9.4312 9.1490 9.367265 12.5635 12.3187 12.4164 12.0795 12.278670 10.9401 10.7937 10.9026 10.5153 10.682180 7.5385 7.3818 7.4803 7.2304 7.305490 4.5369 4.2686 4.3079 4.3052 4.3213
Percent Change in Monthly Annuity Due
AgeFrom GAM-83
to RP-2000From UP-94to RP-2000
From UP-94Projected to 2000
to RP-2000
From RP-2000to RP-2000
GenerationalMales
30 8.86% 4.71% 1.42% 16.54%40 8.75% 4.50% 1.25% 12.64%50 7.99% 4.27% 1.15% 8.53%60 5.55% 3.14% 0.56% 4.57%65 4.26% 2.01% -0.07% 2.88%70 4.51% 1.13% -1.24% 2.52%80 1.96% -1.86% -3.97% 1.39%90 -8.61% -6.40% -7.67% 0.46%
Females30 -4.86% -2.35% -3.46% 7.72%40 -4.87% -2.41% -3.48% 5.85%50 -4.79% -2.36% -3.34% 4.02%60 -4.57% -2.13% -2.99% 2.38%65 -3.85% -1.94% -2.71% 1.65%70 -3.88% -2.58% -3.55% 1.59%80 -4.09% -2.05% -3.34% 1.04%90 -5.11% 0.86% -0.06% 0.37%

April 25, 2001 p. 70
Table 8-1BComparison of GAM-83, UP-94, UP-94 Projected to 2000, and
Employee/Healthy Annuitant RP-2000 Annuity Values5% Interest
Monthly Annuity Due, Deferred to Age 65
Age GAM-83 UP-94
UP-94Projected to 2000
RP2000Employee/
Healthy Annuitant
RP-2000Generational
Employee/Healthy Annuitant
Males30 1.6719 1.7381 1.7945 1.8560 2.147040 2.7461 2.8578 2.9496 3.0455 3.412350 4.5723 4.7355 4.8813 5.0350 5.449160 7.9085 8.0932 8.3013 8.4575 8.841065 10.6849 10.9212 11.1488 11.1203 11.440370 9.0686 9.3717 9.5971 9.4778 9.716280 5.9748 6.2075 6.3437 6.0918 6.176390 3.6941 3.6067 3.6564 3.3759 3.3914
Females30 2.1306 2.0757 2.0996 2.0504 2.204940 3.4866 3.3986 3.4365 3.3551 3.547250 5.7373 5.5942 5.6511 5.5253 5.743960 9.5875 9.3480 9.4312 9.2292 9.448565 12.5635 12.3187 12.4164 12.0578 12.256770 10.9401 10.7937 10.9026 10.5153 10.682180 7.5385 7.3818 7.4803 7.2304 7.305490 4.5369 4.2686 4.3079 4.3052 4.3213
Percent Change in Monthly Annuity Due
AgeFrom GAM-83
to RP-2000From UP-94to RP-2000
From UP-94Projected to 2000
to RP-2000
From RP-2000to RP-2000
GenerationalMales
30 11.01% 6.78% 3.43% 15.68%40 10.90% 6.57% 3.25% 12.04%50 10.12% 6.33% 3.15% 8.22%60 6.94% 4.50% 1.88% 4.53%65 4.08% 1.82% -0.26% 2.88%70 4.51% 1.13% -1.24% 2.52%80 1.96% -1.86% -3.97% 1.39%90 -8.61% -6.40% -7.67% 0.46%
Females30 -3.76% -1.22% -2.34% 7.53%40 -3.77% -1.28% -2.37% 5.72%50 -3.70% -1.23% -2.23% 3.96%60 -3.74% -1.27% -2.14% 2.38%65 -4.02% -2.12% -2.89% 1.65%70 -3.88% -2.58% -3.55% 1.59%80 -4.09% -2.05% -3.34% 1.04%90 -5.11% 0.86% -0.06% 0.37%
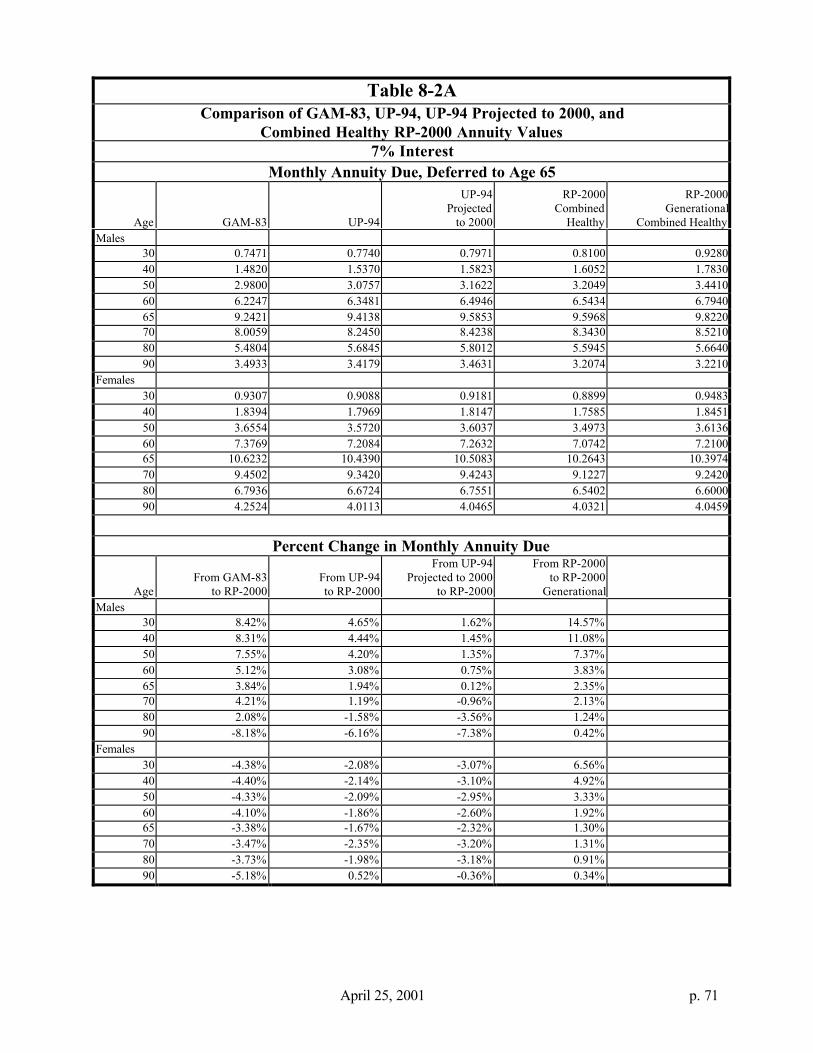
April 25, 2001 p. 71
Table 8-2AComparison of GAM-83, UP-94, UP-94 Projected to 2000, and
Combined Healthy RP-2000 Annuity Values7% Interest
Monthly Annuity Due, Deferred to Age 65
Age GAM-83 UP-94
UP-94Projected to 2000
RP-2000Combined
Healthy
RP-2000Generational
Combined HealthyMales
30 0.7471 0.7740 0.7971 0.8100 0.928040 1.4820 1.5370 1.5823 1.6052 1.783050 2.9800 3.0757 3.1622 3.2049 3.441060 6.2247 6.3481 6.4946 6.5434 6.794065 9.2421 9.4138 9.5853 9.5968 9.822070 8.0059 8.2450 8.4238 8.3430 8.521080 5.4804 5.6845 5.8012 5.5945 5.664090 3.4933 3.4179 3.4631 3.2074 3.2210
Females30 0.9307 0.9088 0.9181 0.8899 0.948340 1.8394 1.7969 1.8147 1.7585 1.845150 3.6554 3.5720 3.6037 3.4973 3.613660 7.3769 7.2084 7.2632 7.0742 7.210065 10.6232 10.4390 10.5083 10.2643 10.397470 9.4502 9.3420 9.4243 9.1227 9.242080 6.7936 6.6724 6.7551 6.5402 6.600090 4.2524 4.0113 4.0465 4.0321 4.0459
Percent Change in Monthly Annuity Due
AgeFrom GAM-83
to RP-2000From UP-94to RP-2000
From UP-94Projected to 2000
to RP-2000
From RP-2000to RP-2000
GenerationalMales
30 8.42% 4.65% 1.62% 14.57%40 8.31% 4.44% 1.45% 11.08%50 7.55% 4.20% 1.35% 7.37%60 5.12% 3.08% 0.75% 3.83%65 3.84% 1.94% 0.12% 2.35%70 4.21% 1.19% -0.96% 2.13%80 2.08% -1.58% -3.56% 1.24%90 -8.18% -6.16% -7.38% 0.42%
Females30 -4.38% -2.08% -3.07% 6.56%40 -4.40% -2.14% -3.10% 4.92%50 -4.33% -2.09% -2.95% 3.33%60 -4.10% -1.86% -2.60% 1.92%65 -3.38% -1.67% -2.32% 1.30%70 -3.47% -2.35% -3.20% 1.31%80 -3.73% -1.98% -3.18% 0.91%90 -5.18% 0.52% -0.36% 0.34%
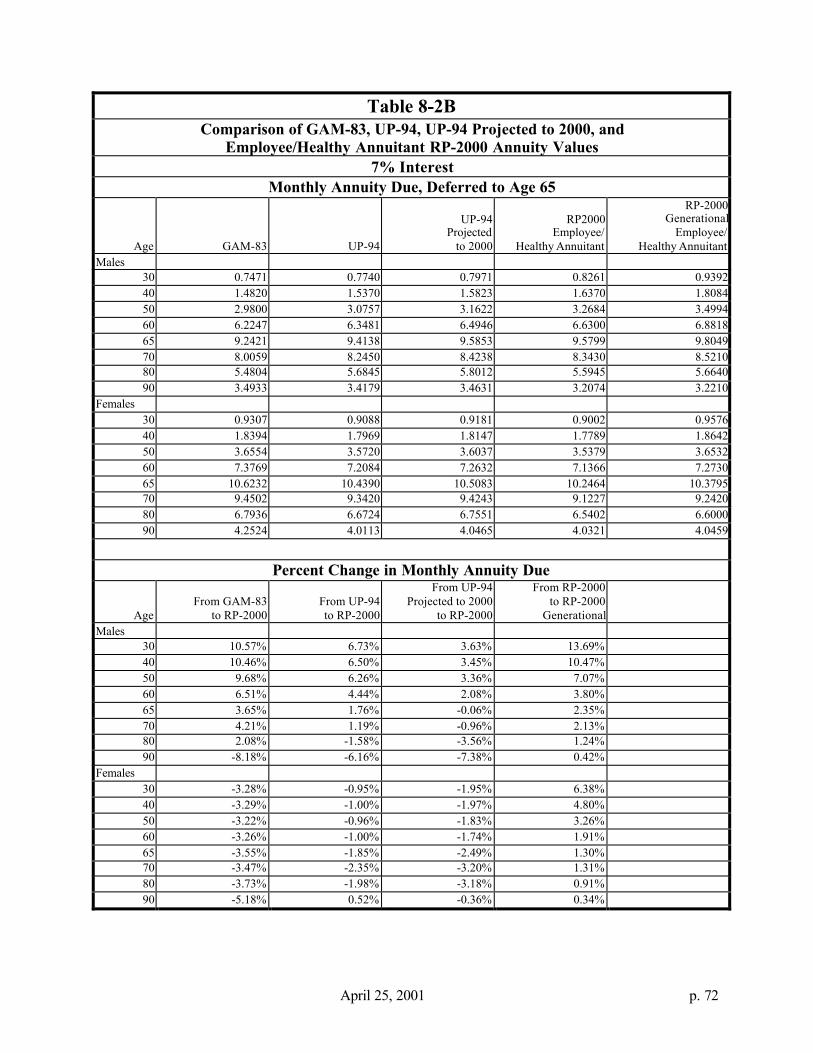
April 25, 2001 p. 72
Table 8-2BComparison of GAM-83, UP-94, UP-94 Projected to 2000, and
Employee/Healthy Annuitant RP-2000 Annuity Values7% Interest
Monthly Annuity Due, Deferred to Age 65
Age GAM-83 UP-94
UP-94Projected to 2000
RP2000Employee/
Healthy Annuitant
RP-2000Generational
Employee/Healthy Annuitant
Males30 0.7471 0.7740 0.7971 0.8261 0.939240 1.4820 1.5370 1.5823 1.6370 1.808450 2.9800 3.0757 3.1622 3.2684 3.499460 6.2247 6.3481 6.4946 6.6300 6.881865 9.2421 9.4138 9.5853 9.5799 9.804970 8.0059 8.2450 8.4238 8.3430 8.521080 5.4804 5.6845 5.8012 5.5945 5.664090 3.4933 3.4179 3.4631 3.2074 3.2210
Females30 0.9307 0.9088 0.9181 0.9002 0.957640 1.8394 1.7969 1.8147 1.7789 1.864250 3.6554 3.5720 3.6037 3.5379 3.653260 7.3769 7.2084 7.2632 7.1366 7.273065 10.6232 10.4390 10.5083 10.2464 10.379570 9.4502 9.3420 9.4243 9.1227 9.242080 6.7936 6.6724 6.7551 6.5402 6.600090 4.2524 4.0113 4.0465 4.0321 4.0459
Percent Change in Monthly Annuity Due
AgeFrom GAM-83
to RP-2000From UP-94to RP-2000
From UP-94Projected to 2000
to RP-2000
From RP-2000to RP-2000
GenerationalMales
30 10.57% 6.73% 3.63% 13.69%40 10.46% 6.50% 3.45% 10.47%50 9.68% 6.26% 3.36% 7.07%60 6.51% 4.44% 2.08% 3.80%65 3.65% 1.76% -0.06% 2.35%70 4.21% 1.19% -0.96% 2.13%80 2.08% -1.58% -3.56% 1.24%90 -8.18% -6.16% -7.38% 0.42%
Females30 -3.28% -0.95% -1.95% 6.38%40 -3.29% -1.00% -1.97% 4.80%50 -3.22% -0.96% -1.83% 3.26%60 -3.26% -1.00% -1.74% 1.91%65 -3.55% -1.85% -2.49% 1.30%70 -3.47% -2.35% -3.20% 1.31%80 -3.73% -1.98% -3.18% 0.91%90 -5.18% 0.52% -0.36% 0.34%
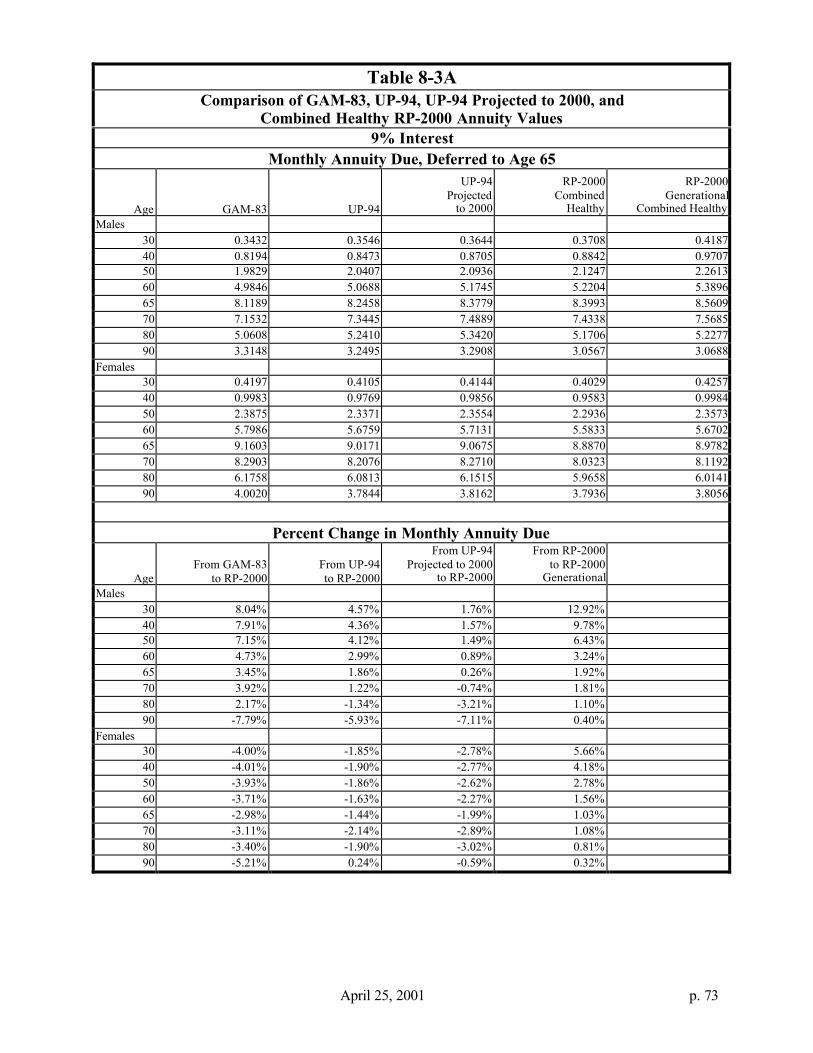
April 25, 2001 p. 73
Table 8-3AComparison of GAM-83, UP-94, UP-94 Projected to 2000, and
Combined Healthy RP-2000 Annuity Values9% Interest
Monthly Annuity Due, Deferred to Age 65
Age GAM-83 UP-94
UP-94Projected to 2000
RP-2000Combined
Healthy
RP-2000Generational
Combined HealthyMales
30 0.3432 0.3546 0.3644 0.3708 0.418740 0.8194 0.8473 0.8705 0.8842 0.970750 1.9829 2.0407 2.0936 2.1247 2.261360 4.9846 5.0688 5.1745 5.2204 5.389665 8.1189 8.2458 8.3779 8.3993 8.560970 7.1532 7.3445 7.4889 7.4338 7.568580 5.0608 5.2410 5.3420 5.1706 5.227790 3.3148 3.2495 3.2908 3.0567 3.0688
Females30 0.4197 0.4105 0.4144 0.4029 0.425740 0.9983 0.9769 0.9856 0.9583 0.998450 2.3875 2.3371 2.3554 2.2936 2.357360 5.7986 5.6759 5.7131 5.5833 5.670265 9.1603 9.0171 9.0675 8.8870 8.978270 8.2903 8.2076 8.2710 8.0323 8.119280 6.1758 6.0813 6.1515 5.9658 6.014190 4.0020 3.7844 3.8162 3.7936 3.8056
Percent Change in Monthly Annuity Due
AgeFrom GAM-83
to RP-2000From UP-94to RP-2000
From UP-94Projected to 2000
to RP-2000
From RP-2000to RP-2000
GenerationalMales
30 8.04% 4.57% 1.76% 12.92%40 7.91% 4.36% 1.57% 9.78%50 7.15% 4.12% 1.49% 6.43%60 4.73% 2.99% 0.89% 3.24%65 3.45% 1.86% 0.26% 1.92%70 3.92% 1.22% -0.74% 1.81%80 2.17% -1.34% -3.21% 1.10%90 -7.79% -5.93% -7.11% 0.40%
Females30 -4.00% -1.85% -2.78% 5.66%40 -4.01% -1.90% -2.77% 4.18%50 -3.93% -1.86% -2.62% 2.78%60 -3.71% -1.63% -2.27% 1.56%65 -2.98% -1.44% -1.99% 1.03%70 -3.11% -2.14% -2.89% 1.08%80 -3.40% -1.90% -3.02% 0.81%90 -5.21% 0.24% -0.59% 0.32%
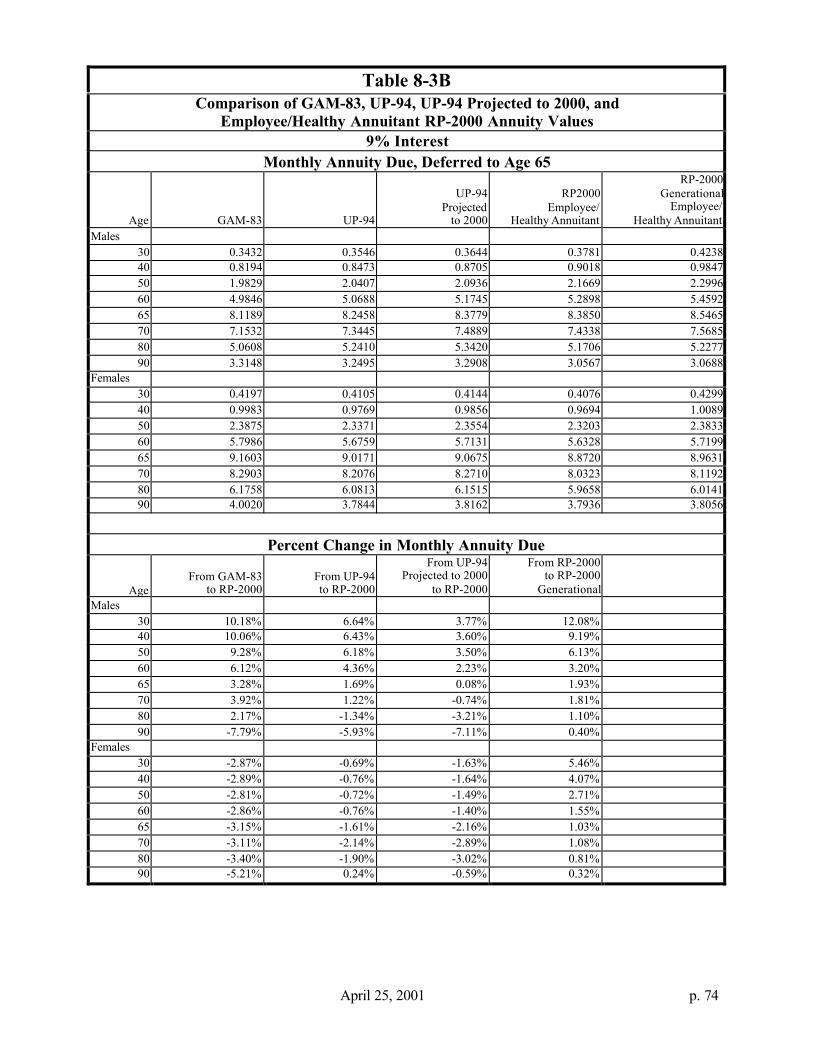
April 25, 2001 p. 74
Table 8-3BComparison of GAM-83, UP-94, UP-94 Projected to 2000, and
Employee/Healthy Annuitant RP-2000 Annuity Values9% Interest
Monthly Annuity Due, Deferred to Age 65
Age GAM-83 UP-94
UP-94Projected to 2000
RP2000Employee/
Healthy Annuitant
RP-2000Generational
Employee/Healthy Annuitant
Males30 0.3432 0.3546 0.3644 0.3781 0.423840 0.8194 0.8473 0.8705 0.9018 0.984750 1.9829 2.0407 2.0936 2.1669 2.299660 4.9846 5.0688 5.1745 5.2898 5.459265 8.1189 8.2458 8.3779 8.3850 8.546570 7.1532 7.3445 7.4889 7.4338 7.568580 5.0608 5.2410 5.3420 5.1706 5.227790 3.3148 3.2495 3.2908 3.0567 3.0688
Females30 0.4197 0.4105 0.4144 0.4076 0.429940 0.9983 0.9769 0.9856 0.9694 1.008950 2.3875 2.3371 2.3554 2.3203 2.383360 5.7986 5.6759 5.7131 5.6328 5.719965 9.1603 9.0171 9.0675 8.8720 8.963170 8.2903 8.2076 8.2710 8.0323 8.119280 6.1758 6.0813 6.1515 5.9658 6.014190 4.0020 3.7844 3.8162 3.7936 3.8056
Percent Change in Monthly Annuity Due
AgeFrom GAM-83
to RP-2000From UP-94to RP-2000
From UP-94Projected to 2000
to RP-2000
From RP-2000to RP-2000
GenerationalMales
30 10.18% 6.64% 3.77% 12.08%40 10.06% 6.43% 3.60% 9.19%50 9.28% 6.18% 3.50% 6.13%60 6.12% 4.36% 2.23% 3.20%65 3.28% 1.69% 0.08% 1.93%70 3.92% 1.22% -0.74% 1.81%80 2.17% -1.34% -3.21% 1.10%90 -7.79% -5.93% -7.11% 0.40%
Females30 -2.87% -0.69% -1.63% 5.46%40 -2.89% -0.76% -1.64% 4.07%50 -2.81% -0.72% -1.49% 2.71%60 -2.86% -0.76% -1.40% 1.55%65 -3.15% -1.61% -2.16% 1.03%70 -3.11% -2.14% -2.89% 1.08%80 -3.40% -1.90% -3.02% 0.81%90 -5.21% 0.24% -0.59% 0.32%

Comparison of Blended and Separate Employee and Healthy Annuitant Tables
The RPEC suggests that a blended healthy lives mortality table can be used if it is not practical touse the separate employee and healthy retiree tables. This section shows the effect of using theblended tables. The section also compares both results to those using the GAM-83 table withoutprojection.
Tables 8-4 to 8-6 compare the present value of accrued benefits using the RP-2000 withseparate active and annuitant tables to values using the RP-2000 blended table for differentinterest rates and proportion female. For comparison, present values assuming GAM-83 andUP-94 mortality are also included.
The sample population and accrued benefits were obtained from PBGC’s Pension InformationManagement System (PIMS) Model. The PIMS model was developed based on Form 5500data for 265 large pension plans. The following assumptions were selected with variations forinterest and the proportion of females:
• Terminated vested employees were valued using the employee mortality table.• Retirement rates were 2 percent a year for ages 50-54, 3 percent a year for ages 55-
59, 10 percent a year for ages 60-61, 15 percent a year for ages 62-64, and 100percent at age 65.
• Early retirement reductions were 1/15 for each of the first 5 years before age 65 and1/30 for each of the next 5 years, i.e., half of the accrued benefit is paid at age 55.
The liabilities for the RP-2000 blended are quite close to the results of using the RP-2000separate tables for all variations of interest and male/female mix. The RP-2000 results are alsoclose to the GAM-83 and UP-94 tables for a 50% male/female mix. The RP-2000 results arehigher than the earlier tables for the 75% male population and lower for the 75% femalepopulation.
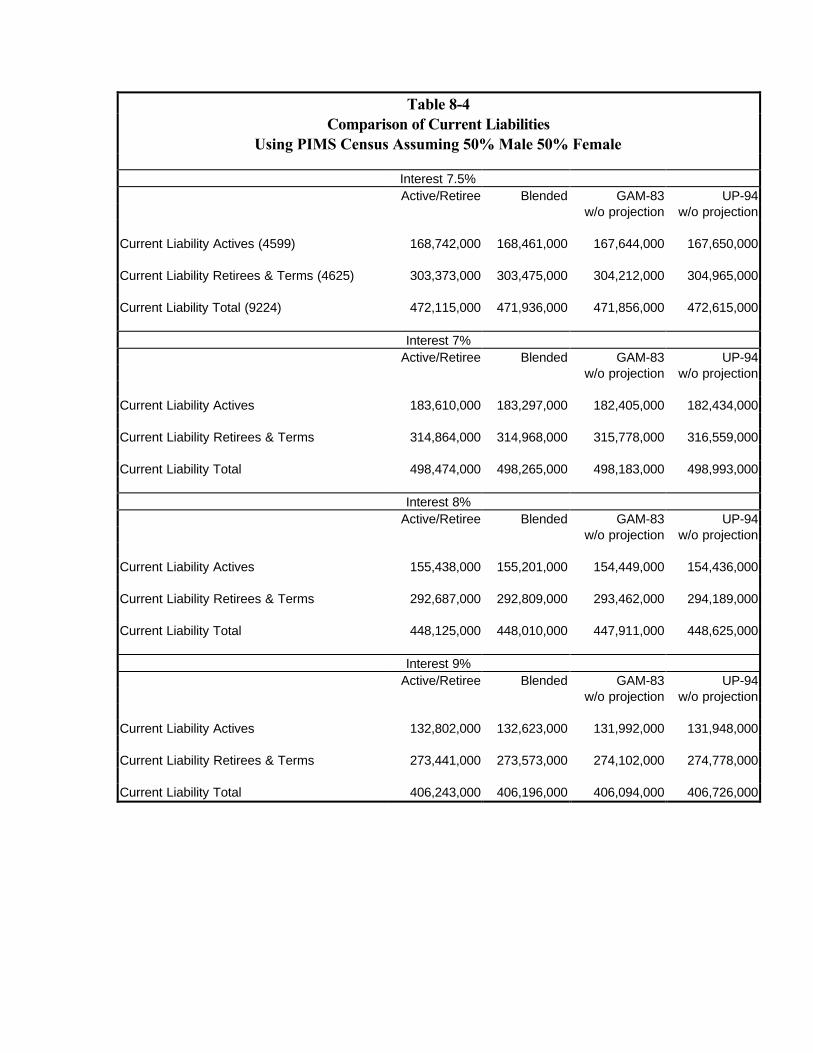
Table 8-4Comparison of Current Liabilities
Using PIMS Census Assuming 50% Male 50% Female
Interest 7.5%Active/Retiree Blended GAM-83 UP-94
w/o projection w/o projection
Current Liability Actives (4599) 168,742,000 168,461,000 167,644,000 167,650,000
Current Liability Retirees & Terms (4625) 303,373,000 303,475,000 304,212,000 304,965,000
Current Liability Total (9224) 472,115,000 471,936,000 471,856,000 472,615,000
Interest 7%Active/Retiree Blended GAM-83 UP-94
w/o projection w/o projection
Current Liability Actives 183,610,000 183,297,000 182,405,000 182,434,000
Current Liability Retirees & Terms 314,864,000 314,968,000 315,778,000 316,559,000
Current Liability Total 498,474,000 498,265,000 498,183,000 498,993,000
Interest 8%Active/Retiree Blended GAM-83 UP-94
w/o projection w/o projection
Current Liability Actives 155,438,000 155,201,000 154,449,000 154,436,000
Current Liability Retirees & Terms 292,687,000 292,809,000 293,462,000 294,189,000
Current Liability Total 448,125,000 448,010,000 447,911,000 448,625,000
Interest 9%Active/Retiree Blended GAM-83 UP-94
w/o projection w/o projection
Current Liability Actives 132,802,000 132,623,000 131,992,000 131,948,000
Current Liability Retirees & Terms 273,441,000 273,573,000 274,102,000 274,778,000
Current Liability Total 406,243,000 406,196,000 406,094,000 406,726,000
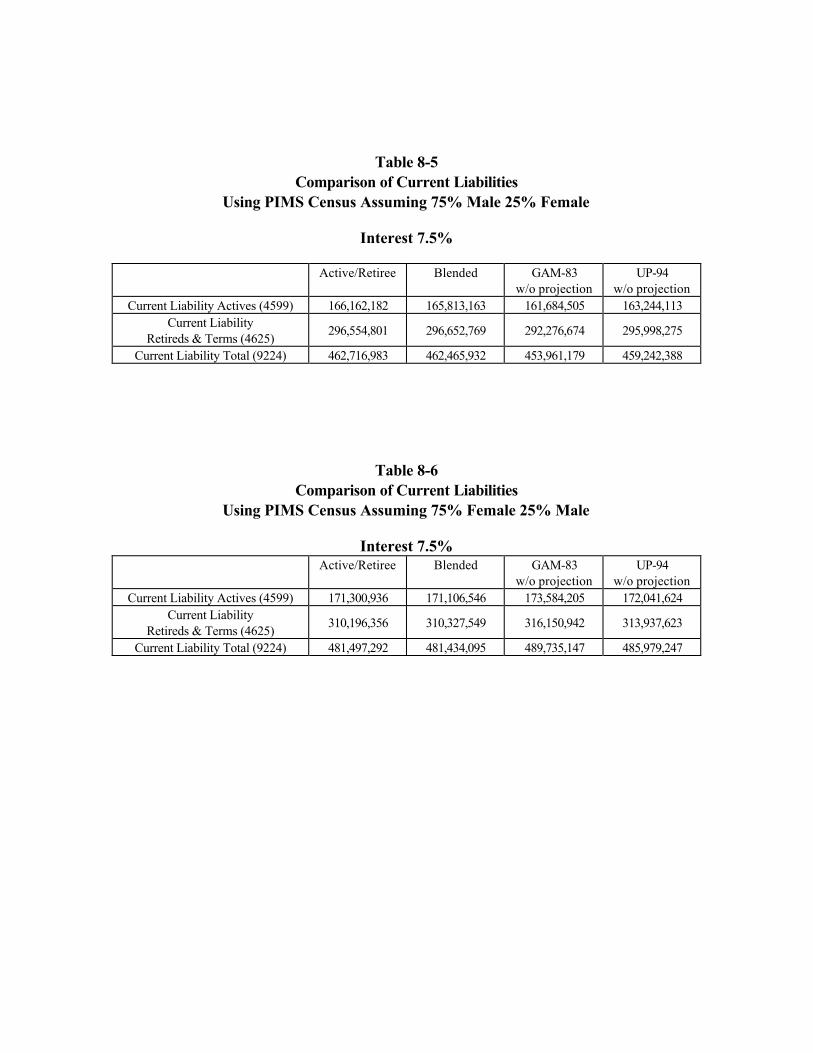
Table 8-5Comparison of Current Liabilities
Using PIMS Census Assuming 75% Male 25% Female
Interest 7.5%
Active/Retiree Blended GAM-83w/o projection
UP-94w/o projection
Current Liability Actives (4599) 166,162,182 165,813,163 161,684,505 163,244,113Current Liability
Retireds & Terms (4625)296,554,801 296,652,769 292,276,674 295,998,275
Current Liability Total (9224) 462,716,983 462,465,932 453,961,179 459,242,388
Table 8-6Comparison of Current Liabilities
Using PIMS Census Assuming 75% Female 25% Male
Interest 7.5%Active/Retiree Blended GAM-83
w/o projectionUP-94
w/o projectionCurrent Liability Actives (4599) 171,300,936 171,106,546 173,584,205 172,041,624
Current LiabilityRetireds & Terms (4625)
310,196,356 310,327,549 316,150,942 313,937,623
Current Liability Total (9224) 481,497,292 481,434,095 489,735,147 485,979,247

Appendix A
SOCIETY OF ACTUARIES475 N. MARTINGALE RD., SUITE 800, SCHAUMBURG, IL 60173-2226 847/706-3500
847/706-3599 FAX
September 29, 1995
Dear Pension Section Member:
The Retirement Plans Experience Committee of the Society of Actuaries is collecting pensionmortality data to evaluate mortality experience in the first half of the 1990s. The Committeehopes to gather sufficient data from each type of plan to determine if the mortality for that typeof plan is significantly different from mortality for other types of plans. The Committee willdevelop adjustments to a standard, which could be a new table developed by the Committee.
The Retirement Protection Act of 1994 [RPA], passed as part of the GATT legislation, imposesthe requirement to use a prescribed mortality table for certain pension funding calculations.Current liability for affected plans must be calculated using the 1983 GAM table through 1999.The Secretary of Treasury can promulgate a new table in the year 2000. Thereafter, theSecretary will be able to change the mortality standard every five years. During the legislativedebate leading up to enactment of RPA, federal regulators argued that a standard mortality tablewas needed to minimize a company’s ability to reduce its minimum funding obligation by usinginappropriate tables. Industry groups pointed out that a standard table would have the effect ofoverstating calculated liabilities for some plans while understating them for others. The Societyof Actuaries believes it is in everyone’s best interests to have “standard” mortality tables thatcredibly reflect the expected experience of the participant population. This suggests havingdifferent tables for groups with significant differences in mortality experience such as hourly andsalaried groups, for example.
As part of an ongoing effort, the Society of Actuaries Retirement Plans Experience Committeeis collecting pension data to evaluate trends in mortality experience. The Committee isperiodically briefing federal regulators on its work and will complete this round of analysis in1997. In addition to providing pension actuaries with current mortality information, theCommittee hopes that federal regulators will consider its work product in developing the nextRPA mortality tables.
For previous mortality experience review cycles the Committee has had relatively little privateemployer data and has had to rely largely on data provided by the U.S. Civil Service retirement

programs. In order to measure mortality differences between types of workers and types ofindustries, the Committee will need a large volume of data for each. Companies that sponsorplans affected by the current liability funding provisions would be well advised to send theirdata. The likely alternative to “tailored” tables is a one-size-fits-all table that will overstate orunderstate calculated liabilities for many plans. For example, an overstatement would result infront-loading minimum funding requirements.
The enclosed Data Submission Instructions describe the data and format being requested. Asnoted, a separate “chart” for each year, gender and participant status group [for example,employee and retiree or beneficiary] for each plan should be submitted. Please submit databoth on hardcopy and IBM PC compatible diskette (ASCII text), if possible. Submissions withall requested data are preferred but partial submissions are acceptable. The most importantdata is the non-disabled retiree data with an indication of the hourly, salaried and unioncomposition of the group and the sponsor’s Standard Industrial Code applicable to theparticipant group.
Data should be mailed by December 31, 1995, to Mr. Thomas Edwalds, Society of Actuaries,475 N. Martingale Road, Suite 800, Schaumburg, IL 60173-2226 [708-706-3578]. He willrecord submissions received and then forward them to an outside contractor for analysis. Thecontractor will likely be a university, the assigned staff employees of which will signconfidentiality agreements, and the identity of the data will be masked—the Committee will nothave access to information that could be used to link specific data to a contributing company.
If you have any question about the data submission process or would like to discussalternatives, call the Committee chairman, Edwin Hustead at 202-637-6640.
Sincerely,
Edwin Hustead, ChairmanRetirement Plans Experience Committee


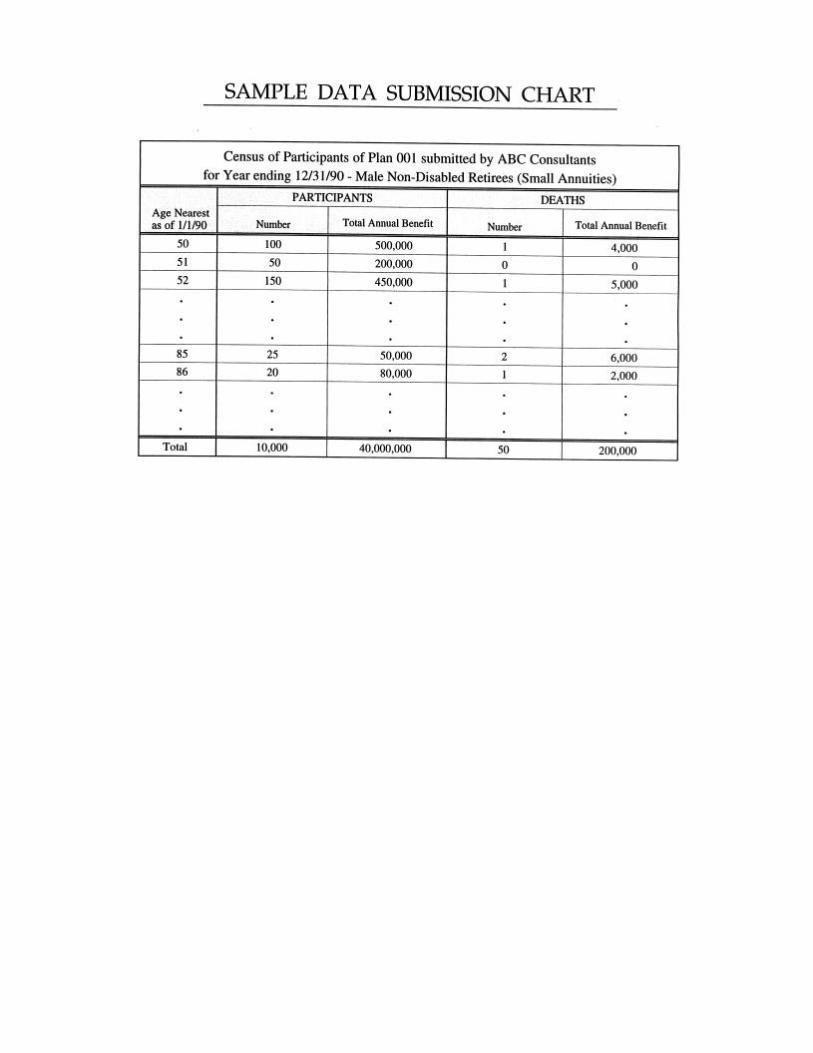

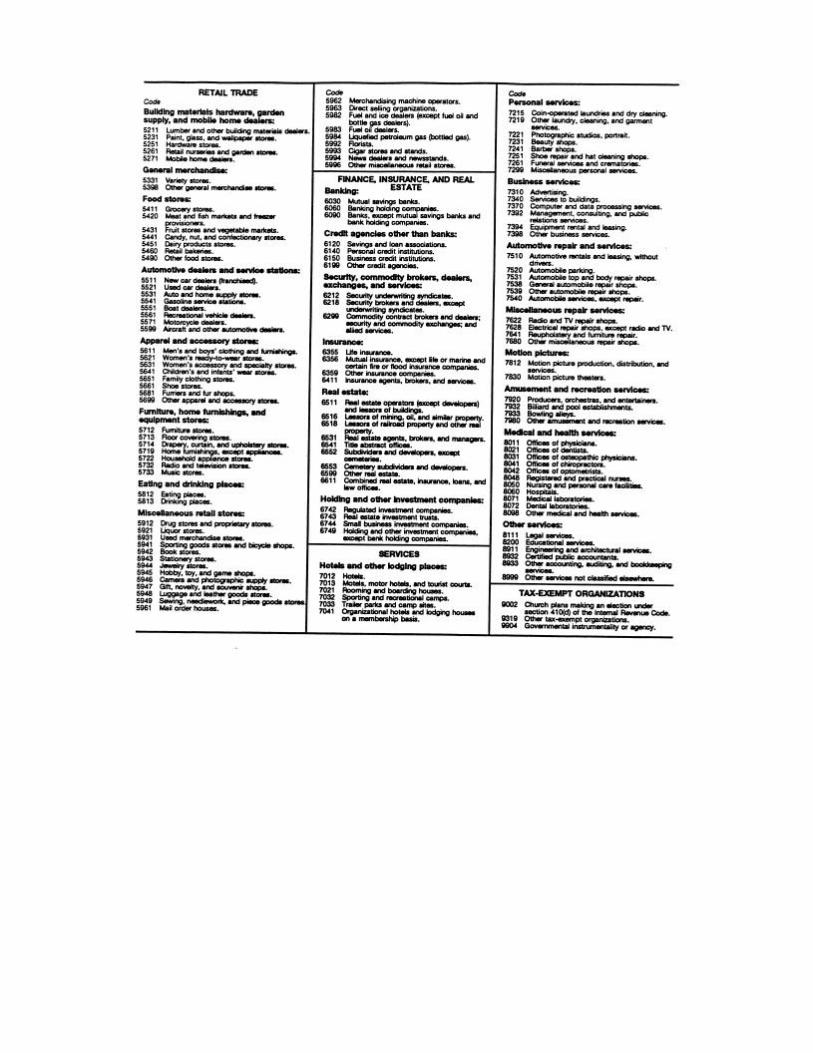
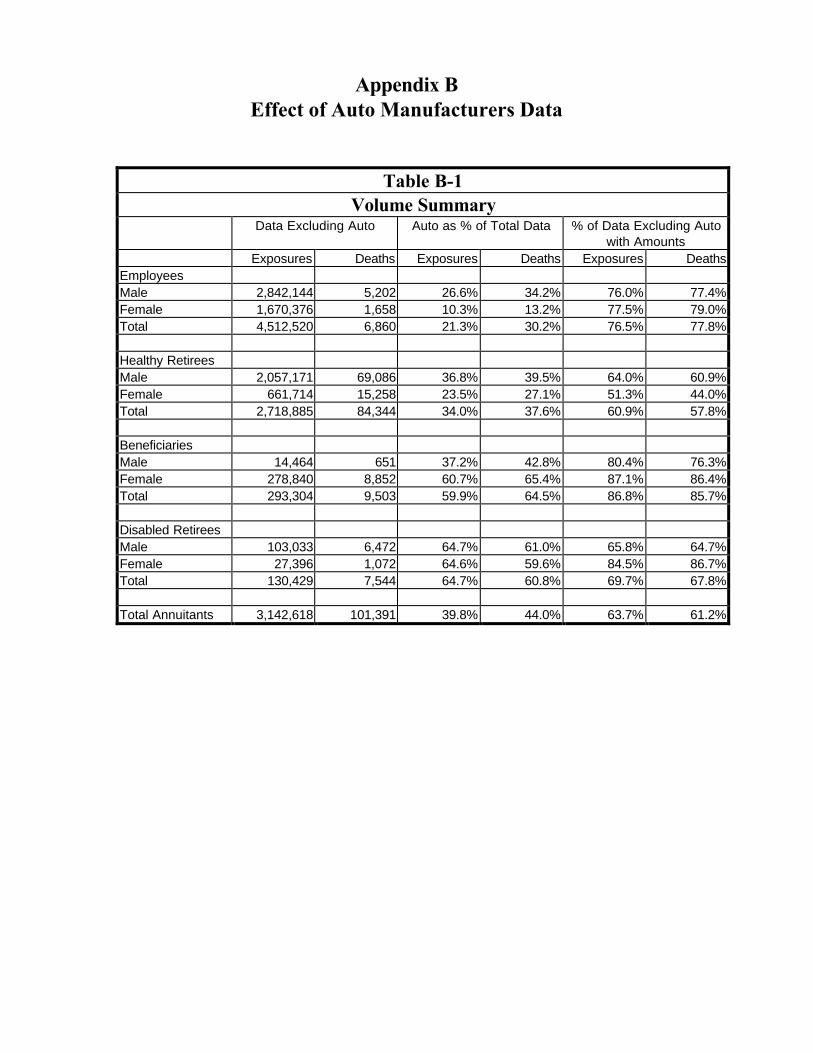
Appendix BEffect of Auto Manufacturers Data
Table B-1Volume Summary
Data Excluding Auto Auto as % of Total Data % of Data Excluding Autowith Amounts
Exposures Deaths Exposures Deaths Exposures DeathsEmployeesMale 2,842,144 5,202 26.6% 34.2% 76.0% 77.4%Female 1,670,376 1,658 10.3% 13.2% 77.5% 79.0%Total 4,512,520 6,860 21.3% 30.2% 76.5% 77.8%
Healthy RetireesMale 2,057,171 69,086 36.8% 39.5% 64.0% 60.9%Female 661,714 15,258 23.5% 27.1% 51.3% 44.0%Total 2,718,885 84,344 34.0% 37.6% 60.9% 57.8%
BeneficiariesMale 14,464 651 37.2% 42.8% 80.4% 76.3%Female 278,840 8,852 60.7% 65.4% 87.1% 86.4%Total 293,304 9,503 59.9% 64.5% 86.8% 85.7%
Disabled RetireesMale 103,033 6,472 64.7% 61.0% 65.8% 64.7%Female 27,396 1,072 64.6% 59.6% 84.5% 86.7%Total 130,429 7,544 64.7% 60.8% 69.7% 67.8%
Total Annuitants 3,142,618 101,391 39.8% 44.0% 63.7% 61.2%
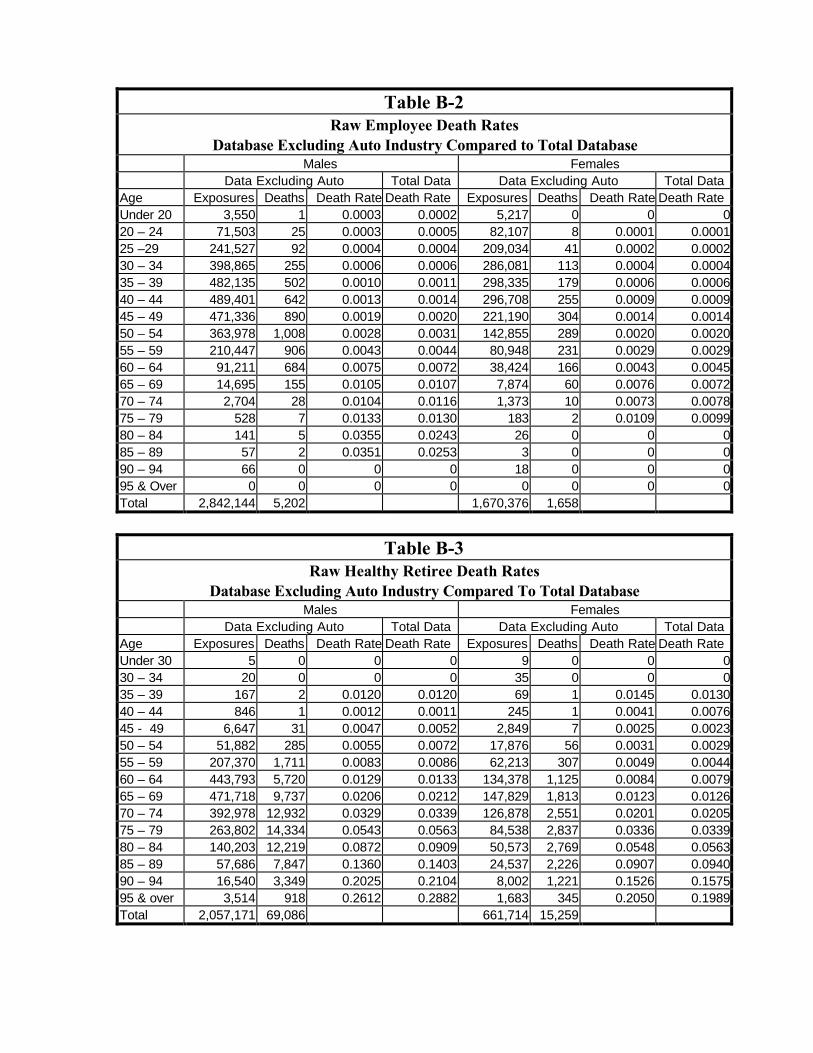
Table B-2Raw Employee Death Rates
Database Excluding Auto Industry Compared to Total DatabaseMales Females
Data Excluding Auto Total Data Data Excluding Auto Total DataAge Exposures Deaths Death Rate Death Rate Exposures Deaths Death Rate Death RateUnder 20 3,550 1 0.0003 0.0002 5,217 0 0 020 – 24 71,503 25 0.0003 0.0005 82,107 8 0.0001 0.000125 –29 241,527 92 0.0004 0.0004 209,034 41 0.0002 0.000230 – 34 398,865 255 0.0006 0.0006 286,081 113 0.0004 0.000435 – 39 482,135 502 0.0010 0.0011 298,335 179 0.0006 0.000640 – 44 489,401 642 0.0013 0.0014 296,708 255 0.0009 0.000945 – 49 471,336 890 0.0019 0.0020 221,190 304 0.0014 0.001450 – 54 363,978 1,008 0.0028 0.0031 142,855 289 0.0020 0.002055 – 59 210,447 906 0.0043 0.0044 80,948 231 0.0029 0.002960 – 64 91,211 684 0.0075 0.0072 38,424 166 0.0043 0.004565 – 69 14,695 155 0.0105 0.0107 7,874 60 0.0076 0.007270 – 74 2,704 28 0.0104 0.0116 1,373 10 0.0073 0.007875 – 79 528 7 0.0133 0.0130 183 2 0.0109 0.009980 – 84 141 5 0.0355 0.0243 26 0 0 085 – 89 57 2 0.0351 0.0253 3 0 0 090 – 94 66 0 0 0 18 0 0 095 & Over 0 0 0 0 0 0 0 0Total 2,842,144 5,202 1,670,376 1,658
Table B-3Raw Healthy Retiree Death Rates
Database Excluding Auto Industry Compared To Total DatabaseMales Females
Data Excluding Auto Total Data Data Excluding Auto Total DataAge Exposures Deaths Death Rate Death Rate Exposures Deaths Death Rate Death RateUnder 30 5 0 0 0 9 0 0 030 – 34 20 0 0 0 35 0 0 035 – 39 167 2 0.0120 0.0120 69 1 0.0145 0.013040 – 44 846 1 0.0012 0.0011 245 1 0.0041 0.007645 - 49 6,647 31 0.0047 0.0052 2,849 7 0.0025 0.002350 – 54 51,882 285 0.0055 0.0072 17,876 56 0.0031 0.002955 – 59 207,370 1,711 0.0083 0.0086 62,213 307 0.0049 0.004460 – 64 443,793 5,720 0.0129 0.0133 134,378 1,125 0.0084 0.007965 – 69 471,718 9,737 0.0206 0.0212 147,829 1,813 0.0123 0.012670 – 74 392,978 12,932 0.0329 0.0339 126,878 2,551 0.0201 0.020575 – 79 263,802 14,334 0.0543 0.0563 84,538 2,837 0.0336 0.033980 – 84 140,203 12,219 0.0872 0.0909 50,573 2,769 0.0548 0.056385 – 89 57,686 7,847 0.1360 0.1403 24,537 2,226 0.0907 0.094090 – 94 16,540 3,349 0.2025 0.2104 8,002 1,221 0.1526 0.157595 & over 3,514 918 0.2612 0.2882 1,683 345 0.2050 0.1989Total 2,057,171 69,086 661,714 15,259
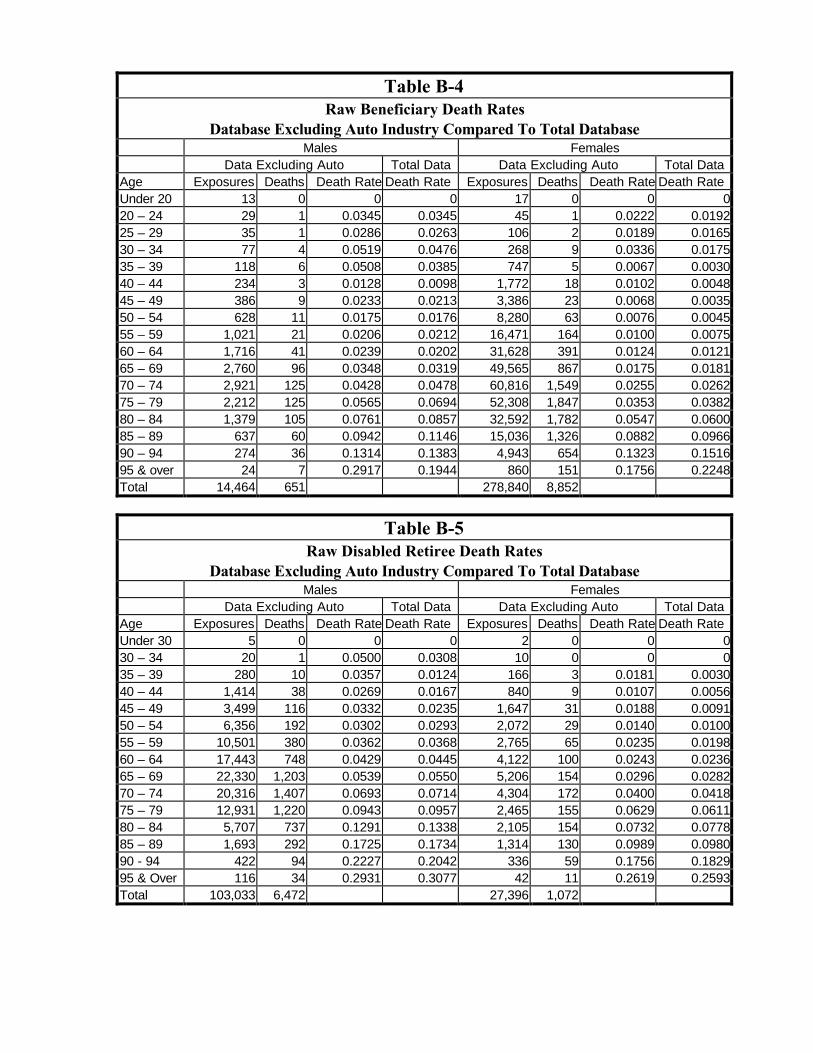
Table B-4Raw Beneficiary Death Rates
Database Excluding Auto Industry Compared To Total DatabaseMales Females
Data Excluding Auto Total Data Data Excluding Auto Total DataAge Exposures Deaths Death Rate Death Rate Exposures Deaths Death Rate Death RateUnder 20 13 0 0 0 17 0 0 020 – 24 29 1 0.0345 0.0345 45 1 0.0222 0.019225 – 29 35 1 0.0286 0.0263 106 2 0.0189 0.016530 – 34 77 4 0.0519 0.0476 268 9 0.0336 0.017535 – 39 118 6 0.0508 0.0385 747 5 0.0067 0.003040 – 44 234 3 0.0128 0.0098 1,772 18 0.0102 0.004845 – 49 386 9 0.0233 0.0213 3,386 23 0.0068 0.003550 – 54 628 11 0.0175 0.0176 8,280 63 0.0076 0.004555 – 59 1,021 21 0.0206 0.0212 16,471 164 0.0100 0.007560 – 64 1,716 41 0.0239 0.0202 31,628 391 0.0124 0.012165 – 69 2,760 96 0.0348 0.0319 49,565 867 0.0175 0.018170 – 74 2,921 125 0.0428 0.0478 60,816 1,549 0.0255 0.026275 – 79 2,212 125 0.0565 0.0694 52,308 1,847 0.0353 0.038280 – 84 1,379 105 0.0761 0.0857 32,592 1,782 0.0547 0.060085 – 89 637 60 0.0942 0.1146 15,036 1,326 0.0882 0.096690 – 94 274 36 0.1314 0.1383 4,943 654 0.1323 0.151695 & over 24 7 0.2917 0.1944 860 151 0.1756 0.2248Total 14,464 651 278,840 8,852
Table B-5Raw Disabled Retiree Death Rates
Database Excluding Auto Industry Compared To Total DatabaseMales Females
Data Excluding Auto Total Data Data Excluding Auto Total DataAge Exposures Deaths Death Rate Death Rate Exposures Deaths Death Rate Death RateUnder 30 5 0 0 0 2 0 0 030 – 34 20 1 0.0500 0.0308 10 0 0 035 – 39 280 10 0.0357 0.0124 166 3 0.0181 0.003040 – 44 1,414 38 0.0269 0.0167 840 9 0.0107 0.005645 – 49 3,499 116 0.0332 0.0235 1,647 31 0.0188 0.009150 – 54 6,356 192 0.0302 0.0293 2,072 29 0.0140 0.010055 – 59 10,501 380 0.0362 0.0368 2,765 65 0.0235 0.019860 – 64 17,443 748 0.0429 0.0445 4,122 100 0.0243 0.023665 – 69 22,330 1,203 0.0539 0.0550 5,206 154 0.0296 0.028270 – 74 20,316 1,407 0.0693 0.0714 4,304 172 0.0400 0.041875 – 79 12,931 1,220 0.0943 0.0957 2,465 155 0.0629 0.061180 – 84 5,707 737 0.1291 0.1338 2,105 154 0.0732 0.077885 – 89 1,693 292 0.1725 0.1734 1,314 130 0.0989 0.098090 - 94 422 94 0.2227 0.2042 336 59 0.1756 0.182995 & Over 116 34 0.2931 0.3077 42 11 0.2619 0.2593Total 103,033 6,472 27,396 1,072
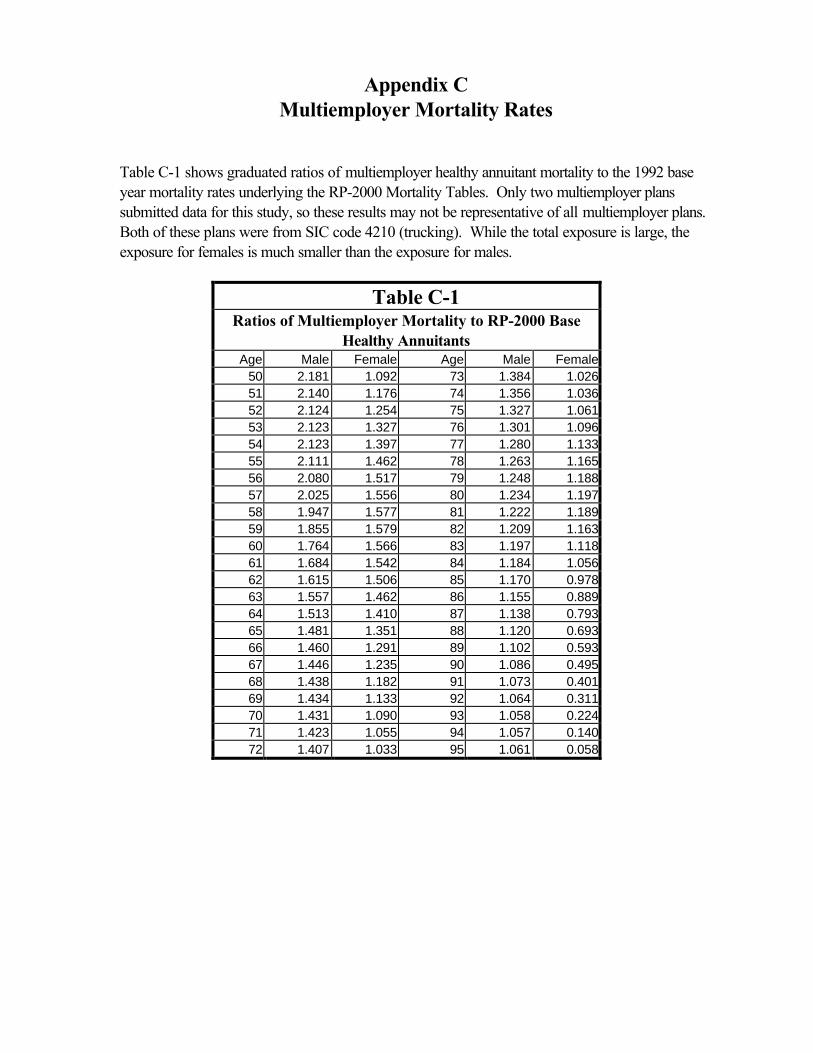
Appendix CMultiemployer Mortality Rates
Table C-1 shows graduated ratios of multiemployer healthy annuitant mortality to the 1992 baseyear mortality rates underlying the RP-2000 Mortality Tables. Only two multiemployer planssubmitted data for this study, so these results may not be representative of all multiemployer plans.Both of these plans were from SIC code 4210 (trucking). While the total exposure is large, theexposure for females is much smaller than the exposure for males.
Table C-1Ratios of Multiemployer Mortality to RP-2000 Base
Healthy AnnuitantsAge Male Female Age Male Female
50 2.181 1.092 73 1.384 1.02651 2.140 1.176 74 1.356 1.03652 2.124 1.254 75 1.327 1.06153 2.123 1.327 76 1.301 1.09654 2.123 1.397 77 1.280 1.13355 2.111 1.462 78 1.263 1.16556 2.080 1.517 79 1.248 1.18857 2.025 1.556 80 1.234 1.19758 1.947 1.577 81 1.222 1.18959 1.855 1.579 82 1.209 1.16360 1.764 1.566 83 1.197 1.11861 1.684 1.542 84 1.184 1.05662 1.615 1.506 85 1.170 0.97863 1.557 1.462 86 1.155 0.88964 1.513 1.410 87 1.138 0.79365 1.481 1.351 88 1.120 0.69366 1.460 1.291 89 1.102 0.59367 1.446 1.235 90 1.086 0.49568 1.438 1.182 91 1.073 0.40169 1.434 1.133 92 1.064 0.31170 1.431 1.090 93 1.058 0.22471 1.423 1.055 94 1.057 0.14072 1.407 1.033 95 1.061 0.058
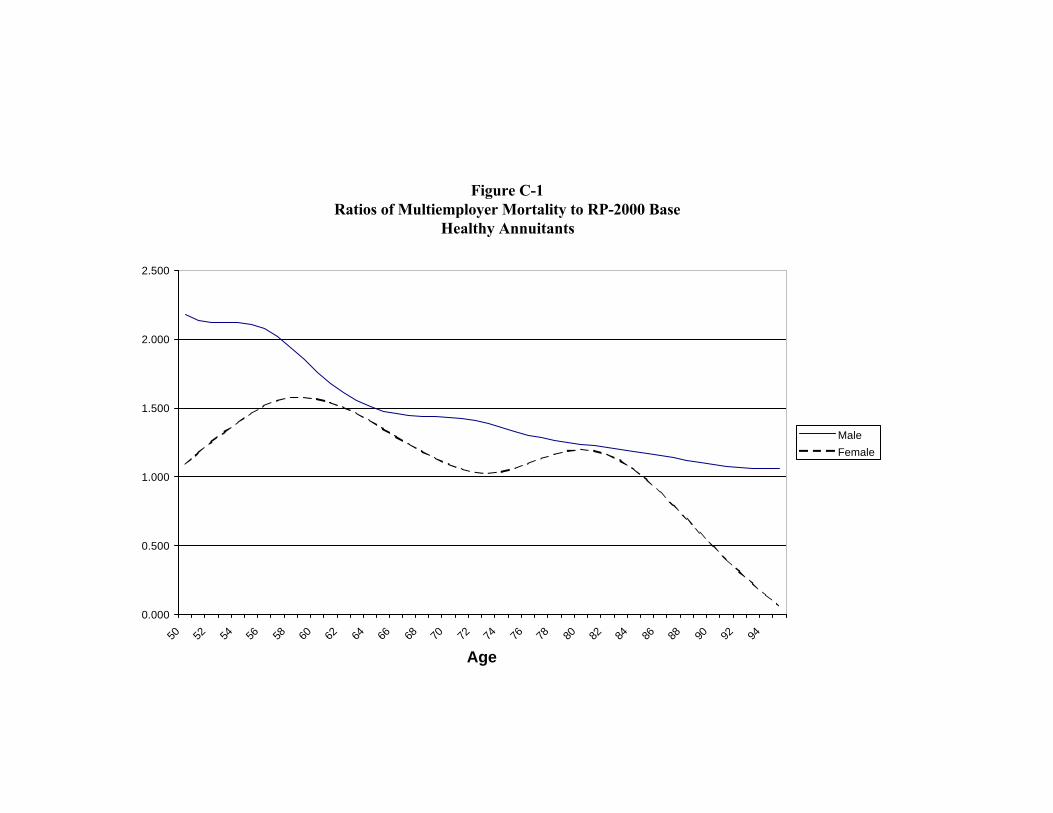
Figure C-1Ratios of Multiemployer Mortality to RP-2000 Base
Healthy Annuitants
0.000
0.500
1.000
1.500
2.000
2.500
50 52 54 56 58 60 62 64 66 68 70 72 74 76 78 80 82 84 86 88 90 92 94
Age
Male
Female
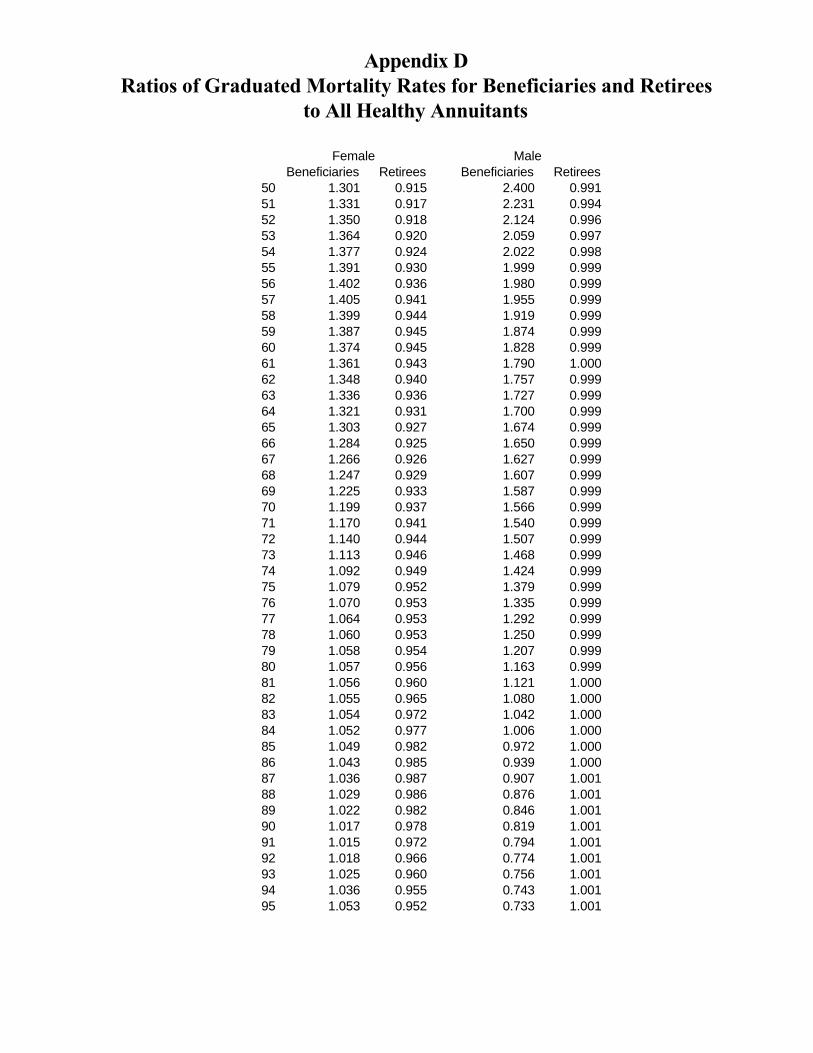
Appendix DRatios of Graduated Mortality Rates for Beneficiaries and Retirees
to All Healthy Annuitants
Female MaleBeneficiaries Retirees Beneficiaries Retirees
50 1.301 0.915 2.400 0.99151 1.331 0.917 2.231 0.99452 1.350 0.918 2.124 0.99653 1.364 0.920 2.059 0.99754 1.377 0.924 2.022 0.99855 1.391 0.930 1.999 0.99956 1.402 0.936 1.980 0.99957 1.405 0.941 1.955 0.99958 1.399 0.944 1.919 0.99959 1.387 0.945 1.874 0.99960 1.374 0.945 1.828 0.99961 1.361 0.943 1.790 1.00062 1.348 0.940 1.757 0.99963 1.336 0.936 1.727 0.99964 1.321 0.931 1.700 0.99965 1.303 0.927 1.674 0.99966 1.284 0.925 1.650 0.99967 1.266 0.926 1.627 0.99968 1.247 0.929 1.607 0.99969 1.225 0.933 1.587 0.99970 1.199 0.937 1.566 0.99971 1.170 0.941 1.540 0.99972 1.140 0.944 1.507 0.99973 1.113 0.946 1.468 0.99974 1.092 0.949 1.424 0.99975 1.079 0.952 1.379 0.99976 1.070 0.953 1.335 0.99977 1.064 0.953 1.292 0.99978 1.060 0.953 1.250 0.99979 1.058 0.954 1.207 0.99980 1.057 0.956 1.163 0.99981 1.056 0.960 1.121 1.00082 1.055 0.965 1.080 1.00083 1.054 0.972 1.042 1.00084 1.052 0.977 1.006 1.00085 1.049 0.982 0.972 1.00086 1.043 0.985 0.939 1.00087 1.036 0.987 0.907 1.00188 1.029 0.986 0.876 1.00189 1.022 0.982 0.846 1.00190 1.017 0.978 0.819 1.00191 1.015 0.972 0.794 1.00192 1.018 0.966 0.774 1.00193 1.025 0.960 0.756 1.00194 1.036 0.955 0.743 1.00195 1.053 0.952 0.733 1.001
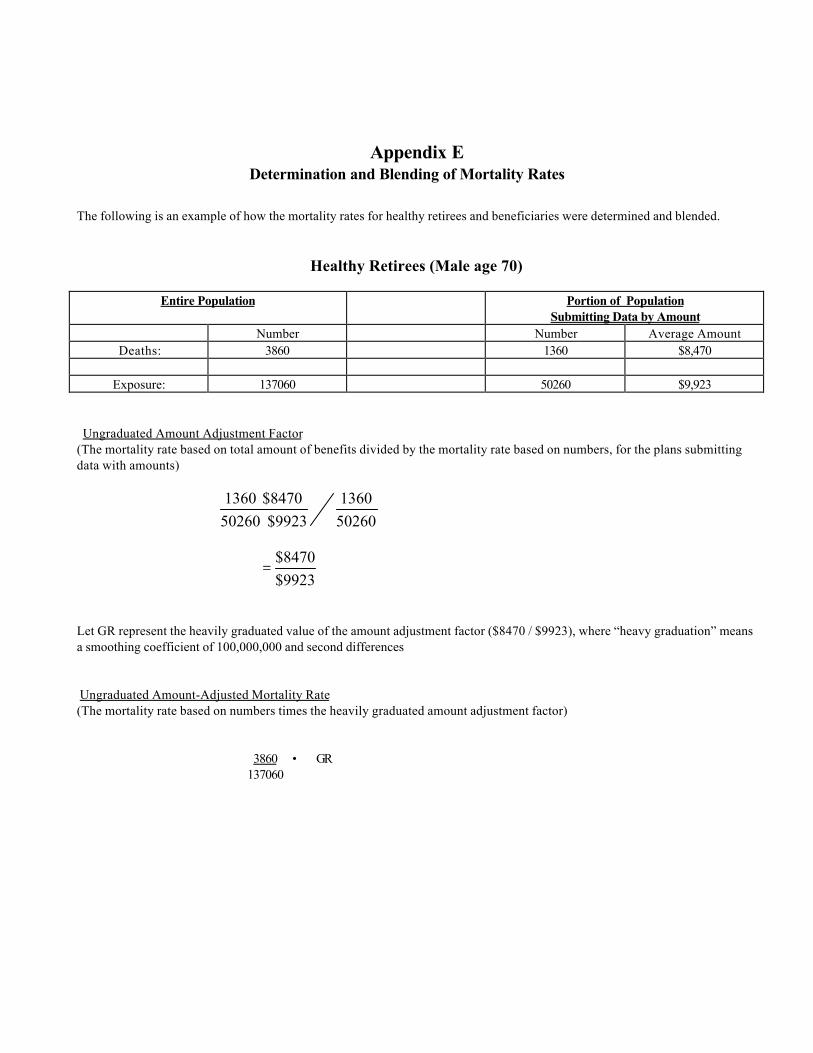
Appendix EDetermination and Blending of Mortality Rates
The following is an example of how the mortality rates for healthy retirees and beneficiaries were determined and blended.
Healthy Retirees (Male age 70)
Entire Population Portion of PopulationSubmitting Data by Amount
Number Number Average AmountDeaths: 3860 1360 $8,470
Exposure: 137060 50260 $9,923
Ungraduated Amount Adjustment Factor(The mortality rate based on total amount of benefits divided by the mortality rate based on numbers, for the plans submittingdata with amounts)
1360
50260
1360
50260
⋅⋅$8470
$9923
=$8470
$9923
Let GR represent the heavily graduated value of the amount adjustment factor ($8470 / $9923), where “heavy graduation” meansa smoothing coefficient of 100,000,000 and second differences
Ungraduated Amount-Adjusted Mortality Rate(The mortality rate based on numbers times the heavily graduated amount adjustment factor)
3860 • GR 137060

Beneficiaries (Male age 70)
Entire Population Portion of PopulationSubmitting Data by Amount
Number Number Average AmountDeaths: 42 16 $2,648
Exposure: 995 500 $2,902
Ungraduated Amount Adjustment Factor(The mortality rate based on total amount of benefits divided by the mortality rate based on numbers, for the plans submittingdata with amounts)
16
500
16
500
⋅⋅$2648
$2902
=$2648
$2902
Let GS represent the heavily graduated value of the amount adjustment factor ($2648 / $2902) where “heavy graduation” meansa smoothing coefficient of 100,000,000 and second differences
Ungraduated Amount-Adjusted Mortality Rate (The mortality rate based on numbers times the heavily graduated amount adjustment factor) 42 • GS 995
Blended Healthy Retiree and Beneficiary Rate:(The weighted average of the ungraduated amount-adjusted mortality rates for annuitants and beneficiaries, where the weightsare are the total number of exposures for all plans times the average amount exposed for those plans with amounts)
3860 • GR • (137060 • $9923) + 42 • GS • (995 • $2902) 137060 995 ______________________________________________________
(137060 • $9923) + (995 • $2902)
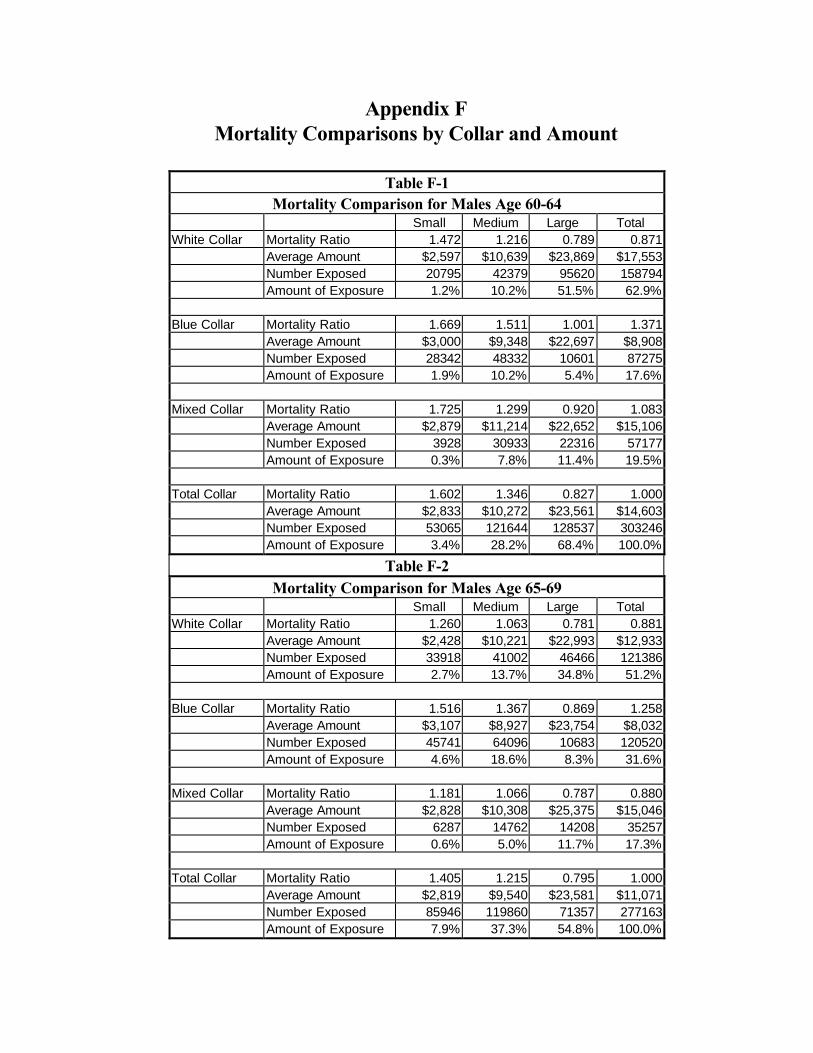
Appendix FMortality Comparisons by Collar and Amount
Table F-1Mortality Comparison for Males Age 60-64
Small Medium Large TotalWhite Collar Mortality Ratio 1.472 1.216 0.789 0.871
Average Amount $2,597 $10,639 $23,869 $17,553Number Exposed 20795 42379 95620 158794Amount of Exposure 1.2% 10.2% 51.5% 62.9%
Blue Collar Mortality Ratio 1.669 1.511 1.001 1.371Average Amount $3,000 $9,348 $22,697 $8,908Number Exposed 28342 48332 10601 87275Amount of Exposure 1.9% 10.2% 5.4% 17.6%
Mixed Collar Mortality Ratio 1.725 1.299 0.920 1.083Average Amount $2,879 $11,214 $22,652 $15,106Number Exposed 3928 30933 22316 57177Amount of Exposure 0.3% 7.8% 11.4% 19.5%
Total Collar Mortality Ratio 1.602 1.346 0.827 1.000Average Amount $2,833 $10,272 $23,561 $14,603Number Exposed 53065 121644 128537 303246Amount of Exposure 3.4% 28.2% 68.4% 100.0%
Table F-2Mortality Comparison for Males Age 65-69
Small Medium Large TotalWhite Collar Mortality Ratio 1.260 1.063 0.781 0.881
Average Amount $2,428 $10,221 $22,993 $12,933Number Exposed 33918 41002 46466 121386Amount of Exposure 2.7% 13.7% 34.8% 51.2%
Blue Collar Mortality Ratio 1.516 1.367 0.869 1.258Average Amount $3,107 $8,927 $23,754 $8,032Number Exposed 45741 64096 10683 120520Amount of Exposure 4.6% 18.6% 8.3% 31.6%
Mixed Collar Mortality Ratio 1.181 1.066 0.787 0.880Average Amount $2,828 $10,308 $25,375 $15,046Number Exposed 6287 14762 14208 35257Amount of Exposure 0.6% 5.0% 11.7% 17.3%
Total Collar Mortality Ratio 1.405 1.215 0.795 1.000Average Amount $2,819 $9,540 $23,581 $11,071Number Exposed 85946 119860 71357 277163Amount of Exposure 7.9% 37.3% 54.8% 100.0%
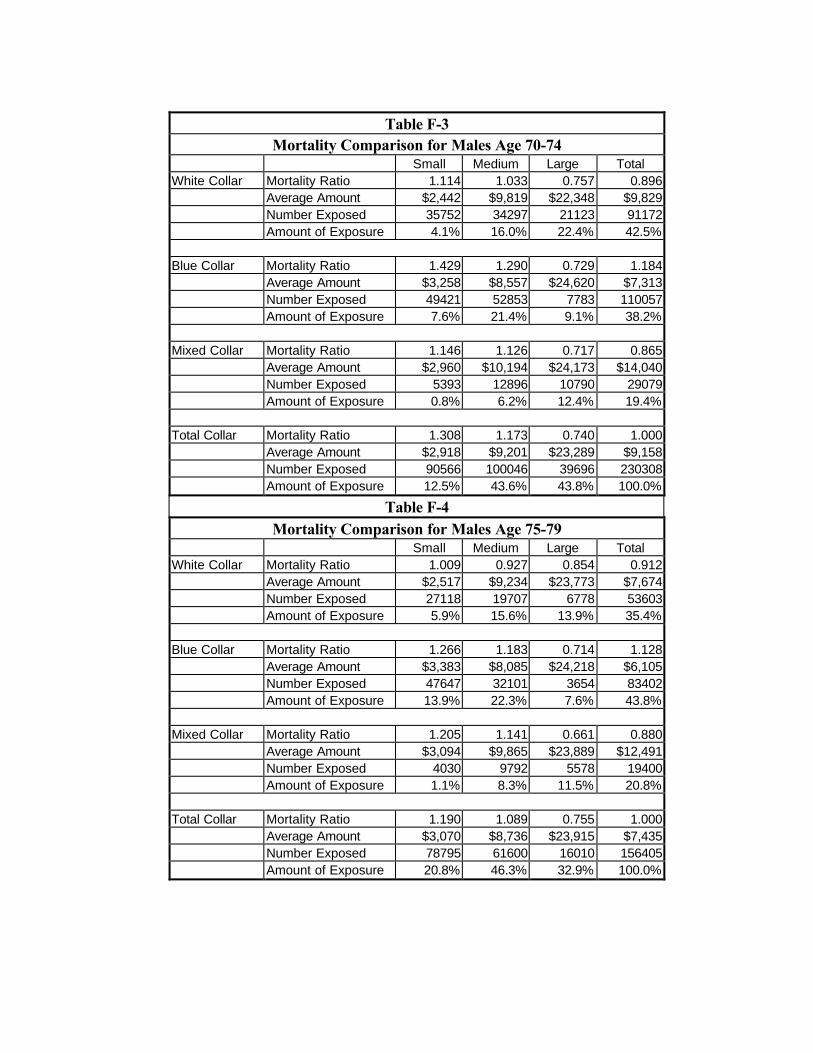
Table F-3Mortality Comparison for Males Age 70-74
Small Medium Large TotalWhite Collar Mortality Ratio 1.114 1.033 0.757 0.896
Average Amount $2,442 $9,819 $22,348 $9,829Number Exposed 35752 34297 21123 91172Amount of Exposure 4.1% 16.0% 22.4% 42.5%
Blue Collar Mortality Ratio 1.429 1.290 0.729 1.184Average Amount $3,258 $8,557 $24,620 $7,313Number Exposed 49421 52853 7783 110057Amount of Exposure 7.6% 21.4% 9.1% 38.2%
Mixed Collar Mortality Ratio 1.146 1.126 0.717 0.865Average Amount $2,960 $10,194 $24,173 $14,040Number Exposed 5393 12896 10790 29079Amount of Exposure 0.8% 6.2% 12.4% 19.4%
Total Collar Mortality Ratio 1.308 1.173 0.740 1.000Average Amount $2,918 $9,201 $23,289 $9,158Number Exposed 90566 100046 39696 230308Amount of Exposure 12.5% 43.6% 43.8% 100.0%
Table F-4Mortality Comparison for Males Age 75-79
Small Medium Large TotalWhite Collar Mortality Ratio 1.009 0.927 0.854 0.912
Average Amount $2,517 $9,234 $23,773 $7,674Number Exposed 27118 19707 6778 53603Amount of Exposure 5.9% 15.6% 13.9% 35.4%
Blue Collar Mortality Ratio 1.266 1.183 0.714 1.128Average Amount $3,383 $8,085 $24,218 $6,105Number Exposed 47647 32101 3654 83402Amount of Exposure 13.9% 22.3% 7.6% 43.8%
Mixed Collar Mortality Ratio 1.205 1.141 0.661 0.880Average Amount $3,094 $9,865 $23,889 $12,491Number Exposed 4030 9792 5578 19400Amount of Exposure 1.1% 8.3% 11.5% 20.8%
Total Collar Mortality Ratio 1.190 1.089 0.755 1.000Average Amount $3,070 $8,736 $23,915 $7,435Number Exposed 78795 61600 16010 156405Amount of Exposure 20.8% 46.3% 32.9% 100.0%
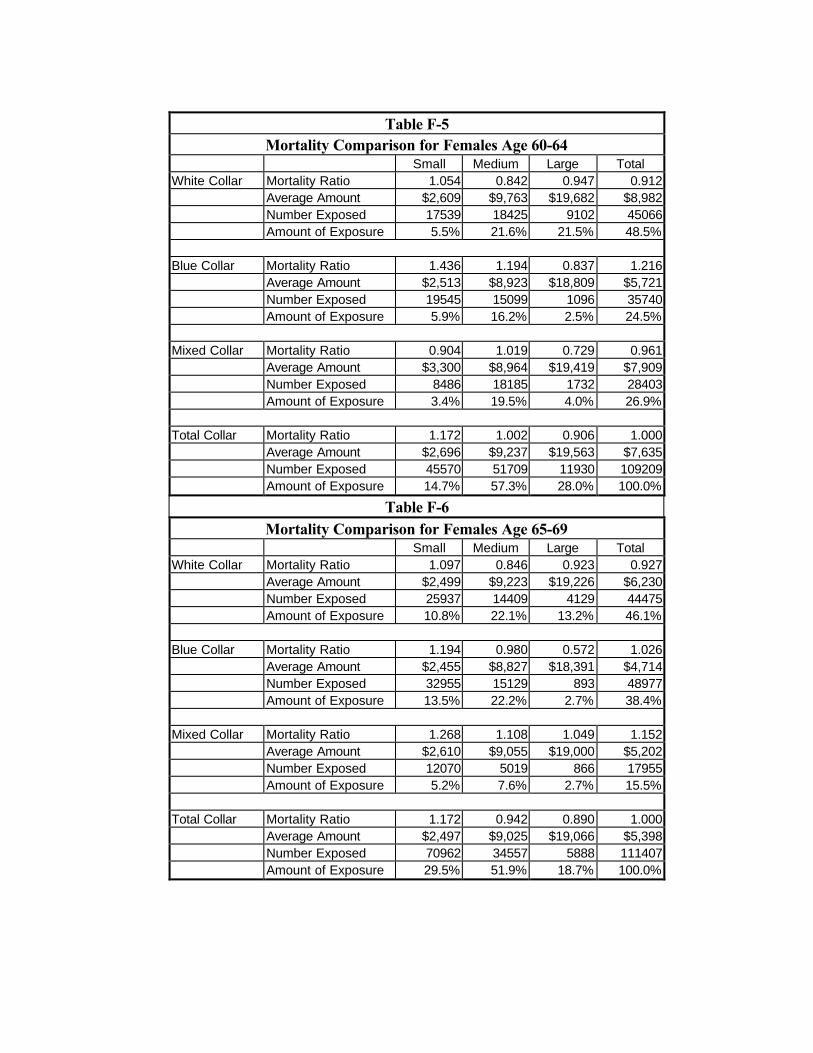
Table F-5Mortality Comparison for Females Age 60-64
Small Medium Large TotalWhite Collar Mortality Ratio 1.054 0.842 0.947 0.912
Average Amount $2,609 $9,763 $19,682 $8,982Number Exposed 17539 18425 9102 45066Amount of Exposure 5.5% 21.6% 21.5% 48.5%
Blue Collar Mortality Ratio 1.436 1.194 0.837 1.216Average Amount $2,513 $8,923 $18,809 $5,721Number Exposed 19545 15099 1096 35740Amount of Exposure 5.9% 16.2% 2.5% 24.5%
Mixed Collar Mortality Ratio 0.904 1.019 0.729 0.961Average Amount $3,300 $8,964 $19,419 $7,909Number Exposed 8486 18185 1732 28403Amount of Exposure 3.4% 19.5% 4.0% 26.9%
Total Collar Mortality Ratio 1.172 1.002 0.906 1.000Average Amount $2,696 $9,237 $19,563 $7,635Number Exposed 45570 51709 11930 109209Amount of Exposure 14.7% 57.3% 28.0% 100.0%
Table F-6Mortality Comparison for Females Age 65-69
Small Medium Large TotalWhite Collar Mortality Ratio 1.097 0.846 0.923 0.927
Average Amount $2,499 $9,223 $19,226 $6,230Number Exposed 25937 14409 4129 44475Amount of Exposure 10.8% 22.1% 13.2% 46.1%
Blue Collar Mortality Ratio 1.194 0.980 0.572 1.026Average Amount $2,455 $8,827 $18,391 $4,714Number Exposed 32955 15129 893 48977Amount of Exposure 13.5% 22.2% 2.7% 38.4%
Mixed Collar Mortality Ratio 1.268 1.108 1.049 1.152Average Amount $2,610 $9,055 $19,000 $5,202Number Exposed 12070 5019 866 17955Amount of Exposure 5.2% 7.6% 2.7% 15.5%
Total Collar Mortality Ratio 1.172 0.942 0.890 1.000Average Amount $2,497 $9,025 $19,066 $5,398Number Exposed 70962 34557 5888 111407Amount of Exposure 29.5% 51.9% 18.7% 100.0%
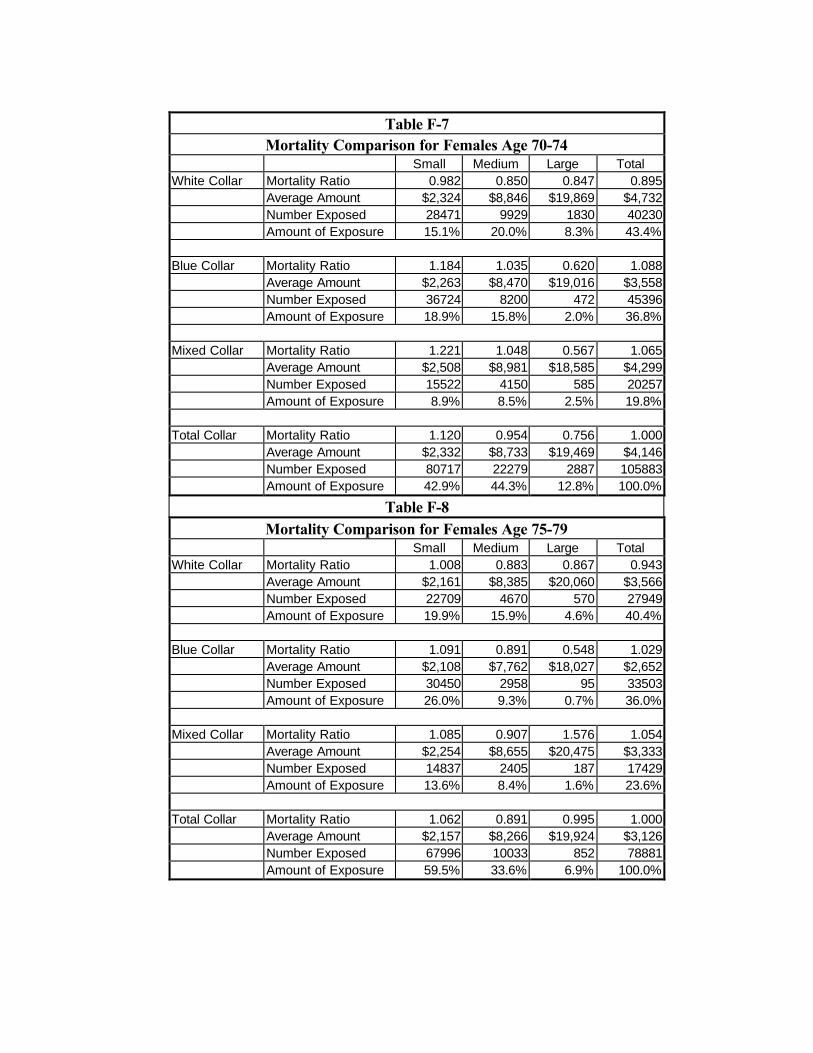
Table F-7Mortality Comparison for Females Age 70-74
Small Medium Large TotalWhite Collar Mortality Ratio 0.982 0.850 0.847 0.895
Average Amount $2,324 $8,846 $19,869 $4,732Number Exposed 28471 9929 1830 40230Amount of Exposure 15.1% 20.0% 8.3% 43.4%
Blue Collar Mortality Ratio 1.184 1.035 0.620 1.088Average Amount $2,263 $8,470 $19,016 $3,558Number Exposed 36724 8200 472 45396Amount of Exposure 18.9% 15.8% 2.0% 36.8%
Mixed Collar Mortality Ratio 1.221 1.048 0.567 1.065Average Amount $2,508 $8,981 $18,585 $4,299Number Exposed 15522 4150 585 20257Amount of Exposure 8.9% 8.5% 2.5% 19.8%
Total Collar Mortality Ratio 1.120 0.954 0.756 1.000Average Amount $2,332 $8,733 $19,469 $4,146Number Exposed 80717 22279 2887 105883Amount of Exposure 42.9% 44.3% 12.8% 100.0%
Table F-8Mortality Comparison for Females Age 75-79
Small Medium Large TotalWhite Collar Mortality Ratio 1.008 0.883 0.867 0.943
Average Amount $2,161 $8,385 $20,060 $3,566Number Exposed 22709 4670 570 27949Amount of Exposure 19.9% 15.9% 4.6% 40.4%
Blue Collar Mortality Ratio 1.091 0.891 0.548 1.029Average Amount $2,108 $7,762 $18,027 $2,652Number Exposed 30450 2958 95 33503Amount of Exposure 26.0% 9.3% 0.7% 36.0%
Mixed Collar Mortality Ratio 1.085 0.907 1.576 1.054Average Amount $2,254 $8,655 $20,475 $3,333Number Exposed 14837 2405 187 17429Amount of Exposure 13.6% 8.4% 1.6% 23.6%
Total Collar Mortality Ratio 1.062 0.891 0.995 1.000Average Amount $2,157 $8,266 $19,924 $3,126Number Exposed 67996 10033 852 78881Amount of Exposure 59.5% 33.6% 6.9% 100.0%
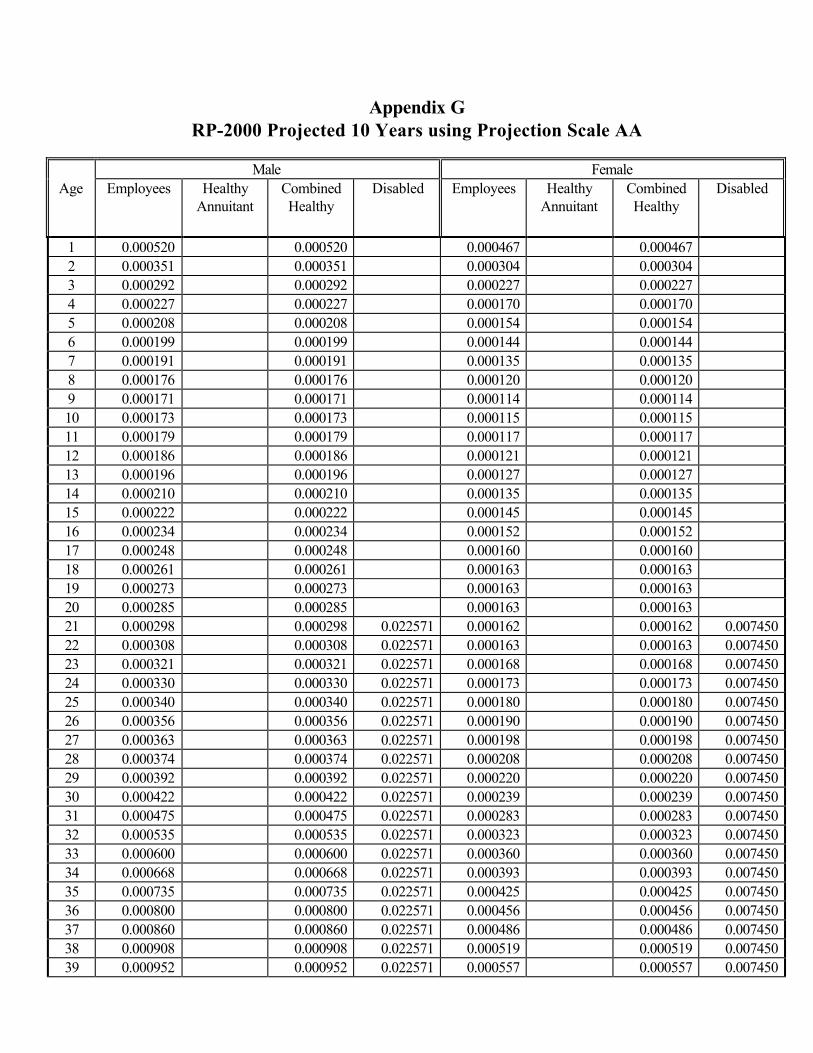
Appendix GRP-2000 Projected 10 Years using Projection Scale AA
Male FemaleAge Employees Healthy
AnnuitantCombinedHealthy
Disabled Employees HealthyAnnuitant
CombinedHealthy
Disabled
1 0.000520 0.000520 0.000467 0.0004672 0.000351 0.000351 0.000304 0.0003043 0.000292 0.000292 0.000227 0.0002274 0.000227 0.000227 0.000170 0.0001705 0.000208 0.000208 0.000154 0.0001546 0.000199 0.000199 0.000144 0.0001447 0.000191 0.000191 0.000135 0.0001358 0.000176 0.000176 0.000120 0.0001209 0.000171 0.000171 0.000114 0.00011410 0.000173 0.000173 0.000115 0.00011511 0.000179 0.000179 0.000117 0.00011712 0.000186 0.000186 0.000121 0.00012113 0.000196 0.000196 0.000127 0.00012714 0.000210 0.000210 0.000135 0.00013515 0.000222 0.000222 0.000145 0.00014516 0.000234 0.000234 0.000152 0.00015217 0.000248 0.000248 0.000160 0.00016018 0.000261 0.000261 0.000163 0.00016319 0.000273 0.000273 0.000163 0.00016320 0.000285 0.000285 0.000163 0.00016321 0.000298 0.000298 0.022571 0.000162 0.000162 0.00745022 0.000308 0.000308 0.022571 0.000163 0.000163 0.00745023 0.000321 0.000321 0.022571 0.000168 0.000168 0.00745024 0.000330 0.000330 0.022571 0.000173 0.000173 0.00745025 0.000340 0.000340 0.022571 0.000180 0.000180 0.00745026 0.000356 0.000356 0.022571 0.000190 0.000190 0.00745027 0.000363 0.000363 0.022571 0.000198 0.000198 0.00745028 0.000374 0.000374 0.022571 0.000208 0.000208 0.00745029 0.000392 0.000392 0.022571 0.000220 0.000220 0.00745030 0.000422 0.000422 0.022571 0.000239 0.000239 0.00745031 0.000475 0.000475 0.022571 0.000283 0.000283 0.00745032 0.000535 0.000535 0.022571 0.000323 0.000323 0.00745033 0.000600 0.000600 0.022571 0.000360 0.000360 0.00745034 0.000668 0.000668 0.022571 0.000393 0.000393 0.00745035 0.000735 0.000735 0.022571 0.000425 0.000425 0.00745036 0.000800 0.000800 0.022571 0.000456 0.000456 0.00745037 0.000860 0.000860 0.022571 0.000486 0.000486 0.00745038 0.000908 0.000908 0.022571 0.000519 0.000519 0.00745039 0.000952 0.000952 0.022571 0.000557 0.000557 0.007450
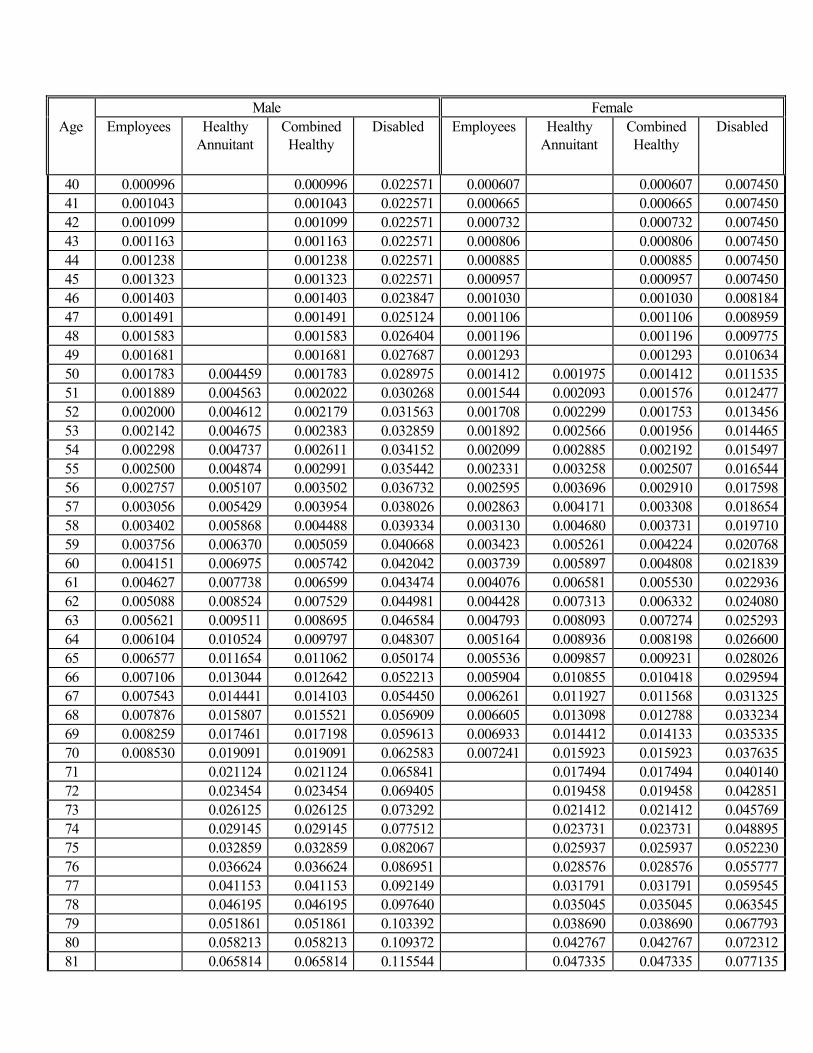
Male FemaleAge Employees Healthy
AnnuitantCombinedHealthy
Disabled Employees HealthyAnnuitant
CombinedHealthy
Disabled
40 0.000996 0.000996 0.022571 0.000607 0.000607 0.00745041 0.001043 0.001043 0.022571 0.000665 0.000665 0.00745042 0.001099 0.001099 0.022571 0.000732 0.000732 0.00745043 0.001163 0.001163 0.022571 0.000806 0.000806 0.00745044 0.001238 0.001238 0.022571 0.000885 0.000885 0.00745045 0.001323 0.001323 0.022571 0.000957 0.000957 0.00745046 0.001403 0.001403 0.023847 0.001030 0.001030 0.00818447 0.001491 0.001491 0.025124 0.001106 0.001106 0.00895948 0.001583 0.001583 0.026404 0.001196 0.001196 0.00977549 0.001681 0.001681 0.027687 0.001293 0.001293 0.01063450 0.001783 0.004459 0.001783 0.028975 0.001412 0.001975 0.001412 0.01153551 0.001889 0.004563 0.002022 0.030268 0.001544 0.002093 0.001576 0.01247752 0.002000 0.004612 0.002179 0.031563 0.001708 0.002299 0.001753 0.01345653 0.002142 0.004675 0.002383 0.032859 0.001892 0.002566 0.001956 0.01446554 0.002298 0.004737 0.002611 0.034152 0.002099 0.002885 0.002192 0.01549755 0.002500 0.004874 0.002991 0.035442 0.002331 0.003258 0.002507 0.01654456 0.002757 0.005107 0.003502 0.036732 0.002595 0.003696 0.002910 0.01759857 0.003056 0.005429 0.003954 0.038026 0.002863 0.004171 0.003308 0.01865458 0.003402 0.005868 0.004488 0.039334 0.003130 0.004680 0.003731 0.01971059 0.003756 0.006370 0.005059 0.040668 0.003423 0.005261 0.004224 0.02076860 0.004151 0.006975 0.005742 0.042042 0.003739 0.005897 0.004808 0.02183961 0.004627 0.007738 0.006599 0.043474 0.004076 0.006581 0.005530 0.02293662 0.005088 0.008524 0.007529 0.044981 0.004428 0.007313 0.006332 0.02408063 0.005621 0.009511 0.008695 0.046584 0.004793 0.008093 0.007274 0.02529364 0.006104 0.010524 0.009797 0.048307 0.005164 0.008936 0.008198 0.02660065 0.006577 0.011654 0.011062 0.050174 0.005536 0.009857 0.009231 0.02802666 0.007106 0.013044 0.012642 0.052213 0.005904 0.010855 0.010418 0.02959467 0.007543 0.014441 0.014103 0.054450 0.006261 0.011927 0.011568 0.03132568 0.007876 0.015807 0.015521 0.056909 0.006605 0.013098 0.012788 0.03323469 0.008259 0.017461 0.017198 0.059613 0.006933 0.014412 0.014133 0.03533570 0.008530 0.019091 0.019091 0.062583 0.007241 0.015923 0.015923 0.03763571 0.021124 0.021124 0.065841 0.017494 0.017494 0.04014072 0.023454 0.023454 0.069405 0.019458 0.019458 0.04285173 0.026125 0.026125 0.073292 0.021412 0.021412 0.04576974 0.029145 0.029145 0.077512 0.023731 0.023731 0.04889575 0.032859 0.032859 0.082067 0.025937 0.025937 0.05223076 0.036624 0.036624 0.086951 0.028576 0.028576 0.05577777 0.041153 0.041153 0.092149 0.031791 0.031791 0.05954578 0.046195 0.046195 0.097640 0.035045 0.035045 0.06354579 0.051861 0.051861 0.103392 0.038690 0.038690 0.06779380 0.058213 0.058213 0.109372 0.042767 0.042767 0.07231281 0.065814 0.065814 0.115544 0.047335 0.047335 0.077135
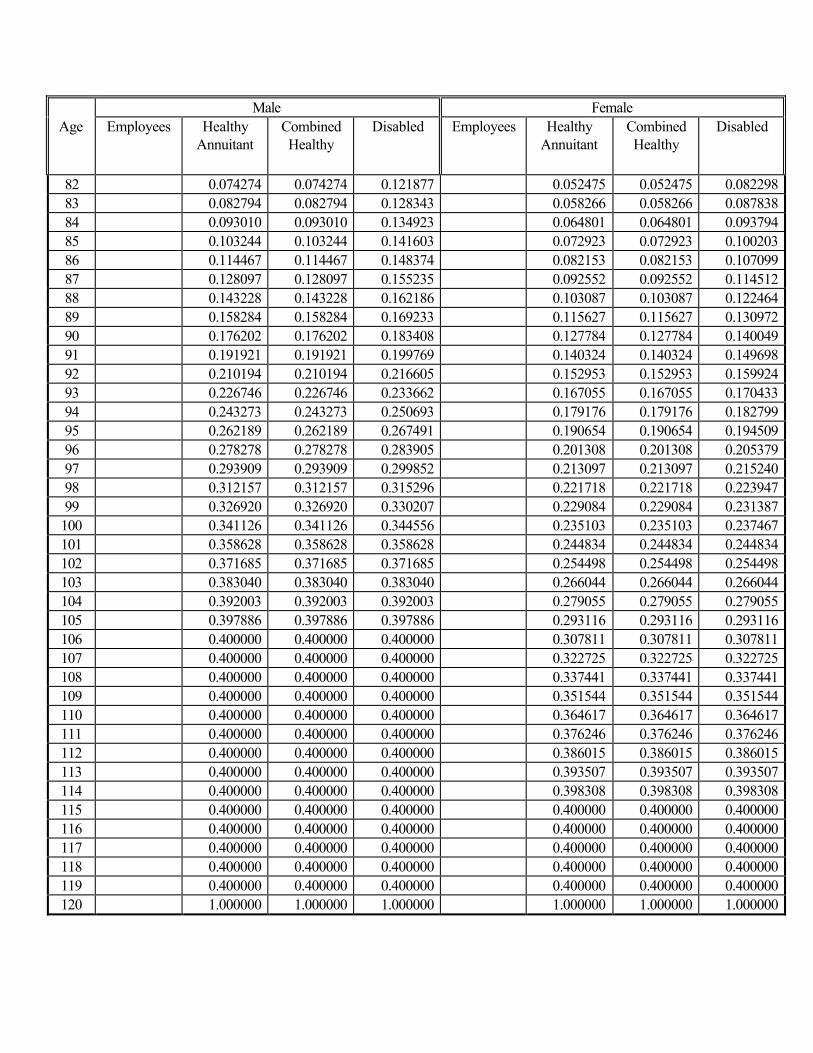
Male FemaleAge Employees Healthy
AnnuitantCombinedHealthy
Disabled Employees HealthyAnnuitant
CombinedHealthy
Disabled
82 0.074274 0.074274 0.121877 0.052475 0.052475 0.08229883 0.082794 0.082794 0.128343 0.058266 0.058266 0.08783884 0.093010 0.093010 0.134923 0.064801 0.064801 0.09379485 0.103244 0.103244 0.141603 0.072923 0.072923 0.10020386 0.114467 0.114467 0.148374 0.082153 0.082153 0.10709987 0.128097 0.128097 0.155235 0.092552 0.092552 0.11451288 0.143228 0.143228 0.162186 0.103087 0.103087 0.12246489 0.158284 0.158284 0.169233 0.115627 0.115627 0.13097290 0.176202 0.176202 0.183408 0.127784 0.127784 0.14004991 0.191921 0.191921 0.199769 0.140324 0.140324 0.14969892 0.210194 0.210194 0.216605 0.152953 0.152953 0.15992493 0.226746 0.226746 0.233662 0.167055 0.167055 0.17043394 0.243273 0.243273 0.250693 0.179176 0.179176 0.18279995 0.262189 0.262189 0.267491 0.190654 0.190654 0.19450996 0.278278 0.278278 0.283905 0.201308 0.201308 0.20537997 0.293909 0.293909 0.299852 0.213097 0.213097 0.21524098 0.312157 0.312157 0.315296 0.221718 0.221718 0.22394799 0.326920 0.326920 0.330207 0.229084 0.229084 0.231387
100 0.341126 0.341126 0.344556 0.235103 0.235103 0.237467101 0.358628 0.358628 0.358628 0.244834 0.244834 0.244834102 0.371685 0.371685 0.371685 0.254498 0.254498 0.254498103 0.383040 0.383040 0.383040 0.266044 0.266044 0.266044104 0.392003 0.392003 0.392003 0.279055 0.279055 0.279055105 0.397886 0.397886 0.397886 0.293116 0.293116 0.293116106 0.400000 0.400000 0.400000 0.307811 0.307811 0.307811107 0.400000 0.400000 0.400000 0.322725 0.322725 0.322725108 0.400000 0.400000 0.400000 0.337441 0.337441 0.337441109 0.400000 0.400000 0.400000 0.351544 0.351544 0.351544110 0.400000 0.400000 0.400000 0.364617 0.364617 0.364617111 0.400000 0.400000 0.400000 0.376246 0.376246 0.376246112 0.400000 0.400000 0.400000 0.386015 0.386015 0.386015113 0.400000 0.400000 0.400000 0.393507 0.393507 0.393507114 0.400000 0.400000 0.400000 0.398308 0.398308 0.398308115 0.400000 0.400000 0.400000 0.400000 0.400000 0.400000116 0.400000 0.400000 0.400000 0.400000 0.400000 0.400000117 0.400000 0.400000 0.400000 0.400000 0.400000 0.400000118 0.400000 0.400000 0.400000 0.400000 0.400000 0.400000119 0.400000 0.400000 0.400000 0.400000 0.400000 0.400000120 1.000000 1.000000 1.000000 1.000000 1.000000 1.000000