Embed Size (px)
Citation preview

Page 1 of 46
The Royal Wolverhampton NHS Trust
Trust Board Report
Meeting Date: 27 June 2016
Title: Consultant Outcome Report 2015 - 2016 Publication
Executive Summary: This report shows a summary of the latest Consultant Outcomes
Publication. The outcomes are presented at hospital (where available) and
consultant level. Data include mortality rates and for some specialties
additional indicators. RWT consultants’ outcomes have been published for
seven surgical specialties and selected indicators. All indicators with data
for RWT show outcomes within expected range or better than predicted.
Two measured outcomes for Interventional Cardiology, survival rates and
freedom from major adverse cardiac and cerebrovascular event (MACCE),
were better than predicted for RWT.
Action Requested: Report for information and assurance
Report of: Medical Director
Author: Contact Details:
Dr J Odum, Medical Director
Tel 01902 695958 Email [email protected]
Resource Implications: None
Public or Private: (with
reasons if private) Public Session
References: (e.g. from/to
other committees)
Appendices/ References/Background Reading
All indicators and further explanation of methodologies used are available on http://www.nhs.uk/service-search/performance/Consultants
NHS Constitution:
(How it impacts on any decision-making)
In determining this matter, the Board should have regard to the Core principles contained in the Constitution of:
Equality of treatment and access to services
High standards of excellence and professionalism
Service user preferences
Cross community working
Best Value
Accountability through local influence and scrutiny
Background Details
Please see Summary section

Page 2 of 46
CONSULTANT OUTCOMES PUBLICATION 2015-16
TABLE OF CONTENTS
Table of Contents ............................................................................................................................................. 2
Summary .......................................................................................................................................................... 3
Published data by specialty for The Royal Wolverhampton NHS Trust (RWT) ................................................ 4
Adult cardiac surgery ................................................................................................................................... 4
Hospital Level Data ..................................................................................................................................4
Consultant level Data ...............................................................................................................................5
Colorectal surgery ........................................................................................................................................ 9
Hospital Level Data ............................................................................................................................... 10
Consultant Level Data ........................................................................................................................... 10
Interventional cardiology ........................................................................................................................... 12
Hospital Level Data ............................................................................................................................... 12
Consultant Level Data ........................................................................................................................... 14
Lung cancer ................................................................................................................................................ 21
Hospital Level Data ............................................................................................................................... 21
Orthopaedic surgery .................................................................................................................................. 23
Hospital Level Data - New Cross Hospital ............................................................................................. 23
Consultant Level Data – Risk adjusted 90-day mortality ...................................................................... 27
Urological surgery ...................................................................................................................................... 41
Consultant Level Data - Nephrectomy morbidity and stay length ....................................................... 41

Page 3 of 46
SUMMARY
This report extracts information for The Royal Wolverhampton NHS Trust (RWT) and the consultants
practising at this Trust from the latest publication of consultant outcomes for selected specialties in
England. Specialties were chosen if they were covered by an audit that was felt fit for purpose, or in a
position that they could be developed so they are fit for purpose. The initiative is expected to expand over
time to include other specialties. Each specialty published data showing, for each consultant, how many
times they have performed a procedure and what their mortality rate is for that procedure. Each specialty
has decided which procedures to include and what measure of mortality to show, based upon what is
most relevant to their patients and what data are collected. Some specialties published additional
outcomes data. Where possible, data are adjusted to take into consideration the risk of a procedure on
patients with different risk factors.
Six specialties have published data for RWT and consultants practising at this Trust and the details are
found under each specialty’s section in the report. The following are included: Adult cardiac surgery,
Colorectal surgery, Interventional cardiology, Lung cancer, Orthopaedic surgery (data available only for
hip and knee procedures) and Urological surgery. The Head and neck cancer surgery specialty hasn’t
published updated data at the time of writing this report.
All outcomes included in the publication for consultants at RWT are within expected range and in some
instances outcomes are better than predicted. Two measured outcomes for Interventional Cardiology,
survival rates and freedom from major adverse cardiac and cerebrovascular event (MACCE), were better
than predicted for RWT.

Page 4 of 46
PUBLISHED DATA BY SPECIALTY FOR THE ROYAL WOLVERHAMPTON NHS TRUST
(RWT)
ADULT CARDIAC SURGERY
All graphs included for this specialty are based on UK data from the National Adult Cardiac Surgery Audit.
Data for congenital, paediatric or thoracic surgery are not included. Adult Cardiac surgery is surgery on
the heart and the large blood vessels in the chest in patients above the age of 16 years. It is most often
done to treat complications of narrowing of the coronary arteries due to 'hardening' of the blood vessels.
It is also practiced to treat disease of the heart valves caused by infection, rheumatic heart disease,
calcification and narrowing, or when the valves become stretched up and start to leak.
HOSPITAL LEVEL DATA
IN-HOSPITAL SURVIVAL RATE (RISK ADJUSTED)
This graph shows the percentage of patients who survived their operation. This is called the ‘in-hospital
survival rate’.
Some units do more complicated surgery on patients who are sicker, whilst others do fairly routine
surgery. So that we can make fair comparisons between these units, the survival rate has been ‘risk
adjusted’ to take into account the difficulty of each operation.
The dot in the graph shows the risk-adjusted survival rate for RWT. The area between the two dotted lines
is the range in which the dot will appear if the results are as expected.
Further information on understanding the survival rates graphs can be accessed at
http://scts.org/patients/understanding_mortality_rates.aspx.

Page 5 of 46
CONSULTANT LEVEL DATA
The results shown are combined totals across all the hospitals within which a consultant has worked
during the collation period.
Consultant name Volume of operations
Risk adjusted in-hospital survival rate
Moninder Bhabra 472 97.35%
John Billing 517 98.53%
Heyman Luckraz 358 98.75%
Maciej Matuszewski 511 99.12%
Ian Morgan 234 97.08%
Mazhar Ur Rehman 174 100%
Patrick Yiu 397 98.52%
Within expected limits
1. Moninder Singh Bhabra

Page 6 of 46
2. John Stephen Billing
3. Heyman Luckraz

Page 7 of 46
4. Maciej Matuszewski
5. Ian Stewart Morgan

Page 8 of 46
6. Mazhar Ur Rehman
7. Patrick Yiu
(source: Society for cardiothoracic Surgery in Great Britain & Ireland – SCTS)

Page 9 of 46
COLORECTAL SURGERY
The outcomes presented here for individual surgeons working in English NHS Trusts are the percentage of
patients who die within the first 90 days after planned removal of a bowel cancer during a four year
period between 2010 and 2014. The mortality results are taken from the National Bowel Cancer Audit, a
national project that reports every year on the treatment and outcomes of patients with bowel cancer for
NHS Trusts and regional Cancer Networks. The overall mortality rate for planned bowel cancer surgery in
England was 2.8%. No surgeon was an outlier in this year’s report. The data were extracted from the
National Bowel Cancer Audit. This audit has been collecting data on patients with bowel cancer admitted
to NHS hospitals for many years. The Audit collects information about the patients and their cancer, the
treatments received and follow-up. The number of patients included in the Audit and the quality of data
have increased year on year.
90-day mortality is a readily available but quite crude measure of the performance of a surgeon. It does
not give any information on important aspects of that surgeon’s care, such as success at completely
removing the cancer, how well the surgeon interacts with the patient, and the frequency of complications
after surgery. The outcomes reported here are for a specific time period and represent only a snapshot of
a surgeon’s overall activity.
The surgeon’s 90-day mortality will vary over time as a result of the play of chance. During the reporting
period, some surgeons may have had clusters of poor results which may then be followed by clusters of
better results depending when the data are extracted. In other words, caution should be exercised when
using these data to predict future surgical performance (just like the warning that comes with any
financial investment).
Most colorectal surgeons will perform 20 or more planned operations to remove a colorectal cancer per
year. They will also operate on a number of patients who present for the first time as an emergency with
the complications of bowel cancer. In addition, they operate on many other patients with non-cancerous
conditions of their bowel. Thus, the patients included in this analysis are only a proportion of the bowel
operations that an individual colorectal surgeon has performed.
It has been calculated that a colorectal surgeon would need outcome data on over 150 patients before
there is an 8 out of 10 chance of spotting genuine poor performance. For this reason, although there is a
wide range of mortality between different surgeons, for the vast majority, their outcome falls within an
accepted range. With low numbers, a surgeon could have a high death rate simply by chance and be
wrongly labelled as performing poorly. Similarly, low numbers could mask a poorly performing surgeon
and engender complacency.
The results reported here have been adjusted for case-mix to ensure that surgeons who take on more
difficult cases are not unfairly penalised. Some surgeons may have treated patients who had more
advanced cancer or patients who had other medical conditions. This adjustment was carried out by using
a statistical technique called risk adjustment. Depending on the risk profile of their patients, the results of
some surgeons were adjusted upwards (these surgeons had operated on patients for whom a statistical
risk model had predicted a lower than average risk of dying after the operation) whilst the results for
other surgeons were adjusted downwards (these surgeons had operated on patients for whom a higher
than average risk had been predicted). Details of the methods used to carry out the risk adjustment can
be found in the Annual Report of the Audit.
Patients suffering with colorectal cancer tend to be elderly and often suffer a number of other medical
conditions such as heart and lung disease. These problems put them at a high risk of developing non-
surgical complications following major abdominal surgery. About two thirds of patients who die in the

Page 10 of 46
postoperative period following bowel cancer resection succumb from complications of their associated
medical conditions, rather than as a result of surgical complications.
Bowel cancer can affect different parts of the large intestine; tumours in the lower part (rectum) are more
difficult to remove and surgery takes longer because of the relative inaccessibility of this part of the
bowel. Complications are more common for rectal cancer surgery than for surgery to remove tumours in
the colon. Some surgeons may have developed a special interest and skill in dealing with particular types
of bowel cancer and therefore treat higher risk patients than other colleagues. Thus the case mix is likely
to vary from surgeon to surgeon and with it the outcome of the surgery.
Further information about this audit can be accessed at http://www.acpgbi.org.uk/surgeon-
outcomes/explanatory-notes/.
HOSPITAL LEVEL DATA
CONSULTANT LEVEL DATA

Page 11 of 46
The dots show the result for an individual NHS Trust / surgeon.
a RED dot indicates the outcome(s) for this named Trust / surgeons working at the trust
a BLUE dot indicates the outcome(s) for all other Trust / surgeons
Vertical axis (y axis) is the adjusted 90-day post-operative mortality (%). Horizontal axis (x axis) is the
number of operations (volume) performed at a trust / by a surgeon.
The green zone shows the range of mortality that could be explained by random variation. A Trust /
surgeon within this zone has a mortality rate that can be explained by random variation alone. The zone is
funnel shaped because outcomes at low volumes are more affected by random variation (giving a larger
acceptable range) than at high volumes, where less random variation has less effect The pink zone shows
the area above the funnel limit – a Trust / surgeon in this area is identified as an “outlier”. This means that
the Trust/surgeon has been asked to check the accuracy of their data and examine what might have
caused the higher than expected rate.
Consultant Name Procedures Deaths Adjusted 90-day
mortality rate
ACPGBI
surgeon *
Elgaddal, Sanaa 132 1 0.5 Yes
Williams, Graham 110 5 4.4 Yes
Soulsby, Ruth 87 0 0 Yes
Badger, Ian 85 3 3 Yes
Mirza, Nazzia Nosheen 25 0 0 Yes
* This denotes whether this surgeon is a member of the Association of Coloproctology of Great Britain
and Ireland.
(source: the Association of Coloproctology of Great Britain and Ireland)

Page 12 of 46
INTERVENTIONAL CARDIOLOGY
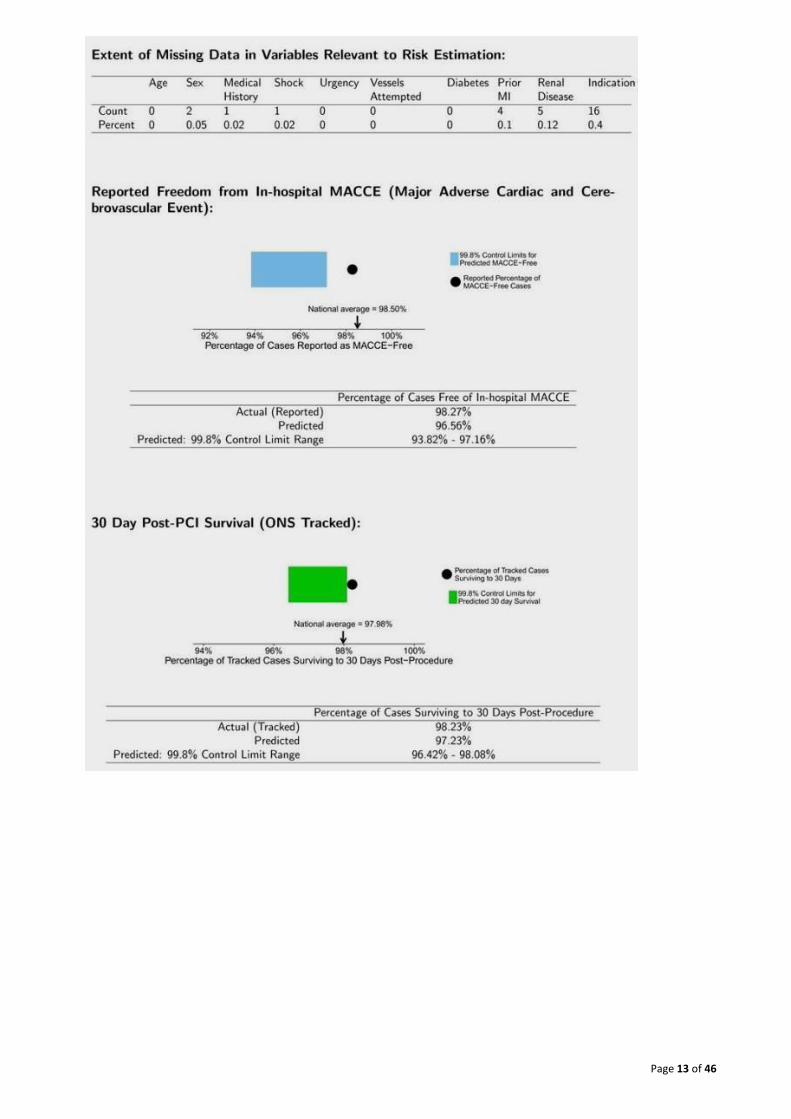
Data from 1st January 2012 to 31st December 2014 are included for this specialty. A total of 4009
percutaneous coronary interventions (PCI) have been performed at RWT. Two measured outcomes,
survival rates and freedom from major adverse cardiac and cerebrovascular event (MACCE) were better
than predicted for RWT.
The assessment of risk adjusted outcomes is dependent on the accuracy and completeness of data
submitted by the operator and PCI hospitals to NICOR for analysis. In order to assess the risk adjusted
outcome, certain patient characteristics must be included in the data submitted for each patient. If the
data submitted are complete, then there will be no missing data, and so the best data are characterised
by having ‘0’ in every place in the table. As the amount of missing data increases, the risk adjustment
estimate becomes less accurate.
MACCE stands for major adverse cerebrovascular or cardiovascular events. It includes death, stroke,
myocardial infarction caused by PCI and the need for emergency cardiac surgery because of a
complication of PCI. In this analysis, events up to the time of hospital discharge are included. The
freedom from MACCE % shown in the graph is the percentage of these events as reported by that
operator.
The horizontal axis shows the freedom from MACCE, running up to 100% freedom (i.e. no MACCE events)
at the far right. The blue bar shows the range of MACCE free % that would have been expected given this
operator’s case mix. The black dot shows the actual reported freedom from MACCE. Provided that the
black dot is within, or to the right of the blue box, then there is no concern about the reported MACCE
rates. For interest the overall national average is marked on the horizontal axis.
30 Day post-PCI Survival (ONS tracked) - the horizontal axis shows survival, running up to 100% at the far
right. The green bar shows the range of survival that would have been expected given this operator’s case
mix. The black dot shows the actual survival independently provided by the Office of National Statistics.
Provided that the black dot is within, or to the right of the green box, then there is no concern about
survival rate following PCI for this operator (or centre). For interest the overall national average is marked
on the horizontal axis.
Further information on methodology can be accessed at
http://www.bcis.org.uk/pages/page_box_contents.asp?pageid=773&navcatid=157.
HOSPITAL LEVEL DATA
Page 13 of 46

Page 14 of 46
CONSULTANT LEVEL DATA
1. Jeffrin Anthony

Page 15 of 46
2. Matthew John Banks

Page 16 of 46
3. James Cotton

Page 17 of 46
4. Jalaluddin Jaumdally (visiting Consultant from Walsall)

Page 18 of 46
5. Saib Khogali

Page 19 of 46
6. Jose Martins (visiting Consultant from Walsall)

Page 20 of 46
7. Michael Norell
(source: British Cardiovascular Intervention Society; data generated by the NICOR Analysis Team on 4
September 2015 based on data as of 27 August 2015
http://www.bcis.org.uk/pages/operator.asp?navcatid=88&Type=surgeon&id=7159)

Page 21 of 46
LUNG CANCER
Data were collected from all the hospital trusts in England that act as lung cancer surgical units. These 28
units provide lung cancer surgery to patients who were referred for surgery by the multidisciplinary team
(MDT) responsible for their care.
The 30/ 90 day post-operative crude mortality of a trust as a percentage shows what proportion of
patients had died within 30/ 90 days after their operation, for lung cancer operations that took place in
2013. This counts all deaths, including any that might not be related to lung cancer or the patient's recent
surgery. The life / death status of patients was traced with data from the Office for National Statistics
(ONS) and almost all (99.5%) patients were found.
The percentage is not risk adjusted - it does not take into account that some patients might be sicker than
others and so be at a higher risk of complications or death. A risk model is being developed for this
project and it is anticipated that a more robust risk adjusted data will be presented next year.
The point representing RWT is highlighted in the graph below.
The background to the chart is shaded in four colours: red (top), yellow, light green and dark green (a
small strip at the foot of the chart). Trusts that are shown in either green area of the graph have a
mortality rate that is as expected (light green) or better than expected (dark green) given the rate of
deaths within 30 days nationwide. This national rate is shown as a labelled horizontal line on the graph.
If a trust is shown outside these areas then they are thought to have a lower survival rate than the
national rate. Any trust appearing in the red region has a lower survival rate at the 99.8% level. A trust
with an underlying survival rate that is the same as the national rate might appear in these regions by
random chance, but only for 99.8% (red) of cases.
The definition of "alarm" level is the 99.8% p value.
This year all Trusts were within the alarm limits at both 30 and 90 days after surgery. That is to say, there
were no outliers. The small differences seen between individual Trusts are most likely due to chance. For
this indicator only the number of procedures undertaken is available at consultant level.
HOSPITAL LEVEL DATA
Trust
Total
Ops
Post-operative survival
Survival after 30
days
Survival after 90
days
The Royal Wolverhampton NHS Trust 74 71 (95.9%) 69 (93.2%)
England Total 4926 4830 (98.1%) 4726 (95.9%)

Page 22 of 46
Further information about the charts and interpretation can be found at:
http://scts.org/patients/thoracic/data.aspx?type=trust
(source: Society for cardiothoracic Surgery in Great Britain & Ireland – SCTS)

Page 23 of 46
ORTHOPAEDIC SURGERY
(Outcomes data are only published for hip and knee surgery).
HOSPITAL LEVEL DATA - NEW CROSS HOSPITAL
How to interpret the charts
This information display shows how RWT’s hospitals compare to the national rates for a range of patient
improvement and outcomes measures used to demonstrate quality in joint replacement surgery. Against
each measure you will be able to see whether this hospital is performing better than expected, within the
expected range or worse than expected for this type of surgery. In some cases, favourable results are
indicated by higher numbers and in some cases, by lower numbers. This depends on the type of measure
displayed. However, all the thermometer charts have been designed to report better performance on the
right hand side and poorer performance on the left hand side.
This hospital is represented on the chart by the black marker (I). It is important to note that the types of
patients a hospital treats and the procedures it carries out can explain variation in patient outcomes after
surgery.
Important note 1: These data are a snapshot in time of the relative performance of this hospital. A
hospital’s results may fluctuate over time and get progressively better or worse, reflecting the types of
procedures they carry out, implants used and/or the types of patients that they treat among other, local
factors including whether the hospital is providing a full and accurate submission of data to the NJR. For
the revision and mortality information, it is important to note that more recent changes in practice at
these hospitals may not be reflected in the results because of the longer five and ten year time periods
covered and/or insufficient reporting of first-time and revision operation information to the NJR.
Important note 2: This thermometer chart has been created to aid interpretation of the revision ratio and
mortality ratio figures in the table (to the left of the thermometer). It is designed to show where hospitals
perform better or worse than the national average and where their performance is within the expected
range or outside the expected range.
For any given result (whether better or poorer), it also shows how likely it is that their performance has
varied because of ‘chance’ or because of actual practice. This depends on the how far the result is from
the national average and the number of patients on which the analysis is based. The further the hospital
indicator (black marker) is from the centre, the less likely this is to be down to chance, especially if a large
number of patient records have been analysed for the hospital. Where the number of patient records is
low, this might indicate a less certain result.
Important note 3: The green band represents the range over which any performance away from the
national average is not thought to be significant. However, it also worth noting that there is a less than
one in a five hundred chance that the results for any individual hospital could fall outside the expected
range by chance alone.

Page 24 of 46
PATIENT IMPROVEMENT
Patient improvement, featured in the charts below, look at three measures of patient-reported outcomes
that are routinely assessed following hip/knee replacement in England. The measures are referred to
using their technical names 'Oxford hip/knee score', 'EQ-5D' and 'EQ-VAS'.
Data for 1 April 2014 – 31 March 2015
Hips
Knees
PATIENT OUTCOMES
Patient outcomes, featured in the charts below, look at mortality and revision.
Data for 1 April 2003 – 31 July 2015
Hips

Page 25 of 46
Knees
The green banding represents the expected range of performance for hospitals.
The grey dotted line represents the national average.
Further information on how to interpret the charts can be accessed at
http://www.njrsurgeonhospitalprofile.org.uk/.
HOSPITAL RISK ADJUSTED 90-DAY MORTALITY
This shows 90-day mortality following hip/knee surgery at hospital and consultant level, based on the
type of patients the hospital has seen. RWT’s hospital/consultants are highlighted as an orange triangle.
Progression along the horizontal axis (x axis) means that the hospital/ consultant has done more cases
and/or cases at a higher mortality risk such as older patients. Progression along the vertical axis (y axis)
means the hospital/ consultant has had more deaths.
The vertical axis figures are presented as a standardised mortality ratio. This means the values do not
represent percentages of patients who have died, but they represent the proportion of deaths compared
to the national average. The data are also ‘risk adjusted’ to take account of the fact that different
hospitals/ consultants may operate on more higher-risk or lower-risk patients e.g. because of
demographics in the patient population they work with.
- Hospitals/ consultants on the central (green) horizontal line (at national average ratio figure of 1)
have had exactly the average expected mortality.
- Hospitals/ consultants either side of the central green line but below the upper red line have had
a level of mortality that is within the expected range.
- Any hospitals/ consultants that appear above the top red line which represents a Control limit
(99.8%) have a mortality rate that is higher than expected.
The overall 90-day mortality rate following primary hip replacement surgery is approximately 0.4%.
The overall 90-day mortality rate following primary knee replacement surgery is approximately 0.3%.

Page 26 of 46
Data for 1 April 2003 – 31 July 2015
Hips
Knees

Page 27 of 46
CONSULTANT LEVEL DATA – RISK ADJUSTED 90-DAY MORTALITY
1. Sanjiv Chugh (activity recorded at New Cross Hospital, Cannock Chase Hospital, Nuffield Health
Wolverhampton Hospital)
SURGEON RISK ADJUSTED 90-DAY MORTALITY – DATA FOR 1 APRIL 2003 – 31 JULY 2015 - HIPS
SURGEON RISK ADJUSTED 90-DAY MORTALITY – DATA FOR 1 APRIL 2003 – 31 JULY 2015 - KNEES

Page 28 of 46
2. Devendra Shashikant Damany (activity recorded at New Cross Hospital, Nuffield Health
Wolverhampton Hospital)
SURGEON RISK ADJUSTED 90-DAY MORTALITY – DATA FOR 1 APRIL 2003 – 31 JULY 2015 - HIPS
SURGEON RISK ADJUSTED 90-DAY MORTALITY – DATA FOR 1 APRIL 2003 – 31 JULY 2015 - KNEES

Page 29 of 46
3. Shreeram Deshpande (activity recorded at New Cross Hospital, Cannock Chase Hospital,
Nuffield Health Wolverhampton Hospital)
SURGEON RISK ADJUSTED 90-DAY MORTALITY – DATA FOR 1 APRIL 2003 – 31 JULY 2015 - HIPS
SURGEON RISK ADJUSTED 90-DAY MORTALITY – DATA FOR 1 APRIL 2003 – 31 JULY 2015 - KNEES

Page 30 of 46
4. Sukhrajbir Dhillon (activity recorded at New Cross Hospital)
SURGEON RISK ADJUSTED 90-DAY MORTALITY – DATA FOR 1 APRIL 2003 – 31 JULY 2015 - HIPS
5. William James Hart (activity recorded at New Cross Hospital, Cannock Chase Hospital, Nuffield
Health Shrewsbury Hospital, Nuffield Health Wolverhampton Hospital)
SURGEON RISK ADJUSTED 90-DAY MORTALITY – DATA FOR 1 APRIL 2003 – 31 JULY 2015 – HIPS
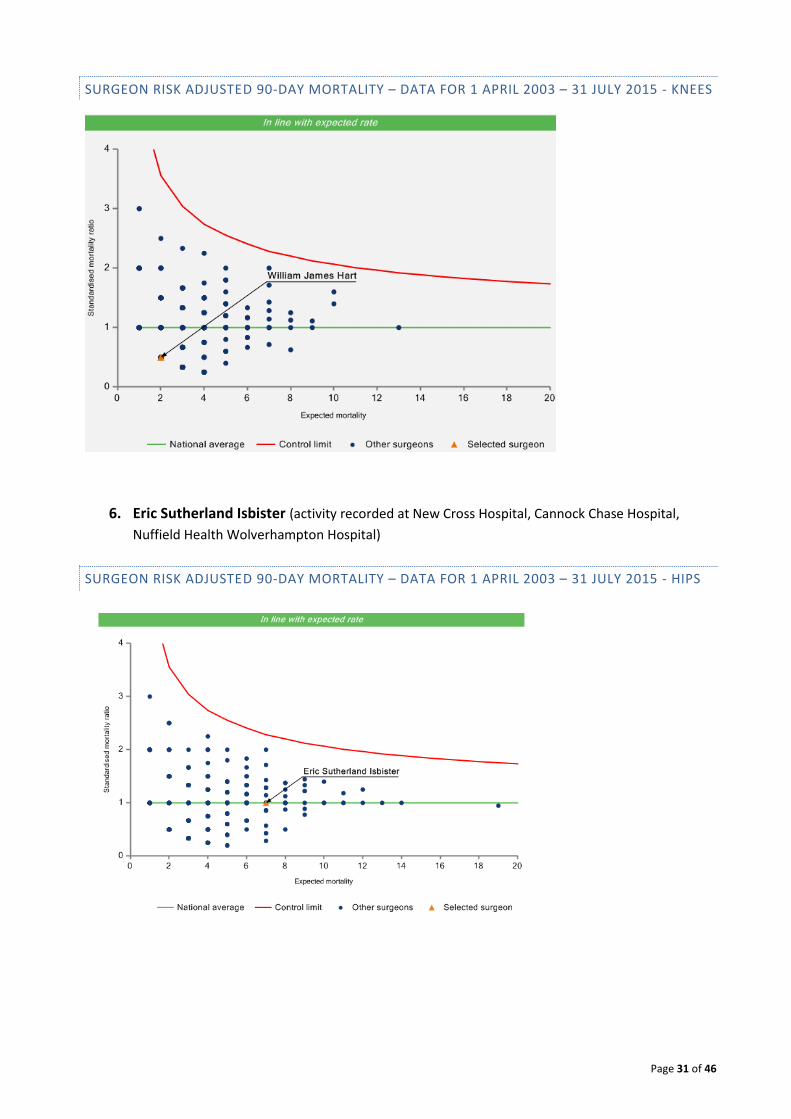
Page 31 of 46
SURGEON RISK ADJUSTED 90-DAY MORTALITY – DATA FOR 1 APRIL 2003 – 31 JULY 2015 - KNEES
6. Eric Sutherland Isbister (activity recorded at New Cross Hospital, Cannock Chase Hospital,
Nuffield Health Wolverhampton Hospital)
SURGEON RISK ADJUSTED 90-DAY MORTALITY – DATA FOR 1 APRIL 2003 – 31 JULY 2015 - HIPS

Page 32 of 46
SURGEON RISK ADJUSTED 90-DAY MORTALITY – DATA FOR 1 APRIL 2003 – 31 JULY 2015 - KNEES
7. Sabur Malek (activity recorded at New Cross Hospital, Cannock Chase Hospital, County Hospital,
Rowley Hall Hospital, Whiston Hospital)
SURGEON RISK ADJUSTED 90-DAY MORTALITY – DATA FOR 1 APRIL 2003 – 31 JULY 2015 - HIPS

Page 33 of 46
SURGEON RISK ADJUSTED 90-DAY MORTALITY – DATA FOR 1 APRIL 2003 – 31 JULY 2015 - KNEES
8. Anthony Marino (activity recorded at New Cross Hospital)
SURGEON RISK ADJUSTED 90-DAY MORTALITY – DATA FOR 1 APRIL 2003 – 31 JULY 2015 - HIPS

Page 34 of 46
SURGEON RISK ADJUSTED 90-DAY MORTALITY – DATA FOR 1 APRIL 2003 – 31 JULY 2015 - KNEES
9. Ejaz Mughal (activity recorded at New Cross Hospital, Cannock Chase Hospital, Nuffield Health
Wolverhampton Hospital)
SURGEON RISK ADJUSTED 90-DAY MORTALITY – DATA FOR 1 APRIL 2003 – 31 JULY 2015 - HIPS

Page 35 of 46
SURGEON RISK ADJUSTED 90-DAY MORTALITY – DATA FOR 1 APRIL 2003 – 31 JULY 2015 - KNEES
10. Gopala Pemmaraju (activity recorded at New Cross Hospital, Cannock Chase Hospital)
SURGEON RISK ADJUSTED 90-DAY MORTALITY – DATA FOR 1 APRIL 2003 – 31 JULY 2015 - HIPS

Page 36 of 46
SURGEON RISK ADJUSTED 90-DAY MORTALITY – DATA FOR 1 APRIL 2003 – 31 JULY 2015 - KNEES
11. Phillip Shaylor (activity recorded at New Cross Hospital, Cannock Chase Hospital, County
Hospital, Rowley Hall Hospital)
SURGEON RISK ADJUSTED 90-DAY MORTALITY – DATA FOR 1 APRIL 2003 – 31 JULY 2015 - HIPS

Page 37 of 46
SURGEON RISK ADJUSTED 90-DAY MORTALITY – DATA FOR 1 APRIL 2003 – 31 JULY 2015 - KNEES
12. Adrian Simons (activity recorded at New Cross Hospital, Nuffield Health Hospital)
SURGEON RISK ADJUSTED 90-DAY MORTALITY – DATA FOR 1 APRIL 2003 – 31 JULY 2015 - HIPS

Page 38 of 46
SURGEON RISK ADJUSTED 90-DAY MORTALITY – DATA FOR 1 APRIL 2003 – 31 JULY 2015 - KNEES
13. David Simpson (activity recorded at New Cross Hospital, Cannock Chase Hospital, Nuffield
Health Hospital)
SURGEON RISK ADJUSTED 90-DAY MORTALITY – DATA FOR 1 APRIL 2003 – 31 JULY 2015 - HIPS

Page 39 of 46
SURGEON RISK ADJUSTED 90-DAY MORTALITY – DATA FOR 1 APRIL 2003 – 31 JULY 2015 - KNEES
14. Osmond Thomas (activity recorded at New Cross Hospital, Nuffield Health Hospital)
SURGEON RISK ADJUSTED 90-DAY MORTALITY – DATA FOR 1 APRIL 2003 – 31 JULY 2015 - HIPS

Page 40 of 46
SURGEON RISK ADJUSTED 90-DAY MORTALITY – DATA FOR 1 APRIL 2003 – 31 JULY 2015 - KNEES

Page 41 of 46
UROLOGICAL SURGERY
Nephrectomy Outcomes Data are published for individual consultants. Variations in the data between
individual surgeons and units may be a reflection of case complexity or patient factors.
The British Association of Urological Surgeons (BAUS) has included all the data returned in the overall
analysis but, in some of the audits, when presenting the individual surgeon’s results, the surgeons who
returned less than five cases for the year were excluded because statistical analysis of such a low number
would be invalid. Data are presented cumulatively for 2012 to 2014. BAUS has written to all of these
surgeons or, if they were unable to identify the surgeons, to the unit and asked them to provide further
information on their caseload. The fact that an individual appears to have undertaken less than five cases
in the year may be due to several factors:
- the individual was the second surgeon in a number of cases and the data is actually recorded
under another surgeon in the unit,
- the surgeon only does a few (less than 5) high-risk, complex cases each year,
- the surgeon took time off in the year for medical / professional reasons,
- the surgeon has only recently been appointed to the Trust and
- the surgeon only undertook the procedure in conjunction with another surgeon as an emergency.
BAUS has taken the decision to keep the data as simple as possible by publishing the number of
procedures according to each category, together with simple outcome measures. Further information on
the individual audits is given on the relevant audit pages (http://www.baus.org.uk/).
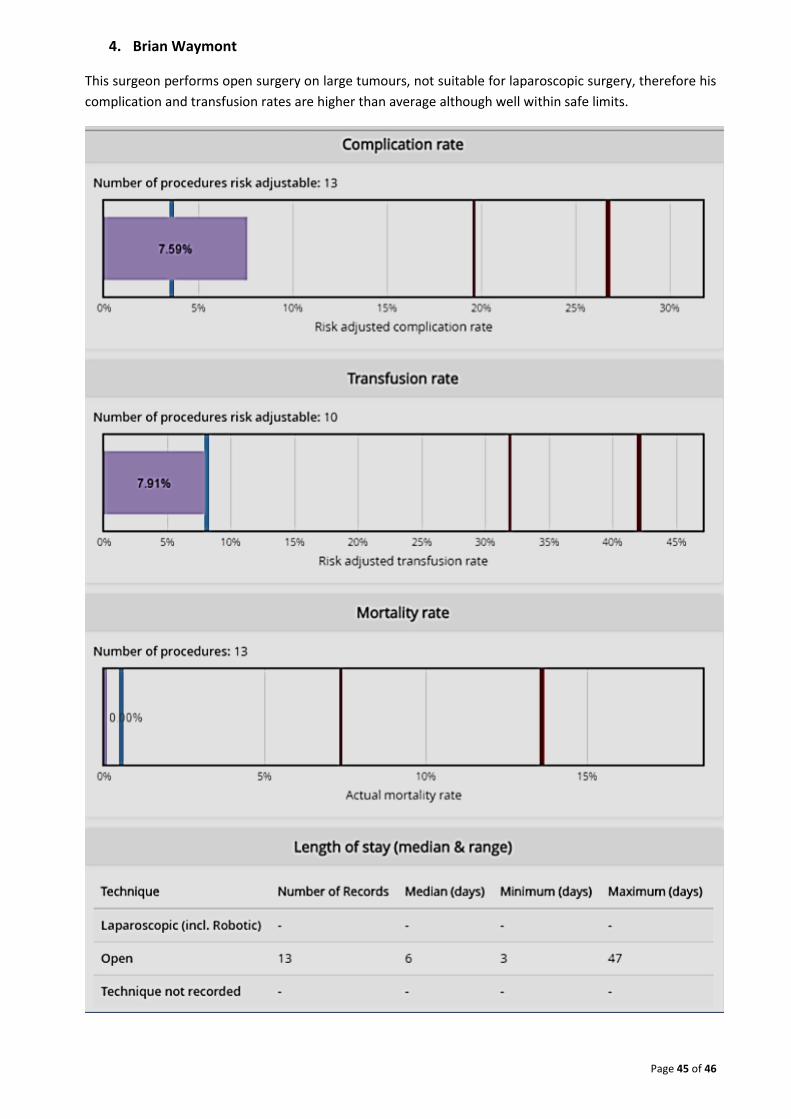
CONSULTANT LEVEL DATA - NEPHRECTOMY MORBIDITY AND STAY LENGTH
The light blue line in these graphs indicates national average. The red lines indicate 99% & 99.9% upper
alarms.
An empty bar indicates that there were no reported events for that particular outcome.
The complication rate is for complications graded Clavien-Dindo III and above (complications requiring
surgical, endoscopic or radiological intervention, life-threatening complications; this includes CNS
complications (e.g. brain haemorrhage, ischaemic stroke, subarachnoid haemorrhage) which require
intensive care, but excludes transient ischaemic attacks (TIAs), death of the patient.
Full documentation about the Clavien-Dindo grading system can be accessed at
http://www.baus.org.uk/patients/surgical_outcomes/grading_of_surgical_complications.aspx

Page 42 of 46
1. Jane Letitia Boddy

Page 43 of 46
2. Aniruddha Chakravarti

Page 44 of 46
3. Peter William Cooke
Page 45 of 46
4. Brian Waymont
This surgeon performs open surgery on large tumours, not suitable for laparoscopic surgery, therefore his
complication and transfusion rates are higher than average although well within safe limits.

Page 46 of 46
For more information on interpreting the graphs see
http://www.baus.org.uk/patients/surgical_outcomes/understanding_the_graphs.aspx