Embed Size (px)
Citation preview
A tetrachlorinated molecular non-fullerene acceptor for high performance near-IR absorbing organic solar cells
Audrey Laventure and Gregory C. Welch*
Department of Chemistry, University of Calgary 2500 University Drive NW Calgary, Alberta T2N 1N4, Canada
* Corresponding AuthorEmail: [email protected]
SUPPORTING INFORMATION
Table of Contents
Experimental details S2Nuclear magnetic resonance S4Mass spectrometry S6Elemental analysis S6Photoluminescence spectroscopy S7Cyclic voltammetry S7Influence of the solvent additive on the ITIC-Cl4 optical absorbance S8Organic Solar Cells S8Device optimization S9X-ray photoelectron spectroscopy S13References S14
Electronic Supplementary Material (ESI) for Journal of Materials Chemistry C.This journal is © The Royal Society of Chemistry 2018
Experimental details
Materials: PBDB-T and ITIC-Cl4 used in this study are commercially available and were provided to us by Brilliant Matters.
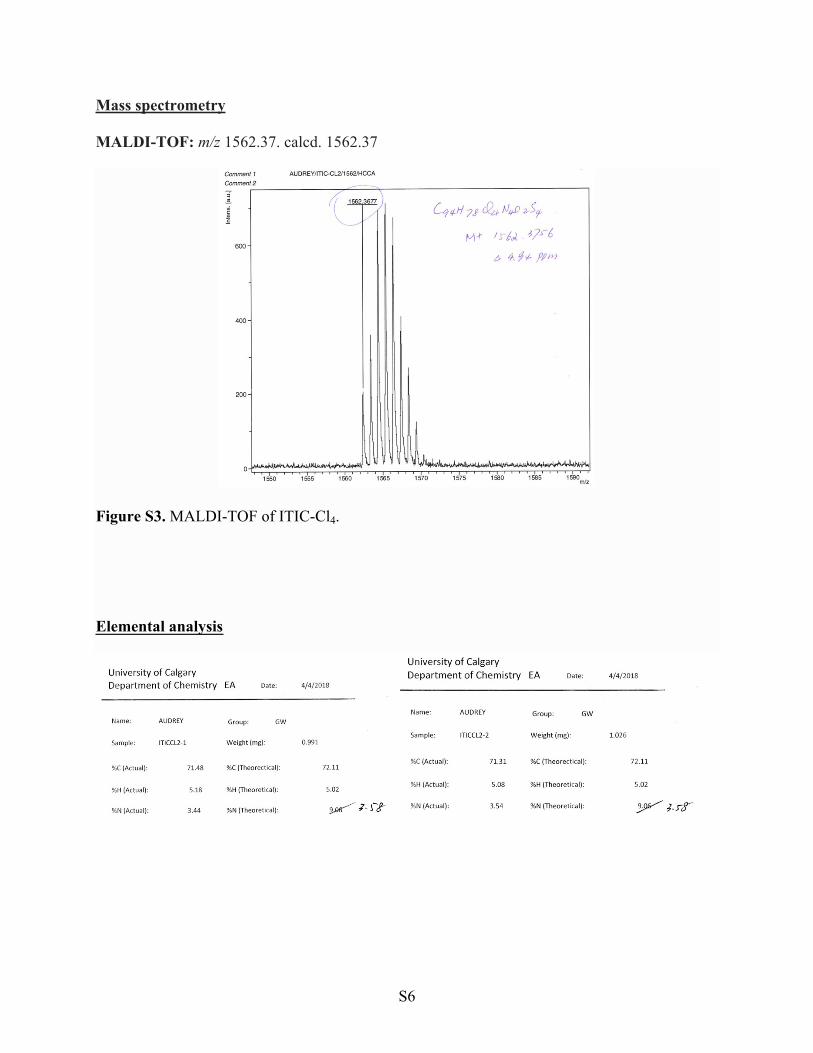
Mass spectrometry: High-resolution MALDI mass spectrometry measurements were performed courtesy of Jian Jun (Johnson) Li in the Chemical Instrumentation Facility at the University of Calgary. A Bruker Autoflex III Smartbeam MALDI-TOF (Na:YAG laser, 355nm), setting in positive reflective mode, was used to acquire spectra. Operation settings were all typical, e.g. laser offset 62-69; laser frequency 200Hz; and number of shots 300. The target used was Bruker MTP 384 ground steel plate target. Sample solution (~ 1 μg/mL in dichloromethane) was mixed with matrix trans-2-[3-(4-tert-Butylphenyl)-2-methyl-2-propenylidene]malononitrile (DCTB) solution (~ 5mg/mL in methanol) . Pipetted 1μl solution above to target spot and dried in the fume hood.
Cyclic Voltammetry (CV): All electrochemical measurements were performed using a Model 1200B Series Handheld Potentiostat by CH Instruments Inc. equipped with Ag wire, Pt wire, and glassy carbon electrode, as the pseudo reference, counter electrode, and working electrode, respectively. Glassy carbon electrodes were polished with alumina. The cyclic voltammetry experiments were performed in anhydrous dichloromethane solution with ~0.1 M tetrabutylammonium hexafluorophosphate (TBAPF6) as the supporting electrolyte at a scan rate of 100 mV/s. All electrochemical solutions were purged with dry N2 for 5 minutes to deoxygenate the system. Solution CV measurements were carried out with a concentration of ~0.5 mg/mL in dichloromethane. The ionization potentials (IP) and electron affinities (EA) were estimated by correlating the onsets (EoxFc/Fc+, EredFc/Fc) to the normal hydrogen electrode (NHE), assuming the IP of Fc/Fc+ to be 4.80 eV.1
UV-Visible Spectroscopy (UV-Vis): All absorption measurements were recorded using Agilent Technologies Cary 60 UV-Vis spectrometer at room temperature. All solution UV-Vis spectroscopy experiments were run in CHCl3 using 10 mm quartz cuvettes. Neat films were prepared by spin-coating 0.1 mL from a 1 % wt/v solution (CHCl3) onto clean Corning glass micro slides. Prior to use, glass slides were cleaned with soap and water, acetone and isopropanol, and followed by UV/ozone treatment using a Novascan UV/ozone cleaning system.
Photoluminescence (PL): All emission measurements were recorded using an Agilent Technologies Cary Eclipse fluorescence spectrophotometer at room temperature.
Atomic Force Microscopy (AFM): AFM measurements were performed by using a TT2-AFM (AFM Workshop) in tapping mode and WSxM software with an 0.01-0.025 Ohm/cm Sb (n) doped Si probe with a reflective back side aluminum coating. Samples for AFM measurement were the same ones that were used to collect the respective device parameters and EQE profiles.
Power Conversion Efficiency (PCE) and External Quantum Efficiency (EQE): The current density-voltage (J-V) curves were measured by a Keithley 2420 source measure unit. The photocurrent was measured under AM 1.5 illumination at 100mW/cm2 under a Solar Simulator (Newport 92251A-1000). The standard silicon solar cell (Newport 91150V) was used to calibrate light intensity. EQE was measured in a QEX7 Solar Cell Spectral Response/QE/IPCE
S2
Measurement System (PV Measurement, Model QEX7, USA) with an optical lens to focus the light into an area about 0.04cm2, smaller than the dot cell. The silicon photodiode was used to calibrate the EQE measurement system in the wavelength range from 300 to 1100 nm.
X-ray photoelectron spectroscopy: Room-temperature XPS experiments were performed at nanoFAB using Kratos Ultra spectrometer with monochromatized Al Kα (hυ = 1486.71 eV). The spectrometer was calibrated by the binding energy (84.0 eV) of Au 4f7/2 with reference to Fermi level. The pressure of analysis chamber during experiments is lower than 5×10⁻¹⁰ Torr. A hemispherical electron-energy analyzer working at the pass energy of 20 eV was used to collect core-level spectra while survey spectrum within a range of binding energies from 0 to 1100 eV was collected at analyzer pass energy of 160 eV. A Shirley background was applied to subtract the inelastic background of core-level peaks. Non-linear optimization using the Marquardt Algorithm (Casa XPS) was used to determine the peak model parameters such as peak positions, widths and peak intensities. The model peak to describe XPS core-level lines for curve fitting was a product of Gaussian and Lorentzian functions.
Compositions were calculated from the angle-resolved spectra using the major elemental peaks and sensitivity factors provided by the database. CASA XPS was used for component analysis to fit the spectra of C1s with peaks related to different chemical bonds.
S3
Nuclear Magnetic Resonance
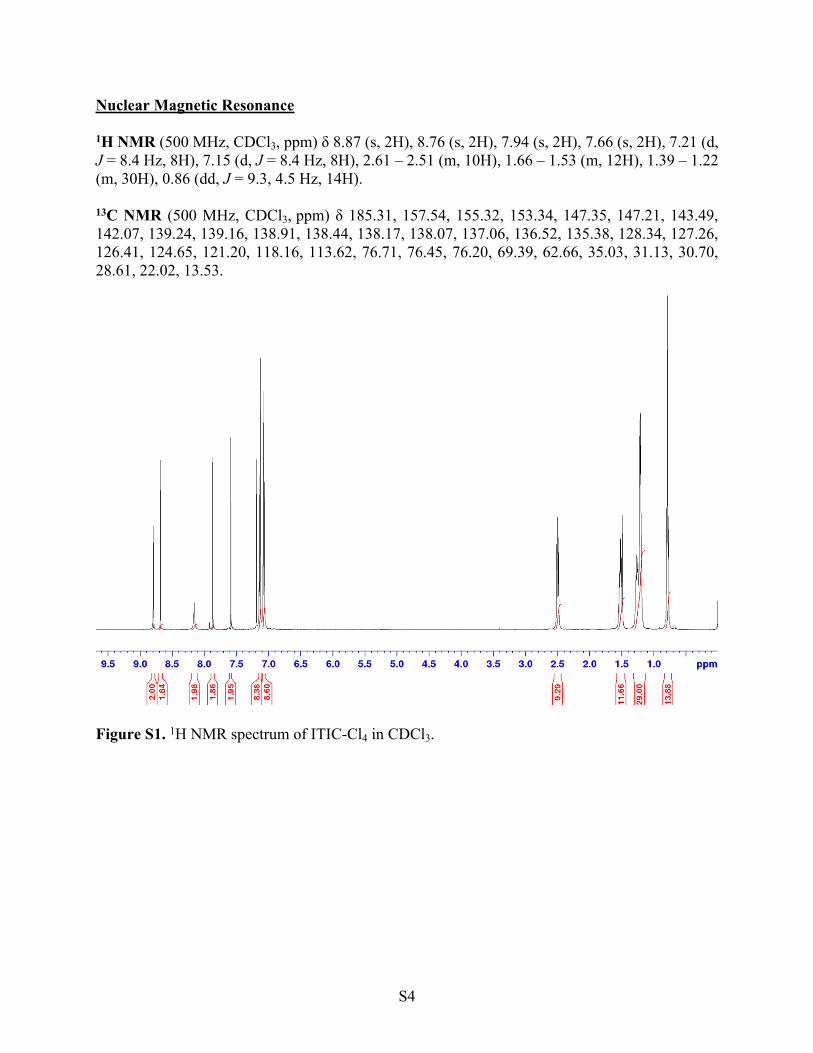
1H NMR (500 MHz, CDCl3, ppm) δ 8.87 (s, 2H), 8.76 (s, 2H), 7.94 (s, 2H), 7.66 (s, 2H), 7.21 (d, J = 8.4 Hz, 8H), 7.15 (d, J = 8.4 Hz, 8H), 2.61 – 2.51 (m, 10H), 1.66 – 1.53 (m, 12H), 1.39 – 1.22 (m, 30H), 0.86 (dd, J = 9.3, 4.5 Hz, 14H).
13C NMR (500 MHz, CDCl3, ppm) δ 185.31, 157.54, 155.32, 153.34, 147.35, 147.21, 143.49, 142.07, 139.24, 139.16, 138.91, 138.44, 138.17, 138.07, 137.06, 136.52, 135.38, 128.34, 127.26, 126.41, 124.65, 121.20, 118.16, 113.62, 76.71, 76.45, 76.20, 69.39, 62.66, 35.03, 31.13, 30.70, 28.61, 22.02, 13.53.
Figure S1. 1H NMR spectrum of ITIC-Cl4 in CDCl3.
S4
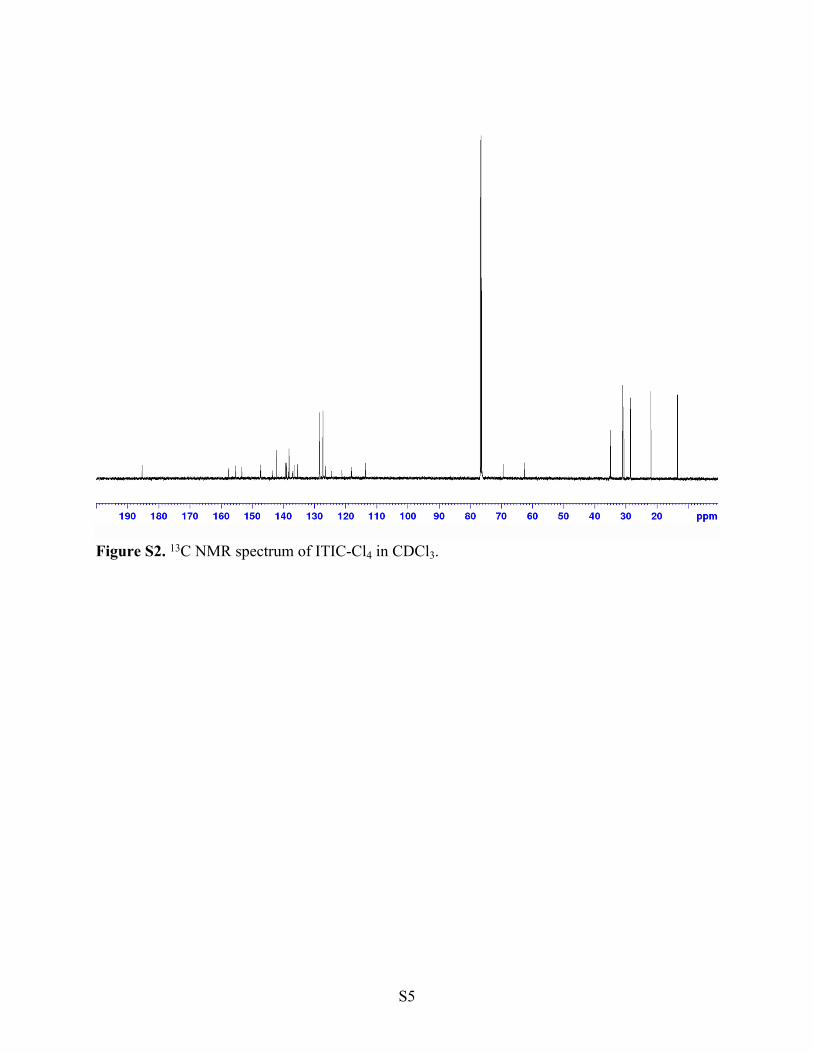
Figure S2. 13C NMR spectrum of ITIC-Cl4 in CDCl3.
S5
Mass spectrometry
MALDI-TOF: m/z 1562.37. calcd. 1562.37
Figure S3. MALDI-TOF of ITIC-Cl4.
Elemental analysis
S6
Photoluminescence spectroscopy
0.0
0.2
0.4
0.6
0.8
1.0
700 750 800 850 900
Nor
mal
ized
inte
nsity
Wavelength (nm)
Solution
Film
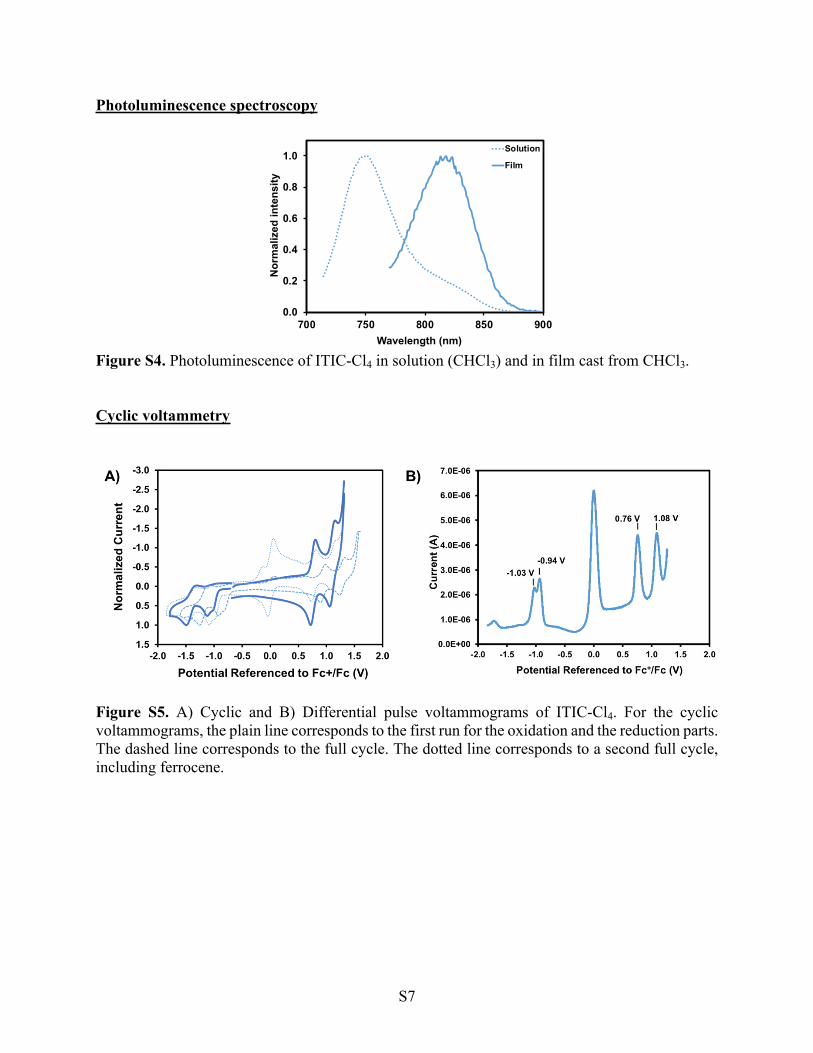
Figure S4. Photoluminescence of ITIC-Cl4 in solution (CHCl3) and in film cast from CHCl3.
Cyclic voltammetry
Figure S5. A) Cyclic and B) Differential pulse voltammograms of ITIC-Cl4. For the cyclic voltammograms, the plain line corresponds to the first run for the oxidation and the reduction parts. The dashed line corresponds to the full cycle. The dotted line corresponds to a second full cycle, including ferrocene.
S7
Influence of the solvent additive on the ITIC-Cl4 optical absorbance
A) B)
C) D)5% DIO 5% CN
0.0
0.1
0.2
0.3
500 600 700 800 900 1000
Film
Abs
orba
nce
Wavelength (nm)
No additive0.5% CN1% CN5% CN
0.0
0.1
0.2
0.3
500 600 700 800 900 1000
Film
Abs
orba
nce
Wavelength (nm)
No additive0.5% DIO1% DIO5% DIO
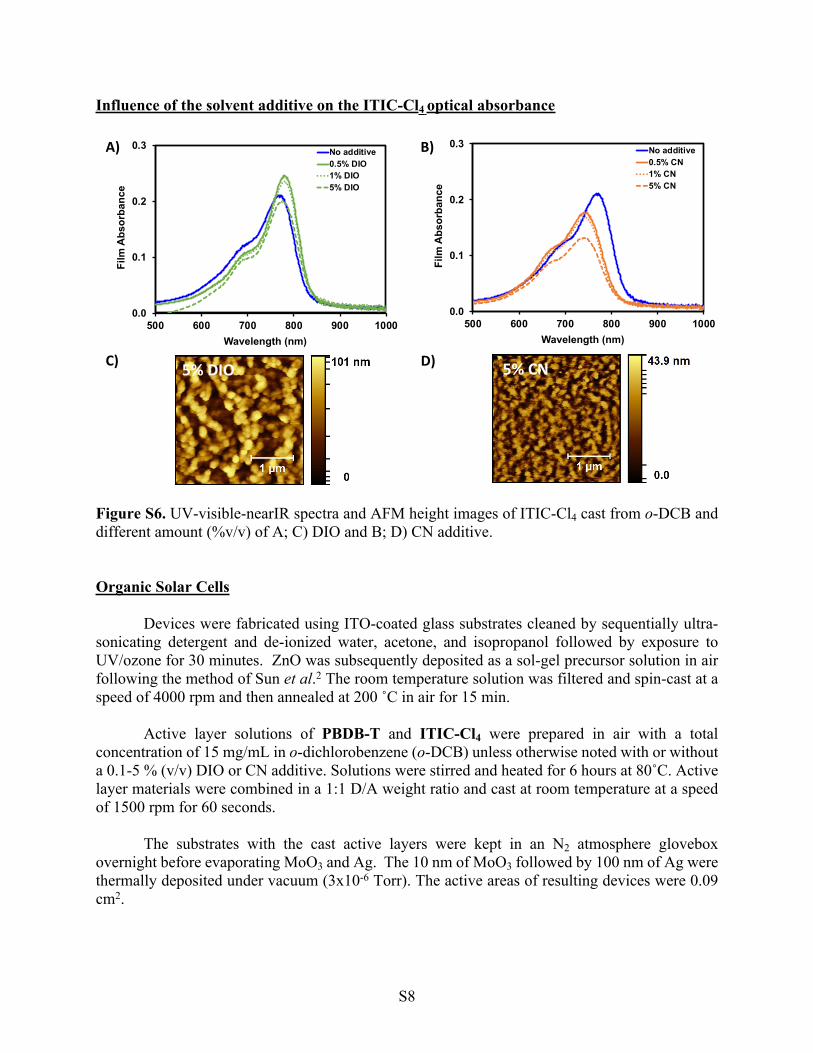
Figure S6. UV-visible-nearIR spectra and AFM height images of ITIC-Cl4 cast from o-DCB and different amount (%v/v) of A; C) DIO and B; D) CN additive.
Organic Solar Cells
Devices were fabricated using ITO-coated glass substrates cleaned by sequentially ultra-sonicating detergent and de-ionized water, acetone, and isopropanol followed by exposure to UV/ozone for 30 minutes. ZnO was subsequently deposited as a sol-gel precursor solution in air following the method of Sun et al.2 The room temperature solution was filtered and spin-cast at a speed of 4000 rpm and then annealed at 200 ˚C in air for 15 min.
Active layer solutions of PBDB-T and ITIC-Cl4 were prepared in air with a total concentration of 15 mg/mL in o-dichlorobenzene (o-DCB) unless otherwise noted with or without a 0.1-5 % (v/v) DIO or CN additive. Solutions were stirred and heated for 6 hours at 80˚C. Active layer materials were combined in a 1:1 D/A weight ratio and cast at room temperature at a speed of 1500 rpm for 60 seconds.
The substrates with the cast active layers were kept in an N2 atmosphere glovebox overnight before evaporating MoO3 and Ag. The 10 nm of MoO3 followed by 100 nm of Ag were thermally deposited under vacuum (3x10⁻⁶ Torr). The active areas of resulting devices were 0.09 cm2.
S8
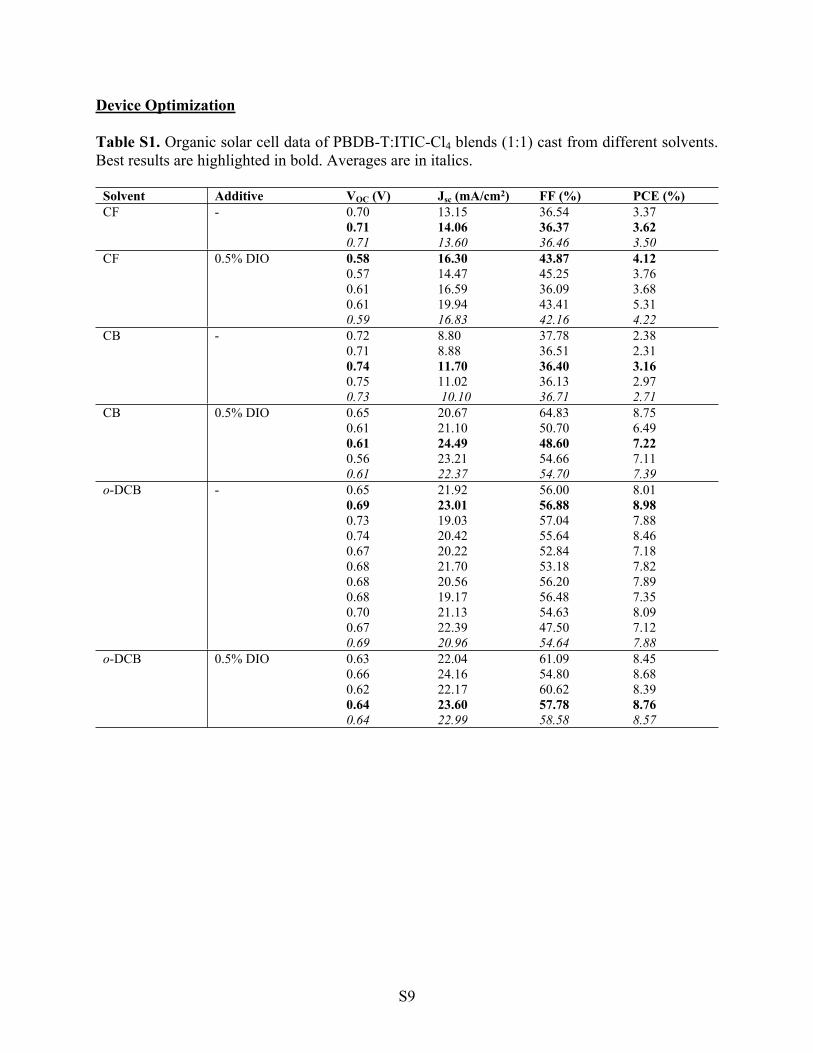
Device Optimization
Table S1. Organic solar cell data of PBDB-T:ITIC-Cl4 blends (1:1) cast from different solvents. Best results are highlighted in bold. Averages are in italics.
Solvent Additive VOC (V) Jsc (mA/cm2) FF (%) PCE (%)CF - 0.70 13.15 36.54 3.37
0.71 14.06 36.37 3.620.71 13.60 36.46 3.50
CF 0.5% DIO 0.58 16.30 43.87 4.120.57 14.47 45.25 3.760.61 16.59 36.09 3.680.61 19.94 43.41 5.310.59 16.83 42.16 4.22
CB - 0.72 8.80 37.78 2.380.71 8.88 36.51 2.310.74 11.70 36.40 3.160.75 11.02 36.13 2.970.73 10.10 36.71 2.71
CB 0.5% DIO 0.65 20.67 64.83 8.750.61 21.10 50.70 6.490.61 24.49 48.60 7.220.56 23.21 54.66 7.110.61 22.37 54.70 7.39
o-DCB - 0.65 21.92 56.00 8.010.69 23.01 56.88 8.980.73 19.03 57.04 7.880.74 20.42 55.64 8.460.67 20.22 52.84 7.180.68 21.70 53.18 7.820.68 20.56 56.20 7.890.68 19.17 56.48 7.350.70 21.13 54.63 8.090.67 22.39 47.50 7.120.69 20.96 54.64 7.88
o-DCB 0.5% DIO 0.63 22.04 61.09 8.450.66 24.16 54.80 8.680.62 22.17 60.62 8.390.64 23.60 57.78 8.760.64 22.99 58.58 8.57
S9
A) B)
-30.0
-25.0
-20.0
-15.0
-10.0
-5.0
0.0
5.0-0.2 0.0 0.2 0.4 0.6 0.8 1.0
Cur
rent
(mA
cm-2
)
Voltage (V)
CF - As castCF - 0.5% DIOCB - As castCB - 0.5% DIOoDCB - As castoDCB - 0.5% DIO
0.00.20.40.60.81.01.21.41.61.82.0
350 450 550 650 750 850 950
Film
Abs
orba
nce
Wavelength (nm)
CF - As castCF - 0.5% DIOCB - As castCB - 0.5% DIOoDCB - As castoDCB - 0.5% DIO
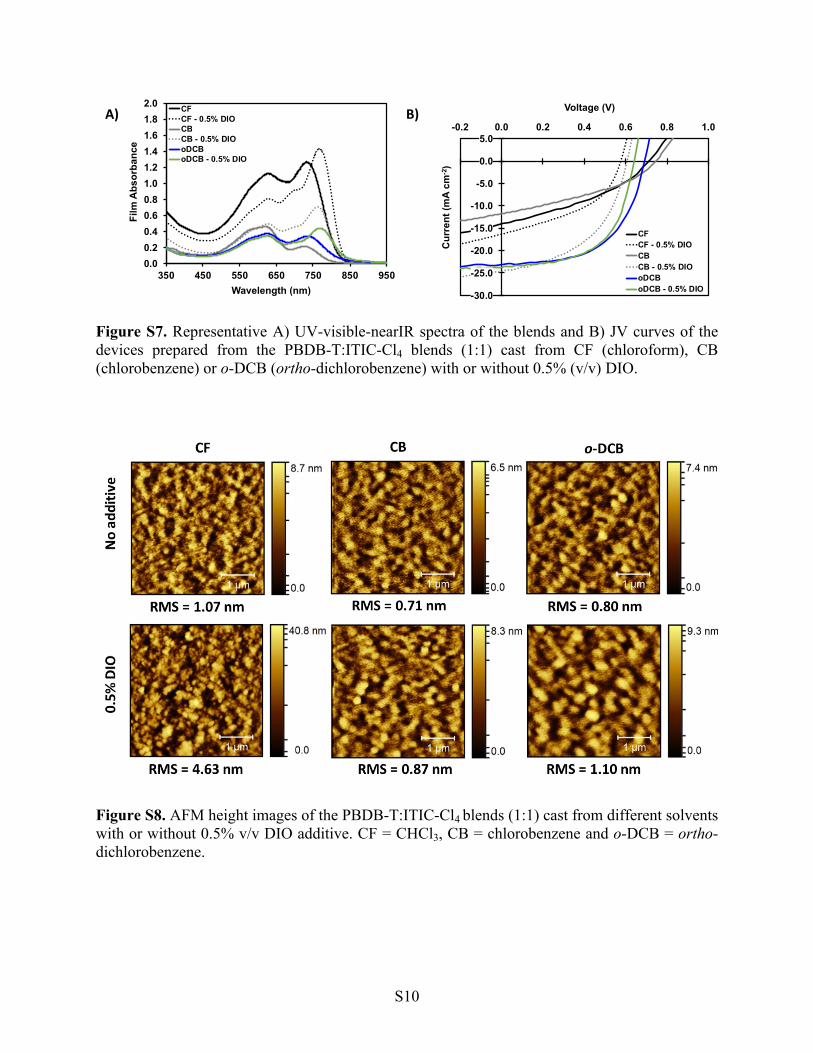
Figure S7. Representative A) UV-visible-nearIR spectra of the blends and B) JV curves of the devices prepared from the PBDB-T:ITIC-Cl4 blends (1:1) cast from CF (chloroform), CB (chlorobenzene) or o-DCB (ortho-dichlorobenzene) with or without 0.5% (v/v) DIO.
Figure S8. AFM height images of the PBDB-T:ITIC-Cl4 blends (1:1) cast from different solvents with or without 0.5% v/v DIO additive. CF = CHCl3, CB = chlorobenzene and o-DCB = ortho-dichlorobenzene.
S10
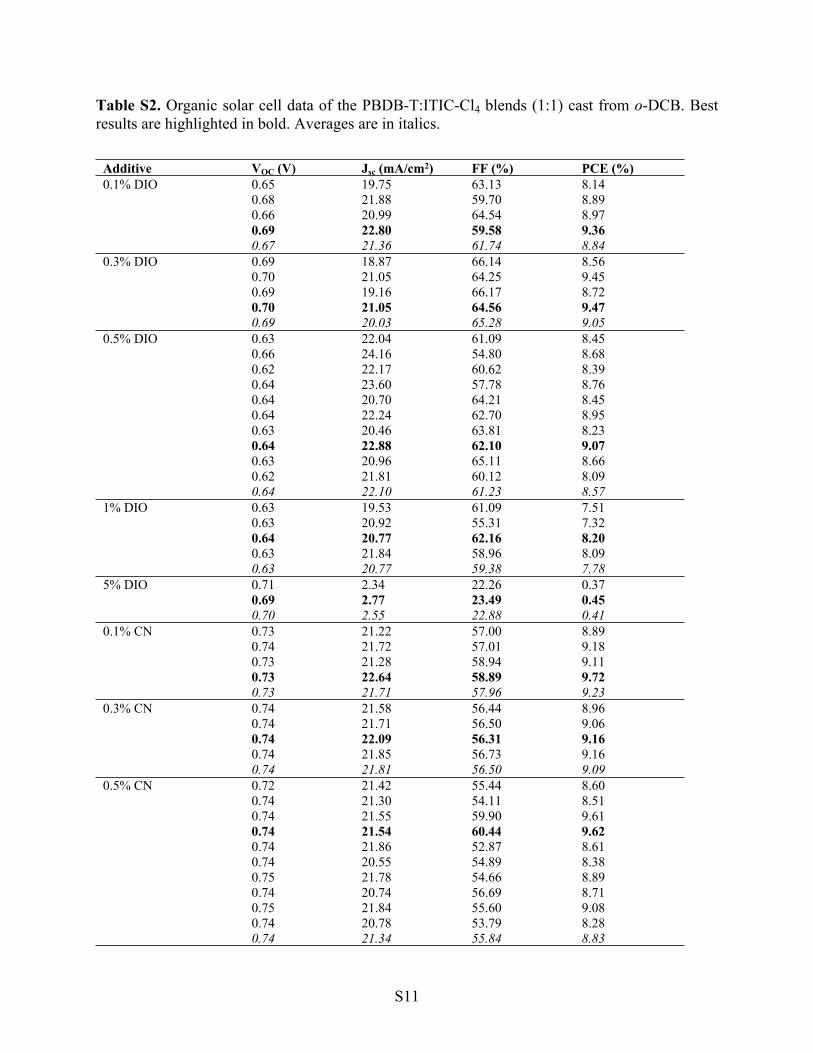
Table S2. Organic solar cell data of the PBDB-T:ITIC-Cl4 blends (1:1) cast from o-DCB. Best results are highlighted in bold. Averages are in italics.
Additive VOC (V) Jsc (mA/cm2) FF (%) PCE (%)0.1% DIO 0.65 19.75 63.13 8.14
0.68 21.88 59.70 8.890.66 20.99 64.54 8.970.69 22.80 59.58 9.360.67 21.36 61.74 8.84
0.3% DIO 0.69 18.87 66.14 8.560.70 21.05 64.25 9.450.69 19.16 66.17 8.720.70 21.05 64.56 9.470.69 20.03 65.28 9.05
0.5% DIO 0.63 22.04 61.09 8.450.66 24.16 54.80 8.680.62 22.17 60.62 8.390.64 23.60 57.78 8.760.64 20.70 64.21 8.450.64 22.24 62.70 8.950.63 20.46 63.81 8.230.64 22.88 62.10 9.070.63 20.96 65.11 8.660.62 21.81 60.12 8.090.64 22.10 61.23 8.57
1% DIO 0.63 19.53 61.09 7.510.63 20.92 55.31 7.320.64 20.77 62.16 8.200.63 21.84 58.96 8.090.63 20.77 59.38 7.78
5% DIO 0.71 2.34 22.26 0.370.69 2.77 23.49 0.450.70 2.55 22.88 0.41
0.1% CN 0.73 21.22 57.00 8.890.74 21.72 57.01 9.180.73 21.28 58.94 9.110.73 22.64 58.89 9.720.73 21.71 57.96 9.23
0.3% CN 0.74 21.58 56.44 8.960.74 21.71 56.50 9.060.74 22.09 56.31 9.160.74 21.85 56.73 9.160.74 21.81 56.50 9.09
0.5% CN 0.72 21.42 55.44 8.600.74 21.30 54.11 8.510.74 21.55 59.90 9.610.74 21.54 60.44 9.620.74 21.86 52.87 8.610.74 20.55 54.89 8.380.75 21.78 54.66 8.890.74 20.74 56.69 8.710.75 21.84 55.60 9.080.74 20.78 53.79 8.280.74 21.34 55.84 8.83
S11
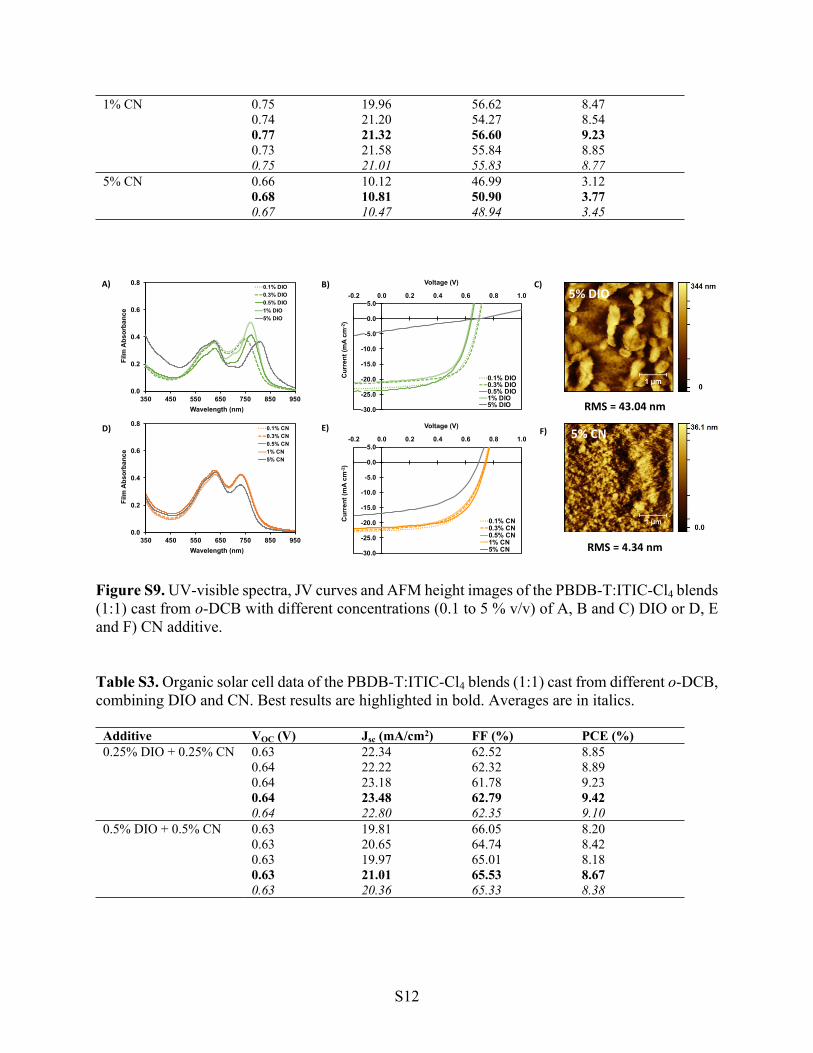
1% CN 0.75 19.96 56.62 8.470.74 21.20 54.27 8.540.77 21.32 56.60 9.230.73 21.58 55.84 8.850.75 21.01 55.83 8.77
5% CN 0.66 10.12 46.99 3.120.68 10.81 50.90 3.770.67 10.47 48.94 3.45
D) E)
A) B)
-30.0
-25.0
-20.0
-15.0
-10.0
-5.0
0.0
5.0-0.2 0.0 0.2 0.4 0.6 0.8 1.0
Cur
rent
(mA
cm-2
)
Voltage (V)
0.1% DIO0.3% DIO0.5% DIO1% DIO5% DIO
-30.0
-25.0
-20.0
-15.0
-10.0
-5.0
0.0
5.0-0.2 0.0 0.2 0.4 0.6 0.8 1.0
Cur
rent
(mA
cm-2
)
Voltage (V)
0.1% CN0.3% CN0.5% CN1% CN5% CN
0.0
0.2
0.4
0.6
0.8
350 450 550 650 750 850 950
Film
Abs
orba
nce
Wavelength (nm)
0.1% CN0.3% CN0.5% CN1% CN5% CN
0.0
0.2
0.4
0.6
0.8
350 450 550 650 750 850 950
Film
Abs
orba
nce
Wavelength (nm)
0.1% DIO0.3% DIO0.5% DIO1% DIO5% DIO
C)
F)
RMS = 43.04 nm
RMS = 4.34 nm
5% CN
5% DIO
Figure S9. UV-visible spectra, JV curves and AFM height images of the PBDB-T:ITIC-Cl4 blends (1:1) cast from o-DCB with different concentrations (0.1 to 5 % v/v) of A, B and C) DIO or D, E and F) CN additive.
Table S3. Organic solar cell data of the PBDB-T:ITIC-Cl4 blends (1:1) cast from different o-DCB, combining DIO and CN. Best results are highlighted in bold. Averages are in italics.
Additive VOC (V) Jsc (mA/cm2) FF (%) PCE (%)0.25% DIO + 0.25% CN 0.63 22.34 62.52 8.85
0.64 22.22 62.32 8.890.64 23.18 61.78 9.230.64 23.48 62.79 9.420.64 22.80 62.35 9.10
0.5% DIO + 0.5% CN 0.63 19.81 66.05 8.200.63 20.65 64.74 8.420.63 19.97 65.01 8.180.63 21.01 65.53 8.670.63 20.36 65.33 8.38
S12
C)
A) B)
RMS = 2.10 nm
0.25% DIO+
0.25% CN
0.5% DIO+
0.5% CN
RMS = 6.57 nm
-30.0
-25.0
-20.0
-15.0
-10.0
-5.0
0.0
5.0-0.2 0.0 0.2 0.4 0.6 0.8 1.0
Cur
rent
(mA
cm-2
)
Voltage (V)
0.25% DIO + 0.25% CN
0.5% DIO + 0.5% CN0.0
0.2
0.4
0.6
0.8
350 450 550 650 750 850 950
Film
Abs
orba
nce
Wavelength (nm)
No additive0.5% DIO0.5% CN0.25% DIO + 0.25% CN0.5% DIO + 0.5% CN
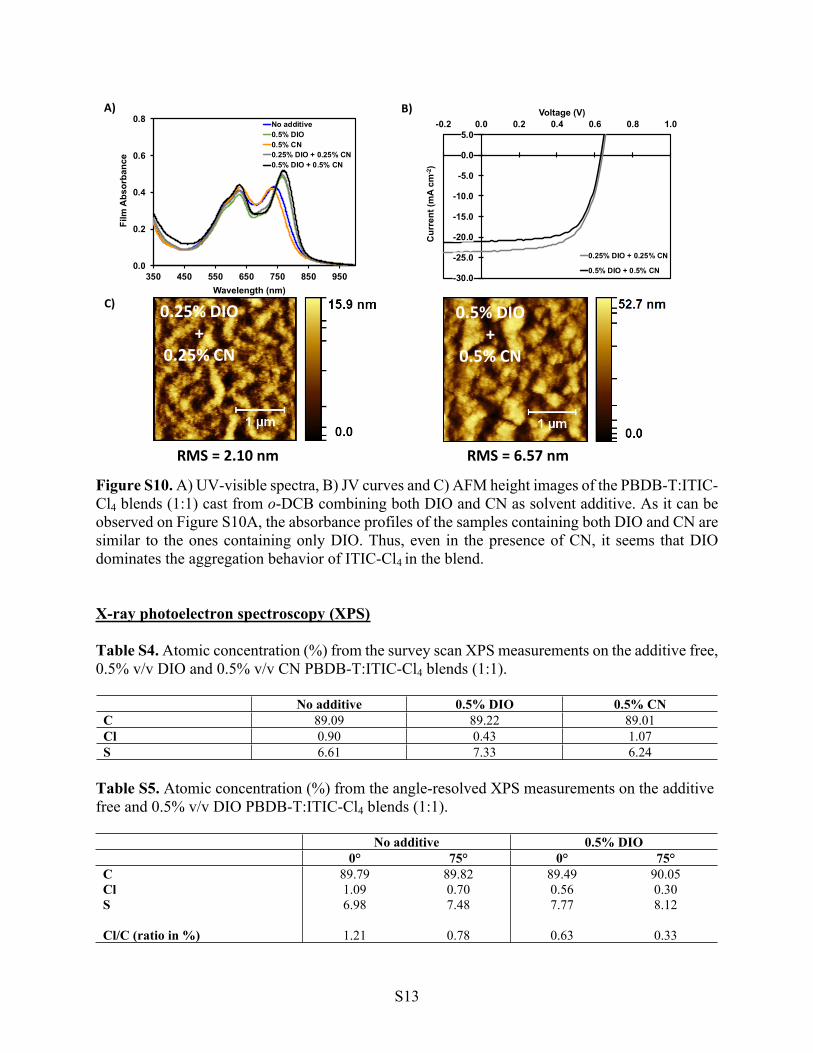
Figure S10. A) UV-visible spectra, B) JV curves and C) AFM height images of the PBDB-T:ITIC-Cl4 blends (1:1) cast from o-DCB combining both DIO and CN as solvent additive. As it can be observed on Figure S10A, the absorbance profiles of the samples containing both DIO and CN are similar to the ones containing only DIO. Thus, even in the presence of CN, it seems that DIO dominates the aggregation behavior of ITIC-Cl4 in the blend.
X-ray photoelectron spectroscopy (XPS)
Table S4. Atomic concentration (%) from the survey scan XPS measurements on the additive free, 0.5% v/v DIO and 0.5% v/v CN PBDB-T:ITIC-Cl4 blends (1:1).
No additive 0.5% DIO 0.5% CNC 89.09 89.22 89.01Cl 0.90 0.43 1.07S 6.61 7.33 6.24
Table S5. Atomic concentration (%) from the angle-resolved XPS measurements on the additive free and 0.5% v/v DIO PBDB-T:ITIC-Cl4 blends (1:1).
No additive 0.5% DIO0° 75° 0° 75°
C 89.79 89.82 89.49 90.05Cl 1.09 0.70 0.56 0.30S 6.98 7.48 7.77 8.12
Cl/C (ratio in %) 1.21 0.78 0.63 0.33
S13
References
1. J. Pommerehne, H. Vestweber, W. Guss, R. F. Mahrt, H. Bässler, M. Porsch and J. Daub, Adv. Mater., 1995, 7, 551–554.
2. Y. Sun, J. H. Seo, C. J. Takacs, J. Seifter and A. J. Heeger, Adv. Mater., 2011, 23, 1679–1683.
S14