Embed Size (px)
Citation preview

The Royal Marsden
Statistics for imaging studies (an introduction)
Karen Thomas, Senior Statistician Royal Marsden NHS Foundation Trust

The Royal Marsden
• Statistics is about understanding and describing data
• Taking measurements of interest from a sample to make inferences about a population
Statistics – What is it?

The Royal Marsden
• Hypothesis generating
• Hypothesis testing
Types of research

The Royal Marsden
Hypothesis generating

The Royal Marsden
• Describing data from a sample in order to generate hypotheses about the wider population
• Aim of study is to estimate values of a parameter
• Also need to assess the variability of that estimate
Hypothesis generating studies
The Royal Marsden
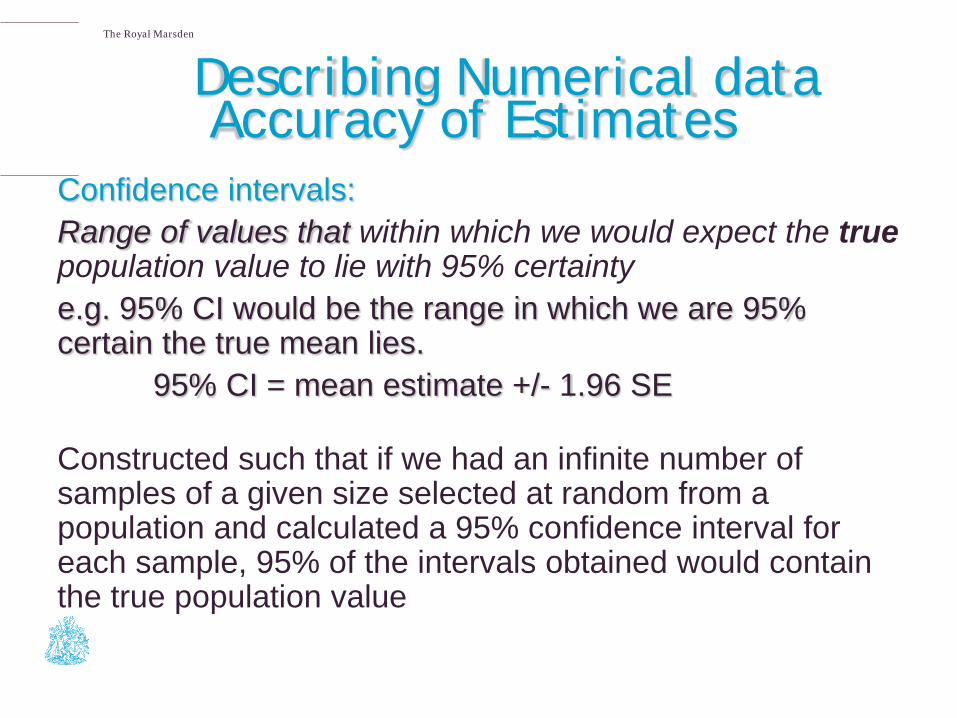
Describing Numerical data Accuracy of Estimates
Confidence intervals: Range of values that within which we would expect the true population value to lie with 95% certainty e.g. 95% CI would be the range in which we are 95% certain the true mean lies. 95% CI = mean estimate +/- 1.96 SE
Constructed such that if we had an infinite number of samples of a given size selected at random from a population and calculated a 95% confidence interval for each sample, 95% of the intervals obtained would contain the true population value

The Royal Marsden
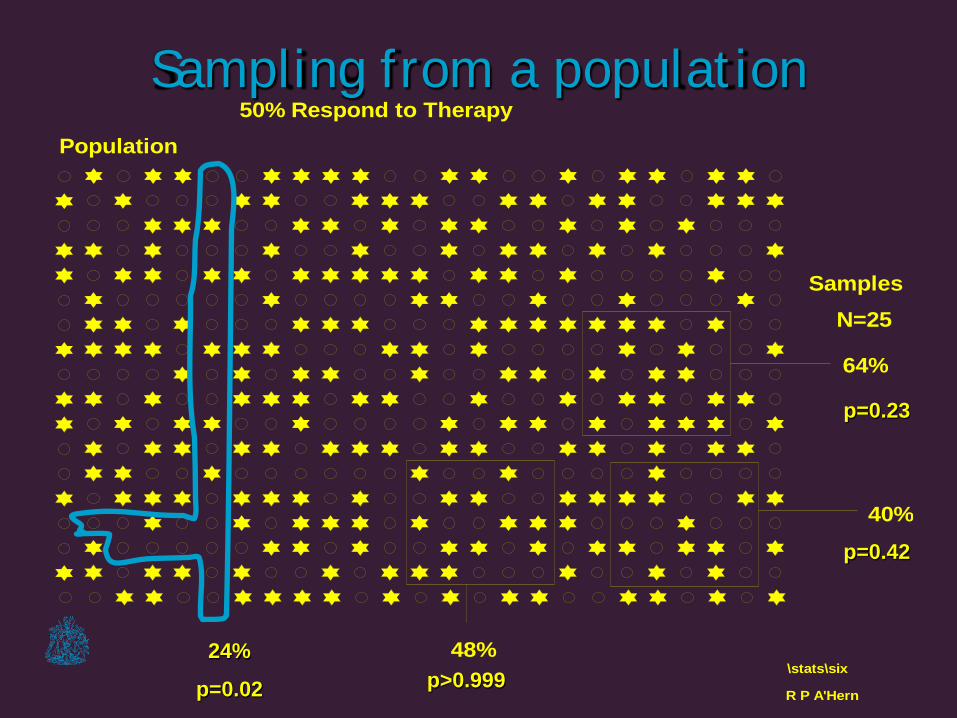
Sampling from a population
R P A'Hern
50% Respond to TherapyPopulation
48%
40%
64%
SamplesN=25
\stats\six

The Royal Marsden
Sampling from a population
R P A'Hern
50% Respond to TherapyPopulation
48%
40%
64%
SamplesN=25
\stats\six(28%, 69%)
(21%, 61%)
(43%, 82%)

The Royal Marsden
Hypothesis testing

The Royal Marsden
Research project testing a pre-defined hypothesis regarding the value of a specific endpoint…
• Alternative Hypothesis (H1): Needs new evidence to support (Often, the new treatment is superior to the current standard…)
• Null Hypothesis (H0): Reflects existing clinical knowledge (Often, the new treatment is not better than the current standard ..)
Hypothesis testing
The Royal Marsden
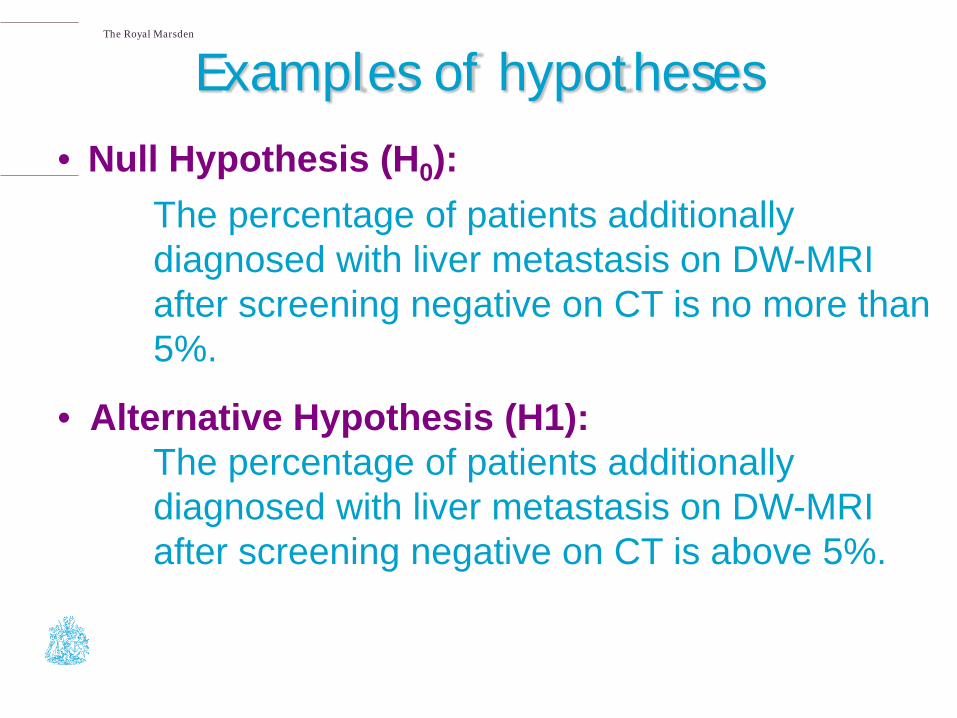
• Alternative Hypothesis (H1): The percentage of patients additionally diagnosed with liver metastasis on DW-MRI after screening negative on CT is above 5%.
• Null Hypothesis (H0): The percentage of patients additionally
diagnosed with liver metastasis on DW-MRI after screening negative on CT is no more than 5%.
Examples of hypotheses
The Royal Marsden
• A p-value is used to measure the strength of the evidence in favour of the alternative hypothesis •Hypothesis always defined before collecting data •P-values calculated after collecting data
P-values

The Royal Marsden
• A p-value reflects the probability of a result occurring which is as least as extreme as the observed result, if the null hypothesis were true.
Large P-value → data consistent with null hypothesis Small P-value → evidence favours alternative hypothesis (convention use p=0.05 as cut off for decision making – but should be pre-defined)
Definition of p-values
The Royal Marsden
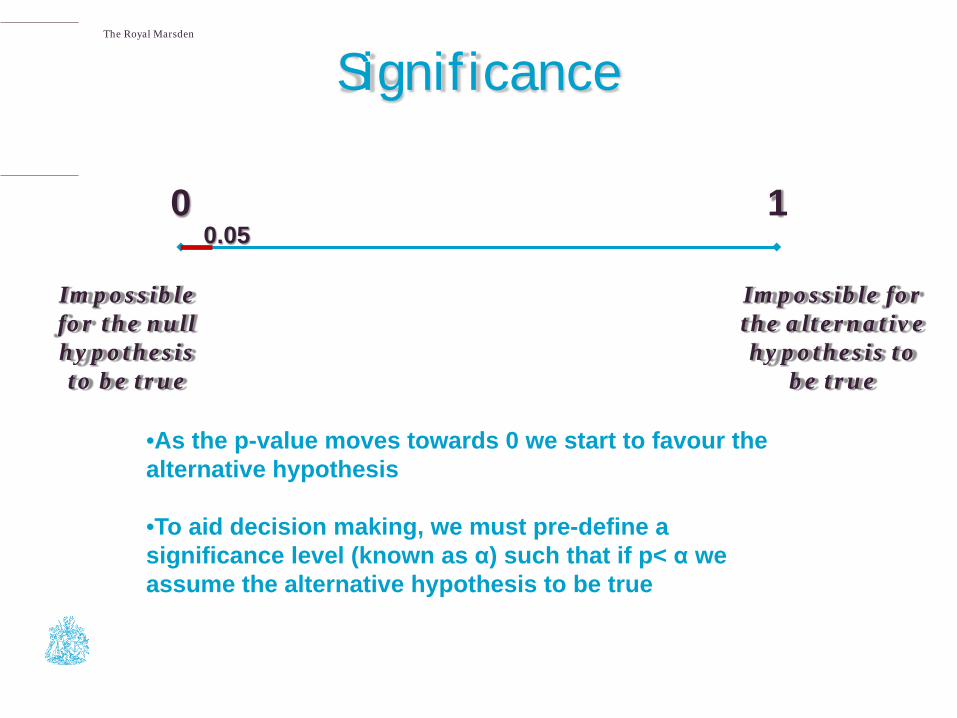
Significance
0 1
Impossible for the null hypothesis to be true
Impossible for the alternative hypothesis to
be true
0.05
•As the p-value moves towards 0 we start to favour the alternative hypothesis
•To aid decision making, we must pre-define a significance level (known as α) such that if p< α we assume the alternative hypothesis to be true

The Royal Marsden
Possible results of hypothesis testing
H0 is true (treatments are
equal)
H0 is false (one treatment is
better)
Reject H0
Type I error (Incorrectly
conclude that new treatment is better)
Correct
Do not
reject H0
Correct
Type II error (Incorrectly
conclude standard treatment is better)
The Royal Marsden
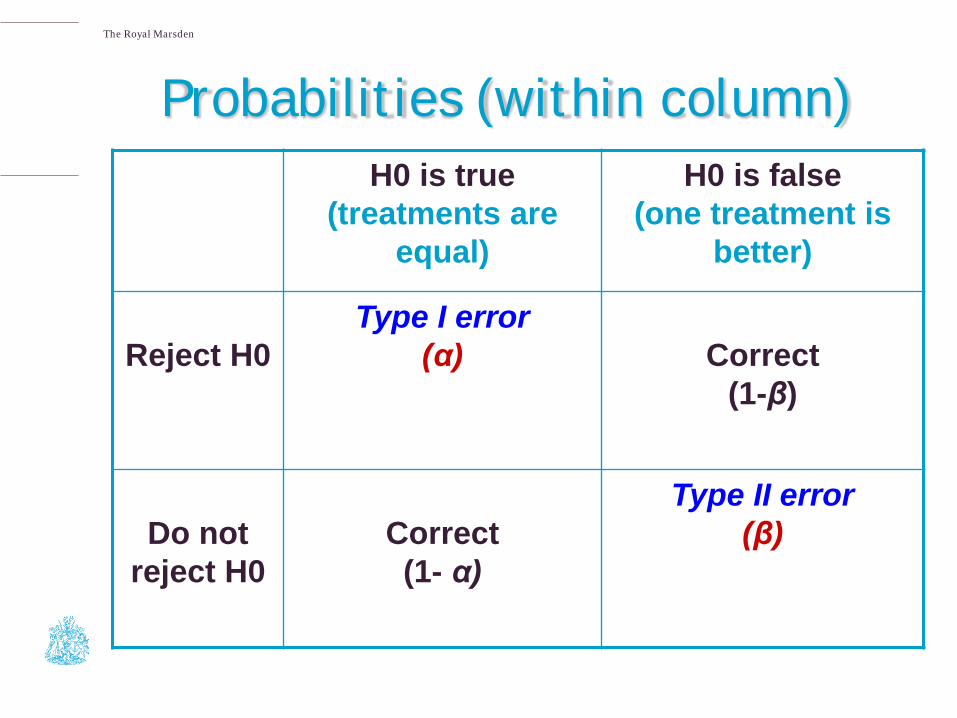
Probabilities (within column) H0 is true
(treatments are equal)
H0 is false (one treatment is
better)
Reject H0
Type I error (α)
Correct
(1-β)
Do not
reject H0
Correct (1- α)
Type II error (β)

The Royal Marsden
If Ho is true H0 is true
(treatments are equal)
Reject H0
Type I error (α)
Do not reject H0
Correct (1- α)
Accept or reject H0 on the basis of the calculated p-value.
P-value is the probability of seeing the observed result if H0 is true. α is predefined and known as the significance level.
For α =0.05, P<5% leads us to reject H0. This implies that there is a 5% chance of incorrectly rejecting Ho (making a Type I error).
The Royal Marsden
R P A'Hern
50% Respond to TherapyPopulation
48%
40%
64%
SamplesN=25
\stats\six
Sampling from a population
p>0.999
p=0.42
p=0.23
24%
p=0.02

The Royal Marsden
If H0 is false H0 is false
(one treatment is better)
Reject H0
Correct
(1-β)
Do not reject H0
Type II error (β)
1-β is the probability of correctly rejecting H0 if H0 is false, and is know as the power of the study.
Exact method to calculate 1- β depends on the type of data, and is a factor of sample size and expected variability of sample data.
Large sample, low variability -> high power
The Royal Marsden
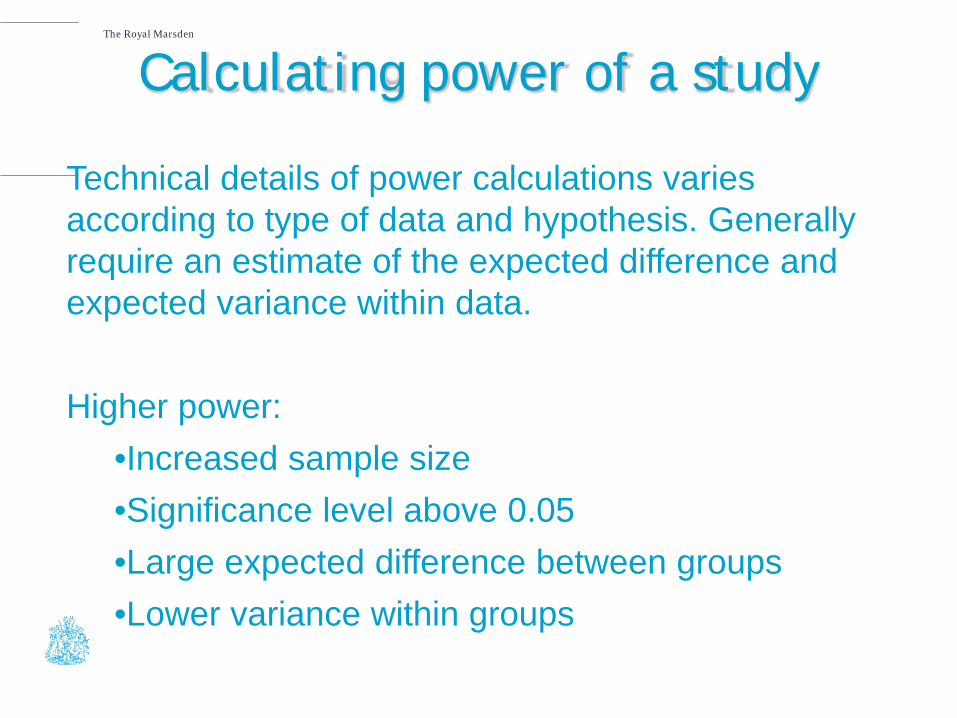
Technical details of power calculations varies according to type of data and hypothesis. Generally require an estimate of the expected difference and expected variance within data. Higher power:
•Increased sample size •Significance level above 0.05 •Large expected difference between groups •Lower variance within groups
Calculating power of a study

The Royal Marsden
H0: The mean baseline ADC is the same in patients with good response to treatment at 6 weeks (responders) vs. those with poor response (non-responders). H1: Mean ADC differs in responders vs. non-responders (two-sided test)
Need to know: required significance level estimated mean ADC in both groups expected common standard deviation of ADC expected % responders.
Power calculation example

The Royal Marsden
Power calculation example (cont)
Significance 0.05
Expected mean (non-responders) 200
Expected mean (responders) 250
St. dev. 48
Required power 80%
Expected response rate 40%
Total N (responders) 38 (11)

The Royal Marsden Power calculation example 1 (cont)
Significance 0.05 0.01
Expected mean (non-responders) 200 200
Expected mean (responders) 250 250
St. dev. 48 48
Required power 80% 80%
Expected response rate 40% 40%
Total N (responders) 38 (11)
58 (17)

The Royal Marsden Power calculation example 1 (cont)
Significance 0.05 0.01 0.01
Expected mean (non-responders) 200 200 200
Expected mean (responders) 250 250 225
St. dev. 48 48 48
Required power 80% 80% 80%
Expected response rate 40% 40% 40%
Total N (responders) 38 (11)
58 (17)
216 (62)

The Royal Marsden Power calculation example 1 (cont)
Significance 0.05 0.01 0.01 0.01
Expected mean (non-responders) 200 200 200 200
Expected mean (responders) 250 250 225 225
St. dev. 48 48 48 35
Required power 80% 80% 80% 80%
Expected response rate 40% 40% 40% 40%
Total N (responders) 38 (11)
58 (17)
216 (62)
117 (34)

The Royal Marsden Power calculation example 1 (cont)
Significance 0.05 0.01 0.01 0.01 0.01
Expected mean (non-responders) 200 200 200 200 200
Expected mean (responders) 250 250 225 225 225
St. dev. 48 48 48 35 35
Required power 80% 80% 80% 80% 80%
Expected response rate 40% 40% 40% 40% 20%
Total N (responders) 38 (11)
58 (17)
216 (62)
117 (34)
170 (29)

The Royal Marsden
Taking measurements of interest from a sample to make inferences
about a population What is the question of interest? Are the planned measurements relevant? What is the population of interest? Is the sample representative of this population? What is the required power and significance level?
Planning your study

The Royal Marsden
Test Accuracy and Prediction
(Sensitivity & Specificity)

The Royal Marsden
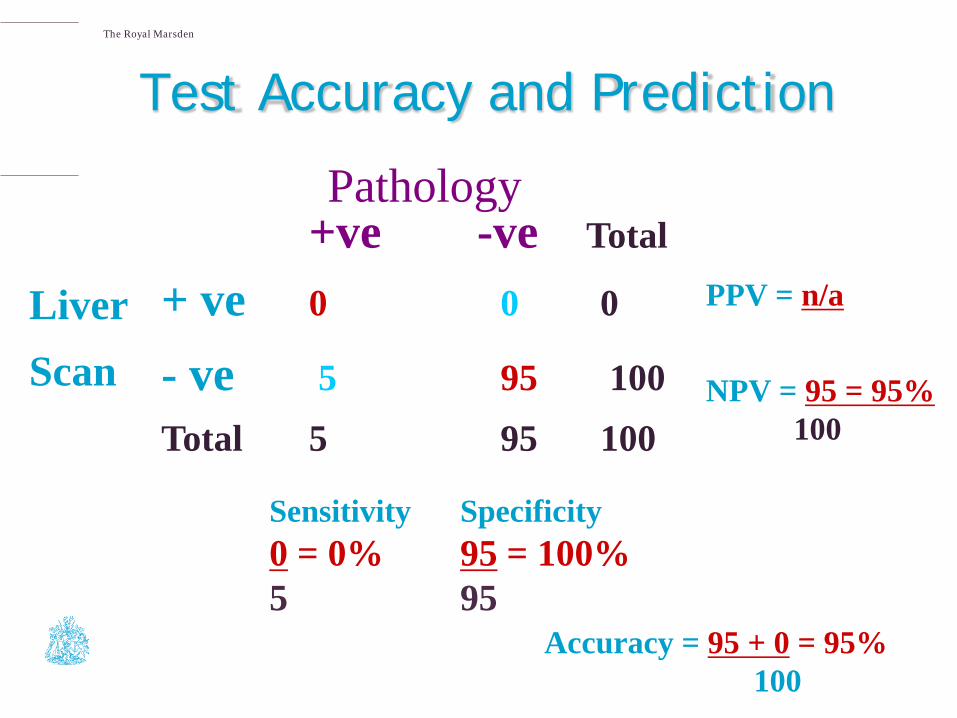
Test Accuracy and Prediction
• Used to compare prognostic tests with a gold standard. • Identifies false positives / false negatives & true values • Calculate:
– Sensitivity: proportion of actual positives correctly identified – Specificity: proportion of actual negatives correctly identified – Positive Predictive Value: proportions of positive results
that are true positive – Negative Predictive Value: proportions of negative results
that are true negative – Accuracy: proportion of true results (both true positives &
negatives) among the total number of cases examined

The Royal Marsden
Pathology +ve -ve Total
+ ve 67 9 76
- ve 8 16 24 Total 75 25 100
Test Accuracy and Prediction
Liver Scan
Sensitivity 67 = 90% 75
Specificity 16 = 63% 25
PPV = 67 = 88% 76
NPV = 16 = 67% 24
Accuracy = 67 + 16 = 83% 100
The Royal Marsden
Pathology +ve -ve Total
+ ve 0 0 0
- ve 5 95 100 Total 5 95 100
Test Accuracy and Prediction
Liver Scan
Sensitivity 0 = 0% 5
Specificity 95 = 100% 95
PPV = n/a
NPV = 95 = 95% 100
Accuracy = 95 + 0 = 95% 100

The Royal Marsden
Measuring reliability

The Royal Marsden
Pairs of repeated measures
Each patient has a DW-MRI twice on the same day, is the ADC value the same both times (is it repeatable)?

The Royal Marsden
Measures the strength of the linear relationship between two continuous variables. Lies between –1 and +1, with 0 for no relationship.
Measures association NOT causation. Does not test the hypothesis that the variables are the same.
Correlation, r

The Royal Marsden
Correlation example 1
Highly correlated with r=0.85 Mean difference second minus first scan = 45
0
20
40
60
80
100
120
140
160
0 20 40 60 80 100 120 140 160
First scan
Seco
nd s
can
Scan 1 Scan 2 Difference
62 85 23
41 111 70
13 57 44
71 115 44
98 143 45
82 134 52
26 85 59
28 71 44
34 59 25
65 88 23
82 146 64
12 78 66
62 128 66
19 46 27
15 75 60
65 88 23
91 122 32
62 100 39
29 71 42

The Royal Marsden
Correlation example 2
Highly correlated with r=0.96 Mean difference = 0
0
20
40
60
80
100
120
140
160
180
200
0 50 100 150 200
First scan
Seco
nd s
can
Scan 1 Scan 2 Difference
62 13 49
63 15 48
65 23 42
69 20 49
76 67 9
78 63 15
79 77 2
84 67 17
91 58 33
112 96 16
112 114 -2
112 150 -38
115 125 -10
115 134 -19
121 148 -27
132 175 -43
132 170 -38
141 152 -11
148 240 -92
The Royal Marsden
t-test for difference in means
Two-sample t-test is used for two sets of Normally distributed data (paired or unpaired)
Tests the hypotheses that the mean of the sets are equal
Does not measure variability between pairs
The Royal Marsden
Bland-Altman plots
Scatter plot of the mean of both observations against the difference
Calculate the mean and standard deviation (sd) of differences
Assuming differences are normally distributed, 95% of differences will lie with mean +/-2*sd (limits of agreement)
2*sd also known as co-effiecient of repeatability

The Royal Marsden
Bland-Altman example 1
+2*sd
-2*sd-5
-3
-1
1
3
5
50 60 70 80 90 100
Mean of paired observations
Dif
fere
nc
e S
ca
n 1
- S
ca
n 2
Scan 1 Scan 2 Difference Mean
67 67 0 67
75 78 2 77
88 89 1 88
78 79 1 78
65 66 2 65
53 56 2 55
74 72 -2 73
57 59 2 58
53 50 -2 52
74 74 0 74
61 58 -2 59
65 63 -2 64
60 58 -2 59
99 98 -1 99
63 62 -2 63
97 98 1 98
84 86 1 85
61 61 0 61
90 92 2 91
67 69 2 68
Mean observation from 50 to 100
Mean difference 0
s.d. of differences 1.8
Limits of agreement +3.6 to -3.6

The Royal Marsden
Correlation example 2
Highly correlated with r=0.96 Mean difference = 0
0
20
40
60
80
100
120
140
160
180
200
0 50 100 150 200
First scan
Seco
nd s
can
Scan 1 Scan 2 Difference
62 13 49
63 15 48
65 23 42
69 20 49
76 67 9
78 63 15
79 77 2
84 67 17
91 58 33
112 96 16
112 114 -2
112 150 -38
115 125 -10
115 134 -19
121 148 -27
132 175 -43
132 170 -38
141 152 -11
148 240 -92
The Royal Marsden
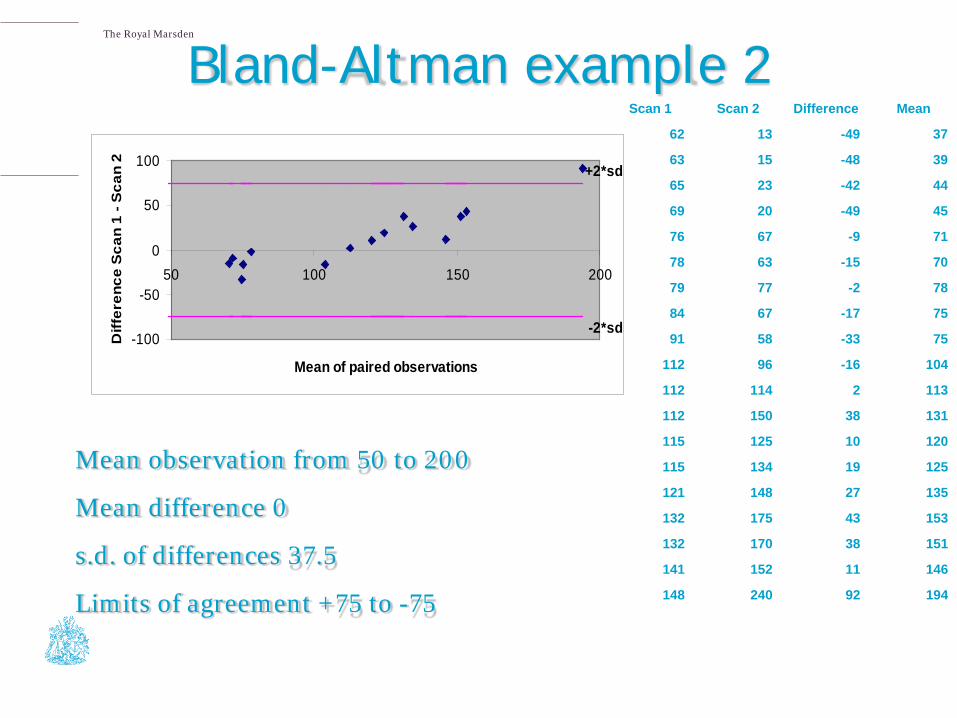
Bland-Altman example 2
Mean observation from 50 to 200
Mean difference 0
s.d. of differences 37.5
Limits of agreement +75 to -75
+2*sd
-2*sd-100
-50
0
50
100
50 100 150 200
Mean of paired observations
Diff
eren
ce S
can
1 - S
can
2Scan 1 Scan 2 Difference Mean
62 13 -49 37
63 15 -48 39
65 23 -42 44
69 20 -49 45
76 67 -9 71
78 63 -15 70
79 77 -2 78
84 67 -17 75
91 58 -33 75
112 96 -16 104
112 114 2 113
112 150 38 131
115 125 10 120
115 134 19 125
121 148 27 135
132 175 43 153
132 170 38 151
141 152 11 146
148 240 92 194

The Royal Marsden
Thank you for listening !!!