Embed Size (px)
Citation preview

Company Registered Number: 65046
THE ROYAL BANK OF SCOTLAND INTERNATIONAL (HOLDINGS) LIMITED
ANNUAL REPORT AND ACCOUNTS
31 December 2020

Contents
Page
Board of directors and secretary 1
Report of the directors 2
Statement of directors’ responsibilities 6
Independent auditor’s report to the members of the Royal Bank of Scotland International (Holdings) Limited 7
Consolidated income statement for the year ended 31 December 2020 10
Consolidated statement of comprehensive income for the year ended 31 December 2020 11
Consolidated balance sheet as at 31 December 2020 12
Consolidated statement of changes in equity for the year ended 31 December 2020 13
Consolidated cash flow statement for the year ended 31 December 2020 14
Accounting policies 15
Notes to the accounts 21
Board of directors and secretary
1 The Royal Bank of Scotland International (Holdings) Limited Annual Report and Accounts 2020
Chairman John Philip Ward Brewster Executive directors Andrew Martin McLaughlin Chief Executive Officer Lynn Ann Cleary Chief Financial Officer Non-executive directors Louis Philip Chetwynd Taylor (resigned 31 October 2020) Stuart Porteous Bruce Mark Cannon Gregory John Branch Christine Hilary Ashton (appointed 14 September 2020) Company Secretary Rachael Emma Pocklington (resigned 1 September 2020) Andrew Nicholson (appointed 1 September 2020) Auditor Ernst & Young LLP Castle Street St Helier Jersey JE1 1EY Registered office and Head office Royal Bank House 71 Bath Street St Helier Jersey JE4 8PJ The Royal Bank of Scotland International (Holdings) Limited Registered in Jersey, Channel Islands No. 65046
Report of the directors
2 The Royal Bank of Scotland International (Holdings) Limited Annual Report and Accounts 2020
Presentation of information
The directors of The Royal Bank of Scotland International (Holdings) Limited (the “Company”/“RBS International Holdings”) present their annual report, together with the audited financial statements of the Company and its subsidiaries (together "the Group") for the year ended 31 December 2020. The financial statements are prepared in accordance with International Financial Reporting Standards as issued by the International Accounting Standards Board (IASB). The Group publishes its financial statements in the functional currency, pounds sterling (‘£’ or ‘sterling’) and all values are rounded to the nearest million pound, except when otherwise indicated. The abbreviations ‘£m’ and ‘£bn’ represent millions and thousands of millions of pounds sterling, respectively.
ACTIVITIES AND BUSINESS REVIEW
Principal activities
The Company is a holding company owning the entire issued share capital of The Royal Bank of Scotland International Limited (“RBS International”/”RBSI”/the ”Bank”), as well as the other key companies forming the Group, including NatWest Trustee and Depositary Services Limited (NWTDS) and RBS International Funds Services SA (RBSI DS).
The Group includes RBS International, one of the largest banks operating in the Channel Islands, Isle of Man and Gibraltar with wholesale branches in Luxembourg and the UK. It provides a comprehensive range of financial services through its International Retail & Commercial Banking and Institutional Banking customer segments. International Retail & Commercial Banking provides loan and deposit products and services to personal, private, business and commercial customers. Institutional Banking provides services to European fund asset Managers, fund administrators and corporate service providers.
The directors do not anticipate any material change in the type or activities of the Company.
The Group is a subsidiary of NatWest Group plc (‘NWG’) (renamed from The Royal Bank of Scotland Group plc on 22 June 2020) which provides support and access to all central resources. The Group will leverage this relationship to NWG and other subsidiaries to continue to improve on the quality and efficiency of the services and products provided.
Copies of the annual report of NWG can be obtained from Corporate Governance and Regulatory Affairs, NatWest Gogarburn, Edinburgh EH12 1HQ, the Registrar of Companies or through the NWG website, www.natwestgroup.com.
Business review
The Group’s purpose, which is aligned with NatWest Group, is to champion potential, helping people, families and businesses
to thrive. The Group has identified three focus areas where it can make a meaningful contribution to its clients, colleagues and communities; climate, enterprise and learning.
With 2020 being dominated by the Coronavirus Disease 2019 (COVID-19) crisis, the Group has demonstrated our purpose-led approach with its ongoing support of clients and the launch of key sustainability initiatives. We continue to focus on improving client satisfaction through fully understanding their needs across the financial lifecycle.
The Group worked closely with local governments to implement emergency policies to support local communities and businesses in light of COVID-19. It led the offshore banking sector in the creation of the loan Disruption Guarantee Scheme (DGS), providing £858 million of loan facilities to financially support customers through forbearance, the DGS and payment holidays in 2020. The Group’s priority during the coronavirus pandemic has been to look after the safety and wellbeing of its clients and colleagues. The Group has created a safe working environment for its colleagues through rigorous health and safety procedures in its buildings and providing the right support for colleagues to work at home. With the majority of colleagues now working from home the Group has provided them with the technology they require to work effectively to continue to service its clients in addition to wellbeing support to help them in adapting to home working.
We build long-term partnerships, working collaboratively to understand our customers’ needs and create tailored solutions to help them grow and prosper. Our relationship teams provide insight and expertise in the sectors and locations where we operate. Leading a digital transformation across the communities we operate in and becoming a bank that is easy to deal with is the best way to fulfil our purpose to champion potential. Our customers have shown an increased digital adoption as behaviours and travel habits change.
International Retail & Commercial Banking There have been 26 releases of new features across Group’s personal digital channels; driven by customer feedback, supporting a 17% increase in users. Overall 68% Local Banking customers are now registered with digital banking which is an 8% increase on 2019.
The Group has improved its service propositions for our Coutts Crown Dependencies clients with the introduction of payment functionality and new deposit products.
The Group has accelerated its digital transformation strategy in light of COVID-19 and is now meeting the increasing customer demand for digital solutions. This change in customer behaviour has also led the Group to consolidate the branch network in local markets reducing the branch network to 8 in early January 2021.
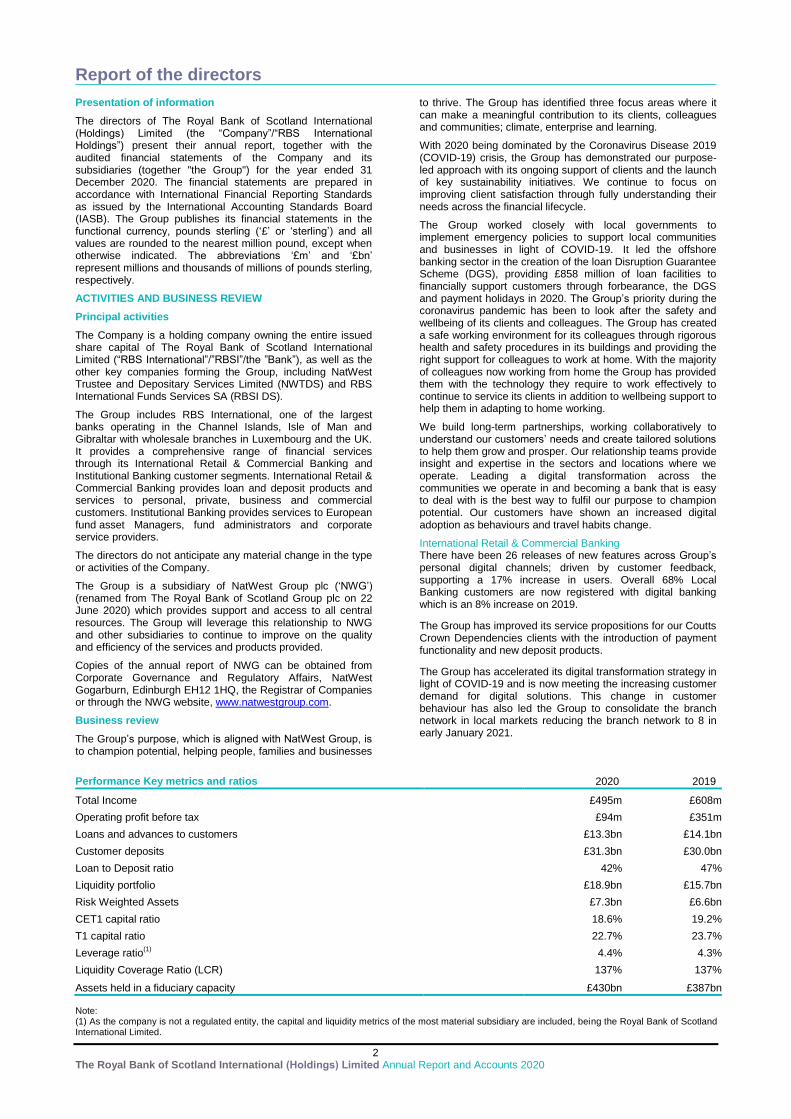
Performance Key metrics and ratios 2020 2019
Total Income £495m £608m
Operating profit before tax £94m £351m
Loans and advances to customers £13.3bn £14.1bn
Customer deposits £31.3bn £30.0bn
Loan to Deposit ratio 42% 47%
Liquidity portfolio £18.9bn £15.7bn
Risk Weighted Assets £7.3bn £6.6bn
CET1 capital ratio 18.6% 19.2%
T1 capital ratio 22.7% 23.7%
Leverage ratio(1)
4.4% 4.3%
Liquidity Coverage Ratio (LCR) 137% 137%
Assets held in a fiduciary capacity £430bn £387bn
Note: (1) As the company is not a regulated entity, the capital and liquidity metrics of the most material subsidiary are included, being the Royal Bank of Scotland International Limited.
Report of the directors
3 The Royal Bank of Scotland International (Holdings) Limited Annual Report and Accounts 2020
Institutional Banking Through increased investment in the multi-currency banking platform, eQ, the Group has improved the digital experience for institutional customers. With 11 releases of new features in 2020, there have been multiple improvements and all users have moved to the new version of eQ, making sure everyone has the same great functionality and experience. In September 2020 the Group has released its multi-currency platform for Corporate and Institutional banking clients on mobile.
Financial performance in a challenging environment The Group’s operating profit before tax was £94m compared with an operating profit before tax of £351m in 2019, reflecting lower income and significantly higher impairment charges primarily due to the current COVID-19 crisis and resulting uncertain economic conditions. The Group’s financial performance is presented in the Consolidated Income Statement on page 10. These results demonstrate the resilience of our underlying business and the strength of our balance sheet in the face of significant continued uncertainty. Income Income decreased by 19% to £495m reflecting the impact of central bank responses to COVID-19 as lower interest rates cause deposit margins to fall significantly.
Operating expenses Operating expenses increased by 16% to £294m. Included in operating expense is £34m of restructuring costs related to property exits and redundancy costs.
Impairments Impairment provisions of £107m primarily reflect a more uncertain economic environment and refreshed staging and maturity date analysis. £28m of this amount is specific impairments (Stage 3 Expected Credit Loss).
Loans and advances to customers Loans and advances to customers have decreased by £0.9bn during the year to £13.3bn. Funds Banking clients repaid loans to position themselves for potential future opportunities and to meet cleared funds requirements. The Group has worked closely with local governments to implement emergency policies to support local communities and businesses in light of COVID-19.
Customer deposits Customer deposits at £31.3bn have increased £1.1bn and represent the Group’s primary funding source. Year end balances comprised £10bn (2019: £9.6bn) International Retail & Commercial Banking deposits and £21.3bn (2019: £20.4bn) Institutional Banking deposits. Capital and Liquidity Management The Group entities’ capital and liquidity positions remained robust during 2020.
As at 31 December 2020 the CET1 ratio was 18.6% (2019: 19.2%) and the Liquidity Coverage Ratio was 137% (2019: 137%).
The decrease in CET1 reflects an increase in RWAs and an increase in capital deduction for a defined benefit pension scheme surplus. RWAs have increased £0.7bn to £7.3bn driven by increased lending activity and movements in customer maturities and credit risk. The Group’s loan to deposit ratio improved by 5 pts to 42% at 31 December 2020 (2019: 47%). To support diversification of funding sources the Group has issued Euro Commercial Paper and broadened its notice deposit product offering. In addition, as part of its management of the structural hedging programme the Group introduced interest rate swaps during the year.
The Group’s securities holdings of £5.4bn are highly liquid and comprised primarily of UK Gilts, German Bund and US Treasuries.
Assets held in a fiduciary capacity The Group holds assets under management which are not included in its financial statements. This includes trustee and depositary services to Collective Investment Schemes (CIS), including Alternative Investment Funds (AIFs) and Undertakings for Collective Investment in Transferable Securities Directive (UCITS). Assets under Management are favourably impacted by new monies into funds and strong performance by some fund manager.
Credit ratings RBS International which is the main subsidiary of the Company, has the following Credit Ratings at 31 December 2020:
S&P A- / A-2 (Negative)
Moody’s Baa1 / P-2 (Positive)
Fitch A / F1 (Negative)
ACCOUNTING POLICIES
The reported results of the Group are sensitive to the accounting policies, assumptions and estimates that underline the preparation of its financial statements. Details of the Group’s accounting policies and key sources of estimation uncertainty are included within the Accounting policies on pages 15 to 20. RISK MANAGEMENT
The prevailing market and economic conditions pose risks for the Group. These include the level of defaults from customers on outstanding advances as well as the degree of uncertainty in the valuation of other financial assets and liabilities.
The financial position of the Group, its cash flows, liquidity position and borrowing facilities are set out in the financial statements. Notes 8 and 18 to the financial statements include the Group’s objectives, policies and processes for managing its capital; its financial risk management objectives; details of its financial instruments and hedging activities; and its exposures to credit risk and liquidity risk.
THE BOARD
The Board considers strategic issues and ensures the Group manages risk effectively through approving and monitoring the Group’s risk appetite, considering stress scenarios and agreed mitigants and identifying longer term strategic threats to the Group’s business operations. The Board’s terms of reference include key aspects of the Group’s affairs reserved for the Board’s decision and are reviewed at least annually.
There are a number of areas where the Board has delegated specific authority to management, including the Chief Executive Officer (CEO) and Chief Financial Officer (CFO). These include responsibility for the operational management of the Group’s businesses as well as reviewing high level strategic issues and considering risk appetite, risk policies and risk management strategies in advance of these being considered by the Board and/or its Committees. The roles of Chairman and CEO are distinct and separate, with a clear division of responsibilities. The Chairman leads the Board and ensures the effective engagement and contribution of all executive, non-executive and CEO has responsibility for all Group’s businesses and acts in accordance with authority delegated by the Board. The independent non-executive directors combine broad business and commercial experience with independent and objective judgement and they provide
Report of the directors
4 The Royal Bank of Scotland International (Holdings) Limited Annual Report and Accounts 2020
independent challenge to the executive directors and leadership team. In order to provide effective oversight and leadership the Board has established three Board Committees with particular responsibilities: The Audit Committee assists the Board in discharging its responsibilities for monitoring the quality of the financial statements of the Group. It reviews the accounting policies, financial reporting and regulatory compliance of the Group and its systems and standards of internal controls and monitors the work of internal and external audit. The Board Risk Committee provides oversight and advice on current and potential future risk exposures of the Company and future risk strategy. It reviews compliance with risk appetite and oversees the operation of the policy framework and submission to regulators. The Remuneration Committee is responsible for overseeing the implementation of Remuneration Policy. The Remuneration Committee also reviews performance and remuneration arrangements for the in-scope population detailed in its terms of reference. The Board has delegated day to day management of the business to the CEO. The CEO is supported by various management level committees including the Executive Committee which assists the CEO in managing strategic, financial, capital and operational issues related to the running of the business. DIRECTORS AND SECRETARY The present directors and secretary, who have served during the year, are listed on page 1. COLLEAGUES Colleague engagement The group prioritised the wellbeing of our colleagues in this challenging year. It enabled the majority of colleagues to work from home. It ensured that all colleagues continued to be paid as normal until September if they needed to take some time to look after their families, were unable to work from home or were ill. It also enhanced our free mental health support through a new partnership with Silvercloud, providing substantial, sector-leading support to any colleague who needs it and provided all leaders access to extended mental health awareness support. The group values the input of its colleagues and actively seeks opportunities to engage with them to contribute to on-going dialogue and activities to make the Group a better bank for our customers and colleagues. The survey of colleague opinions, known as ‘Our View’, provides valuable data to decision makers across the Group in support of improving employee engagement and satisfaction. This progress is tracked through a survey during the financial year, utilising questions common across the financial services industry to compare ourselves against our peers. 75% of colleagues completed the staff opinion survey. Scores improved in 7 of the 15 categories though there was an overall decline in wellbeing. Diversity and inclusion The Group has a Diversity and Inclusion Policy and values and promotes diversity in all areas of recruitment and employment. Building a working environment where all our colleagues can develop to their full potential is important to us irrespective of their age, belief, disability, ethnic or national origin, gender, gender identity, marital or civil partnership status, political opinion, race, religion or sexual orientation. We work to avoid limiting potential through bias, prejudice or discrimination. The Group recognises the beneficial
contribution of a diverse mix of uniquely talented individuals for the delivery of great service to our diverse customer base. Key principles of our Diversity and Inclusion Policy include that we attract, motivate and retain the best talent. We base the employment relationship on the principles of fairness, respect and inclusion. We comply with local laws on equality and Our Code, which sets out the Group’s expected behaviours and standards of conduct, to build and develop an inclusive workforce in order to understand and respond to our diverse customer base.
Safety, health and wellbeing
As a strong component of making the Group a purpose-led organisation, an established wellbeing strategy is key. The Group’s Wellbeing strategy is delivered against four pillars; Physical, Mental, Social and Financial.
Championing the potential of our colleagues Ongoing professional development for our colleagues and continuous learning culture is important to the Group.
The Group offers a wide range of learning opportunities including technical knowledge and skills. We need to prepare colleagues for the future and we continue to focus broader development on our Critical People Capabilities.
We’re committed to developing colleagues in the five key critical capability areas we have identified, that will help build the right knowledge, skills and behaviours, to help our colleagues stay relevant and employable, and support our ambition and purpose. In addition, we are encouraging agility and shifting mindsets so that a focus on the future, continuous learning, knowledge sharing and reflective practice becomes the norm. Rewarding our colleagues Our approach to performance management provides clarity for our colleagues about how their contribution links to our ambition. It recognises contributions that support our values and holds individuals to account for behaviour and performance that does not. ENTERPRISE In July the Group introduced the Woman in Business accreditation, with 46 colleagues completing the qualification. In tandem we nominated 9 customers for the NatWest Everywoman Awards, championing their potential and helping to remove the barriers to business. In the second half of 2020 we selected six local, social enterprises to support with mentoring, sharing our knowledge and resources with our communities. We also held virtual Business Builder events which were open to anyone in the community, a first for RBS International, we had 93 attendees, of which a third signed up for further support. CLIMATE The Group continues to help drive the transition to a low carbon economy. In the fourth quarter of 2020 we signed an investor backed loan facility (IBLF) for an energy transition fund focusing on clean energy production, energy efficiency enhancements and clean energy utilisation. We also signed an IBLF for a European fund; who invests in the development, construction and management of subsidy-free and sustainable renewable energy assets Throughout 2020 we have sought to increase customer and colleague knowledge on climate by running education sessions on sustainability-linked loans, holding a Climate Awareness month and by enrolling over 100 colleagues on climate education courses; in partnership with the University of Edinburgh and Cambridge Institute of Sustainability Leadership.
Report of the directors
5 The Royal Bank of Scotland International (Holdings) Limited Annual Report and Accounts 2020
OUTLOOK
The Group faces increased political and economic risks and uncertainty. In the current environment, and recognising ongoing market uncertainty, we continue to expect challenges on income. Scenarios identified as having a potentially material negative impact on the Group include; persistent or more intense weakness in global economic growth, particularly COVID-19 pandemic related uncertainties; shifts in the international tax policy environment; an extended period of low inflation and low (or negative) interest rates; market volatility or fluctuations in the value of the pound sterling, new or extended economic sanctions, volatility in commodity prices or concerns regarding sovereign debt; and political and geopolitical instability. This may be compounded by the ageing demographics of the populations in the markets that the Group serves, or rapid change to the economic environment due to the adoption of technology and artificial intelligence. Any of the above developments could adversely impact the Group directly (for example, as a result of credit losses) or indirectly (for example, by impacting global economic growth and financial markets and the Group’s clients and their banking needs). The directors, noting the continued and forecast challenging economic outlook and cognisant of the macroeconomic and political risks, consider that the Group’s continued focus on accelerating digital transformation, simplifying its business model, maintaining strength and sustainability and supporting growth will assist in the delivery of the NatWest Group’s purpose to champion potential, helping people, families and businesses to thrive.
Economic and political landscape The Group continues to deal with a range of significant risks and uncertainties in the external economic, political and regulatory environment. Scenarios identified as having a potentially negative impact on the Group include
• Further decreases in interest rates and/or continued sustained low or negative interest rates could put pressure on the Group’s interest margins and adversely affect the Group’s profitability.
• Changes in currency rates, particularly in the sterling-US dollar and euro-sterling rates, can adversely affect the value of assets, liabilities, income, RWAs and expenses.
• Shifts in the international tax policy environment and imposition of levies and taxes can affect the distributable profits of the Group, as the Group is subject to tax laws and practice in the jurisdictions in which it has operations.
• Political and geopolitical instability could result in subdued confidence and impact on credit ratings.
• Changes to IRB regulation from the Prudential Regulatory Authority (PRA).
• The uncertainty around the consequences of Brexit on cross-border activities.
GOING CONCERN The directors are satisfied with the financial position of the Group and believe that they are appropriately placed to manage their business risks successfully. Having reviewed the Group’s forecasts, projections and other relevant evidence, the directors have a reasonable expectation that the Group will continue in operational existence for the foreseeable future. Foreseeable future is defined as 12 months from the date of signing of this Report and Accounts. Accordingly, the financial statements of the Group have been prepared on a going concern basis. DIVIDENDS In light of the economic uncertainty, the directors have not declared any ordinary dividend (2019: £872m) to NatWest Group Plc. A preference dividend of £20m (2019: £10m) was paid by RBSI to NatWest Group Plc. POST BALANCE SHEET EVENTS Post balance sheet events are described in note 23 to the financial statements. AUDITOR Ernst & Young were acted as independent auditors for the year ended 31 December 2020 and expressed their willingness to continue in office.
By order of the Board:
Andrew Martin McLaughlin Lynn Ann Cleary Chief Executive Officer Chief Financial Officer Date: 16 February 2021 Date: 16 February 2021
Statement of directors’ responsibilities
6 The Royal Bank of Scotland International (Holdings) Limited Annual Report and Accounts 2020
The directors are responsible for preparing the financial statements in accordance with applicable law and regulation. Company law requires the directors to prepare financial statements for each financial year. Under that law the directors have elected to prepare the financial statements in accordance with International Financial Reporting Standards (IFRS) as issued by the IASB. The financial statements are required by law to give a true and fair view of the state of affairs of the Company and of the profit or loss of the Company for that period. In preparing these financial statements the directors are required to:
select suitable accounting policies and then apply them consistently;
make judgements and estimates that are reasonable and prudent;
state whether applicable accounting standards have been followed, subject to any material departures disclosed and explained in the accounts, and
prepare the financial statements on the going concern basis unless it is inappropriate to presume that the Company will continue in business.
The directors are responsible for keeping proper accounting records that disclose with reasonable accuracy at any time the financial position of the Company and enable them to ensure that the financial statements comply with the Companies (Jersey) Law 1991. They are responsible for safeguarding the assets of the Company and hence for taking reasonable steps for the prevention and detection of fraud and other irregularities. The directors confirm they have discharged those responsibilities. The directors confirm that these financial statements comply with the aforementioned requirements. By order of the Board:
Andrew Martin McLaughlin Lynn Ann Cleary Chief Executive Officer Chief Financial Officer Date: 16 February 2021 Date: 16 February 2021
Independent auditor’s report to the members of The Royal Bank of Scotland International (Holdings) Limited
7 The Royal Bank of Scotland International (Holdings) Limited Annual Report and Accounts 2020
Opinion We have audited the financial statements of The Royal Bank of Scotland International (Holdings) Limited (the “Company”) and its subsidiaries (the “Group”) for the year ended 31 December 2020 which comprise the Consolidated Income Statement, the Consolidated Statement of Comprehensive Income, the Consolidated Balance Sheet, the Consolidated Statement of Changes in Equity, the Consolidated Cash Flow Statement and the related notes 1 to 23, including a summary of significant accounting policies. The financial reporting framework that has been applied in their preparation is applicable law and International Financial Reporting Standards as issued by the IASB.
In our opinion, the financial statements:
give a true and fair view of the state of the Group’s affairs as at 31 December 2020 and of its profit for the year then ended;
have been properly prepared in accordance with International Financial Reporting Standards as issued by the IASB; and
have been properly prepared in accordance with the requirements of the Companies (Jersey) Law 1991. Basis for opinion We conducted our audit in accordance with International Standards on Auditing (UK) (“ISAs (UK)”) and applicable law. Our responsibilities under those standards are further described in the Auditor’s responsibilities for the audit of the financial statements section of our report. We are independent of the Group in accordance with the ethical requirements that are relevant to our audit of the financial statements, including the UK FRC’s Ethical Standard, and we have fulfilled our other ethical responsibilities in accordance with these requirements.
We believe that the audit evidence we have obtained is sufficient and appropriate to provide a basis for our opinion.
Conclusions relating to going concern In auditing the financial statements, we have concluded that the directors’ use of the going concern basis of accounting in the preparation of the financial statements is appropriate. Based on the work we have performed, we have not identified any material uncertainties relating to events or conditions that, individually or collectively, may cast significant doubt on the Group’s ability to continue as a going concern for a period of at least twelve months from when the financial statements are authorised for issue. Our responsibilities and the responsibilities of the directors with respect to going concern are described in the relevant sections of this report. However, because not all future events or conditions can be predicted, this statement is not a guarantee as to the Group’s ability to continue as a going concern. Other information The other information comprises the information included in the Annual Report other than the financial statements and our auditor’s report thereon. The directors are responsible for the other information contained within the Annual Report.
Our opinion on the financial statements does not cover the other information and, except to the extent otherwise explicitly stated in this report, we do not express any form of assurance conclusion thereon.
Our responsibility is to read the other information and, in doing so, consider whether the other information is materially inconsistent with the financial statements or our knowledge obtained in the course of the audit or otherwise appears to be materially misstated. If we identify such material inconsistencies or apparent material misstatements, we are required to determine whether there is a material misstatement in the financial statements themselves. If, based on the work we have performed, we conclude that there is a material misstatement of the other information, we are required to report that fact. We have nothing to report in this regard. Matters on which we are required to report by exception We have nothing to report in respect of the following matters in relation to which the Companies (Jersey) Law 1991 requires us to report to you if, in our opinion:
proper accounting records have not been kept by the Company, or proper returns adequate for our audit have not been received from branches not visited by us; or
the financial statements are not in agreement with the Company’s accounting records and returns; or
we have not received all the information and explanations we require for our audit.
Independent auditor’s report to the members of The Royal Bank of Scotland International (Holdings) Limited
8 The Royal Bank of Scotland International (Holdings) Limited Annual Report and Accounts 2020
Responsibilities of directors As explained more fully in the Statement of directors’ responsibilities set out on page 6, the directors are responsible for the preparation of the financial statements and for being satisfied that they give a true and fair view, and for such internal control as the directors determine is necessary to enable the preparation of financial statements that are free from material misstatement, whether due to fraud or error.
In preparing the financial statements, the directors are responsible for assessing the Group’s ability to continue as a going concern, disclosing, as applicable, matters related to going concern and using the going concern basis of accounting unless the directors either intend to liquidate the Group or to cease operations, or have no realistic alternative but to do so.
Auditor’s responsibilities for the audit of the financial statements Our objectives are to obtain reasonable assurance about whether the financial statements as a whole are free from material misstatement, whether due to fraud or error, and to issue an auditor’s report that includes our opinion. Reasonable assurance is a high level of assurance, but is not a guarantee that an audit conducted in accordance with ISAs (UK) will always detect a material misstatement when it exists. Misstatements can arise from fraud or error and are considered material if, individually or in the aggregate, they could reasonably be expected to influence the economic decisions of users taken on the basis of these financial statements.
Explanation as to what extent the audit was considered capable of detecting irregularities, including fraud
Irregularities, including fraud, are instances of non-compliance with laws and regulations. We design procedures in line with our responsibilities, outlined above, to detect irregularities, including fraud. The risk of not detecting a material misstatement due to fraud is higher than the risk of not detecting one resulting from error, as fraud may involve deliberate concealment by, for example, forgery or intentional misrepresentations, or through collusion. The extent to which our procedures are capable of detecting irregularities, including fraud is detailed below. However, the primary responsibility for the prevention and detection of fraud rests with both those charged with governance of the Group and management.
We obtained an understanding of the legal and regulatory frameworks that are applicable to the Group and determined that the most significant are those that relate to the reporting framework, namely;
the Companies (Jersey) Law 1991
We understood how the Group is complying with those frameworks by making enquiries of management, internal audit and those responsible for legal and compliance matters and corroborated this by reviewing supporting documentation. We also reviewed minutes of the Board and gained an understanding of the Group’s governance framework;
We assessed the susceptibility of the Group’s financial statements to material misstatement, including how fraud might occur by considering the controls established to address risks identified to prevent or detect fraud. We identified the risk of management override associated to impairment provisions and the risk associated with the revenue recognition of manual and partly manual revenue streams to be a fraud risks. When performing our fraud procedures we identified others areas that we considered, such as cybersecurity, the impact of remote working and the appropriateness of sources used when performing confirmation testing on accounts such as cash, loans and securities; and
Based on this understanding we designed our audit procedures to identify noncompliance with such laws and regulations. Our procedures involved reading Board minutes, complaints register, compliance reports, and inquiries of internal legal counsel, those charged with governance, executive management, compliance and internal audit, and the performance of journal entry testing meeting our defined risk criteria and our understanding of the business.
A further description of our responsibilities for the audit of the financial statements is located on the Financial Reporting Council’s website at https://www.frc.org.uk/auditorsresponsibilities. This description forms part of our auditor’s report.
Independent auditor’s report to the members of The Royal Bank of Scotland International (Holdings) Limited
9 The Royal Bank of Scotland International (Holdings) Limited Annual Report and Accounts 2020
Use of our report This report is made solely to the Company’s members, as a body, in accordance with Article 113A of the Companies (Jersey) Law 1991. Our audit work has been undertaken so that we might state to the Company’s members those matters we are required to state to them in an auditor’s report and for no other purpose. To the fullest extent permitted by law, we do not accept or assume responsibility to anyone other than the Company and the Company’s members as a body, for our audit work, for this report, or for the opinions we have formed.
David Robert John Moore ACA
for and on behalf of Ernst & Young LLP Jersey, Channel Islands
16 February 2021 Notes:
1. The maintenance and integrity of Company’s web site is the responsibility of the directors; the work carried out by the auditors does not involve consideration of these matters and, accordingly, the auditors accept no responsibility for any changes that may have occurred to the financial statements since they were initially presented on the web site.
2. Legislation in the Jersey governing the preparation and dissemination of financial statements may differ from legislation in other jurisdictions.
Consolidated income statement for the year ended 31 December 2020
10 The Royal Bank of Scotland International (Holdings) Limited Annual Report and Accounts 2020
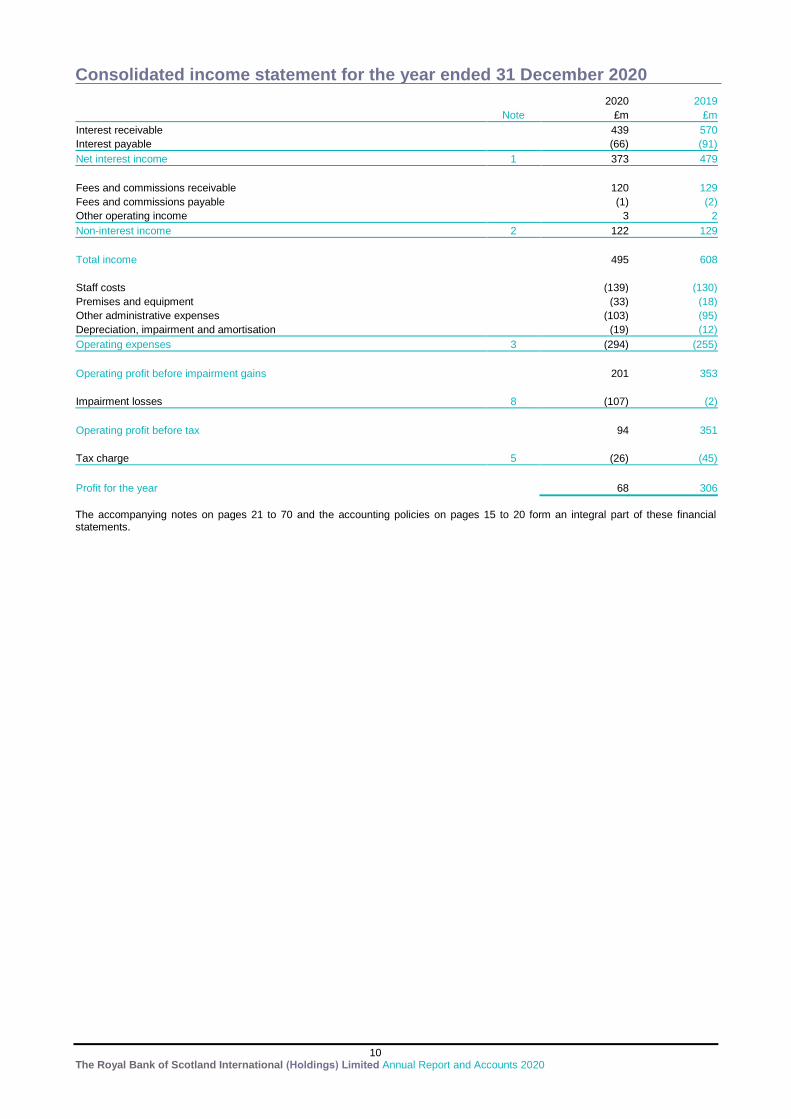
2020 2019
Note £m £m
Interest receivable
439 570
Interest payable
(66) (91)
Net interest income 1 373 479
Fees and commissions receivable
120 129
Fees and commissions payable
(1) (2)
Other operating income
3 2
Non-interest income 2 122 129
Total income
495 608
Staff costs
(139) (130)
Premises and equipment
(33) (18)
Other administrative expenses
(103) (95)
Depreciation, impairment and amortisation
(19) (12)
Operating expenses 3 (294) (255)
Operating profit before impairment gains
201 353
Impairment losses 8 (107) (2)
Operating profit before tax
94 351
Tax charge 5 (26) (45)
Profit for the year
68 306
The accompanying notes on pages 21 to 70 and the accounting policies on pages 15 to 20 form an integral part of these financial statements.
Consolidated statement of comprehensive income for the year ended 31 December 2020
11 The Royal Bank of Scotland International (Holdings) Limited Annual Report and Accounts 2020
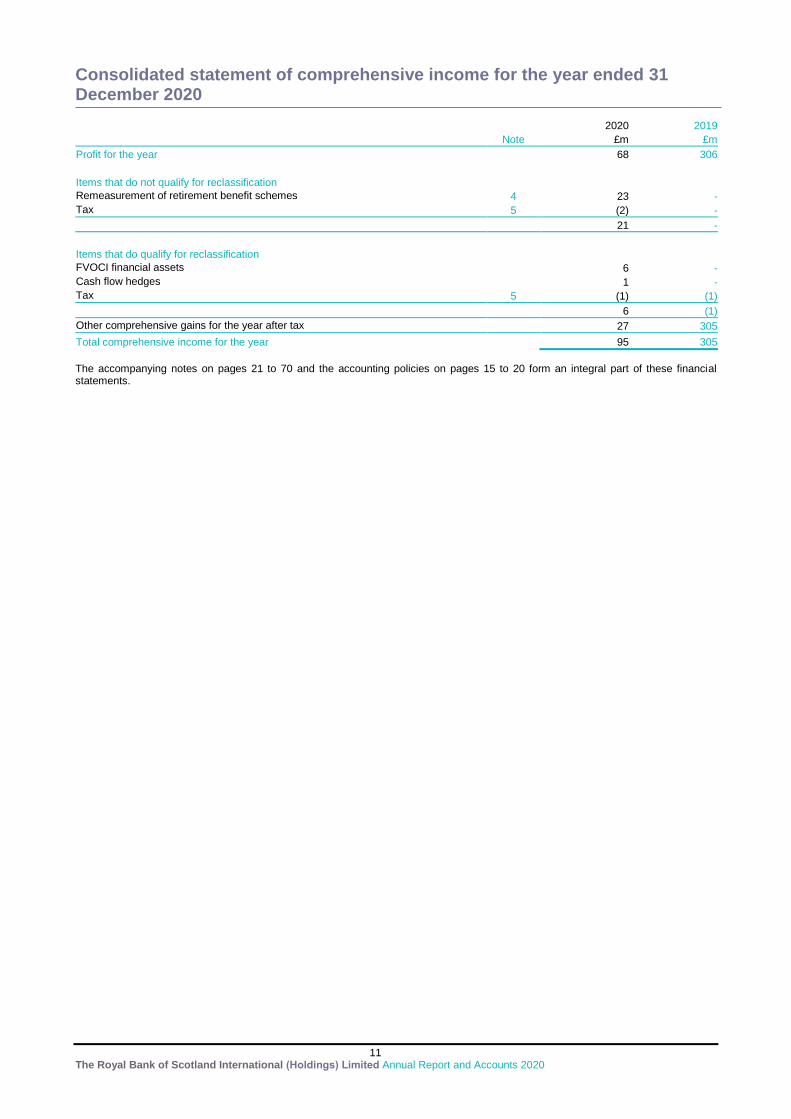
2020 2019
Note £m £m
Profit for the year
68 306
Items that do not qualify for reclassification Remeasurement of retirement benefit schemes 4 23 -
Tax 5 (2) -
21 -
Items that do qualify for reclassification FVOCI financial assets
6 -
Cash flow hedges
1 -
Tax 5 (1) (1)
6 (1)
Other comprehensive gains for the year after tax
27 305
Total comprehensive income for the year
95 305
The accompanying notes on pages 21 to 70 and the accounting policies on pages 15 to 20 form an integral part of these financial statements.
Consolidated balance sheet as at 31 December 2020
12 The Royal Bank of Scotland International (Holdings) Limited Annual Report and Accounts 2020
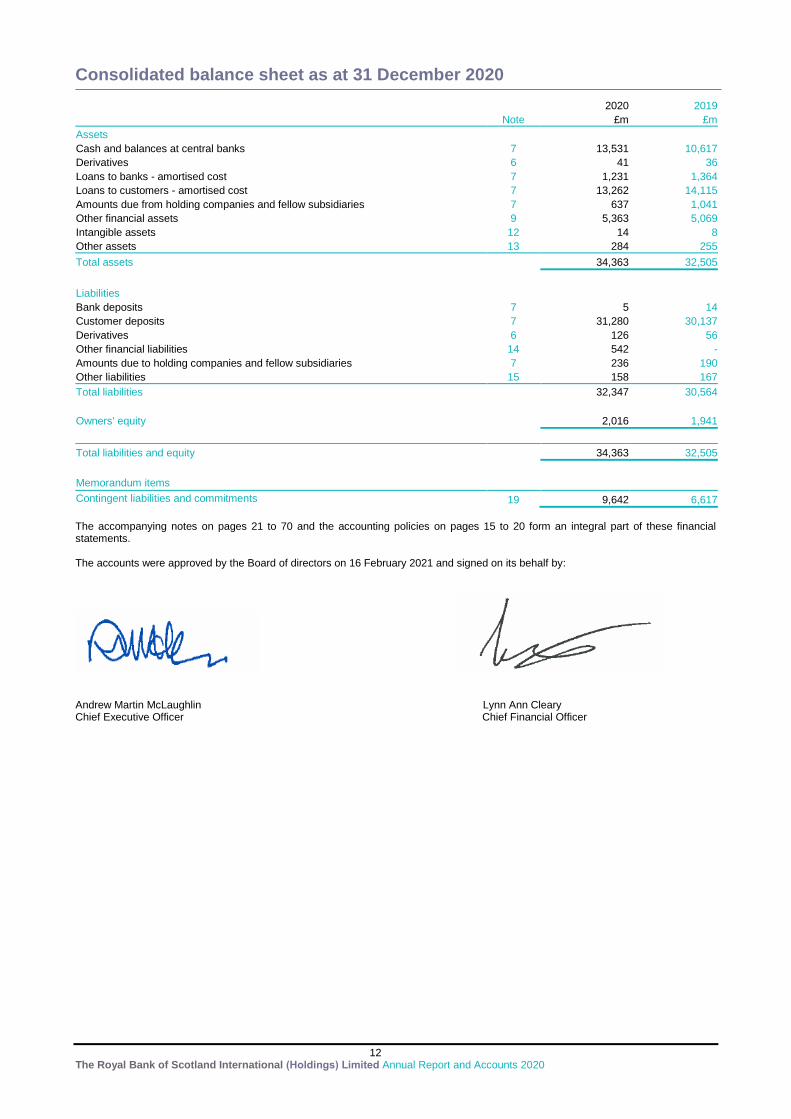
2020 2019
Note £m £m
Assets Cash and balances at central banks 7 13,531 10,617
Derivatives 6 41 36
Loans to banks - amortised cost 7 1,231 1,364
Loans to customers - amortised cost 7 13,262 14,115
Amounts due from holding companies and fellow subsidiaries 7 637 1,041
Other financial assets 9 5,363 5,069
Intangible assets 12 14 8
Other assets 13 284 255
Total assets
34,363 32,505
Liabilities Bank deposits 7 5 14
Customer deposits 7 31,280 30,137
Derivatives 6 126 56
Other financial liabilities 14 542 -
Amounts due to holding companies and fellow subsidiaries 7 236 190
Other liabilities 15 158 167
Total liabilities
32,347 30,564
Owners' equity
2,016 1,941
Total liabilities and equity
34,363 32,505
Memorandum items
Contingent liabilities and commitments 19 9,642 6,617
The accompanying notes on pages 21 to 70 and the accounting policies on pages 15 to 20 form an integral part of these financial statements. The accounts were approved by the Board of directors on 16 February 2021 and signed on its behalf by:
Andrew Martin McLaughlin Lynn Ann Cleary Chief Executive Officer Chief Financial Officer
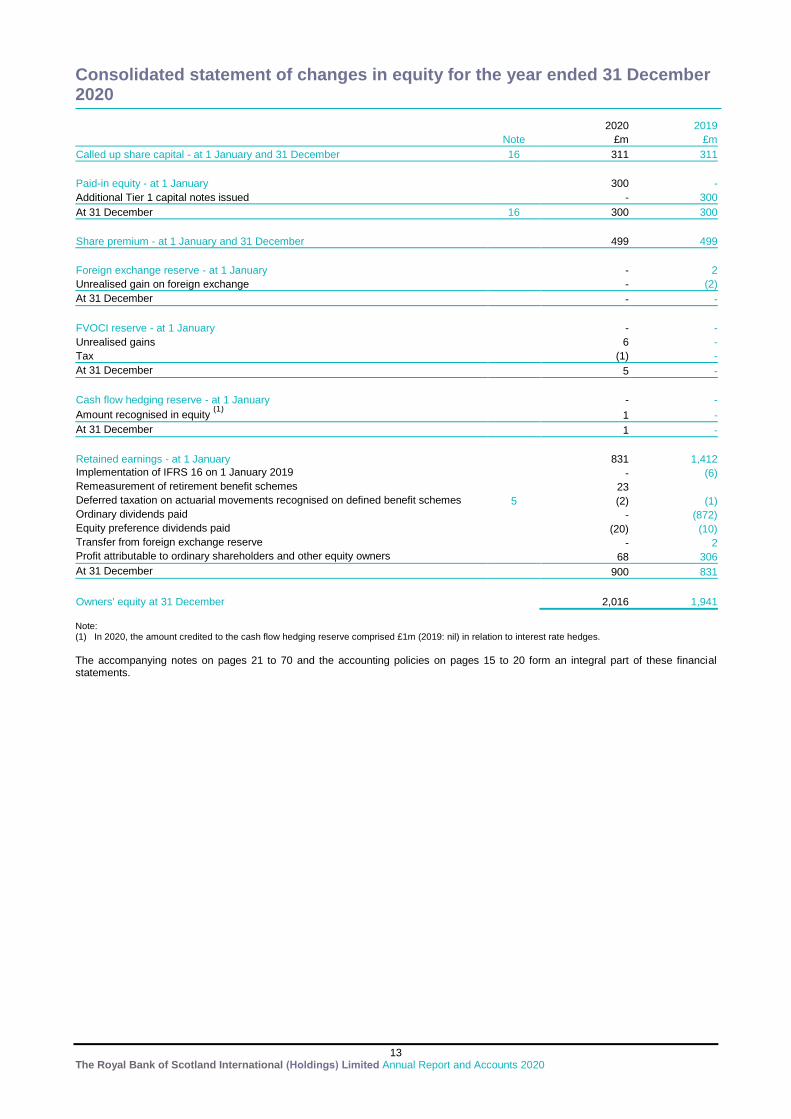
Consolidated statement of changes in equity for the year ended 31 December 2020
13 The Royal Bank of Scotland International (Holdings) Limited Annual Report and Accounts 2020
2020 2019
Note £m £m
Called up share capital - at 1 January and 31 December 16 311 311
Paid-in equity - at 1 January
300 -
Additional Tier 1 capital notes issued
- 300
At 31 December 16 300 300
Share premium - at 1 January and 31 December
499 499
Foreign exchange reserve - at 1 January
- 2
Unrealised gain on foreign exchange
- (2)
At 31 December
- -
FVOCI reserve - at 1 January
- -
Unrealised gains
6 -
Tax
(1) -
At 31 December
5 -
Cash flow hedging reserve - at 1 January
- -
Amount recognised in equity (1)
1 -
At 31 December
1 -
Retained earnings - at 1 January
831 1,412
Implementation of IFRS 16 on 1 January 2019
- (6)
Remeasurement of retirement benefit schemes
23
Deferred taxation on actuarial movements recognised on defined benefit schemes 5 (2) (1)
Ordinary dividends paid
- (872)
Equity preference dividends paid
(20) (10)
Transfer from foreign exchange reserve
- 2
Profit attributable to ordinary shareholders and other equity owners
68 306
At 31 December
900 831
Owners' equity at 31 December
2,016 1,941
Note: (1) In 2020, the amount credited to the cash flow hedging reserve comprised £1m (2019: nil) in relation to interest rate hedges.
The accompanying notes on pages 21 to 70 and the accounting policies on pages 15 to 20 form an integral part of these financial statements.
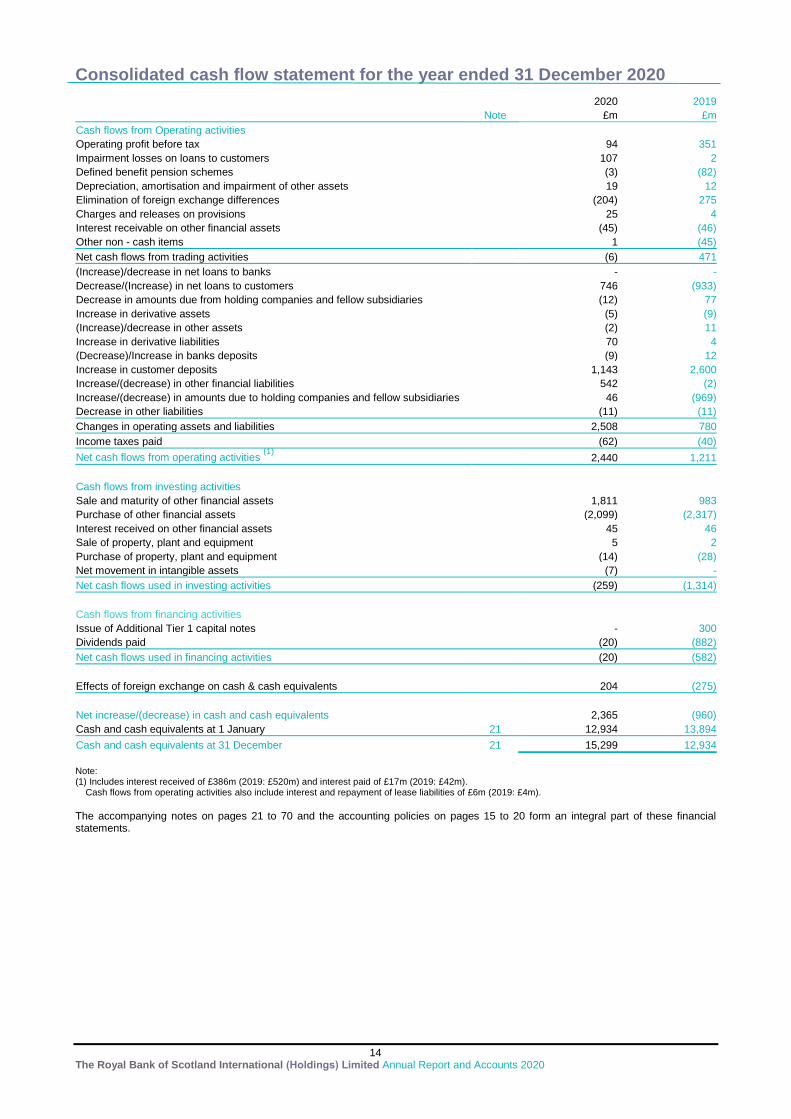
Consolidated cash flow statement for the year ended 31 December 2020
14 The Royal Bank of Scotland International (Holdings) Limited Annual Report and Accounts 2020
2020 2019
Note £m £m
Cash flows from Operating activities Operating profit before tax
94 351
Impairment losses on loans to customers
107 2
Defined benefit pension schemes
(3) (82)
Depreciation, amortisation and impairment of other assets
19 12
Elimination of foreign exchange differences
(204) 275
Charges and releases on provisions
25 4
Interest receivable on other financial assets
(45) (46)
Other non - cash items
1 (45)
Net cash flows from trading activities
(6) 471
(Increase)/decrease in net loans to banks
- -
Decrease/(Increase) in net loans to customers
746 (933)
Decrease in amounts due from holding companies and fellow subsidiaries
(12) 77
Increase in derivative assets
(5) (9)
(Increase)/decrease in other assets
(2) 11
Increase in derivative liabilities
70 4
(Decrease)/Increase in banks deposits
(9) 12
Increase in customer deposits
1,143 2,600
Increase/(decrease) in other financial liabilities
542 (2)
Increase/(decrease) in amounts due to holding companies and fellow subsidiaries
46 (969)
Decrease in other liabilities
(11) (11)
Changes in operating assets and liabilities
2,508 780
Income taxes paid
(62) (40)
Net cash flows from operating activities (1)
2,440 1,211
Cash flows from investing activities Sale and maturity of other financial assets
1,811 983
Purchase of other financial assets
(2,099) (2,317)
Interest received on other financial assets
45 46
Sale of property, plant and equipment
5 2
Purchase of property, plant and equipment
(14) (28)
Net movement in intangible assets
(7) -
Net cash flows used in investing activities
(259) (1,314)
Cash flows from financing activities Issue of Additional Tier 1 capital notes
- 300
Dividends paid
(20) (882)
Net cash flows used in financing activities
(20) (582)
Effects of foreign exchange on cash & cash equivalents
204 (275)
Net increase/(decrease) in cash and cash equivalents
2,365 (960)
Cash and cash equivalents at 1 January 21 12,934 13,894
Cash and cash equivalents at 31 December 21 15,299 12,934
Note: (1) Includes interest received of £386m (2019: £520m) and interest paid of £17m (2019: £42m). Cash flows from operating activities also include interest and repayment of lease liabilities of £6m (2019: £4m).
The accompanying notes on pages 21 to 70 and the accounting policies on pages 15 to 20 form an integral part of these financial statements.
Accounting policies
15 The Royal Bank of Scotland International (Holdings) Limited Annual Report and Accounts 2020
1. Presentation of accounts
The accounts, set out on pages 10 to 70 including these accounting policies on pages 15 to 20 and Risk management sections on pages 41 to 68, are prepared on a going concern basis (see the Report of the directors, page 5) in accordance with International Financial Reporting Standards as issued by the IASB. The significant accounting policies and related judgments are set out below. The Company is incorporated and registered in Jersey, Channel Islands (Registration number - 65046). The Company's registered and head office is Royal Bank House, 71 Bath Street, St Helier, Jersey, JE4 8PJ. The accounts are presented in the functional currency, pounds sterling. With the exception of certain financial instruments as described in Accounting policies 12 and 18, the accounts are presented on a historical cost basis. Accounting policy changes effective 1 January 2020
Amendments to IFRS 3 Business Combinations (IFRS 3) - Changes to the definition of a business The IASB amended IFRS 3 to provide additional guidance on the definition of a business. The amendment aims to help entities when determining whether a transaction should be accounted for as a business combination or as an asset acquisition. The amendments are in line with current accounting policy and therefore did not affect the accounts.
Definition of material – Amendments to IAS 1 – Presentation of Financial Statements (IAS 1) and IAS 8 - Accounting Policies, Changes in Accounting Estimates and Errors (IAS 8) The IASB clarified the definition of ‘material’ and aligned the definition of material used in the Conceptual Framework and in other IFRS standards. The amendments clarify that materiality will depend on the nature or magnitude of information. Under the amended definition of materiality, an entity will need to assess whether the information, either individually or in combination with other information, is material in the context of the accounts. A misstatement of information is material if it could reasonably be expected to influence decisions made by the primary users. The Company’s definition and application of materiality is in line with the definition in the amendments. Interest Rate Benchmark Reform (IBOR reform) Phase 1 amendments to IFRS 9 and IAS 39 The IASB issued 'Interest Rate Benchmark Reform (Amendments to IFRS 9, IAS 39 and IFRS 7)' as a first reaction to the potential effects the IBOR reform could have on financial reporting. The amendments focused on hedge accounting and allow hedge relationships affected by the IBOR reform to be accounted for as continuing hedges. Amendments are effective for annual reporting periods beginning on or after 1 January 2020. Interest Rate Benchmark Reform (IBOR reform) Phase 2 amendments to IFRS 9, IAS 39, IFRS 7, IFRS 4 and IFRS 16 Phase 2 of the IASB’s IBOR project addresses the wider accounting issues arising from the IBOR reform. This was published in August 2020 and is endorsed in January 2021 in the UK and EU. The amendments are effective for annual reporting periods beginning on or after 1 January 2021 with early application permitted. The Group early adopted these amendments for the annual period ending on 31 December 2020. The Group’s IBOR transition program remains on track and key milestones have been met. Conversion from LIBOR to alternative risk-free Rates (RFRs) is expected to increase as RFR based products become more widely available and key market-driven conversion events occur.
2. Basis of consolidation
The consolidated accounts incorporate the financial statements of the Company and entities that give access to variable returns and that are controlled by the Group. Control is assessed by reference to our ability to enforce our will on the other entity, typically through voting rights. All intergroup balances, transactions, income and expenses are eliminated on consolidation. The consolidated accounts are prepared under uniform accounting policies. 3. Revenue recognition
Interest income or expense relates to financial instruments measured at amortised cost and debt instruments classified as fair value through OCI using the effective interest rate method, the effective part of any related accounting hedging instruments, and finance lease income recognised at a constant periodic rate of return before tax on the net investment. Negative effective interest accruing to financial assets is presented in interest payable. Other interest relating to financial instruments measured at fair value is recognised as part of the movement in fair value. Fees in respect of services are recognised as the right to consideration accrues through the performance of each distinct service obligation to the customer. The arrangements are generally contractual and the cost of providing the service is incurred as the service is rendered. The pricing base is usually known and always determinable. 4. Employee benefits
Short-term employee benefits, such as salaries, paid absences, and other benefits are accounted for on an accrual basis over the period in which the employees provide the related services. Employees may receive variable compensation satisfied by cash, by debt instruments issued by the Natwest Group or by NatWest Group plc shares. The Company operates a number of share-based compensation schemes under which it awards NatWest Group plc shares and share options to its employees. Such awards are generally subject to vesting conditions. Variable compensation that is settled in cash or debt instruments is charged to profit or loss on a straight-line basis over the vesting period, taking account of forfeiture and clawback criteria. Contributions to defined contribution pension schemes are recognised in profit or loss as employee service costs accrue. For defined benefit pension schemes, the net of the recognisable scheme assets and obligations is reported in the balance sheet. The defined benefit obligation is measured on an actuarial basis. The charge to profit or loss for pension costs (mainly the service cost and the net interest on the net defined benefit asset or liability) is recognised in operating expenses. Actuarial gains and losses (i.e. gains and/or losses on re-measuring the net defined benefit asset or liability) are recognised in other comprehensive income in full in the period in which they arise. The difference between scheme assets and scheme liabilities, the net defined benefit asset or liability, is recognised in the balance sheet subject to the asset ceiling test which requires the net defined benefit surplus to be limited to the present value of any economic benefits available to the company in the form of refunds from the plan or reduced contributions to it. The charge to profit or loss for pension costs (mainly the service cost and the net interest on the net defined benefit asset or liability) is recognised in operating expenses.

Accounting policies
16 The Royal Bank of Scotland International (Holdings) Limited Annual Report and Accounts 2020
5. Property, plant and equipment
Items of property, plant and equipment are stated at cost less accumulated depreciation and impairment losses. Where an item of property, plant and equipment comprises major components having different useful lives, they are accounted for separately. Depreciation is charged to the income statement on a straight-line basis so as to write off the depreciable amount of property, plant and equipment (including assets owned and let on operating leases) over their estimated useful lives. The depreciable amount is the cost of an asset less its residual value. Freehold land is not depreciated. The estimated useful lives are as follows: Freehold and long-leasehold buildings 50 years Short leaseholds unexpired period of the
lease Computer equipment up to 5 years Property adaptation costs 10 years Other equipment 5 to 15 years The residual value and useful life of property, plant and equipment are reviewed at each balance sheet date and updated for any changes to previous estimates.
6. Intangible assets and goodwill
Intangible assets acquired by the Company are stated at cost less accumulated amortisation and impairment losses. Amortisation is charged to profit or loss over the assets' estimated useful economic lives using methods that best reflect the pattern of economic benefits and is included in depreciation and amortisation. These estimated useful economic lives are: Computer software 3 to 12 years Other acquired intangibles 5 to 10 years Expenditure on internally generated goodwill and brands is written-off as incurred. Direct costs relating to the development of internal-use computer software are capitalised once technical feasibility and economic viability have been established. These costs include payroll, the costs of materials and services, and directly attributable overheads. Capitalisation of costs ceases when the software is capable of operating as intended. During and after development, accumulated costs are reviewed for impairment against the benefits that the software is expected to generate. Costs incurred prior to the establishment of technical feasibility and economic viability are expensed as incurred as are all training costs and general overheads. The costs of licences to use computer software that are expected to generate economic benefits beyond one year are also capitalised. Goodwill on the acquisition of a subsidiary is the excess of the fair value of the consideration transferred, the fair value of any existing interest in the subsidiary and the amount of any non-controlling interest measured either at fair value or at its share of the subsidiary’s net assets over the net fair value of the subsidiary’s identifiable assets, liabilities and contingent liabilities. Goodwill is measured at initial cost less any subsequent impairment losses. The gain or loss on the disposal of a subsidiary includes the carrying value of any related goodwill. 7. Impairment of non-financial assets At each balance sheet date, the Company assesses whether there is any indication that its intangible assets, right of use assets or property, plant and equipment are impaired. If any such indication exists, the Company estimates the recoverable amount of the asset and the impairment loss if any. Goodwill is tested for impairment annually or more frequently if events or changes in circumstances indicate that it might be impaired.
The recoverable amount of an asset that does not generate
cash flows that are independent from those of other assets or
groups of assets, is determined as part of the cash-generating
unit to which the asset belongs. A cash-generating unit is the
smallest identifiable group of assets that generates cash
inflows that are largely independent of the cash inflows from
other assets or groups of assets. For the purposes of
impairment testing, goodwill acquired in a business
combination is allocated to each of the Company’s cash-
generating units or groups of cash-generating units expected
to benefit from the combination. The recoverable amount of an
asset or cash-generating unit is the higher of its fair value less
cost to sell or its value in use. Value in use is the present value
of future cash flows from the asset or cash-generating unit
discounted at a rate that reflects market interest rates adjusted
for risks specific to the asset or cash-generating unit that have
not been taken into account in estimating future cash flows.
An impairment loss is recognised if the recoverable amount of
an intangible or tangible asset is less than its carrying value.
The carrying value of the asset is reduced by the amount of
the loss and a charge recognised in profit or loss. A reversal of
an impairment loss on intangible assets (excluding goodwill) or
property, plant and equipment can be recognised when an
increase in service potential arises provided the increased
carrying value is not greater than it would have been had no
impairment loss been recognised. Impairment losses on
goodwill are not reversed.
8. Foreign currencies Transactions in foreign currencies are recorded in the functional currency at the foreign exchange rate ruling at the date of the transaction. Monetary assets and liabilities denominated in foreign currencies are translated into the relevant functional currency at the foreign exchange rates ruling at the balance sheet date. Foreign exchange differences arising on the settlement of foreign currency transactions and from the translation of monetary assets and liabilities are reported in income from trading activities except for differences arising on cash flow hedges (see Accounting policy 18). Non-monetary items denominated in foreign currencies that are stated at fair value are translated into the relevant functional currency at the foreign exchange rates ruling at the dates the values are determined. Translation differences arising on non-monetary items measured at fair value are recognised in profit or loss except for differences arising on nonmonetary financial assets classified as fair value through OCI, for example equity shares, which are recognised in other comprehensive income unless the asset is the hedged item in a fair value hedge. Assets and liabilities of foreign operations, including goodwill and fair value adjustments arising on acquisition, are translated into Sterling at foreign exchange rates ruling at the balance sheet date. Income and expenses of foreign operations are translated into Sterling at average exchange rates unless these do not approximate to the foreign exchange rates ruling at the dates of the transactions. Foreign exchange differences arising on translation of foreign operations are recognised in other comprehensive income. The amount accumulated in equity is reclassified from equity to profit or loss on disposal of a foreign operation. 9. Leases As lessor Finance lease contracts are those which transfer substantially all the risks and rewards of ownership of an asset to a customer. All other contracts with customers to lease assets are classified as operating leases.
Accounting policies
17 The Royal Bank of Scotland International (Holdings) Limited Annual Report and Accounts 2020
Loans to customers include finance lease receivables measured at the net investment in the lease, comprising the minimum lease payments and any unguaranteed residual value discounted at the interest rate implicit in the lease. Interest receivable includes finance lease income recognised at a constant periodic rate of return before tax on the net investment. Unguaranteed residual values are subject to regular review; if there is a reduction in their value, income allocation is revised and any reduction in respect of amounts accrued is recognised immediately. Rental income from operating leases is recognised in other operating income on a straight-line basis over the lease term unless another systematic basis better represents the time pattern of the asset’s use. Operating lease assets are included within Property, plant and equipment and depreciated over their useful lives. As lessee On entering into a new lease contract, the Company recognises a right of use asset and a lease liability to pay future rentals. The liability is measured at the present value of future lease payments discounted at the applicable incremental borrowing rate. The right of use asset is depreciated over the shorter of the term of the lease and the useful economic life, subject to review for impairment. Short term and low value leased assets are expensed on a systematic basis. 10. Provisions and contingent liabilities The Company recognises a provision for a present obligation resulting from a past event when it is more likely than not that it will be required to transfer economic benefits to settle the obligation and the amount of the obligation can be estimated reliably. Provision is made for restructuring costs, including the costs of redundancy, when the Company has a constructive obligation to restructure. An obligation exists when the Company has a detailed formal plan for the restructuring and has raised a valid expectation in those affected by starting to implement the plan or by announcing its main features. The Company recognises any onerous cost of the present obligation under a contract as a provision. An onerous cost is the unavoidable cost of meeting the Company’s contractual obligations that exceed the expected economic benefits. When the Company vacates a leasehold property, the right of use asset would be tested for impairment and a provision may be recognised for the ancillary occupancy costs, such as rates. Contingent liabilities are possible obligations arising from past events, whose existence will be confirmed only by uncertain future events, or present obligations arising from past events that are not recognised because either an outflow of economic benefits is not probable or the amount of the obligation cannot be reliably measured. Contingent liabilities are not recognised if not probable but information about them is disclosed unless the possibility of any outflow of economic benefits in settlement is remote. 11. Tax Income tax expense or income, comprising current tax and deferred tax, is recorded in the income statement except income tax on items recognised outside profit or loss which is credited or charged to other comprehensive income or to equity as appropriate. The tax consequences of servicing equity instruments are recognised in income statement. Current tax is income tax payable or recoverable in respect of the taxable profit or loss for the year arising in profit or loss, other comprehensive income or equity. Provision is made for current tax at rates enacted or substantively enacted at the balance sheet date.
Deferred tax is the tax expected to be payable or recoverable in respect of temporary differences between the carrying amount of an asset or liability for accounting purposes and its carrying amount for tax purposes. Deferred tax liabilities are generally recognised for all taxable temporary differences and deferred tax assets are recognised to the extent their recovery is probable. Deferred tax is not recognised on temporary differences that arise from initial recognition of an asset or a liability in a transaction (other than a business combination) that at the time of the transaction affects neither accounting nor taxable profit or loss. Deferred tax is calculated using tax rates expected to apply in the periods when the assets will be realised or the liabilities settled, based on tax rates and laws enacted, or substantively enacted, at the balance sheet date. Deferred tax assets and liabilities are offset where the Company has a legally enforceable right to offset and where they relate to income taxes levied by the same taxation authority either on an individual Group company or on Group companies in the same tax group that intend, in future periods, to settle current tax liabilities and assets on a net basis or on a gross basis simultaneously. Accounting for taxes is judgmental and carries a degree of uncertainty because tax law is subject to interpretation, which might be questioned by the relevant tax authority. The Company recognises the most likely current and deferred tax liability or asset, assessed for uncertainty using consistent judgments and estimates. Current and deferred tax assets are only recognised where their recovery is deemed probable and current and deferred tax liabilities are recognised at the amount that represents the best estimate of the probable outcome having regard to their acceptance by the tax authorities.
12. Financial instruments
Financial instruments are classified either by product, by business model or by reference to the IFRS default classification. Classification by product relies on specific designation criteria which are applicable to certain classes of financial assets or circumstances where accounting mismatches would otherwise arise. Classification by business model reflects how the Company manages its financial assets to generate cash flows. A business model assessment determines if cash flows result from holding financial assets to collect the contractual cash flows; from selling those financial assets; or both. The product classifications apply to financial assets that are either designated at fair value through profit or loss (DFV), or to equity investments designated as at fair value through other comprehensive income (FVOCI). Financial assets may also be irrevocably designated at fair value through profit or loss upon initial recognition if such designation eliminates, or significantly reduces, accounting mismatch. In all other instances, fair value through profit or loss (MFVTPL) is the default classification and measurement category for financial assets. Regular way purchases of financial assets classified as amortised cost, are recognised on the settlement date; all other regular way transactions in financial assets are recognised on the trade date. Business model assessment of assets is made at portfolio level, being the level at which they are managed to achieve a predefined business objective. This is expected to result in the most consistent classification of assets because it aligns with the stated objectives of the portfolio, its risk management, manager’s remuneration and the ability to monitor sales of assets from a portfolio.
Accounting policies
18 The Royal Bank of Scotland International (Holdings) Limited Annual Report and Accounts 2020
Most financial assets are within ‘held to collect’ business models, and have the contractual cash flows that comprise solely payments of principal and interest and therefore measured at amortised cost. Certain financial assets are managed under a business model of both ‘held to collect and sell’ and have contractual cash flows comprising solely of payments of principal and interest are measured at fair value through other comprehensive income (‘FVOCI’). A debt instrument is normally measured at FVOCI if both of the following conditions are met:
The instrument is held within a business model whose
objective is both to hold assets to collect contractual cash
flows and selling financial assets; and
The contractual terms of the financial asset are solely
payments of principle and interest on the outstanding
balance.
A debt instrument that is not measured at amortised cost or at FVOCI must be measured at FVPL. The contractual terms of a facility, any leverage features, prepayment and extension terms, and triggers that might reset the effective rate of interest, are considered in determining whether cash flows comprise solely payments of principal and interest. All financial instruments are measured at fair value on initial recognition. All liabilities not subsequently measured at fair value are measured at amortised cost. 13. Impairment: expected credit losses (ECL)
At each balance sheet date each financial asset or portfolio of loans measured at amortised cost or at fair value through other comprehensive income, issued financial guarantee and loan commitment is assessed for impairment and presented as impairments in the income statement. Loss allowances are forward looking, based on 12 month expected credit losses where there has not been a significant increase in credit risk (SICR) rating (refer Note 18 for details), otherwise allowances are based on lifetime expected losses. Expected credit losses are a probability-weighted estimate of credit losses. The probability is determined by the risk of default which is applied to the cash flow estimates. In the absence of a change in credit rating, allowances are recognised when there is reduction in the net present value of expected cash flows. On a significant increase in credit risk, allowances are recognised without a change in the expected cash flows, although typically expected cash flows do change also; and expected credit losses are adjusted from 12 month to lifetime expectations. Judgement is exercised as follows:
Models – in certain low default portfolios, Basel parameter estimates are also applied for IFRS 9.
Non-modelled portfolios, RBSI Retail remains Basel standardised for Risk Weighted Assets, therefore modelled Probability of Default (PDs) and Loss Given Default (LGDs) are not available for calculating stage 1 and stage 2 ECLs. Instead this is undertaken by sourcing the equivalent product PD & LGD from within NatWest UK, which was identified as the closest comparable portfolio to RBSI Retail. The PD and LGD benchmarks are then used, along with the known exposure, to calculate an account level ECL.
Multiple economic scenarios (MES) – the central, or base, scenario is most critical to the ECL calculation, independent of the method used to generate a range of alternative outcomes and their probabilities.
Significant increase in credit risk - IFRS 9 requires that at each reporting date, an entity shall assess whether the credit risk on an account has increased significantly since initial recognition. Part of this assessment requires a comparison to be made between the current lifetime PD (i.e. the current probability of default over the remaining lifetime) with the equivalent lifetime PD as determined at the date of initial recognition.
On restructuring a financial asset without causing derecognition of the original asset the revised cash flows are used in re-estimating the credit loss. Where restructuring causes derecognition of the original financial asset, the fair value of the replacement asset is used as the closing cash flow of the original asset. Impaired loans are written off and therefore derecognised from the balance sheet when the Company concludes that there is no longer any realistic prospect of recovery of part, or all, of the loan. For loans that are individually assessed for impairment, the timing of the write off is determined on a case by case basis. Such loans are reviewed regularly and write off will be prompted by bankruptcy, insolvency, renegotiation and similar events. The typical time frames from initial impairment to write off for Company’s collectively-assessed portfolios are:
Retail mortgages: write off usually occurs within five years, or when an account is closed if earlier.
Overdrafts and other unsecured loans: write off occurs within six years
Commercial loans: write offs are determined in the light of individual circumstances; the period does not typically exceed five years.
Business loans are generally written off within five years. 14. Derecognition A financial asset is derecognised when the contractual right to receive cash flows from the asset has expired or when it has been transferred and the transfer qualifies for derecognition. Conversely, an asset is not derecognised by a contract under which the Company retains substantially all the risks and rewards of ownership. If substantially all the risks and rewards have been neither retained nor transferred, the Company does not derecognise an asset over which it has retained control but limits its recognition to the extent of its continuing involvement. A financial liability is removed from the balance sheet when the obligation is discharged, or cancelled, or expires. 15. Sale and repurchase transactions
Securities subject to sale and repurchase agreement under which substantially all the risks and rewards of ownership are retained by the Group continue to be shown on the balance sheet and the sale proceeds recorded as a financial liability. Securities acquired in a reverse sale and repurchase transaction under which the Group is not exposed to substantially all the risks and rewards of ownership are not recognised on the balance sheet and the consideration paid is recorded as a financial asset. Where Collateral supporting the transaction is received in the form of cash, deposit is recorded. Sale and repurchase transactions that are not accounted for at fair value through profit or loss are measured at amortised cost. The difference between the consideration paid or received and the repurchase or resale price is treated as interest and recognised in interest income or interest expense over the life of the transaction. 16. Netting Financial assets and financial liabilities are offset and the net amounts presented in the balance sheet when, and only when, the Group has a legally enforceable right to set off the recognised amounts and it intends either to settle on a net
Accounting policies
19 The Royal Bank of Scotland International (Holdings) Limited Annual Report and Accounts 2020
basis, or to realise the asset and settle the liability simultaneously. The Group is party to a number of arrangements, including master netting agreements, that give it the right to offset financial assets and financial liabilities but where it does not intend to settle the amounts net or simultaneously the assets and liabilities concerned are presented gross. 17. Capital instruments
The Group classifies a financial instrument that it issues as a liability if it is a contractual obligation to deliver cash or another financial asset, or to exchange financial assets or financial liabilities on potentially unfavourable terms and as equity if it evidences a residual interest in the assets of the Group after the deduction of liabilities. 18. Derivatives and hedging Derivative financial instruments are initially recognised, and subsequently measured, at fair value. The Group’s approach to determining the fair value of financial instruments is set out in the Critical accounting policies and key sources of estimation uncertainty entitled Fair value - financial instruments; further details are given in Note 7 on the accounts. A derivative embedded in a financial liability contract is accounted for as a stand-alone derivative if its economic characteristics are not closely related to the economic characteristics of the host contract; unless the entire contract is measured at fair value with changes in fair value recognised in profit or loss. Gains and losses arising from changes in the fair value of derivatives that are not the hedging instrument in a qualifying hedge are recognised as they arise in profit or loss. Gains and losses are recorded in Income from trading activities except for gains and losses on those derivatives that are managed together with financial instruments designated at fair value; these gains and losses are included in Other operating income. The Group enters into three types of hedge relationship: hedges of changes in the fair value of a recognised asset or liability or unrecognised firm commitment (fair value hedges); hedges of the variability in cash flows from a recognised asset or liability or a highly probable forecast transaction (cash flow hedges) and hedges of the net investment in a foreign operation (net investment hedges). Hedge relationships are formally designated and documented at inception in line with the requirements of IAS 39 Financial instruments – Recognition and measurement. The documentation identifies the hedged item, the hedging instrument and details the risk that is being hedged and the way in which effectiveness will be assessed at inception and during the period of the hedge. If the hedge is not highly effective in offsetting changes in fair values or cash flows attributable to the hedged risk, consistent with the documented risk management strategy, hedge accounting is discontinued. Hedge accounting is also discontinued if NatWest Group revokes the designation of a hedge relationship. Fair value hedge - in a fair value hedge, the gain or loss on the hedging instrument is recognised in profit or loss. The gain or loss on the hedged item attributable to the hedged risk is recognised in profit or loss and, where the hedged item is measured at amortised cost, adjusts the carrying amount of the hedged item. Hedge accounting is discontinued if the hedge no longer meets the criteria for hedge accounting; or if the hedging instrument expires or is sold, terminated or exercised; or if hedge designation is revoked. If the hedged item is one for which the effective interest rate method is used, any cumulative adjustment is amortised to profit or loss over the life of the hedged item using a recalculated effective interest rate.
Cash flow hedge - in a cash flow hedge, the effective portion of the gain or loss on the hedging instrument is recognised in other comprehensive income and the ineffective portion in profit or loss. When the forecast transaction results in the recognition of a financial asset or financial liability, the cumulative gain or loss is reclassified from equity to profit or loss in the same periods in which the hedged forecast cash flows affect profit or loss. Otherwise the cumulative gain or loss is removed from equity and recognised in profit or loss at the same time as the hedged transaction. Hedge accounting is discontinued if the hedge no longer meets the criteria for hedge accounting; if the hedging instrument expires or is sold, terminated or exercised; if the forecast transaction is no longer expected to occur; or if hedge designation is revoked. On the discontinuation of hedge accounting (except where a forecast transaction is no longer expected to occur), the cumulative unrealised gain or loss is reclassified from equity to profit or loss when the hedged cash flows occur or, if the forecast transaction results in the recognition of a financial asset or financial liability, when the hedged forecast cash flows affect profit or loss. Where a forecast transaction is no longer expected to occur, the cumulative unrealised gain or loss is reclassified from equity to profit or loss immediately. Hedge of net investment in a foreign operation - in the hedge of a net investment in a foreign operation, the portion of foreign exchange differences arising on the hedging instrument determined to be an effective hedge is recognised in other comprehensive income. Any ineffective portion is recognised in profit or loss. Non-derivative financial liabilities as well as derivatives may be the hedging instrument in a net investment hedge. On disposal or partial disposal of a foreign operation, the amount accumulated in equity is reclassified from equity to profit or loss. 19. Cash and cash equivalents In the cash flow statement, cash and cash equivalents comprises cash and deposits with banks with an original maturity of less than three months together with short-term highly liquid investments that are readily convertible to known amounts of cash and subject to insignificant risk of change in value. 20. Assets under administration Assets and liabilities held in a fiduciary capacity are not included in these financial statements.
Accounting policies
20 The Royal Bank of Scotland International (Holdings) Limited Annual Report and Accounts 2020
Critical accounting policies and key sources of estimation uncertainty The reported results of the Company are sensitive to the accounting policies, assumptions and estimates that underlie the preparation of its accounts. IFRS require the directors, in preparing the Company’s financial statements, to select suitable accounting policies, apply them consistently and make judgements and estimates that are reasonable and prudent. In the absence of an applicable standard or interpretation, IAS 8 ‘Accounting Policies, Changes in Accounting Estimates and Errors’ requires management to develop and apply an accounting policy that results in relevant and reliable information in the light of the requirements and guidance in IFRS dealing with similar and related issues and the IASB’s ‘Conceptual Framework for Financial Reporting’.
The judgements and assumptions involved in the Company’s accounting policies that are considered by the Board to be the most important to the portrayal of its financial condition are discussed below. The use of estimates, assumptions or models that differ from those adopted by the Company would affect its reported results.
During 2020, estimation uncertainty has been affected by the COVID-19 pandemic. Consideration of this source of estimation uncertainty has been set out in the notes below:
Critical accounting policy Note Amortisation of fees 1 Pensions 4 Fair value - financial instruments 7 Loan impairment provisions 8 Provisions for liabilities and charges 15
Future Accounting developments
International Financial Reporting Standards
COVID-19 amendments on lease modifications –
Amendments to IFRS 16 –Leases (IFRS 16)
The IASB published 'amendments to IFRS 16 covering COVID-19-Related Rent Concessions’. These provide lessees with an exemption from assessing whether a COVID-19 related rent concession is a lease modification. The amendment is effective for annual reporting periods beginning on or after 1 June 2020. The effect of the amendment on the Company’s accounts is immaterial and will be adopted from 1 January 2021. Other new standards and amendments that are effective for annual periods beginning after 1 January 2022, with earlier application permitted, are set out below. Effective 1 January 2022
Onerous Contracts – Cost of Fulfilling a Contract
(Amendments to IAS 37).
Property, Plant and Equipment: Proceeds before
Intended Use (Amendments to IAS 16).
Reference to Conceptual Framework (Amendments
to IFRS 3).
Classification of Liabilities as Current or Non-current
(Amendments to IAS 1).
Fees in the “10 per cent” test for Derecognition of
Financial Liabilities (Amendments to IFRS 9).
Effective 1 January 2023
IFRS 17 Insurance Contracts (Amendments to IFRS
17 Insurance Contracts).
The Company is assessing the effect of adopting these standards and amendments on its financial statements but does not expect the effect to be material.
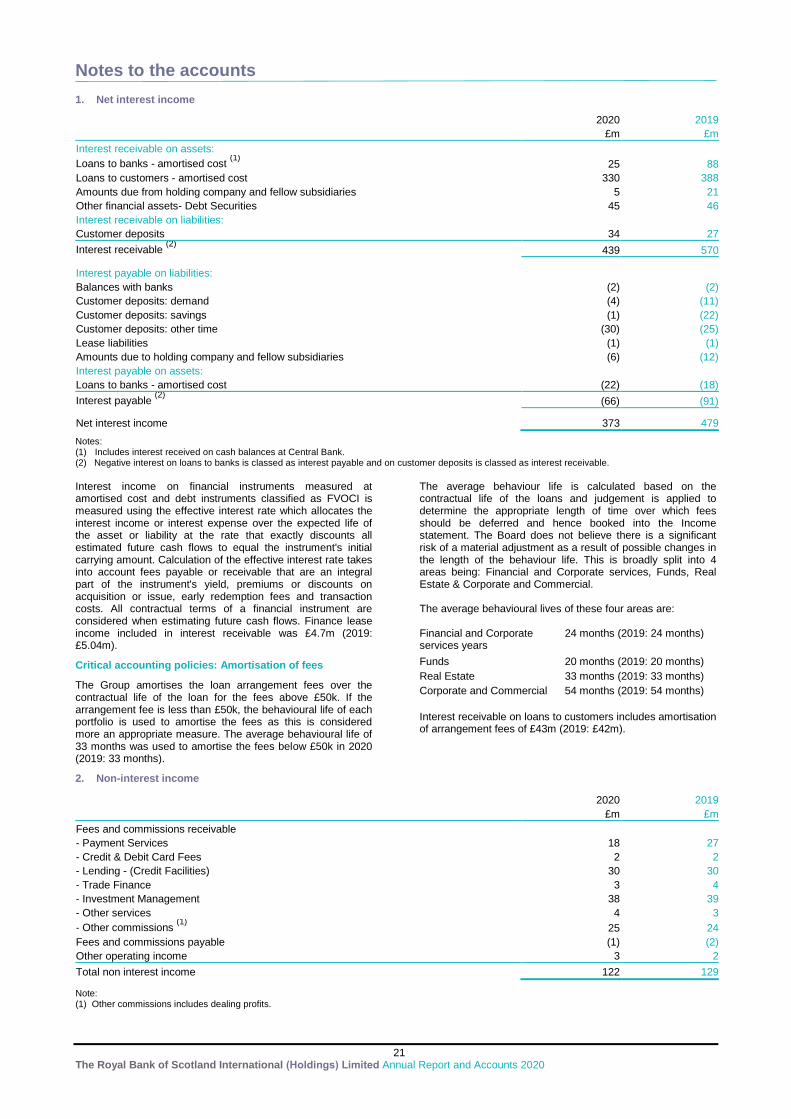
Notes to the accounts
21 The Royal Bank of Scotland International (Holdings) Limited Annual Report and Accounts 2020
1. Net interest income
2020 2019
£m £m
Interest receivable on assets: Loans to banks - amortised cost
(1) 25 88
Loans to customers - amortised cost 330 388
Amounts due from holding company and fellow subsidiaries 5 21
Other financial assets- Debt Securities 45 46
Interest receivable on liabilities: Customer deposits 34 27
Interest receivable (2)
439 570
Interest payable on liabilities: Balances with banks (2) (2)
Customer deposits: demand (4) (11)
Customer deposits: savings (1) (22)
Customer deposits: other time (30) (25)
Lease liabilities (1) (1)
Amounts due to holding company and fellow subsidiaries (6) (12)
Interest payable on assets:
Loans to banks - amortised cost (22) (18)
Interest payable (2)
(66) (91)
Net interest income 373 479
Notes: (1) Includes interest received on cash balances at Central Bank. (2) Negative interest on loans to banks is classed as interest payable and on customer deposits is classed as interest receivable.
Interest income on financial instruments measured at amortised cost and debt instruments classified as FVOCI is measured using the effective interest rate which allocates the interest income or interest expense over the expected life of the asset or liability at the rate that exactly discounts all estimated future cash flows to equal the instrument's initial carrying amount. Calculation of the effective interest rate takes into account fees payable or receivable that are an integral part of the instrument's yield, premiums or discounts on acquisition or issue, early redemption fees and transaction costs. All contractual terms of a financial instrument are considered when estimating future cash flows. Finance lease income included in interest receivable was £4.7m (2019: £5.04m).
Critical accounting policies: Amortisation of fees
The Group amortises the loan arrangement fees over the contractual life of the loan for the fees above £50k. If the arrangement fee is less than £50k, the behavioural life of each portfolio is used to amortise the fees as this is considered more an appropriate measure. The average behavioural life of 33 months was used to amortise the fees below £50k in 2020 (2019: 33 months).
The average behaviour life is calculated based on the contractual life of the loans and judgement is applied to determine the appropriate length of time over which fees should be deferred and hence booked into the Income statement. The Board does not believe there is a significant risk of a material adjustment as a result of possible changes in the length of the behaviour life. This is broadly split into 4 areas being: Financial and Corporate services, Funds, Real Estate & Corporate and Commercial. The average behavioural lives of these four areas are: Financial and Corporate services years
24 months (2019: 24 months)
Funds 20 months (2019: 20 months)
Real Estate 33 months (2019: 33 months)
Corporate and Commercial 54 months (2019: 54 months)
Interest receivable on loans to customers includes amortisation of arrangement fees of £43m (2019: £42m).
2. Non-interest income
2020 2019
£m £m
Fees and commissions receivable - Payment Services 18 27
- Credit & Debit Card Fees 2 2
- Lending - (Credit Facilities) 30 30
- Trade Finance 3 4
- Investment Management 38 39
- Other services 4 3
- Other commissions (1)
25 24
Fees and commissions payable (1) (2)
Other operating income 3 2
Total non interest income 122 129
Note: (1) Other commissions includes dealing profits.
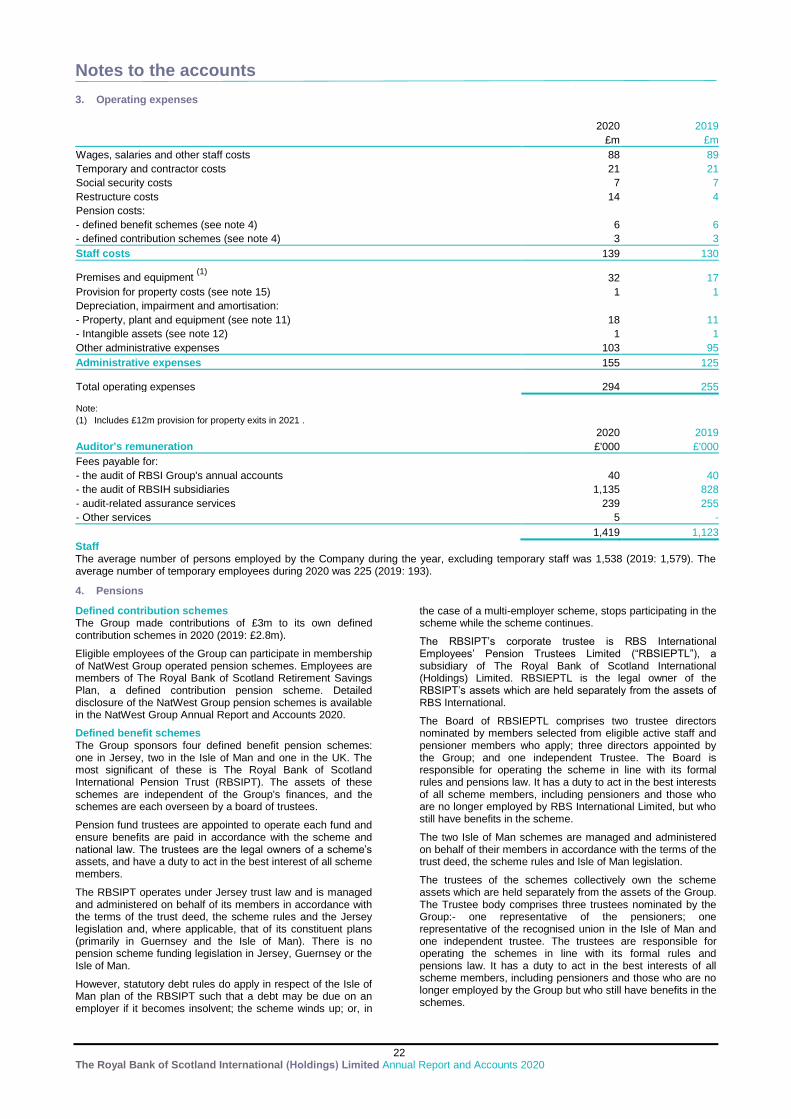
Notes to the accounts
22 The Royal Bank of Scotland International (Holdings) Limited Annual Report and Accounts 2020
3. Operating expenses
2020 2019
£m £m
Wages, salaries and other staff costs 88 89
Temporary and contractor costs 21 21
Social security costs 7 7
Restructure costs 14 4
Pension costs: - defined benefit schemes (see note 4) 6 6
- defined contribution schemes (see note 4) 3 3
Staff costs 139 130
Premises and equipment (1)
32 17
Provision for property costs (see note 15) 1 1
Depreciation, impairment and amortisation: - Property, plant and equipment (see note 11) 18 11
- Intangible assets (see note 12) 1 1
Other administrative expenses 103 95
Administrative expenses 155 125
Total operating expenses 294 255
Note:
(1) Includes £12m provision for property exits in 2021 .
2020 2019
Auditor's remuneration £'000 £'000
Fees payable for: - the audit of RBSI Group's annual accounts 40 40
- the audit of RBSIH subsidiaries 1,135 828
- audit-related assurance services 239 255
- Other services 5 -
1,419 1,123
Staff The average number of persons employed by the Company during the year, excluding temporary staff was 1,538 (2019: 1,579). The average number of temporary employees during 2020 was 225 (2019: 193).
4. Pensions
Defined contribution schemes The Group made contributions of £3m to its own defined contribution schemes in 2020 (2019: £2.8m).
Eligible employees of the Group can participate in membership of NatWest Group operated pension schemes. Employees are members of The Royal Bank of Scotland Retirement Savings Plan, a defined contribution pension scheme. Detailed disclosure of the NatWest Group pension schemes is available in the NatWest Group Annual Report and Accounts 2020.
Defined benefit schemes The Group sponsors four defined benefit pension schemes: one in Jersey, two in the Isle of Man and one in the UK. The most significant of these is The Royal Bank of Scotland International Pension Trust (RBSIPT). The assets of these schemes are independent of the Group's finances, and the schemes are each overseen by a board of trustees.
Pension fund trustees are appointed to operate each fund and ensure benefits are paid in accordance with the scheme and national law. The trustees are the legal owners of a scheme’s assets, and have a duty to act in the best interest of all scheme members.
The RBSIPT operates under Jersey trust law and is managed and administered on behalf of its members in accordance with the terms of the trust deed, the scheme rules and the Jersey legislation and, where applicable, that of its constituent plans (primarily in Guernsey and the Isle of Man). There is no pension scheme funding legislation in Jersey, Guernsey or the Isle of Man.
However, statutory debt rules do apply in respect of the Isle of Man plan of the RBSIPT such that a debt may be due on an employer if it becomes insolvent; the scheme winds up; or, in
the case of a multi-employer scheme, stops participating in the scheme while the scheme continues.
The RBSIPT’s corporate trustee is RBS International Employees’ Pension Trustees Limited (“RBSIEPTL”), a subsidiary of The Royal Bank of Scotland International (Holdings) Limited. RBSIEPTL is the legal owner of the RBSIPT’s assets which are held separately from the assets of RBS International.
The Board of RBSIEPTL comprises two trustee directors nominated by members selected from eligible active staff and pensioner members who apply; three directors appointed by the Group; and one independent Trustee. The Board is responsible for operating the scheme in line with its formal rules and pensions law. It has a duty to act in the best interests of all scheme members, including pensioners and those who are no longer employed by RBS International Limited, but who still have benefits in the scheme.
The two Isle of Man schemes are managed and administered on behalf of their members in accordance with the terms of the trust deed, the scheme rules and Isle of Man legislation.
The trustees of the schemes collectively own the scheme assets which are held separately from the assets of the Group. The Trustee body comprises three trustees nominated by the Group:- one representative of the pensioners; one representative of the recognised union in the Isle of Man and one independent trustee. The trustees are responsible for operating the schemes in line with its formal rules and pensions law. It has a duty to act in the best interests of all scheme members, including pensioners and those who are no longer employed by the Group but who still have benefits in the schemes.
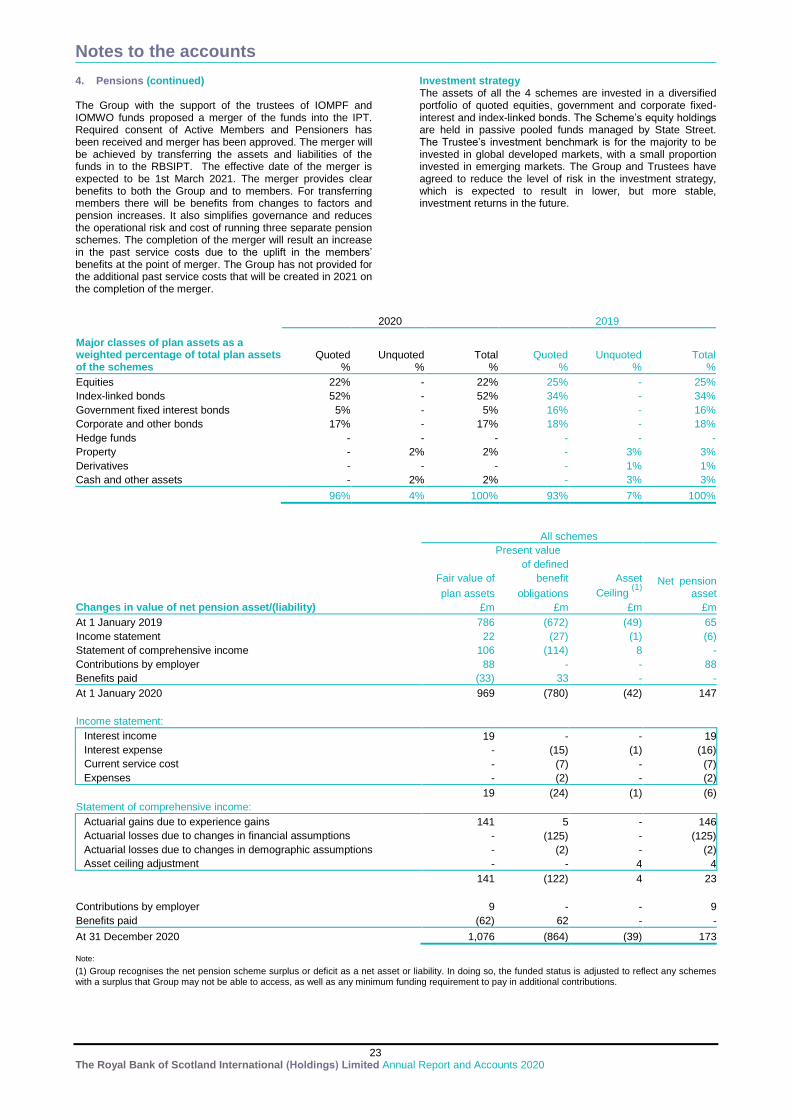
Notes to the accounts
23 The Royal Bank of Scotland International (Holdings) Limited Annual Report and Accounts 2020
4. Pensions (continued) The Group with the support of the trustees of IOMPF and IOMWO funds proposed a merger of the funds into the IPT. Required consent of Active Members and Pensioners has been received and merger has been approved. The merger will be achieved by transferring the assets and liabilities of the funds in to the RBSIPT. The effective date of the merger is expected to be 1st March 2021. The merger provides clear benefits to both the Group and to members. For transferring members there will be benefits from changes to factors and pension increases. It also simplifies governance and reduces the operational risk and cost of running three separate pension schemes. The completion of the merger will result an increase in the past service costs due to the uplift in the members’ benefits at the point of merger. The Group has not provided for the additional past service costs that will be created in 2021 on the completion of the merger.
Investment strategy The assets of all the 4 schemes are invested in a diversified portfolio of quoted equities, government and corporate fixed-interest and index-linked bonds. The Scheme’s equity holdings are held in passive pooled funds managed by State Street. The Trustee’s investment benchmark is for the majority to be invested in global developed markets, with a small proportion invested in emerging markets. The Group and Trustees have agreed to reduce the level of risk in the investment strategy, which is expected to result in lower, but more stable, investment returns in the future.
2020 2019
Major classes of plan assets as a weighted percentage of total plan assets of the schemes
Quoted %
Unquoted %
Total %
Quoted %
Unquoted %
Total %
Equities 22% - 22% 25% - 25%
Index-linked bonds 52% - 52% 34% - 34%
Government fixed interest bonds 5% - 5% 16% - 16%
Corporate and other bonds 17% - 17% 18% - 18%
Hedge funds - - - - - -
Property - 2% 2% - 3% 3%
Derivatives - - - - 1% 1%
Cash and other assets - 2% 2% - 3% 3%
96% 4% 100% 93% 7% 100%
All schemes
Present value
Net pension asset
of defined
Fair value of benefit Asset
plan assets obligations Ceiling (1)
Changes in value of net pension asset/(liability) £m £m £m £m
At 1 January 2019 786 (672) (49) 65
Income statement 22 (27) (1) (6)
Statement of comprehensive income 106 (114) 8 -
Contributions by employer 88 - - 88
Benefits paid (33) 33 - -
At 1 January 2020 969 (780) (42) 147
Income statement:
Interest income 19 - - 19
Interest expense - (15) (1) (16)
Current service cost - (7) - (7)
Expenses - (2) - (2)
19 (24) (1) (6)
Statement of comprehensive income:
Actuarial gains due to experience gains 141 5 - 146
Actuarial losses due to changes in financial assumptions - (125) - (125)
Actuarial losses due to changes in demographic assumptions - (2) - (2)
Asset ceiling adjustment - - 4 4
141 (122) 4 23
Contributions by employer 9 - - 9
Benefits paid (62) 62 - -
At 31 December 2020 1,076 (864) (39) 173 Note:
(1) Group recognises the net pension scheme surplus or deficit as a net asset or liability. In doing so, the funded status is adjusted to reflect any schemes with a surplus that Group may not be able to access, as well as any minimum funding requirement to pay in additional contributions.
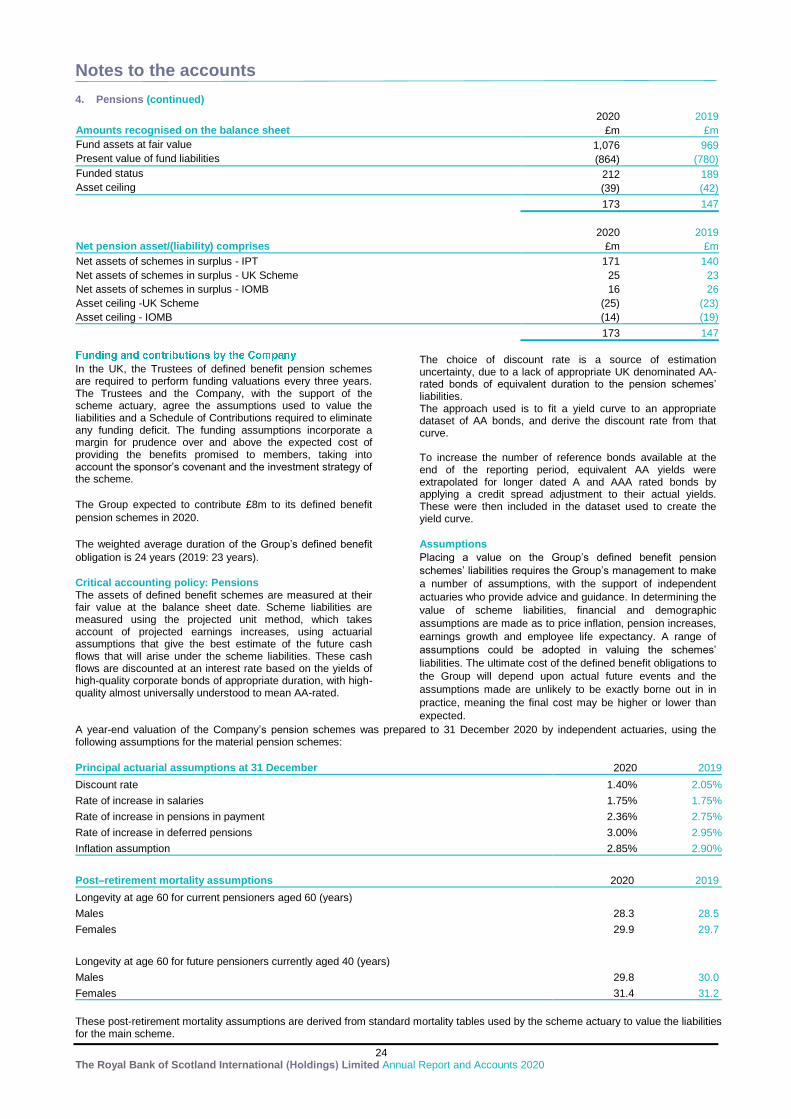
Notes to the accounts
24 The Royal Bank of Scotland International (Holdings) Limited Annual Report and Accounts 2020
4. Pensions (continued)
2020 2019
Amounts recognised on the balance sheet £m £m
Fund assets at fair value 1,076 969
Present value of fund liabilities (864) (780)
Funded status 212 189
Asset ceiling (39) (42)
173 147
2020 2019
Net pension asset/(liability) comprises £m £m
Net assets of schemes in surplus - IPT 171 140
Net assets of schemes in surplus - UK Scheme 25 23
Net assets of schemes in surplus - IOMB 16 26
Asset ceiling -UK Scheme (25) (23)
Asset ceiling - IOMB (14) (19)
173 147
In the UK, the Trustees of defined benefit pension schemes are required to perform funding valuations every three years. The Trustees and the Company, with the support of the scheme actuary, agree the assumptions used to value the liabilities and a Schedule of Contributions required to eliminate any funding deficit. The funding assumptions incorporate a margin for prudence over and above the expected cost of providing the benefits promised to members, taking into account the sponsor’s covenant and the investment strategy of the scheme.
The Group expected to contribute £8m to its defined benefit
pension schemes in 2020.
The weighted average duration of the Group’s defined benefit
obligation is 24 years (2019: 23 years).
Critical accounting policy: Pensions The assets of defined benefit schemes are measured at their fair value at the balance sheet date. Scheme liabilities are measured using the projected unit method, which takes account of projected earnings increases, using actuarial assumptions that give the best estimate of the future cash flows that will arise under the scheme liabilities. These cash flows are discounted at an interest rate based on the yields of high-quality corporate bonds of appropriate duration, with high-quality almost universally understood to mean AA-rated.
The choice of discount rate is a source of estimation uncertainty, due to a lack of appropriate UK denominated AA-rated bonds of equivalent duration to the pension schemes’ liabilities. The approach used is to fit a yield curve to an appropriate dataset of AA bonds, and derive the discount rate from that curve. To increase the number of reference bonds available at the end of the reporting period, equivalent AA yields were extrapolated for longer dated A and AAA rated bonds by applying a credit spread adjustment to their actual yields. These were then included in the dataset used to create the yield curve.
Assumptions
Placing a value on the Group’s defined benefit pension
schemes’ liabilities requires the Group’s management to make
a number of assumptions, with the support of independent
actuaries who provide advice and guidance. In determining the
value of scheme liabilities, financial and demographic
assumptions are made as to price inflation, pension increases,
earnings growth and employee life expectancy. A range of
assumptions could be adopted in valuing the schemes’
liabilities. The ultimate cost of the defined benefit obligations to
the Group will depend upon actual future events and the
assumptions made are unlikely to be exactly borne out in in
practice, meaning the final cost may be higher or lower than
expected.
A year-end valuation of the Company’s pension schemes was prepared to 31 December 2020 by independent actuaries, using the following assumptions for the material pension schemes:
Principal actuarial assumptions at 31 December 2020 2019
Discount rate 1.40% 2.05%
Rate of increase in salaries 1.75% 1.75%
Rate of increase in pensions in payment 2.36% 2.75%
Rate of increase in deferred pensions 3.00% 2.95%
Inflation assumption 2.85% 2.90%
Post–retirement mortality assumptions 2020 2019
Longevity at age 60 for current pensioners aged 60 (years)
Males 28.3 28.5
Females 29.9 29.7
Longevity at age 60 for future pensioners currently aged 40 (years)
Males 29.8 30.0
Females 31.4 31.2
These post-retirement mortality assumptions are derived from standard mortality tables used by the scheme actuary to value the liabilities for the main scheme.
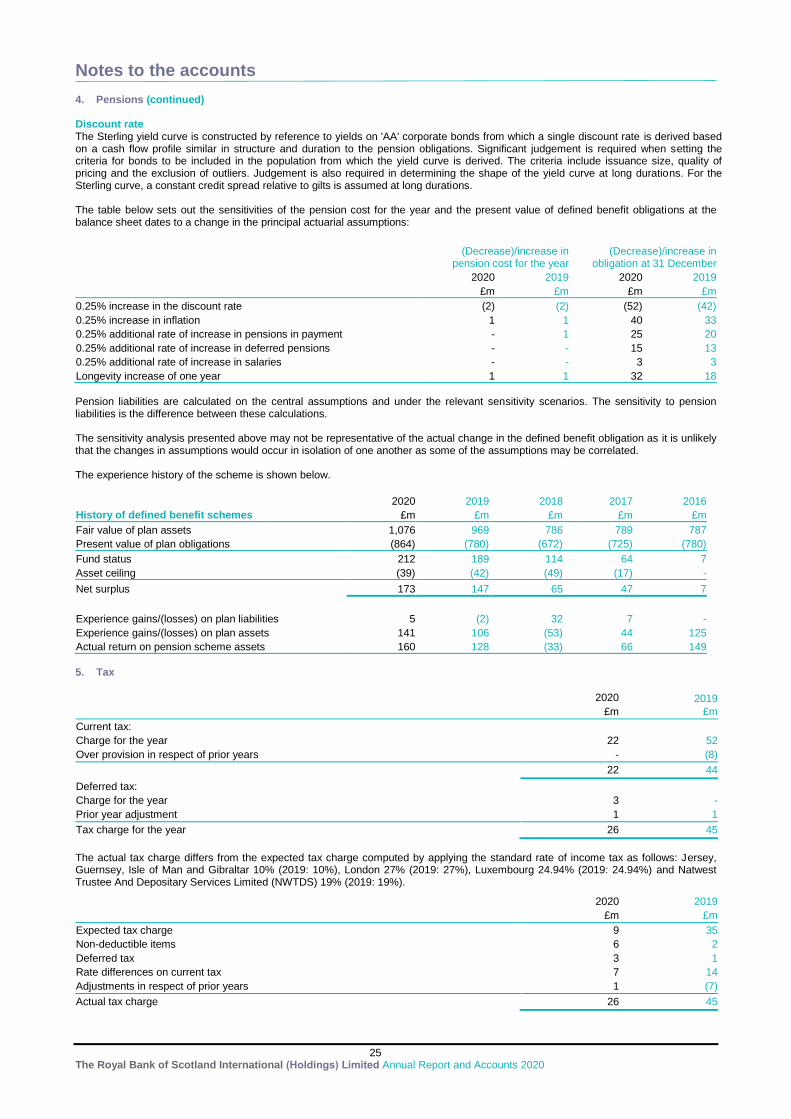
Notes to the accounts
25 The Royal Bank of Scotland International (Holdings) Limited Annual Report and Accounts 2020
4. Pensions (continued) Discount rate The Sterling yield curve is constructed by reference to yields on 'AA' corporate bonds from which a single discount rate is derived based on a cash flow profile similar in structure and duration to the pension obligations. Significant judgement is required when setting the criteria for bonds to be included in the population from which the yield curve is derived. The criteria include issuance size, quality of pricing and the exclusion of outliers. Judgement is also required in determining the shape of the yield curve at long durations. For the Sterling curve, a constant credit spread relative to gilts is assumed at long durations. The table below sets out the sensitivities of the pension cost for the year and the present value of defined benefit obligations at the balance sheet dates to a change in the principal actuarial assumptions:
(Decrease)/increase in
pension cost for the year (Decrease)/increase in
obligation at 31 December
2020 2019 2020 2019
£m £m £m £m
0.25% increase in the discount rate (2) (2) (52) (42)
0.25% increase in inflation 1 1 40 33
0.25% additional rate of increase in pensions in payment - 1 25 20
0.25% additional rate of increase in deferred pensions - - 15 13
0.25% additional rate of increase in salaries - - 3 3
Longevity increase of one year 1 1 32 18
Pension liabilities are calculated on the central assumptions and under the relevant sensitivity scenarios. The sensitivity to pension liabilities is the difference between these calculations. The sensitivity analysis presented above may not be representative of the actual change in the defined benefit obligation as it is unlikely that the changes in assumptions would occur in isolation of one another as some of the assumptions may be correlated. The experience history of the scheme is shown below.
2020 2019 2018 2017 2016
History of defined benefit schemes £m £m £m £m £m
Fair value of plan assets 1,076 969 786 789 787
Present value of plan obligations (864) (780) (672) (725) (780)
Fund status 212 189 114 64 7
Asset ceiling (39) (42) (49) (17) -
Net surplus 173 147 65 47 7
Experience gains/(losses) on plan liabilities 5 (2) 32 7 -
Experience gains/(losses) on plan assets 141 106 (53) 44 125
Actual return on pension scheme assets 160 128 (33) 66 149
5. Tax
2020 2019
£m £m
Current tax:
Charge for the year 22 52
Over provision in respect of prior years - (8)
22 44
Deferred tax:
Charge for the year 3 -
Prior year adjustment 1 1
Tax charge for the year 26 45
The actual tax charge differs from the expected tax charge computed by applying the standard rate of income tax as follows: Jersey, Guernsey, Isle of Man and Gibraltar 10% (2019: 10%), London 27% (2019: 27%), Luxembourg 24.94% (2019: 24.94%) and Natwest Trustee And Depositary Services Limited (NWTDS) 19% (2019: 19%).
2020 2019
£m £m
Expected tax charge 9 35
Non-deductible items 6 2
Deferred tax 3 1
Rate differences on current tax 7 14
Adjustments in respect of prior years 1 (7)
Actual tax charge 26 45
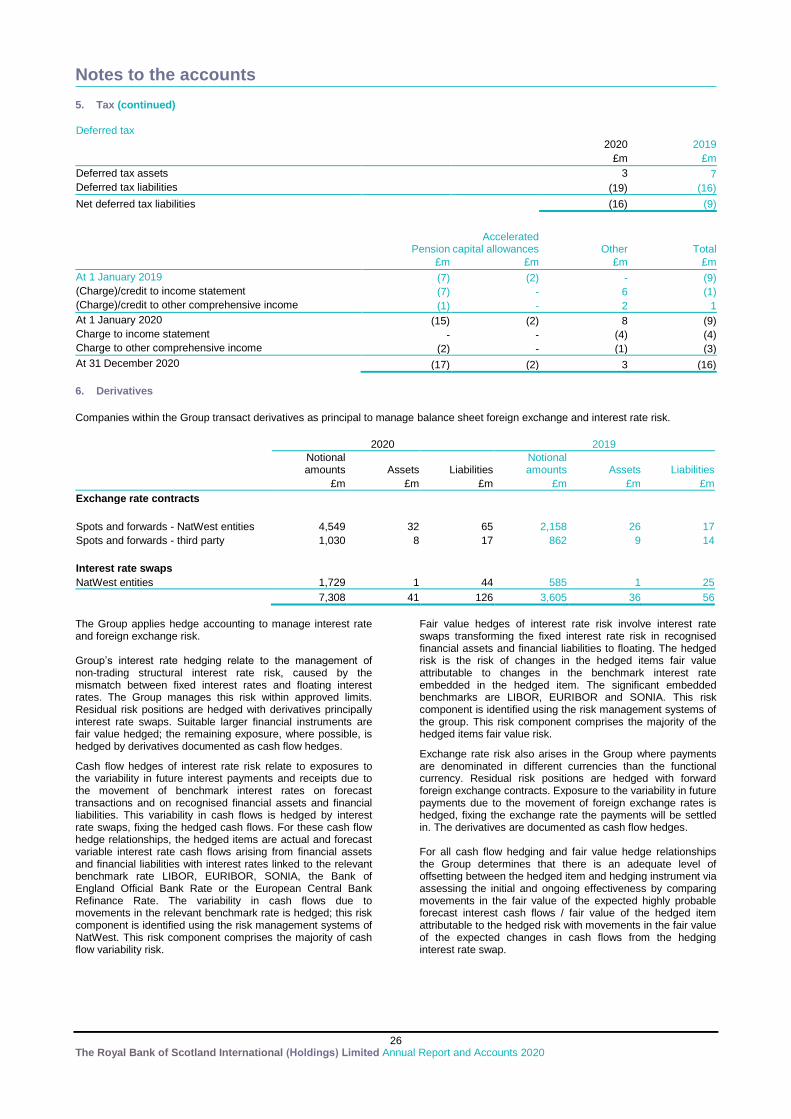
Notes to the accounts
26 The Royal Bank of Scotland International (Holdings) Limited Annual Report and Accounts 2020
5. Tax (continued)
Deferred tax
2020 2019
£m £m
Deferred tax assets
3 7
Deferred tax liabilities
(19) (16)
Net deferred tax liabilities
(16) (9)
Pension
Accelerated capital allowances Other Total
£m £m £m £m
At 1 January 2019 (7) (2) - (9)
(Charge)/credit to income statement (7) - 6 (1)
(Charge)/credit to other comprehensive income (1) - 2 1
At 1 January 2020 (15) (2) 8 (9)
Charge to income statement - - (4) (4)
Charge to other comprehensive income (2) - (1) (3)
At 31 December 2020 (17) (2) 3 (16)
6. Derivatives
Companies within the Group transact derivatives as principal to manage balance sheet foreign exchange and interest rate risk.
2020 2019
Notional amounts Assets Liabilities
Notional amounts Assets Liabilities
£m £m £m £m £m £m
Exchange rate contracts
Spots and forwards - NatWest entities 4,549 32 65 2,158 26 17
Spots and forwards - third party 1,030 8 17 862 9 14
Interest rate swaps NatWest entities 1,729 1 44 585 1 25
7,308 41 126 3,605 36 56
The Group applies hedge accounting to manage interest rate and foreign exchange risk. Group’s interest rate hedging relate to the management of non-trading structural interest rate risk, caused by the mismatch between fixed interest rates and floating interest rates. The Group manages this risk within approved limits. Residual risk positions are hedged with derivatives principally interest rate swaps. Suitable larger financial instruments are fair value hedged; the remaining exposure, where possible, is hedged by derivatives documented as cash flow hedges.
Cash flow hedges of interest rate risk relate to exposures to the variability in future interest payments and receipts due to the movement of benchmark interest rates on forecast transactions and on recognised financial assets and financial liabilities. This variability in cash flows is hedged by interest rate swaps, fixing the hedged cash flows. For these cash flow hedge relationships, the hedged items are actual and forecast variable interest rate cash flows arising from financial assets and financial liabilities with interest rates linked to the relevant benchmark rate LIBOR, EURIBOR, SONIA, the Bank of England Official Bank Rate or the European Central Bank Refinance Rate. The variability in cash flows due to movements in the relevant benchmark rate is hedged; this risk component is identified using the risk management systems of NatWest. This risk component comprises the majority of cash flow variability risk.
Fair value hedges of interest rate risk involve interest rate swaps transforming the fixed interest rate risk in recognised financial assets and financial liabilities to floating. The hedged risk is the risk of changes in the hedged items fair value attributable to changes in the benchmark interest rate embedded in the hedged item. The significant embedded benchmarks are LIBOR, EURIBOR and SONIA. This risk component is identified using the risk management systems of the group. This risk component comprises the majority of the hedged items fair value risk.
Exchange rate risk also arises in the Group where payments are denominated in different currencies than the functional currency. Residual risk positions are hedged with forward foreign exchange contracts. Exposure to the variability in future payments due to the movement of foreign exchange rates is hedged, fixing the exchange rate the payments will be settled in. The derivatives are documented as cash flow hedges. For all cash flow hedging and fair value hedge relationships the Group determines that there is an adequate level of offsetting between the hedged item and hedging instrument via assessing the initial and ongoing effectiveness by comparing movements in the fair value of the expected highly probable forecast interest cash flows / fair value of the hedged item attributable to the hedged risk with movements in the fair value of the expected changes in cash flows from the hedging interest rate swap.
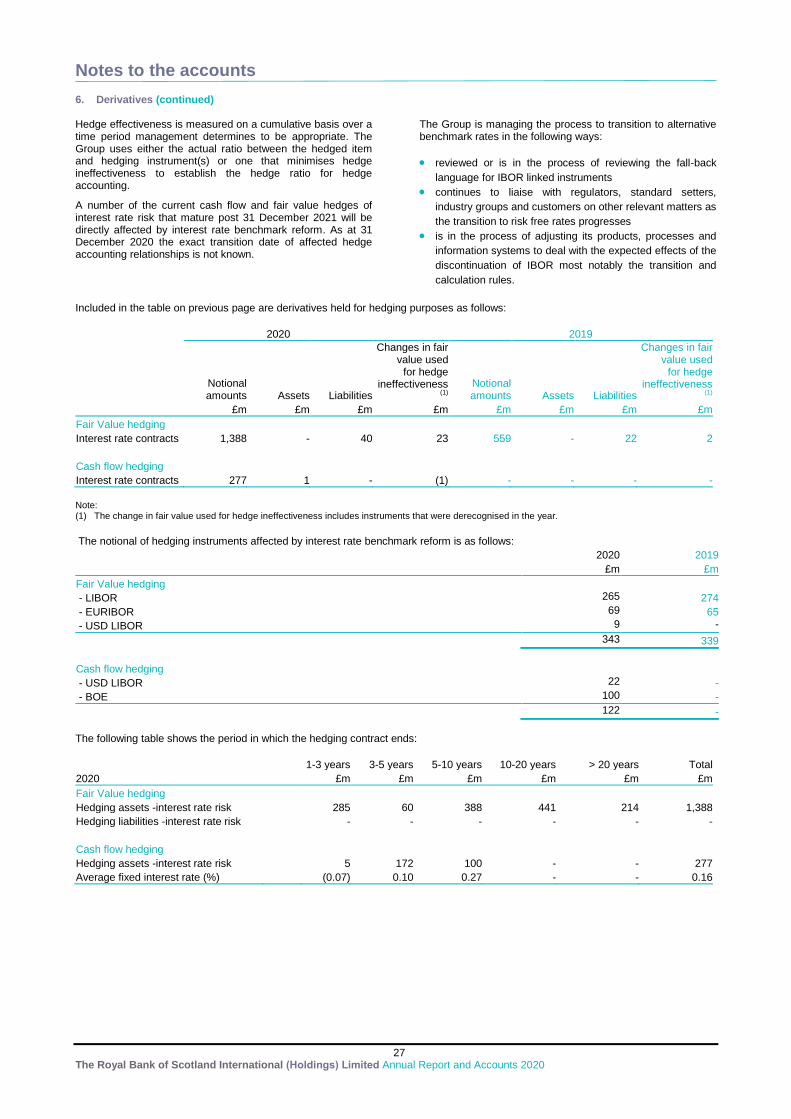
Notes to the accounts
27 The Royal Bank of Scotland International (Holdings) Limited Annual Report and Accounts 2020
6. Derivatives (continued) Hedge effectiveness is measured on a cumulative basis over a time period management determines to be appropriate. The Group uses either the actual ratio between the hedged item and hedging instrument(s) or one that minimises hedge ineffectiveness to establish the hedge ratio for hedge accounting.
A number of the current cash flow and fair value hedges of interest rate risk that mature post 31 December 2021 will be directly affected by interest rate benchmark reform. As at 31 December 2020 the exact transition date of affected hedge accounting relationships is not known.
The Group is managing the process to transition to alternative benchmark rates in the following ways:
reviewed or is in the process of reviewing the fall-back
language for IBOR linked instruments
continues to liaise with regulators, standard setters,
industry groups and customers on other relevant matters as
the transition to risk free rates progresses
is in the process of adjusting its products, processes and
information systems to deal with the expected effects of the
discontinuation of IBOR most notably the transition and
calculation rules.
Included in the table on previous page are derivatives held for hedging purposes as follows:
2020
2019
Changes in fair value used
Changes in fair value used
Notional amounts Assets Liabilities
for hedge ineffectiveness
(1) Notional amounts Assets Liabilities
for hedge ineffectiveness
(1)
£m £m £m £m £m £m £m £m
Fair Value hedging Interest rate contracts 1,388 - 40 23 559 - 22 2
Cash flow hedging Interest rate contracts 277 1 - (1) - - - -
Note: (1) The change in fair value used for hedge ineffectiveness includes instruments that were derecognised in the year.
The notional of hedging instruments affected by interest rate benchmark reform is as follows:
2020 2019
£m £m
Fair Value hedging - LIBOR 265 274
- EURIBOR 69 65
- USD LIBOR 9 -
343 339
Cash flow hedging - USD LIBOR 22 -
- BOE 100 -
122 -
The following table shows the period in which the hedging contract ends:
1-3 years 3-5 years 5-10 years 10-20 years > 20 years Total
2020
£m £m £m £m £m £m
Fair Value hedging
Hedging assets -interest rate risk 285 60 388 441 214 1,388
Hedging liabilities -interest rate risk - - - - - -
Cash flow hedging Hedging assets -interest rate risk
5 172 100 - - 277
Average fixed interest rate (%)
(0.07) 0.10 0.27 - - 0.16
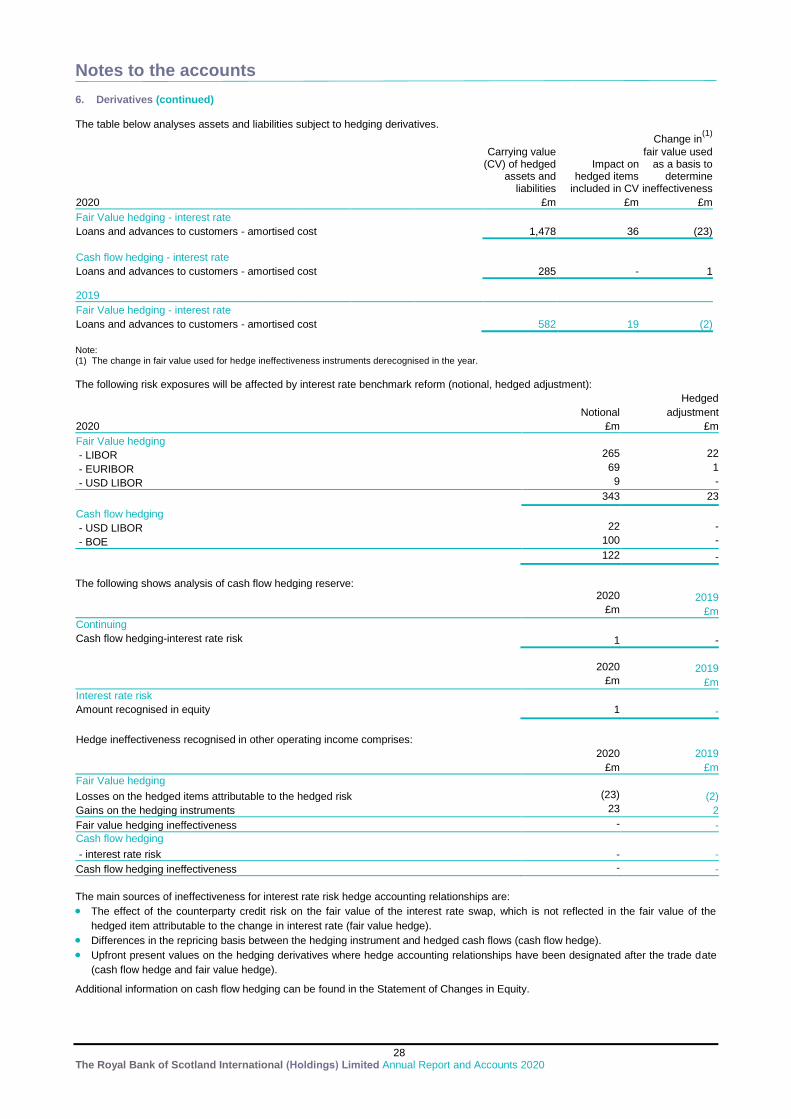
Notes to the accounts
28 The Royal Bank of Scotland International (Holdings) Limited Annual Report and Accounts 2020
6. Derivatives (continued) The table below analyses assets and liabilities subject to hedging derivatives.
Carrying value (CV) of hedged
assets and liabilities
Impact on hedged items
included in CV
Change in(1)
fair value used as a basis to
determine ineffectiveness
2020
£m £m £m
Fair Value hedging - interest rate Loans and advances to customers - amortised cost
1,478 36 (23)
Cash flow hedging - interest rate Loans and advances to customers - amortised cost
285 - 1
2019 Fair Value hedging - interest rate
Loans and advances to customers - amortised cost
582 19 (2)
Note: (1) The change in fair value used for hedge ineffectiveness instruments derecognised in the year.
The following risk exposures will be affected by interest rate benchmark reform (notional, hedged adjustment):
Hedged
Notional adjustment
2020 £m £m
Fair Value hedging - LIBOR 265 22
- EURIBOR 69 1
- USD LIBOR 9 -
343 23
Cash flow hedging - USD LIBOR 22 -
- BOE 100 -
122 -
The following shows analysis of cash flow hedging reserve: 2020 2019 £m £m
Continuing
Cash flow hedging-interest rate risk 1 -
2020 2019 £m £m
Interest rate risk
Amount recognised in equity 1 -
Hedge ineffectiveness recognised in other operating income comprises:
2020 2019
£m £m
Fair Value hedging Losses on the hedged items attributable to the hedged risk (23) (2)
Gains on the hedging instruments 23 2
Fair value hedging ineffectiveness - -
Cash flow hedging
- interest rate risk - -
Cash flow hedging ineffectiveness - -
The main sources of ineffectiveness for interest rate risk hedge accounting relationships are:
The effect of the counterparty credit risk on the fair value of the interest rate swap, which is not reflected in the fair value of the
hedged item attributable to the change in interest rate (fair value hedge).
Differences in the repricing basis between the hedging instrument and hedged cash flows (cash flow hedge).
Upfront present values on the hedging derivatives where hedge accounting relationships have been designated after the trade date
(cash flow hedge and fair value hedge).
Additional information on cash flow hedging can be found in the Statement of Changes in Equity.
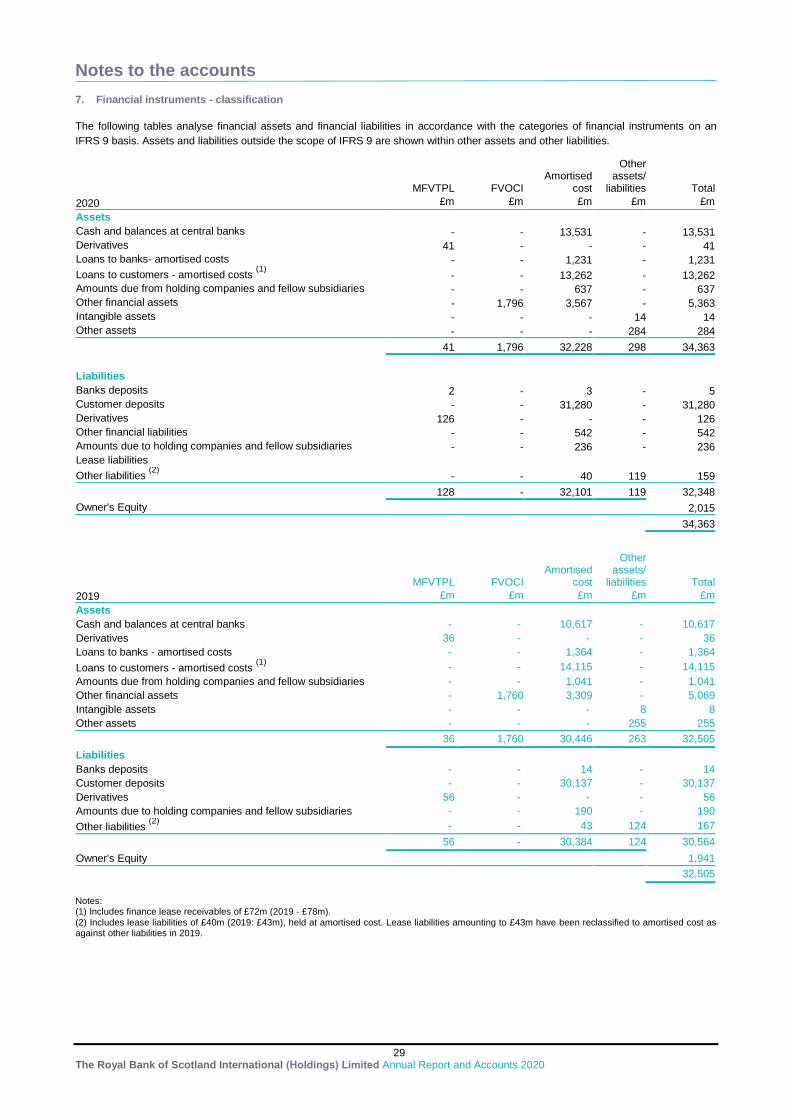
Notes to the accounts
29 The Royal Bank of Scotland International (Holdings) Limited Annual Report and Accounts 2020
7. Financial instruments - classification
The following tables analyse financial assets and financial liabilities in accordance with the categories of financial instruments on an
IFRS 9 basis. Assets and liabilities outside the scope of IFRS 9 are shown within other assets and other liabilities.
2020
MFVTPL FVOCI Amortised
cost
Other assets/
liabilities Total
£m £m £m £m £m
Assets
Cash and balances at central banks - - 13,531 - 13,531
Derivatives 41 - - - 41
Loans to banks- amortised costs - - 1,231 - 1,231
Loans to customers - amortised costs (1)
- - 13,262 - 13,262
Amounts due from holding companies and fellow subsidiaries - - 637 - 637
Other financial assets - 1,796 3,567 - 5,363
Intangible assets - - - 14 14
Other assets - - - 284 284
41 1,796 32,228 298 34,363
Liabilities
Banks deposits 2 - 3 - 5
Customer deposits - - 31,280 - 31,280
Derivatives 126 - - - 126
Other financial liabilities - - 542 - 542
Amounts due to holding companies and fellow subsidiaries - - 236 - 236
Lease liabilities
Other liabilities (2)
- - 40 119 159
128 - 32,101 119 32,348
Owner's Equity
2,015
34,363
MFVTPL FVOCI Amortised
cost
Other assets/
liabilities Total
2019 £m £m £m £m £m
Assets
Cash and balances at central banks - - 10,617 - 10,617
Derivatives 36 - - - 36
Loans to banks - amortised costs - - 1,364 - 1,364
Loans to customers - amortised costs (1)
- - 14,115 - 14,115
Amounts due from holding companies and fellow subsidiaries - - 1,041 - 1,041
Other financial assets - 1,760 3,309 - 5,069
Intangible assets - - - 8 8
Other assets - - - 255 255
36 1,760 30,446 263 32,505
Liabilities
Banks deposits - - 14 - 14
Customer deposits - - 30,137 - 30,137
Derivatives 56 - - - 56
Amounts due to holding companies and fellow subsidiaries - - 190 - 190
Other liabilities (2)
- - 43 124 167
56 - 30,384 124 30,564
Owner's Equity
1,941
32,505
Notes: (1) Includes finance lease receivables of £72m (2019 - £78m). (2) Includes lease liabilities of £40m (2019: £43m), held at amortised cost. Lease liabilities amounting to £43m have been reclassified to amortised cost as against other liabilities in 2019.
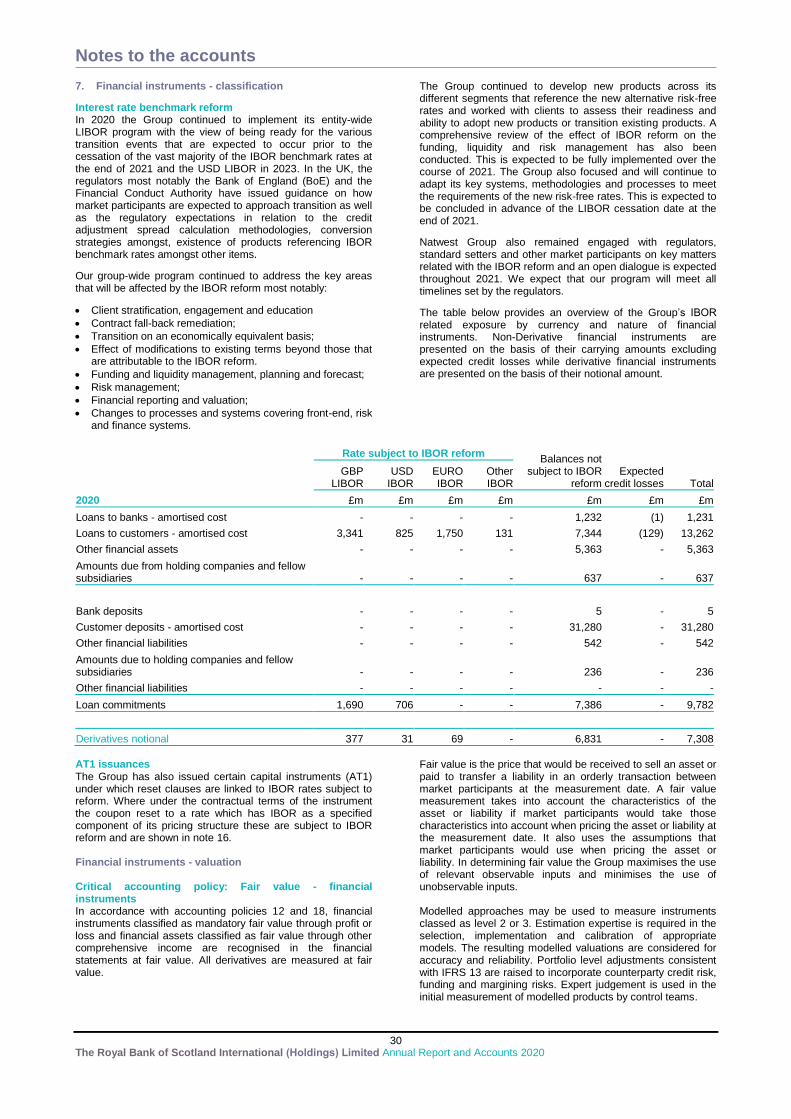
Notes to the accounts
30 The Royal Bank of Scotland International (Holdings) Limited Annual Report and Accounts 2020
7. Financial instruments - classification
Interest rate benchmark reform In 2020 the Group continued to implement its entity-wide LIBOR program with the view of being ready for the various transition events that are expected to occur prior to the cessation of the vast majority of the IBOR benchmark rates at the end of 2021 and the USD LIBOR in 2023. In the UK, the regulators most notably the Bank of England (BoE) and the Financial Conduct Authority have issued guidance on how market participants are expected to approach transition as well as the regulatory expectations in relation to the credit adjustment spread calculation methodologies, conversion strategies amongst, existence of products referencing IBOR benchmark rates amongst other items.
Our group-wide program continued to address the key areas that will be affected by the IBOR reform most notably:
Client stratification, engagement and education
Contract fall-back remediation;
Transition on an economically equivalent basis;
Effect of modifications to existing terms beyond those that are attributable to the IBOR reform.
Funding and liquidity management, planning and forecast;
Risk management;
Financial reporting and valuation;
Changes to processes and systems covering front-end, risk and finance systems.
The Group continued to develop new products across its different segments that reference the new alternative risk-free rates and worked with clients to assess their readiness and ability to adopt new products or transition existing products. A comprehensive review of the effect of IBOR reform on the funding, liquidity and risk management has also been conducted. This is expected to be fully implemented over the course of 2021. The Group also focused and will continue to adapt its key systems, methodologies and processes to meet the requirements of the new risk-free rates. This is expected to be concluded in advance of the LIBOR cessation date at the end of 2021.
Natwest Group also remained engaged with regulators, standard setters and other market participants on key matters related with the IBOR reform and an open dialogue is expected throughout 2021. We expect that our program will meet all timelines set by the regulators.
The table below provides an overview of the Group’s IBOR related exposure by currency and nature of financial instruments. Non-Derivative financial instruments are presented on the basis of their carrying amounts excluding expected credit losses while derivative financial instruments are presented on the basis of their notional amount.
Rate subject to IBOR reform Balances not
subject to IBOR reform
Expected credit losses Total
GBP LIBOR
USD IBOR
EURO IBOR
Other IBOR
2020 £m £m £m £m £m £m £m
Loans to banks - amortised cost - - - - 1,232 (1) 1,231
Loans to customers - amortised cost 3,341 825 1,750 131 7,344 (129) 13,262
Other financial assets - - - - 5,363 - 5,363
Amounts due from holding companies and fellow subsidiaries - - - - 637 - 637
Bank deposits - - - - 5 - 5
Customer deposits - amortised cost - - - - 31,280 - 31,280
Other financial liabilities - - - - 542 - 542
Amounts due to holding companies and fellow subsidiaries
- - - - 236 - 236
Other financial liabilities - - - - - - -
Loan commitments 1,690 706 - - 7,386 - 9,782
Derivatives notional 377 31 69 - 6,831 - 7,308
AT1 issuances The Group has also issued certain capital instruments (AT1) under which reset clauses are linked to IBOR rates subject to reform. Where under the contractual terms of the instrument the coupon reset to a rate which has IBOR as a specified component of its pricing structure these are subject to IBOR reform and are shown in note 16. Financial instruments - valuation Critical accounting policy: Fair value - financial instruments In accordance with accounting policies 12 and 18, financial instruments classified as mandatory fair value through profit or loss and financial assets classified as fair value through other comprehensive income are recognised in the financial statements at fair value. All derivatives are measured at fair value.
Fair value is the price that would be received to sell an asset or paid to transfer a liability in an orderly transaction between market participants at the measurement date. A fair value measurement takes into account the characteristics of the asset or liability if market participants would take those characteristics into account when pricing the asset or liability at the measurement date. It also uses the assumptions that market participants would use when pricing the asset or liability. In determining fair value the Group maximises the use of relevant observable inputs and minimises the use of unobservable inputs. Modelled approaches may be used to measure instruments classed as level 2 or 3. Estimation expertise is required in the selection, implementation and calibration of appropriate models. The resulting modelled valuations are considered for accuracy and reliability. Portfolio level adjustments consistent with IFRS 13 are raised to incorporate counterparty credit risk, funding and margining risks. Expert judgement is used in the initial measurement of modelled products by control teams.
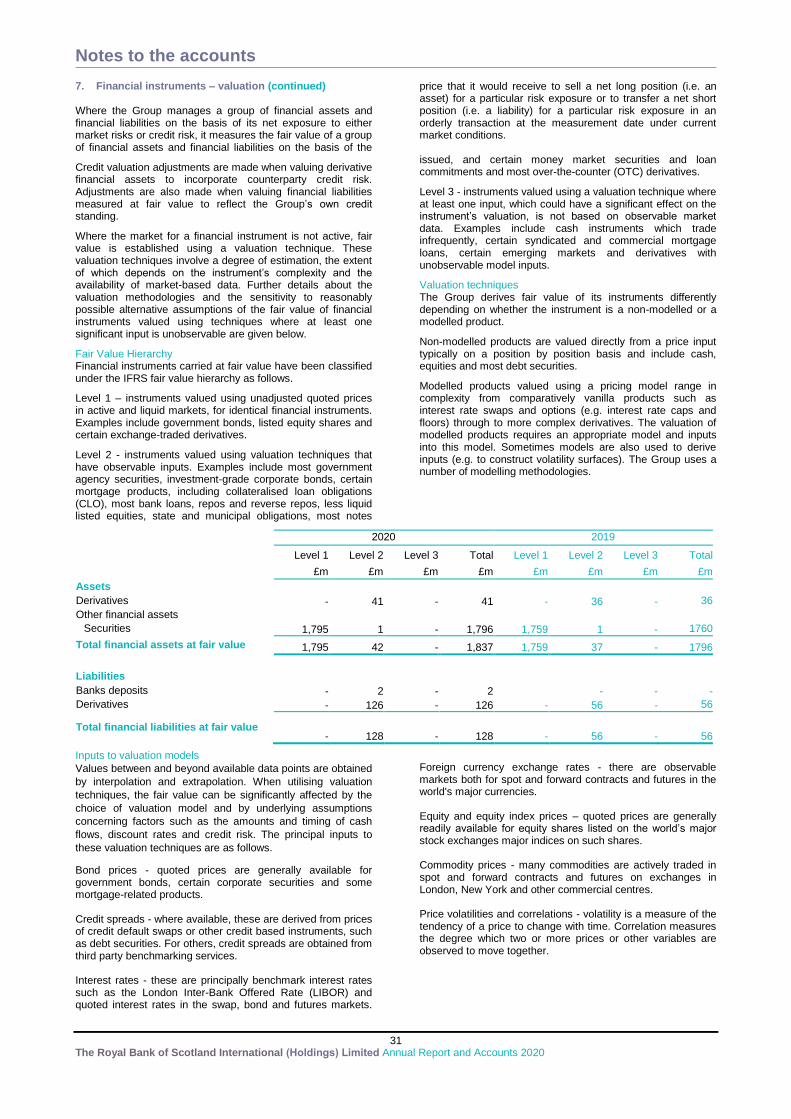
Notes to the accounts
31 The Royal Bank of Scotland International (Holdings) Limited Annual Report and Accounts 2020
7. Financial instruments – valuation (continued) Where the Group manages a group of financial assets and financial liabilities on the basis of its net exposure to either market risks or credit risk, it measures the fair value of a group of financial assets and financial liabilities on the basis of the
price that it would receive to sell a net long position (i.e. an asset) for a particular risk exposure or to transfer a net short position (i.e. a liability) for a particular risk exposure in an orderly transaction at the measurement date under current market conditions.
Credit valuation adjustments are made when valuing derivative financial assets to incorporate counterparty credit risk. Adjustments are also made when valuing financial liabilities measured at fair value to reflect the Group’s own credit standing.
Where the market for a financial instrument is not active, fair value is established using a valuation technique. These valuation techniques involve a degree of estimation, the extent of which depends on the instrument’s complexity and the availability of market-based data. Further details about the valuation methodologies and the sensitivity to reasonably possible alternative assumptions of the fair value of financial instruments valued using techniques where at least one significant input is unobservable are given below.
Fair Value Hierarchy Financial instruments carried at fair value have been classified under the IFRS fair value hierarchy as follows.
Level 1 – instruments valued using unadjusted quoted prices in active and liquid markets, for identical financial instruments. Examples include government bonds, listed equity shares and certain exchange-traded derivatives.
Level 2 - instruments valued using valuation techniques that have observable inputs. Examples include most government agency securities, investment-grade corporate bonds, certain mortgage products, including collateralised loan obligations (CLO), most bank loans, repos and reverse repos, less liquid listed equities, state and municipal obligations, most notes
issued, and certain money market securities and loan commitments and most over-the-counter (OTC) derivatives.
Level 3 - instruments valued using a valuation technique where at least one input, which could have a significant effect on the instrument’s valuation, is not based on observable market data. Examples include cash instruments which trade infrequently, certain syndicated and commercial mortgage loans, certain emerging markets and derivatives with unobservable model inputs.
Valuation techniques The Group derives fair value of its instruments differently depending on whether the instrument is a non-modelled or a modelled product.
Non-modelled products are valued directly from a price input typically on a position by position basis and include cash, equities and most debt securities.
Modelled products valued using a pricing model range in complexity from comparatively vanilla products such as interest rate swaps and options (e.g. interest rate caps and floors) through to more complex derivatives. The valuation of modelled products requires an appropriate model and inputs into this model. Sometimes models are also used to derive inputs (e.g. to construct volatility surfaces). The Group uses a number of modelling methodologies.
2020 2019
Level 1 Level 2 Level 3 Total Level 1 Level 2 Level 3 Total
£m £m
£m
£m £m £m £m £m
Assets
Derivatives - 41 - 41 - 36 - 36
Other financial assets
Securities 1,795 1 - 1,796 1,759 1 - 1760
Total financial assets at fair value 1,795 42 - 1,837 1,759 37 - 1796
Liabilities
Banks deposits - 2 - 2
- - -
Derivatives - 126 - 126 - 56 - 56
Total financial liabilities at fair value - 128 - 128 - 56 - 56
Inputs to valuation models
Values between and beyond available data points are obtained
by interpolation and extrapolation. When utilising valuation
techniques, the fair value can be significantly affected by the
choice of valuation model and by underlying assumptions
concerning factors such as the amounts and timing of cash
flows, discount rates and credit risk. The principal inputs to
these valuation techniques are as follows.
Bond prices - quoted prices are generally available for government bonds, certain corporate securities and some mortgage-related products. Credit spreads - where available, these are derived from prices of credit default swaps or other credit based instruments, such as debt securities. For others, credit spreads are obtained from third party benchmarking services. Interest rates - these are principally benchmark interest rates such as the London Inter-Bank Offered Rate (LIBOR) and quoted interest rates in the swap, bond and futures markets.
Foreign currency exchange rates - there are observable markets both for spot and forward contracts and futures in the world's major currencies. Equity and equity index prices – quoted prices are generally readily available for equity shares listed on the world’s major stock exchanges major indices on such shares. Commodity prices - many commodities are actively traded in spot and forward contracts and futures on exchanges in London, New York and other commercial centres. Price volatilities and correlations - volatility is a measure of the tendency of a price to change with time. Correlation measures the degree which two or more prices or other variables are observed to move together.
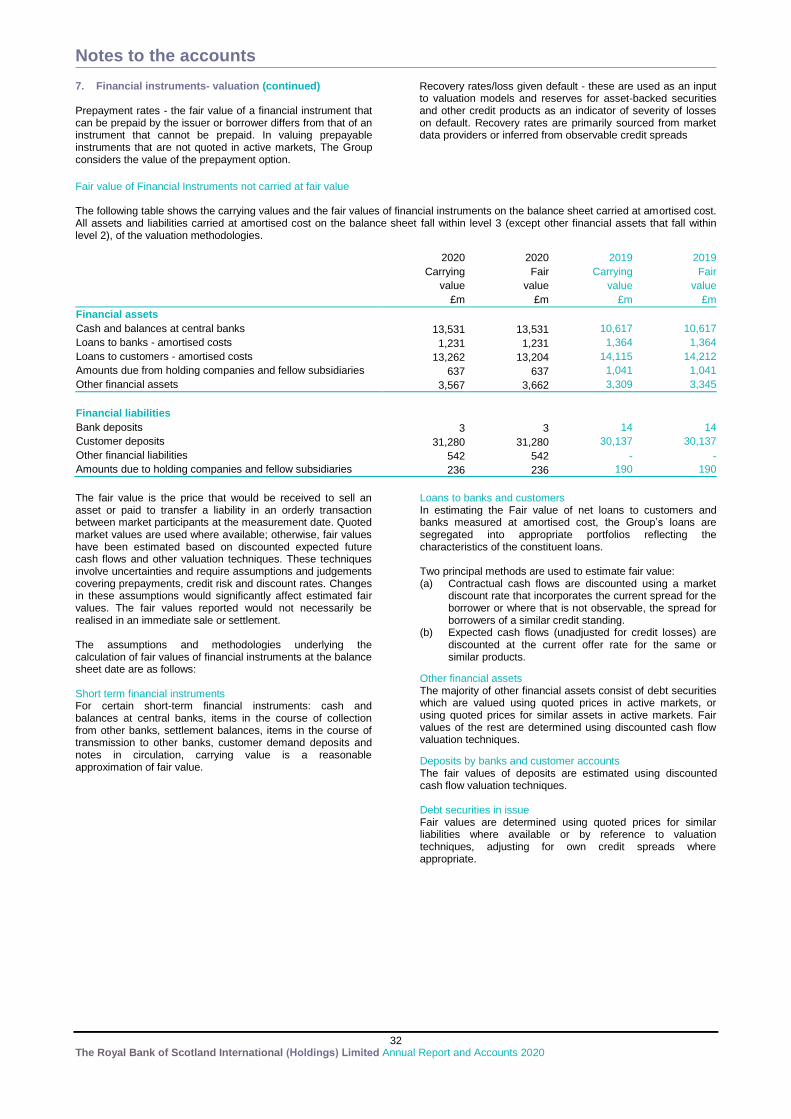
Notes to the accounts
32 The Royal Bank of Scotland International (Holdings) Limited Annual Report and Accounts 2020
7. Financial instruments- valuation (continued) Prepayment rates - the fair value of a financial instrument that can be prepaid by the issuer or borrower differs from that of an instrument that cannot be prepaid. In valuing prepayable instruments that are not quoted in active markets, The Group considers the value of the prepayment option.
Recovery rates/loss given default - these are used as an input to valuation models and reserves for asset-backed securities and other credit products as an indicator of severity of losses on default. Recovery rates are primarily sourced from market data providers or inferred from observable credit spreads
Fair value of Financial Instruments not carried at fair value The following table shows the carrying values and the fair values of financial instruments on the balance sheet carried at amortised cost. All assets and liabilities carried at amortised cost on the balance sheet fall within level 3 (except other financial assets that fall within level 2), of the valuation methodologies.
2020 2020 2019 2019
Carrying Fair Carrying Fair
value value value value
£m £m £m £m
Financial assets
Cash and balances at central banks 13,531 13,531 10,617 10,617
Loans to banks - amortised costs 1,231 1,231 1,364 1,364
Loans to customers - amortised costs 13,262 13,204 14,115 14,212
Amounts due from holding companies and fellow subsidiaries 637 637 1,041 1,041
Other financial assets 3,567 3,662 3,309 3,345
Financial liabilities
Bank deposits 3 3 14 14
Customer deposits 31,280 31,280 30,137 30,137
Other financial liabilities 542 542 - -
Amounts due to holding companies and fellow subsidiaries 236 236 190 190
The fair value is the price that would be received to sell an asset or paid to transfer a liability in an orderly transaction between market participants at the measurement date. Quoted market values are used where available; otherwise, fair values have been estimated based on discounted expected future cash flows and other valuation techniques. These techniques involve uncertainties and require assumptions and judgements covering prepayments, credit risk and discount rates. Changes in these assumptions would significantly affect estimated fair values. The fair values reported would not necessarily be realised in an immediate sale or settlement. The assumptions and methodologies underlying the calculation of fair values of financial instruments at the balance sheet date are as follows: Short term financial instruments For certain short-term financial instruments: cash and balances at central banks, items in the course of collection from other banks, settlement balances, items in the course of transmission to other banks, customer demand deposits and notes in circulation, carrying value is a reasonable approximation of fair value.
Loans to banks and customers In estimating the Fair value of net loans to customers and banks measured at amortised cost, the Group’s loans are segregated into appropriate portfolios reflecting the characteristics of the constituent loans. Two principal methods are used to estimate fair value: (a) Contractual cash flows are discounted using a market
discount rate that incorporates the current spread for the borrower or where that is not observable, the spread for borrowers of a similar credit standing.
(b) Expected cash flows (unadjusted for credit losses) are discounted at the current offer rate for the same or similar products.
Other financial assets The majority of other financial assets consist of debt securities which are valued using quoted prices in active markets, or using quoted prices for similar assets in active markets. Fair values of the rest are determined using discounted cash flow valuation techniques.
Deposits by banks and customer accounts The fair values of deposits are estimated using discounted cash flow valuation techniques. Debt securities in issue Fair values are determined using quoted prices for similar liabilities where available or by reference to valuation techniques, adjusting for own credit spreads where appropriate.
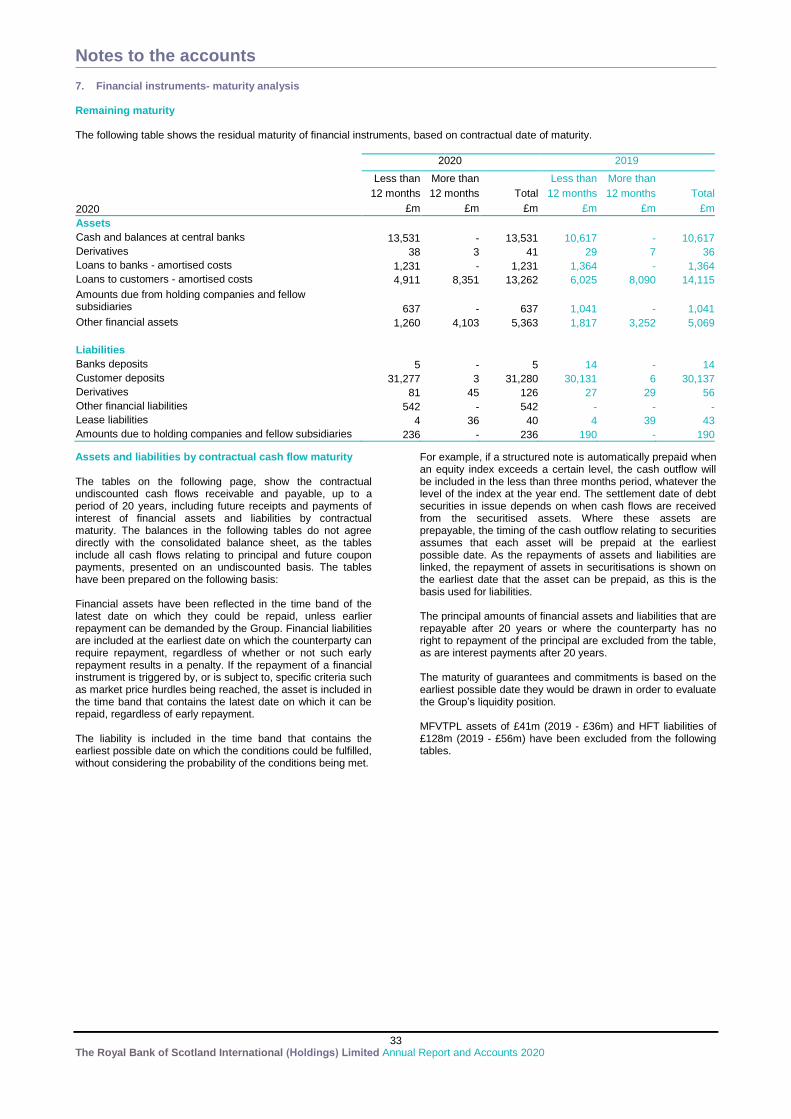
Notes to the accounts
33 The Royal Bank of Scotland International (Holdings) Limited Annual Report and Accounts 2020
7. Financial instruments- maturity analysis Remaining maturity The following table shows the residual maturity of financial instruments, based on contractual date of maturity.
2020 2019
2020
Less than More than
Less than More than
12 months 12 months Total 12 months 12 months Total
£m £m £m £m £m £m
Assets
Cash and balances at central banks 13,531 - 13,531 10,617 - 10,617
Derivatives 38 3 41 29 7 36
Loans to banks - amortised costs 1,231 - 1,231 1,364 - 1,364
Loans to customers - amortised costs 4,911 8,351 13,262 6,025 8,090 14,115
Amounts due from holding companies and fellow subsidiaries 637 - 637 1,041 - 1,041
Other financial assets 1,260 4,103 5,363 1,817 3,252 5,069
Liabilities
Banks deposits 5 - 5 14 - 14
Customer deposits 31,277 3 31,280 30,131 6 30,137
Derivatives 81 45 126 27 29 56
Other financial liabilities 542 - 542 - - -
Lease liabilities 4 36 40 4 39 43
Amounts due to holding companies and fellow subsidiaries 236 - 236 190 - 190
Assets and liabilities by contractual cash flow maturity The tables on the following page, show the contractual undiscounted cash flows receivable and payable, up to a period of 20 years, including future receipts and payments of interest of financial assets and liabilities by contractual maturity. The balances in the following tables do not agree directly with the consolidated balance sheet, as the tables include all cash flows relating to principal and future coupon payments, presented on an undiscounted basis. The tables have been prepared on the following basis: Financial assets have been reflected in the time band of the latest date on which they could be repaid, unless earlier repayment can be demanded by the Group. Financial liabilities are included at the earliest date on which the counterparty can require repayment, regardless of whether or not such early repayment results in a penalty. If the repayment of a financial instrument is triggered by, or is subject to, specific criteria such as market price hurdles being reached, the asset is included in the time band that contains the latest date on which it can be repaid, regardless of early repayment. The liability is included in the time band that contains the earliest possible date on which the conditions could be fulfilled, without considering the probability of the conditions being met.
For example, if a structured note is automatically prepaid when an equity index exceeds a certain level, the cash outflow will be included in the less than three months period, whatever the level of the index at the year end. The settlement date of debt securities in issue depends on when cash flows are received from the securitised assets. Where these assets are prepayable, the timing of the cash outflow relating to securities assumes that each asset will be prepaid at the earliest possible date. As the repayments of assets and liabilities are linked, the repayment of assets in securitisations is shown on the earliest date that the asset can be prepaid, as this is the basis used for liabilities. The principal amounts of financial assets and liabilities that are repayable after 20 years or where the counterparty has no right to repayment of the principal are excluded from the table, as are interest payments after 20 years. The maturity of guarantees and commitments is based on the earliest possible date they would be drawn in order to evaluate the Group’s liquidity position. MFVTPL assets of £41m (2019 - £36m) and HFT liabilities of £128m (2019 - £56m) have been excluded from the following tables.
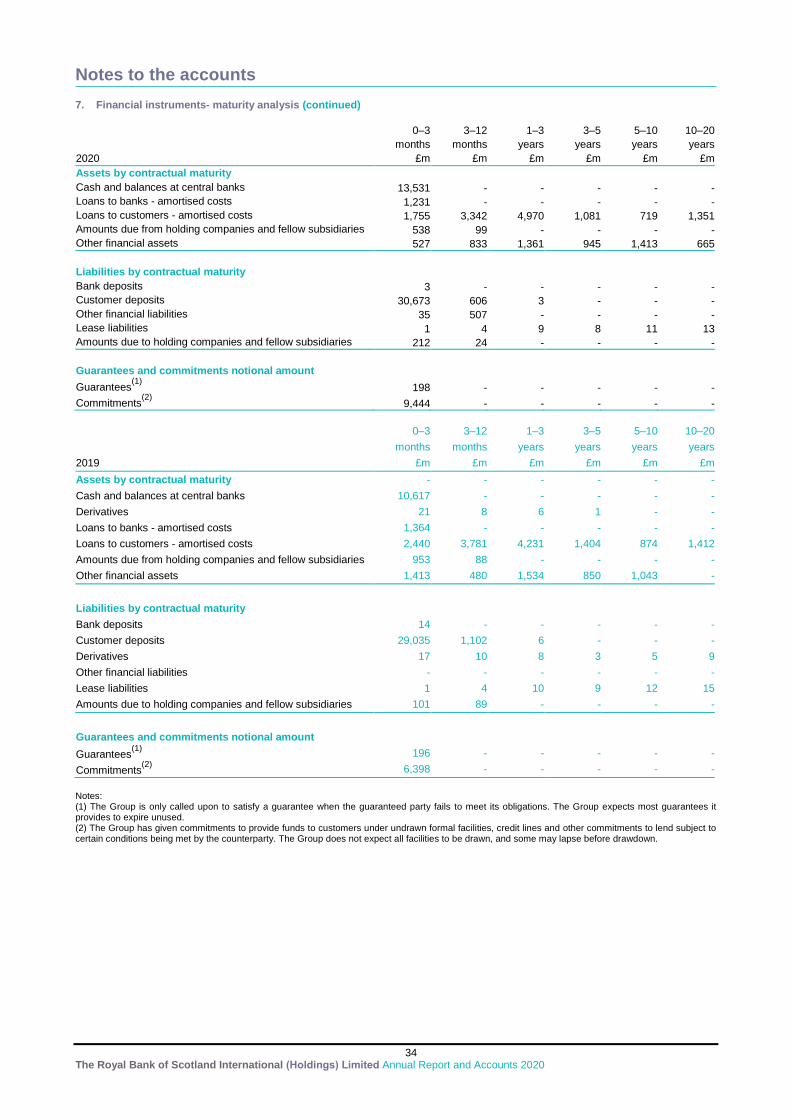
Notes to the accounts
34 The Royal Bank of Scotland International (Holdings) Limited Annual Report and Accounts 2020
7. Financial instruments- maturity analysis (continued)
0–3 3–12 1–3 3–5 5–10 10–20
months months years years years years
2020 £m £m £m £m £m £m
Assets by contractual maturity
Cash and balances at central banks 13,531 - - - - -
Loans to banks - amortised costs 1,231 - - - - -
Loans to customers - amortised costs 1,755 3,342 4,970 1,081 719 1,351
Amounts due from holding companies and fellow subsidiaries 538 99 - - - -
Other financial assets 527 833 1,361 945 1,413 665
Liabilities by contractual maturity
Bank deposits 3 - - - - -
Customer deposits 30,673 606 3 - - -
Other financial liabilities 35 507 - - - -
Lease liabilities 1 4 9 8 11 13
Amounts due to holding companies and fellow subsidiaries 212 24 - - - -
Guarantees and commitments notional amount
Guarantees(1)
198 - - - - -
Commitments(2)
9,444 - - - - -
0–3 3–12 1–3 3–5 5–10 10–20
months months years years years years
2019 £m £m £m £m £m £m
Assets by contractual maturity - - - - - -
Cash and balances at central banks 10,617 - - - - -
Derivatives 21 8 6 1 - -
Loans to banks - amortised costs 1,364 - - - - -
Loans to customers - amortised costs 2,440 3,781 4,231 1,404 874 1,412
Amounts due from holding companies and fellow subsidiaries 953 88 - - - -
Other financial assets 1,413 480 1,534 850 1,043 -
Liabilities by contractual maturity
Bank deposits 14 - - - - -
Customer deposits 29,035 1,102 6 - - -
Derivatives 17 10 8 3 5 9
Other financial liabilities - - - - - -
Lease liabilities 1 4 10 9 12 15
Amounts due to holding companies and fellow subsidiaries 101 89 - - - -
Guarantees and commitments notional amount
Guarantees(1)
196 - - - - -
Commitments(2)
6,398 - - - - -
Notes: (1) The Group is only called upon to satisfy a guarantee when the guaranteed party fails to meet its obligations. The Group expects most guarantees it provides to expire unused. (2) The Group has given commitments to provide funds to customers under undrawn formal facilities, credit lines and other commitments to lend subject to certain conditions being met by the counterparty. The Group does not expect all facilities to be drawn, and some may lapse before drawdown.
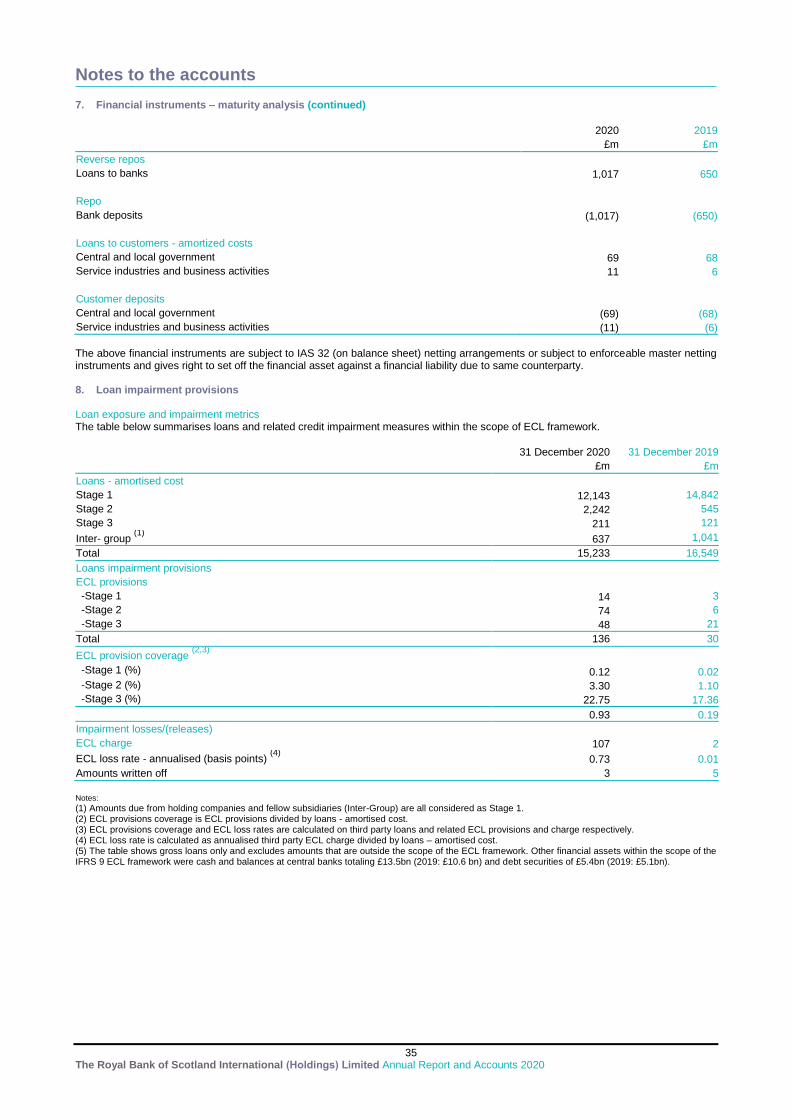
Notes to the accounts
35 The Royal Bank of Scotland International (Holdings) Limited Annual Report and Accounts 2020
7. Financial instruments – maturity analysis (continued)
2020 2019
£m £m
Reverse repos Loans to banks 1,017 650
Repo
Bank deposits (1,017) (650)
Loans to customers - amortized costs
Central and local government 69 68
Service industries and business activities 11 6
Customer deposits
Central and local government (69) (68)
Service industries and business activities (11) (6)
The above financial instruments are subject to IAS 32 (on balance sheet) netting arrangements or subject to enforceable master netting instruments and gives right to set off the financial asset against a financial liability due to same counterparty. 8. Loan impairment provisions Loan exposure and impairment metrics The table below summarises loans and related credit impairment measures within the scope of ECL framework.
31 December 2020 31 December 2019
£m £m
Loans - amortised cost
Stage 1 12,143 14,842
Stage 2 2,242 545
Stage 3 211 121
Inter- group (1)
637 1,041
Total 15,233 16,549
Loans impairment provisions
ECL provisions
-Stage 1 14 3
-Stage 2 74 6
-Stage 3 48 21
Total 136 30
ECL provision coverage (2,3)
-Stage 1 (%) 0.12 0.02
-Stage 2 (%) 3.30 1.10
-Stage 3 (%) 22.75 17.36
0.93 0.19
Impairment losses/(releases)
ECL charge 107 2
ECL loss rate - annualised (basis points) (4)
0.73 0.01
Amounts written off 3 5
Notes:
(1) Amounts due from holding companies and fellow subsidiaries (Inter-Group) are all considered as Stage 1. (2) ECL provisions coverage is ECL provisions divided by loans - amortised cost. (3) ECL provisions coverage and ECL loss rates are calculated on third party loans and related ECL provisions and charge respectively. (4) ECL loss rate is calculated as annualised third party ECL charge divided by loans – amortised cost. (5) The table shows gross loans only and excludes amounts that are outside the scope of the ECL framework. Other financial assets within the scope of the IFRS 9 ECL framework were cash and balances at central banks totaling £13.5bn (2019: £10.6 bn) and debt securities of £5.4bn (2019: £5.1bn).
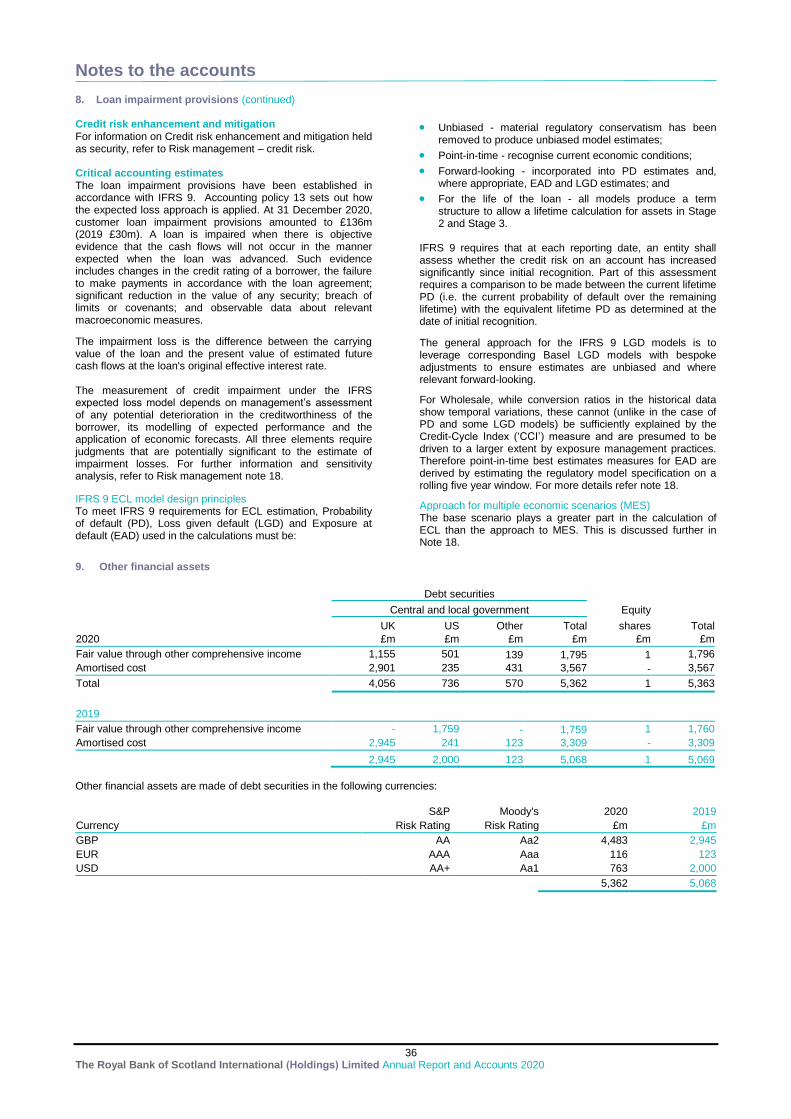
Notes to the accounts
36 The Royal Bank of Scotland International (Holdings) Limited Annual Report and Accounts 2020
8. Loan impairment provisions (continued) Credit risk enhancement and mitigation For information on Credit risk enhancement and mitigation held as security, refer to Risk management – credit risk. Critical accounting estimates The loan impairment provisions have been established in accordance with IFRS 9. Accounting policy 13 sets out how the expected loss approach is applied. At 31 December 2020, customer loan impairment provisions amounted to £136m (2019 £30m). A loan is impaired when there is objective evidence that the cash flows will not occur in the manner expected when the loan was advanced. Such evidence includes changes in the credit rating of a borrower, the failure to make payments in accordance with the loan agreement; significant reduction in the value of any security; breach of limits or covenants; and observable data about relevant macroeconomic measures.
The impairment loss is the difference between the carrying value of the loan and the present value of estimated future cash flows at the loan's original effective interest rate. The measurement of credit impairment under the IFRS expected loss model depends on management’s assessment of any potential deterioration in the creditworthiness of the borrower, its modelling of expected performance and the application of economic forecasts. All three elements require judgments that are potentially significant to the estimate of impairment losses. For further information and sensitivity analysis, refer to Risk management note 18.
IFRS 9 ECL model design principles To meet IFRS 9 requirements for ECL estimation, Probability of default (PD), Loss given default (LGD) and Exposure at default (EAD) used in the calculations must be:
Unbiased - material regulatory conservatism has been removed to produce unbiased model estimates;
Point-in-time - recognise current economic conditions;
Forward-looking - incorporated into PD estimates and, where appropriate, EAD and LGD estimates; and
For the life of the loan - all models produce a term structure to allow a lifetime calculation for assets in Stage 2 and Stage 3.
IFRS 9 requires that at each reporting date, an entity shall assess whether the credit risk on an account has increased significantly since initial recognition. Part of this assessment requires a comparison to be made between the current lifetime PD (i.e. the current probability of default over the remaining lifetime) with the equivalent lifetime PD as determined at the date of initial recognition.
The general approach for the IFRS 9 LGD models is to leverage corresponding Basel LGD models with bespoke adjustments to ensure estimates are unbiased and where relevant forward-looking.
For Wholesale, while conversion ratios in the historical data show temporal variations, these cannot (unlike in the case of PD and some LGD models) be sufficiently explained by the Credit-Cycle Index (‘CCI’) measure and are presumed to be driven to a larger extent by exposure management practices. Therefore point-in-time best estimates measures for EAD are derived by estimating the regulatory model specification on a rolling five year window. For more details refer note 18.
Approach for multiple economic scenarios (MES) The base scenario plays a greater part in the calculation of ECL than the approach to MES. This is discussed further in Note 18.
9. Other financial assets
Debt securities
Central and local government Equity
UK US Other Total shares Total
2020 £m £m £m £m £m £m
Fair value through other comprehensive income 1,155 501 139 1,795 1 1,796
Amortised cost 2,901 235 431 3,567 - 3,567
Total 4,056 736 570 5,362 1 5,363
2019
Fair value through other comprehensive income - 1,759 - 1,759 1 1,760
Amortised cost 2,945 241 123 3,309 - 3,309
2,945 2,000 123 5,068 1 5,069
Other financial assets are made of debt securities in the following currencies:
S&P Moody's 2020 2019
Currency Risk Rating Risk Rating £m £m
GBP AA Aa2 4,483 2,945
EUR AAA Aaa 116 123
USD AA+ Aa1 763 2,000
5,362 5,068
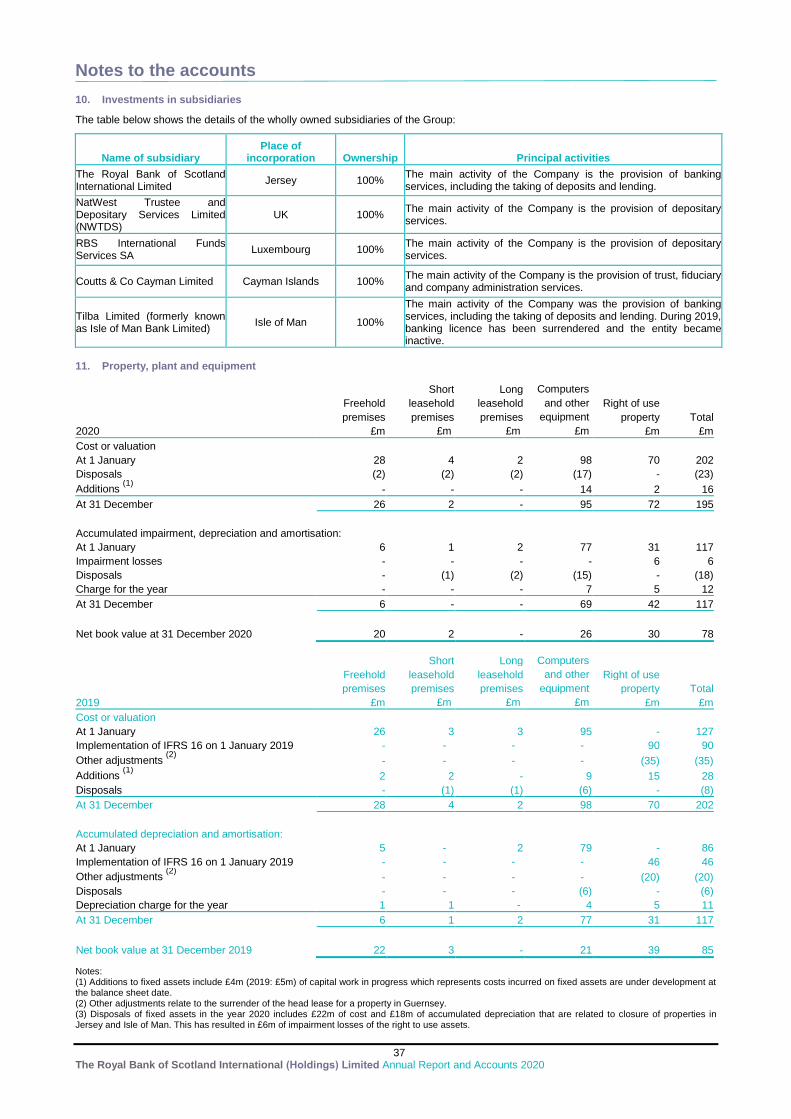
Notes to the accounts
37 The Royal Bank of Scotland International (Holdings) Limited Annual Report and Accounts 2020
10. Investments in subsidiaries
The table below shows the details of the wholly owned subsidiaries of the Group:
Name of subsidiary Place of
incorporation Ownership Principal activities
The Royal Bank of Scotland International Limited
Jersey 100% The main activity of the Company is the provision of banking services, including the taking of deposits and lending.
NatWest Trustee and Depositary Services Limited (NWTDS)
UK 100% The main activity of the Company is the provision of depositary services.
RBS International Funds Services SA
Luxembourg 100% The main activity of the Company is the provision of depositary services.
Coutts & Co Cayman Limited Cayman Islands 100% The main activity of the Company is the provision of trust, fiduciary and company administration services.
Tilba Limited (formerly known as Isle of Man Bank Limited)
Isle of Man 100%
The main activity of the Company was the provision of banking services, including the taking of deposits and lending. During 2019, banking licence has been surrendered and the entity became inactive.
11. Property, plant and equipment
Short Long Computers
Freehold leasehold leasehold and other Right of use
premises premises premises equipment property Total
2020 £m £m £m £m £m £m
Cost or valuation At 1 January 28 4 2 98 70 202
Disposals (2) (2) (2) (17) - (23)
Additions (1)
- - - 14 2 16
At 31 December 26 2 - 95 72 195
Accumulated impairment, depreciation and amortisation: At 1 January 6 1 2 77 31 117
Impairment losses - - - - 6 6
Disposals - (1) (2) (15) - (18)
Charge for the year - - - 7 5 12
At 31 December 6 - - 69 42 117
Net book value at 31 December 2020 20 2 - 26 30 78
Short Long Computers
Freehold leasehold leasehold and other Right of use
premises premises premises equipment property Total
2019 £m £m £m £m £m £m
Cost or valuation At 1 January 26 3 3 95 - 127
Implementation of IFRS 16 on 1 January 2019 - - - - 90 90
Other adjustments (2)
- - - - (35) (35)
Additions (1)
2 2 - 9 15 28
Disposals - (1) (1) (6) - (8)
At 31 December 28 4 2 98 70 202
Accumulated depreciation and amortisation: At 1 January 5 - 2 79 - 86
Implementation of IFRS 16 on 1 January 2019 - - - - 46 46
Other adjustments (2)
- - - - (20) (20)
Disposals - - - (6) - (6)
Depreciation charge for the year 1 1 - 4 5 11
At 31 December 6 1 2 77 31 117
Net book value at 31 December 2019 22 3 - 21 39 85
Notes: (1) Additions to fixed assets include £4m (2019: £5m) of capital work in progress which represents costs incurred on fixed assets are under development at the balance sheet date. (2) Other adjustments relate to the surrender of the head lease for a property in Guernsey. (3) Disposals of fixed assets in the year 2020 includes £22m of cost and £18m of accumulated depreciation that are related to closure of properties in Jersey and Isle of Man. This has resulted in £6m of impairment losses of the right to use assets.
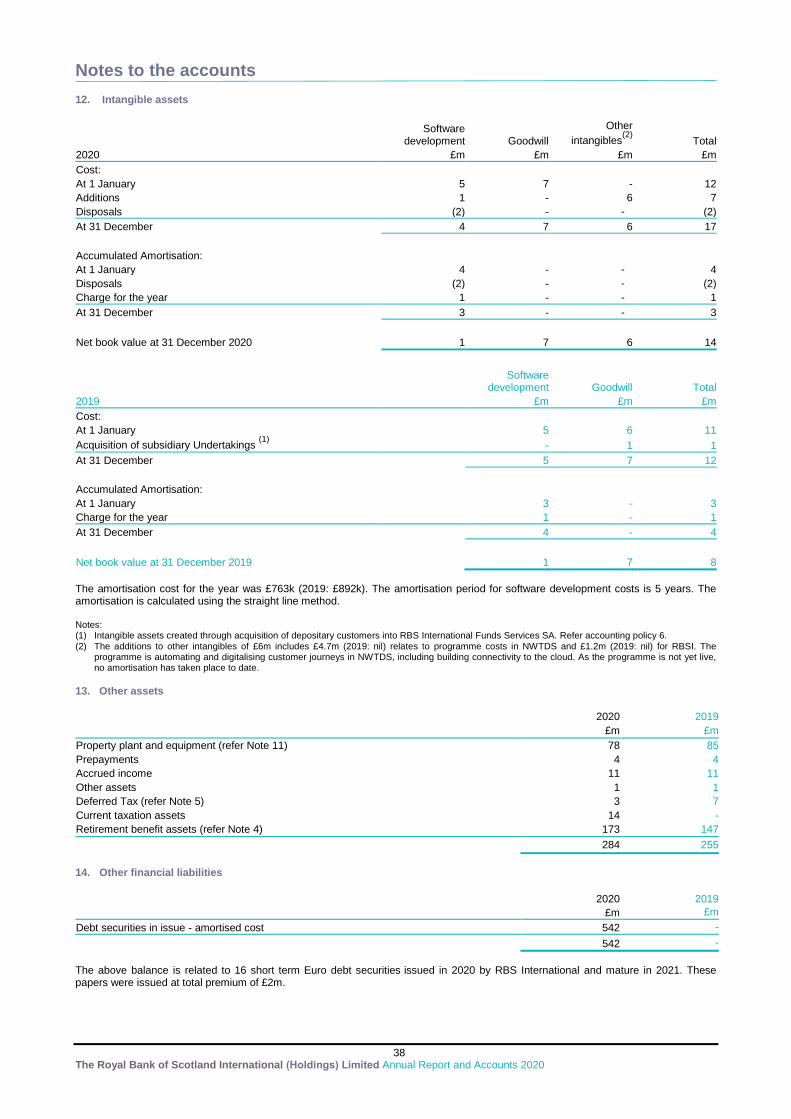
Notes to the accounts
38 The Royal Bank of Scotland International (Holdings) Limited Annual Report and Accounts 2020
12. Intangible assets
Software
development Goodwill
Other
intangibles(2)
Total
2020 £m £m £m £m
Cost: At 1 January 5 7 - 12
Additions 1 - 6 7
Disposals (2) - - (2)
At 31 December 4 7 6 17
Accumulated Amortisation: At 1 January 4 - - 4
Disposals (2) - - (2)
Charge for the year 1 - - 1
At 31 December 3 - - 3
Net book value at 31 December 2020 1 7 6 14
Software development Goodwill Total
2019
£m £m £m
Cost: At 1 January
5 6 11
Acquisition of subsidiary Undertakings (1)
- 1 1
At 31 December
5 7 12
Accumulated Amortisation: At 1 January
3 - 3
Charge for the year
1 - 1
At 31 December
4 - 4
Net book value at 31 December 2019
1 7 8
The amortisation cost for the year was £763k (2019: £892k). The amortisation period for software development costs is 5 years. The amortisation is calculated using the straight line method. Notes: (1) Intangible assets created through acquisition of depositary customers into RBS International Funds Services SA. Refer accounting policy 6. (2) The additions to other intangibles of £6m includes £4.7m (2019: nil) relates to programme costs in NWTDS and £1.2m (2019: nil) for RBSI. The
programme is automating and digitalising customer journeys in NWTDS, including building connectivity to the cloud. As the programme is not yet live, no amortisation has taken place to date.
13. Other assets
2020 2019
£m £m
Property plant and equipment (refer Note 11) 78 85
Prepayments 4 4
Accrued income 11 11
Other assets 1 1
Deferred Tax (refer Note 5) 3 7
Current taxation assets 14 -
Retirement benefit assets (refer Note 4) 173 147
284 255
14. Other financial liabilities
2020 2019
£m £m
Debt securities in issue - amortised cost 542 -
542 -
The above balance is related to 16 short term Euro debt securities issued in 2020 by RBS International and mature in 2021. These papers were issued at total premium of £2m.
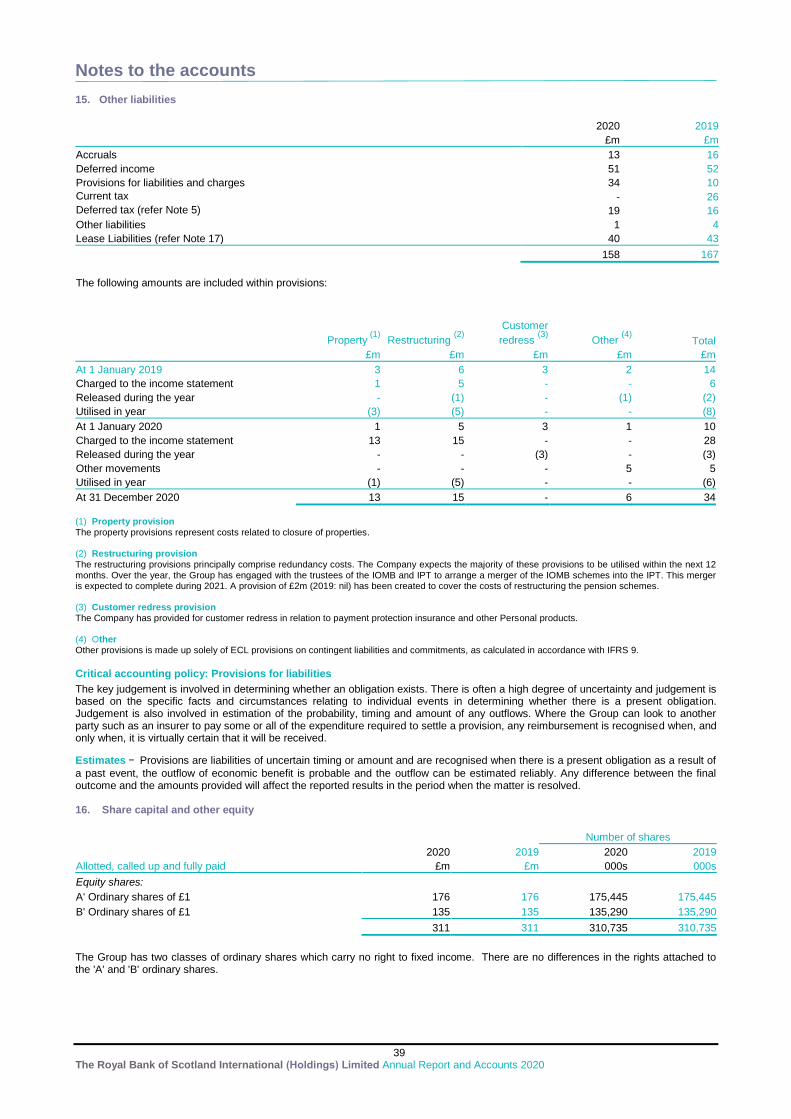
Notes to the accounts
39 The Royal Bank of Scotland International (Holdings) Limited Annual Report and Accounts 2020
15. Other liabilities
2020 2019
£m £m
Accruals 13 16
Deferred income 51 52
Provisions for liabilities and charges 34 10
Current tax - 26
Deferred tax (refer Note 5) 19 16
Other liabilities 1 4
Lease Liabilities (refer Note 17) 40 43
158 167
The following amounts are included within provisions:
Property (1)
Restructuring (2)
Customer
redress (3)
Other (4)
Total
£m £m £m £m £m
At 1 January 2019 3 6 3 2 14
Charged to the income statement 1 5 - - 6
Released during the year - (1) - (1) (2)
Utilised in year (3) (5) - - (8)
At 1 January 2020 1 5 3 1 10
Charged to the income statement 13 15 - - 28
Released during the year - - (3) - (3)
Other movements - - - 5 5
Utilised in year (1) (5) - - (6)
At 31 December 2020 13 15 - 6 34
(1) Property provision
The property provisions represent costs related to closure of properties. (2) Restructuring provision The restructuring provisions principally comprise redundancy costs. The Company expects the majority of these provisions to be utilised within the next 12 months. Over the year, the Group has engaged with the trustees of the IOMB and IPT to arrange a merger of the IOMB schemes into the IPT. This merger is expected to complete during 2021. A provision of £2m (2019: nil) has been created to cover the costs of restructuring the pension schemes. (3) Customer redress provision The Company has provided for customer redress in relation to payment protection insurance and other Personal products. (4) Other Other provisions is made up solely of ECL provisions on contingent liabilities and commitments, as calculated in accordance with IFRS 9.
Critical accounting policy: Provisions for liabilities
The key judgement is involved in determining whether an obligation exists. There is often a high degree of uncertainty and judgement is based on the specific facts and circumstances relating to individual events in determining whether there is a present obligation. Judgement is also involved in estimation of the probability, timing and amount of any outflows. Where the Group can look to another party such as an insurer to pay some or all of the expenditure required to settle a provision, any reimbursement is recognised when, and only when, it is virtually certain that it will be received.
Estimates - Provisions are liabilities of uncertain timing or amount and are recognised when there is a present obligation as a result of
a past event, the outflow of economic benefit is probable and the outflow can be estimated reliably. Any difference between the final outcome and the amounts provided will affect the reported results in the period when the matter is resolved. 16. Share capital and other equity
Number of shares
2020 2019 2020 2019
Allotted, called up and fully paid £m £m 000s 000s
Equity shares: A' Ordinary shares of £1 176 176 175,445 175,445
B' Ordinary shares of £1 135 135 135,290 135,290
311 311 310,735 310,735
The Group has two classes of ordinary shares which carry no right to fixed income. There are no differences in the rights attached to the 'A' and 'B' ordinary shares.
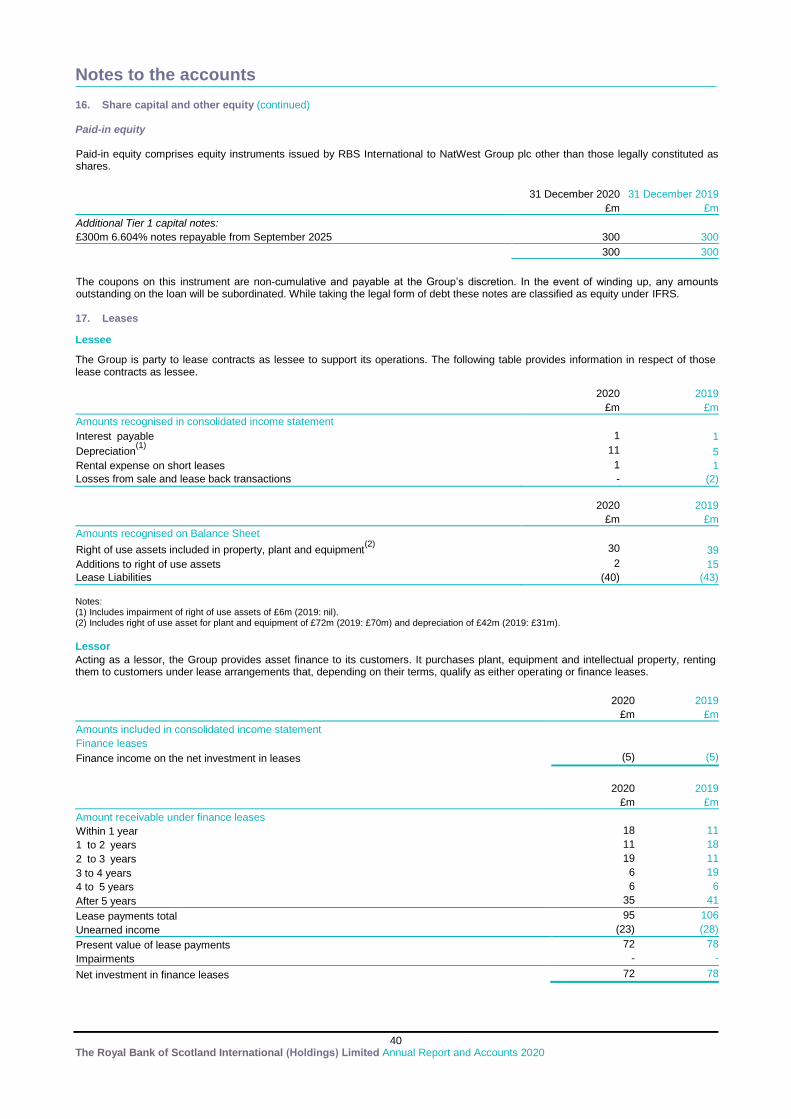
Notes to the accounts
40 The Royal Bank of Scotland International (Holdings) Limited Annual Report and Accounts 2020
16. Share capital and other equity (continued) Paid-in equity Paid-in equity comprises equity instruments issued by RBS International to NatWest Group plc other than those legally constituted as shares.
31 December 2020 31 December 2019
£m £m
Additional Tier 1 capital notes: £300m 6.604% notes repayable from September 2025 300 300
300 300
The coupons on this instrument are non-cumulative and payable at the Group’s discretion. In the event of winding up, any amounts outstanding on the loan will be subordinated. While taking the legal form of debt these notes are classified as equity under IFRS. 17. Leases
Lessee
The Group is party to lease contracts as lessee to support its operations. The following table provides information in respect of those lease contracts as lessee.
2020 2019
£m £m
Amounts recognised in consolidated income statement
Interest payable 1 1
Depreciation(1)
11 5
Rental expense on short leases 1 1
Losses from sale and lease back transactions - (2)
2020 2019
£m £m
Amounts recognised on Balance Sheet
Right of use assets included in property, plant and equipment(2)
30 39
Additions to right of use assets 2 15
Lease Liabilities (40) (43)
Notes: (1) Includes impairment of right of use assets of £6m (2019: nil). (2) Includes right of use asset for plant and equipment of £72m (2019: £70m) and depreciation of £42m (2019: £31m).
Lessor
Acting as a lessor, the Group provides asset finance to its customers. It purchases plant, equipment and intellectual property, renting them to customers under lease arrangements that, depending on their terms, qualify as either operating or finance leases.
2020 2019
£m £m
Amounts included in consolidated income statement Finance leases
Finance income on the net investment in leases (5) (5)
2020 2019
£m £m
Amount receivable under finance leases Within 1 year 18 11
1 to 2 years 11 18
2 to 3 years 19 11
3 to 4 years 6 19
4 to 5 years 6 6
After 5 years 35 41
Lease payments total 95 106
Unearned income (23) (28)
Present value of lease payments 72 78
Impairments - -
Net investment in finance leases 72 78
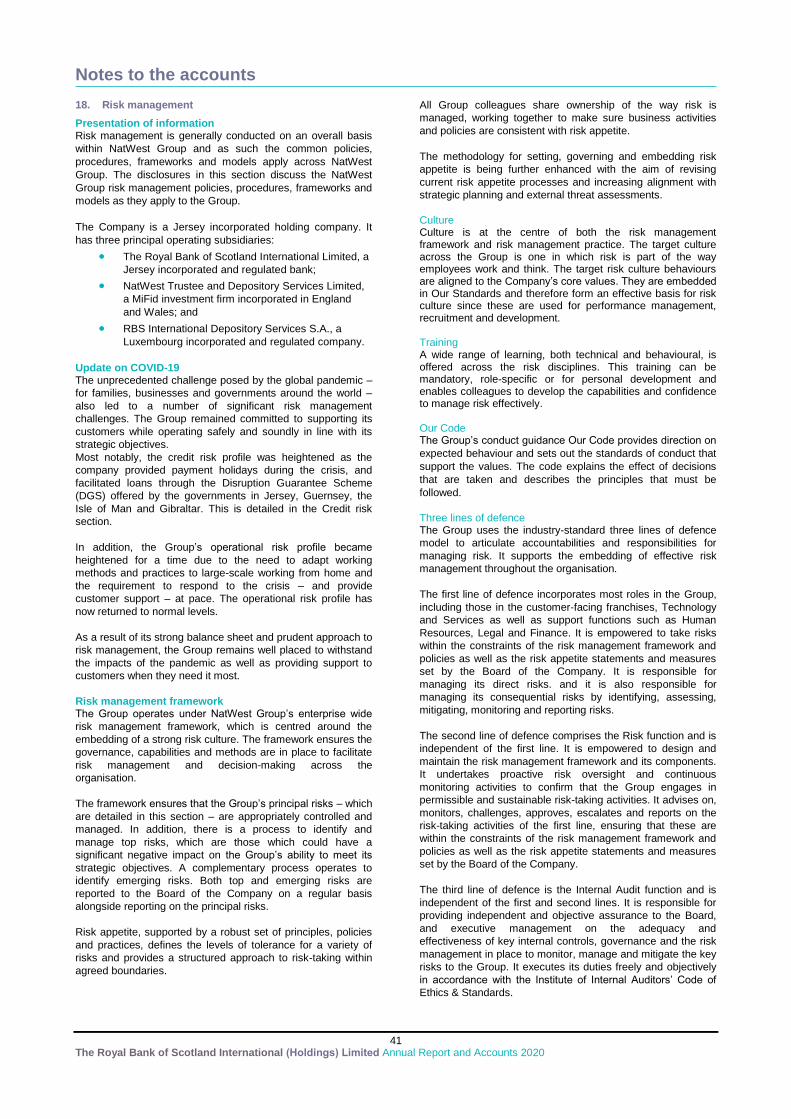
Notes to the accounts
41 The Royal Bank of Scotland International (Holdings) Limited Annual Report and Accounts 2020
18. Risk management
Presentation of information Risk management is generally conducted on an overall basis
within NatWest Group and as such the common policies,
procedures, frameworks and models apply across NatWest
Group. The disclosures in this section discuss the NatWest
Group risk management policies, procedures, frameworks and
models as they apply to the Group.
The Company is a Jersey incorporated holding company. It
has three principal operating subsidiaries:
The Royal Bank of Scotland International Limited, a
Jersey incorporated and regulated bank;
NatWest Trustee and Depository Services Limited,
a MiFid investment firm incorporated in England
and Wales; and
RBS International Depository Services S.A., a
Luxembourg incorporated and regulated company.
Update on COVID-19 The unprecedented challenge posed by the global pandemic –
for families, businesses and governments around the world –
also led to a number of significant risk management
challenges. The Group remained committed to supporting its
customers while operating safely and soundly in line with its
strategic objectives.
Most notably, the credit risk profile was heightened as the
company provided payment holidays during the crisis, and
facilitated loans through the Disruption Guarantee Scheme
(DGS) offered by the governments in Jersey, Guernsey, the
Isle of Man and Gibraltar. This is detailed in the Credit risk
section.
In addition, the Group’s operational risk profile became
heightened for a time due to the need to adapt working
methods and practices to large-scale working from home and
the requirement to respond to the crisis – and provide
customer support – at pace. The operational risk profile has
now returned to normal levels.
As a result of its strong balance sheet and prudent approach to
risk management, the Group remains well placed to withstand
the impacts of the pandemic as well as providing support to
customers when they need it most.
Risk management framework The Group operates under NatWest Group’s enterprise wide
risk management framework, which is centred around the
embedding of a strong risk culture. The framework ensures the
governance, capabilities and methods are in place to facilitate
risk management and decision-making across the
organisation.
The framework ensures that the Group’s principal risks – which
are detailed in this section – are appropriately controlled and
managed. In addition, there is a process to identify and
manage top risks, which are those which could have a
significant negative impact on the Group’s ability to meet its
strategic objectives. A complementary process operates to
identify emerging risks. Both top and emerging risks are
reported to the Board of the Company on a regular basis
alongside reporting on the principal risks.
Risk appetite, supported by a robust set of principles, policies
and practices, defines the levels of tolerance for a variety of
risks and provides a structured approach to risk-taking within
agreed boundaries.
All Group colleagues share ownership of the way risk is
managed, working together to make sure business activities
and policies are consistent with risk appetite.
The methodology for setting, governing and embedding risk
appetite is being further enhanced with the aim of revising
current risk appetite processes and increasing alignment with
strategic planning and external threat assessments.
Culture Culture is at the centre of both the risk management framework and risk management practice. The target culture across the Group is one in which risk is part of the way employees work and think. The target risk culture behaviours are aligned to the Company’s core values. They are embedded in Our Standards and therefore form an effective basis for risk culture since these are used for performance management, recruitment and development. Training A wide range of learning, both technical and behavioural, is offered across the risk disciplines. This training can be mandatory, role-specific or for personal development and enables colleagues to develop the capabilities and confidence to manage risk effectively. Our Code The Group’s conduct guidance Our Code provides direction on
expected behaviour and sets out the standards of conduct that
support the values. The code explains the effect of decisions
that are taken and describes the principles that must be
followed.
Three lines of defence The Group uses the industry-standard three lines of defence
model to articulate accountabilities and responsibilities for
managing risk. It supports the embedding of effective risk
management throughout the organisation.
The first line of defence incorporates most roles in the Group,
including those in the customer-facing franchises, Technology
and Services as well as support functions such as Human
Resources, Legal and Finance. It is empowered to take risks
within the constraints of the risk management framework and
policies as well as the risk appetite statements and measures
set by the Board of the Company. It is responsible for
managing its direct risks. and it is also responsible for
managing its consequential risks by identifying, assessing,
mitigating, monitoring and reporting risks.
The second line of defence comprises the Risk function and is
independent of the first line. It is empowered to design and
maintain the risk management framework and its components.
It undertakes proactive risk oversight and continuous
monitoring activities to confirm that the Group engages in
permissible and sustainable risk-taking activities. It advises on,
monitors, challenges, approves, escalates and reports on the
risk-taking activities of the first line, ensuring that these are
within the constraints of the risk management framework and
policies as well as the risk appetite statements and measures
set by the Board of the Company.
The third line of defence is the Internal Audit function and is
independent of the first and second lines. It is responsible for
providing independent and objective assurance to the Board,
and executive management on the adequacy and
effectiveness of key internal controls, governance and the risk
management in place to monitor, manage and mitigate the key
risks to the Group. It executes its duties freely and objectively
in accordance with the Institute of Internal Auditors’ Code of
Ethics & Standards.
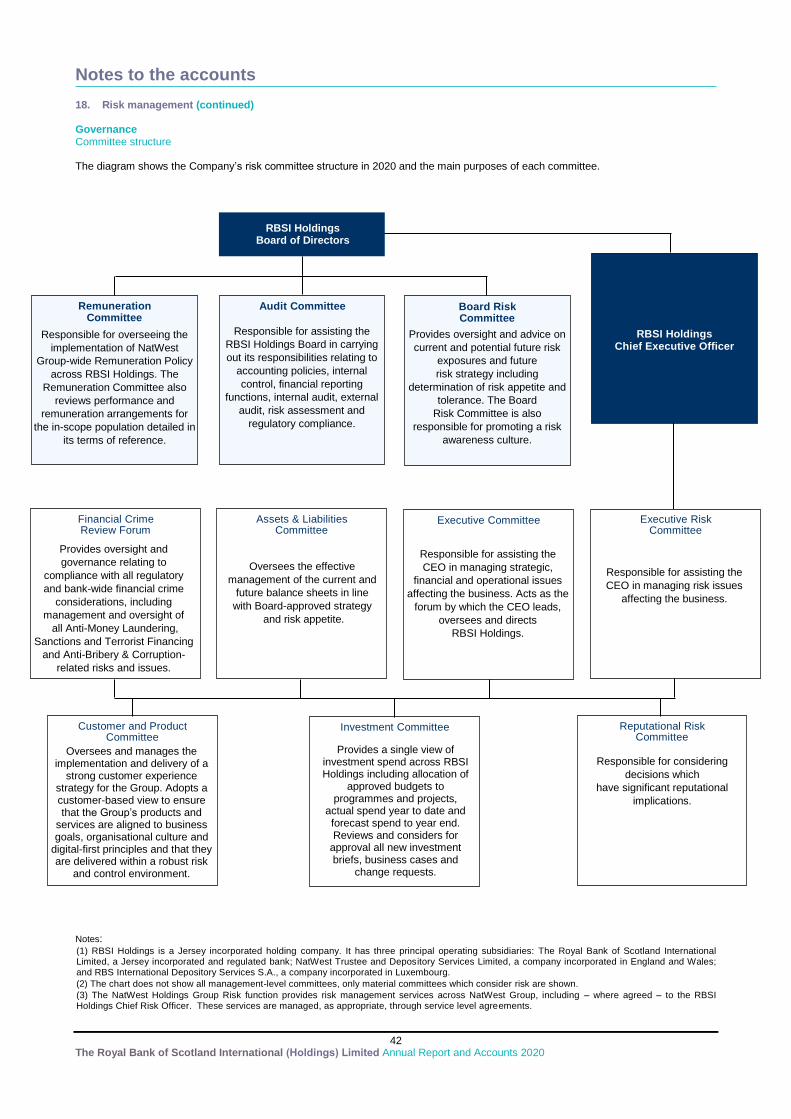
Notes to the accounts
42 The Royal Bank of Scotland International (Holdings) Limited Annual Report and Accounts 2020
18. Risk management (continued) Governance Committee structure The diagram shows the Company’s risk committee structure in 2020 and the main purposes of each committee.
Notes: (1) RBSI Holdings is a Jersey incorporated holding company. It has three principal operating subsidiaries: The Royal Bank of Scotland International Limited, a Jersey incorporated and regulated bank; NatWest Trustee and Depository Services Limited, a company incorporated in England and Wales; and RBS International Depository Services S.A., a company incorporated in Luxembourg. (2) The chart does not show all management-level committees, only material committees which consider risk are shown.
(3) The NatWest Holdings Group Risk function provides risk management services across NatWest Group, including – where agreed – to the RBSI Holdings Chief Risk Officer. These services are managed, as appropriate, through service level agreements.
RBSI (Holdings) Limited Board of Directors
Board Risk Committee
Audit Committee
Executive Risk Committee
Reputational Risk Committee
Customer and Product Committee
Investment Committee
Executive Committee
Financial Crime Review Forum
Assets & Liabilities Committee
Responsible for assisting the
RBSI Holdings Board in carrying
out its responsibilities relating to
accounting policies, internal
control, financial reporting
functions, internal audit, external
audit, risk assessment and
regulatory compliance.
Provides oversight and advice on
current and potential future risk
exposures and future risk strategy including
determination of risk appetite and
tolerance. The Board
Risk Committee is also
responsible for promoting a risk
awareness culture.
RBSI Holdings Board of Directors
Oversees the effective
management of the current and
future balance sheets in line
with Board-approved strategy
and risk appetite.
Responsible for assisting the
CEO in managing strategic,
financial and operational issues
affecting the business. Acts as the
forum by which the CEO leads,
oversees and directs RBSI Holdings.
Responsible for assisting the
CEO in managing risk issues
affecting the business.
Responsible for considering decisions which
have significant reputational
implications.
Oversees and manages the implementation and delivery of a
strong customer experience strategy for the Group. Adopts a customer-based view to ensure that the Group’s products and
services are aligned to business goals, organisational culture and
digital-first principles and that they are delivered within a robust risk
and control environment. This Committee supports and provides approvals for the following legal entities: • The Royal Bank of Scotland International Limited; • NatWest Trustee and Depositary Services Limited; and • RBS International Depositary Services S.A. Committee members should ensure that due consideration is given to the Group’s Purpose when considering matters within the Committee’s
Provides a single view of investment spend across RBSI Holdings including allocation of
approved budgets to programmes and projects,
actual spend year to date and forecast spend to year end. Reviews and considers for
approval all new investment briefs, business cases and
change requests.
Provides oversight and
governance relating to
compliance with all regulatory
and bank-wide financial crime
considerations, including
management and oversight of
all Anti-Money Laundering,
Sanctions and Terrorist Financing
and Anti-Bribery & Corruption-
related risks and issues.
RBSI Holdings Chief Executive Officer
Remuneration Committee
Responsible for overseeing the
implementation of NatWest
Group-wide Remuneration Policy
across RBSI Holdings. The
Remuneration Committee also
reviews performance and
remuneration arrangements for
the in-scope population detailed in
its terms of reference.
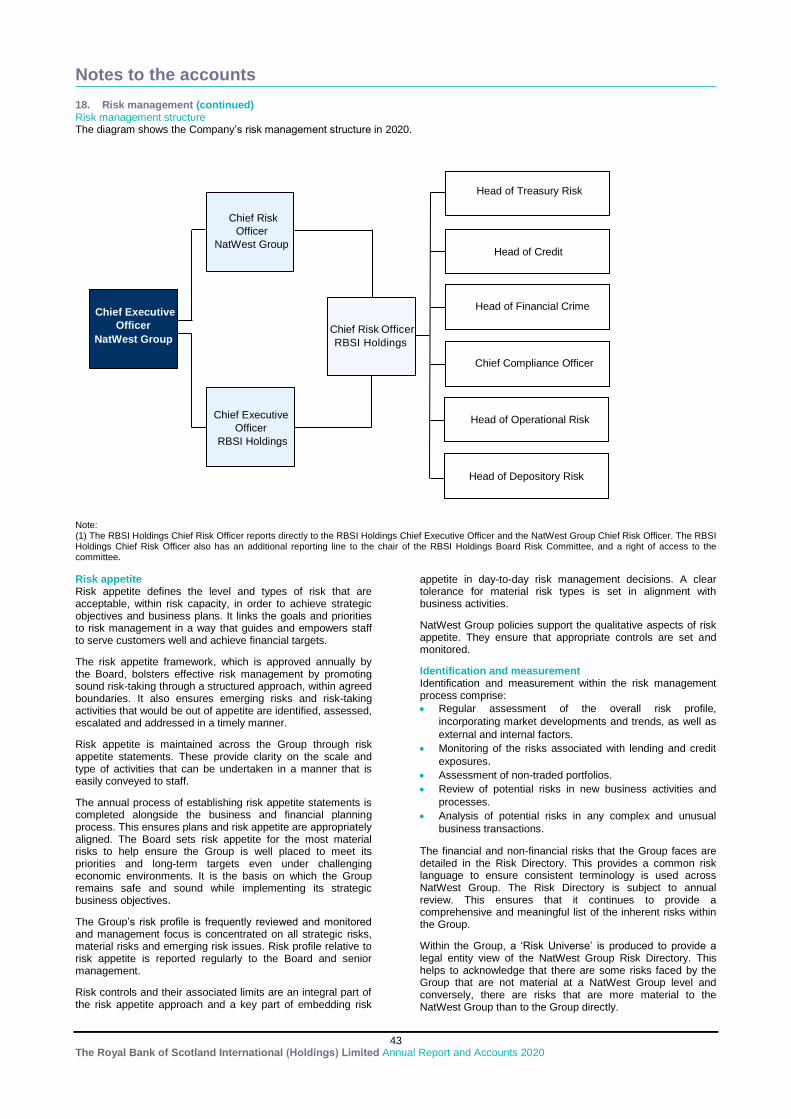
Notes to the accounts
43 The Royal Bank of Scotland International (Holdings) Limited Annual Report and Accounts 2020
18. Risk management (continued) Risk management structure The diagram shows the Company’s risk management structure in 2020.
Note: (1) The RBSI Holdings Chief Risk Officer reports directly to the RBSI Holdings Chief Executive Officer and the NatWest Group Chief Risk Officer. The RBSI Holdings Chief Risk Officer also has an additional reporting line to the chair of the RBSI Holdings Board Risk Committee, and a right of access to the committee.
Risk appetite Risk appetite defines the level and types of risk that are acceptable, within risk capacity, in order to achieve strategic objectives and business plans. It links the goals and priorities to risk management in a way that guides and empowers staff to serve customers well and achieve financial targets.
The risk appetite framework, which is approved annually by the Board, bolsters effective risk management by promoting sound risk-taking through a structured approach, within agreed boundaries. It also ensures emerging risks and risk-taking activities that would be out of appetite are identified, assessed, escalated and addressed in a timely manner.
Risk appetite is maintained across the Group through risk appetite statements. These provide clarity on the scale and type of activities that can be undertaken in a manner that is easily conveyed to staff.
The annual process of establishing risk appetite statements is completed alongside the business and financial planning process. This ensures plans and risk appetite are appropriately aligned. The Board sets risk appetite for the most material risks to help ensure the Group is well placed to meet its priorities and long-term targets even under challenging economic environments. It is the basis on which the Group remains safe and sound while implementing its strategic business objectives.
The Group’s risk profile is frequently reviewed and monitored and management focus is concentrated on all strategic risks, material risks and emerging risk issues. Risk profile relative to risk appetite is reported regularly to the Board and senior management.
Risk controls and their associated limits are an integral part of the risk appetite approach and a key part of embedding risk
appetite in day-to-day risk management decisions. A clear tolerance for material risk types is set in alignment with business activities.
NatWest Group policies support the qualitative aspects of risk appetite. They ensure that appropriate controls are set and monitored.
Identification and measurement Identification and measurement within the risk management process comprise:
Regular assessment of the overall risk profile,
incorporating market developments and trends, as well as
external and internal factors.
Monitoring of the risks associated with lending and credit
exposures.
Assessment of non-traded portfolios.
Review of potential risks in new business activities and
processes.
Analysis of potential risks in any complex and unusual
business transactions.
The financial and non-financial risks that the Group faces are detailed in the Risk Directory. This provides a common risk language to ensure consistent terminology is used across NatWest Group. The Risk Directory is subject to annual review. This ensures that it continues to provide a comprehensive and meaningful list of the inherent risks within the Group.
Within the Group, a ‘Risk Universe’ is produced to provide a legal entity view of the NatWest Group Risk Directory. This helps to acknowledge that there are some risks faced by the Group that are not material at a NatWest Group level and conversely, there are risks that are more material to the NatWest Group than to the Group directly.
Chief Executive
RBSI Holdings
Chief Risk Officer
NatWest Group
RBSIH Chief Executive
Chief Risk Officer RBSI Holdings
Head of Operational Risk
Chief Compliance Officer
Head of Credit
Head of Financial Crime
Head of Treasury Risk
Chief Executive
Officer NatWest Group
Chief Executive
Officer
RBSI Holdings
Head of Depository Risk
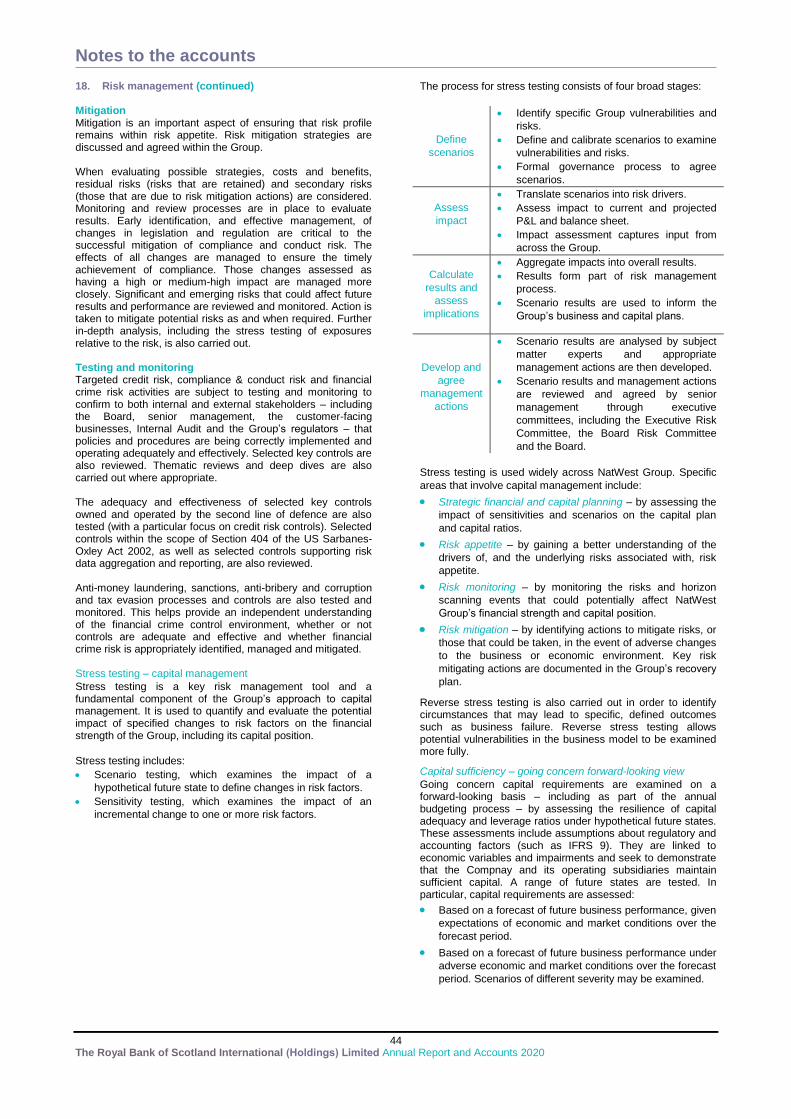
Notes to the accounts
44 The Royal Bank of Scotland International (Holdings) Limited Annual Report and Accounts 2020
18. Risk management (continued) Mitigation Mitigation is an important aspect of ensuring that risk profile remains within risk appetite. Risk mitigation strategies are discussed and agreed within the Group. When evaluating possible strategies, costs and benefits, residual risks (risks that are retained) and secondary risks (those that are due to risk mitigation actions) are considered. Monitoring and review processes are in place to evaluate results. Early identification, and effective management, of changes in legislation and regulation are critical to the successful mitigation of compliance and conduct risk. The effects of all changes are managed to ensure the timely achievement of compliance. Those changes assessed as having a high or medium-high impact are managed more closely. Significant and emerging risks that could affect future results and performance are reviewed and monitored. Action is taken to mitigate potential risks as and when required. Further in-depth analysis, including the stress testing of exposures relative to the risk, is also carried out. Testing and monitoring Targeted credit risk, compliance & conduct risk and financial crime risk activities are subject to testing and monitoring to confirm to both internal and external stakeholders – including the Board, senior management, the customer-facing businesses, Internal Audit and the Group’s regulators – that policies and procedures are being correctly implemented and operating adequately and effectively. Selected key controls are also reviewed. Thematic reviews and deep dives are also carried out where appropriate. The adequacy and effectiveness of selected key controls owned and operated by the second line of defence are also tested (with a particular focus on credit risk controls). Selected controls within the scope of Section 404 of the US Sarbanes-Oxley Act 2002, as well as selected controls supporting risk data aggregation and reporting, are also reviewed. Anti-money laundering, sanctions, anti-bribery and corruption and tax evasion processes and controls are also tested and monitored. This helps provide an independent understanding of the financial crime control environment, whether or not controls are adequate and effective and whether financial crime risk is appropriately identified, managed and mitigated. Stress testing – capital management
Stress testing is a key risk management tool and a fundamental component of the Group’s approach to capital management. It is used to quantify and evaluate the potential impact of specified changes to risk factors on the financial strength of the Group, including its capital position.
Stress testing includes:
Scenario testing, which examines the impact of a
hypothetical future state to define changes in risk factors.
Sensitivity testing, which examines the impact of an
incremental change to one or more risk factors.
The process for stress testing consists of four broad stages:
Define
scenarios
Identify specific Group vulnerabilities and
risks.
Define and calibrate scenarios to examine
vulnerabilities and risks.
Formal governance process to agree
scenarios.
Assess
impact
Translate scenarios into risk drivers.
Assess impact to current and projected
P&L and balance sheet.
Impact assessment captures input from
across the Group.
Calculate
results and
assess
implications
Aggregate impacts into overall results.
Results form part of risk management
process.
Scenario results are used to inform the
Group’s business and capital plans.
Develop and
agree
management
actions
Scenario results are analysed by subject
matter experts and appropriate
management actions are then developed.
Scenario results and management actions
are reviewed and agreed by senior
management through executive
committees, including the Executive Risk
Committee, the Board Risk Committee
and the Board.
Stress testing is used widely across NatWest Group. Specific
areas that involve capital management include:
Strategic financial and capital planning – by assessing the
impact of sensitivities and scenarios on the capital plan
and capital ratios.
Risk appetite – by gaining a better understanding of the
drivers of, and the underlying risks associated with, risk
appetite.
Risk monitoring – by monitoring the risks and horizon
scanning events that could potentially affect NatWest
Group’s financial strength and capital position.
Risk mitigation – by identifying actions to mitigate risks, or
those that could be taken, in the event of adverse changes
to the business or economic environment. Key risk
mitigating actions are documented in the Group’s recovery
plan.
Reverse stress testing is also carried out in order to identify circumstances that may lead to specific, defined outcomes such as business failure. Reverse stress testing allows potential vulnerabilities in the business model to be examined more fully.
Capital sufficiency – going concern forward-looking view
Going concern capital requirements are examined on a forward-looking basis – including as part of the annual budgeting process – by assessing the resilience of capital adequacy and leverage ratios under hypothetical future states. These assessments include assumptions about regulatory and accounting factors (such as IFRS 9). They are linked to economic variables and impairments and seek to demonstrate that the Compnay and its operating subsidiaries maintain sufficient capital. A range of future states are tested. In particular, capital requirements are assessed:
Based on a forecast of future business performance, given
expectations of economic and market conditions over the
forecast period.
Based on a forecast of future business performance under
adverse economic and market conditions over the forecast
period. Scenarios of different severity may be examined.
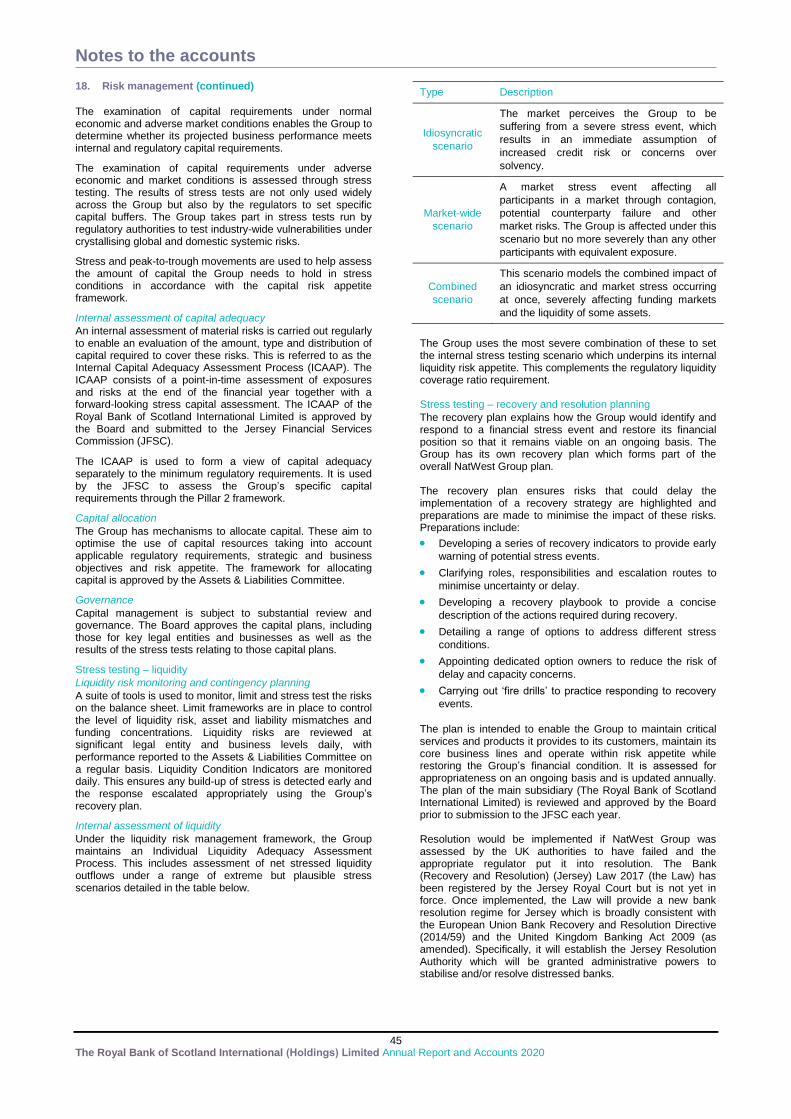
Notes to the accounts
45 The Royal Bank of Scotland International (Holdings) Limited Annual Report and Accounts 2020
18. Risk management (continued)
The examination of capital requirements under normal economic and adverse market conditions enables the Group to determine whether its projected business performance meets internal and regulatory capital requirements.
The examination of capital requirements under adverse economic and market conditions is assessed through stress testing. The results of stress tests are not only used widely across the Group but also by the regulators to set specific capital buffers. The Group takes part in stress tests run by regulatory authorities to test industry-wide vulnerabilities under crystallising global and domestic systemic risks.
Stress and peak-to-trough movements are used to help assess the amount of capital the Group needs to hold in stress conditions in accordance with the capital risk appetite framework.
Internal assessment of capital adequacy
An internal assessment of material risks is carried out regularly to enable an evaluation of the amount, type and distribution of capital required to cover these risks. This is referred to as the Internal Capital Adequacy Assessment Process (ICAAP). The ICAAP consists of a point-in-time assessment of exposures and risks at the end of the financial year together with a forward-looking stress capital assessment. The ICAAP of the Royal Bank of Scotland International Limited is approved by the Board and submitted to the Jersey Financial Services Commission (JFSC).
The ICAAP is used to form a view of capital adequacy separately to the minimum regulatory requirements. It is used by the JFSC to assess the Group’s specific capital requirements through the Pillar 2 framework.
Capital allocation
The Group has mechanisms to allocate capital. These aim to optimise the use of capital resources taking into account applicable regulatory requirements, strategic and business objectives and risk appetite. The framework for allocating capital is approved by the Assets & Liabilities Committee.
Governance
Capital management is subject to substantial review and governance. The Board approves the capital plans, including those for key legal entities and businesses as well as the results of the stress tests relating to those capital plans.
Stress testing – liquidity
Liquidity risk monitoring and contingency planning
A suite of tools is used to monitor, limit and stress test the risks on the balance sheet. Limit frameworks are in place to control the level of liquidity risk, asset and liability mismatches and funding concentrations. Liquidity risks are reviewed at significant legal entity and business levels daily, with performance reported to the Assets & Liabilities Committee on a regular basis. Liquidity Condition Indicators are monitored daily. This ensures any build-up of stress is detected early and the response escalated appropriately using the Group’s recovery plan.
Internal assessment of liquidity
Under the liquidity risk management framework, the Group maintains an Individual Liquidity Adequacy Assessment Process. This includes assessment of net stressed liquidity outflows under a range of extreme but plausible stress scenarios detailed in the table below.
Type Description
Idiosyncratic
scenario
The market perceives the Group to be
suffering from a severe stress event, which
results in an immediate assumption of
increased credit risk or concerns over
solvency.
Market-wide
scenario
A market stress event affecting all
participants in a market through contagion,
potential counterparty failure and other
market risks. The Group is affected under this
scenario but no more severely than any other
participants with equivalent exposure.
Combined
scenario
This scenario models the combined impact of
an idiosyncratic and market stress occurring
at once, severely affecting funding markets
and the liquidity of some assets.
The Group uses the most severe combination of these to set the internal stress testing scenario which underpins its internal liquidity risk appetite. This complements the regulatory liquidity coverage ratio requirement. Stress testing – recovery and resolution planning
The recovery plan explains how the Group would identify and respond to a financial stress event and restore its financial position so that it remains viable on an ongoing basis. The Group has its own recovery plan which forms part of the overall NatWest Group plan. The recovery plan ensures risks that could delay the implementation of a recovery strategy are highlighted and preparations are made to minimise the impact of these risks. Preparations include:
Developing a series of recovery indicators to provide early
warning of potential stress events.
Clarifying roles, responsibilities and escalation routes to
minimise uncertainty or delay.
Developing a recovery playbook to provide a concise
description of the actions required during recovery.
Detailing a range of options to address different stress
conditions.
Appointing dedicated option owners to reduce the risk of
delay and capacity concerns.
Carrying out ‘fire drills’ to practice responding to recovery
events.
The plan is intended to enable the Group to maintain critical services and products it provides to its customers, maintain its core business lines and operate within risk appetite while restoring the Group’s financial condition. It is assessed for appropriateness on an ongoing basis and is updated annually. The plan of the main subsidiary (The Royal Bank of Scotland International Limited) is reviewed and approved by the Board prior to submission to the JFSC each year. Resolution would be implemented if NatWest Group was assessed by the UK authorities to have failed and the appropriate regulator put it into resolution. The Bank (Recovery and Resolution) (Jersey) Law 2017 (the Law) has been registered by the Jersey Royal Court but is not yet in force. Once implemented, the Law will provide a new bank resolution regime for Jersey which is broadly consistent with the European Union Bank Recovery and Resolution Directive (2014/59) and the United Kingdom Banking Act 2009 (as amended). Specifically, it will establish the Jersey Resolution Authority which will be granted administrative powers to stabilise and/or resolve distressed banks.

Notes to the accounts
46 The Royal Bank of Scotland International (Holdings) Limited Annual Report and Accounts 2020
18. Risk management (continued) Stress testing – non-traded market risk
The Company produces an internal scenario analysis as part of its financial planning cycles. Non-traded exposures are capitalised through the ICAAP. This covers gap risk, basis risk, credit spread risk, pipeline risk, structural foreign exchange risk, prepayment risk, equity risk and accounting volatility risk. The ICAAP is completed with a combination of value and earnings measures. The total non-traded market risk capital requirement is determined by adding the different charges for each sub risk type. The ICAAP methodology captures at least ten years of historical volatility, produced with a 99% confidence level. Methodologies are reviewed by NatWest Group Model Risk and the results are approved by the NatWest Group Technical Asset & Liability Management Committee. Credit risk Definition Credit risk is the risk that customers and counterparties fail to meet their contractual obligation to settle outstanding amounts. Sources of risk The Group has exposure to entities by making placements and advances to those counterparties. The Board reviews the placement of deposits to other legal entities in NatWest Group. The NatWest Group is majority owned by the UK Government and draws on support provided by central banks where required in order to meet its commitments including those to the Group. The Group also has exposure to the Bank of England, the Central Bank of Luxembourg, US correspondent banks and to the UK, US and various eurozone governments through holding government bonds in its liquid asset portfolio. These exposures are also reviewed by the Board of Directors.
Governance The Credit Risk function provides oversight of frontline credit risk management activities. Governance activities include:
Defining credit risk appetite for the management of
concentration risk and credit policy to establish the key
causes of risk in the process of providing credit and the
controls that must be in place to mitigate them.
Approving and monitoring credit limits.
Oversight of the first line of defence to ensure that credit
risk remains within the appetite set by the Board and that
controls are being operated adequately and effectively.
Assessing the adequacy of expected credit loss (ECL)
provisions including approving any necessary in-model
and post model adjustments through the Provisions
Committee.
Risk appetite Credit risk appetite aligns to the strategic risk appetite set by the Board and is set and monitored through risk appetite frameworks. Personal The Personal credit risk appetite framework sets limits that measure and control the quality and concentration of both existing and new business for each relevant business segment. The actual performance of each portfolio is tracked relative to these limits and management action is taken where necessary. In the Group, the limits specifically measure exposure, new business growth and expected loss. Wholesale
For Wholesale credit, the framework has been designed to reflect factors that influence the ability to operate within risk appetite. Tools such as stress testing and economic capital are used to measure credit risk volatility and develop links between the framework and risk appetite limits.
Four formal frameworks are used, classifying, measuring and monitoring credit risk exposure across single name, sector and country concentrations and product and asset classes with heightened risk characteristics. The framework is supported by a suite of transactional acceptance standards that set out the risk parameters within which businesses should operate. Credit policy standards are in place for both the Wholesale and Personal portfolios. They are expressed as a set of mandatory controls.
Identification and measurement Credit stewardship Risks are identified through relationship management and credit stewardship of customers and portfolios. Credit risk stewardship takes place throughout the customer relationship, beginning with the initial approval. It includes the application of credit assessment standards, credit risk mitigation and collateral, ensuring that credit documentation is complete and appropriate, carrying out regular portfolio or customer reviews and problem debt identification and management. Additional stewardship measures were put in place in response to COVID-19. Refer to the Impact of COVID-19 section for further details.
Asset quality All credit grades map to an asset quality scale, used for financial reporting. Performing loans are defined as AQ1-AQ9 (where the probability of default (PD) is less than 100%) and defaulted non-performing loans as AQ10 or Stage 3 under IFRS 9 (where the PD is 100%). Loans are defined as defaulted when the payment status becomes 90 days past due, or earlier if there is clear evidence that the borrower is unlikely to repay, for example bankruptcy or insolvency.
Counterparty credit risk
The Group mitigates counterparty credit risk through collateralisation and netting agreements, which allow amounts owed by the Group to a counterparty to be netted against amounts the counterparty owes the Group.
Mitigation Mitigation techniques, as set out in the appropriate credit policies and transactional acceptance standards, are used in the management of credit portfolios across the Group. These techniques mitigate credit concentrations in relation to an individual customer, a borrower group or a collection of related borrowers. Where possible, customer credit balances are netted against obligations. Mitigation tools can include structuring a security interest in a physical or financial asset, the use of credit derivatives including credit default swaps, credit-linked debt instruments and securitisation structures, and the use of guarantees and similar instruments (for example, credit insurance) from related and third parties. Property is used to mitigate credit risk across a number of portfolios, in particular residential mortgage lending and commercial real estate (CRE).
The valuation methodologies for collateral in the form of residential mortgage property and CRE are detailed below.
Residential mortgages – The Group takes collateral in the form of residential property to mitigate the credit risk arising from mortgages. The Group values residential property during the loan underwriting process by appraising properties individually.
Commercial real estate valuations – The Group has a panel of chartered surveying firms that cover the spectrum of geography and property sectors in which the Group takes collateral. Suitable valuers for particular assets are contracted through a single service agreement to ensure consistency of quality and advice. Valuations are generally commissioned when an asset is taken as security; a material increase in a facility is requested; or a default event is anticipated or has occurred.
Notes to the accounts
47 The Royal Bank of Scotland International (Holdings) Limited Annual Report and Accounts 2020
18. Risk management (continued) Credit risk continued Assessment and monitoring Practices for credit stewardship – including credit assessment, approval and monitoring as well as the identification and management of problem debts – differ between the Personal and Wholesale portfolios. Personal Personal customers are served through a lending approach that entails offering a large number of small-value loans. To ensure that these lending decisions are made consistently, the Group analyses internal credit information as well as external data supplied by credit reference agencies (including historical debt servicing behaviour of customers with respect to both the Group and other lenders). The Group then sets its lending rules accordingly, developing different rules for different products. The process is then largely automated, with each customer receiving an individual credit score that reflects both internal and external behaviours and this score is compared with the lending rules set. For relatively high-value, complex personal loans, including residential mortgage lending, credit managers make the final lending decisions. These decisions are made within specified delegated authority limits that are issued dependent on the experience of the individual. Underwriting standards and portfolio performance are monitored on an ongoing basis to ensure they remain adequate in the current market environment and are not weakened materially to sustain growth. Wholesale Wholesale customers are grouped by industry sectors and geography as well as by product/asset class and are managed on an individual basis. Customers are aggregated as a single risk when sufficiently interconnected. A credit assessment is carried out before credit facilities are made available to customers. The assessment process is dependent on the complexity of the transaction. Credit approvals are subject to environmental, social and governance risk policies which restrict exposure to certain highly carbon intensive industries as well as those with potentially heightened reputational impacts. Transactional acceptance standards provide detailed transactional lending and risk acceptance metrics and structuring guidance. As such, these standards provide a mechanism to manage risk appetite at the customer/transaction level and are supplementary to the established credit risk appetite. PD and loss given default (LGD) are reviewed and if appropriate re-approved annually. The review process assesses borrower performance, including reconfirmation or adjustment of risk parameter estimates; the adequacy of security; compliance with terms and conditions; and refinancing risk. Problem debt management Personal Early problem identification Pre-emptive triggers are in place to help identify customers that may be at risk of being in financial difficulty. These triggers are both internal, using the Group’s data, and external using information from credit reference agencies. Proactive contact is then made with the customer to establish if they require help with managing their finances. By adopting this approach, the aim is to prevent a customer’s financial position deteriorating which may then require intervention from the Collections and Recoveries teams.
Personal customers experiencing financial difficulty are managed by the Collections team. If the Collections team is unable to provide appropriate support after discussing suitable options with the customer, management of that customer moves to the Recoveries team. If at any point in the collections and recoveries process the customer is determined as being potentially vulnerable, they will be identified as such and provided support by suitably experienced colleagues, to ensure they receive the appropriate support for their circumstances. Collections When a customer exceeds an agreed limit or misses a regular monthly payment the customer is contacted by the Group and requested to remedy the position. If the situation is not regularised then, where appropriate, the Collections team will become more fully involved and the customer will be supported by skilled debt management staff who endeavour to provide customers with bespoke solutions. Solutions include short-term account restructuring, refinance loans and forbearance which can include interest suspension and ‘breathing space’. In the event that an affordable/sustainable agreement with a customer cannot be reached, the debt will transition to the Recoveries team. For provisioning purposes, under IFRS 9, exposure to customers managed by the Collections team is categorised as Stage 2 and subject to a lifetime loss assessment, unless it is 90 days past due or has an interest non-accrual status, in which case it is categorised as Stage 3. Recoveries The Recoveries team will issue a notice of intention to default to the customer and, if appropriate, a formal demand, while also registering the account with credit reference agencies where appropriate. Following this, the customer’s debt may then be placed with a third-party debt collection agency, or alternatively a solicitor, in order to agree an affordable repayment plan with the customer. An option that may also be considered, is the sale of unsecured debt. Exposures subject to formal debt recovery are defaulted and categorised as Stage 3 impaired. Wholesale Early problem identification Each sector has defined early warning indicators to identify customers experiencing financial difficulty, and to increase monitoring if needed. Early warning indicators may be internal, such as a customer’s bank account activity, or external, such as a publicly-listed customer’s share price. If early warning indicators show a customer is experiencing potential or actual difficulty, or if relationship managers or credit officers identify other signs of financial difficulty, they may decide to classify the customer within the Risk of Credit Loss framework. Risk of Credit Loss framework
The Risk of Credit Loss framework is used where the credit profile of a Wholesale customer has deteriorated materially since origination. Experienced credit risk officers apply expert judgement to classify cases into categories that reflect progressively deteriorating credit risk. There are two classifications in the framework that apply to non-defaulted customers – Heightened Monitoring and Risk of Credit Loss. For the purposes of provisioning, all exposures subject to the framework are categorised as Stage 2 and subject to a lifetime loss assessment. The framework also applies to those customers that have met the Group’s default criteria (AQ10 exposures). Defaulted exposures are categorised as Stage 3 impaired for provisioning purposes. Customers classified in the Heightened Monitoring category are those who are still performing but have certain characteristics – such as trading issues, covenant breaches, material PD downgrades and past due facilities – that may affect the ability to meet repayment obligations. Heightened

Notes to the accounts
48 The Royal Bank of Scotland International (Holdings) Limited Annual Report and Accounts 2020
18. Risk management (continued) Credit risk continued
Monitoring customers require pre-emptive actions to return or maintain their facilities within risk appetite prior to maturity. Risk of Credit Loss customers are performing customers that have met the criteria for Heightened Monitoring and also pose a risk of credit loss to the Group in the next 12 months should mitigating action not be taken or not be successful.
Once classified as either Heightened Monitoring or Risk of Credit Loss, a number of mandatory actions are taken – including a review of the customer’s credit grade, facility and security documentation and the valuation of security. Depending on the severity of the financial difficulty and the size of the exposure, the customer relationship strategy is reassessed by credit officers, by specialist credit risk or relationship management units in the relevant business, or by Restructuring. Restructuring Where customers are categorised as Risk of Credit Loss, relationships are mainly managed by the Restructuring team. The purpose of Restructuring is to protect the Group’s capital. Restructuring does this by working with customers in financial difficulty on their restructuring and repayment strategies. Restructuring will always aim to recover capital fairly and efficiently. Specialists in Restructuring work with customers experiencing financial difficulties and showing signs of financial stress. Throughout Restructuring’s involvement, the mainstream relationship manager will remain an integral part of the customer relationship, unless a repayment strategy is deemed appropriate. The objective is to find a mutually acceptable solution, including restructuring of existing facilities, repayment or refinancing. Where a solvent outcome is not possible, insolvency may be considered as a last resort. However, helping the customer return to financial health and restoring a normal banking relationship is always the preferred outcome. Forbearance Forbearance takes place when a concession is made on the contractual terms of a loan/debt in response to a customer’s financial difficulties. The aim of forbearance is to support and restore the customer to financial health while minimising risk. To ensure that forbearance is appropriate for the needs of the customer, minimum standards are applied when assessing, recording, monitoring and reporting forbearance. A credit exposure may be forborne more than once, generally where a temporary concession has been granted and circumstances warrant another temporary or permanent revision of the loan’s terms. In the Personal portfolio, loans are reported as forborne until they meet the exit criteria set out by the European Banking Authority. These include being classified as performing for two years since the last forbearance event, making regular repayments and the loan/debt being less than 30 days past due. Types of forbearance Personal In the Personal portfolio, forbearance may involve payment concessions and loan rescheduling (including extensions in contractual maturity) and capitalisation of arrears. Forbearance support is provided for both mortgages and unsecured lending. Wholesale In the Wholesale portfolio, forbearance may involve covenant waivers, reductions to margins, payment concessions and loan
rescheduling (including extensions in contractual maturity), capitalisation of arrears, and debt forgiveness or debt-for-equity swaps. Monitoring of forbearance Personal For Personal portfolios, forborne loans are separated and regularly monitored and reported while the forbearance strategy is implemented, until they exit forbearance. Wholesale In the Wholesale portfolio, customer PDs and facility LGDs are reassessed prior to finalising any forbearance arrangement. The ultimate outcome of a forbearance strategy is highly dependent on the co-operation of the borrower and a viable business or repayment outcome. Where forbearance is no longer appropriate, the Group will consider other options such as the enforcement of security, insolvency proceedings or both, although these are options of last resort. Provisioning requirements on forbearance are detailed in the Provisioning for forbearance section. Impact of COVID-19 COVID-19 has necessitated various changes to the “business as usual” credit risk management approaches set out above. Specific adjustments made to credit risk management as a result of COVID-19 are set out below. Risk appetite Personal The onset of COVID-19 resulted in a significant deterioration in the economic outlook and consequently the credit environment. In response, credit risk appetite was tightened including changes to credit score acceptance thresholds and certain credit policy criteria, for example, maximum loan-to-values on new mortgage business. The criteria were reviewed and adapted on an ongoing basis throughout the year. Wholesale At the outset of COVID-19, Wholesale Credit Risk undertook a vulnerability assessment of sectors and conducted more frequent monitoring of these portfolios, including sub-sector and single name analysis. Additional oversight forums for both new and existing customer requests linked to sector, customer viability and transaction value were also introduced. Monitoring of government support scheme lending, including tracking customer lending journeys to prioritise resources, ensured customers could be supported in a timely manner. Risk appetite limits were reduced to reflect current risks and remain under constant review. Credit stewardship
Wholesale
The Group’s credit stewardship included carrying out regular portfolio or customer reviews and problem debt identification and management. In line with existing credit policy parameters, relationship managers were able to defer annual reviews for a maximum of three months. These deferrals were used during 2020 to provide capacity to focus on supporting government lending scheme requests. Customer review meetings took place virtually unless a specific customer request was made, prior approval obtained and a risk assessment carried out. Mitigation During COVID-19, valuers were prohibited from conducting physical property inspections. As a result, mortgage application processing was suspended where a physical valuation was required. Following the easing of restrictions, the application backlog was cleared once valuers were able to safely return to physical property inspections.
Notes to the accounts
49 The Royal Bank of Scotland International (Holdings) Limited Annual Report and Accounts 2020
18. Risk management (continued)
Credit risk continued Assessment and monitoring Personal Reflecting the deteriorated economic outlook, underwriting standards were tightened.
Customers requesting a COVID-19 related payment holiday were not subject to a credit assessment for those requests.
Portfolio performance monitoring was expanded to include insight on customers accessing payment holiday support and their performance at the end of the payment holiday period).
Wholesale The Group established guidance on credit grading in response to COVID-19 to ensure consistent and fair outcomes for customers, whilst appropriately reflecting the economic outlook.
Within the Wholesale portfolio, customer credit grades
were reassessed when a request for financing was made,
a scheduled customer credit review undertaken or a
material event specific to that customer occurred.
A request for support using one of the government-backed
COVID-19 support schemes was not, in itself, a reason for
a customer’s credit grade to be amended.
Large or complex customers were graded using financial
forecasts, incorporating both the effect of COVID-19 and
the estimated length of time to return to within credit
appetite metrics.
All other customers who were not subject to any wider
significant increase in credit risk (SICR) triggers and who
were assessed as having the ability in the medium-term
post-COVID-19 to be viable and meet credit appetite
metrics were graded using financial information for the
previous 12 month period.
The Group identified those customers for whom additional
borrowing would require remedial action to return to within
risk appetite over the medium term, and customers who
were exhibiting signs of financial stress before COVID-19.
These customers were graded with reference to the impact
COVID-19 had on their business.
Within the Wholesale portfolio, additional monitoring was implemented to identify and monitor specific sectors which had been particularly adversely affected by COVID-19 and the use of government support schemes.
Problem debt management Personal In accordance with regulatory guidance, Personal customers were able to obtain a payment holiday of up to three months, twice, if requested. Such payment holidays would not necessarily have been considered forbearance (refer to Forbearance below).
In addition, the Group suspended new formal repossession recovery action for Personal customers.
Wholesale In response to COVID-19, a new framework was introduced to categorise clients in a consistent manner across the Wholesale portfolio, based on the impact of COVID-19 on their financial position and outlook in relation to the sector risk appetite. This framework was extended to all Wholesale customers and supplemented the Risk of Credit Loss framework in assessing whether customers exhibited a SICR, and if support was considered to be granting forbearance.
Forbearance Personal In the absence of any other forbearance or SICR triggers, customers granted COVID-19 related payment holidays were not considered forborne and were not subject to Collections team engagement.
Wholesale Customers seeking COVID-19 related support, including payment holidays, who were not subject to any wider SICR triggers and who were assessed as having the ability in the medium term post-COVID-19 to be viable and meet credit appetite metrics, were not considered to have been granted forbearance.
ECL modelling The unprecedented nature of COVID-19 required various interventions in ECL modelling to ensure reasonable and supportable ECL estimates. These are detailed in the Governance and post model adjustments section.
Credit grading models Credit grading models is the collective term used to describe all models, frameworks and methodologies used to calculate probability of default (PD), exposure at default (EAD), loss given default (LGD), maturity and the production of credit grades. Credit grading models are designed to provide:
An assessment of customer and transaction
characteristics.
A meaningful differentiation of credit risk.
Accurate internal default, loss and EAD estimates that are
used in the capital calculation or wider risk management
purposes.
Impairment, provisioning and write-offs In the overall assessment of credit risk, impairment provisioning and write-offs are used as key indicators of credit quality. The approach that the Group adopts in relation to the calculation of ECL within Personal includes the use of PD and LGD benchmarks. Refer to Personal non-modelled portfolio for further details. The Group’s IFRS 9 provisioning models, which used existing Basel models as a starting point, incorporate term structures and forward-looking information. Regulatory conservatism within the Basel models has been removed as appropriate to comply with the IFRS 9 requirement for unbiased ECL estimates. Five key areas may materially influence the measurement of credit impairment under IFRS 9 – two of these relate to model build and three relate to model application:
Model build:
The determination of economic indicators that have most
influence on credit loss for each portfolio and the
severity of impact (this leverages existing stress testing
models which are reviewed annually).
The build of term structures to extend the determination
of the risk of loss beyond 12 months that will influence
the impact of lifetime loss for assets in Stage 2.
Model application:
The assessment of the SICR and the formation of a
framework capable of consistent application.
The determination of asset lifetimes that reflect
behavioural characteristics while also representing
management actions and processes (using historical
data and experience).
The choice of forward-looking economic scenarios and
their respective probability weights.
Notes to the accounts
50 The Royal Bank of Scotland International (Holdings) Limited Annual Report and Accounts 2020
18. Risk management (continued) Credit risk continued IFRS 9 ECL model design principles Modelling of ECL for IFRS 9 follows the conventional approach to divide the problem of estimating credit losses for a given account into its component parts of PD, LGD and EAD. To meet IFRS 9 requirements, the PD, LGD and EAD parameters differ from their Pillar 1 internal ratings based counterparts in the following aspects:
Unbiased – material regulatory conservatism has been
removed from IFRS 9 parameters to produce unbiased
estimates.
Point-in-time – IFRS 9 parameters reflect actual economic
conditions at the reporting date instead of long-run
average or downturn conditions.
Forward-looking – IFRS 9 PD estimates and, where
appropriate, EAD and LGD estimates reflect forward-
looking economic conditions.
Tenor – IFRS 9 PD, LGD and EAD are provided as multi-
period term structures up to exposure lifetimes instead of a
fixed one-year horizon.
IFRS 9 requires that at each reporting date, an entity shall assess whether the credit risk on an account has increased significantly since initial recognition. Part of this assessment requires a comparison to be made between the current lifetime PD (i.e. the PD over the remaining lifetime at the reporting date) with the equivalent lifetime PD as determined at the date of initial recognition. For assets originated before IFRS 9 was introduced, comparable lifetime origination PDs did not exist. These have been retrospectively created using the relevant model inputs applicable at initial recognition. PD estimates Wholesale PD models use a point-in-time/through-the-cycle framework to convert one-year regulatory PDs into point-in-time estimates that accurately reflect economic conditions observed at the reporting date. The framework utilises credit cycle indices (CCIs) across a comprehensive set of region/industry segments. Further detail on CCIs is provided in the Economic loss drivers section. One year point-in-time PDs are subsequently extended to forward-looking lifetime PDs using a conditional transition matrix approach and a set of econometric models. LGD estimates The general approach for the IFRS 9 LGD models is to leverage corresponding Basel LGD models with bespoke adjustments to ensure estimates are unbiased and where relevant, forward-looking. Forward-looking economic information is incorporated into Wholesale LGD estimates using the existing CCI framework. For low default portfolios, including sovereigns and banks, loss data is too scarce to substantiate estimates that vary with economic conditions. Consequently, for these portfolios, LGD estimates are assumed to be constant throughout the projection horizon. EAD estimates Personal EAD is calculated as the maximum of the balance exposure, or
limit which has been factored up by a credit conversion factor
sourced from the benchmarked modelled portfolio.
Wholesale For Wholesale, EAD values are projected using product specific credit conversion factors (CCFs), closely following the
product segmentation and approach of the respective Basel model. However, the CCFs are estimated over multi-year time horizons to produce unbiased model estimates. No explicit forward-looking information is incorporated, on the basis that analysis has shown that temporal variations in CCFs are mainly attributable to changes in exposure management practices rather than economic conditions. Governance and post model adjustments The IFRS 9 PD, EAD and LGD models are subject to NatWest Group’s model risk policy that stipulates periodic model monitoring, periodic re-validation and defines approval procedures and authorities according to model materiality. Various post model adjustments (PMAs) were applied where management judged they were necessary to ensure an adequate level of overall ECL provision. All PMAs were subject to formal approval through provisioning governance, and were categorised as follows:
Deferred model calibrations – ECL adjustments where
model monitoring indicated that losses were being over
predicted but where it was judged that an implied ECL
release was not supportable. As a consequence, any
potential ECL release was deferred and retained on the
balance sheet.
Economic uncertainty – ECL adjustments primarily arising
from uncertainties associated with multiple economic
scenarios (also for 2019) and credit outcomes as a result
of the effect of COVID-19 and the consequences of
government interventions. In both cases, management
judged that additional ECL was required until further credit
performance data became available on the behavioural
and loss consequences of COVID-19.
Other adjustments – ECL adjustments where it was judged
that the modelled ECL required to be amended.
2020 2019
ECL post model adjustments £m £m
Deferred model calibrations — —
Economic uncertainty 7.1 1.3
Other adjustments 3.1 4.3
Total 10.2 5.6
Significant increase in credit risk (SICR)
Exposures that are considered significantly credit deteriorated since initial recognition are classified in Stage 2 and assessed for lifetime ECL measurement (exposures not considered deteriorated carry a 12 month ECL). The Group has adopted a framework to identify deterioration based primarily on relative movements in lifetime PD supported by additional qualitative backstops. The principles applied are consistent across the Group and align to credit risk management practices, where appropriate. The framework comprises the following elements:
IFRS 9 lifetime PD assessment (the primary driver) – on
modelled portfolios the assessment is based on the
relative deterioration in forward-looking lifetime PD and is
assessed monthly. To assess whether credit deterioration
has occurred, the residual lifetime PD at balance sheet
date (which PD is established at date of initial recognition)
is compared to the current PD. If the current lifetime PD
exceeds the residual origination PD by more than a
threshold amount deterioration is assumed to have
occurred and the exposure transferred to Stage 2 for a
lifetime loss assessment. For Wholesale, a doubling of PD
would indicate a SICR subject to a minimum PD uplift of
0.1%. For Personal portfolios, the criteria vary by risk
band, with lower risk exposures needing to deteriorate
more than higher risk exposures.

Notes to the accounts
51 The Royal Bank of Scotland International (Holdings) Limited Annual Report and Accounts 2020
18. Risk management (continued)
Credit risk continued
Qualitative high-risk backstops – the PD assessment is
complemented with the use of qualitative high-risk
backstops to further inform whether significant
deterioration in lifetime risk of default has occurred. The
qualitative high-risk backstop assessment includes the use
of the mandatory 30+ days past due backstop, as
prescribed by IFRS 9 guidance, and other features such
as forbearance support, Wholesale exposures managed
within the Risk of Credit Loss framework, and adverse
credit bureau results for Personal customers. Where a
Personal customer was granted a payment holiday (also
referred to as a payment deferral) in response to COVID-
19, they were not automatically transferred into Stage 2.
Wholesale customers accessing the various COVID-19
support mechanisms were assessed as detailed in the
Impact of COVID-19 section.
The criteria are based on a significant amount of empirical analysis and seek to meet three key objectives:
Criteria effectiveness – the criteria should be effective in
identifying significant credit deterioration and prospective
default population.
Stage 2 stability – the criteria should not introduce
unnecessary volatility in the Stage 2 population.
Portfolio analysis – the criteria should produce results
which are intuitive when reported as part of the wider
credit portfolio.
Provisioning for forbearance Personal The methodology used for provisioning in respect of Personal forborne loans will differ depending on whether the loans are performing or non-performing and which business is managing them due to local market conditions.
Granting forbearance will only change the arrears status of the loan in specific circumstances, which can include capitalisation of principal and interest in arrears, where the loan may be returned to the performing book if the customer has demonstrated an ability to meet regular payments and is likely to continue to do so.
The loan would continue to be reported as forborne until it meets the exit criteria set out by the European Banking Authority.
For ECL provisioning, all forborne but performing exposures are categorised as Stage 2 and are subject to a lifetime loss provisioning assessment.
For non-performing forborne loans, the Stage 3 loss assessment process is the same as for non-forborne loans.
In the absence of any other forbearance or SICR triggers,
customers granted COVID-19 related payment holidays were
not considered forborne. However, any support provided
beyond completion of a second payment holiday is considered
forbearance.
Wholesale Provisions for forborne loans are assessed in accordance with normal provisioning policies. The customer’s financial position and prospects – as well as the likely effect of the forbearance, including any concessions granted, and revised PD or LGD gradings – are considered in order to establish whether an impairment provision increase is required. Wholesale loans granted forbearance are individually assessed in most cases. Performing loans subject to forbearance treatment are categorised as Stage 2 and subject to a lifetime loss assessment. Forbearance may result in the value of the outstanding debt exceeding the present value of
the estimated future cash flows. This difference will lead to a customer being classified as non-performing. In the case of non-performing forborne loans, an individual loan impairment provision assessment generally takes place prior to forbearance being granted. The amount of the loan impairment provision may change once the terms of the forbearance are known, resulting in an additional provision charge or a release of the provision in the period the forbearance is granted.
The transfer of Wholesale loans from impaired to performing status follows assessment by relationship managers and credit. When no further losses are anticipated and the customer is expected to meet the loan’s revised terms, any provision is written-off or released and the balance of the loan returned to performing status. This is not dependent on a specified time period and follows the credit risk manager’s assessment.
Customers seeking COVID-19 related support, including payment holidays, who were not subject to any wider SICR triggers and who were assessed as having the ability in the medium term post-COVID-19 to be viable and meet credit appetite metrics, were not considered to have been granted forbearance. Refer to the Impact of COVID-19 section for further details.
Asset lifetimes
The choice of initial recognition and asset duration is another critical judgement in determining the quantum of lifetime losses that apply. The date of initial recognition reflects the date that a transaction (or account) was first recognised on the balance sheet; the PD recorded at that time provides the baseline used for subsequent determination of SICR as detailed above. For asset duration, the approach applied for term lending (in line with IFRS 9 requirements) is the contractual maturity date, reduced for behavioural trends where appropriate (such as, expected prepayment and amortisation). Personal non-modelled portfolio RBSI Personal remains Basel standardised for risk-weighted assets, therefore modelled PDs and LGDs are not available for calculating Stage 1 and Stage 2 ECLs. Instead, this is performed by sourcing the equivalent product PD and LGD from within NatWest UK, which was identified as the closest comparable portfolio to RBSI Personal. The PD and LGD benchmarks are then used, along with the known exposure, to calculate an account level ECL. In order to identify accounts showing Stage 2 the RBSI Personal Watch classification is applied where accounts are identified as having clear signs of credit deterioration, increased risk of default or have been given forbearance, with days past due being checked as supplementary back stop. Economic loss drivers Introduction The portfolio segmentation and selection of economic loss drivers for IFRS 9 follow closely the approach used in stress testing. To enable robust modelling the forecasting models for each portfolio segment (defined by product or asset class and where relevant, industry sector and region) are based on a selected, small number of economic factors, (typically three to four) that best explain the temporal variations in portfolio loss rates. The process to select economic loss drivers involves empirical analysis and expert judgement. The most material economic loss drivers for Personal portfolios include unemployment rate, house price index, and base rate for the UK, including the Crown Dependencies, Isle of Man and Gibraltar.
In addition to some of these loss drivers, world GDP is a primary loss driver for Wholesale portfolios.
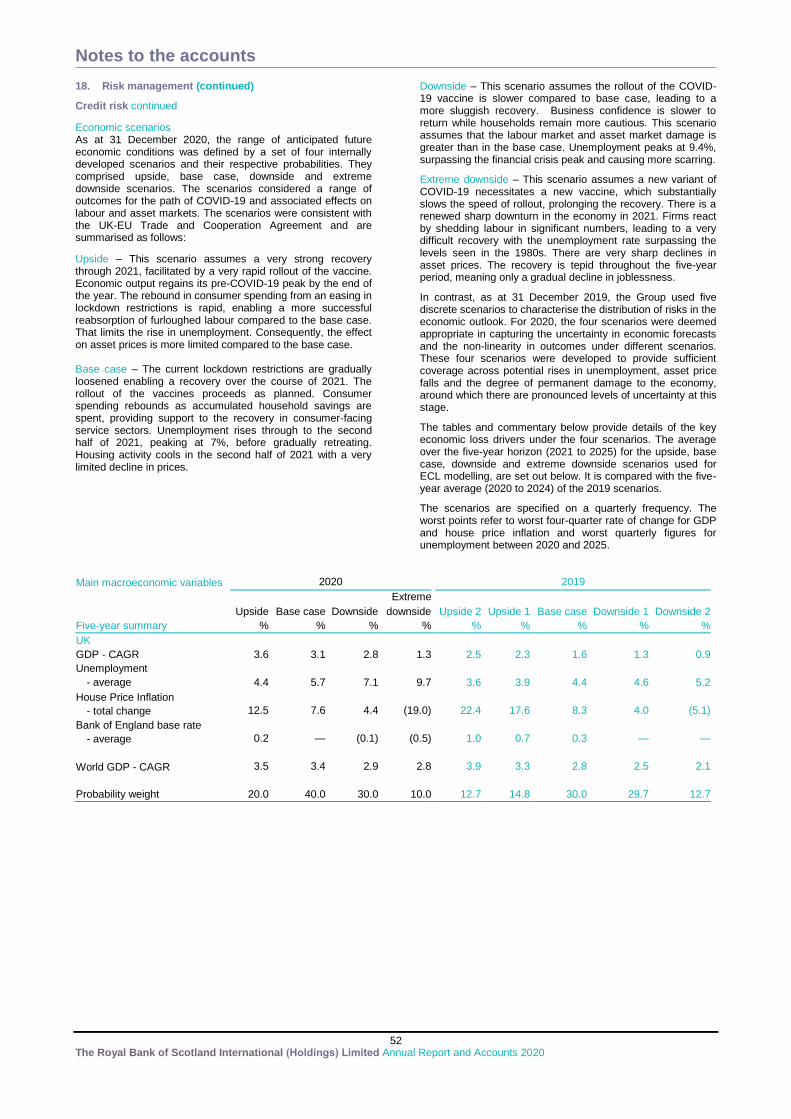
Notes to the accounts
52 The Royal Bank of Scotland International (Holdings) Limited Annual Report and Accounts 2020
18. Risk management (continued)
Credit risk continued
Economic scenarios As at 31 December 2020, the range of anticipated future economic conditions was defined by a set of four internally developed scenarios and their respective probabilities. They comprised upside, base case, downside and extreme downside scenarios. The scenarios considered a range of outcomes for the path of COVID-19 and associated effects on labour and asset markets. The scenarios were consistent with the UK-EU Trade and Cooperation Agreement and are summarised as follows:
Upside – This scenario assumes a very strong recovery through 2021, facilitated by a very rapid rollout of the vaccine. Economic output regains its pre-COVID-19 peak by the end of the year. The rebound in consumer spending from an easing in lockdown restrictions is rapid, enabling a more successful reabsorption of furloughed labour compared to the base case. That limits the rise in unemployment. Consequently, the effect on asset prices is more limited compared to the base case. Base case – The current lockdown restrictions are gradually loosened enabling a recovery over the course of 2021. The rollout of the vaccines proceeds as planned. Consumer spending rebounds as accumulated household savings are spent, providing support to the recovery in consumer-facing service sectors. Unemployment rises through to the second half of 2021, peaking at 7%, before gradually retreating. Housing activity cools in the second half of 2021 with a very limited decline in prices.
Downside – This scenario assumes the rollout of the COVID-19 vaccine is slower compared to base case, leading to a more sluggish recovery. Business confidence is slower to return while households remain more cautious. This scenario assumes that the labour market and asset market damage is greater than in the base case. Unemployment peaks at 9.4%, surpassing the financial crisis peak and causing more scarring.
Extreme downside – This scenario assumes a new variant of COVID-19 necessitates a new vaccine, which substantially slows the speed of rollout, prolonging the recovery. There is a renewed sharp downturn in the economy in 2021. Firms react by shedding labour in significant numbers, leading to a very difficult recovery with the unemployment rate surpassing the levels seen in the 1980s. There are very sharp declines in asset prices. The recovery is tepid throughout the five-year period, meaning only a gradual decline in joblessness.
In contrast, as at 31 December 2019, the Group used five discrete scenarios to characterise the distribution of risks in the economic outlook. For 2020, the four scenarios were deemed appropriate in capturing the uncertainty in economic forecasts and the non-linearity in outcomes under different scenarios. These four scenarios were developed to provide sufficient coverage across potential rises in unemployment, asset price falls and the degree of permanent damage to the economy, around which there are pronounced levels of uncertainty at this stage.
The tables and commentary below provide details of the key economic loss drivers under the four scenarios. The average over the five-year horizon (2021 to 2025) for the upside, base case, downside and extreme downside scenarios used for ECL modelling, are set out below. It is compared with the five-year average (2020 to 2024) of the 2019 scenarios.
The scenarios are specified on a quarterly frequency. The worst points refer to worst four-quarter rate of change for GDP and house price inflation and worst quarterly figures for unemployment between 2020 and 2025.
Main macroeconomic variables 2020 2019
Extreme
Upside Base case Downside downside Upside 2 Upside 1 Base case Downside 1 Downside 2
Five-year summary % % % %
% % % % %
UK
GDP - CAGR 3.6 3.1 2.8 1.3
2.5 2.3 1.6 1.3 0.9
Unemployment
- average 4.4 5.7 7.1 9.7
3.6 3.9 4.4 4.6 5.2
House Price Inflation
- total change 12.5 7.6 4.4 (19.0)
22.4 17.6 8.3 4.0 (5.1)
Bank of England base rate
- average 0.2 — (0.1) (0.5)
1.0 0.7 0.3 — —
World GDP - CAGR 3.5 3.4 2.9 2.8
3.9 3.3 2.8 2.5 2.1
Probability weight 20.0 40.0 30.0 10.0
12.7 14.8 30.0 29.7 12.7
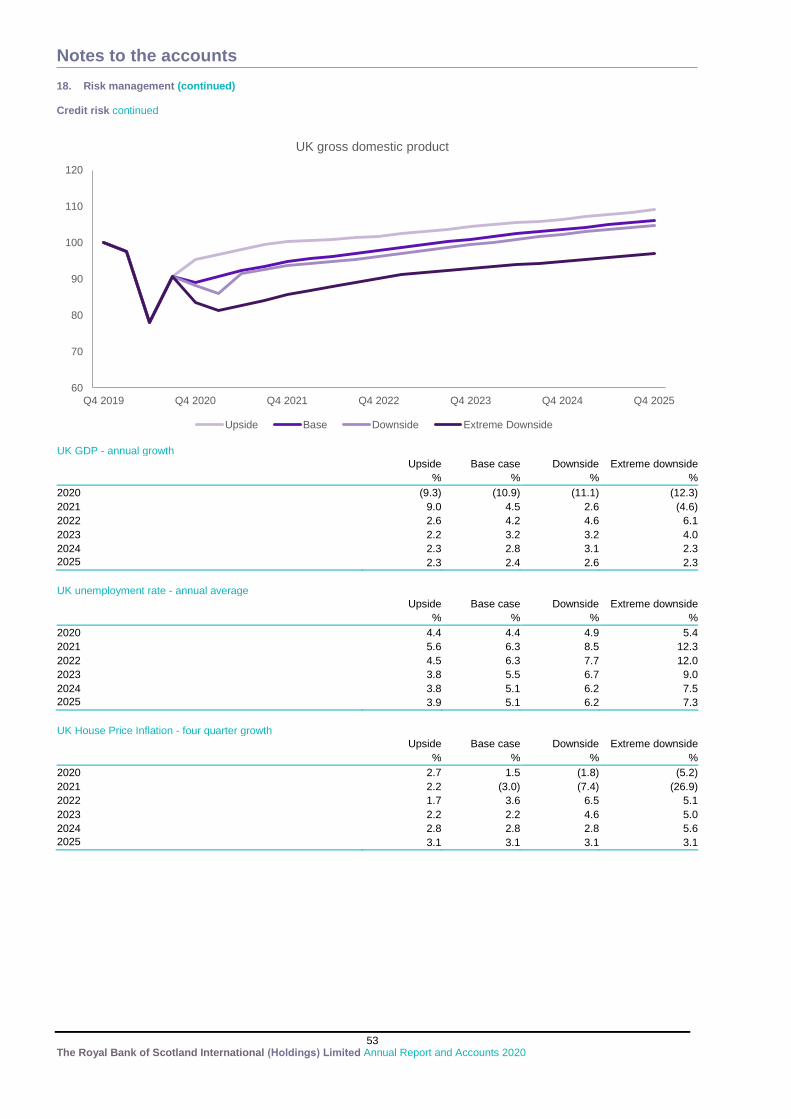
Notes to the accounts
53 The Royal Bank of Scotland International (Holdings) Limited Annual Report and Accounts 2020
18. Risk management (continued) Credit risk continued
UK GDP - annual growth
Upside Base case Downside Extreme downside
% % % %
2020 (9.3) (10.9) (11.1) (12.3)
2021 9.0 4.5 2.6 (4.6)
2022 2.6 4.2 4.6 6.1
2023 2.2 3.2 3.2 4.0
2024 2.3 2.8 3.1 2.3
2025 2.3 2.4 2.6 2.3
UK unemployment rate - annual average
Upside Base case Downside Extreme downside
% % % %
2020 4.4 4.4 4.9 5.4
2021 5.6 6.3 8.5 12.3
2022 4.5 6.3 7.7 12.0
2023 3.8 5.5 6.7 9.0
2024 3.8 5.1 6.2 7.5
2025 3.9 5.1 6.2 7.3
UK House Price Inflation - four quarter growth
Upside Base case Downside Extreme downside
% % % %
2020 2.7 1.5 (1.8) (5.2)
2021 2.2 (3.0) (7.4) (26.9)
2022 1.7 3.6 6.5 5.1
2023 2.2 2.2 4.6 5.0
2024 2.8 2.8 2.8 5.6
2025 3.1 3.1 3.1 3.1
60
70
80
90
100
110
120
Q4 2019 Q4 2020 Q4 2021 Q4 2022 Q4 2023 Q4 2024 Q4 2025
UK gross domestic product
Upside Base Downside Extreme Downside
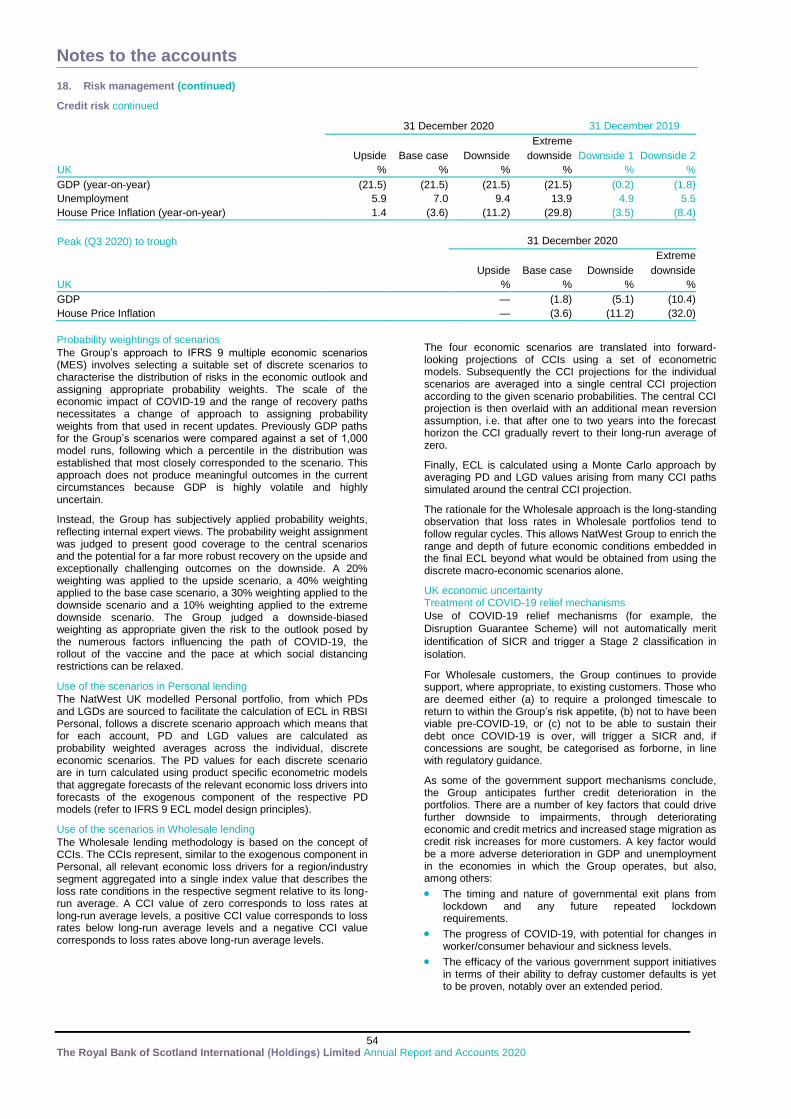
Notes to the accounts
54 The Royal Bank of Scotland International (Holdings) Limited Annual Report and Accounts 2020
18. Risk management (continued)
Credit risk continued
31 December 2020 31 December 2019
Extreme
Upside Base case Downside downside Downside 1 Downside 2
UK % % % % % %
GDP (year-on-year) (21.5) (21.5) (21.5) (21.5) (0.2) (1.8)
Unemployment 5.9 7.0 9.4 13.9 4.9 5.5
House Price Inflation (year-on-year) 1.4 (3.6) (11.2) (29.8) (3.5) (8.4)
Peak (Q3 2020) to trough
31 December 2020
Extreme
Upside Base case Downside downside
UK
% % % %
GDP
— (1.8) (5.1) (10.4)
House Price Inflation
— (3.6) (11.2) (32.0)
Probability weightings of scenarios
The Group’s approach to IFRS 9 multiple economic scenarios (MES) involves selecting a suitable set of discrete scenarios to characterise the distribution of risks in the economic outlook and assigning appropriate probability weights. The scale of the economic impact of COVID-19 and the range of recovery paths necessitates a change of approach to assigning probability weights from that used in recent updates. Previously GDP paths for the Group’s scenarios were compared against a set of 1,000 model runs, following which a percentile in the distribution was established that most closely corresponded to the scenario. This approach does not produce meaningful outcomes in the current circumstances because GDP is highly volatile and highly uncertain.
Instead, the Group has subjectively applied probability weights, reflecting internal expert views. The probability weight assignment was judged to present good coverage to the central scenarios and the potential for a far more robust recovery on the upside and exceptionally challenging outcomes on the downside. A 20% weighting was applied to the upside scenario, a 40% weighting applied to the base case scenario, a 30% weighting applied to the downside scenario and a 10% weighting applied to the extreme downside scenario. The Group judged a downside-biased weighting as appropriate given the risk to the outlook posed by the numerous factors influencing the path of COVID-19, the rollout of the vaccine and the pace at which social distancing restrictions can be relaxed.
Use of the scenarios in Personal lending
The NatWest UK modelled Personal portfolio, from which PDs and LGDs are sourced to facilitate the calculation of ECL in RBSI Personal, follows a discrete scenario approach which means that for each account, PD and LGD values are calculated as probability weighted averages across the individual, discrete economic scenarios. The PD values for each discrete scenario are in turn calculated using product specific econometric models that aggregate forecasts of the relevant economic loss drivers into forecasts of the exogenous component of the respective PD models (refer to IFRS 9 ECL model design principles).
Use of the scenarios in Wholesale lending
The Wholesale lending methodology is based on the concept of CCIs. The CCIs represent, similar to the exogenous component in Personal, all relevant economic loss drivers for a region/industry segment aggregated into a single index value that describes the loss rate conditions in the respective segment relative to its long-run average. A CCI value of zero corresponds to loss rates at long-run average levels, a positive CCI value corresponds to loss rates below long-run average levels and a negative CCI value corresponds to loss rates above long-run average levels.
The four economic scenarios are translated into forward-looking projections of CCIs using a set of econometric models. Subsequently the CCI projections for the individual scenarios are averaged into a single central CCI projection according to the given scenario probabilities. The central CCI projection is then overlaid with an additional mean reversion assumption, i.e. that after one to two years into the forecast horizon the CCI gradually revert to their long-run average of zero. Finally, ECL is calculated using a Monte Carlo approach by averaging PD and LGD values arising from many CCI paths simulated around the central CCI projection.
The rationale for the Wholesale approach is the long-standing observation that loss rates in Wholesale portfolios tend to follow regular cycles. This allows NatWest Group to enrich the range and depth of future economic conditions embedded in the final ECL beyond what would be obtained from using the discrete macro-economic scenarios alone.
UK economic uncertainty Treatment of COVID-19 relief mechanisms
Use of COVID-19 relief mechanisms (for example, the
Disruption Guarantee Scheme) will not automatically merit
identification of SICR and trigger a Stage 2 classification in
isolation.
For Wholesale customers, the Group continues to provide support, where appropriate, to existing customers. Those who are deemed either (a) to require a prolonged timescale to return to within the Group’s risk appetite, (b) not to have been viable pre-COVID-19, or (c) not to be able to sustain their debt once COVID-19 is over, will trigger a SICR and, if concessions are sought, be categorised as forborne, in line with regulatory guidance.
As some of the government support mechanisms conclude, the Group anticipates further credit deterioration in the portfolios. There are a number of key factors that could drive further downside to impairments, through deteriorating economic and credit metrics and increased stage migration as credit risk increases for more customers. A key factor would be a more adverse deterioration in GDP and unemployment in the economies in which the Group operates, but also, among others:
The timing and nature of governmental exit plans from lockdown and any future repeated lockdown requirements.
The progress of COVID-19, with potential for changes in worker/consumer behaviour and sickness levels.
The efficacy of the various government support initiatives in terms of their ability to defray customer defaults is yet to be proven, notably over an extended period.
Notes to the accounts
55 The Royal Bank of Scotland International (Holdings) Limited Annual Report and Accounts 2020
18. Risk management (continued)
Credit risk continued
Any further damage to certain supply chains, most notably in the case of any re-tightening of lockdown rules but also delays caused by social distancing measures and possible export/import controls.
The level of revenues lost by corporate clients and pace of recovery of those revenues may affect the Group’s clients’ ability to service their borrowing, especially in those sectors most exposed to the impacts of COVID-19.
Higher unemployment if companies fail to restart jobs after periods of staff furlough.
This could potentially lead to further ECL increases. However, the income statement impact of this will be mitigated to some extent by the forward-looking provisions taken as at 31 December 2020.
Model monitoring and enhancement
The abrupt and prolonged interruption of a wide range of economic activities due to COVID-19 and the subsequent government interventions to support businesses and individuals, has resulted in patterns in the data of key economic loss drivers and loss outcomes, that are markedly different from those that the Group models have been built on. To account for these structural changes, model adjustments have been applied and model changes have been implemented. Government support
Most notably as a result of various government support measures, the increase in model-predicted defaults caused by the sharp contraction in GDP and consumer spending in Q2 2020 has to date, not materialised. Accordingly, model-projected default rates in Wholesale and Personal have been adjusted by introducing lags of up to 12 months. These lags are based partly on objective empirical data (i.e. the absence of increases in realised default rates by the reporting date) and partly judgmental, based on the extension of government support measures into 2021 and their expected effectiveness. In Wholesale lending, most importantly business and commercial banking, model-projected default rates have also been scaled down based on the expectation that credit extended under various government support loan schemes will allow many businesses, not only to delay, but to sustainably mitigate their default risk profile. Extreme GDP movements – Wholesale only
Due to the specific nature of COVID-19, GDP year-on-year movements in both directions are extremely sharp, many multiples of their respective extremes observed previously. This creates a risk of overstretched, invalid extrapolations in statistical models. Therefore, all Wholesale econometric models were updated to make them robust against extreme GDP movements by capping projected CCI values at levels corresponding to three times the default rates observed at the peak of the global financial crisis and using quarterly averages rather than spot values for CCI projections. Industry sector detail – Wholesale only The economic impact of COVID-19 is highly differentiated by industry sector, with hospitality and other contact-based leisure, service, travel and passenger transport activities significantly more affected than the overall economy. On the other hand, the corporate and commercial econometric forecasting models used in Wholesale are sector agnostic. Sector performance was therefore monitored throughout the year and additional adjustments were applied when PDs were deemed inconsistent with expected loss outcomes at sector level. No such interventions were necessary at the year end.
Scenario sensitivity – Personal only
For the NatWest UK modelled Personal portfolio, from which PDs and LGDs are sourced to facilitate the calculation of ECL in RBSI Personal, the forward-looking components of the IFRS 9 PD models were modified, leveraging existing econometric models used in stress testing to ensure that PDs appropriately reflect the forecasts for unemployment and house prices in particular.
All in-model adjustments described have been applied by correcting the PD and LGD estimates within the core ECL calculation process and therefore consistently and systematically inform SICR identification and ECL measurement. Additionally, post model ECL adjustments were made in Personal to ensure that the ECL was adjusted for known model over and under-predictions pre-existing COVID-19, pending the systematic re-calibration of the underlying models. Measurement uncertainty and ECL sensitivity analysis The recognition and measurement of ECL is complex and involves the use of significant judgement and estimation, particularly in times of economic volatility and uncertainty. This includes the formulation and incorporation of multiple forward-looking economic conditions into ECL to meet the measurement objective of IFRS 9. The ECL provision is sensitive to the model inputs and economic assumptions underlying the estimate. The focus of the simulations is on ECL provisioning requirements on performing exposures in Stage 1 and Stage 2. The simulations are run on a stand-alone basis and are independent of each other; the potential ECL impacts reflect the simulated impact as at 31 December 2020. Scenario impacts on SICR should be considered when evaluating the ECL movements of Stage 1 and Stage 2. In all scenarios the total exposure was the same but exposure by stage varied in each scenario. Stage 3 provisions are not subject to the same level of measurement uncertainty – default is an observed event as at the balance sheet date. Stage 3 provisions therefore have not been considered in this analysis. The impact arising from the upside, downside and extreme downside scenarios has been simulated. These scenarios are three of the four discrete scenarios used in the methodology for Personal MES as described in the Economic loss drivers section. In the simulations, the Group has assumed that the economic macro variables associated with these scenarios replace the existing base case economic assumptions, giving them a 100% probability weighting and thus serving as a single economic scenario. These scenarios have been applied to all modelled portfolios in the analysis below, with the simulation impacting both PDs and LGDs. Modelled overlays present in the underlying ECL estimates are also sensitised in line with the modelled ECL movements, but those that were judgmental in nature, primarily those for economic uncertainty, were not (refer to the Governance and post model adjustments section). As expected, the scenarios create differing impacts on ECL by portfolio and the impacts are deemed reasonable. In this simulation, it is assumed that existing modelled relationships between key economic variables and loss drivers hold, but in practice other factors would also have an impact, for example, potential customer behaviour changes and policy changes by lenders that might impact on the wider availability of credit. The Group’s core criterion to identify a SICR is founded on PD deterioration, as discussed above. Under the simulations, PDs change and result in exposures moving between Stage 1 and Stage 2 contributing to the ECL impact.
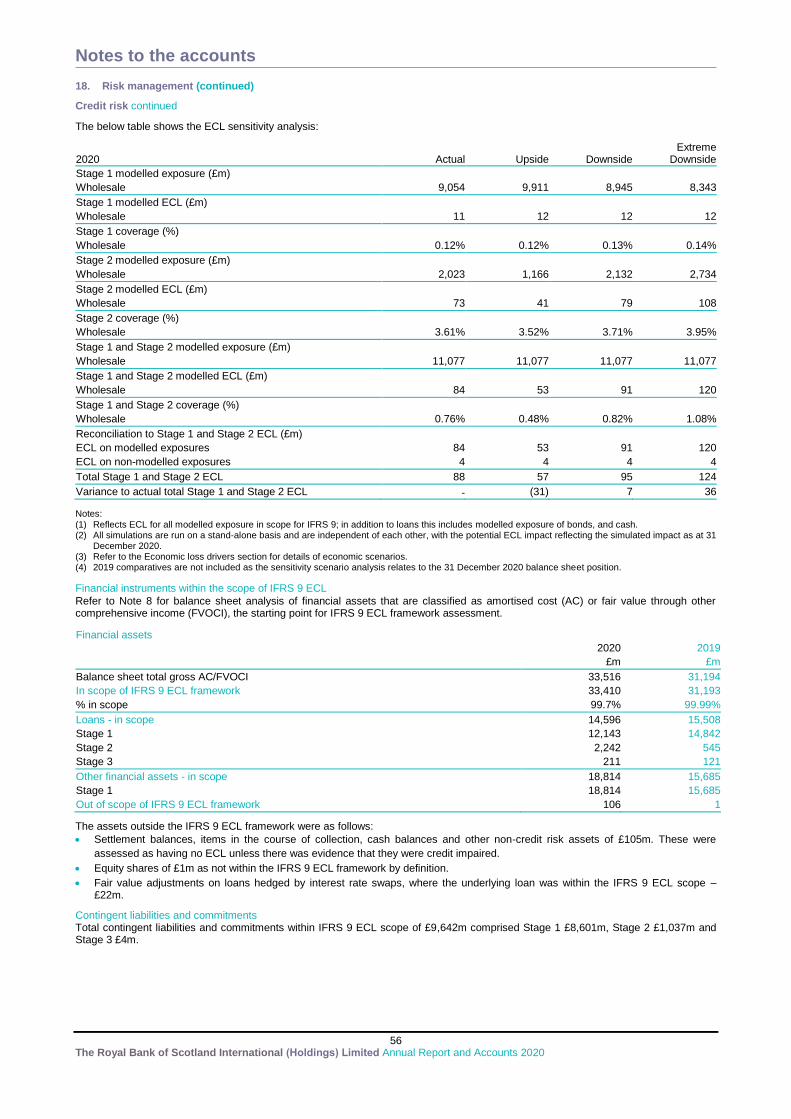
Notes to the accounts
56 The Royal Bank of Scotland International (Holdings) Limited Annual Report and Accounts 2020
18. Risk management (continued)
Credit risk continued
The below table shows the ECL sensitivity analysis:
2020 Actual Upside Downside Extreme
Downside
Stage 1 modelled exposure (£m)
Wholesale 9,054 9,911 8,945 8,343
Stage 1 modelled ECL (£m)
Wholesale 11 12 12 12
Stage 1 coverage (%)
Wholesale 0.12% 0.12% 0.13% 0.14%
Stage 2 modelled exposure (£m)
Wholesale 2,023 1,166 2,132 2,734
Stage 2 modelled ECL (£m)
Wholesale 73 41 79 108
Stage 2 coverage (%)
Wholesale 3.61% 3.52% 3.71% 3.95%
Stage 1 and Stage 2 modelled exposure (£m)
Wholesale 11,077 11,077 11,077 11,077
Stage 1 and Stage 2 modelled ECL (£m)
Wholesale 84 53 91 120
Stage 1 and Stage 2 coverage (%)
Wholesale 0.76% 0.48% 0.82% 1.08%
Reconciliation to Stage 1 and Stage 2 ECL (£m)
ECL on modelled exposures 84 53 91 120
ECL on non-modelled exposures 4 4 4 4
Total Stage 1 and Stage 2 ECL 88 57 95 124
Variance to actual total Stage 1 and Stage 2 ECL - (31) 7 36
Notes:
(1) Reflects ECL for all modelled exposure in scope for IFRS 9; in addition to loans this includes modelled exposure of bonds, and cash. (2) All simulations are run on a stand-alone basis and are independent of each other, with the potential ECL impact reflecting the simulated impact as at 31
December 2020. (3) Refer to the Economic loss drivers section for details of economic scenarios. (4) 2019 comparatives are not included as the sensitivity scenario analysis relates to the 31 December 2020 balance sheet position.
Financial instruments within the scope of IFRS 9 ECL
Refer to Note 8 for balance sheet analysis of financial assets that are classified as amortised cost (AC) or fair value through other comprehensive income (FVOCI), the starting point for IFRS 9 ECL framework assessment.
Financial assets
2020 2019
£m £m
Balance sheet total gross AC/FVOCI 33,516 31,194
In scope of IFRS 9 ECL framework 33,410 31,193
% in scope 99.7% 99.99%
Loans - in scope 14,596 15,508
Stage 1 12,143 14,842
Stage 2 2,242 545
Stage 3 211 121
Other financial assets - in scope 18,814 15,685
Stage 1 18,814 15,685
Out of scope of IFRS 9 ECL framework 106 1
The assets outside the IFRS 9 ECL framework were as follows:
Settlement balances, items in the course of collection, cash balances and other non-credit risk assets of £105m. These were
assessed as having no ECL unless there was evidence that they were credit impaired.
Equity shares of £1m as not within the IFRS 9 ECL framework by definition.
Fair value adjustments on loans hedged by interest rate swaps, where the underlying loan was within the IFRS 9 ECL scope – £22m.
Contingent liabilities and commitments Total contingent liabilities and commitments within IFRS 9 ECL scope of £9,642m comprised Stage 1 £8,601m, Stage 2 £1,037m and Stage 3 £4m.
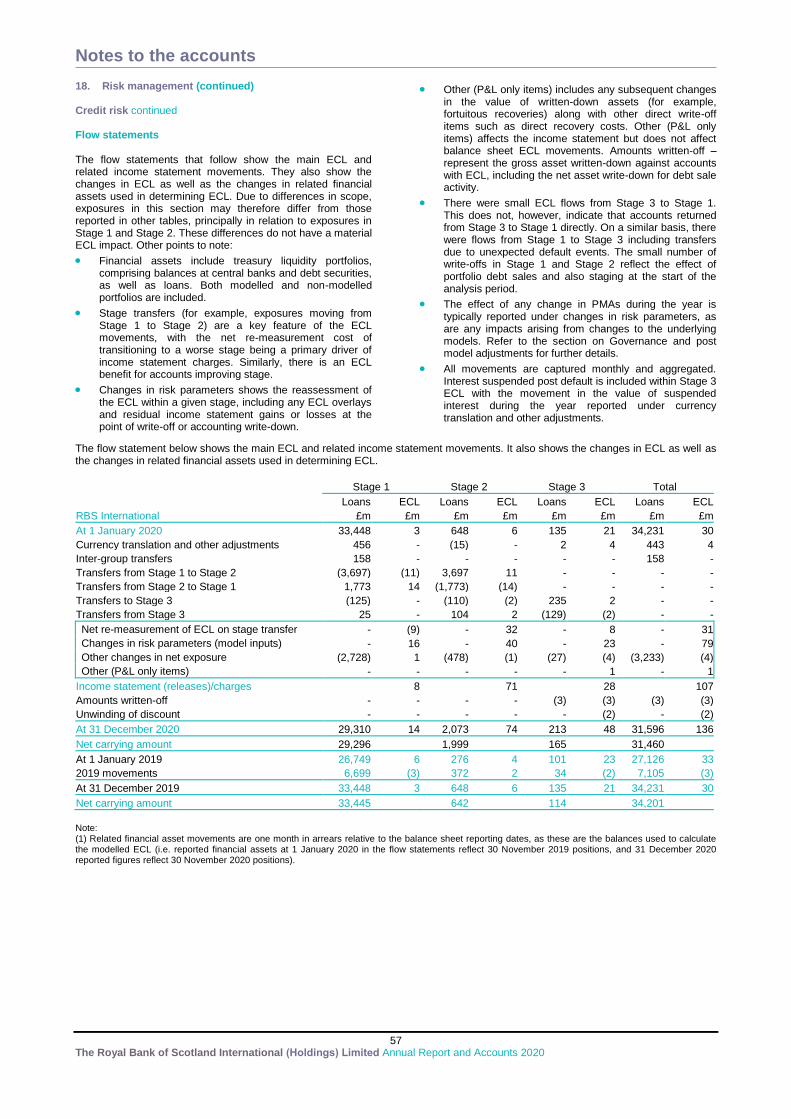
Notes to the accounts
57 The Royal Bank of Scotland International (Holdings) Limited Annual Report and Accounts 2020
18. Risk management (continued) Credit risk continued Flow statements The flow statements that follow show the main ECL and related income statement movements. They also show the changes in ECL as well as the changes in related financial assets used in determining ECL. Due to differences in scope, exposures in this section may therefore differ from those reported in other tables, principally in relation to exposures in Stage 1 and Stage 2. These differences do not have a material ECL impact. Other points to note:
Financial assets include treasury liquidity portfolios, comprising balances at central banks and debt securities, as well as loans. Both modelled and non-modelled portfolios are included.
Stage transfers (for example, exposures moving from Stage 1 to Stage 2) are a key feature of the ECL movements, with the net re-measurement cost of transitioning to a worse stage being a primary driver of income statement charges. Similarly, there is an ECL benefit for accounts improving stage.
Changes in risk parameters shows the reassessment of the ECL within a given stage, including any ECL overlays and residual income statement gains or losses at the point of write-off or accounting write-down.
Other (P&L only items) includes any subsequent changes in the value of written-down assets (for example, fortuitous recoveries) along with other direct write-off items such as direct recovery costs. Other (P&L only items) affects the income statement but does not affect balance sheet ECL movements. Amounts written-off – represent the gross asset written-down against accounts with ECL, including the net asset write-down for debt sale activity.
There were small ECL flows from Stage 3 to Stage 1. This does not, however, indicate that accounts returned from Stage 3 to Stage 1 directly. On a similar basis, there were flows from Stage 1 to Stage 3 including transfers due to unexpected default events. The small number of write-offs in Stage 1 and Stage 2 reflect the effect of portfolio debt sales and also staging at the start of the analysis period.
The effect of any change in PMAs during the year is typically reported under changes in risk parameters, as are any impacts arising from changes to the underlying models. Refer to the section on Governance and post model adjustments for further details.
All movements are captured monthly and aggregated. Interest suspended post default is included within Stage 3 ECL with the movement in the value of suspended interest during the year reported under currency translation and other adjustments.
The flow statement below shows the main ECL and related income statement movements. It also shows the changes in ECL as well as the changes in related financial assets used in determining ECL.
Stage 1 Stage 2 Stage 3 Total
Loans ECL Loans ECL Loans ECL Loans ECL
RBS International £m £m £m £m £m £m £m £m
At 1 January 2020 33,448 3 648 6 135 21 34,231 30
Currency translation and other adjustments 456 - (15) - 2 4 443 4
Inter-group transfers 158 - - - - - 158 -
Transfers from Stage 1 to Stage 2 (3,697) (11) 3,697 11 - - - -
Transfers from Stage 2 to Stage 1 1,773 14 (1,773) (14) - - - -
Transfers to Stage 3 (125) - (110) (2) 235 2 - -
Transfers from Stage 3 25 - 104 2 (129) (2) - -
Net re-measurement of ECL on stage transfer - (9) - 32 - 8 - 31
Changes in risk parameters (model inputs) - 16 - 40 - 23 - 79
Other changes in net exposure (2,728) 1 (478) (1) (27) (4) (3,233) (4)
Other (P&L only items) - - - - - 1 - 1
Income statement (releases)/charges
8
71
28
107
Amounts written-off - - - - (3) (3) (3) (3)
Unwinding of discount - - - - - (2) - (2)
At 31 December 2020 29,310 14 2,073 74 213 48 31,596 136
Net carrying amount 29,296
1,999
165
31,460 At 1 January 2019 26,749 6 276 4 101 23 27,126 33
2019 movements 6,699 (3) 372 2 34 (2) 7,105 (3)
At 31 December 2019 33,448 3 648 6 135 21 34,231 30
Net carrying amount 33,445
642
114
34,201
Note: (1) Related financial asset movements are one month in arrears relative to the balance sheet reporting dates, as these are the balances used to calculate the modelled ECL (i.e. reported financial assets at 1 January 2020 in the flow statements reflect 30 November 2019 positions, and 31 December 2020 reported figures reflect 30 November 2020 positions).
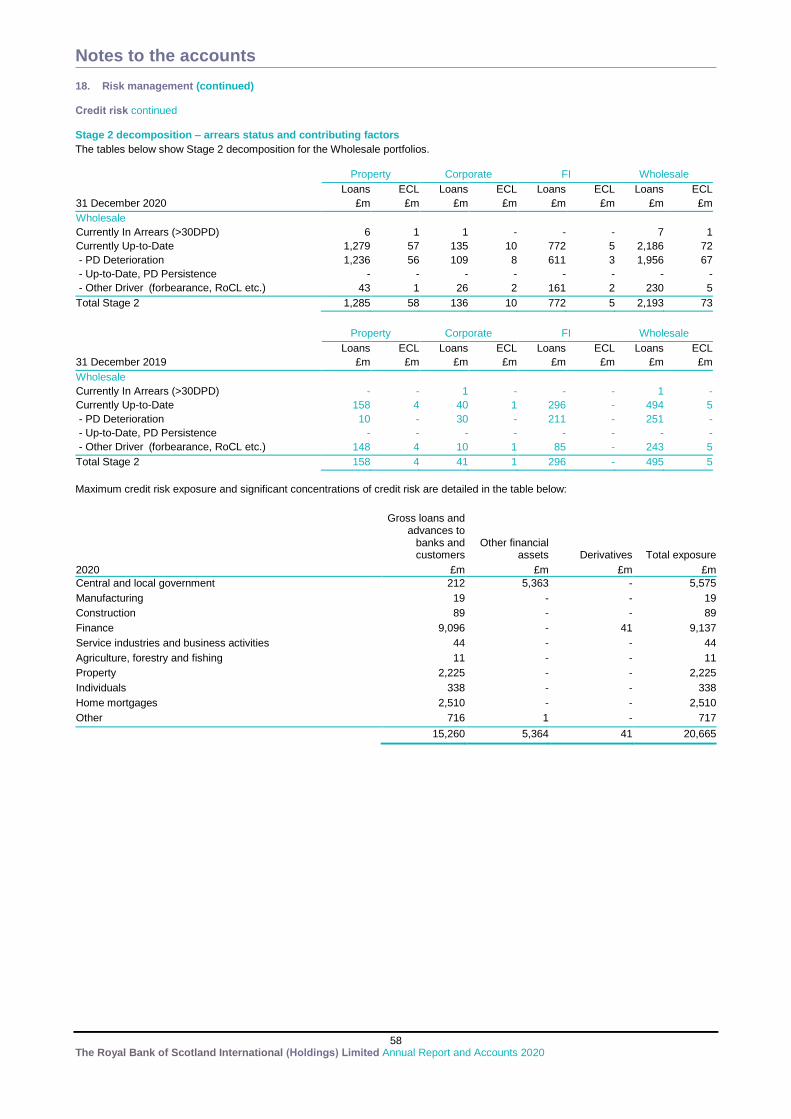
Notes to the accounts
58 The Royal Bank of Scotland International (Holdings) Limited Annual Report and Accounts 2020
18. Risk management (continued)
Credit risk continued Stage 2 decomposition – arrears status and contributing factors
The tables below show Stage 2 decomposition for the Wholesale portfolios.
Property Corporate FI Wholesale
Loans ECL Loans ECL Loans ECL Loans ECL
31 December 2020 £m £m £m £m £m £m £m £m
Wholesale
Currently In Arrears (>30DPD) 6 1 1 - - - 7 1
Currently Up-to-Date 1,279 57 135 10 772 5 2,186 72
- PD Deterioration 1,236 56 109 8 611 3 1,956 67
- Up-to-Date, PD Persistence - - - - - - - -
- Other Driver (forbearance, RoCL etc.) 43 1 26 2 161 2 230 5
Total Stage 2 1,285 58 136 10 772 5 2,193 73
Property Corporate FI Wholesale
Loans ECL Loans ECL Loans ECL Loans ECL
31 December 2019 £m £m £m £m £m £m £m £m
Wholesale
Currently In Arrears (>30DPD) - - 1 - - - 1 -
Currently Up-to-Date 158 4 40 1 296 - 494 5
- PD Deterioration 10 - 30 - 211 - 251 -
- Up-to-Date, PD Persistence - - - - - - - -
- Other Driver (forbearance, RoCL etc.) 148 4 10 1 85 - 243 5
Total Stage 2 158 4 41 1 296 - 495 5
Maximum credit risk exposure and significant concentrations of credit risk are detailed in the table below:
Gross loans and advances to
banks and customers
Other financial assets Derivatives Total exposure
2020 £m £m £m £m
Central and local government 212 5,363 - 5,575
Manufacturing 19 - - 19
Construction 89 - - 89
Finance 9,096 - 41 9,137
Service industries and business activities 44 - - 44
Agriculture, forestry and fishing 11 - - 11
Property 2,225 - - 2,225
Individuals 338 - - 338
Home mortgages 2,510 - - 2,510
Other 716 1 - 717
15,260 5,364 41 20,665
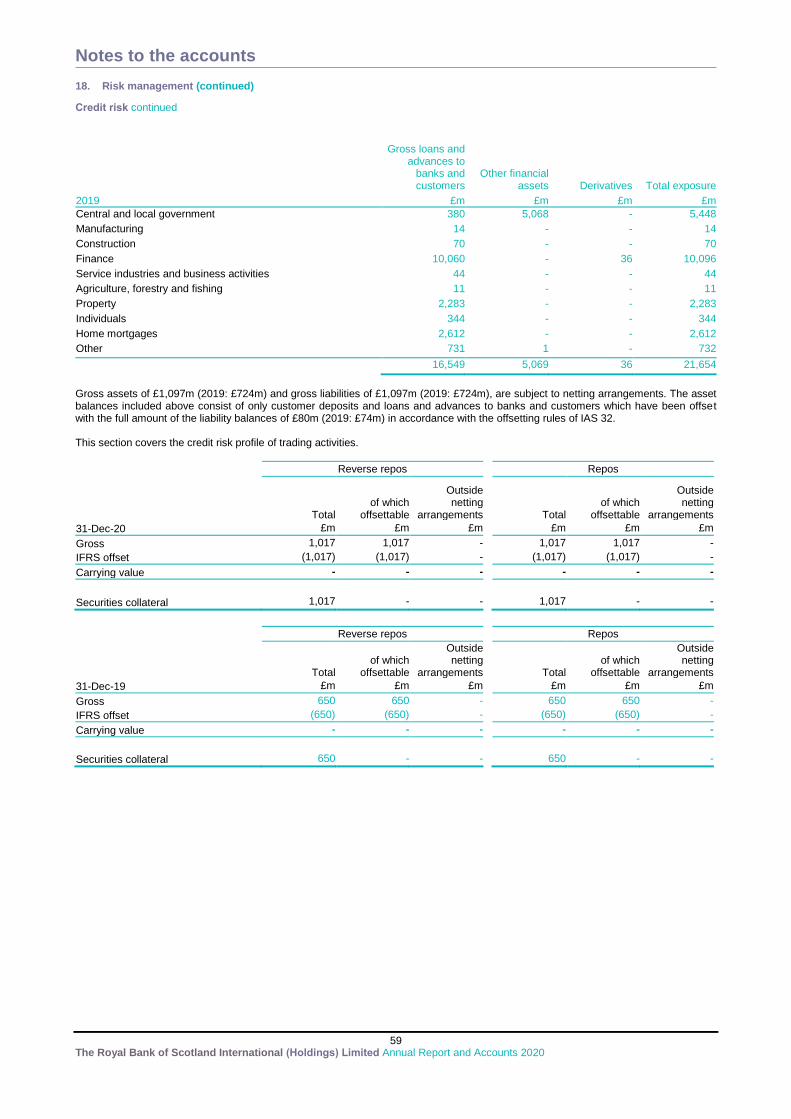
Notes to the accounts
59 The Royal Bank of Scotland International (Holdings) Limited Annual Report and Accounts 2020
18. Risk management (continued)
Credit risk continued
Gross loans and advances to
banks and customers
Other financial assets Derivatives Total exposure
2019 £m £m £m £m
Central and local government 380 5,068 - 5,448
Manufacturing 14 - - 14
Construction 70 - - 70
Finance 10,060 - 36 10,096
Service industries and business activities 44 - - 44
Agriculture, forestry and fishing 11 - - 11
Property 2,283 - - 2,283
Individuals 344 - - 344
Home mortgages 2,612 - - 2,612
Other 731 1 - 732
16,549 5,069 36 21,654
Gross assets of £1,097m (2019: £724m) and gross liabilities of £1,097m (2019: £724m), are subject to netting arrangements. The asset balances included above consist of only customer deposits and loans and advances to banks and customers which have been offset with the full amount of the liability balances of £80m (2019: £74m) in accordance with the offsetting rules of IAS 32. This section covers the credit risk profile of trading activities.
Reverse repos
Repos
Total
of which offsettable
Outside netting
arrangements
Total of which
offsettable
Outside netting
arrangements
31-Dec-20 £m £m £m
£m £m £m
Gross 1,017 1,017 -
1,017 1,017 -
IFRS offset (1,017) (1,017) -
(1,017) (1,017) -
Carrying value - - -
- - -
Securities collateral 1,017 - -
1,017 - -
Reverse repos
Repos
Total
of which offsettable
Outside netting
arrangements
Total of which
offsettable
Outside netting
arrangements
31-Dec-19 £m £m £m
£m £m £m
Gross 650 650 -
650 650 -
IFRS offset (650) (650) -
(650) (650) -
Carrying value - - -
- - -
Securities collateral 650 - -
650 - -
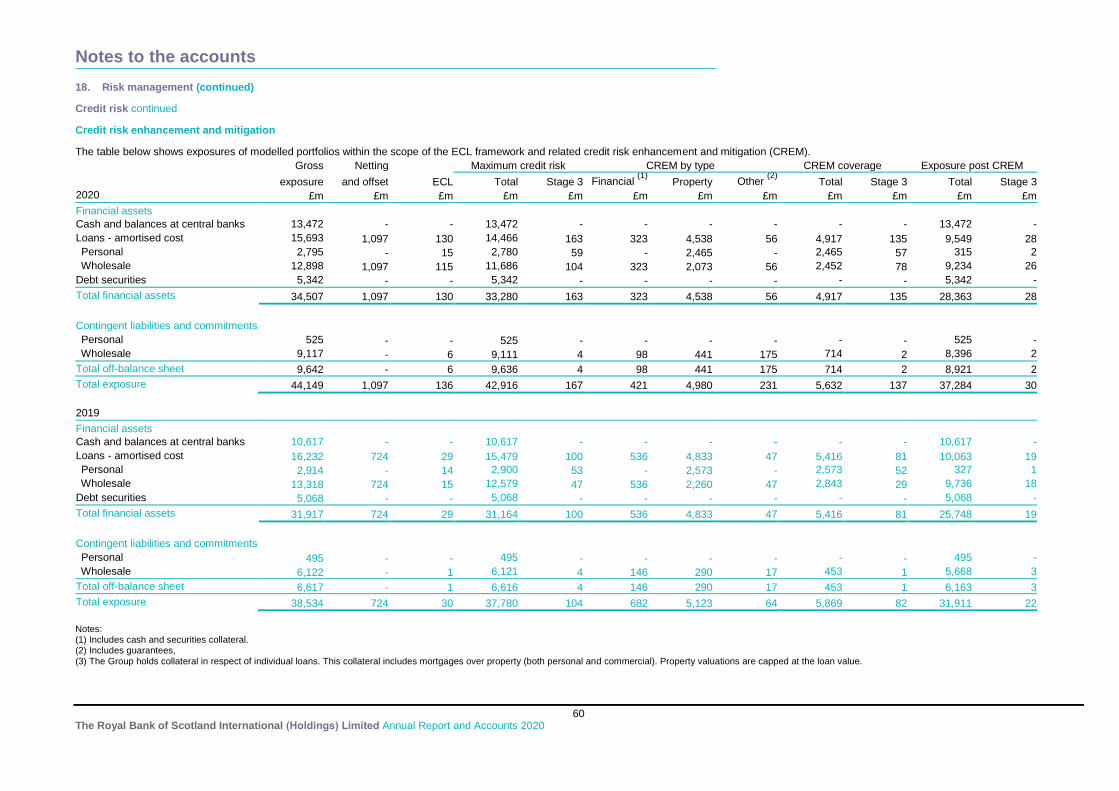
Notes to the accounts
60 The Royal Bank of Scotland International (Holdings) Limited Annual Report and Accounts 2020
18. Risk management (continued)
Credit risk continued
Credit risk enhancement and mitigation
The table below shows exposures of modelled portfolios within the scope of the ECL framework and related credit risk enhancement and mitigation (CREM).
Gross Netting
Maximum credit risk CREM by type CREM coverage Exposure post CREM
exposure and offset ECL Total Stage 3 Financial
(1) Property Other
(2) Total Stage 3 Total Stage 3
2020 £m £m £m £m £m £m £m £m £m £m £m £m
Financial assets Cash and balances at central banks 13,472 - - 13,472 - - - - - - 13,472 -
Loans - amortised cost 15,693 1,097 130 14,466 163 323 4,538 56 4,917 135 9,549 28
Personal 2,795 - 15 2,780 59 - 2,465 - 2,465 57 315 2
Wholesale 12,898 1,097 115 11,686 104 323 2,073 56 2,452 78 9,234 26
Debt securities 5,342 - - 5,342 - - - - - - 5,342 -
Total financial assets 34,507 1,097 130 33,280 163 323 4,538 56 4,917 135 28,363 28
Contingent liabilities and commitments
Personal 525 - - 525 - - - - - - 525 -
Wholesale 9,117 - 6 9,111 4 98 441 175 714 2 8,396 2
Total off-balance sheet 9,642 - 6 9,636 4 98 441 175 714 2 8,921 2
Total exposure 44,149 1,097 136 42,916 167 421 4,980 231 5,632 137 37,284 30
2019
Financial assets Cash and balances at central banks 10,617 - - 10,617 - - - - - - 10,617 -
Loans - amortised cost 16,232 724 29 15,479 100 536 4,833 47 5,416 81 10,063 19
Personal 2,914 - 14 2,900 53 - 2,573 - 2,573 52 327 1
Wholesale 13,318 724 15 12,579 47 536 2,260 47 2,843 29 9,736 18
Debt securities 5,068 - - 5,068 - - - - - - 5,068 -
Total financial assets 31,917 724 29 31,164 100 536 4,833 47 5,416 81 25,748 19
Contingent liabilities and commitments
Personal 495 - - 495 - - - - - - 495 -
Wholesale 6,122 - 1 6,121 4 146 290 17 453 1 5,668 3
Total off-balance sheet 6,617 - 1 6,616 4 146 290 17 453 1 6,163 3
Total exposure 38,534 724 30 37,780 104 682 5,123 64 5,869 82 31,911 22
Notes: (1) Includes cash and securities collateral. (2) Includes guarantees, (3) The Group holds collateral in respect of individual loans. This collateral includes mortgages over property (both personal and commercial). Property valuations are capped at the loan value.
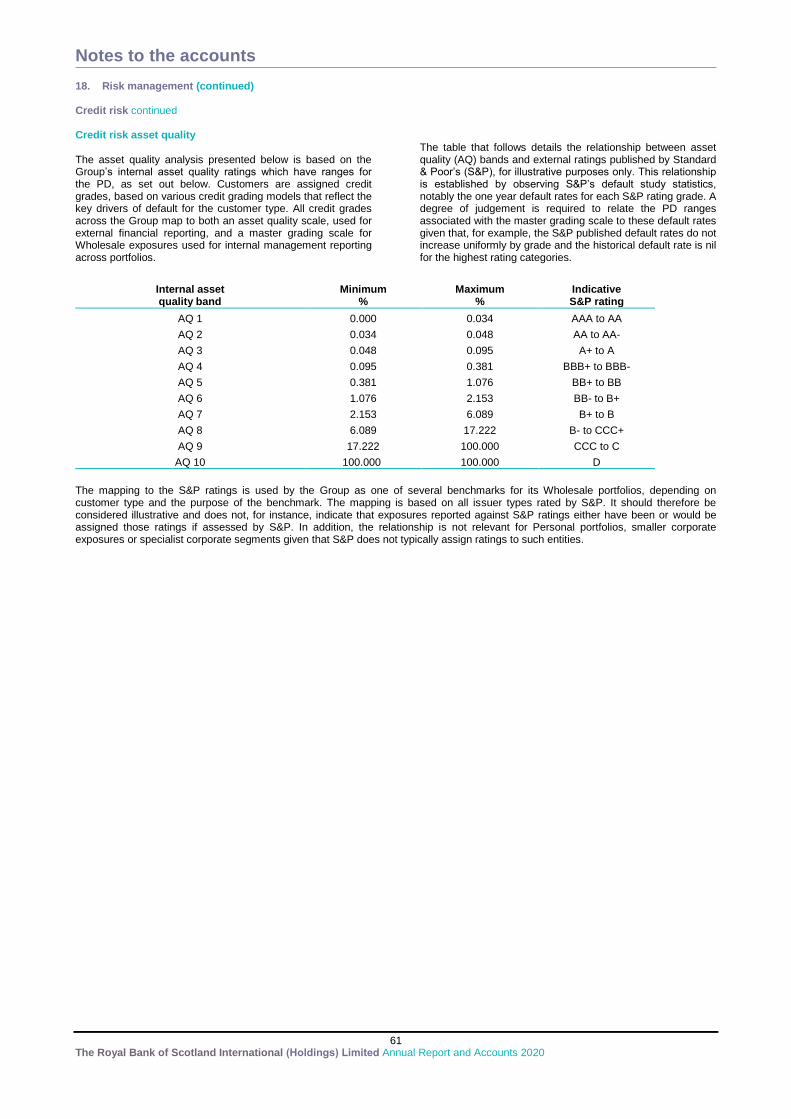
Notes to the accounts
61 The Royal Bank of Scotland International (Holdings) Limited Annual Report and Accounts 2020
18. Risk management (continued) Credit risk continued Credit risk asset quality The asset quality analysis presented below is based on the Group’s internal asset quality ratings which have ranges for the PD, as set out below. Customers are assigned credit grades, based on various credit grading models that reflect the key drivers of default for the customer type. All credit grades across the Group map to both an asset quality scale, used for external financial reporting, and a master grading scale for Wholesale exposures used for internal management reporting across portfolios.
The table that follows details the relationship between asset quality (AQ) bands and external ratings published by Standard & Poor’s (S&P), for illustrative purposes only. This relationship is established by observing S&P’s default study statistics, notably the one year default rates for each S&P rating grade. A degree of judgement is required to relate the PD ranges associated with the master grading scale to these default rates given that, for example, the S&P published default rates do not increase uniformly by grade and the historical default rate is nil for the highest rating categories.
Internal asset quality band
Minimum %
Maximum %
Indicative S&P rating
AQ 1 0.000 0.034 AAA to AA
AQ 2 0.034 0.048 AA to AA-
AQ 3 0.048 0.095 A+ to A
AQ 4 0.095 0.381 BBB+ to BBB-
AQ 5 0.381 1.076 BB+ to BB
AQ 6 1.076 2.153 BB- to B+
AQ 7 2.153 6.089 B+ to B
AQ 8 6.089 17.222 B- to CCC+
AQ 9 17.222 100.000 CCC to C
AQ 10 100.000 100.000 D
The mapping to the S&P ratings is used by the Group as one of several benchmarks for its Wholesale portfolios, depending on customer type and the purpose of the benchmark. The mapping is based on all issuer types rated by S&P. It should therefore be considered illustrative and does not, for instance, indicate that exposures reported against S&P ratings either have been or would be assigned those ratings if assessed by S&P. In addition, the relationship is not relevant for Personal portfolios, smaller corporate exposures or specialist corporate segments given that S&P does not typically assign ratings to such entities.
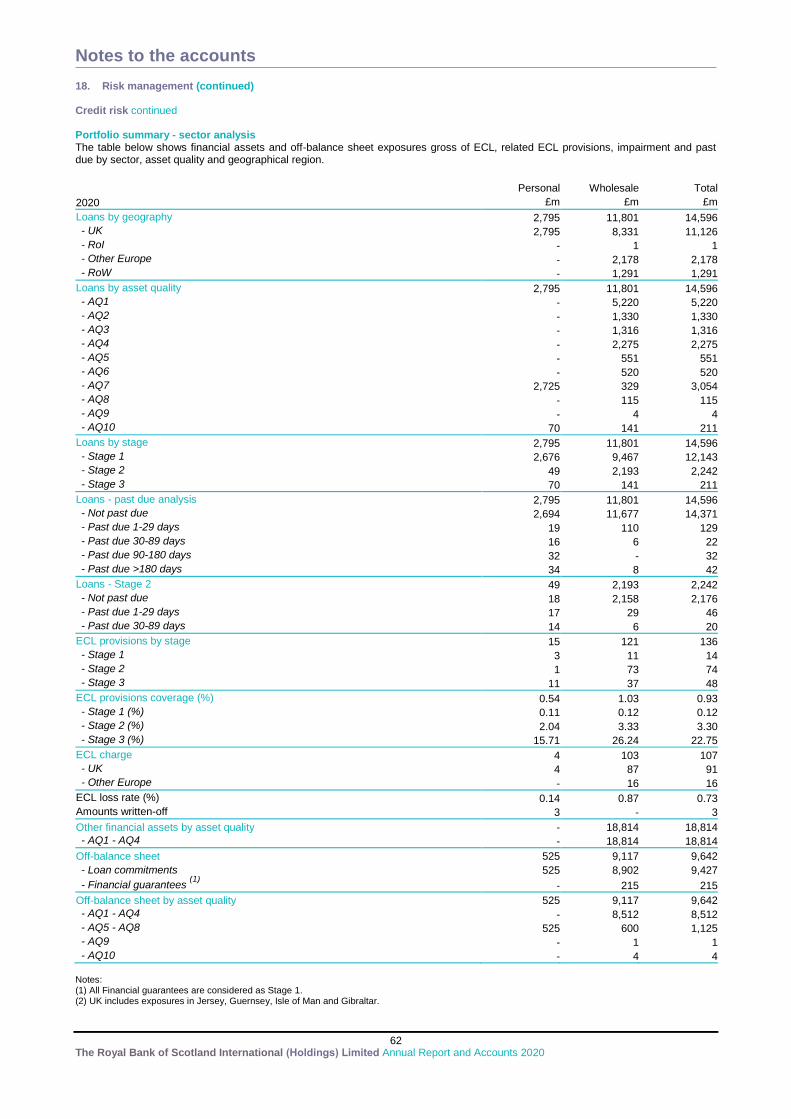
Notes to the accounts
62 The Royal Bank of Scotland International (Holdings) Limited Annual Report and Accounts 2020
18. Risk management (continued) Credit risk continued Portfolio summary - sector analysis The table below shows financial assets and off-balance sheet exposures gross of ECL, related ECL provisions, impairment and past due by sector, asset quality and geographical region.
Personal Wholesale Total
2020 £m £m £m
Loans by geography 2,795 11,801 14,596
- UK 2,795 8,331 11,126
- RoI - 1 1
- Other Europe - 2,178 2,178
- RoW - 1,291 1,291
Loans by asset quality 2,795 11,801 14,596
- AQ1 - 5,220 5,220
- AQ2 - 1,330 1,330
- AQ3 - 1,316 1,316
- AQ4 - 2,275 2,275
- AQ5 - 551 551
- AQ6 - 520 520
- AQ7 2,725 329 3,054
- AQ8 - 115 115
- AQ9 - 4 4
- AQ10 70 141 211
Loans by stage 2,795 11,801 14,596
- Stage 1 2,676 9,467 12,143
- Stage 2 49 2,193 2,242
- Stage 3 70 141 211
Loans - past due analysis 2,795 11,801 14,596
- Not past due 2,694 11,677 14,371
- Past due 1-29 days 19 110 129
- Past due 30-89 days 16 6 22
- Past due 90-180 days 32 - 32
- Past due >180 days 34 8 42
Loans - Stage 2 49 2,193 2,242
- Not past due 18 2,158 2,176
- Past due 1-29 days 17 29 46
- Past due 30-89 days 14 6 20
ECL provisions by stage 15 121 136
- Stage 1 3 11 14
- Stage 2 1 73 74
- Stage 3 11 37 48
ECL provisions coverage (%) 0.54 1.03 0.93
- Stage 1 (%) 0.11 0.12 0.12
- Stage 2 (%) 2.04 3.33 3.30
- Stage 3 (%) 15.71 26.24 22.75
ECL charge 4 103 107
- UK 4 87 91
- Other Europe - 16 16
ECL loss rate (%) 0.14 0.87 0.73
Amounts written-off 3 - 3
Other financial assets by asset quality - 18,814 18,814
- AQ1 - AQ4 - 18,814 18,814
Off-balance sheet 525 9,117 9,642
- Loan commitments 525 8,902 9,427
- Financial guarantees (1)
- 215 215
Off-balance sheet by asset quality 525 9,117 9,642
- AQ1 - AQ4 - 8,512 8,512
- AQ5 - AQ8 525 600 1,125
- AQ9 - 1 1
- AQ10 - 4 4 Notes: (1) All Financial guarantees are considered as Stage 1. (2) UK includes exposures in Jersey, Guernsey, Isle of Man and Gibraltar.
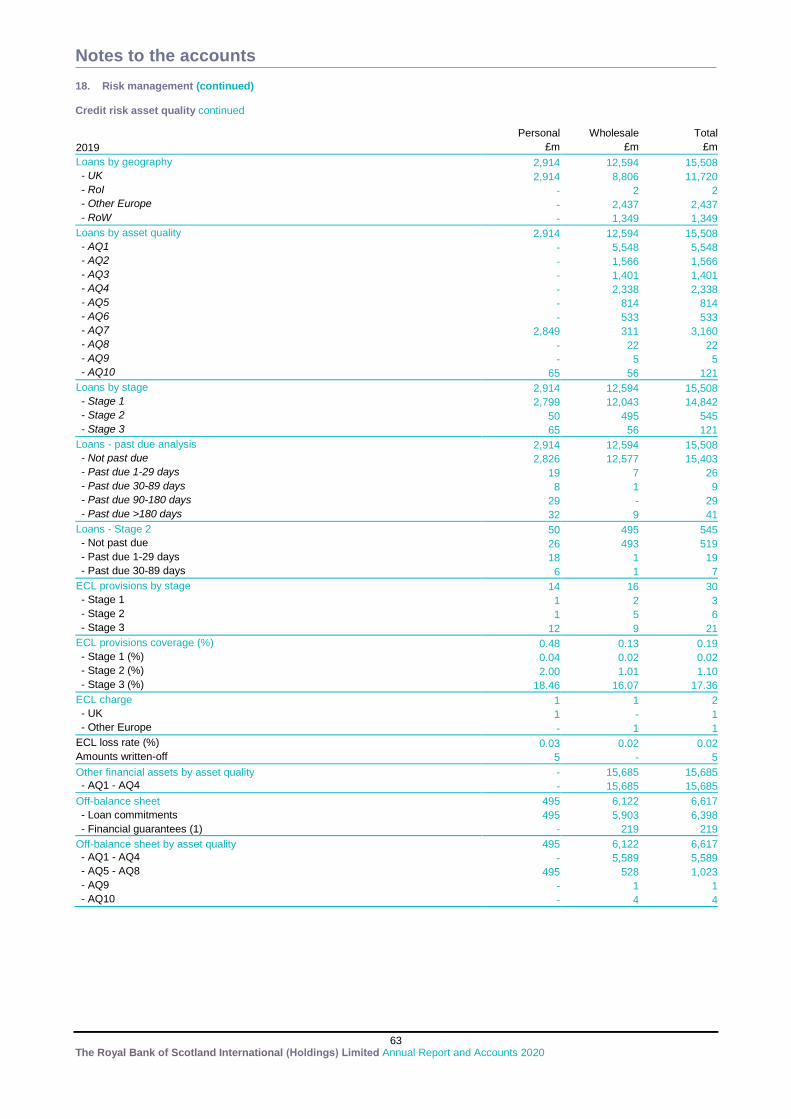
Notes to the accounts
63 The Royal Bank of Scotland International (Holdings) Limited Annual Report and Accounts 2020
18. Risk management (continued) Credit risk asset quality continued
Personal Wholesale Total
2019 £m £m £m
Loans by geography 2,914 12,594 15,508
- UK 2,914 8,806 11,720
- RoI - 2 2
- Other Europe - 2,437 2,437
- RoW - 1,349 1,349
Loans by asset quality 2,914 12,594 15,508
- AQ1 - 5,548 5,548
- AQ2 - 1,566 1,566
- AQ3 - 1,401 1,401
- AQ4 - 2,338 2,338
- AQ5 - 814 814
- AQ6 - 533 533
- AQ7 2,849 311 3,160
- AQ8 - 22 22
- AQ9 - 5 5
- AQ10 65 56 121
Loans by stage 2,914 12,594 15,508
- Stage 1 2,799 12,043 14,842
- Stage 2 50 495 545
- Stage 3 65 56 121
Loans - past due analysis 2,914 12,594 15,508
- Not past due 2,826 12,577 15,403
- Past due 1-29 days 19 7 26
- Past due 30-89 days 8 1 9
- Past due 90-180 days 29 - 29
- Past due >180 days 32 9 41
Loans - Stage 2 50 495 545
- Not past due 26 493 519
- Past due 1-29 days 18 1 19
- Past due 30-89 days 6 1 7
ECL provisions by stage 14 16 30
- Stage 1 1 2 3
- Stage 2 1 5 6
- Stage 3 12 9 21
ECL provisions coverage (%) 0.48 0.13 0.19
- Stage 1 (%) 0.04 0.02 0.02
- Stage 2 (%) 2.00 1.01 1.10
- Stage 3 (%) 18.46 16.07 17.36
ECL charge 1 1 2
- UK 1 - 1
- Other Europe - 1 1
ECL loss rate (%) 0.03 0.02 0.02
Amounts written-off 5 - 5
Other financial assets by asset quality - 15,685 15,685
- AQ1 - AQ4 - 15,685 15,685
Off-balance sheet 495 6,122 6,617
- Loan commitments 495 5,903 6,398
- Financial guarantees (1) - 219 219
Off-balance sheet by asset quality 495 6,122 6,617
- AQ1 - AQ4 - 5,589 5,589
- AQ5 - AQ8 495 528 1,023
- AQ9 - 1 1
- AQ10 - 4 4
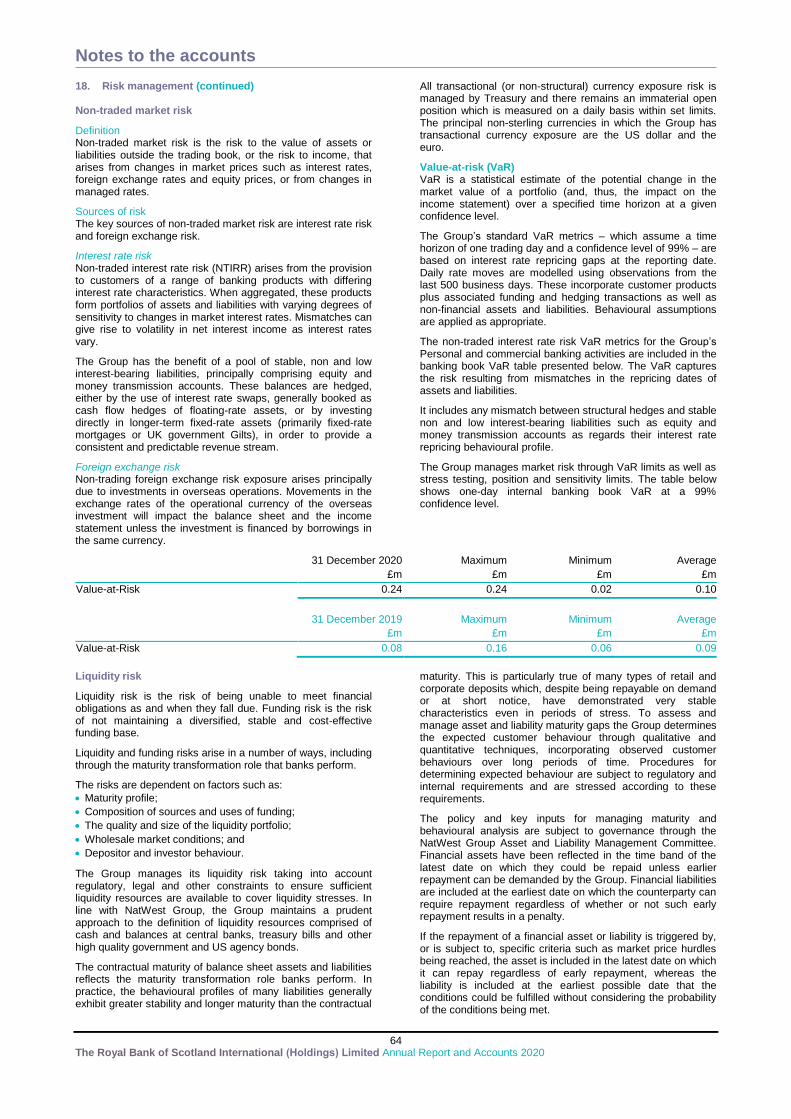
Notes to the accounts
64 The Royal Bank of Scotland International (Holdings) Limited Annual Report and Accounts 2020
18. Risk management (continued) Non-traded market risk
Definition Non-traded market risk is the risk to the value of assets or liabilities outside the trading book, or the risk to income, that arises from changes in market prices such as interest rates, foreign exchange rates and equity prices, or from changes in managed rates.
Sources of risk The key sources of non-traded market risk are interest rate risk and foreign exchange risk.
Interest rate risk Non-traded interest rate risk (NTIRR) arises from the provision to customers of a range of banking products with differing interest rate characteristics. When aggregated, these products form portfolios of assets and liabilities with varying degrees of sensitivity to changes in market interest rates. Mismatches can give rise to volatility in net interest income as interest rates vary.
The Group has the benefit of a pool of stable, non and low interest-bearing liabilities, principally comprising equity and money transmission accounts. These balances are hedged, either by the use of interest rate swaps, generally booked as cash flow hedges of floating-rate assets, or by investing directly in longer-term fixed-rate assets (primarily fixed-rate mortgages or UK government Gilts), in order to provide a consistent and predictable revenue stream.
Foreign exchange risk Non-trading foreign exchange risk exposure arises principally due to investments in overseas operations. Movements in the exchange rates of the operational currency of the overseas investment will impact the balance sheet and the income statement unless the investment is financed by borrowings in the same currency.
All transactional (or non-structural) currency exposure risk is managed by Treasury and there remains an immaterial open position which is measured on a daily basis within set limits. The principal non-sterling currencies in which the Group has transactional currency exposure are the US dollar and the euro.
Value-at-risk (VaR) VaR is a statistical estimate of the potential change in the market value of a portfolio (and, thus, the impact on the income statement) over a specified time horizon at a given confidence level.
The Group’s standard VaR metrics – which assume a time horizon of one trading day and a confidence level of 99% – are based on interest rate repricing gaps at the reporting date. Daily rate moves are modelled using observations from the last 500 business days. These incorporate customer products plus associated funding and hedging transactions as well as non-financial assets and liabilities. Behavioural assumptions are applied as appropriate.
The non-traded interest rate risk VaR metrics for the Group’s Personal and commercial banking activities are included in the banking book VaR table presented below. The VaR captures the risk resulting from mismatches in the repricing dates of assets and liabilities.
It includes any mismatch between structural hedges and stable non and low interest-bearing liabilities such as equity and money transmission accounts as regards their interest rate repricing behavioural profile.
The Group manages market risk through VaR limits as well as stress testing, position and sensitivity limits. The table below shows one-day internal banking book VaR at a 99% confidence level.
31 December 2020 Maximum Minimum Average
£m £m £m £m
Value-at-Risk 0.24 0.24 0.02 0.10
31 December 2019 Maximum Minimum Average
£m £m £m £m
Value-at-Risk 0.08 0.16 0.06 0.09
Liquidity risk
Liquidity risk is the risk of being unable to meet financial obligations as and when they fall due. Funding risk is the risk of not maintaining a diversified, stable and cost-effective funding base.
Liquidity and funding risks arise in a number of ways, including through the maturity transformation role that banks perform.
The risks are dependent on factors such as:
Maturity profile;
Composition of sources and uses of funding;
The quality and size of the liquidity portfolio;
Wholesale market conditions; and
Depositor and investor behaviour.
The Group manages its liquidity risk taking into account regulatory, legal and other constraints to ensure sufficient liquidity resources are available to cover liquidity stresses. In line with NatWest Group, the Group maintains a prudent approach to the definition of liquidity resources comprised of cash and balances at central banks, treasury bills and other high quality government and US agency bonds.
The contractual maturity of balance sheet assets and liabilities reflects the maturity transformation role banks perform. In practice, the behavioural profiles of many liabilities generally exhibit greater stability and longer maturity than the contractual
maturity. This is particularly true of many types of retail and corporate deposits which, despite being repayable on demand or at short notice, have demonstrated very stable characteristics even in periods of stress. To assess and manage asset and liability maturity gaps the Group determines the expected customer behaviour through qualitative and quantitative techniques, incorporating observed customer behaviours over long periods of time. Procedures for determining expected behaviour are subject to regulatory and internal requirements and are stressed according to these requirements.
The policy and key inputs for managing maturity and behavioural analysis are subject to governance through the NatWest Group Asset and Liability Management Committee. Financial assets have been reflected in the time band of the latest date on which they could be repaid unless earlier repayment can be demanded by the Group. Financial liabilities are included at the earliest date on which the counterparty can require repayment regardless of whether or not such early repayment results in a penalty.
If the repayment of a financial asset or liability is triggered by, or is subject to, specific criteria such as market price hurdles being reached, the asset is included in the latest date on which it can repay regardless of early repayment, whereas the liability is included at the earliest possible date that the conditions could be fulfilled without considering the probability of the conditions being met.
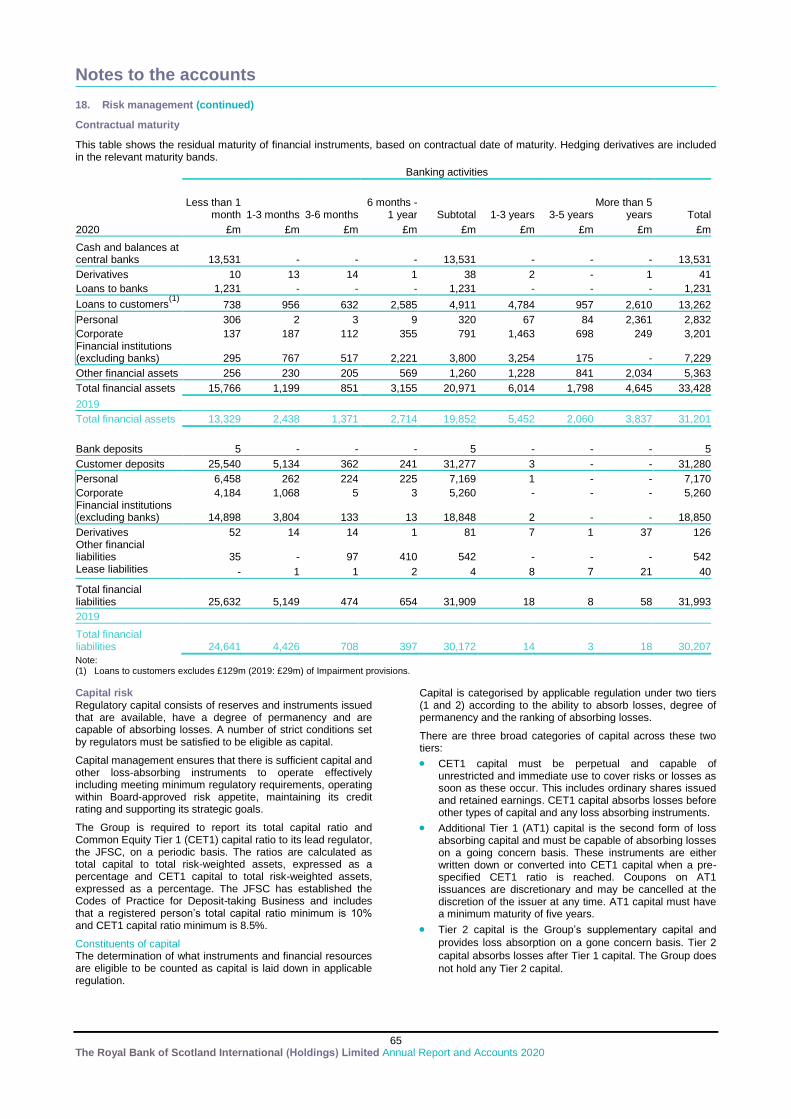
Notes to the accounts
65 The Royal Bank of Scotland International (Holdings) Limited Annual Report and Accounts 2020
18. Risk management (continued)
Contractual maturity
This table shows the residual maturity of financial instruments, based on contractual date of maturity. Hedging derivatives are included in the relevant maturity bands.
2020
Banking activities
Less than 1 month 1-3 months 3-6 months
6 months - 1 year Subtotal 1-3 years 3-5 years
More than 5 years Total
£m £m £m £m £m £m £m £m £m
Cash and balances at central banks 13,531 - - - 13,531 - - - 13,531
Derivatives 10 13 14 1 38 2 - 1 41
Loans to banks 1,231 - - - 1,231 - - - 1,231
Loans to customers(1)
738 956 632 2,585 4,911 4,784 957 2,610 13,262
Personal 306 2 3 9 320 67 84 2,361 2,832
Corporate 137 187 112 355 791 1,463 698 249 3,201 Financial institutions (excluding banks) 295 767 517 2,221 3,800 3,254 175 - 7,229
Other financial assets 256 230 205 569 1,260 1,228 841 2,034 5,363
Total financial assets 15,766 1,199 851 3,155 20,971 6,014 1,798 4,645 33,428
2019 Total financial assets 13,329 2,438 1,371 2,714 19,852 5,452 2,060 3,837 31,201
Bank deposits 5 - - - 5 - - - 5
Customer deposits 25,540 5,134 362 241 31,277 3 - - 31,280
Personal 6,458 262 224 225 7,169 1 - - 7,170
Corporate 4,184 1,068 5 3 5,260 - - - 5,260 Financial institutions (excluding banks) 14,898 3,804 133 13 18,848 2 - - 18,850
Derivatives 52 14 14 1 81 7 1 37 126 Other financial liabilities 35 - 97 410 542 - - - 542 Lease liabilities - 1 1 2 4 8 7 21 40
Total financial liabilities 25,632 5,149 474 654 31,909 18 8 58 31,993
2019
Total financial liabilities 24,641 4,426 708 397 30,172 14 3 18 30,207
Note: (1) Loans to customers excludes £129m (2019: £29m) of Impairment provisions.
Capital risk Regulatory capital consists of reserves and instruments issued that are available, have a degree of permanency and are capable of absorbing losses. A number of strict conditions set by regulators must be satisfied to be eligible as capital.
Capital management ensures that there is sufficient capital and other loss-absorbing instruments to operate effectively including meeting minimum regulatory requirements, operating within Board-approved risk appetite, maintaining its credit rating and supporting its strategic goals.
The Group is required to report its total capital ratio and Common Equity Tier 1 (CET1) capital ratio to its lead regulator, the JFSC, on a periodic basis. The ratios are calculated as total capital to total risk-weighted assets, expressed as a percentage and CET1 capital to total risk-weighted assets, expressed as a percentage. The JFSC has established the Codes of Practice for Deposit-taking Business and includes that a registered person’s total capital ratio minimum is 10% and CET1 capital ratio minimum is 8.5%.
Constituents of capital The determination of what instruments and financial resources are eligible to be counted as capital is laid down in applicable regulation.
Capital is categorised by applicable regulation under two tiers (1 and 2) according to the ability to absorb losses, degree of permanency and the ranking of absorbing losses.
There are three broad categories of capital across these two tiers:
CET1 capital must be perpetual and capable of unrestricted and immediate use to cover risks or losses as soon as these occur. This includes ordinary shares issued and retained earnings. CET1 capital absorbs losses before other types of capital and any loss absorbing instruments.
Additional Tier 1 (AT1) capital is the second form of loss absorbing capital and must be capable of absorbing losses on a going concern basis. These instruments are either written down or converted into CET1 capital when a pre-specified CET1 ratio is reached. Coupons on AT1 issuances are discretionary and may be cancelled at the discretion of the issuer at any time. AT1 capital must have a minimum maturity of five years.
Tier 2 capital is the Group’s supplementary capital and
provides loss absorption on a gone concern basis. Tier 2
capital absorbs losses after Tier 1 capital. The Group does
not hold any Tier 2 capital.
Notes to the accounts
66 The Royal Bank of Scotland International (Holdings) Limited Annual Report and Accounts 2020
18. Risk management (continued) Pension risk Definition Pension risk is the risk to the Group caused by its contractual or other liabilities to, or with respect to, a pension scheme (whether established for its employees or those of a related company or otherwise). It is also the risk that the Group will make payments or other contributions to, or with respect to, a pension scheme because of a moral obligation or because the Group considers that it needs to do so for some other reason. Sources of risk The main source of pension risk for the Group is through its largest scheme, the International Pensions Trust (IPT). Further detail on the Group’s pension obligations can be found in Note 4 on the accounts. The Group is exposed to the risk that the schemes’ assets, together with future investment returns and additional future contributions, are estimated to be insufficient to meet liabilities as they fall due. In such circumstances, the Group could be obliged (or might choose) to make additional contributions to the schemes, or be required to hold additional capital to mitigate such risk. Key developments in 2020
There have been no material changes to the Group’s exposure to pension risk during the year, and the positions of the schemes that the Group sponsors have remained resilient despite the challenges caused by COVID-19.
Further liability driven investment was carried out in early 2020 following the payment of an £80m contribution in December 2019.
The next triennial actuarial valuation for the IPT will have an effective date of 31 March 2021. The expectation is that agreement will be reached with the Trustee such that no additional contributions are needed.
The Group with the support of the trustees of IOMPF and IOMWO funds proposed a merger of the funds into the RBSIPT. Following engagement with the trustees and the membership of the IOMPF and IOMWO funds, the Transfer Agreement was signed in December 2020. The effective date of the merger is expected to be 1 March 2021, subject to final conditions being satisfied. On completion, the merger will result in a single de-segregated scheme, with some changes to and alignment of benefits. The effect of the merger, including the changes to benefits, will be recognised when the final conditions are met.
Governance, risk appetite and controls The RBSI Pension Forum receives authority from the Board and is responsible for taking decisions or making recommendations in relation to the financial, compliance, policy and operational structure of the Group’s pension arrangements. Where authority is not delegated, the Forum makes recommendations to the Group’s Chief Financial Officer or the Board, depending on the materiality of the issue. The Group’s Board retains ultimate authority for decision making. Monitoring and measurement The RBSI Pension Forum formulates the Group view of pension risk and provides a governance framework for all the Group’s pension schemes. The Group calculates stochastic stresses on its material defined benefit pension schemes each year. These tests are used to satisfy the requests of regulatory bodies such as the Bank of England. The stress calculations also form the basis of the pension risk Pillar 2 charge in the Royal Bank of Scotland International Limited ICAAP.
Mitigation The trustee board of the IPT is solely responsible for the investment of scheme assets which are held separately from the assets of the Group. The trustee board has taken measures to mitigate risk including adopting a diversified investment strategy and investing in liability driven investments, so that changes in the value of the liabilities will be partially matched by changes in the asset values, thus reducing volatility of the scheme’s funding position.
In managing the assets of the IPT, the trustee board also takes account of, and gives consideration to, the ability of investment managers to effectively deal with environmental, social and governance issues.
Compliance & conduct risk
Definition Compliance risk is the risk that the behaviour of the Group
towards customers fails to comply with laws, regulations, rules,
standards and codes of conduct. Such a failure may lead to
breaches of regulatory requirements, organisational standards
or customer expectations and could result in legal or regulatory
sanctions, material financial loss or reputational damage.
Conduct risk is the risk that the conduct of the Group and its
subsidiaries and its staff towards customers – or in the markets
in which it operates – leads to unfair or inappropriate customer
outcomes and results in reputational damage, financial loss or
both.
Sources of risk Compliance and conduct risks exist across all stages of the
Group’s relationships with its customers and arise from a
variety of activities including product design, marketing and
sales, complaint handling, staff training, and handling of
confidential insider information.
Key developments in 2020
Through the development and enhancement of the Group’s upstream risk process, the Group was better positioned to ensure that future regulatory change was captured and tracked and implemented in a timely manner. The Group participated in a NatWest Group digital rules mapping programme that will further enhance this capability in 2021.
Challenges presented by COVID-19 forced the Group to move at pace to revise its processes and service delivery. This was managed through robust governance processes whereby purpose led decision making related to customer facing product and service delivery, without evidence of increased Compliance or Conduct Risk was seen. Notwithstanding, a number of projects with regulatory change drivers were paused requiring increased regulator engagement.
Governance The Group defines appropriate standards of compliance and conduct and ensures adherence to those standards through its risk management framework. Relevant compliance and conduct matters are escalated through the Board Risk Committee.
Risk appetite Risk appetite for compliance and conduct risks is set at Board level. Risk appetite statements articulate the levels of risk that legal entities, businesses and functions work within when pursuing their strategic objectives and business plans.
Notes to the accounts
67 The Royal Bank of Scotland International (Holdings) Limited Annual Report and Accounts 2020
18. Risk management (continued)
Compliance & conduct risk continued
A range of controls is operated to ensure the business delivers good customer outcomes and is conducted in accordance with legal and regulatory requirements. A suite of policies addressing compliance and conduct risks set appropriate standards across the Group. Examples of these include the Complaints Management Policy, Client Assets & Money Policy, and Product Lifecycle Policy as well as policies relating to customers in vulnerable situations, cross-border activities and market abuse. Continuous monitoring and targeted assurance is carried out as appropriate.
Monitoring and measurement Compliance and conduct risks are measured and managed through continuous assessment and reporting to the Group’s senior risk committees and at Board level. The compliance and conduct risk framework facilitates the consistent monitoring and measurement of compliance with laws and regulations and the delivery of consistently good customer outcomes. The first line of defence is responsible for effective risk identification, reporting and monitoring, with oversight, challenge and review by the second line. Compliance and conduct risk management is also integrated into the Group’s strategic planning cycle.
Mitigation Activity to mitigate the most-material compliance and conduct risks is carried out across the Group. Examples of mitigation include consideration of customer needs in business and product planning, targeted training, complaints management, as well as independent monitoring activity. Internal policies help support a strong customer focus across the Group.
Financial crime risk
Definition Financial crime risk is presented by criminal activity in the form of money laundering, terrorist financing, bribery and corruption, sanctions and tax evasion.
Sources of risk Financial crime risk may be presented if the Group’s customers, employees or third parties undertake or facilitate financial crime, or if the Group’s products or services are used to facilitate such crime. Financial crime risk is an inherent risk across all lines of business.
Key developments in 2020
A new system has been implemented to identify any adverse press related to customers or their key principals.
All RBSI customers are now screened by the NWG preferred tool ensuring centralised expertise is available to detect and disrupt threats to the Group and its customers.
Following the move of the London book to RBSI, a review and uplift of the due diligence was completed for the customers.
Governance The Financial Crime Review Forum is the principal financial crime risk management forum. The forum reviews and, where appropriate, escalates material financial crime risks and issues across the Group. It is represented by all three lines of defence.
Risk appetite There is no appetite to operate in an environment where systems and controls do not enable the identification, assessment, monitoring, management and mitigation of financial crime risk. The Group’s systems and controls must be comprehensive and proportionate to the nature, scale and complexity of its businesses. There is no tolerance to systematically or repeatedly breach relevant financial crime regulations and laws.
The Group operates a framework of preventative and detective controls designed to mitigate the risk that it could facilitate
financial crime. These controls are supported by a suite of policies, procedures and detailed instructions to ensure they operate effectively.
Monitoring and measurement Financial crime risks are identified and reported through continuous risk management and regular monthly reporting to the Financial Crime Risk Forum and other risk governance committees. Quantitative and qualitative data is reviewed and assessed to measure whether financial crime risk is within risk appetite.
Mitigation Through the financial crime framework, relevant policies, systems, processes and controls are used to mitigate financial crime risk. This includes the use of dedicated screening and monitoring controls to identify people, organisations, transactions and behaviours that may require further investigation or other actions. Centralised Group expertise is available to detect and disrupt threats to the Group and its customers. Intelligence is shared with law enforcement, regulators and government bodies to strengthen jurisdictional defences against those who would misuse the financial system for criminal motives.
Climate-related risk
Definition Climate-related risk is the threat of financial loss or adverse non-financial impacts associated with climate change and the political, economic and environmental responses to it.
Sources of risk Physical risks may arise from climate and weather-related events such as heatwaves, droughts, floods, storms and sea level rises. They can potentially result in financial losses, impairing asset values and the creditworthiness of borrowers. The Group could be exposed to physical risks directly by the effects on its property portfolio and, indirectly, by the impacts on the wider economy as well as on the property and business interests of its customers.
Transition risks may arise from the process of adjustment towards a low-carbon economy. Changes in policy, technology and sentiment could prompt reassessment of customers’ financial risk and may lead to falls in the value of a large range of assets. The Group could be exposed to transition risks directly through the costs of adaptation within economic sectors and markets as well as supply chain disruption leading to financial impacts on it and its customers. Potential indirect effects include the erosion of the Group’s competitiveness, profitability, or reputation damage.
Within these broad categories specific climate risk factors have been identified, which give rise to climate-related risks over the short, medium and long-term.
Risk governance The Board is responsible for monitoring and overseeing climate-related risk within the Group’s overall business strategy and risk appetite.
Where climate-related risk is deemed to have a material impact on a particular risk discipline, then changes to policies and procedures will be made accordingly in 2021 and onwards. Availability of data and the robustness of risk measurement methodologies will influence the timing of any proposed changes.
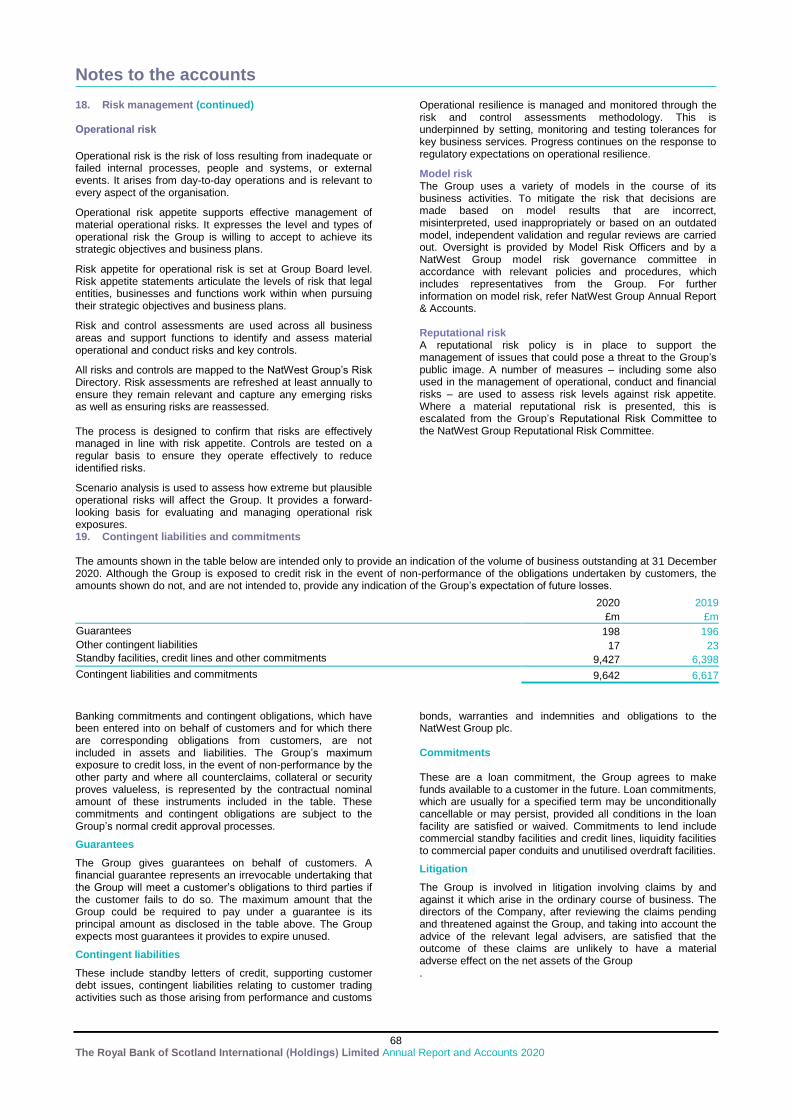
Notes to the accounts
68 The Royal Bank of Scotland International (Holdings) Limited Annual Report and Accounts 2020
18. Risk management (continued) Operational risk
Operational risk is the risk of loss resulting from inadequate or failed internal processes, people and systems, or external events. It arises from day-to-day operations and is relevant to every aspect of the organisation.
Operational risk appetite supports effective management of material operational risks. It expresses the level and types of operational risk the Group is willing to accept to achieve its strategic objectives and business plans.
Risk appetite for operational risk is set at Group Board level. Risk appetite statements articulate the levels of risk that legal entities, businesses and functions work within when pursuing their strategic objectives and business plans.
Risk and control assessments are used across all business areas and support functions to identify and assess material operational and conduct risks and key controls.
All risks and controls are mapped to the NatWest Group’s Risk Directory. Risk assessments are refreshed at least annually to ensure they remain relevant and capture any emerging risks as well as ensuring risks are reassessed. The process is designed to confirm that risks are effectively managed in line with risk appetite. Controls are tested on a regular basis to ensure they operate effectively to reduce identified risks.
Scenario analysis is used to assess how extreme but plausible operational risks will affect the Group. It provides a forward-looking basis for evaluating and managing operational risk exposures.
Operational resilience is managed and monitored through the risk and control assessments methodology. This is underpinned by setting, monitoring and testing tolerances for key business services. Progress continues on the response to regulatory expectations on operational resilience.
Model risk The Group uses a variety of models in the course of its business activities. To mitigate the risk that decisions are made based on model results that are incorrect, misinterpreted, used inappropriately or based on an outdated model, independent validation and regular reviews are carried out. Oversight is provided by Model Risk Officers and by a NatWest Group model risk governance committee in accordance with relevant policies and procedures, which includes representatives from the Group. For further information on model risk, refer NatWest Group Annual Report & Accounts. Reputational risk A reputational risk policy is in place to support the management of issues that could pose a threat to the Group’s public image. A number of measures – including some also used in the management of operational, conduct and financial risks – are used to assess risk levels against risk appetite. Where a material reputational risk is presented, this is escalated from the Group’s Reputational Risk Committee to the NatWest Group Reputational Risk Committee.
19. Contingent liabilities and commitments The amounts shown in the table below are intended only to provide an indication of the volume of business outstanding at 31 December 2020. Although the Group is exposed to credit risk in the event of non-performance of the obligations undertaken by customers, the amounts shown do not, and are not intended to, provide any indication of the Group’s expectation of future losses.
2020 2019
£m £m
Guarantees 198 196
Other contingent liabilities 17 23 Standby facilities, credit lines and other commitments 9,427 6,398
Contingent liabilities and commitments 9,642 6,617
Banking commitments and contingent obligations, which have been entered into on behalf of customers and for which there are corresponding obligations from customers, are not included in assets and liabilities. The Group’s maximum exposure to credit loss, in the event of non-performance by the other party and where all counterclaims, collateral or security proves valueless, is represented by the contractual nominal amount of these instruments included in the table. These commitments and contingent obligations are subject to the Group’s normal credit approval processes.
Guarantees
The Group gives guarantees on behalf of customers. A financial guarantee represents an irrevocable undertaking that the Group will meet a customer’s obligations to third parties if the customer fails to do so. The maximum amount that the Group could be required to pay under a guarantee is its principal amount as disclosed in the table above. The Group expects most guarantees it provides to expire unused.
Contingent liabilities
These include standby letters of credit, supporting customer debt issues, contingent liabilities relating to customer trading activities such as those arising from performance and customs
bonds, warranties and indemnities and obligations to the NatWest Group plc. Commitments These are a loan commitment, the Group agrees to make funds available to a customer in the future. Loan commitments, which are usually for a specified term may be unconditionally cancellable or may persist, provided all conditions in the loan facility are satisfied or waived. Commitments to lend include commercial standby facilities and credit lines, liquidity facilities to commercial paper conduits and unutilised overdraft facilities.
Litigation
The Group is involved in litigation involving claims by and against it which arise in the ordinary course of business. The directors of the Company, after reviewing the claims pending and threatened against the Group, and taking into account the advice of the relevant legal advisers, are satisfied that the outcome of these claims are unlikely to have a material adverse effect on the net assets of the Group .
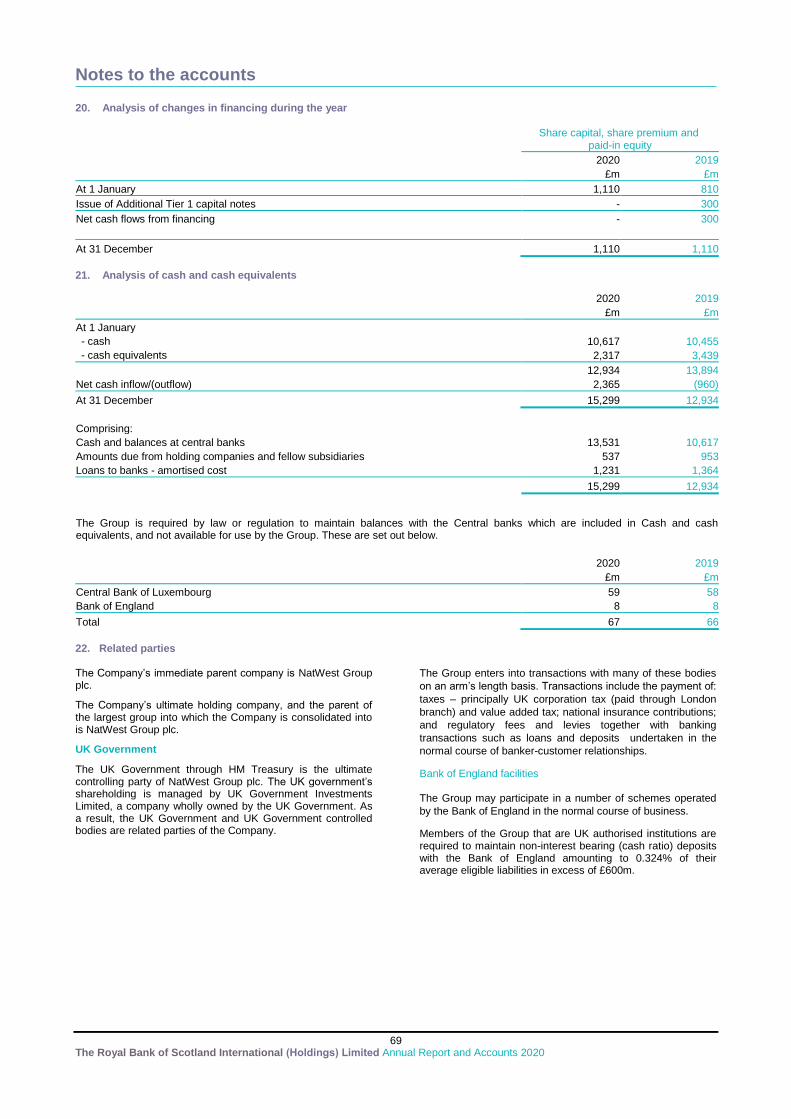
Notes to the accounts
69 The Royal Bank of Scotland International (Holdings) Limited Annual Report and Accounts 2020
20. Analysis of changes in financing during the year
Share capital, share premium and
paid-in equity
2020 2019
£m £m
At 1 January 1,110 810
Issue of Additional Tier 1 capital notes - 300
Net cash flows from financing - 300
At 31 December 1,110 1,110
21. Analysis of cash and cash equivalents
2020 2019
£m £m
At 1 January - cash 10,617 10,455
- cash equivalents 2,317 3,439
12,934 13,894
Net cash inflow/(outflow) 2,365 (960)
At 31 December 15,299 12,934
Comprising: Cash and balances at central banks 13,531 10,617
Amounts due from holding companies and fellow subsidiaries 537 953
Loans to banks - amortised cost 1,231 1,364
15,299 12,934
The Group is required by law or regulation to maintain balances with the Central banks which are included in Cash and cash equivalents, and not available for use by the Group. These are set out below.
2020 2019
£m £m
Central Bank of Luxembourg 59 58
Bank of England 8 8
Total 67 66
22. Related parties The Company’s immediate parent company is NatWest Group plc.
The Company’s ultimate holding company, and the parent of the largest group into which the Company is consolidated into is NatWest Group plc.
UK Government
The UK Government through HM Treasury is the ultimate controlling party of NatWest Group plc. The UK government’s shareholding is managed by UK Government Investments Limited, a company wholly owned by the UK Government. As a result, the UK Government and UK Government controlled bodies are related parties of the Company.
The Group enters into transactions with many of these bodies
on an arm’s length basis. Transactions include the payment of:
taxes – principally UK corporation tax (paid through London
branch) and value added tax; national insurance contributions;
and regulatory fees and levies together with banking
transactions such as loans and deposits undertaken in the
normal course of banker-customer relationships. Bank of England facilities The Group may participate in a number of schemes operated
by the Bank of England in the normal course of business. Members of the Group that are UK authorised institutions are required to maintain non-interest bearing (cash ratio) deposits with the Bank of England amounting to 0.324% of their average eligible liabilities in excess of £600m.
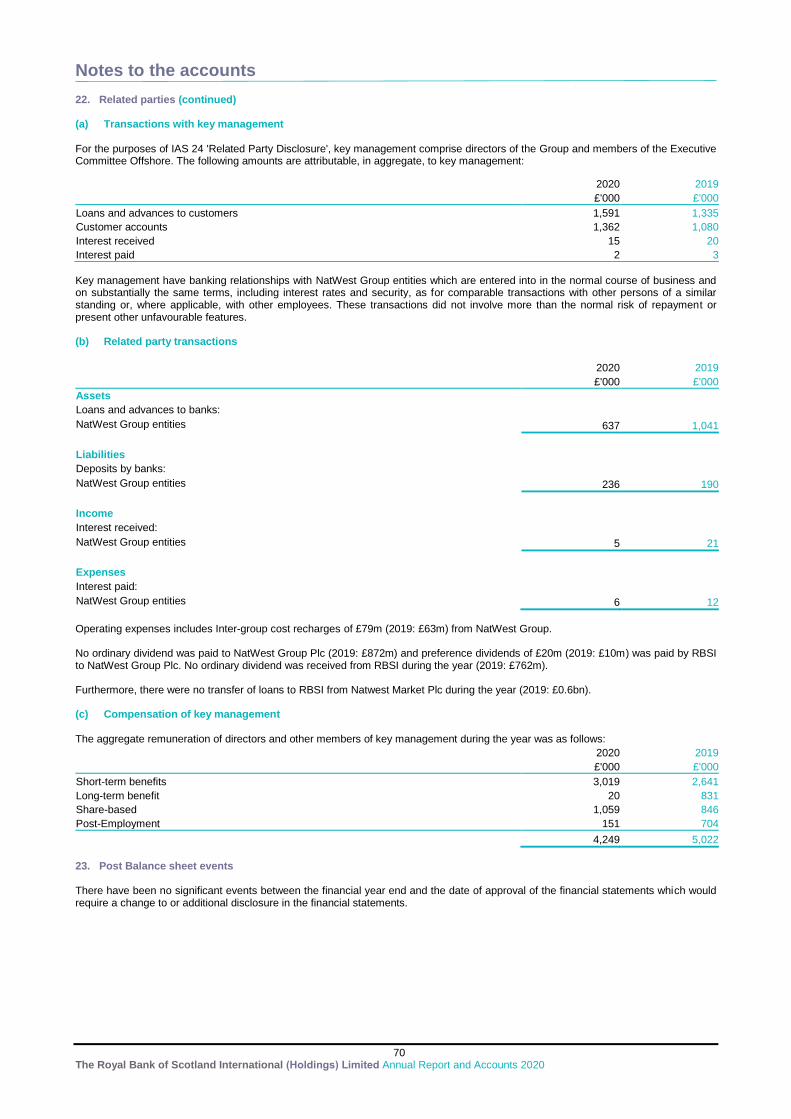
Notes to the accounts
70 The Royal Bank of Scotland International (Holdings) Limited Annual Report and Accounts 2020
22. Related parties (continued) (a) Transactions with key management For the purposes of IAS 24 'Related Party Disclosure', key management comprise directors of the Group and members of the Executive Committee Offshore. The following amounts are attributable, in aggregate, to key management:
2020 2019
£'000 £'000
Loans and advances to customers 1,591 1,335
Customer accounts 1,362 1,080
Interest received 15 20
Interest paid 2 3
Key management have banking relationships with NatWest Group entities which are entered into in the normal course of business and on substantially the same terms, including interest rates and security, as for comparable transactions with other persons of a similar standing or, where applicable, with other employees. These transactions did not involve more than the normal risk of repayment or present other unfavourable features. (b) Related party transactions
2020 2019
£'000 £'000
Assets
Loans and advances to banks:
NatWest Group entities 637 1,041
Liabilities
Deposits by banks:
NatWest Group entities 236 190
Income
Interest received:
NatWest Group entities 5 21
Expenses
Interest paid:
NatWest Group entities 6 12
Operating expenses includes Inter-group cost recharges of £79m (2019: £63m) from NatWest Group. No ordinary dividend was paid to NatWest Group Plc (2019: £872m) and preference dividends of £20m (2019: £10m) was paid by RBSI to NatWest Group Plc. No ordinary dividend was received from RBSI during the year (2019: £762m). Furthermore, there were no transfer of loans to RBSI from Natwest Market Plc during the year (2019: £0.6bn). (c) Compensation of key management The aggregate remuneration of directors and other members of key management during the year was as follows:
2020 2019
£'000 £'000
Short-term benefits 3,019 2,641
Long-term benefit 20 831
Share-based 1,059 846
Post-Employment 151 704
4,249 5,022
23. Post Balance sheet events There have been no significant events between the financial year end and the date of approval of the financial statements which would require a change to or additional disclosure in the financial statements.