Embed Size (px)
Citation preview
1 RBS – Annual results 2016
The Royal Bank of Scotland Group plc Annual results 2016
Contents Page
Introduction 2Highlights 3Chief Executive’s message 16Summary consolidated results 19Analysis of results 21Segment performance 30Statutory results 48Notes 55Statement of directors' responsibilities 63Forward-looking statements 64Appendix 1 – Segmental income statement reconciliations
Contacts
For analyst enquiries: Alexander Holcroft Investor Relations +44 (0) 20 7672 1758 For media enquiries: RBS Press Office +44 (0) 131 523 4205
Analysts and investors conference call RBS will host a presentation for analysts and investors on the results for the year ended 31 December 2016. Details are as follows:
Date: Friday 24 February 2017 Time: 9.30 am UK time
Conference ID: 62910737 Webcast: www.rbs.com/results
Dial in details: International – +44 (0) 1452 568 172 UK Free Call – 0800 694 8082 US Toll Free – 1 866 966 8024
There will also be a call for fixed income analysts and investors. The details are as follows:
Date: Friday 24 February 2017 Time: 1.30 pm UK time Conference ID 57346988 Webcast: www.rbs.com/results Dial in details: International – +44 (0) 1452 568 172
UK Free Call – 0800 694 8082 US Toll Free – 1 866 966 8024
Available on www.rbs.com/results
● Announcements and slides ● Annual Report and Account 2016 ● A financial supplement containing income statement, balance sheet and segment performance
information for the nine quarters ended 31 December 2016 ● Pillar 3 Report 2016 ● Pillar 3 Capital instruments annex
2 RBS – Annual results 2016
Introduction
In this document, ‘RBSG plc’ or the ‘parent company’ refers to The Royal Bank of Scotland Group plc, and ‘RBS’ or the ‘Group’ refers to RBSG plc and its subsidiaries.
Financial information contained in this document does not constitute statutory accounts within the meaning of section 434 of the Companies Act 2006 (‘the Act’). The statutory accounts for the year ended 31 December 2015 have been filed with the Registrar of Companies and those for the year ended 31 December 2016 will be filed with the Registrar of Companies following the company’s Annual General Meeting. The report of the auditor on those statutory accounts was unqualified, did not draw attention to any matters by way of emphasis and did not contain a statement under section 498(2) or (3) of the Act.
The condensed consolidated income statement, condensed consolidated statement of comprehensive income, condensed consolidated balance sheet, condensed consolidated statement of changes in equity, condensed consolidated cash flow statement and related notes presented on pages 48 to 62 inclusive are presented on a statutory basis as described in Note 1.
Key operating indicators As described in Note 1 on page 55, RBS prepares its financial statements in accordance with IFRS as issued by the IASB which constitutes a body of generally accepted accounting principles (‘GAAP’). This document contains a number of adjusted or alternative performance measures, also known as non-GAAP financial measures. These measure exclude certain items which management believe are not representative of the underlying performance of the business and which distort period-on-period comparison. These measures include: ● ‘Adjusted’ measures of financial performance, principally operating performance before: own credit
adjustments; gain or loss on redemption of own debt; strategic disposals; restructuring costs; litigation and conduct costs and write down of goodwill (refer to Appendix 1 for reconciliations of the statutory toadjusted basis);
● Performance, funding and credit metrics such as ‘Return on tangible equity’, ‘adjusted return on tangible equity’ and related RWA equivalents incorporating the effect of capital deductions (RWAes),total assets excluding derivatives (funded assets), net interest margin (NIM) adjusted for itemsdesignated at fair value through profit or loss (non-statutory NIM), cost:income ratio, loan:deposit ratioand REIL/Impairment provision ratios. These are internal metrics used to measure businessperformance;
● Personal & Business Banking (PBB) franchise, combining the reportable segments of UK Personal &Business Banking (UK PBB) and Ulster Bank RoI; and Commercial & Private Banking (CPB)franchise, combining the reportable segments of Commercial Banking, Private Banking and RBS International (RBSI); and
● Cost savings progress and 2016 target calculated using operating expenses excluding litigation and conduct costs, restructuring costs, write down of goodwill, the impairment of other intangible assets,the operating costs of Williams & Glyn and the VAT recovery.
3 RBS – Annual results 2016
Highlights
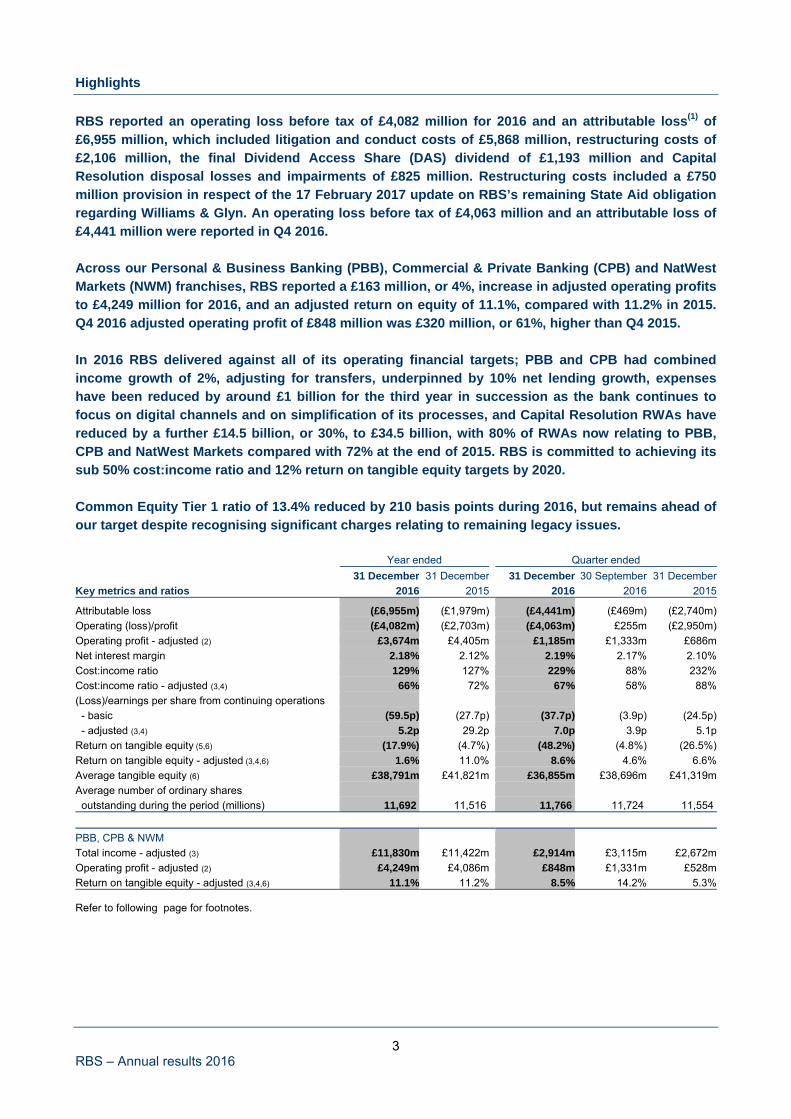
RBS reported an operating loss before tax of £4,082 million for 2016 and an attributable loss(1) of £6,955 million, which included litigation and conduct costs of £5,868 million, restructuring costs of £2,106 million, the final Dividend Access Share (DAS) dividend of £1,193 million and Capital Resolution disposal losses and impairments of £825 million. Restructuring costs included a £750 million provision in respect of the 17 February 2017 update on RBS’s remaining State Aid obligation regarding Williams & Glyn. An operating loss before tax of £4,063 million and an attributable loss of £4,441 million were reported in Q4 2016. Across our Personal & Business Banking (PBB), Commercial & Private Banking (CPB) and NatWest Markets (NWM) franchises, RBS reported a £163 million, or 4%, increase in adjusted operating profits to £4,249 million for 2016, and an adjusted return on equity of 11.1%, compared with 11.2% in 2015. Q4 2016 adjusted operating profit of £848 million was £320 million, or 61%, higher than Q4 2015. In 2016 RBS delivered against all of its operating financial targets; PBB and CPB had combined income growth of 2%, adjusting for transfers, underpinned by 10% net lending growth, expenses have been reduced by around £1 billion for the third year in succession as the bank continues to focus on digital channels and on simplification of its processes, and Capital Resolution RWAs have reduced by a further £14.5 billion, or 30%, to £34.5 billion, with 80% of RWAs now relating to PBB, CPB and NatWest Markets compared with 72% at the end of 2015. RBS is committed to achieving its sub 50% cost:income ratio and 12% return on tangible equity targets by 2020. Common Equity Tier 1 ratio of 13.4% reduced by 210 basis points during 2016, but remains ahead of our target despite recognising significant charges relating to remaining legacy issues. Year ended Quarter ended
31 December 31 December 31 December 30 September 31 December
Key metrics and ratios 2016 2015 2016 2016 2015
Attributable loss (£6,955m) (£1,979m) (£4,441m) (£469m) (£2,740m)
Operating (loss)/profit (£4,082m) (£2,703m) (£4,063m) £255m (£2,950m)
Operating profit - adjusted (2) £3,674m £4,405m £1,185m £1,333m £686m
Net interest margin 2.18% 2.12% 2.19% 2.17% 2.10%
Cost:income ratio 129% 127% 229% 88% 232%
Cost:income ratio - adjusted (3,4) 66% 72% 67% 58% 88%
(Loss)/earnings per share from continuing operations
- basic (59.5p) (27.7p) (37.7p) (3.9p) (24.5p)
- adjusted (3,4) 5.2p 29.2p 7.0p 3.9p 5.1p
Return on tangible equity (5,6) (17.9%) (4.7%) (48.2%) (4.8%) (26.5%)
Return on tangible equity - adjusted (3,4,6) 1.6% 11.0% 8.6% 4.6% 6.6%
Average tangible equity (6) £38,791m £41,821m £36,855m £38,696m £41,319m
Average number of ordinary shares
outstanding during the period (millions) 11,692 11,516 11,766 11,724 11,554
PBB, CPB & NWM
Total income - adjusted (3) £11,830m £11,422m £2,914m £3,115m £2,672m
Operating profit - adjusted (2) £4,249m £4,086m £848m £1,331m £528m
Return on tangible equity - adjusted (3,4,6) 11.1% 11.2% 8.5% 14.2% 5.3%
Refer to following page for footnotes.
4 RBS – Annual results 2016
Highlights
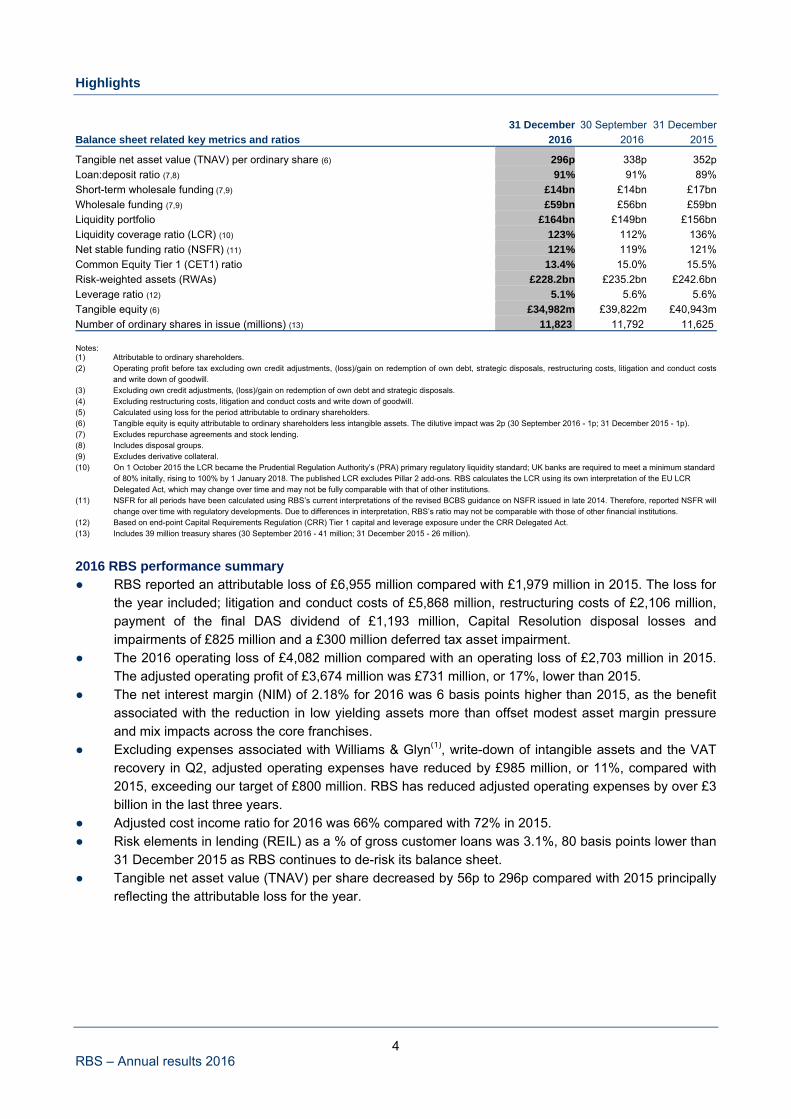
31 December 30 September 31 December
Balance sheet related key metrics and ratios 2016 2016 2015
Tangible net asset value (TNAV) per ordinary share (6) 296p 338p 352p
Loan:deposit ratio (7,8) 91% 91% 89%
Short-term wholesale funding (7,9) £14bn £14bn £17bn
Wholesale funding (7,9) £59bn £56bn £59bn
Liquidity portfolio £164bn £149bn £156bn
Liquidity coverage ratio (LCR) (10) 123% 112% 136%
Net stable funding ratio (NSFR) (11) 121% 119% 121%
Common Equity Tier 1 (CET1) ratio 13.4% 15.0% 15.5%
Risk-weighted assets (RWAs) £228.2bn £235.2bn £242.6bn
Leverage ratio (12) 5.1% 5.6% 5.6%
Tangible equity (6) £34,982m £39,822m £40,943m
Number of ordinary shares in issue (millions) (13) 11,823 11,792 11,625 Notes: (1) Attributable to ordinary shareholders. (2) Operating profit before tax excluding own credit adjustments, (loss)/gain on redemption of own debt, strategic disposals, restructuring costs, litigation and conduct costs
and write down of goodwill. (3) Excluding own credit adjustments, (loss)/gain on redemption of own debt and strategic disposals. (4) Excluding restructuring costs, litigation and conduct costs and write down of goodwill. (5) Calculated using loss for the period attributable to ordinary shareholders. (6) Tangible equity is equity attributable to ordinary shareholders less intangible assets. The dilutive impact was 2p (30 September 2016 - 1p; 31 December 2015 - 1p). (7) Excludes repurchase agreements and stock lending. (8) Includes disposal groups. (9) Excludes derivative collateral. (10) On 1 October 2015 the LCR became the Prudential Regulation Authority’s (PRA) primary regulatory liquidity standard; UK banks are required to meet a minimum standard
of 80% initally, rising to 100% by 1 January 2018. The published LCR excludes Pillar 2 add-ons. RBS calculates the LCR using its own interpretation of the EU LCR Delegated Act, which may change over time and may not be fully comparable with that of other institutions.
(11) NSFR for all periods have been calculated using RBS’s current interpretations of the revised BCBS guidance on NSFR issued in late 2014. Therefore, reported NSFR will change over time with regulatory developments. Due to differences in interpretation, RBS’s ratio may not be comparable with those of other financial institutions.
(12) Based on end-point Capital Requirements Regulation (CRR) Tier 1 capital and leverage exposure under the CRR Delegated Act. (13) Includes 39 million treasury shares (30 September 2016 - 41 million; 31 December 2015 - 26 million).
2016 RBS performance summary ● RBS reported an attributable loss of £6,955 million compared with £1,979 million in 2015. The loss for
the year included; litigation and conduct costs of £5,868 million, restructuring costs of £2,106 million,payment of the final DAS dividend of £1,193 million, Capital Resolution disposal losses andimpairments of £825 million and a £300 million deferred tax asset impairment.
● The 2016 operating loss of £4,082 million compared with an operating loss of £2,703 million in 2015. The adjusted operating profit of £3,674 million was £731 million, or 17%, lower than 2015.
● The net interest margin (NIM) of 2.18% for 2016 was 6 basis points higher than 2015, as the benefitassociated with the reduction in low yielding assets more than offset modest asset margin pressure and mix impacts across the core franchises.
● Excluding expenses associated with Williams & Glyn(1), write-down of intangible assets and the VAT recovery in Q2, adjusted operating expenses have reduced by £985 million, or 11%, compared with 2015, exceeding our target of £800 million. RBS has reduced adjusted operating expenses by over £3billion in the last three years.
● Adjusted cost income ratio for 2016 was 66% compared with 72% in 2015. ● Risk elements in lending (REIL) as a % of gross customer loans was 3.1%, 80 basis points lower than
31 December 2015 as RBS continues to de-risk its balance sheet. ● Tangible net asset value (TNAV) per share decreased by 56p to 296p compared with 2015 principally
reflecting the attributable loss for the year.
5 RBS – Annual results 2016
Highlights
PBB, CPB and NatWest Markets delivered increased profits and strong lending growth ● RBS reported an adjusted operating profit of £4,249 million across PBB, CPB and NatWest Markets,
4% higher than 2015 and an average of over £1 billion a quarter. ● Income across PBB and CPB increased by 2% in 2016 compared with 2015, adjusting for transfers(2),
as increased lending volumes more than offset reduced margins. NatWest Markets adjusted income of £1,521 million increased by 16% compared with 2015, adjusting for transfers(2), driven by Rates and Currencies.
● PBB and CPB net loans and advances of £272.1 billion have increased by 10% in 2016, compared with a target of 4%, reflecting strong growth across both residential mortgages and commercial lending.
● Adjusted cost income ratio improved to 63% compared with 65% in 2015 as we continue to deliverefficiencies across PBB, CPB and NatWest Markets.
RBS continues to address its remaining legacy issues and drive forward its restructuring programme ● Restructuring costs were £2,106 million for 2016, compared with £2,931 million in 2015, and included
a £750 million provision in respect of the plan by the Commissioner responsible for EU competitionpolicy to propose to the College of Commissioners to open proceedings to gather evidence on analternative plan for RBS to meet its remaining State Aid obligations in respect of Williams & Glyn. Ifadopted, this alternative plan would replace the existing requirement to achieve separation anddivestment by 31 December 2017. In addition, £706 million of the remaining restructuring costs relatedto Williams & Glyn, including £146 million of termination costs associated with the decision todiscontinue the programme to create a cloned banking platform.
● Litigation and conduct costs of £5,868 million included; a £3,107 million provision in relation to various investigations and litigation matters relating to RBS’s issuance and underwriting of residentialmortgage-backed securities (RMBS), an additional charge in respect of the settlement with theNational Credit Union Administration Board to resolve two outstanding RMBS lawsuits, a provision in respect of the UK 2008 rights issue shareholder litigation, additional PPI provisions, a provision in respect of the FCA review of RBS’s treatment of SMEs and a provision in Ulster Bank RoI in respectof an industry wide examination of tracker mortgages.
● A net strategic disposal gain of £164 million includes a £246 million gain on disposal of RBS’s stake inVisa Europe partially offset by losses associated with the sale of our Russian subsidiary and exit ofKazakhstan.
6 RBS – Annual results 2016
Highlights
PBB, CPB and NatWest Markets operating performance ● Across our three customer facing franchises, PBB, CPB and NatWest Markets, adjusted operating
profit of £4,249 million, was £163 million, or 4% higher than 2015.
○ UK PBB adjusted operating profit of £2,202 million was £33 million, or 2%, higher than 2015 as increased income and reduced costs were partially offset by increased impairments. Total income increased by £90 million, or 2%, to £5,290 million compared with 2015 as the benefit of increasedlending more than offset reduced margins, down 17 basis points to 3.01%, and lower fee income, reflecting reduced credit card interchange fees and increased cash back payments following thelaunch of the Reward account. Net loans and advances increased by 10% to £132.1 billion in 2016 principally driven by mortgage growth.
○ Ulster Bank RoI adjusted operating profit of £229 million was £35 million lower than 2015 principally reflecting a £28 million reduction in net impairments releases. REIL decreased by £1.3 billion in Q42016 largely driven by the sale of a portfolio of distressed loans.
○ Commercial Banking adjusted operating profit of £1,273 million was £111 million, or 8%, lower than 2015 primarily reflecting a £137 million increase in net impairment losses, largely driven by a single name charge in respect of the oil and gas portfolio. Adjusting for business transfers, total income increased by £21 million, or 1%, reflecting higher asset and deposit volumes partially offset by asset margin pressure. Net loans and advances increased by 10% in 2016 to £100.1 billion.
○ Private Banking(3) adjusted operating profit of £149 million increased by £36 million, or 32%, compared with 2015 as increased asset volumes drove a £13 million, or 2%, uplift in income andcost efficiencies resulted in a £7 million, or 1%, reduction in adjusted operating expenses. Inaddition, net impairment losses reduced by £16 million.
○ RBS International adjusted operating profit of £195 million was £16 million, or 8%, lower than 2015 largely reflecting a £13 million, or 8%, increase in adjusted operating expenses, driven by a number of one-off charges, and a £10 million net impairment loss in 2016. Partially offsetting, total incomeincreased by £7 million, or 2%, driven by increased asset volumes.
○ NatWest Markets adjusted income of £1,521 million was 16% higher than 2015, adjusting fortransfers, driven by Rates and Currencies, which benefited from sustained customer activity andfavourable market conditions following the EU referendum and subsequent central bank actions. An adjusted operating profit of £201 million compared with a loss of £55 million in 2015.
Capital Resolution & Central items operating performance ● Capital Resolution adjusted operating loss of £1,432 million compared with a loss of £412 million in
2015 and included disposal losses and impairments of £825 million, of which £683 million related tothe shipping portfolio. RWAs reduced by £14.5 billion in 2016 to £34.5 billion.
● Central items adjusted operating profit of £455 million compared with £272 million in 2015 andincluded a £349 million FX gain, principally associated with the weakening of sterling against the USdollar, a £227 million VAT recovery, a £97 million foreign exchange reserve recycling gain and othergains, partially offset by a £510 million loss in respect of IFRS volatility(4) due to reductions in long terminterest rates (2015 - £15 million profit).
7 RBS – Annual results 2016
Highlights
Q4 2016 RBS performance summary ● An attributable loss of £4,441 million compared with a loss of £2,740 million in Q4 2015 and a loss of
£469 million in Q3 2016. The Q4 2016 loss included a litigation and conduct charge of £4,128 millionand restructuring costs of £1,007 million.
● Q4 2016 adjusted operating profit of £1,185 million was £499 million, or 73%, higher than Q4 2015 butwas £148 million lower than Q3 2016 largely reflecting the £190 million UK bank levy charge.
● Across our three customer facing businesses, PBB, CPB and NatWest Markets, adjusted operatingprofit of £848 million was £320 million, or 61%, higher than Q4 2015. Adjusted RoTE was 8.5%compared with 5.3% in Q4 2015.
● Q4 2016 NIM of 2.19% was 9 basis points higher than Q4 2015 as the benefit associated with thereduction in low yielding assets more than offset modest asset margin pressure and mix impactsacross the core franchises. Compared with Q3 2016, NIM increased by 2 basis points.
● Net loans and advances across PBB and CPB increased by £2.7 billion in Q4 2016 to £272.1 billionprincipally driven by increased mortgage lending in UK PBB.
● TNAV per share reduced by 42p in the quarter to 296p principally reflecting the attributable loss. Delivery against our 2016 targets
Strategy goal 2016 target 2016
Strength and sustainability
Maintain Bank CET1 ratio of 13% CET1 ratio of 13.4%
£2 billion AT1 issuance £2 billion equivalent AT1 issued in Q3 2016
Capital Resolution RWAs around £30-35 billion
RWAs down £14.5 billion to £34.5 billion
Customer experience
Narrow the gap to No.1 in NPS in every primary UK brand
Year on year Commercial Banking have narrowed the gap. NatWest Personal, Ulster Business & Commercial in Northern Ireland and Ulster Business Direct in Republic of Ireland, have seen improvements in NPS.
Simplifying the bank
Reduce operating expenses by £800 million
Operating expenses down £985 million(5)
Supporting growth
Net 4% growth in PBB and CPB customer loans
Net lending in PBB and CPB up 10%
Employee engagement
Raise employee engagement to within two points of the GFS norm
Down 3 points to be 6 points adverse to GFS norm
Notes: (1) Williams & Glyn refers to the business formerly intended to be divested as a separate legal entity and comprises RBS England and Wales branch-based businesses, along
with certain small and medium enterprises and corporate activities across the UK. During the period presented Williams & Glyn has not operated as a separate legal entity. (2) NatWest Markets’ results include the following financials for businesses subsequently transferred to Commercial Banking: total income of £98 million for the year ended
2015. (3) Private Banking serves high net worth individuals through Coutts and Adam & Co. (4) IFRS volatility arises from the changes to fair value of hedges of loans which do not qualify for hedge accounting under IFRS. (5) Cost saving target and progress 2016 calculated using operating expenses excluding restructuring costs £2,106 million (2015 - £2,931 million), litigation and conduct costs
£5,868 (2015 - £3,568 million), write down of goodwill nil (2015 - £498 million), write down of other intangible assets of £117 million (2015 - £75 million), the operating costs of Williams and Glyn £393 million (2015 - £359 million) and the VAT recovery £227 million.
8 RBS – Annual results 2016
Highlights
Building a stronger RBS RBS is progressing with its plan to build a strong, simple, fair bank for customers and shareholders. During 2016, RBS narrowed the range of uncertainty around its capital position by addressing a number of legacy issues, and continued to strengthen its capital base. ● CET1 ratio remains ahead of our 13.0% target at 13.4%, a 210 basis points reduction compared with
Q4 2015 principally reflecting the attributable loss, c.300 basis points, partially offset by a £14.4 billion reduction in RWAs, c.100 basis points. During Q4 2016, CET1 ratio reduced by 160 basis points as the benefit of the reduction in RWAs was more than offset by the attributable loss.
● RWAs reduced by £14.4 billion, or 6%, during 2016 to £228.2 billion driven by £14.5 billion of disposals and run-off in Capital Resolution and a £3.9 billion reduction associated with the removal of Citizensoperational risk RWAs, partially offset by an increase associated with the weakening of sterling andlending growth across our core franchises.
● On 10 August 2016 RBS announced that it had successfully completed the pricing of $2.65 billion8.625% AT1 capital notes, with £4.0 billion equivalent issued since August 2015. (1.8% of Q4 2016 RWAs)
● Leverage ratio reduced by 50 basis points during 2016 to 5.1% reflecting the attributable loss for the year partially offset by the AT1 issuance and reduction in leverage exposure.
● RBS issued £4.2 billion equivalent senior debt, which it expects to be eligible to meet its ‘MinimumRequirement for Own Funds and Eligible Liabilities’ (MREL), in line with our targeted £3-5 billion senior debt issuance for the year. €1.5 billion seven year 2.5% notes and $1.5 billion ten year 4.8% noteswere issued in Q1 2016 and $2.65 billion seven year 3.875% notes were issued in Q3 2016.
● In addition, RBS successfully completed the cash tender of £2.3 billion of certain US dollar, sterlingand euro senior debt securities. The tender offers were part of the ongoing transition to a holdingcompany capital and term funding model in line with regulatory requirements and included securitiesthat RBS considers non-compliant for MREL purposes. In total, during 2016, £10 billion has matured across our funding pools and we have redeemed £8.2 billion though calls and repurchase.
● As part of the 2016 Bank of England stress testing exercise RBS submitted a revised capital plan,incorporating further capital strengthening actions, which was accepted by the PRA Board.
RBS has successfully addressed a number of the remaining legacy issues and continues to de-risk its balance sheet ● During Q1 2016 RBS made the final dividend payment in respect of the DAS, £1,193 million, an action
that was taken to normalise the ownership structure of the Bank. ● In June 2016, the triennial funding valuation of the Main scheme of The Royal Bank of Scotland Group
Pension Fund was agreed which showed that as at 31 December 2015 the value of liabilities exceededthe value of assets by £5.8 billion. In March 2016, to mitigate this anticipated deficit, RBS made a cashpayment of £4.2 billion. The next triennial valuation is due to occur at the end of 2018 with agreementon any additional contributions by the end of March 2020. As at 31 December 2016, the Main Scheme had an unrecognised surplus reflected by a ratio of assets to liabilities of c.115% under IAS 19 valuation principles.
● On 11 April 2016, RBS completed the successful transfer of the Coutts International businesses inAsia and the Middle East to Union Bancaire Privée, the final milestone in the sale of our InternationalPrivate Bank. During 2016 we also completed the sale of our Russia and Kazakhstan subsidiaries.
● Risk elements in lending (REIL) of £10.3 billion were £1.8 billion lower than 31 December 2015 and represented 3.1% of gross customer loans, compared with 3.9% as at 31 December 2015 and 3.8% at 30 September 2016.
● In line with the progress to de-risk the balance sheet, exposures to the shipping and oil and gassectors continued to reduce during 2016, with potential exposures declining by 29% to £5.2 billion andby 22% to £5.3 billion respectively. As at the end of 2016, our total exposure to the coal mining, oil andgas and power generation sectors represented 1.4% of our total lending.
9 RBS – Annual results 2016
Highlights
Building the number one bank for customer service, trust and advocacy in the UK Supporting households and business customers ● RBS continued to deliver strong support for both household and business customers. Within UK PBB,
gross new mortgage lending of £29.8 billion was 29% higher than 2015. Across 2016, our market share of new mortgages was 12%, supporting a growth in stock share to 8.8% at end 2016 from 8.2% at end 2015. As a result, total UK PBB net loans and advances increased by 10% compared with 2015. Commercial Banking net loans and advances have also grown by 10% over the course of 2016reflecting increased borrowing across a number of sectors.
● The Reward account continued to show positive momentum and now has 1,149,000 fee-paying customers compared with 202,000 at 31 December 2015. We have seen positive evidence ofincreased levels of engagement, with overall current account attrition levels falling by 7% in the year. This is particularly evident across our Private and Premium customer, with attrition 12% lower. Wecontinue to embed the product across our population of valuable main bank customers.
● RBS continues to support UK business growth through the launch of 6 new business accelerator hubsin 2016, bringing the total to 12. This included the opening of an Entrepreneurial Centre in ourEdinburgh headquarters. In addition, NatWest launched a £1 billion lending fund to support smallbusinesses.
Investing in our operational capabilities and enhancing digital channels ● RBS continued to make better use of our digital channels to make it simpler to serve our customers
and easier for them to do business with us. We now have 4.2 million customers regularly using ourmobile app in the UK, 19% higher than the end of 2015, and around 60% of our personal customersused a digital channel within the last 90 days. In 2016, we more than doubled the number of customers who purchased a product through our mobile channel compared with 2015. NatWest customers can now apply for personal loans, credit cards and overdrafts via the mobile app, facilitating approximately8% of total applications. Our new business banking ‘Online Account Opening’ service now allows start up business customers to submit an application online in just ten minutes and get a sort code and account number in under an hour.
● Nearly 80% of our commercial customers’ interaction with us is via digital channels, with around 270,000 payments processed every day.
● In addition to our digital channels, RBS continues to provide multiple physical channels for servingcustomers, including access to a network of c.11,500 Post Office branches in the UK, c.1,000 An Post branches in the Republic of Ireland, and 41 mobile banking vans, alongside our existing network of1,425 branches and 4,646 ATMs across PBB.
● RBS became the first UK Bank to be accredited by the Royal National Institute for Blind People forhaving an accessible mobile app for blind and partially sighted customers. In addition, we launched a new service for British Sign Language (BSL) customers, making it possible to instantly chat with anadvisor through a BSL interpreter.
● Coutts won the best private bank in the UK for the fifth year running, best private bank for philanthropyservices and best initiative of the year in client facing technology at the Global Private BankingAwards, and was highly commended for innovation for its ‘Coutts Concierge Online’.
10 RBS – Annual results 2016
Highlights
Investing in our people ● In 2016, RBS was one of only two banks to achieve formal recognition from the Chartered Banker
Professional Standards Board for excellence in implementing, monitoring, reporting and commitmentto the Foundation Standard for Professional Bankers.
● Delivered leadership training to almost 16,000 leaders through a comprehensive ‘Determined to Lead’programme.
● We continue to work towards our goal of having at least 30% senior women in our top three leadershiplayers across each business by 2020 and to be fully gender balanced (50/50) by 2030. As at 31 December 2016, in aggregate terms 34% of our top three leadership layers were female.
● RBS has attained silver status in the Business Disability Forum’s Disability Standard, scoring 88% inits assessment of accessibility and inclusion in the workplace.
● RBS has moved up to 13th place, from 32nd last year, in Stonewall's annual Top 100 employers forlesbian, gay, bi and trans (LGBT) staff, the highest position it has achieved in the index to date.
Customer RBS remains committed to achieving its target of being number one bank for customer service, trust and advocacy by 2020.
We use independent surveys to measure our customers’ experience and track our progress against our goal in each of our markets.
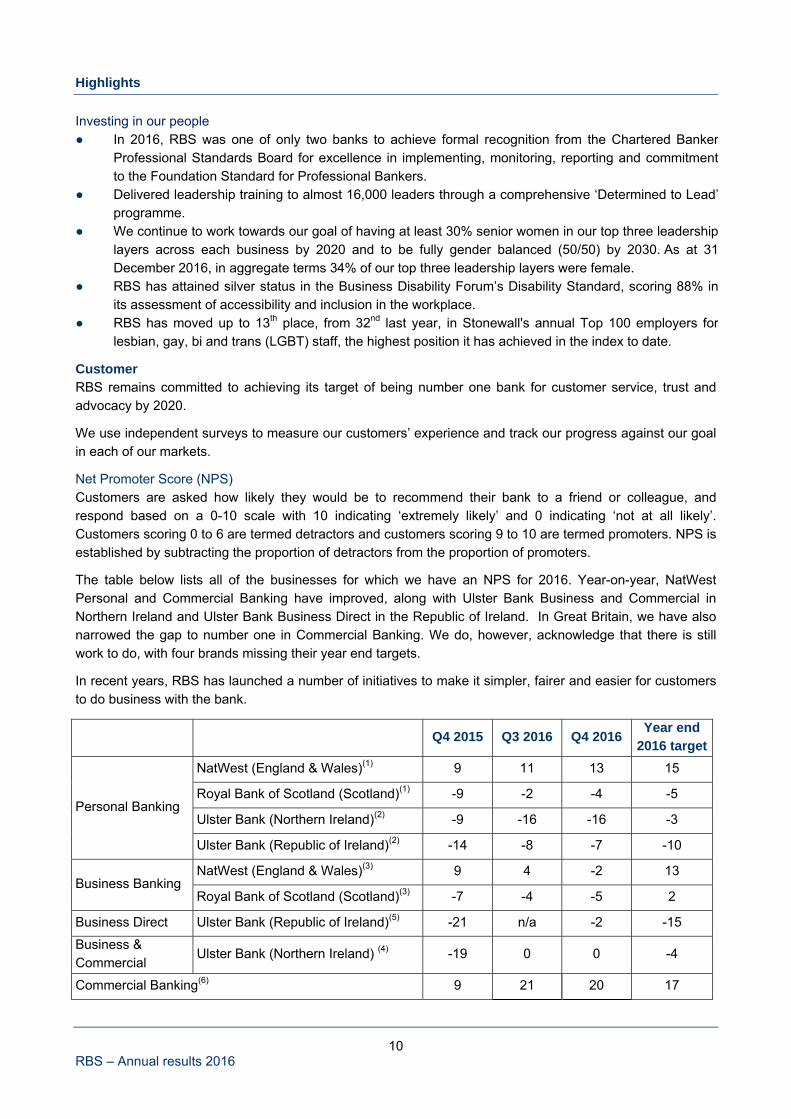
Net Promoter Score (NPS) Customers are asked how likely they would be to recommend their bank to a friend or colleague, and respond based on a 0-10 scale with 10 indicating ‘extremely likely’ and 0 indicating ‘not at all likely’. Customers scoring 0 to 6 are termed detractors and customers scoring 9 to 10 are termed promoters. NPS is established by subtracting the proportion of detractors from the proportion of promoters.
The table below lists all of the businesses for which we have an NPS for 2016. Year-on-year, NatWest Personal and Commercial Banking have improved, along with Ulster Bank Business and Commercial in Northern Ireland and Ulster Bank Business Direct in the Republic of Ireland. In Great Britain, we have also narrowed the gap to number one in Commercial Banking. We do, however, acknowledge that there is still work to do, with four brands missing their year end targets.
In recent years, RBS has launched a number of initiatives to make it simpler, fairer and easier for customers to do business with the bank.
Q4 2015 Q3 2016 Q4 2016
Year end 2016 target
Personal Banking
NatWest (England & Wales)(1) 9 11 13 15
Royal Bank of Scotland (Scotland)(1) -9 -2 -4 -5
Ulster Bank (Northern Ireland)(2) -9 -16 -16 -3
Ulster Bank (Republic of Ireland)(2) -14 -8 -7 -10
Business Banking NatWest (England & Wales)(3) 9 4 -2 13
Royal Bank of Scotland (Scotland)(3) -7 -4 -5 2
Business Direct Ulster Bank (Republic of Ireland)(5) -21 n/a -2 -15
Business & Commercial
Ulster Bank (Northern Ireland) (4) -19 0 0 -4
Commercial Banking(6) 9 21 20 17
11 RBS – Annual results 2016
Highlights
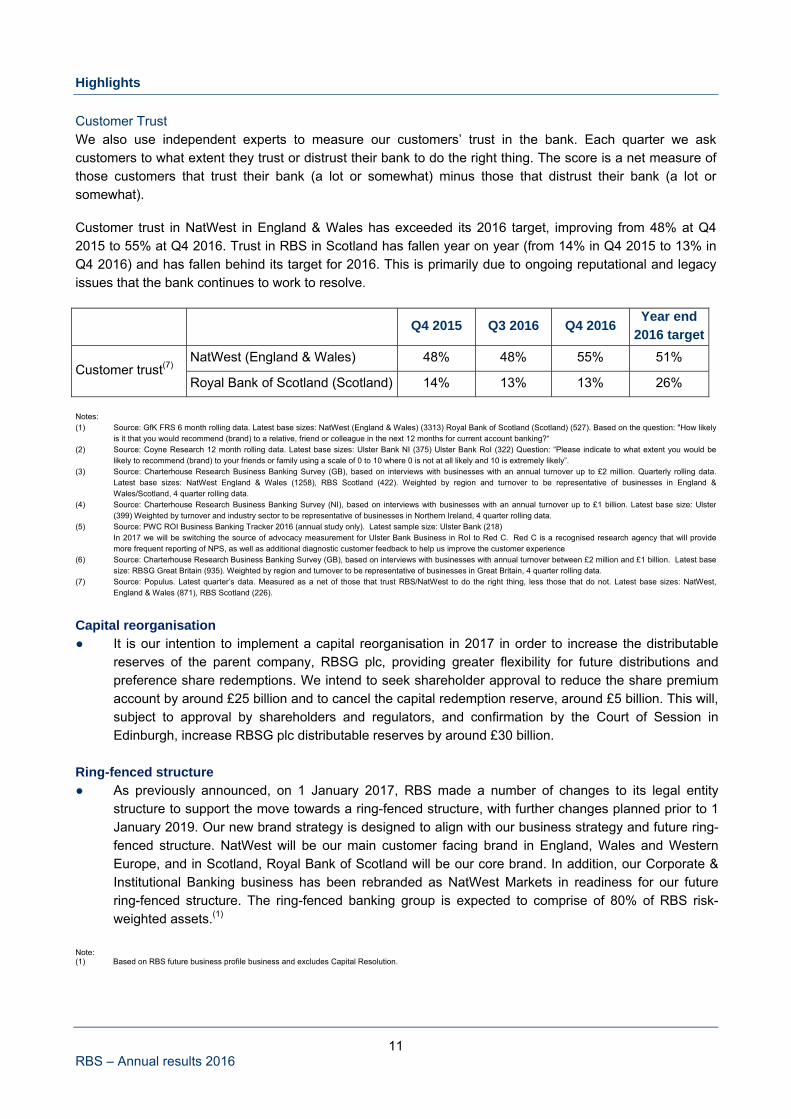
Customer Trust We also use independent experts to measure our customers’ trust in the bank. Each quarter we ask customers to what extent they trust or distrust their bank to do the right thing. The score is a net measure of those customers that trust their bank (a lot or somewhat) minus those that distrust their bank (a lot or somewhat).
Customer trust in NatWest in England & Wales has exceeded its 2016 target, improving from 48% at Q4 2015 to 55% at Q4 2016. Trust in RBS in Scotland has fallen year on year (from 14% in Q4 2015 to 13% in Q4 2016) and has fallen behind its target for 2016. This is primarily due to ongoing reputational and legacy issues that the bank continues to work to resolve.
Q4 2015 Q3 2016 Q4 2016
Year end 2016 target
Customer trust(7) NatWest (England & Wales) 48% 48% 55% 51%
Royal Bank of Scotland (Scotland) 14% 13% 13% 26%
Notes: (1) Source: GfK FRS 6 month rolling data. Latest base sizes: NatWest (England & Wales) (3313) Royal Bank of Scotland (Scotland) (527). Based on the question: "How likely
is it that you would recommend (brand) to a relative, friend or colleague in the next 12 months for current account banking?“ (2) Source: Coyne Research 12 month rolling data. Latest base sizes: Ulster Bank NI (375) Ulster Bank RoI (322) Question: “Please indicate to what extent you would be
likely to recommend (brand) to your friends or family using a scale of 0 to 10 where 0 is not at all likely and 10 is extremely likely”. (3) Source: Charterhouse Research Business Banking Survey (GB), based on interviews with businesses with an annual turnover up to £2 million. Quarterly rolling data.
Latest base sizes: NatWest England & Wales (1258), RBS Scotland (422). Weighted by region and turnover to be representative of businesses in England & Wales/Scotland, 4 quarter rolling data.
(4) Source: Charterhouse Research Business Banking Survey (NI), based on interviews with businesses with an annual turnover up to £1 billion. Latest base size: Ulster (399) Weighted by turnover and industry sector to be representative of businesses in Northern Ireland, 4 quarter rolling data.
(5) Source: PWC ROI Business Banking Tracker 2016 (annual study only). Latest sample size: Ulster Bank (218) In 2017 we will be switching the source of advocacy measurement for Ulster Bank Business in RoI to Red C. Red C is a recognised research agency that will providemore frequent reporting of NPS, as well as additional diagnostic customer feedback to help us improve the customer experience
(6) Source: Charterhouse Research Business Banking Survey (GB), based on interviews with businesses with annual turnover between £2 million and £1 billion. Latest basesize: RBSG Great Britain (935). Weighted by region and turnover to be representative of businesses in Great Britain, 4 quarter rolling data.
(7) Source: Populus. Latest quarter’s data. Measured as a net of those that trust RBS/NatWest to do the right thing, less those that do not. Latest base sizes: NatWest, England & Wales (871), RBS Scotland (226).
Capital reorganisation ● It is our intention to implement a capital reorganisation in 2017 in order to increase the distributable
reserves of the parent company, RBSG plc, providing greater flexibility for future distributions andpreference share redemptions. We intend to seek shareholder approval to reduce the share premiumaccount by around £25 billion and to cancel the capital redemption reserve, around £5 billion. This will,subject to approval by shareholders and regulators, and confirmation by the Court of Session inEdinburgh, increase RBSG plc distributable reserves by around £30 billion.
Ring-fenced structure ● As previously announced, on 1 January 2017, RBS made a number of changes to its legal entity
structure to support the move towards a ring-fenced structure, with further changes planned prior to 1January 2019. Our new brand strategy is designed to align with our business strategy and future ring-fenced structure. NatWest will be our main customer facing brand in England, Wales and WesternEurope, and in Scotland, Royal Bank of Scotland will be our core brand. In addition, our Corporate &Institutional Banking business has been rebranded as NatWest Markets in readiness for our futurering-fenced structure. The ring-fenced banking group is expected to comprise of 80% of RBS risk-weighted assets.(1)
Note: (1) Based on RBS future business profile business and excludes Capital Resolution.
12 RBS – Annual results 2016
Highlights IFRS9 ● RBS continues to develop its processes to enable IFRS 9 Financial Instruments to be implemented on
1 January 2018; an estimate of the initial impact will be included in 2017 H1 interim reporting. Williams & Glyn ● On 17 February 2017, RBS announced that it had been informed by HM Treasury ("HMT") that the
Commissioner responsible for EU competition policy plans to propose to the College ofCommissioners to open proceedings to gather evidence on an alternative plan for RBS to meet itsremaining State Aid obligations. If adopted, this alternative plan would replace the existing requirementto achieve separation and divestment by 31 December 2017 of Williams & Glyn. As previouslydisclosed, none of the proposals to acquire the business received by RBS can deliver a full separationand divestment before the 31 December 2017 deadline.
● RBS has agreed that HMT will now seek formal amendment to RBS's State Aid commitments to pavethe way for the Commissioner to propose to open proceedings, as described above. In addition to theCommission's proceedings, HMT will carry out a market testing exercise in parallel. The opening of theCommission's proceedings does not prejudge the outcome of the investigation.
● The plan envisages that RBS will deliver the following revised package of remedies to promotecompetition in the market for banking services to small and medium enterprises ("SMEs") in the UK:
○ A fund, administered by an independent body, that eligible challenger banks can access to increasetheir business banking capabilities;
○ Funding for eligible challenger banks to help them incentivise SMEs to switch their accounts fromRBS paid in the form of "dowries" to eligible challenger banks;
○ RBS granting business customers of eligible challenger banks access to its branch network for cashand cheque handling, to support the measures above; and
○ An independent fund to invest in fintech to support the business banking of the future.
● The 2016 Annual Results include a £750 million restructuring provision as a consequence of this proposal.
13 RBS – Annual results 2016
Highlights
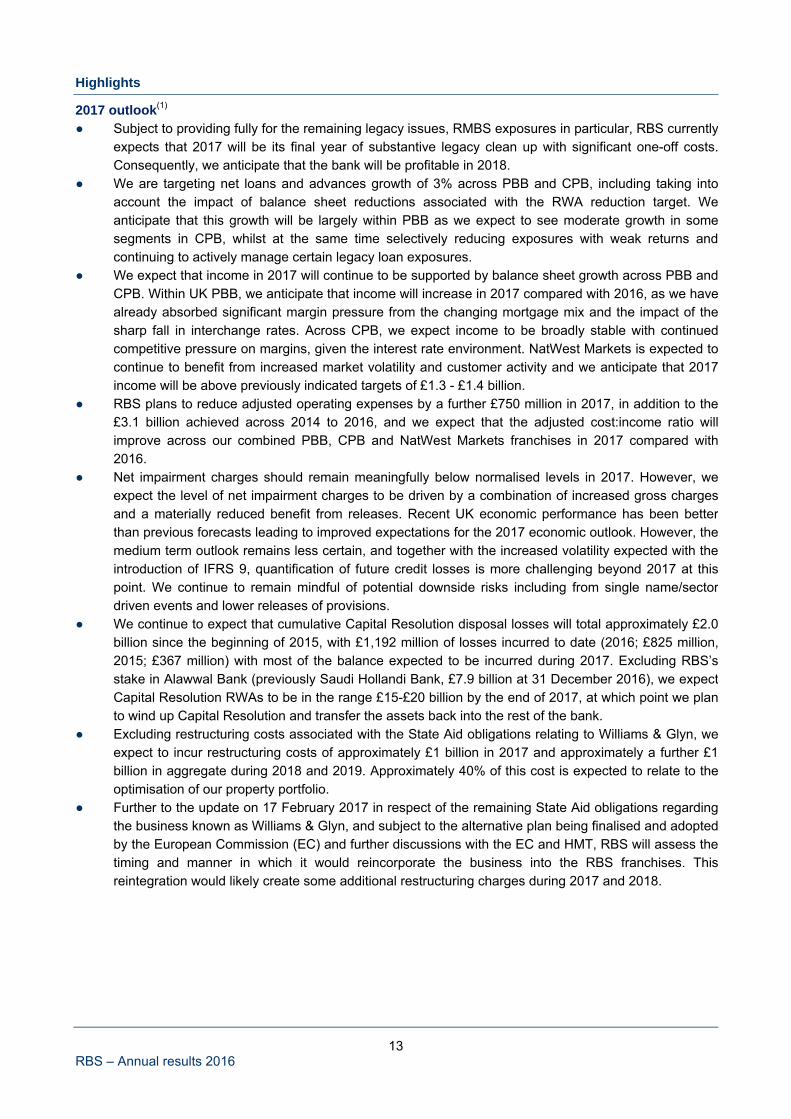
2017 outlook(1) ● Subject to providing fully for the remaining legacy issues, RMBS exposures in particular, RBS currently
expects that 2017 will be its final year of substantive legacy clean up with significant one-off costs.Consequently, we anticipate that the bank will be profitable in 2018.
● We are targeting net loans and advances growth of 3% across PBB and CPB, including taking intoaccount the impact of balance sheet reductions associated with the RWA reduction target. Weanticipate that this growth will be largely within PBB as we expect to see moderate growth in somesegments in CPB, whilst at the same time selectively reducing exposures with weak returns andcontinuing to actively manage certain legacy loan exposures.
● We expect that income in 2017 will continue to be supported by balance sheet growth across PBB andCPB. Within UK PBB, we anticipate that income will increase in 2017 compared with 2016, as we havealready absorbed significant margin pressure from the changing mortgage mix and the impact of thesharp fall in interchange rates. Across CPB, we expect income to be broadly stable with continuedcompetitive pressure on margins, given the interest rate environment. NatWest Markets is expected tocontinue to benefit from increased market volatility and customer activity and we anticipate that 2017income will be above previously indicated targets of £1.3 - £1.4 billion.
● RBS plans to reduce adjusted operating expenses by a further £750 million in 2017, in addition to the£3.1 billion achieved across 2014 to 2016, and we expect that the adjusted cost:income ratio willimprove across our combined PBB, CPB and NatWest Markets franchises in 2017 compared with2016.
● Net impairment charges should remain meaningfully below normalised levels in 2017. However, weexpect the level of net impairment charges to be driven by a combination of increased gross chargesand a materially reduced benefit from releases. Recent UK economic performance has been betterthan previous forecasts leading to improved expectations for the 2017 economic outlook. However, themedium term outlook remains less certain, and together with the increased volatility expected with theintroduction of IFRS 9, quantification of future credit losses is more challenging beyond 2017 at thispoint. We continue to remain mindful of potential downside risks including from single name/sectordriven events and lower releases of provisions.
● We continue to expect that cumulative Capital Resolution disposal losses will total approximately £2.0billion since the beginning of 2015, with £1,192 million of losses incurred to date (2016; £825 million,2015; £367 million) with most of the balance expected to be incurred during 2017. Excluding RBS’sstake in Alawwal Bank (previously Saudi Hollandi Bank, £7.9 billion at 31 December 2016), we expectCapital Resolution RWAs to be in the range £15-£20 billion by the end of 2017, at which point we planto wind up Capital Resolution and transfer the assets back into the rest of the bank.
● Excluding restructuring costs associated with the State Aid obligations relating to Williams & Glyn, weexpect to incur restructuring costs of approximately £1 billion in 2017 and approximately a further £1billion in aggregate during 2018 and 2019. Approximately 40% of this cost is expected to relate to theoptimisation of our property portfolio.
● Further to the update on 17 February 2017 in respect of the remaining State Aid obligations regardingthe business known as Williams & Glyn, and subject to the alternative plan being finalised and adoptedby the European Commission (EC) and further discussions with the EC and HMT, RBS will assess thetiming and manner in which it would reincorporate the business into the RBS franchises. Thisreintegration would likely create some additional restructuring charges during 2017 and 2018.
14 RBS – Annual results 2016
Highlights
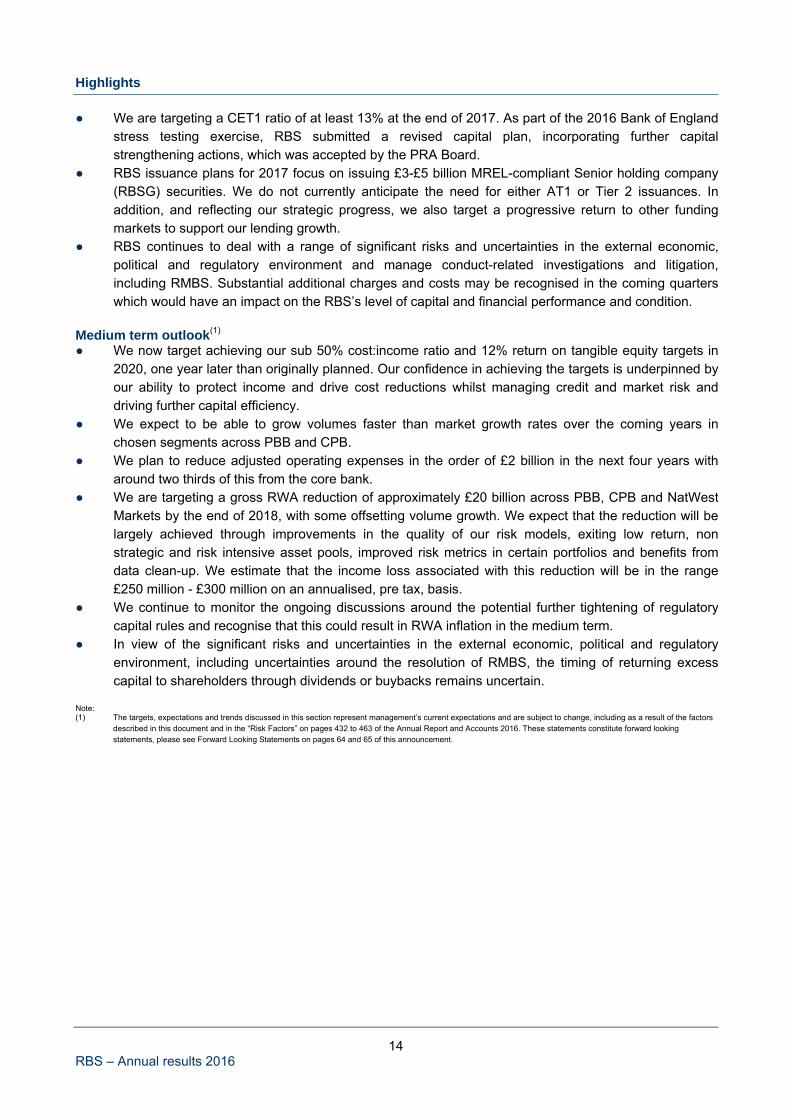
● We are targeting a CET1 ratio of at least 13% at the end of 2017. As part of the 2016 Bank of England
stress testing exercise, RBS submitted a revised capital plan, incorporating further capitalstrengthening actions, which was accepted by the PRA Board.
● RBS issuance plans for 2017 focus on issuing £3-£5 billion MREL-compliant Senior holding company(RBSG) securities. We do not currently anticipate the need for either AT1 or Tier 2 issuances. Inaddition, and reflecting our strategic progress, we also target a progressive return to other funding markets to support our lending growth.
● RBS continues to deal with a range of significant risks and uncertainties in the external economic, political and regulatory environment and manage conduct-related investigations and litigation, including RMBS. Substantial additional charges and costs may be recognised in the coming quarterswhich would have an impact on the RBS’s level of capital and financial performance and condition.
Medium term outlook(1) ● We now target achieving our sub 50% cost:income ratio and 12% return on tangible equity targets in
2020, one year later than originally planned. Our confidence in achieving the targets is underpinned byour ability to protect income and drive cost reductions whilst managing credit and market risk and driving further capital efficiency.
● We expect to be able to grow volumes faster than market growth rates over the coming years inchosen segments across PBB and CPB.
● We plan to reduce adjusted operating expenses in the order of £2 billion in the next four years witharound two thirds of this from the core bank.
● We are targeting a gross RWA reduction of approximately £20 billion across PBB, CPB and NatWestMarkets by the end of 2018, with some offsetting volume growth. We expect that the reduction will belargely achieved through improvements in the quality of our risk models, exiting low return, nonstrategic and risk intensive asset pools, improved risk metrics in certain portfolios and benefits fromdata clean-up. We estimate that the income loss associated with this reduction will be in the range £250 million - £300 million on an annualised, pre tax, basis.
● We continue to monitor the ongoing discussions around the potential further tightening of regulatorycapital rules and recognise that this could result in RWA inflation in the medium term.
● In view of the significant risks and uncertainties in the external economic, political and regulatoryenvironment, including uncertainties around the resolution of RMBS, the timing of returning excesscapital to shareholders through dividends or buybacks remains uncertain.
Note: (1) The targets, expectations and trends discussed in this section represent management’s current expectations and are subject to change, including as a result of the factors
described in this document and in the “Risk Factors” on pages 432 to 463 of the Annual Report and Accounts 2016. These statements constitute forward looking statements, please see Forward Looking Statements on pages 64 and 65 of this announcement.
15 RBS – Annual results 2016
Highlights
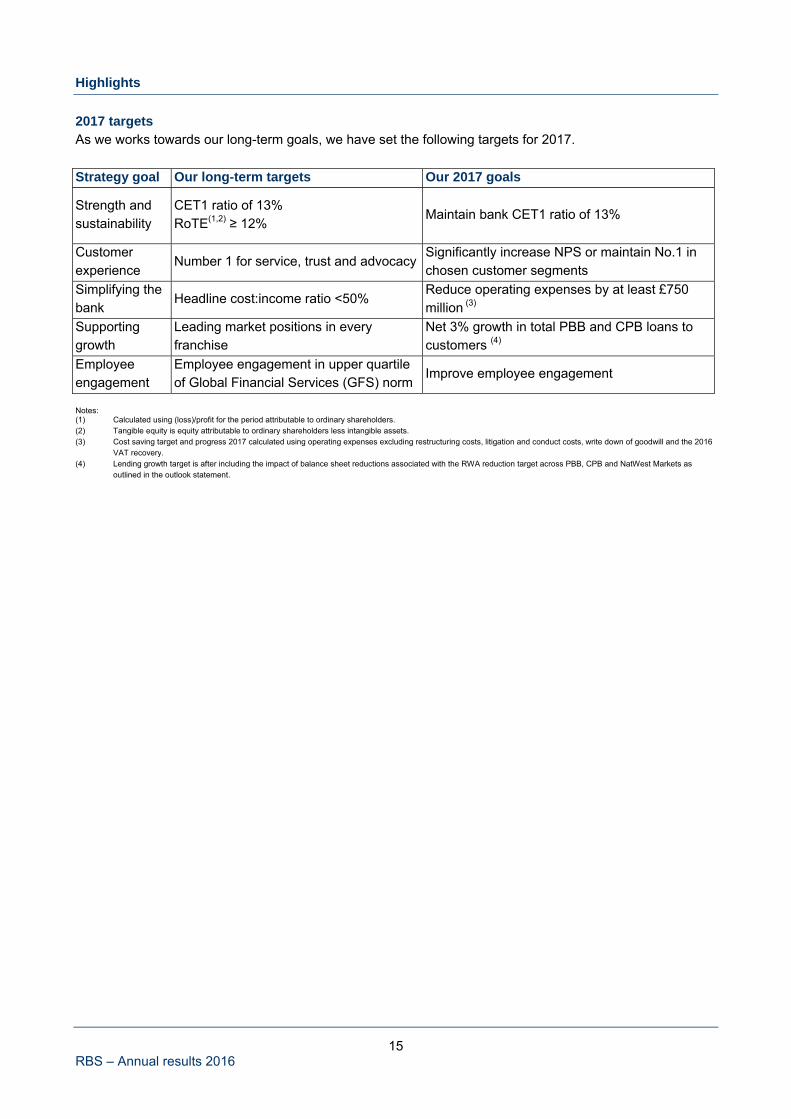
2017 targets As we works towards our long-term goals, we have set the following targets for 2017.
Strategy goal Our long-term targets Our 2017 goals
Strength and sustainability
CET1 ratio of 13% RoTE(1,2) ≥ 12%
Maintain bank CET1 ratio of 13%
Customer experience
Number 1 for service, trust and advocacy Significantly increase NPS or maintain No.1 in chosen customer segments
Simplifying the bank
Headline cost:income ratio <50% Reduce operating expenses by at least £750 million (3)
Supporting growth
Leading market positions in every franchise
Net 3% growth in total PBB and CPB loans to customers (4)
Employee engagement
Employee engagement in upper quartile of Global Financial Services (GFS) norm
Improve employee engagement
Notes: (1) Calculated using (loss)/profit for the period attributable to ordinary shareholders. (2) Tangible equity is equity attributable to ordinary shareholders less intangible assets. (3) Cost saving target and progress 2017 calculated using operating expenses excluding restructuring costs, litigation and conduct costs, write down of goodwill and the 2016
VAT recovery. (4) Lending growth target is after including the impact of balance sheet reductions associated with the RWA reduction target across PBB, CPB and NatWest Markets as
outlined in the outlook statement.
16 RBS – Annual results 2016
Chief Executive’s message
Introduction In 2016 RBS made an attributable loss of £7.0 billion, mostly reflecting charges for outstanding litigation and conduct, and costs associated with restructuring of the bank. The financial impact of these issues is a difficult but necessary step in working through the bank’s legacy issues. These costs are a stark reminder of what happens to a bank when things go wrong and you lose focus on the customer, as this bank did before the financial crisis. The more progress we have made on clearing these past issues, enables us to sharpen our focus on the core go forward bank. Our service level and product improvements are already delivering benefits for both customers and the core bank. In 2017 our focus will turn to going even further on reducing costs and faster on digital transformation in order to deliver a more simple, safe and customer-focused bank. The bank we were I joined RBS because I could see that underneath all the troubles it faced, there was a strong bank, with excellent brands and great colleagues, doing outstanding things for customers each day. This underlying strength is still evident today. In 2014 I announced a three phase strategy. We are moving to the final phase of this, after delivering much during the first two phases, which were about building a platform of strength and stripping away unnecessary complexity. Our CET1 ratio has now materially improved to 13.4% from 8.6% at the start of 2014. We have thoroughly reshaped our investment banking business, now rebranded NatWest Markets. We have sold Citizens in the US, completing the largest bank IPO in US history in the process, and also sold our international private banking business. We have ended active operations in 26 countries, decommissioned 30% of our IT systems and applications, and almost halved the number of legal entities. We have also completed the run-down or sale of over three quarters of Capital Resolution legacy and non-core assets. We have reduced our cost base by over £3 billion, exceeding our target for the third consecutive year, with an operating cost reduction of £985 million. The past is not completely behind us, with our dealings on Residential Mortgage Backed Securities (RMBS) and Williams & Glyn, our residual European Commission State Aid obligations, two significant issues that we still need to resolve. The recent proposal by HM Treasury on an alternative way to increase competition to allow us to meet our State Aid commitments would deliver an outcome more quickly, and with more certainty than undertaking a complex sale. We have been able to provide for both of these in our accounts, though there may still be substantial additional provisions on RMBS. The bank we are today We are now in a much better position to focus on our long term aspiration – to transform the bank into the number one for customer service, trust, and advocacy. While the signs of this transformation have at times been masked by our wider organisational changes, the core bank has already evolved materially since 2014. Our decision to refocus on the UK has seen our balance sheet shrink by £229 billon since the start of our plan. This is net of the continued growth in our Personal and Business Banking and Commercial and Private Banking franchises. We are seeing the benefits of our service-led strategy in the financial performance of the core bank, generating £4.2 billion in adjusted pre-tax operating profit for the year, an average of £1 billion per quarter for the last eight quarters and 4% up on 2015.
17 RBS – Annual results 2016
Chief Executive’s message
While Q4 was down from the levels seen earlier this year, our Net Promoter Scores for Commercial and NatWest Personal in 2016 were the highest they have ever been. With £30 billion of gross new mortgage lending in UK PBB, we helped 320,000 customers with their mortgage in 2016, growing our market share for the fourth consecutive year without leading on price or risk. We are the largest commercial bank in the UK, and are ranked joint number one by Net Promoter Score. Our ability to generate value here is shown by the scale of support we have provided to the economy in the past year, with almost £9 billion of new net commercial lending. The bank we are becoming We still have more work to do. In part, that means finishing the restructuring of RBS, resolving the remaining legacy issues, and preparing the bank for ring-fencing. In the main, however, it is about adapting to the changing nature of the UK and Irish banking sectors, and investing to meet our customers’ evolving needs.
Digital innovation means customers are doing more of their transactions online. We interact with our customers over 20 times more through digital channels than physical ones. 35% of all new products were taken out digitally in UK PBB, and this is rising steadily. A fifth of our customers now solely use mobile and digital to interact with us. As customers change the way they bank with us, we must change the way we serve them. This means continuing to simplify for our customers, and accelerating our deployment of digital and mobile capabilities. The role of the branch is fast moving to an advice and service centre, away from transactions. While the branch will still be a core part of our offering to customers, inevitably some branches will have to close.
We’re working to blur the line between traditional and digital banking channels. We are investing in a video sales and service proposition that will connect customers, no matter where they are, to the right specialist.
This shift isn’t only in personal banking. We are aiming to service 95% of our commercial customers’ needs through mobile and online by 2020, up from nearly 80% today, by introducing a new digital banking service that will greatly improve experience. We’re also responding to customer preferences for more innovative lending platforms and products. We are investing heavily in technology in our NatWest Markets business. Hundreds of separate product databases will be replaced with a single, scalable platform, which will help reduce costs significantly and dramatically increase the speed at which we can deploy new capabilities for our customers. We are also introducing a single dealer platform, an electronic front door, through which we can provide FX and Rates solutions to our clients. These are the kind of changes that will lower costs while protecting revenue and delivering even better customer service at the same time.
We are committed to running the bank as a more sustainable and responsible business, serving today’s customers in a way that also helps future generations, generating long term value for all of our stakeholders and society. In 2016, we improved on our position in a number of rankings, including achieving our highest ever score in the Dow Jones Sustainability Index. We continued with our commitment to manage our impacts on climate change and support our customers to move towards the transition to a low-carbon economy. We continue to support financial education and our goal is to help a further one million more young people understand all about money by the end of 2018.
18 RBS – Annual results 2016
Chief Executive’s message
Our commitment to sustainability is also evident in our annual results, where we have replaced our annual Sustainability Report with a more integrated approach. You will see a number of new elements in the Strategic Report that explain the key influences on our operating environment, and some of the impact we have had over the past year. This is an important step towards fully integrated reporting over the coming years.
Delivering our strategy The decision last summer by UK voters to leave the EU will have wide-reaching consequences. In light of this, we reviewed our plan to ensure that it remained valid in a changed macro and political environment. Following that review, I want to re-iterate our commitment to the strategy we have been pursuing since I became CEO – we firmly believe that our aspiration to reach no.1 for customer service, trust and advocacy will maximise value for our shareholders.
This year we have met all our operating financial targets, though the results of some of our customer NPS and employee engagement surveys show we still have work to do. After the EU referendum result, we promised an update on our targets. We are targeting an unadjusted 12% or greater return on tangible equity, and a below 50% cost to income ratio by 2020, one year later than envisaged when we first set out our plan in 2014.
Our service levels are improving and we believe we can meet our 2020 aspirational customer and colleague targets. Our focus on capital strength remains a cornerstone of our plan. In 2017, we will continue to reduce legacy RWAs, and we will target a CET1 ratio of at least 13%.
This has also been another tough year for our colleagues. I am grateful for their determination in serving our millions of customers every day, despite many negative headlines. Our colleagues are the face of the bank for our customers, and their engagement is critical to our success. One of our five key targets in 2017 is to improve employee engagement.
We no longer have global aspirations and we need to go further still on our operating costs. We expect to take out an additional £750 million of operating costs in 2017 through our focus on simplification and digital transformation. A simpler bank is a more profitable bank and a bank that delivers a better customer experience. Where we can make it easy for our customers, the more business they will do with us and the more sustainable our earnings will become.
Looking ahead The progress of the last three years positions us well to achieve our vision for the future. We have the right strategy, and it is starting to deliver results. Now, we need to go further on cost reduction and faster on digital transformation.
We aren’t alone in searching for efficiency gains and investing in digital capability, but the unique strength of this bank lies in the fact that we have a diverse business profile, with scale in all of our chosen markets. Investment in our market leading brands and better customer service will deliver steadier, higher quality earnings. Our focus on service rather than price has also shown that we can continue to grow in areas of strategic opportunity, such as mortgages, without compromising on risk. All of this will deliver a sustainable competitive advantage and a compelling investment case in the longer term.
This is a bank that has been on a remarkable journey. We still have further to go. But the next three years will not be the same as the past three. Legacy issues will take up a decreasing amount of our time and focus. Our customers, our cost base and the measures we plan to implement to return the bank to sustainable headline profits will be where we focus our efforts. Assuming we can conclude our issues on RMBS this year and resolve our residual State Aid obligations, we aim to have RBS back into profit in 2018 representing a significant step towards being able to start repaying UK taxpayers for their support.
19 RBS – Annual results 2016
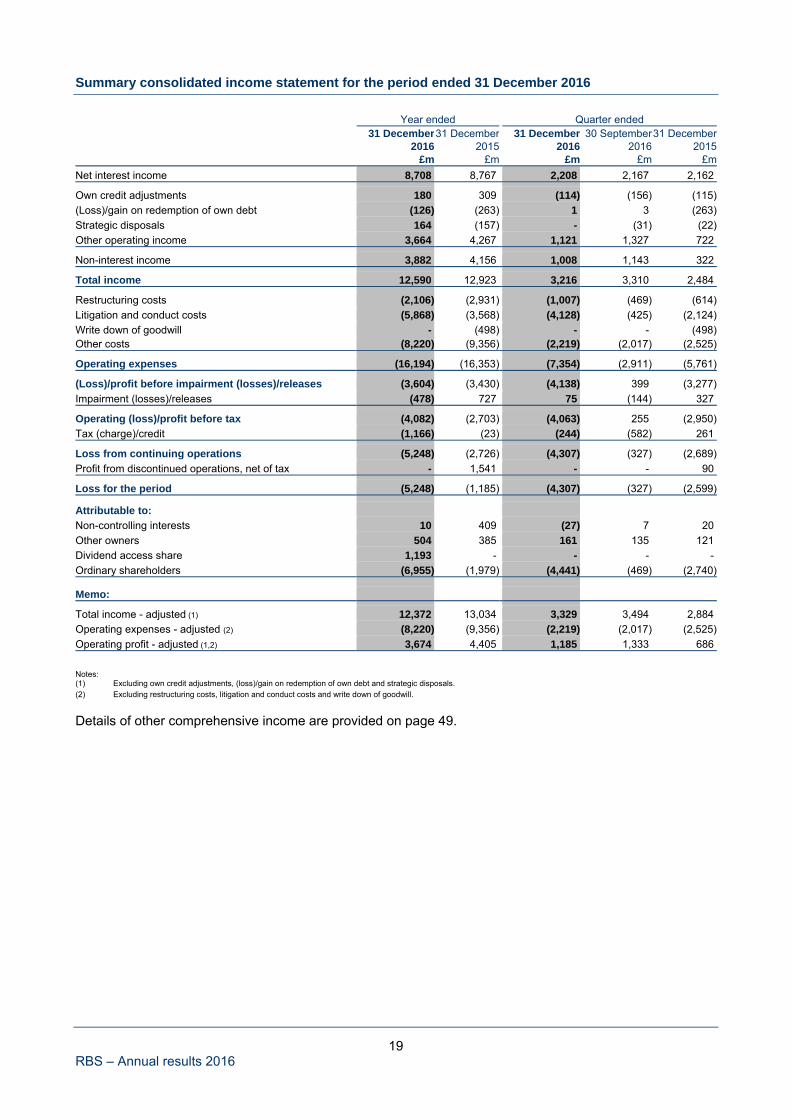
Summary consolidated income statement for the period ended 31 December 2016
Year ended Quarter ended 31 December31 December 31 December 30 September31 December 2016 2015 2016 2016 2015 £m £m £m £m £m
Net interest income 8,708 8,767 2,208 2,167 2,162
Own credit adjustments 180 309 (114) (156) (115)
(Loss)/gain on redemption of own debt (126) (263) 1 3 (263)
Strategic disposals 164 (157) - (31) (22)
Other operating income 3,664 4,267 1,121 1,327 722
Non-interest income 3,882 4,156 1,008 1,143 322
Total income 12,590 12,923 3,216 3,310 2,484
Restructuring costs (2,106) (2,931) (1,007) (469) (614)
Litigation and conduct costs (5,868) (3,568) (4,128) (425) (2,124)
Write down of goodwill - (498) - - (498)Other costs (8,220) (9,356) (2,219) (2,017) (2,525)
Operating expenses (16,194) (16,353) (7,354) (2,911) (5,761)
(Loss)/profit before impairment (losses)/releases (3,604) (3,430) (4,138) 399 (3,277)
Impairment (losses)/releases (478) 727 75 (144) 327
Operating (loss)/profit before tax (4,082) (2,703) (4,063) 255 (2,950)
Tax (charge)/credit (1,166) (23) (244) (582) 261
Loss from continuing operations (5,248) (2,726) (4,307) (327) (2,689)
Profit from discontinued operations, net of tax - 1,541 - - 90
Loss for the period (5,248) (1,185) (4,307) (327) (2,599)
Attributable to:
Non-controlling interests 10 409 (27) 7 20
Other owners 504 385 161 135 121
Dividend access share 1,193 - - - -
Ordinary shareholders (6,955) (1,979) (4,441) (469) (2,740)
Memo:
Total income - adjusted (1) 12,372 13,034 3,329 3,494 2,884
Operating expenses - adjusted (2) (8,220) (9,356) (2,219) (2,017) (2,525)
Operating profit - adjusted (1,2) 3,674 4,405 1,185 1,333 686
Notes: (1) Excluding own credit adjustments, (loss)/gain on redemption of own debt and strategic disposals. (2) Excluding restructuring costs, litigation and conduct costs and write down of goodwill.
Details of other comprehensive income are provided on page 49.
20 RBS – Annual results 2016
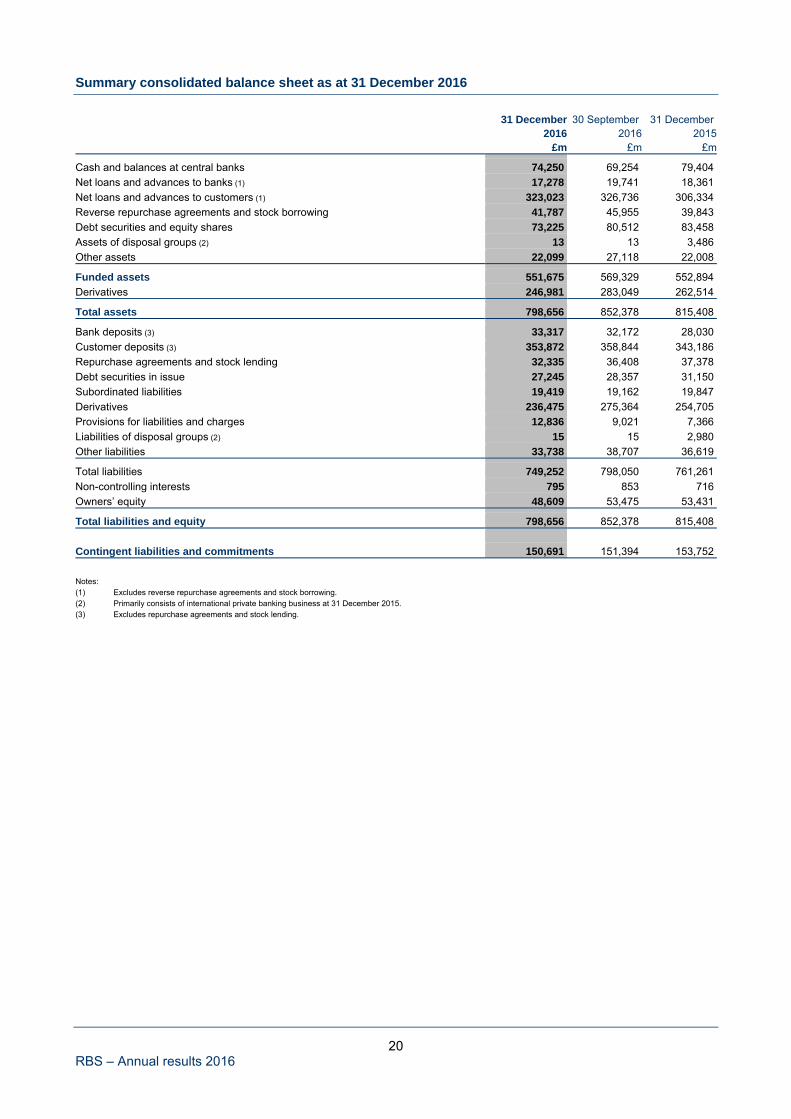
Summary consolidated balance sheet as at 31 December 2016
31 December 30 September 31 December 2016 2016 2015 £m £m £m
Cash and balances at central banks 74,250 69,254 79,404
Net loans and advances to banks (1) 17,278 19,741 18,361
Net loans and advances to customers (1) 323,023 326,736 306,334
Reverse repurchase agreements and stock borrowing 41,787 45,955 39,843
Debt securities and equity shares 73,225 80,512 83,458
Assets of disposal groups (2) 13 13 3,486
Other assets 22,099 27,118 22,008
Funded assets 551,675 569,329 552,894
Derivatives 246,981 283,049 262,514
Total assets 798,656 852,378 815,408
Bank deposits (3) 33,317 32,172 28,030
Customer deposits (3) 353,872 358,844 343,186
Repurchase agreements and stock lending 32,335 36,408 37,378
Debt securities in issue 27,245 28,357 31,150
Subordinated liabilities 19,419 19,162 19,847
Derivatives 236,475 275,364 254,705
Provisions for liabilities and charges 12,836 9,021 7,366
Liabilities of disposal groups (2) 15 15 2,980
Other liabilities 33,738 38,707 36,619
Total liabilities 749,252 798,050 761,261
Non-controlling interests 795 853 716
Owners’ equity 48,609 53,475 53,431
Total liabilities and equity 798,656 852,378 815,408
Contingent liabilities and commitments 150,691 151,394 153,752
Notes: (1) Excludes reverse repurchase agreements and stock borrowing. (2) Primarily consists of international private banking business at 31 December 2015. (3) Excludes repurchase agreements and stock lending.
21 RBS – Annual results 2016
Analysis of results Year ended Quarter ended
31 December 31 December 31 December 30 September 31 December
2016 2015 2016 2016 2015Net interest income £m £m £m £m £m
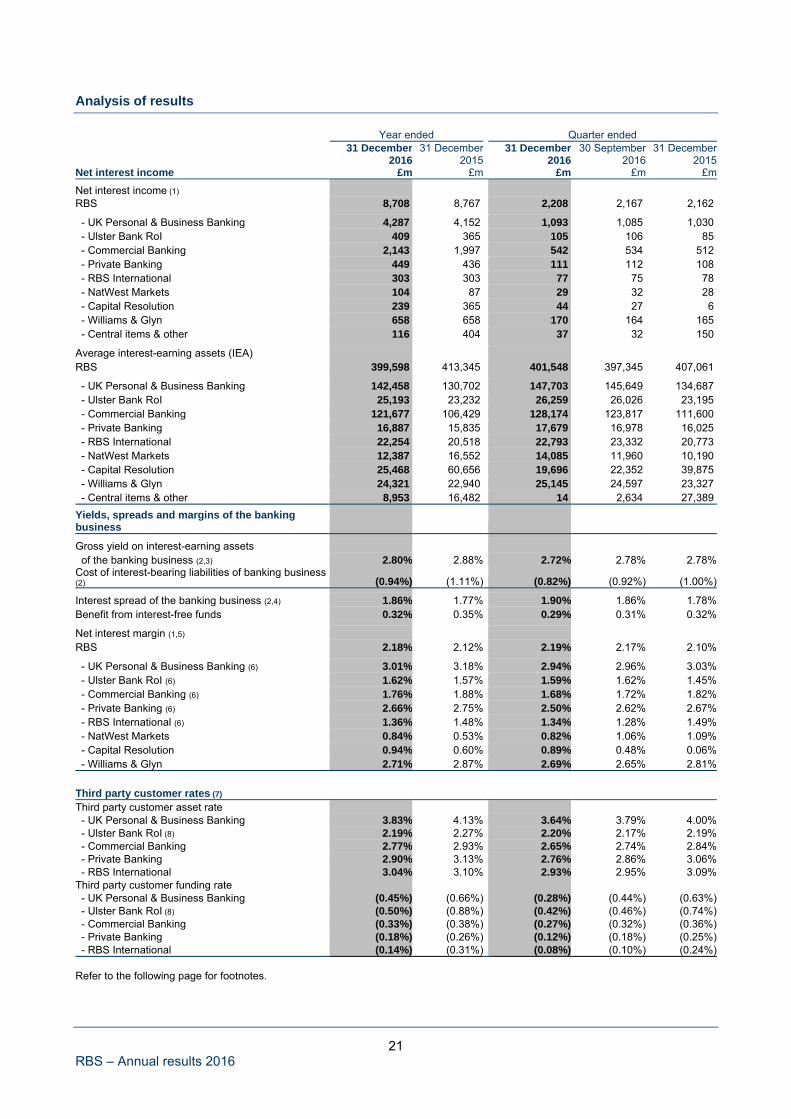
Net interest income (1) RBS 8,708 8,767 2,208 2,167 2,162
- UK Personal & Business Banking 4,287 4,152 1,093 1,085 1,030 - Ulster Bank RoI 409 365 105 106 85 - Commercial Banking 2,143 1,997 542 534 512 - Private Banking 449 436 111 112 108 - RBS International 303 303 77 75 78 - NatWest Markets 104 87 29 32 28 - Capital Resolution 239 365 44 27 6 - Williams & Glyn 658 658 170 164 165 - Central items & other 116 404 37 32 150
Average interest-earning assets (IEA) RBS 399,598 413,345 401,548 397,345 407,061
- UK Personal & Business Banking 142,458 130,702 147,703 145,649 134,687 - Ulster Bank RoI 25,193 23,232 26,259 26,026 23,195 - Commercial Banking 121,677 106,429 128,174 123,817 111,600 - Private Banking 16,887 15,835 17,679 16,978 16,025 - RBS International 22,254 20,518 22,793 23,332 20,773 - NatWest Markets 12,387 16,552 14,085 11,960 10,190 - Capital Resolution 25,468 60,656 19,696 22,352 39,875 - Williams & Glyn 24,321 22,940 25,145 24,597 23,327 - Central items & other 8,953 16,482 14 2,634 27,389
Yields, spreads and margins of the banking business
Gross yield on interest-earning assets of the banking business (2,3) 2.80% 2.88% 2.72% 2.78% 2.78%Cost of interest-bearing liabilities of banking business (2) (0.94%) (1.11%) (0.82%) (0.92%) (1.00%)
Interest spread of the banking business (2,4) 1.86% 1.77% 1.90% 1.86% 1.78%Benefit from interest-free funds 0.32% 0.35% 0.29% 0.31% 0.32%
Net interest margin (1,5) RBS 2.18% 2.12% 2.19% 2.17% 2.10%
- UK Personal & Business Banking (6) 3.01% 3.18% 2.94% 2.96% 3.03% - Ulster Bank RoI (6) 1.62% 1.57% 1.59% 1.62% 1.45% - Commercial Banking (6) 1.76% 1.88% 1.68% 1.72% 1.82% - Private Banking (6) 2.66% 2.75% 2.50% 2.62% 2.67% - RBS International (6) 1.36% 1.48% 1.34% 1.28% 1.49% - NatWest Markets 0.84% 0.53% 0.82% 1.06% 1.09% - Capital Resolution 0.94% 0.60% 0.89% 0.48% 0.06% - Williams & Glyn 2.71% 2.87% 2.69% 2.65% 2.81%
Third party customer rates (7) Third party customer asset rate - UK Personal & Business Banking 3.83% 4.13% 3.64% 3.79% 4.00% - Ulster Bank RoI (8) 2.19% 2.27% 2.20% 2.17% 2.19% - Commercial Banking 2.77% 2.93% 2.65% 2.74% 2.84% - Private Banking 2.90% 3.13% 2.76% 2.86% 3.06% - RBS International 3.04% 3.10% 2.93% 2.95% 3.09%Third party customer funding rate - UK Personal & Business Banking (0.45%) (0.66%) (0.28%) (0.44%) (0.63%) - Ulster Bank RoI (8) (0.50%) (0.88%) (0.42%) (0.46%) (0.74%) - Commercial Banking (0.33%) (0.38%) (0.27%) (0.32%) (0.36%) - Private Banking (0.18%) (0.26%) (0.12%) (0.18%) (0.25%) - RBS International (0.14%) (0.31%) (0.08%) (0.10%) (0.24%) Refer to the following page for footnotes.
22 RBS – Annual results 2016
Analysis of results
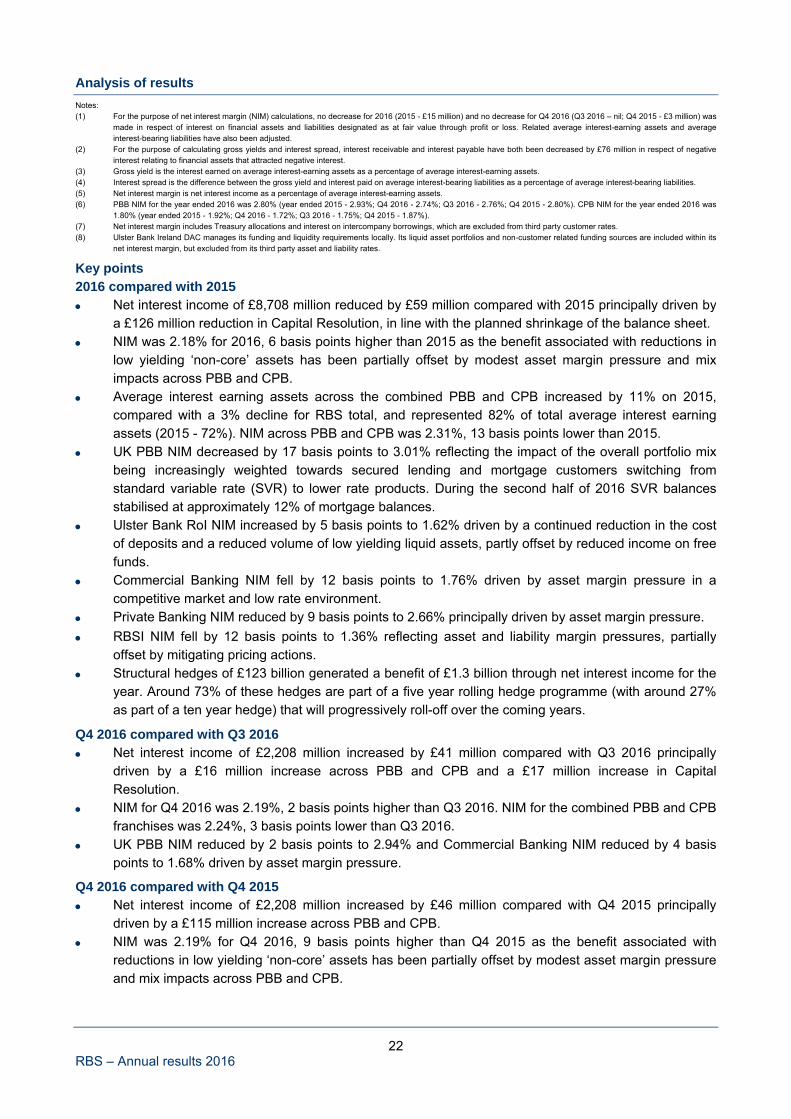
Notes: (1) For the purpose of net interest margin (NIM) calculations, no decrease for 2016 (2015 - £15 million) and no decrease for Q4 2016 (Q3 2016 – nil; Q4 2015 - £3 million) was
made in respect of interest on financial assets and liabilities designated as at fair value through profit or loss. Related average interest-earning assets and average interest-bearing liabilities have also been adjusted.
(2) For the purpose of calculating gross yields and interest spread, interest receivable and interest payable have both been decreased by £76 million in respect of negative interest relating to financial assets that attracted negative interest.
(3) Gross yield is the interest earned on average interest-earning assets as a percentage of average interest-earning assets. (4) Interest spread is the difference between the gross yield and interest paid on average interest-bearing liabilities as a percentage of average interest-bearing liabilities. (5) Net interest margin is net interest income as a percentage of average interest-earning assets. (6) PBB NIM for the year ended 2016 was 2.80% (year ended 2015 - 2.93%; Q4 2016 - 2.74%; Q3 2016 - 2.76%; Q4 2015 - 2.80%). CPB NIM for the year ended 2016 was
1.80% (year ended 2015 - 1.92%; Q4 2016 - 1.72%; Q3 2016 - 1.75%; Q4 2015 - 1.87%). (7) Net interest margin includes Treasury allocations and interest on intercompany borrowings, which are excluded from third party customer rates. (8) Ulster Bank Ireland DAC manages its funding and liquidity requirements locally. Its liquid asset portfolios and non-customer related funding sources are included within its
net interest margin, but excluded from its third party asset and liability rates.
Key points 2016 compared with 2015
Net interest income of £8,708 million reduced by £59 million compared with 2015 principally driven by a £126 million reduction in Capital Resolution, in line with the planned shrinkage of the balance sheet.
NIM was 2.18% for 2016, 6 basis points higher than 2015 as the benefit associated with reductions inlow yielding ‘non-core’ assets has been partially offset by modest asset margin pressure and miximpacts across PBB and CPB.
Average interest earning assets across the combined PBB and CPB increased by 11% on 2015,compared with a 3% decline for RBS total, and represented 82% of total average interest earning assets (2015 - 72%). NIM across PBB and CPB was 2.31%, 13 basis points lower than 2015.
UK PBB NIM decreased by 17 basis points to 3.01% reflecting the impact of the overall portfolio mixbeing increasingly weighted towards secured lending and mortgage customers switching fromstandard variable rate (SVR) to lower rate products. During the second half of 2016 SVR balancesstabilised at approximately 12% of mortgage balances.
Ulster Bank RoI NIM increased by 5 basis points to 1.62% driven by a continued reduction in the costof deposits and a reduced volume of low yielding liquid assets, partly offset by reduced income on freefunds.
Commercial Banking NIM fell by 12 basis points to 1.76% driven by asset margin pressure in acompetitive market and low rate environment.
Private Banking NIM reduced by 9 basis points to 2.66% principally driven by asset margin pressure.
RBSI NIM fell by 12 basis points to 1.36% reflecting asset and liability margin pressures, partiallyoffset by mitigating pricing actions.
Structural hedges of £123 billion generated a benefit of £1.3 billion through net interest income for theyear. Around 73% of these hedges are part of a five year rolling hedge programme (with around 27%as part of a ten year hedge) that will progressively roll-off over the coming years.
Q4 2016 compared with Q3 2016
Net interest income of £2,208 million increased by £41 million compared with Q3 2016 principallydriven by a £16 million increase across PBB and CPB and a £17 million increase in CapitalResolution.
NIM for Q4 2016 was 2.19%, 2 basis points higher than Q3 2016. NIM for the combined PBB and CPBfranchises was 2.24%, 3 basis points lower than Q3 2016.
UK PBB NIM reduced by 2 basis points to 2.94% and Commercial Banking NIM reduced by 4 basispoints to 1.68% driven by asset margin pressure.
Q4 2016 compared with Q4 2015
Net interest income of £2,208 million increased by £46 million compared with Q4 2015 principallydriven by a £115 million increase across PBB and CPB.
NIM was 2.19% for Q4 2016, 9 basis points higher than Q4 2015 as the benefit associated withreductions in low yielding ‘non-core’ assets has been partially offset by modest asset margin pressureand mix impacts across PBB and CPB.
23 RBS – Annual results 2016
Analysis of results
Year ended Quarter ended
31 December 31 December 31 December 30 September 31 December
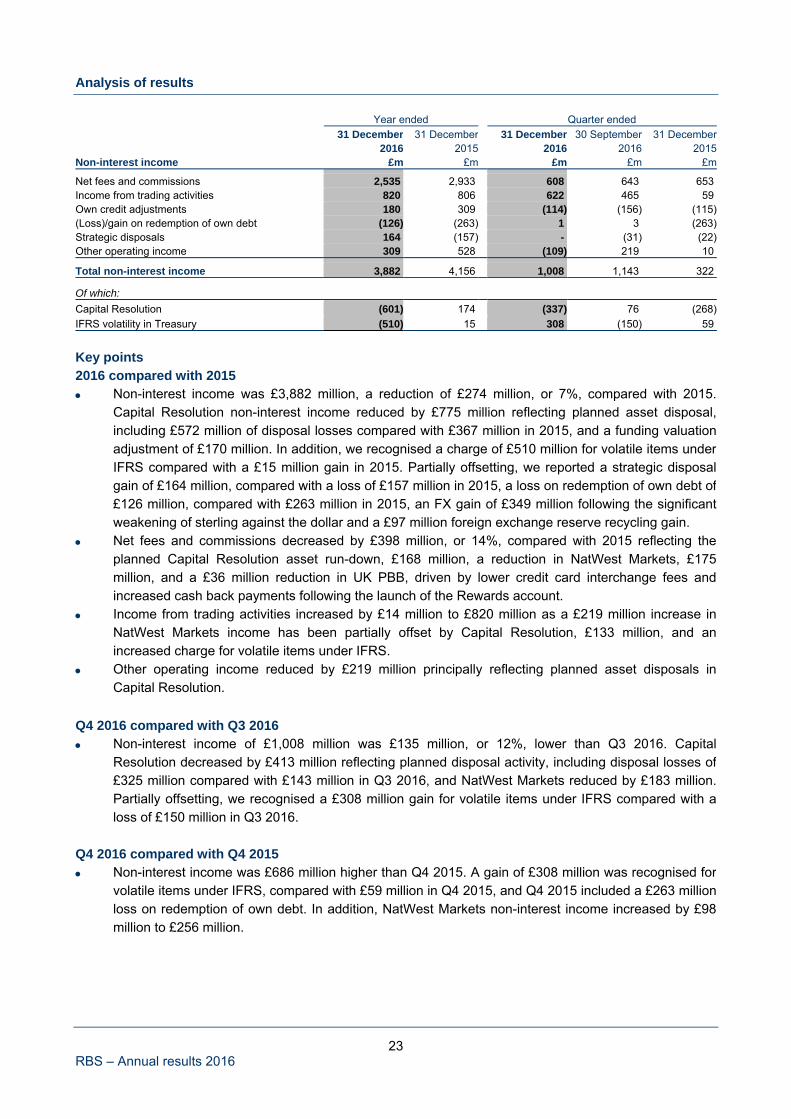
2016 2015 2016 2016 2015Non-interest income £m £m £m £m £m
Net fees and commissions 2,535 2,933 608 643 653 Income from trading activities 820 806 622 465 59 Own credit adjustments 180 309 (114) (156) (115)(Loss)/gain on redemption of own debt (126) (263) 1 3 (263)Strategic disposals 164 (157) - (31) (22)Other operating income 309 528 (109) 219 10
Total non-interest income 3,882 4,156 1,008 1,143 322
Of which:
Capital Resolution (601) 174 (337) 76 (268)
IFRS volatility in Treasury (510) 15 308 (150) 59
Key points 2016 compared with 2015
Non-interest income was £3,882 million, a reduction of £274 million, or 7%, compared with 2015.Capital Resolution non-interest income reduced by £775 million reflecting planned asset disposal,including £572 million of disposal losses compared with £367 million in 2015, and a funding valuationadjustment of £170 million. In addition, we recognised a charge of £510 million for volatile items underIFRS compared with a £15 million gain in 2015. Partially offsetting, we reported a strategic disposalgain of £164 million, compared with a loss of £157 million in 2015, a loss on redemption of own debt of£126 million, compared with £263 million in 2015, an FX gain of £349 million following the significantweakening of sterling against the dollar and a £97 million foreign exchange reserve recycling gain.
Net fees and commissions decreased by £398 million, or 14%, compared with 2015 reflecting theplanned Capital Resolution asset run-down, £168 million, a reduction in NatWest Markets, £175million, and a £36 million reduction in UK PBB, driven by lower credit card interchange fees andincreased cash back payments following the launch of the Rewards account.
Income from trading activities increased by £14 million to £820 million as a £219 million increase in NatWest Markets income has been partially offset by Capital Resolution, £133 million, and anincreased charge for volatile items under IFRS.
Other operating income reduced by £219 million principally reflecting planned asset disposals inCapital Resolution.
Q4 2016 compared with Q3 2016
Non-interest income of £1,008 million was £135 million, or 12%, lower than Q3 2016. CapitalResolution decreased by £413 million reflecting planned disposal activity, including disposal losses of£325 million compared with £143 million in Q3 2016, and NatWest Markets reduced by £183 million.Partially offsetting, we recognised a £308 million gain for volatile items under IFRS compared with aloss of £150 million in Q3 2016.
Q4 2016 compared with Q4 2015
Non-interest income was £686 million higher than Q4 2015. A gain of £308 million was recognised forvolatile items under IFRS, compared with £59 million in Q4 2015, and Q4 2015 included a £263 millionloss on redemption of own debt. In addition, NatWest Markets non-interest income increased by £98million to £256 million.
24 RBS – Annual results 2016
Analysis of results
Year ended Quarter ended
31 December 31 December 31 December 30 September 31 December
2016 2015 2016 2016 2015Operating expenses £m £m £m £m £m
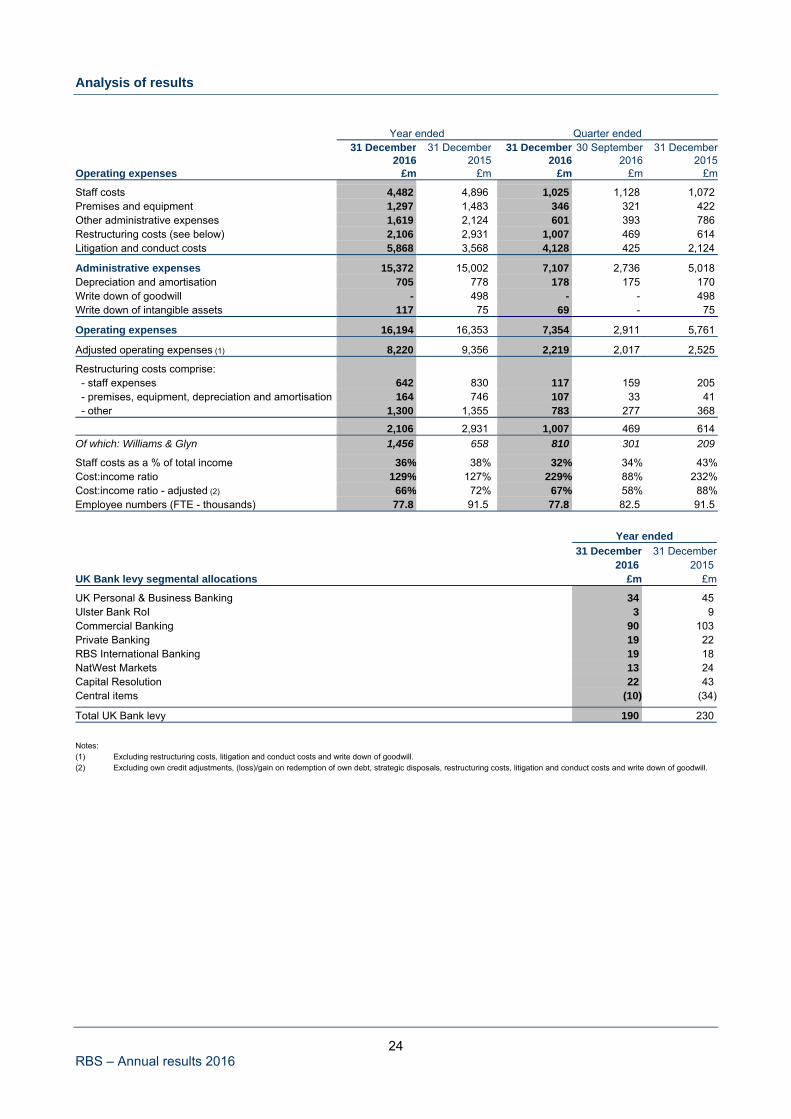
Staff costs 4,482 4,896 1,025 1,128 1,072 Premises and equipment 1,297 1,483 346 321 422 Other administrative expenses 1,619 2,124 601 393 786 Restructuring costs (see below) 2,106 2,931 1,007 469 614 Litigation and conduct costs 5,868 3,568 4,128 425 2,124
Administrative expenses 15,372 15,002 7,107 2,736 5,018 Depreciation and amortisation 705 778 178 175 170 Write down of goodwill - 498 - - 498 Write down of intangible assets 117 75 69 - 75
Operating expenses 16,194 16,353 7,354 2,911 5,761
Adjusted operating expenses (1) 8,220 9,356 2,219 2,017 2,525
Restructuring costs comprise: - staff expenses 642 830 117 159 205 - premises, equipment, depreciation and amortisation 164 746 107 33 41 - other 1,300 1,355 783 277 368
2,106 2,931 1,007 469 614
Of which: Williams & Glyn 1,456 658 810 301 209
Staff costs as a % of total income 36% 38% 32% 34% 43%Cost:income ratio 129% 127% 229% 88% 232%Cost:income ratio - adjusted (2) 66% 72% 67% 58% 88%Employee numbers (FTE - thousands) 77.8 91.5 77.8 82.5 91.5
Year ended 31 December 31 December 2016 2015 UK Bank levy segmental allocations £m £m
UK Personal & Business Banking 34 45 Ulster Bank RoI 3 9 Commercial Banking 90 103 Private Banking 19 22 RBS International Banking 19 18 NatWest Markets 13 24 Capital Resolution 22 43 Central items (10) (34)
Total UK Bank levy 190 230
Notes: (1) Excluding restructuring costs, litigation and conduct costs and write down of goodwill. (2) Excluding own credit adjustments, (loss)/gain on redemption of own debt, strategic disposals, restructuring costs, litigation and conduct costs and write down of goodwill.
25 RBS – Annual results 2016
Analysis of results
Key points 2016 compared with 2015
Operating expenses of £16,194 million were £159 million, or 1%, lower than 2015 reflecting a £1,136million, or 12%, reduction in adjusted operating expenses and a £825 million, or 28%, reduction inrestructuring costs. In addition, 2015 included a £498 million write down of goodwill relating to PrivateBanking. Partially offsetting the above, litigation and conduct costs increased by £2,300 million.
Adjusted operating expenses reduced by £1,136 million, or 12%, compared with 2015 to £8,220million. Excluding expenses associated with Williams & Glyn, write down of intangibles and a £227million VAT recovery, adjusted expenses reduced by £985(1) million, or 11%, in excess of our £800million target. RBS has achieved a cumulative cost reduction of £3.1 billion across 2014 – 2016.
Staff costs of £4,482 million were £414 million, or 8%, lower than 2015 underpinned by a 13,700, or15%, reduction in FTEs.
Restructuring costs were £2,106 million for 2016, compared with £2,931 million in 2015, and included a £750 million provision in respect of the 17 February 2017 update on RBS’s remaining State Aidobligation regarding Williams & Glyn. In addition, £706 million of the remaining restructuring costsrelate to Williams & Glyn, including £146 million of termination costs associated with the decision to discontinue the programme to create a cloned banking platform.
Litigation and conduct costs of £5,868 million included; a £3,107 million provision in relation to variousinvestigations and litigation matters relating to RBS’s issuance and underwriting of residentialmortgage-backed securities (RMBS), £601 million of additional PPI provisions, a £400 million provision in respect of the FCA review of RBS’s treatment of SMEs, an additional £169 million charge in respect of the settlement with the National Credit Union Administration Board to resolve two outstandingRMBS lawsuits in the United States relating to residential mortgage backed securities, a £172 million provision in Ulster Bank RoI, principally in respect of remediation and programme costs associatedwith an industry wide examination of tracker mortgages, and a provision in respect of the UK 2008rights issue shareholder litigation.
Q4 2016 compared with Q3 2016
Operating expenses of £7,354 million were £4,443 million higher than Q3 2016 driven by a £3,703million increase in litigation and conduct costs, a £538 million increase in restructuring costs and a£202 million increase in adjusted operating expenses.
Adjusted operating expenses of £2,219 million were £202 million higher than Q3 2016 principallyreflecting the UK bank levy charge of £190 million.
Restructuring costs of £1,007 million, compared with £469 million in Q3 2016, and included a £750 million provision in respect of the 17 February 2017 update on RBS’s remaining State Aid obligationregarding Williams & Glyn. In addition, £60 million of the remaining cost related to Williams & Glyn,£241 million, or 80%, lower than Q3 2016 following the decision to discontinue the programme tocreate a cloned banking platform.
Litigation and conduct costs of £4,128 million included; a £3,107 million provision in relation to variousinvestigations and litigation matters relating to RBS’s issuance and underwriting of RMBS, a £400 million provision in respect of the FCA review of RBS’s treatment of SMEs, £201 million of additionalPPI provisions and a £77 million provision in Ulster Bank RoI, principally in respect of remediation andprogramme costs associated with an industry wide examination of tracker mortgages.
Q4 2016 compared with Q4 2015
Operating expenses of £7,354 million were £1,593 million higher than Q4 2015 reflecting a £2,004million increase in litigation and conduct costs and a £393 million increase in restructuring costs,partially offset by a £498 million write down of goodwill in Q4 2015 and a £306 million reduction inadjusted operating expenses, principally driven by a £218 million reduction in Capital Resolution.
Note: (1) Operating expenses excluding restructuring costs £2,106 million (2015 - £2,931 million), litigation and conduct costs £5,868 million (2015 - £3,568 million), write down of
goodwill nil (2015 - £498 million), write down of other intangible assets of £117 million (2015 - £75 million), the operating costs of Williams and Glyn £393 million (2015 -£359 million) and the VAT recovery £227 million in 2016.
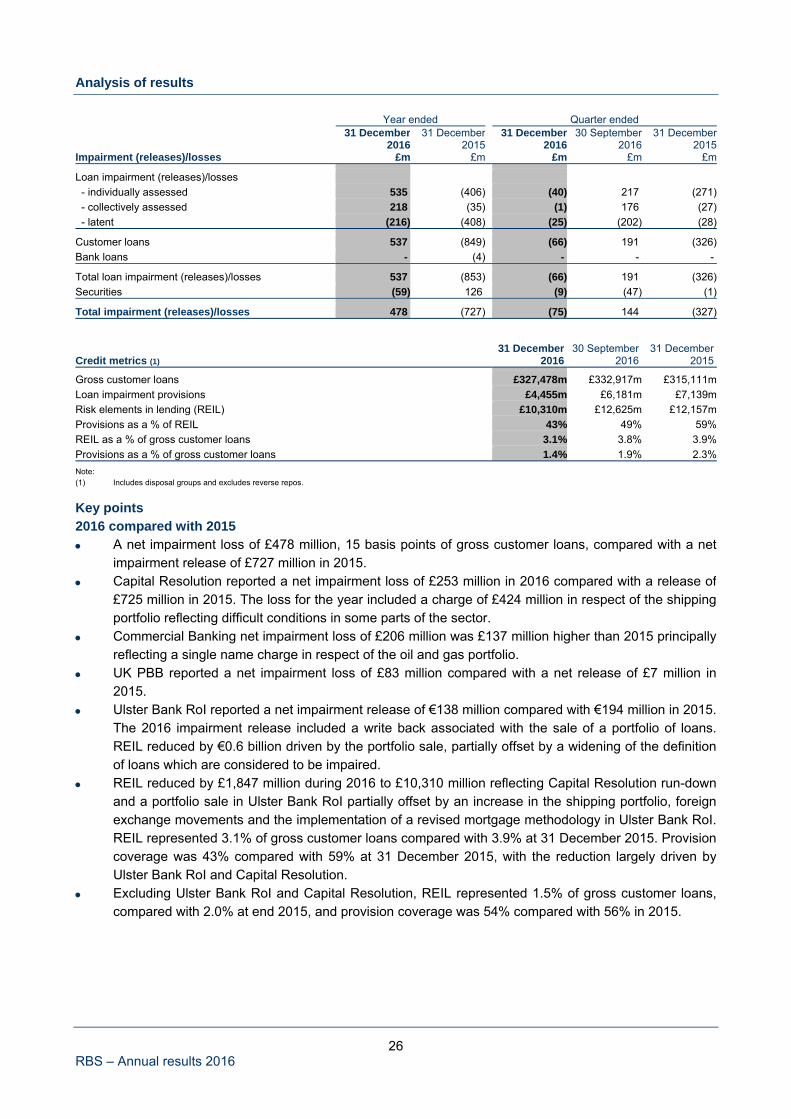
26 RBS – Annual results 2016
Analysis of results
Year ended Quarter ended
31 December 31 December 31 December 30 September 31 December
2016 2015 2016 2016 2015Impairment (releases)/losses £m £m £m £m £m
Loan impairment (releases)/losses
- individually assessed 535 (406) (40) 217 (271)
- collectively assessed 218 (35) (1) 176 (27)
- latent (216) (408) (25) (202) (28)
Customer loans 537 (849) (66) 191 (326)
Bank loans - (4) - - -
Total loan impairment (releases)/losses 537 (853) (66) 191 (326)
Securities (59) 126 (9) (47) (1)
Total impairment (releases)/losses 478 (727) (75) 144 (327)
31 December 30 September 31 December Credit metrics (1) 2016 2016 2015
Gross customer loans £327,478m £332,917m £315,111m
Loan impairment provisions £4,455m £6,181m £7,139m
Risk elements in lending (REIL) £10,310m £12,625m £12,157m
Provisions as a % of REIL 43% 49% 59%
REIL as a % of gross customer loans 3.1% 3.8% 3.9%
Provisions as a % of gross customer loans 1.4% 1.9% 2.3%
Note: (1) Includes disposal groups and excludes reverse repos.
Key points 2016 compared with 2015
A net impairment loss of £478 million, 15 basis points of gross customer loans, compared with a netimpairment release of £727 million in 2015.
Capital Resolution reported a net impairment loss of £253 million in 2016 compared with a release of£725 million in 2015. The loss for the year included a charge of £424 million in respect of the shippingportfolio reflecting difficult conditions in some parts of the sector.
Commercial Banking net impairment loss of £206 million was £137 million higher than 2015 principally reflecting a single name charge in respect of the oil and gas portfolio.
UK PBB reported a net impairment loss of £83 million compared with a net release of £7 million in2015.
Ulster Bank RoI reported a net impairment release of €138 million compared with €194 million in 2015. The 2016 impairment release included a write back associated with the sale of a portfolio of loans.REIL reduced by €0.6 billion driven by the portfolio sale, partially offset by a widening of the definitionof loans which are considered to be impaired.
REIL reduced by £1,847 million during 2016 to £10,310 million reflecting Capital Resolution run-down and a portfolio sale in Ulster Bank RoI partially offset by an increase in the shipping portfolio, foreignexchange movements and the implementation of a revised mortgage methodology in Ulster Bank RoI.REIL represented 3.1% of gross customer loans compared with 3.9% at 31 December 2015. Provisioncoverage was 43% compared with 59% at 31 December 2015, with the reduction largely driven by Ulster Bank RoI and Capital Resolution.
Excluding Ulster Bank RoI and Capital Resolution, REIL represented 1.5% of gross customer loans,compared with 2.0% at end 2015, and provision coverage was 54% compared with 56% in 2015.
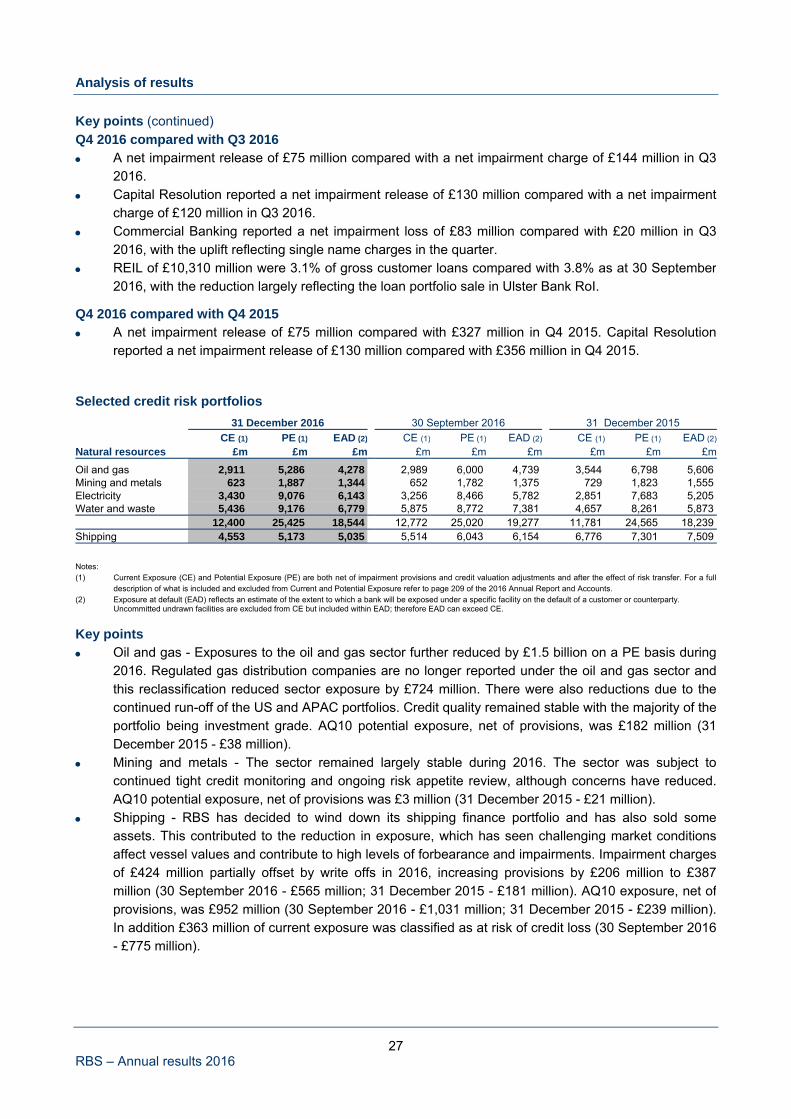
27 RBS – Annual results 2016
Analysis of results
Key points (continued) Q4 2016 compared with Q3 2016
A net impairment release of £75 million compared with a net impairment charge of £144 million in Q32016.
Capital Resolution reported a net impairment release of £130 million compared with a net impairmentcharge of £120 million in Q3 2016.
Commercial Banking reported a net impairment loss of £83 million compared with £20 million in Q32016, with the uplift reflecting single name charges in the quarter.
REIL of £10,310 million were 3.1% of gross customer loans compared with 3.8% as at 30 September 2016, with the reduction largely reflecting the loan portfolio sale in Ulster Bank RoI.
Q4 2016 compared with Q4 2015
A net impairment release of £75 million compared with £327 million in Q4 2015. Capital Resolutionreported a net impairment release of £130 million compared with £356 million in Q4 2015.
Selected credit risk portfolios
31 December 2016 30 September 2016 31 December 2015
CE (1) PE (1) EAD (2) CE (1) PE (1) EAD (2) CE (1) PE (1) EAD (2)
Natural resources £m £m £m £m £m £m £m £m £m
Oil and gas 2,911 5,286 4,278 2,989 6,000 4,739 3,544 6,798 5,606 Mining and metals 623 1,887 1,344 652 1,782 1,375 729 1,823 1,555 Electricity 3,430 9,076 6,143 3,256 8,466 5,782 2,851 7,683 5,205 Water and waste 5,436 9,176 6,779 5,875 8,772 7,381 4,657 8,261 5,873 12,400 25,425 18,544 12,772 25,020 19,277 11,781 24,565 18,239 Shipping 4,553 5,173 5,035 5,514 6,043 6,154 6,776 7,301 7,509
Notes: (1) Current Exposure (CE) and Potential Exposure (PE) are both net of impairment provisions and credit valuation adjustments and after the effect of risk transfer. For a full
description of what is included and excluded from Current and Potential Exposure refer to page 209 of the 2016 Annual Report and Accounts. (2) Exposure at default (EAD) reflects an estimate of the extent to which a bank will be exposed under a specific facility on the default of a customer or counterparty.
Uncommitted undrawn facilities are excluded from CE but included within EAD; therefore EAD can exceed CE.
Key points
Oil and gas - Exposures to the oil and gas sector further reduced by £1.5 billion on a PE basis during2016. Regulated gas distribution companies are no longer reported under the oil and gas sector andthis reclassification reduced sector exposure by £724 million. There were also reductions due to thecontinued run-off of the US and APAC portfolios. Credit quality remained stable with the majority of theportfolio being investment grade. AQ10 potential exposure, net of provisions, was £182 million (31December 2015 - £38 million).
Mining and metals - The sector remained largely stable during 2016. The sector was subject tocontinued tight credit monitoring and ongoing risk appetite review, although concerns have reduced.AQ10 potential exposure, net of provisions was £3 million (31 December 2015 - £21 million).
Shipping - RBS has decided to wind down its shipping finance portfolio and has also sold someassets. This contributed to the reduction in exposure, which has seen challenging market conditionsaffect vessel values and contribute to high levels of forbearance and impairments. Impairment chargesof £424 million partially offset by write offs in 2016, increasing provisions by £206 million to £387million (30 September 2016 - £565 million; 31 December 2015 - £181 million). AQ10 exposure, net of provisions, was £952 million (30 September 2016 - £1,031 million; 31 December 2015 - £239 million). In addition £363 million of current exposure was classified as at risk of credit loss (30 September 2016- £775 million).
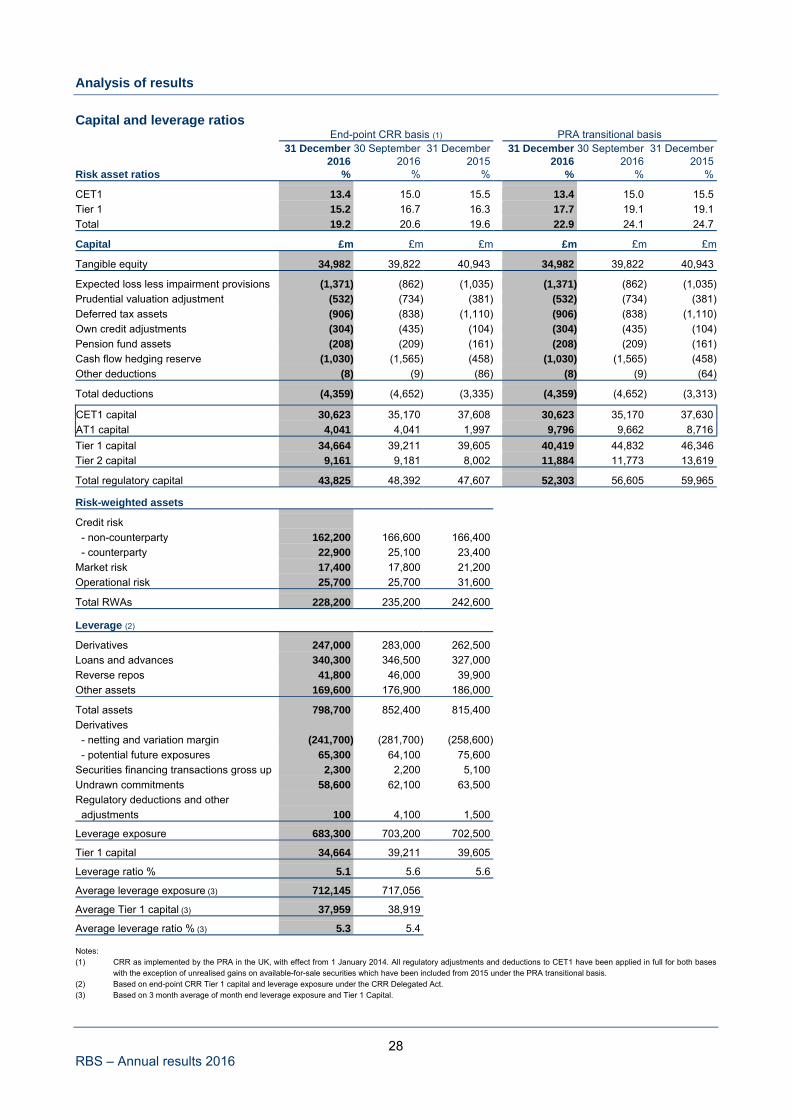
28 RBS – Annual results 2016
Analysis of results
Capital and leverage ratios End-point CRR basis (1) PRA transitional basis 31 December 30 September 31 December 31 December 30 September 31 December 2016 2016 2015 2016 2016 2015 Risk asset ratios % % % % % %
CET1 13.4 15.0 15.5 13.4 15.0 15.5
Tier 1 15.2 16.7 16.3 17.7 19.1 19.1
Total 19.2 20.6 19.6 22.9 24.1 24.7
Capital £m £m £m £m £m £m
Tangible equity 34,982 39,822 40,943 34,982 39,822 40,943
Expected loss less impairment provisions (1,371) (862) (1,035) (1,371) (862) (1,035)
Prudential valuation adjustment (532) (734) (381) (532) (734) (381)
Deferred tax assets (906) (838) (1,110) (906) (838) (1,110)
Own credit adjustments (304) (435) (104) (304) (435) (104)
Pension fund assets (208) (209) (161) (208) (209) (161)
Cash flow hedging reserve (1,030) (1,565) (458) (1,030) (1,565) (458)
Other deductions (8) (9) (86) (8) (9) (64)
Total deductions (4,359) (4,652) (3,335) (4,359) (4,652) (3,313)
CET1 capital 30,623 35,170 37,608 30,623 35,170 37,630
AT1 capital 4,041 4,041 1,997 9,796 9,662 8,716
Tier 1 capital 34,664 39,211 39,605 40,419 44,832 46,346
Tier 2 capital 9,161 9,181 8,002 11,884 11,773 13,619
Total regulatory capital 43,825 48,392 47,607 52,303 56,605 59,965
Risk-weighted assets
Credit risk
- non-counterparty 162,200 166,600 166,400
- counterparty 22,900 25,100 23,400
Market risk 17,400 17,800 21,200
Operational risk 25,700 25,700 31,600
Total RWAs 228,200 235,200 242,600
Leverage (2)
Derivatives 247,000 283,000 262,500
Loans and advances 340,300 346,500 327,000
Reverse repos 41,800 46,000 39,900
Other assets 169,600 176,900 186,000
Total assets 798,700 852,400 815,400
Derivatives
- netting and variation margin (241,700) (281,700) (258,600)
- potential future exposures 65,300 64,100 75,600
Securities financing transactions gross up 2,300 2,200 5,100
Undrawn commitments 58,600 62,100 63,500
Regulatory deductions and other
adjustments 100 4,100 1,500
Leverage exposure 683,300 703,200 702,500
Tier 1 capital 34,664 39,211 39,605
Leverage ratio % 5.1 5.6 5.6
Average leverage exposure (3) 712,145 717,056
Average Tier 1 capital (3) 37,959 38,919
Average leverage ratio % (3) 5.3 5.4 Notes: (1) CRR as implemented by the PRA in the UK, with effect from 1 January 2014. All regulatory adjustments and deductions to CET1 have been applied in full for both bases
with the exception of unrealised gains on available-for-sale securities which have been included from 2015 under the PRA transitional basis. (2) Based on end-point CRR Tier 1 capital and leverage exposure under the CRR Delegated Act. (3) Based on 3 month average of month end leverage exposure and Tier 1 Capital.
29 RBS – Annual results 2016
Analysis of results
Key points The CET1 ratio decreased by 210 basis points to 13.4% in 2016, reflecting lower CET1 capital partially
offset by a reduction in RWAs.
Litigation and conduct charges of £5.9 billion in 2016 contributed to a significant reduction in the CET1capital. Management actions to normalise the ownership structure and improve the long-term resilience of RBS also contributed to the reduction. These actions included the final Dividend Access Sharepayment of £1.2 billion and the impact of the accelerated pension payment of £4.2 billion.
Tier 1 capital benefitted from the successful issuance of £2 billion of Additional Tier 1 (AT1) capital notesin August 2016. Total end-point CRR compliant AT1 capital now stands at £4.0 billion.
RWAs decreased by £14.4 billion in the year to £228.2 billion consisting of reductions across all risktypes predominantly driven by the run down activity within Capital Resolution which resulted in an RWA decrease of £14.5 billion.
o Non-counterparty credit risk RWAs have decreased by £4.2 billion reflecting disposal activity in Capital Resolution partly offset by the adverse impact of foreign exchange movements.
o The impact of sterling weakening and the implementation of a new risk model for banks in thefirst half of the year, led to an increase of £2.8 billion in counterparty credit risk RWAs in NatWest Markets. This was offset by a reduction of £3.3 billion in Capital Resolution to result in an overall decrease of £0.5 billion.
o Market risk RWAs reduced by £3.8 billion driven by disposals in Capital Resolution, business mitigation activity in NatWest Markets and lower US dollar position risk in Treasury.
o Operational risk RWAs decreased by £5.9 billion as a result of the annual recalculation and theremoval of the element relating to Citizens following regulatory approval.
The leverage ratio reduced by 50 basis points to 5.1% at 31 December 2016, primarily reflecting CET1capital erosion partially offset by additional AT1 issuance.
The leverage exposure decreased by £19.2 billion to £683.3 billion. Growth in PBB and CPB lending hasbeen more than offset by lower undrawn commitments and derivative potential future exposures. During2016, approximately half the interest rate trades cleared through London Clearing House have beensettled-to-market each day rather than being collateralised, reducing potential future exposures by £10.3billion.
The UK leverage ratio reflecting the post EU referendum measures announced by the Bank of Englandin Q3 2016 was estimated at 5.6%.
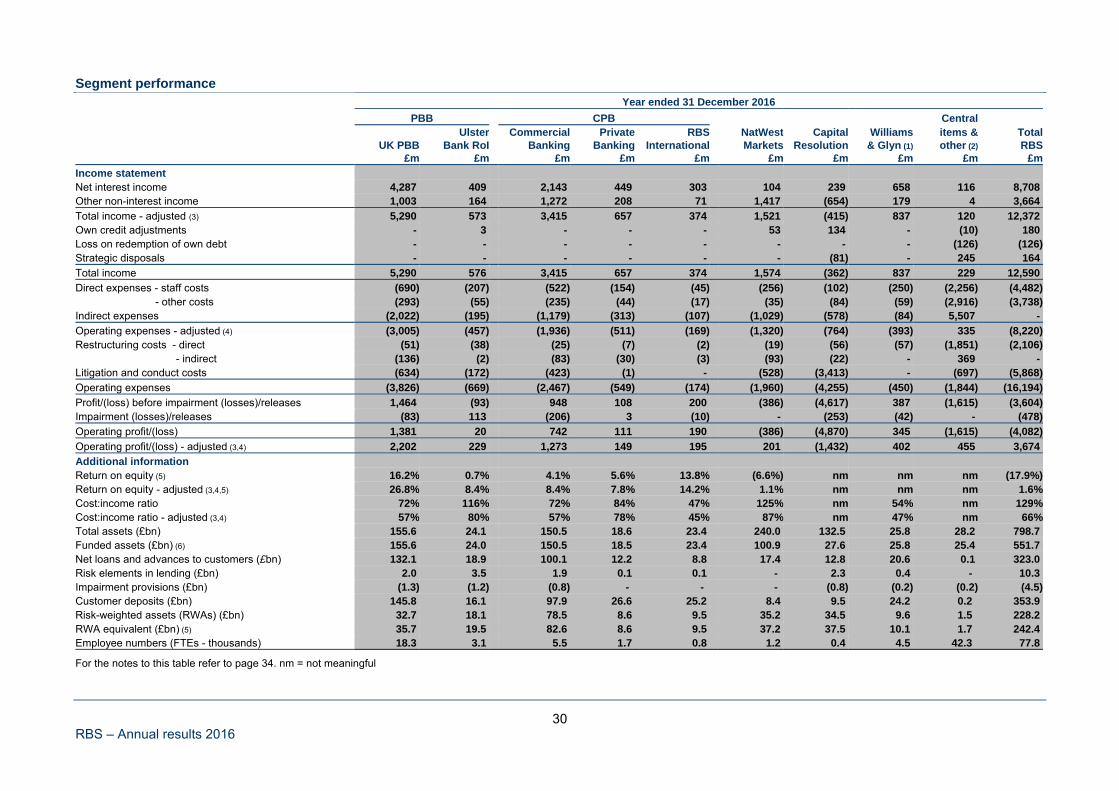
30 RBS – Annual results 2016
Segment performance Year ended 31 December 2016
PBB CPB Central Ulster Commercial Private RBS NatWest Capital Williams items & Total UK PBB Bank RoI Banking Banking International Markets Resolution & Glyn (1) other (2) RBS £m £m £m £m £m £m £m £m £m £m
Income statement Net interest income 4,287 409 2,143 449 303 104 239 658 116 8,708 Other non-interest income 1,003 164 1,272 208 71 1,417 (654) 179 4 3,664
Total income - adjusted (3) 5,290 573 3,415 657 374 1,521 (415) 837 120 12,372 Own credit adjustments - 3 - - - 53 134 - (10) 180 Loss on redemption of own debt - - - - - - - - (126) (126)Strategic disposals - - - - - - (81) - 245 164
Total income 5,290 576 3,415 657 374 1,574 (362) 837 229 12,590
Direct expenses - staff costs (690) (207) (522) (154) (45) (256) (102) (250) (2,256) (4,482) - other costs (293) (55) (235) (44) (17) (35) (84) (59) (2,916) (3,738)Indirect expenses (2,022) (195) (1,179) (313) (107) (1,029) (578) (84) 5,507 -
Operating expenses - adjusted (4) (3,005) (457) (1,936) (511) (169) (1,320) (764) (393) 335 (8,220)Restructuring costs - direct (51) (38) (25) (7) (2) (19) (56) (57) (1,851) (2,106) - indirect (136) (2) (83) (30) (3) (93) (22) - 369 - Litigation and conduct costs (634) (172) (423) (1) - (528) (3,413) - (697) (5,868)
Operating expenses (3,826) (669) (2,467) (549) (174) (1,960) (4,255) (450) (1,844) (16,194)
Profit/(loss) before impairment (losses)/releases 1,464 (93) 948 108 200 (386) (4,617) 387 (1,615) (3,604)Impairment (losses)/releases (83) 113 (206) 3 (10) - (253) (42) - (478)
Operating profit/(loss) 1,381 20 742 111 190 (386) (4,870) 345 (1,615) (4,082)
Operating profit/(loss) - adjusted (3,4) 2,202 229 1,273 149 195 201 (1,432) 402 455 3,674
Additional information Return on equity (5) 16.2% 0.7% 4.1% 5.6% 13.8% (6.6%) nm nm nm (17.9%)Return on equity - adjusted (3,4,5) 26.8% 8.4% 8.4% 7.8% 14.2% 1.1% nm nm nm 1.6%Cost:income ratio 72% 116% 72% 84% 47% 125% nm 54% nm 129%Cost:income ratio - adjusted (3,4) 57% 80% 57% 78% 45% 87% nm 47% nm 66%Total assets (£bn) 155.6 24.1 150.5 18.6 23.4 240.0 132.5 25.8 28.2 798.7 Funded assets (£bn) (6) 155.6 24.0 150.5 18.5 23.4 100.9 27.6 25.8 25.4 551.7 Net loans and advances to customers (£bn) 132.1 18.9 100.1 12.2 8.8 17.4 12.8 20.6 0.1 323.0 Risk elements in lending (£bn) 2.0 3.5 1.9 0.1 0.1 - 2.3 0.4 - 10.3 Impairment provisions (£bn) (1.3) (1.2) (0.8) - - - (0.8) (0.2) (0.2) (4.5)Customer deposits (£bn) 145.8 16.1 97.9 26.6 25.2 8.4 9.5 24.2 0.2 353.9 Risk-weighted assets (RWAs) (£bn) 32.7 18.1 78.5 8.6 9.5 35.2 34.5 9.6 1.5 228.2 RWA equivalent (£bn) (5) 35.7 19.5 82.6 8.6 9.5 37.2 37.5 10.1 1.7 242.4 Employee numbers (FTEs - thousands) 18.3 3.1 5.5 1.7 0.8 1.2 0.4 4.5 42.3 77.8
For the notes to this table refer to page 34. nm = not meaningful
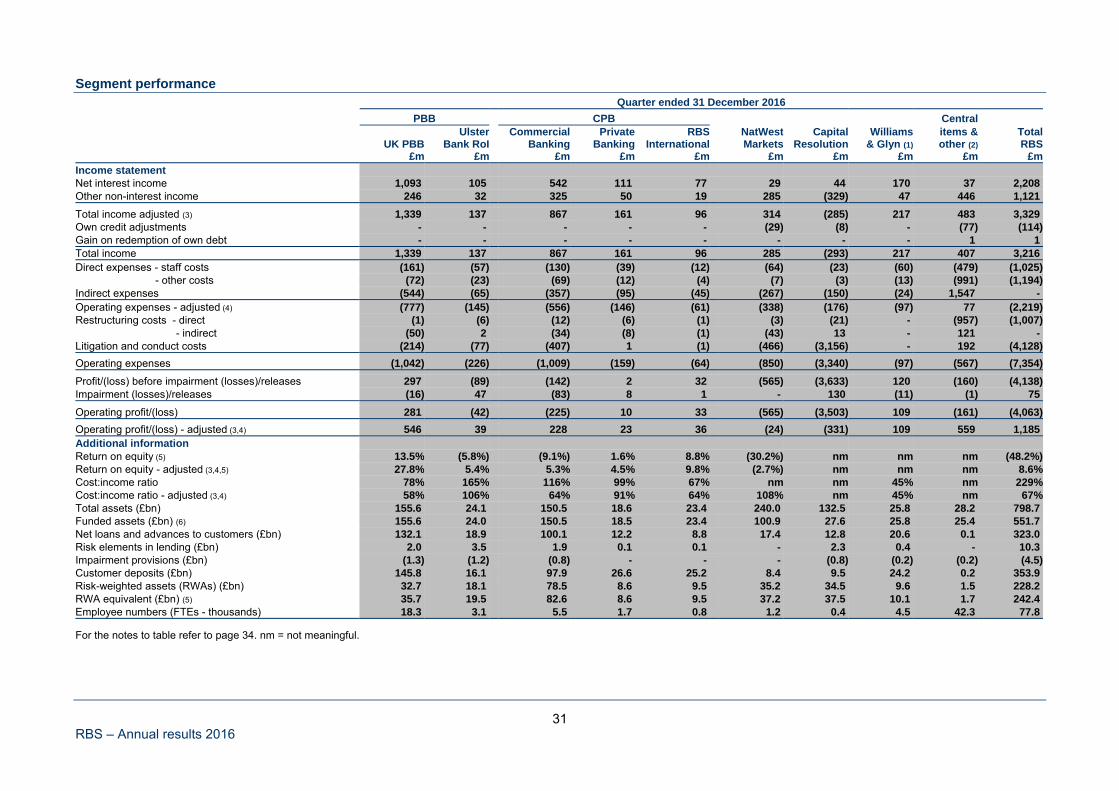
31 RBS – Annual results 2016
Segment performance Quarter ended 31 December 2016
PBB CPB Central Ulster Commercial Private RBS NatWest Capital Williams items & Total UK PBB Bank RoI Banking Banking International Markets Resolution & Glyn (1) other (2) RBS £m £m £m £m £m £m £m £m £m £mIncome statement Net interest income 1,093 105 542 111 77 29 44 170 37 2,208 Other non-interest income 246 32 325 50 19 285 (329) 47 446 1,121
Total income adjusted (3) 1,339 137 867 161 96 314 (285) 217 483 3,329 Own credit adjustments - - - - - (29) (8) - (77) (114)Gain on redemption of own debt - - - - - - - - 1 1 Total income 1,339 137 867 161 96 285 (293) 217 407 3,216 Direct expenses - staff costs (161) (57) (130) (39) (12) (64) (23) (60) (479) (1,025) - other costs (72) (23) (69) (12) (4) (7) (3) (13) (991) (1,194)Indirect expenses (544) (65) (357) (95) (45) (267) (150) (24) 1,547 - Operating expenses - adjusted (4) (777) (145) (556) (146) (61) (338) (176) (97) 77 (2,219)Restructuring costs - direct (1) (6) (12) (6) (1) (3) (21) - (957) (1,007) - indirect (50) 2 (34) (8) (1) (43) 13 - 121 - Litigation and conduct costs (214) (77) (407) 1 (1) (466) (3,156) - 192 (4,128)
Operating expenses (1,042) (226) (1,009) (159) (64) (850) (3,340) (97) (567) (7,354)
Profit/(loss) before impairment (losses)/releases 297 (89) (142) 2 32 (565) (3,633) 120 (160) (4,138)Impairment (losses)/releases (16) 47 (83) 8 1 - 130 (11) (1) 75
Operating profit/(loss) 281 (42) (225) 10 33 (565) (3,503) 109 (161) (4,063)
Operating profit/(loss) - adjusted (3,4) 546 39 228 23 36 (24) (331) 109 559 1,185 Additional information Return on equity (5) 13.5% (5.8%) (9.1%) 1.6% 8.8% (30.2%) nm nm nm (48.2%)Return on equity - adjusted (3,4,5) 27.8% 5.4% 5.3% 4.5% 9.8% (2.7%) nm nm nm 8.6%Cost:income ratio 78% 165% 116% 99% 67% nm nm 45% nm 229%Cost:income ratio - adjusted (3,4) 58% 106% 64% 91% 64% 108% nm 45% nm 67%Total assets (£bn) 155.6 24.1 150.5 18.6 23.4 240.0 132.5 25.8 28.2 798.7 Funded assets (£bn) (6) 155.6 24.0 150.5 18.5 23.4 100.9 27.6 25.8 25.4 551.7 Net loans and advances to customers (£bn) 132.1 18.9 100.1 12.2 8.8 17.4 12.8 20.6 0.1 323.0 Risk elements in lending (£bn) 2.0 3.5 1.9 0.1 0.1 - 2.3 0.4 - 10.3 Impairment provisions (£bn) (1.3) (1.2) (0.8) - - - (0.8) (0.2) (0.2) (4.5)Customer deposits (£bn) 145.8 16.1 97.9 26.6 25.2 8.4 9.5 24.2 0.2 353.9 Risk-weighted assets (RWAs) (£bn) 32.7 18.1 78.5 8.6 9.5 35.2 34.5 9.6 1.5 228.2 RWA equivalent (£bn) (5) 35.7 19.5 82.6 8.6 9.5 37.2 37.5 10.1 1.7 242.4 Employee numbers (FTEs - thousands) 18.3 3.1 5.5 1.7 0.8 1.2 0.4 4.5 42.3 77.8 For the notes to table refer to page 34. nm = not meaningful.
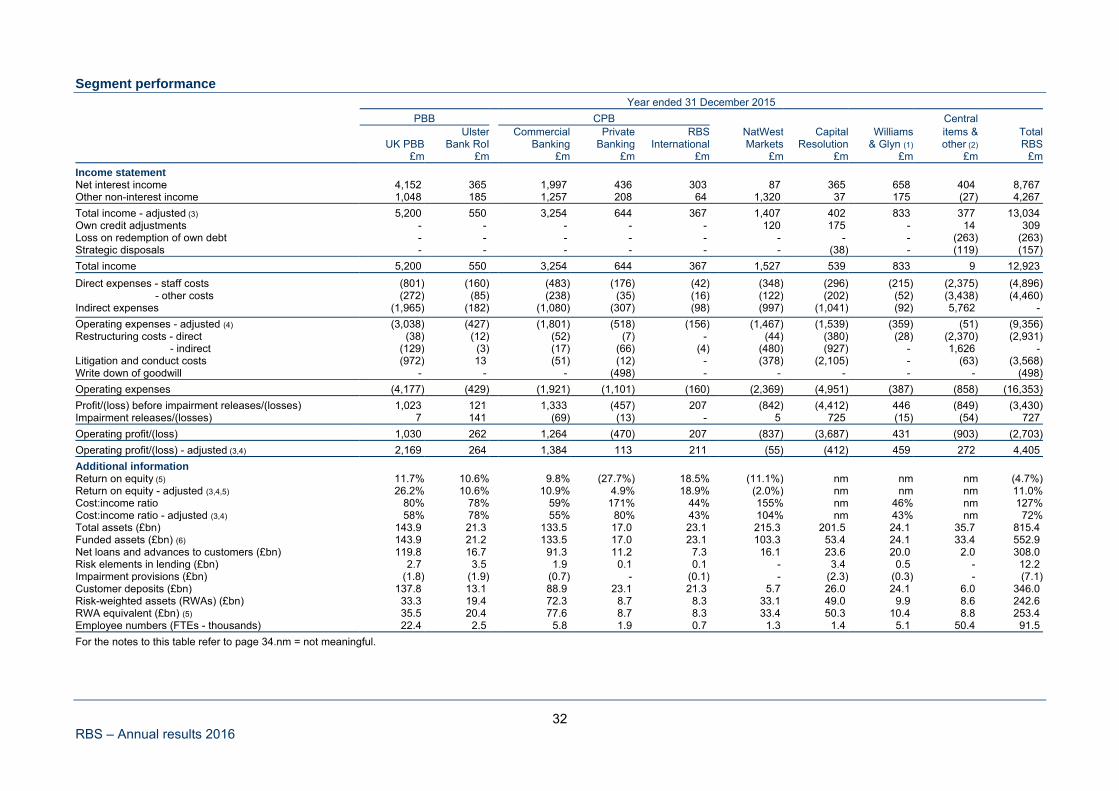
32 RBS – Annual results 2016
Segment performance Year ended 31 December 2015
PBB CPB Central Ulster Commercial Private RBS NatWest Capital Williams items & Total UK PBB Bank RoI Banking Banking International Markets Resolution & Glyn (1) other (2) RBS £m £m £m £m £m £m £m £m £m £m
Income statement Net interest income 4,152 365 1,997 436 303 87 365 658 404 8,767 Other non-interest income 1,048 185 1,257 208 64 1,320 37 175 (27) 4,267
Total income - adjusted (3) 5,200 550 3,254 644 367 1,407 402 833 377 13,034 Own credit adjustments - - - - - 120 175 - 14 309 Loss on redemption of own debt - - - - - - - - (263) (263)Strategic disposals - - - - - - (38) - (119) (157)
Total income 5,200 550 3,254 644 367 1,527 539 833 9 12,923
Direct expenses - staff costs (801) (160) (483) (176) (42) (348) (296) (215) (2,375) (4,896) - other costs (272) (85) (238) (35) (16) (122) (202) (52) (3,438) (4,460)Indirect expenses (1,965) (182) (1,080) (307) (98) (997) (1,041) (92) 5,762 -
Operating expenses - adjusted (4) (3,038) (427) (1,801) (518) (156) (1,467) (1,539) (359) (51) (9,356)Restructuring costs - direct (38) (12) (52) (7) - (44) (380) (28) (2,370) (2,931) - indirect (129) (3) (17) (66) (4) (480) (927) - 1,626 - Litigation and conduct costs (972) 13 (51) (12) - (378) (2,105) - (63) (3,568)Write down of goodwill - - - (498) - - - - - (498)
Operating expenses (4,177) (429) (1,921) (1,101) (160) (2,369) (4,951) (387) (858) (16,353)
Profit/(loss) before impairment releases/(losses) 1,023 121 1,333 (457) 207 (842) (4,412) 446 (849) (3,430)Impairment releases/(losses) 7 141 (69) (13) - 5 725 (15) (54) 727
Operating profit/(loss) 1,030 262 1,264 (470) 207 (837) (3,687) 431 (903) (2,703)
Operating profit/(loss) - adjusted (3,4) 2,169 264 1,384 113 211 (55) (412) 459 272 4,405
Additional information Return on equity (5) 11.7% 10.6% 9.8% (27.7%) 18.5% (11.1%) nm nm nm (4.7%)Return on equity - adjusted (3,4,5) 26.2% 10.6% 10.9% 4.9% 18.9% (2.0%) nm nm nm 11.0% Cost:income ratio 80% 78% 59% 171% 44% 155% nm 46% nm 127% Cost:income ratio - adjusted (3,4) 58% 78% 55% 80% 43% 104% nm 43% nm 72% Total assets (£bn) 143.9 21.3 133.5 17.0 23.1 215.3 201.5 24.1 35.7 815.4 Funded assets (£bn) (6) 143.9 21.2 133.5 17.0 23.1 103.3 53.4 24.1 33.4 552.9 Net loans and advances to customers (£bn) 119.8 16.7 91.3 11.2 7.3 16.1 23.6 20.0 2.0 308.0 Risk elements in lending (£bn) 2.7 3.5 1.9 0.1 0.1 - 3.4 0.5 - 12.2 Impairment provisions (£bn) (1.8) (1.9) (0.7) - (0.1) - (2.3) (0.3) - (7.1)Customer deposits (£bn) 137.8 13.1 88.9 23.1 21.3 5.7 26.0 24.1 6.0 346.0 Risk-weighted assets (RWAs) (£bn) 33.3 19.4 72.3 8.7 8.3 33.1 49.0 9.9 8.6 242.6 RWA equivalent (£bn) (5) 35.5 20.4 77.6 8.7 8.3 33.4 50.3 10.4 8.8 253.4 Employee numbers (FTEs - thousands) 22.4 2.5 5.8 1.9 0.7 1.3 1.4 5.1 50.4 91.5
For the notes to this table refer to page 34.nm = not meaningful.
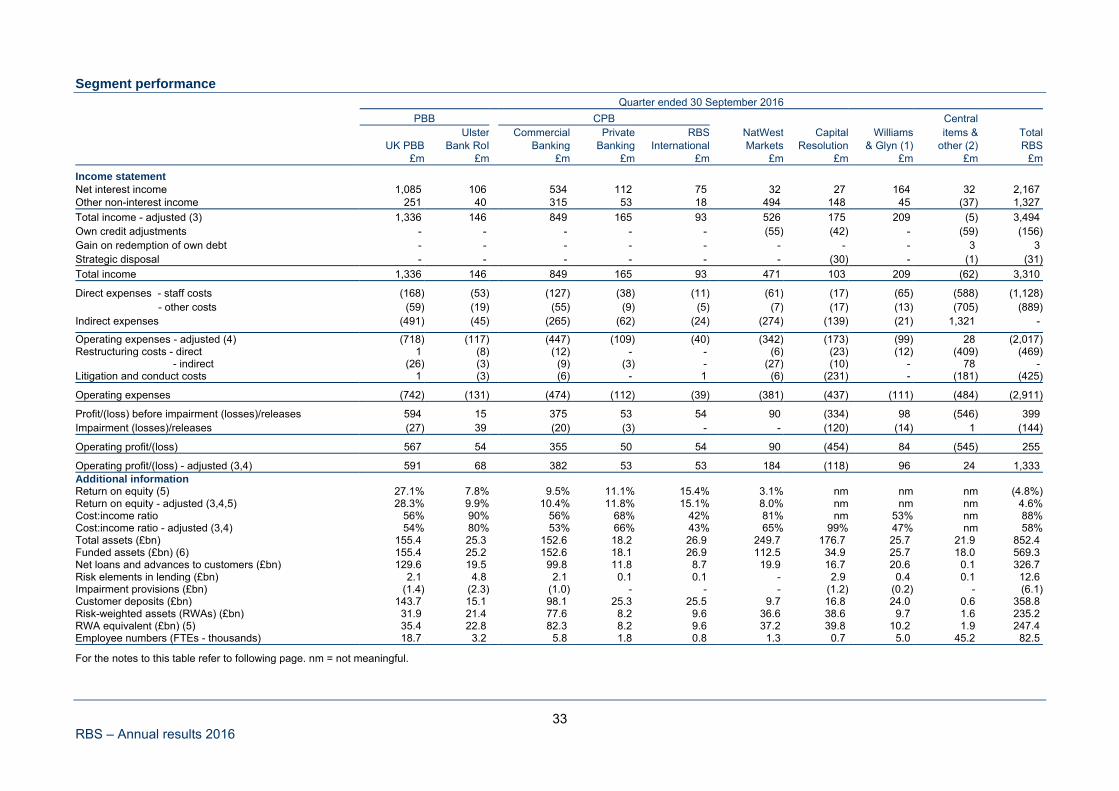
33 RBS – Annual results 2016
Segment performance Quarter ended 30 September 2016
PBB CPB Central Ulster Commercial Private RBS NatWest Capital Williams items & Total UK PBB Bank RoI Banking Banking International Markets Resolution & Glyn (1) other (2) RBS £m £m £m £m £m £m £m £m £m £m
Income statement Net interest income 1,085 106 534 112 75 32 27 164 32 2,167 Other non-interest income 251 40 315 53 18 494 148 45 (37) 1,327
Total income - adjusted (3) 1,336 146 849 165 93 526 175 209 (5) 3,494 Own credit adjustments - - - - - (55) (42) - (59) (156)Gain on redemption of own debt - - - - - - - - 3 3 Strategic disposal - - - - - - (30) - (1) (31)
Total income 1,336 146 849 165 93 471 103 209 (62) 3,310
Direct expenses - staff costs (168) (53) (127) (38) (11) (61) (17) (65) (588) (1,128) - other costs (59) (19) (55) (9) (5) (7) (17) (13) (705) (889)Indirect expenses (491) (45) (265) (62) (24) (274) (139) (21) 1,321 -
Operating expenses - adjusted (4) (718) (117) (447) (109) (40) (342) (173) (99) 28 (2,017)Restructuring costs - direct 1 (8) (12) - - (6) (23) (12) (409) (469) - indirect (26) (3) (9) (3) - (27) (10) - 78 - Litigation and conduct costs 1 (3) (6) - 1 (6) (231) - (181) (425)
Operating expenses (742) (131) (474) (112) (39) (381) (437) (111) (484) (2,911)
Profit/(loss) before impairment (losses)/releases 594 15 375 53 54 90 (334) 98 (546) 399 Impairment (losses)/releases (27) 39 (20) (3) - - (120) (14) 1 (144)
Operating profit/(loss) 567 54 355 50 54 90 (454) 84 (545) 255
Operating profit/(loss) - adjusted (3,4) 591 68 382 53 53 184 (118) 96 24 1,333 Additional information Return on equity (5) 27.1% 7.8% 9.5% 11.1% 15.4% 3.1% nm nm nm (4.8%)Return on equity - adjusted (3,4,5) 28.3% 9.9% 10.4% 11.8% 15.1% 8.0% nm nm nm 4.6%Cost:income ratio 56% 90% 56% 68% 42% 81% nm 53% nm 88%Cost:income ratio - adjusted (3,4) 54% 80% 53% 66% 43% 65% 99% 47% nm 58%Total assets (£bn) 155.4 25.3 152.6 18.2 26.9 249.7 176.7 25.7 21.9 852.4 Funded assets (£bn) (6) 155.4 25.2 152.6 18.1 26.9 112.5 34.9 25.7 18.0 569.3 Net loans and advances to customers (£bn) 129.6 19.5 99.8 11.8 8.7 19.9 16.7 20.6 0.1 326.7 Risk elements in lending (£bn) 2.1 4.8 2.1 0.1 0.1 - 2.9 0.4 0.1 12.6 Impairment provisions (£bn) (1.4) (2.3) (1.0) - - - (1.2) (0.2) - (6.1)Customer deposits (£bn) 143.7 15.1 98.1 25.3 25.5 9.7 16.8 24.0 0.6 358.8 Risk-weighted assets (RWAs) (£bn) 31.9 21.4 77.6 8.2 9.6 36.6 38.6 9.7 1.6 235.2 RWA equivalent (£bn) (5) 35.4 22.8 82.3 8.2 9.6 37.2 39.8 10.2 1.9 247.4 Employee numbers (FTEs - thousands) 18.7 3.2 5.8 1.8 0.8 1.3 0.7 5.0 45.2 82.5
For the notes to this table refer to following page. nm = not meaningful.
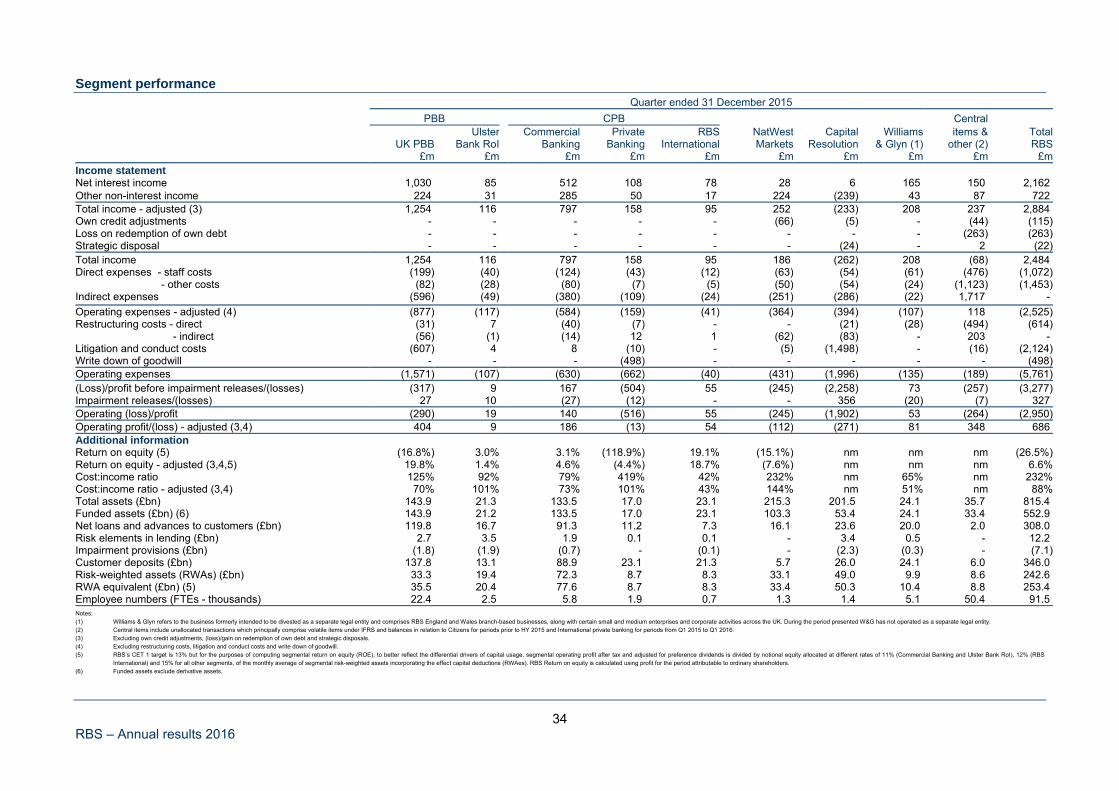
34 RBS – Annual results 2016
Segment performance Quarter ended 31 December 2015
PBB CPB Central Ulster Commercial Private RBS NatWest Capital Williams items & Total UK PBB Bank RoI Banking Banking International Markets Resolution & Glyn (1) other (2) RBS £m £m £m £m £m £m £m £m £m £mIncome statement Net interest income 1,030 85 512 108 78 28 6 165 150 2,162 Other non-interest income 224 31 285 50 17 224 (239) 43 87 722 Total income - adjusted (3) 1,254 116 797 158 95 252 (233) 208 237 2,884 Own credit adjustments - - - - - (66) (5) - (44) (115)Loss on redemption of own debt - - - - - - - - (263) (263)Strategic disposal - - - - - - (24) - 2 (22)Total income 1,254 116 797 158 95 186 (262) 208 (68) 2,484 Direct expenses - staff costs (199) (40) (124) (43) (12) (63) (54) (61) (476) (1,072) - other costs (82) (28) (80) (7) (5) (50) (54) (24) (1,123) (1,453)Indirect expenses (596) (49) (380) (109) (24) (251) (286) (22) 1,717 -
Operating expenses - adjusted (4) (877) (117) (584) (159) (41) (364) (394) (107) 118 (2,525)Restructuring costs - direct (31) 7 (40) (7) - - (21) (28) (494) (614) - indirect (56) (1) (14) 12 1 (62) (83) - 203 - Litigation and conduct costs (607) 4 8 (10) - (5) (1,498) - (16) (2,124)Write down of goodwill - - - (498) - - - - - (498)Operating expenses (1,571) (107) (630) (662) (40) (431) (1,996) (135) (189) (5,761)(Loss)/profit before impairment releases/(losses) (317) 9 167 (504) 55 (245) (2,258) 73 (257) (3,277)Impairment releases/(losses) 27 10 (27) (12) - - 356 (20) (7) 327 Operating (loss)/profit (290) 19 140 (516) 55 (245) (1,902) 53 (264) (2,950)Operating profit/(loss) - adjusted (3,4) 404 9 186 (13) 54 (112) (271) 81 348 686 Additional information Return on equity (5) (16.8%) 3.0% 3.1% (118.9%) 19.1% (15.1%) nm nm nm (26.5%)Return on equity - adjusted (3,4,5) 19.8% 1.4% 4.6% (4.4%) 18.7% (7.6%) nm nm nm 6.6%Cost:income ratio 125% 92% 79% 419% 42% 232% nm 65% nm 232%Cost:income ratio - adjusted (3,4) 70% 101% 73% 101% 43% 144% nm 51% nm 88%Total assets (£bn) 143.9 21.3 133.5 17.0 23.1 215.3 201.5 24.1 35.7 815.4 Funded assets (£bn) (6) 143.9 21.2 133.5 17.0 23.1 103.3 53.4 24.1 33.4 552.9 Net loans and advances to customers (£bn) 119.8 16.7 91.3 11.2 7.3 16.1 23.6 20.0 2.0 308.0 Risk elements in lending (£bn) 2.7 3.5 1.9 0.1 0.1 - 3.4 0.5 - 12.2 Impairment provisions (£bn) (1.8) (1.9) (0.7) - (0.1) - (2.3) (0.3) - (7.1)Customer deposits (£bn) 137.8 13.1 88.9 23.1 21.3 5.7 26.0 24.1 6.0 346.0 Risk-weighted assets (RWAs) (£bn) 33.3 19.4 72.3 8.7 8.3 33.1 49.0 9.9 8.6 242.6 RWA equivalent (£bn) (5) 35.5 20.4 77.6 8.7 8.3 33.4 50.3 10.4 8.8 253.4 Employee numbers (FTEs - thousands) 22.4 2.5 5.8 1.9 0.7 1.3 1.4 5.1 50.4 91.5
Notes: (1) Williams & Glyn refers to the business formerly intended to be divested as a separate legal entity and comprises RBS England and Wales branch-based businesses, along with certain small and medium enterprises and corporate activities across the UK. During the period presented W&G has not operated as a separate legal entity. (2) Central items include unallocated transactions which principally comprise volatile items under IFRS and balances in relation to Citizens for periods prior to HY 2015 and International private banking for periods from Q1 2015 to Q1 2016. (3) Excluding own credit adjustments, (loss)/gain on redemption of own debt and strategic disposals. (4) Excluding restructuring costs, litigation and conduct costs and write down of goodwill. (5) RBS’s CET 1 target is 13% but for the purposes of computing segmental return on equity (ROE), to better reflect the differential drivers of capital usage, segmental operating profit after tax and adjusted for preference dividends is divided by notional equity allocated at different rates of 11% (Commercial Banking and Ulster Bank RoI), 12% (RBS
International) and 15% for all other segments, of the monthly average of segmental risk-weighted assets incorporating the effect capital deductions (RWAes). RBS Return on equity is calculated using profit for the period attributable to ordinary shareholders. (6) Funded assets exclude derivative assets.
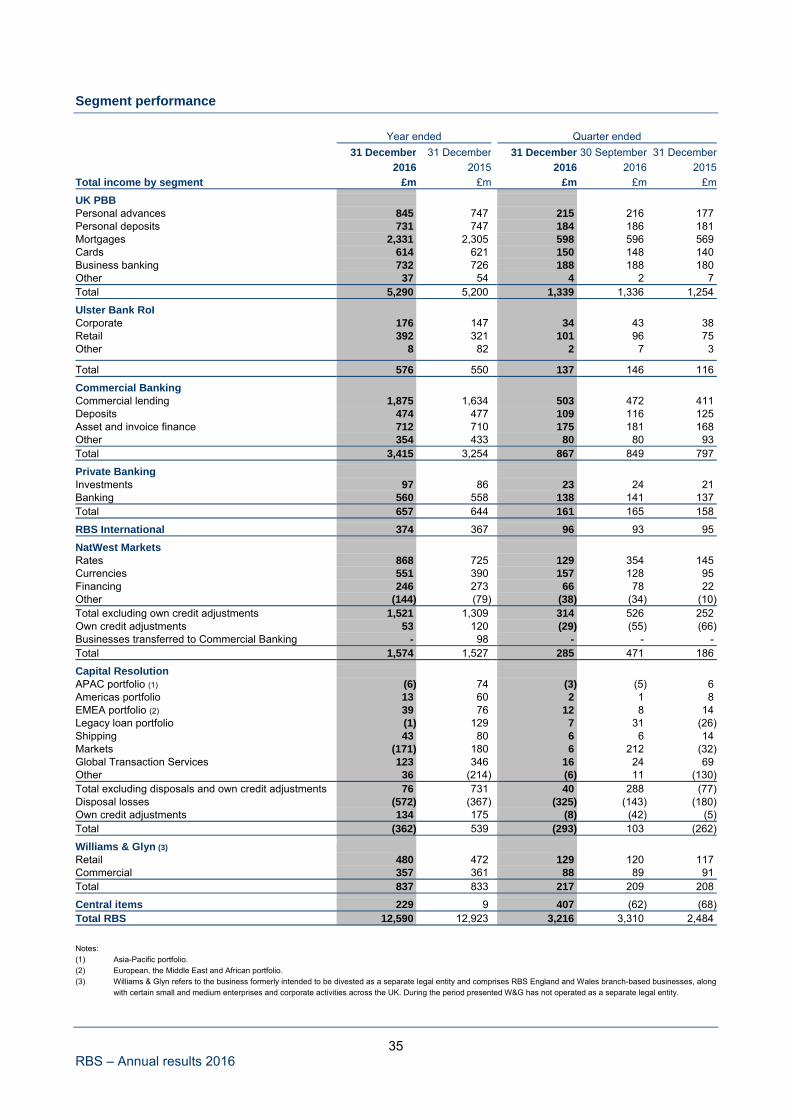
35 RBS – Annual results 2016
Segment performance
Year ended Quarter ended 31 December 31 December 31 December 30 September 31 December
2016 2015 2016 2016 2015
Total income by segment £m £m £m £m £m
UK PBB Personal advances 845 747 215 216 177 Personal deposits 731 747 184 186 181 Mortgages 2,331 2,305 598 596 569 Cards 614 621 150 148 140 Business banking 732 726 188 188 180 Other 37 54 4 2 7 Total 5,290 5,200 1,339 1,336 1,254
Ulster Bank RoI Corporate 176 147 34 43 38 Retail 392 321 101 96 75 Other 8 82 2 7 3
Total 576 550 137 146 116
Commercial Banking Commercial lending 1,875 1,634 503 472 411 Deposits 474 477 109 116 125 Asset and invoice finance 712 710 175 181 168 Other 354 433 80 80 93 Total 3,415 3,254 867 849 797
Private Banking Investments 97 86 23 24 21 Banking 560 558 138 141 137 Total 657 644 161 165 158
RBS International 374 367 96 93 95
NatWest Markets Rates 868 725 129 354 145 Currencies 551 390 157 128 95 Financing 246 273 66 78 22 Other (144) (79) (38) (34) (10)Total excluding own credit adjustments 1,521 1,309 314 526 252 Own credit adjustments 53 120 (29) (55) (66)Businesses transferred to Commercial Banking - 98 - - - Total 1,574 1,527 285 471 186
Capital Resolution APAC portfolio (1) (6) 74 (3) (5) 6 Americas portfolio 13 60 2 1 8 EMEA portfolio (2) 39 76 12 8 14 Legacy loan portfolio (1) 129 7 31 (26)Shipping 43 80 6 6 14 Markets (171) 180 6 212 (32)Global Transaction Services 123 346 16 24 69 Other 36 (214) (6) 11 (130)Total excluding disposals and own credit adjustments 76 731 40 288 (77)Disposal losses (572) (367) (325) (143) (180)Own credit adjustments 134 175 (8) (42) (5)Total (362) 539 (293) 103 (262)
Williams & Glyn (3) Retail 480 472 129 120 117 Commercial 357 361 88 89 91 Total 837 833 217 209 208
Central items 229 9 407 (62) (68)Total RBS 12,590 12,923 3,216 3,310 2,484
Notes: (1) Asia-Pacific portfolio. (2) European, the Middle East and African portfolio. (3) Williams & Glyn refers to the business formerly intended to be divested as a separate legal entity and comprises RBS England and Wales branch-based businesses, along
with certain small and medium enterprises and corporate activities across the UK. During the period presented W&G has not operated as a separate legal entity.
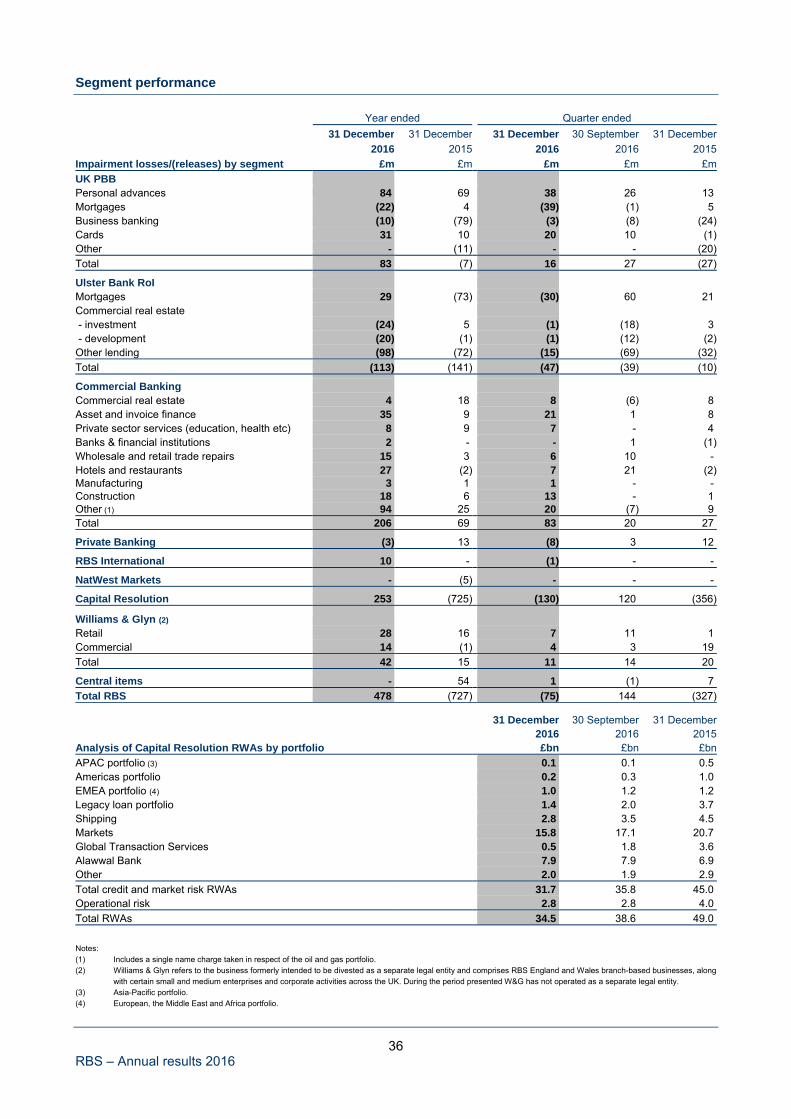
36 RBS – Annual results 2016
Segment performance
Year ended Quarter ended
31 December 31 December 31 December 30 September 31 December
2016 2015 2016 2016 2015
Impairment losses/(releases) by segment £m £m £m £m £m
UK PBB Personal advances 84 69 38 26 13 Mortgages (22) 4 (39) (1) 5 Business banking (10) (79) (3) (8) (24)Cards 31 10 20 10 (1)Other - (11) - - (20)
Total 83 (7) 16 27 (27)
Ulster Bank RoI Mortgages 29 (73) (30) 60 21 Commercial real estate - investment (24) 5 (1) (18) 3 - development (20) (1) (1) (12) (2)Other lending (98) (72) (15) (69) (32)
Total (113) (141) (47) (39) (10)
Commercial Banking Commercial real estate 4 18 8 (6) 8 Asset and invoice finance 35 9 21 1 8 Private sector services (education, health etc) 8 9 7 - 4 Banks & financial institutions 2 - - 1 (1)Wholesale and retail trade repairs 15 3 6 10 - Hotels and restaurants 27 (2) 7 21 (2)Manufacturing 3 1 1 - - Construction 18 6 13 - 1 Other (1) 94 25 20 (7) 9 Total 206 69 83 20 27
Private Banking (3) 13 (8) 3 12
RBS International 10 - (1) - -
NatWest Markets - (5) - - -
Capital Resolution 253 (725) (130) 120 (356)
Williams & Glyn (2) Retail 28 16 7 11 1 Commercial 14 (1) 4 3 19
Total 42 15 11 14 20
Central items - 54 1 (1) 7
Total RBS 478 (727) (75) 144 (327)
31 December 30 September 31 December 2016 2016 2015Analysis of Capital Resolution RWAs by portfolio £bn £bn £bn
APAC portfolio (3) 0.1 0.1 0.5 Americas portfolio 0.2 0.3 1.0 EMEA portfolio (4) 1.0 1.2 1.2 Legacy loan portfolio 1.4 2.0 3.7 Shipping 2.8 3.5 4.5 Markets 15.8 17.1 20.7 Global Transaction Services 0.5 1.8 3.6 Alawwal Bank 7.9 7.9 6.9 Other 2.0 1.9 2.9
Total credit and market risk RWAs 31.7 35.8 45.0 Operational risk 2.8 2.8 4.0
Total RWAs 34.5 38.6 49.0
Notes: (1) Includes a single name charge taken in respect of the oil and gas portfolio. (2) Williams & Glyn refers to the business formerly intended to be divested as a separate legal entity and comprises RBS England and Wales branch-based businesses, along
with certain small and medium enterprises and corporate activities across the UK. During the period presented W&G has not operated as a separate legal entity. (3) Asia-Pacific portfolio. (4) European, the Middle East and Africa portfolio.
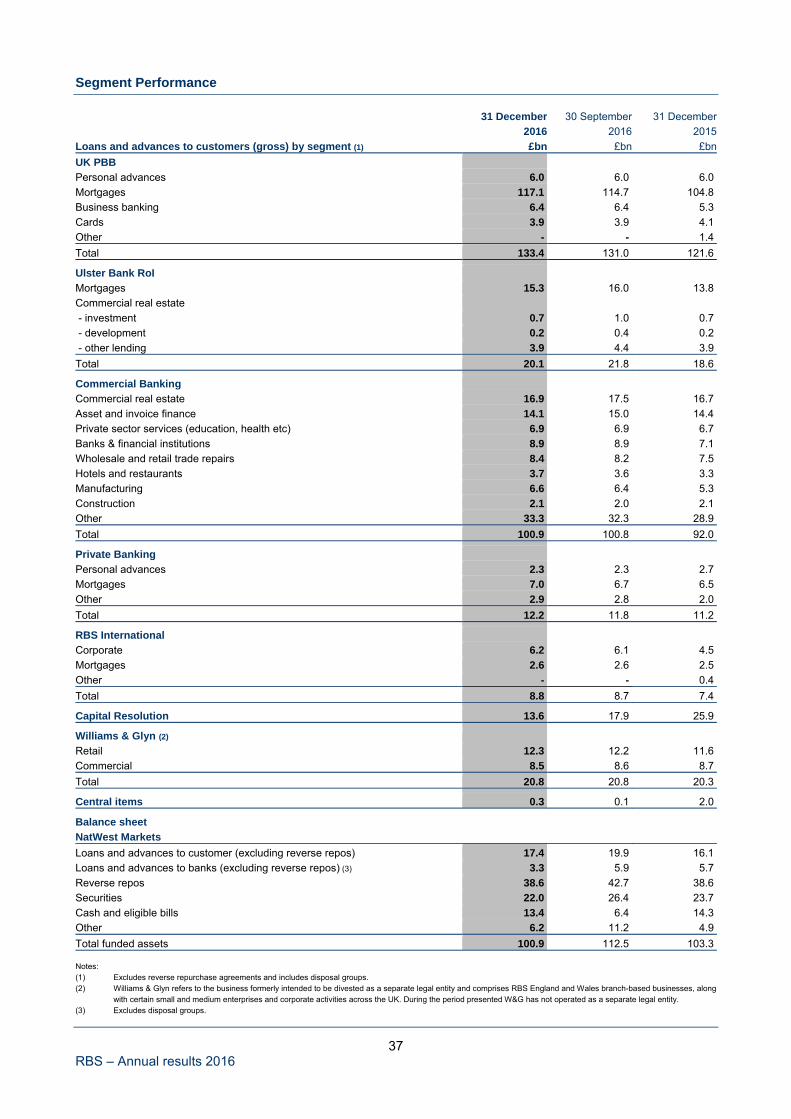
37 RBS – Annual results 2016
Segment Performance 31 December 30 September 31 December
2016 2016 2015
Loans and advances to customers (gross) by segment (1) £bn £bn £bn
UK PBB
Personal advances 6.0 6.0 6.0
Mortgages 117.1 114.7 104.8
Business banking 6.4 6.4 5.3
Cards 3.9 3.9 4.1
Other - - 1.4
Total 133.4 131.0 121.6
Ulster Bank RoI
Mortgages 15.3 16.0 13.8
Commercial real estate
- investment 0.7 1.0 0.7
- development 0.2 0.4 0.2
- other lending 3.9 4.4 3.9
Total 20.1 21.8 18.6
Commercial Banking
Commercial real estate 16.9 17.5 16.7
Asset and invoice finance 14.1 15.0 14.4
Private sector services (education, health etc) 6.9 6.9 6.7
Banks & financial institutions 8.9 8.9 7.1
Wholesale and retail trade repairs 8.4 8.2 7.5
Hotels and restaurants 3.7 3.6 3.3
Manufacturing 6.6 6.4 5.3
Construction 2.1 2.0 2.1
Other 33.3 32.3 28.9
Total 100.9 100.8 92.0
Private Banking
Personal advances 2.3 2.3 2.7
Mortgages 7.0 6.7 6.5
Other 2.9 2.8 2.0
Total 12.2 11.8 11.2
RBS International
Corporate 6.2 6.1 4.5
Mortgages 2.6 2.6 2.5
Other - - 0.4
Total 8.8 8.7 7.4
Capital Resolution 13.6 17.9 25.9
Williams & Glyn (2)
Retail 12.3 12.2 11.6
Commercial 8.5 8.6 8.7
Total 20.8 20.8 20.3
Central items 0.3 0.1 2.0
Balance sheet NatWest Markets
Loans and advances to customer (excluding reverse repos) 17.4 19.9 16.1
Loans and advances to banks (excluding reverse repos) (3) 3.3 5.9 5.7
Reverse repos 38.6 42.7 38.6
Securities 22.0 26.4 23.7
Cash and eligible bills 13.4 6.4 14.3
Other 6.2 11.2 4.9
Total funded assets 100.9 112.5 103.3 Notes: (1) Excludes reverse repurchase agreements and includes disposal groups. (2) Williams & Glyn refers to the business formerly intended to be divested as a separate legal entity and comprises RBS England and Wales branch-based businesses, along
with certain small and medium enterprises and corporate activities across the UK. During the period presented W&G has not operated as a separate legal entity. (3) Excludes disposal groups.
38 RBS – Annual results 2016
Segment performance
UK Personal & Business Banking
2016 compared with 2015 ● Operating profit was £1,381 million, compared with £1,030 million in 2015, and included a £634 million
litigation and conduct charge, principally in respect of additional PPI provisions. Adjusted operating profit of £2,202 million was £33 million, or 2%, higher than 2015 principally reflecting increased netinterest income combined with lower costs, partially offset by a higher impairment charge.
● Total income of £5,290 million increased by £90 million, or 2%, compared with 2015, despite the lowerrate environment depressing earnings on current accounts and the impact of regulatory changesimpacting interchange fees. Net interest income was robust, increasing by £135 million, or 3%,reflecting continued strong asset growth combined with the active repricing of our deposit book. Thismore than offset the impact of lower current account hedge returns and lower mortgage margins. Net interest margin declined by 17 basis points to 3.01% reflecting the change in the overall portfolio mixand reduced mortgage margins. During the second half of 2016 mortgage SVR balances stabilised atapproximately 12%, broadly in line with historical levels.
● Non-interest income reduced by £45 million, or 4%, principally reflecting lower credit card interchange fees, following regulatory changes introduced in 2015. In addition, cash back payments on the Rewardaccount have impacted fee income, however, we have seen increased levels of customerengagement. Partially offsetting, we recognised a £19 million debt sale gain in 2016.
● Adjusted operating expenses decreased by £33 million, or 1%, to £3,005 million. Direct staff costs were £111 million, or 14%, lower driven by an 18% reduction in headcount reflecting the continued movement to digital channels, exiting of business lines with returns below required levels and somecentralisation of administrative activities. This was partially offset by additional investment costs of £102 million, including one-off intangible asset write-downs of £56 million in 2016, together with a £21million increase in regulatory charges.
● The net impairment charge of £83 million reflects continued benign credit conditions and compared with a £7 million release in 2015, with the increase principally reflecting reduced portfolio provisionreleases. The default driven charge was 13% lower than 2015 with REIL 26% lower and provisioncoverage remaining strong at 65%.
● Net loans and advances of £132.1 billion increased by £12.3 billion, or 10%, compared with 2015principally driven by mortgage growth of 12%. We continue to see positive momentum across business and personal unsecured lending, up by 6%, excluding transfers(1), and 7% respectively.
● We continue to build on our strong mortgage market position with gross balances increasing by 12% to£117.1 billion compared with 3% growth for the overall mortgage market. Gross new lending in 2016was £29.8 billion, representing a market share of approximately 12% compared with a stock share ofapproximately 8.8% at 31 December 2016, up from 8.2% in 2015. New business margins were stableover 2016 whilst margins on existing customers remortgaging have improved. Gross new business lending to small and medium-sized enterprises of £1.6 billion was up 43% compared with 2015. Personal loan gross new lending of £2.3 billion was up 24% supported by the launch of functionality for a customer to apply via the mobile app combined with improvements to customer experience. We have continued to take a cautionary risk approach to personal unsecured lending. As a result, personalunsecured cards and overdrafts balances have decreased by £0.3 billion, or 5%, compared with 2015,and margins have widened.
Note: (1) The business transfers included: net loans and advances to customers of £0.8 billion as at 31 December 2016.
39 RBS – Annual results 2016
Segment performance
● Deposit balances performed strongly, increasing by £8.0 billion, or 6%, to £145.8 billion driven by 13%growth in personal current account balances. Personal savings balances increased 3% despite re-pricing activity.
● RWAs decreased by £0.6 billion, or 2%, to £32.7 billion due to asset mix benefits and overall improved credit quality, largely reflecting the current benign credit conditions, partly offset by increased lending.
Q4 2016 compared with Q3 2016 ● Operating profit decreased by £286 million to £281 million. Adjusted operating profit of £546 million
was £45 million lower than Q3 2016 primarily reflecting £35 million of intangible asset write downs and the annual UK bank levy charge of £34 million.
● Income was broadly stable in the quarter. Net interest income continued to build momentum,increasing by £8 million driven by further strong lending growth across mortgages, business lendingand personal loans, with NIM broadly stable at 2.94%. As mortgage SVR balances and margins beginto stabilise, we have seen mortgage income growth for the fourth consecutive quarter. Non interest income declined by £5 million, or 2%, reflecting lower seasonal credit card interchange fees andincreased Reward cash-back payments, partially offset by a £15 million gain following the re-commencement of debt sales in our non-performing loans book.
● Adjusted operating expenses increased £59 million, or 8%, principally due to intangible asset write downs of £35 million and the annual UK bank levy charge of £34 million. Excluding these items, adjusted operating expenses reduced by £10 million, or 1%, due to further improvements in digital andprocess automation delivering lower headcount and staff costs.
● Net loans and advances grew by £2.5 billion to £132.1 billion with gross mortgage balances up £2.4billion.
● Deposits grew by £2.1 billion to £145.8 billion driven by strong growth in current account balances, £1.4 billion.
Q4 2016 compared with Q4 2015 ● Operating profit increased by £571 million to £281 million, predominantly driven by lower litigation and
conduct charges. Adjusted operating profit increased by £142 million to £546 million reflecting an £85million increase in income and a £100 million reduction in adjusted operating expenses partially offsetby a £43 million increase in impairments.
● Total income increased by £85 million, or 7%, to £1,339 million. Net interest income increased by £63 million, or 6%, to £1,093 million reflecting mortgage volume growth, partially offset by a 9 basis pointreduction in net interest margin to 2.94%.
● Adjusted operating expenses reduced by £100 million, or 11%, primarily driven by lower headcount. ● A net impairment loss of £16 million compared with a £27 million release in Q4 2015.
40 RBS – Annual results 2016
Segment performance
Ulster Bank RoI 2016 compared with 2015 ● Operating profit decreased by €338 million to €24 million compared with 2015 primarily due to an
increase in litigation and conduct costs of €229 million and a €56 million reduction in net impairmentreleases. Adjusted operating profit of €280 million was €85 million, or 23%, lower than prior year as areduction in adjusted operating expenses was more than offset by the non recurrence of one-off income benefits in 2015 and lower impairment releases.
● Net interest income was stable year on year. Net interest margin increased by 5 basis points to 1.62%,compared with 2015, driven by a continued reduction in the cost of deposits and a reduced volume oflow yielding liquid assets, partly offset by reduced income on free funds.
● Non interest income decreased by €52 million, or 20%, principally reflecting a one-off €33 million gain realised on the closure of a foreign exchange exposure in 2015 and a €13 million interim adjustment to the pricing of FX transactions between Ulster Bank RoI and NatWest Markets in 2016, pending completion of a detailed pricing review.
● Adjusted operating expenses reduced by €28 million, or 5%, to €559 million reflecting a combination ofprogress made on cost saving initiatives, the non recurrence of one off costs in 2015 and one offaccrual releases in 2016.
● A realignment of costs within direct expenses contributed to an increase in staff costs in 2016 with anoffsetting reduction in other costs. This reflects the reallocation of 660 staff from UK PBB to align withcurrent management responsibilities following the separation of the Northern Ireland and Republic ofIreland businesses. Excluding the reallocation from UK PBB and staff supporting the tracker mortgageexamination and asset disposal programmes, headcount decreased by 9% year on year.
● Litigation and conduct costs of €211 million principally reflects a provision for remediation andprogramme costs associated with an industry wide examination of tracker mortgages. Restructuring costs increased by €27 million to €48 million, primarily driven by costs associated with asset disposalactivity.
● A net impairment release of €138 million comprised write-backs associated with asset disposals and benefited from improved macroeconomic conditions.
● The sale of a portfolio of loans contributed to a €0.6 billion, or 13%, reduction in risk elements inlending in 2016 to €4.1 billion. This was partially offset by a widening of the definition of loans whichare considered to be impaired to include multiple forbearance arrangements and probationarymortgages. The provision coverage ratio reduced from 55% in 2015 to 34% in 2016 largely reflecting afurther de-risking of the balance sheet following recent asset sales of largely non-performing loans.
● Whilst gross new lending increased 31% in 2016, net loans and advances to customers decreased€0.6 billion, or 3%, as new lending was offset by asset disposals and repayments. The low yielding tracker mortgage portfolio declined by €1.0 billion, or 9%, to €10.8 billion at 31 December 2016supported by repayments and asset disposals.
● RWAs reduced by €5.3 billion or 20% during 2016 to €21.1 billion driven by the sale of a portfolio ofloans combined with adjustments to the mortgage modelling approach and an improvement in themacro economic environment. RWAs on the tracker mortgage portfolio reduced by €3.3 billion, or 31%, during 2016 to €7.4 billion.
● Loan:deposit ratio decreased 10 percentage points to 117% in 2016 supported by a €1.0 billion growth in deposits and reduced net loans following recent asset sales.
41 RBS – Annual results 2016
Segment performance
Q4 2016 compared with Q3 2016 ● Adjusted operating profit of €44 million was €37 million lower than Q3 2016. Adjusted operating
expenses increased by €31 million driven by an impairment of intangible assets and a reduction in costs recharged to other business segments. In addition, non-interest income reduced by €12 million principally reflecting an interim adjustment to the pricing of FX transactions between Ulster Bank RoIand NatWest Markets pending completion of a detailed pricing review.
● Litigation and conduct costs increased €93 million primarily reflecting a further provision in respect ofremediation and programme costs associated with an industry wide examination of tracker mortgages.
● The recent sale of a portfolio of loans contributed to a €0.5 billion reduction in net loans and advances and a €1.5 billion reduction in risk elements in lending.
● Risk weighted assets decreased by €3.6 billion in the quarter to €21.1 billion largely reflecting the saleof a portfolio of loans combined with enhancements to mortgage models and an improvement in themacro economic environment.
Q4 2016 compared with Q4 2015 ● Adjusted operating profit of €44 million was €28 million higher than Q4 2015 primarily driven by
increased net impairment releases. ● Net interest margin increased by 14 basis points to 1.59% primarily driven by one-off movements in
income recognised on non performing loans in both Q4 2015 and Q4 2016. Commercial Banking 2016 compared with 2015 ● Operating profit was £742 million compared with £1,264 million in 2015 and included a £423 million
litigation and conduct charge, principally relating to a provision in respect of the FCA review of RBS’streatment of SMEs. Adjusted operating profit of £1,273 million was £111 million, or 8%, lower than 2015, mainly reflecting increased impairments, partially offset by increased income.
● Total income increased by £161 million to £3,415 million. Excluding the impact of transfers(1), income increased by £21 million, or 1%, reflecting higher asset and deposit volumes. Net interest margin fellby 12 basis points to 1.76% driven by asset margin pressure in a competitive market and low rateenvironment.
● Adjusted operating expenses of £1,936 million were £135 million higher than 2015. Excluding businesstransfers, adjusted operating expenses increased by £51 million reflecting a £25 million intangible asset write-down and increased investment spend.
● Net impairment losses increased by £137 million to £206 million primarily reflecting a single namecharge taken in respect of the oil and gas portfolio.
● Net loans and advances of £100.1 billion increased by £8.8 billion, or 10%, compared with 2015reflecting increased borrowing across a number of sectors.
● RWAs were £78.5 billion, an increase of £6.2 billion compared with 2015 reflecting asset growth partially offset by reduced RWA intensity.
Note: (1) The business transfers included impact of: total income of £218 million (2015 - £79 million; Q4 2016 - £48 million; Q4 2015 - £51 million; Q3 2016 - £58 million); operating
expenses of £109 million (2015 - £25 million; Q4 2016 - £29 million; Q4 2015 - £19 million; Q3 2016 - £28 million); impairment losses of £50 million (2015 - £1 million recoveries; Q4 2016 - nil; Q4 2015 - nil; Q3 2016 - £7 million recoveries) net loans and advances to customers of £6.2 billion (31 December 2015 - £5.0 billion; 30 September 2016 - £6.7 billion); customer deposits of £0.4 billion (31 December 2015 - nil; 30 September 2016 - £0.6 billion); and RWAs of £9.3 billion (31 December 2015 - £8.4 billion; 30 September 2016 - £7.4 billion).
42 RBS – Annual results 2016
Segment performance
Q4 2016 compared with Q3 2016 ● An operating loss of £225 million compared with an operating profit of £355 million in Q3 2016
reflecting increased litigation and conduct charges. Adjusted operating profit of £228 million was £154million lower than Q3 2016 driven by increased adjusted operating expenses and increased impairments.
● Adjusted operating expenses increased by £109 million principally due to the annual UK bank levy charge, £90 million.
● Net impairment losses of £83 million increased by £63 million compared with Q3 2016 largely reflecting single name charges in the quarter.
● Net loans and advances continued to grow in the quarter, up £0.3 billion, similar to the growth achieved in Q3 2016, but at a slower rate than in H1 2016.
Q4 2016 compared with Q4 2015 ● An operating loss of £225 million compared with an operating profit of £140 million in Q4 2015
reflecting increased litigation and conduct charges. Adjusted operating profit increased by £42 millionto £228 million driven by higher income and lower adjusted operating expenses.
● Total income increased by £70 million, or 9%, principally reflecting higher asset and deposit volumes,partially offset by asset margin pressure.
● Adjusted operating expenses reduced by £28 million reflecting cost efficiencies and a lower bank levy.
Private Banking
2016 compared with 2015 ● An operating profit of £111 million compared with an operating loss of £470 million in 2015 which
included a goodwill impairment of £498 million. Adjusted operating profit of £149 million was £36million, or 32%, higher than 2015 reflecting increased income, lower adjusted operating expenses andlower impairments.
● Total income increased by £13 million to £657 million primarily reflecting higher asset volumes. Net interest margin fell by 9 basis points to 2.66% reflecting asset margin pressures.
● Adjusted operating expenses of £511 million were £7 million, or 1%, lower than 2015 driven by reductions in the direct cost base, with employee numbers down 10%, partially offset by increasedinfrastructure costs absorbed following the sale of the international business.
● Net loans and advances of £12.2 billion increased by £1.0 billion compared with 2015 driven bymortgages. Assets under management of £17.0 billion were £3.1 billion higher compared with 2015reflecting underlying growth and equity index inflation. In addition, investment cash balances wereincluded in assets under management for the first time in Q3 2016, excluding this, growth was £2.0billion.
Q4 2016 compared with Q3 2016 ● Operating profit decreased by £40 million to £10 million. Adjusted operating profit of £23 million was
£30 million lower than Q3 2016 driven by increased adjusted operating expenses partially offset by anet impairment release in Q4 2016.
● Adjusted operating expenses increased by £37 million due to the annual UK bank levy charge, £19 million, and a £13 million VAT recovery in Q3 2016.
● Net loans and advances increased by £0.4 billion to £12.2 billion due to increased mortgage lending.Assets under management increased by £0.5 billion to £17.0 billion driven by market movements.
43 RBS – Annual results 2016
Segment performance
Q4 2016 compared with Q4 2015 ● An operating profit of £10 million compared with an operating loss of £516 million in Q4 2015 which
included a goodwill impairment of £498 million. An adjusted operating profit of £23 million compared with a loss of £13 million in Q4 2015 reflecting lower adjusted operating expenses and a netimpairment release in Q4 2016.
● Income increased by £3 million, or 2%, principally reflecting higher asset volumes, partially offset byasset margin pressure.
● Adjusted operating expenses reduced by £13 million, or 8%, reflecting cost efficiencies, with headcount down 10%.
RBS International 2016 compared with 2015 ● Operating profit decreased by £17 million to £190 million principally reflecting increased impairment
losses and operating expenses. Adjusted operating profit of £195 million was £16 million lower than2015.
● Total income increased by £7 million to £374 million primarily reflecting higher asset volumes. Net interest margin fell by 12 basis points to 1.36% reflecting asset margin pressures.
● Adjusted operating expenses of £169 million were £13 million, or 8%, higher than 2015, reflecting a number of one-off charges.
● A net impairment loss of £10 million was reported in 2016.
● Net loans and advances of £8.8 billion increased by £1.5 billion compared with 2015 reflecting balancedraw-downs in the corporate lending portfolio, mainly within the Funds sector.
● Customer deposits of £25.2 billion grew by £3.9 billion compared with 2015 principally reflecting the transfer of the Luxembourg branch into RBSI from Capital Resolution during Q2 2016.
● RWAs were £9.5 billion, an increase of £1.2 billion compared with 2015 reflecting asset growth.
Q4 2016 compared with Q3 2016 ● Operating profit decreased by £21 million to £33 million. Adjusted operating profit of £36 million was
£17 million lower than Q3 2016 primarily driven by increased adjusted operating expenses. ● Adjusted operating expenses increased by £21 million, or 53%, principally due to the annual UK bank
levy charge, £19 million. ● Net loans and advances were broadly stable compared with Q3 2016.
Q4 2016 compared with Q4 2015 ● Operating profit decreased by £22 million to £33 million. Adjusted operating profit decreased by £18
million to £36 million primarily driven by increased adjusted expenses. ● Adjusted operating expenses increased by £20 million, or 49%, reflecting an increased bank levy and
a number of one-off charges.
44 RBS – Annual results 2016
Segment performance
NatWest Markets
2016 compared with 2015 ● An operating loss of £386 million compared with an operating loss of £837 million in 2015 and included
litigation and conduct costs of £528 million. The adjusted operating profit was £201 million compared with a loss of £55 million in 2015. The increase was driven by lower adjusted operating expenses andincreased income.
● Total income increased by £47 million to £1,574 million. Excluding the impact of transfers(1), adjusted income increased by £212 million, or 16%, to £1,521 million. The increase was driven by Rates and Currencies, reflecting sustained customer activity throughout the year and favourable market conditions following the EU referendum and subsequent central bank actions.
● Operating expenses decreased from £2,369 million to £1,960 million in 2016, driven by lowerrestructuring costs and lower adjusted expenses. Excluding business transfers(1), adjusted expenses reduced by £116 million, or 8%, reflecting c.£250 million of cost reductions partially offset by higherinvestment spend.
● NatWest Markets are currently in the middle of a substantial investment programme which will equipthe franchise for new regulatory requirements and provide opportunity to reduce back office support costs. We expect that NatWest Markets adjusted operating expenses will reduce by around £500million over the next four years.
● Funded assets decreased by £2.4 billion compared with 2015 to £100.9 billion, as the business continues to work through re-shaping, despite the headwind from foreign exchange movementsfollowing the EU referendum and the substantial weakening of sterling.
● RWAs increased by £2.1 billion compared with 2015 to £35.2 billion principally due to businessmovements and the impact of the weakening of sterling.
Q4 2016 compared with Q3 2016 ● An operating loss of £565 million compared with an operating profit of £90 million in Q3 2016 reflecting
increased litigation and conduct charges. Adjusted operating loss of £24 million compared with an adjusted operating profit of £184 million in Q3 2016 primarily driven by lower income.
● Total income decreased by £186 million to £285 million. Adjusted income reduced by £212 million to £314 million following a particularly strong Q3 2016, which benefitted from sustained customer activityand favourable market conditions following the EU referendum and subsequent central bank actions,in Rates.
● Operating expenses increased by £469 million to £850 million. Adjusted operating expenses reduced by £4 million as lower investment spend, following the elevated Q3 2016 charge, more than offset the annual UK bank levy charge of £13 million.
● Funded assets decreased by £11.6 billion to £100.9 billion in the quarter reflecting seasonally lowlevels of activity at the end of the year.
Q4 2016 compared with Q4 2015 ● An operating loss of £565 million compared with a loss of £245 million in Q4 2015 reflecting increased
litigation and conduct charges. An adjusted operating loss of £24 million compared with a loss of £112million in Q4 2015 reflecting higher income and lower adjusted operating expenses.
● Total income increased by £99 million to £285 million. Adjusted income increased by £62 million, or25%, principally reflecting Currencies driven by heightened levels of customer activity around the USelection.
● Operating expenses increased by £419 million to £850 million. Adjusted expenses decreased by £26 million principally due to lower staff costs and legal expenditure.
Note: (1) NatWest Markets results include the following financials for businesses subsequently transferred to Commercial Banking for 2015: total income of £98 million and
operating expenses of £31 million.
45 RBS – Annual results 2016
Segment performance
Capital Resolution 2016 compared with 2015 ● RWAs decreased by £14.5 billion, or 30%, to £34.5 billion reflecting disposal activity partially offset by
an increase due to the weakening of sterling. Since the end of 2014, RWAs have reduced by £60.6billion, or 64%.
● Funded assets decreased by £25.8 billion to £27.6 billion with the most significant reductions acrossMarkets and GTS.
● An operating loss of £4,870 million compared with a loss of £3,687 million in 2015 and included litigation and conduct costs of £3,413 million. The adjusted operating loss was £1,432 million compared with £412 million in 2015.
● Income disposal losses were £572 million, £205 million higher than 2015, and included £259 million inrespect of the shipping portfolio. In addition, a funding valuation adjustment charge of £170 million was incurred in 2016.
● Operating expenses decreased from £4,951 million to £4,255 million in 2016 principally driven by loweradjusted operating expenses and lower restructuring costs. Adjusted expenses decreased by £775million, or 50%, to £764 million, principally reflecting a 1,000 reduction in headcount.
● A net impairment loss of £253 million compared with a net impairment release of £725 million in 2015and principally comprised charges relating to a number of shipping assets (£424 million).
Q4 2016 compared with Q3 2016 ● RWAs decreased by £4.1 billion to £34.5 billion reflecting disposal activity partially offset by an
increase due to the weakening of sterling. ● Funded assets decreased by £7.3 billion to £27.6 billion with the most significant reductions across
Markets and GTS. ● An operating loss of £3,503 million compared with an operating loss of £454 million in Q3 2016 and
included litigation and conduct costs of £3,156 million. The adjusted operating loss was £331 million compared with £118 million in Q3 2016, with the increase primarily reflecting increased disposallosses.
● Adjusted expenses increased by £3 million to £176 million and included the annual UK bank levycharge of £22 million.
Q4 2016 compared with Q4 2015 ● An operating loss of £3,503 million compared with an operating loss of £1,902 million in Q4 2015 and
included litigation and conduct costs of £3,156 million. The adjusted operating loss was £331 million compared with a loss of £271 million in Q4 2015.
● Adjusted expenses decreased by £218 million, or 55%, to £176 million principally reflecting a 1,000reduction in headcount.
46 RBS – Annual results 2016
Segment performance
Williams & Glyn 2016 compared with 2015 ● An operating profit of £345 million compared with £431 million in 2015. Adjusted operating profit of
£402 million was £57 million lower than 2015 reflecting higher adjusted operating expenses andincreased impairments.
● Total income increased by £4 million to £837 million as the benefit of increased volumes was mainly offset by margin pressure from the impact of the competitive lending environment and a furtherreduction in interest rates. Net interest margin reduced by 16 basis points to 2.71%.
● Operating expenses of £450 million increased by £63 million, or 16%, and included a £29 millionincrease in restructuring costs. Adjusted operating expenses increased by £34 million, or 9%, to £393million reflecting activity undertaken in H1 to create a standalone bank, partially offset by the benefit ofthe commercial business restructuring which was announced in Q4 2015. Following the announcementto discontinue the programme to create a cloned banking platform, a further restructuring programmecommenced in Q4 2016 resulting in an additional reduction in headcount.
● Net impairment losses remained low at £42 million compared with a loss of £15 million in 2015. The2015 charge benefited from a number of releases, totalling £28 million, in the commercial business.
● Net loans and advances increased by £0.6 billion, or 3%, to £20.6 billion principally reflecting growth in mortgages of £0.4 billion, or 4%.
● Customer deposits were broadly stable at £24.2 billion, a £1.2 billion increase in retail deposits wasoffset by a £1.1 billion reduction in commercial deposits.
Q4 2016 compared with Q3 2016 ● Operating profit increased by £25 million to £109 million driven by a £14 million reduction in operating
expenses and a £8 million increase in income. ● Total income increased by £8 million to £217 million driven by an improvement in net interest margin
with volumes remaining stable. ● Adjusted operating expenses reduced by £2 million to £97 million reflecting the restructuring activities
following the announcement to discontinue the programme to create a cloned banking platform. Operating expenses reduced by £14 million principally due to there being no restructuring costsincurred in Q4 2016 compared with £12 million in Q3 2016.
Q4 2016 compared with Q4 2015 ● Operating profit increased by £56 million to £109 million reflecting a £10 million reduction in adjusted
operating expenses, a £9 million reduction in impairments and a £9 million increase in income drivenby increased volumes. In addition, operating expenses in Q4 2015 included a restructuring charge of £28 million in commercial banking.
47 RBS – Annual results 2016
Segment performance
Central items 2016 compared with 2015 ● Central items not allocated represented a charge of £1,615 million in 2016, compared with a £903
million charge in 2015, and included restructuring costs of £1,482 million and litigation and conductcosts of £697 million. Restructuring costs included a £750 million provision in respect of the 17February 2017 update on RBS’s remaining State Aid obligation regarding Williams & Glyn. Treasury funding costs were a charge of £94 million, compared with a gain of £169 million in 2015, and includeda £510 million charge for volatile items under IFRS, due to reductions in long term interest rates, and a£349 million foreign exchange gain, principally associated with the weakening of sterling against theUS dollar. In addition, there was a £126 million loss on redemption of own debt in 2016. These werepartially offset by a VAT recovery of £227 million and a £246 million gain on the sale of the stake inVISA Europe.
Q4 2016 compared with Q3 2016 ● Central items not allocated represented a charge of £161 million in the quarter, compared with a £545
million charge in Q3 2016, and included restructuring costs of £836 million and a net credit of £192million for litigation and conduct costs. Q4 2016 Treasury funding costs were a gain of £465 million(compared with a charge of £177 million in Q3 2016) and included a £308 million IFRS volatility gainand a foreign exchange gain of £140 million. Partially offsetting this was a £77 million own credit adjustment charge as spreads tightened.
Q4 2016 compared with Q4 2015 ● Central items not allocated represented a charge of £161 million in the quarter, compared with a £264
million charge in Q4 2015, and included restructuring costs of £836 million and a net credit of £192million for litigation and conduct costs. Q4 2016 Treasury funding costs were a gain of £465 million (compared with a gain of £193 million in Q4 2015) which included a £308 million IFRS volatility gain and a foreign exchange gain of £140 million. Partially offsetting this was a £77 million own credit adjustments charge as spreads tightened.
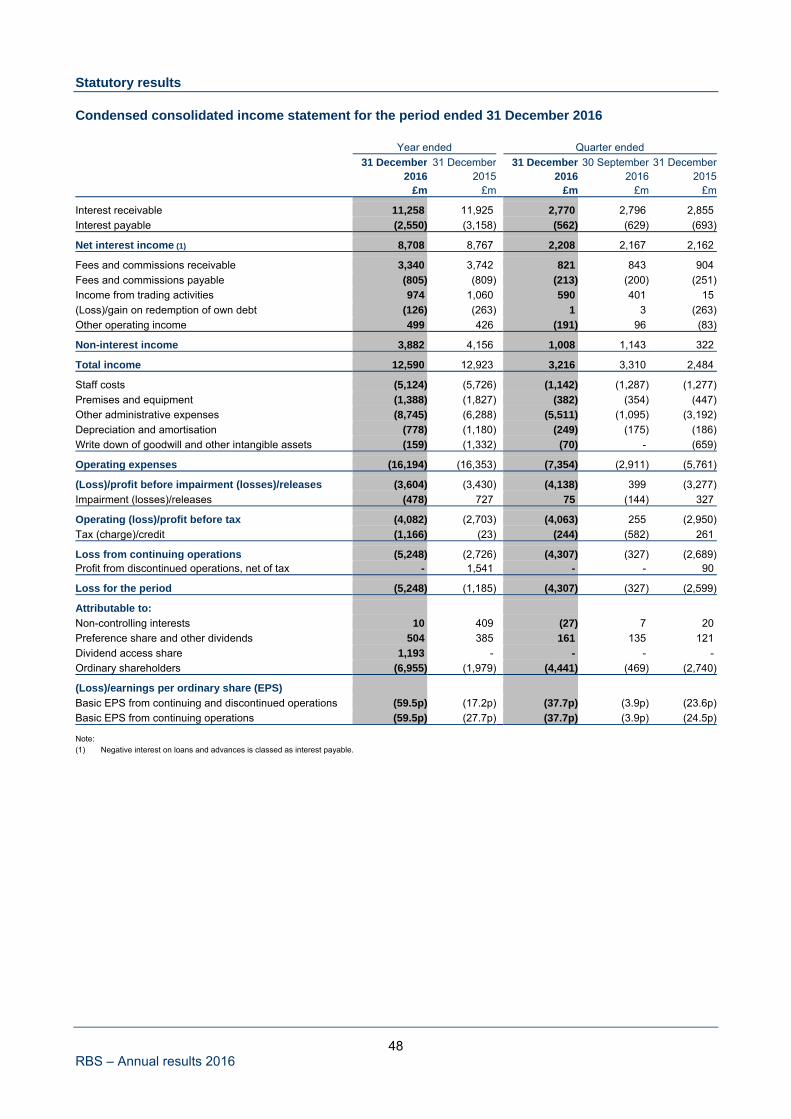
48 RBS – Annual results 2016
Statutory results Condensed consolidated income statement for the period ended 31 December 2016 Year ended Quarter ended 31 December 31 December 31 December 30 September 31 December
2016 2015 2016 2016 2015 £m £m £m £m £m
Interest receivable 11,258 11,925 2,770 2,796 2,855
Interest payable (2,550) (3,158) (562) (629) (693)
Net interest income (1) 8,708 8,767 2,208 2,167 2,162
Fees and commissions receivable 3,340 3,742 821 843 904
Fees and commissions payable (805) (809) (213) (200) (251)
Income from trading activities 974 1,060 590 401 15
(Loss)/gain on redemption of own debt (126) (263) 1 3 (263)
Other operating income 499 426 (191) 96 (83)
Non-interest income 3,882 4,156 1,008 1,143 322
Total income 12,590 12,923 3,216 3,310 2,484
Staff costs (5,124) (5,726) (1,142) (1,287) (1,277)
Premises and equipment (1,388) (1,827) (382) (354) (447)
Other administrative expenses (8,745) (6,288) (5,511) (1,095) (3,192)
Depreciation and amortisation (778) (1,180) (249) (175) (186)
Write down of goodwill and other intangible assets (159) (1,332) (70) - (659)
Operating expenses (16,194) (16,353) (7,354) (2,911) (5,761)
(Loss)/profit before impairment (losses)/releases (3,604) (3,430) (4,138) 399 (3,277)
Impairment (losses)/releases (478) 727 75 (144) 327
Operating (loss)/profit before tax (4,082) (2,703) (4,063) 255 (2,950)
Tax (charge)/credit (1,166) (23) (244) (582) 261
Loss from continuing operations (5,248) (2,726) (4,307) (327) (2,689)Profit from discontinued operations, net of tax - 1,541 - - 90
Loss for the period (5,248) (1,185) (4,307) (327) (2,599)
Attributable to:
Non-controlling interests 10 409 (27) 7 20
Preference share and other dividends 504 385 161 135 121
Dividend access share 1,193 - - - -
Ordinary shareholders (6,955) (1,979) (4,441) (469) (2,740)
(Loss)/earnings per ordinary share (EPS)
Basic EPS from continuing and discontinued operations (59.5p) (17.2p) (37.7p) (3.9p) (23.6p)
Basic EPS from continuing operations (59.5p) (27.7p) (37.7p) (3.9p) (24.5p) Note: (1) Negative interest on loans and advances is classed as interest payable.
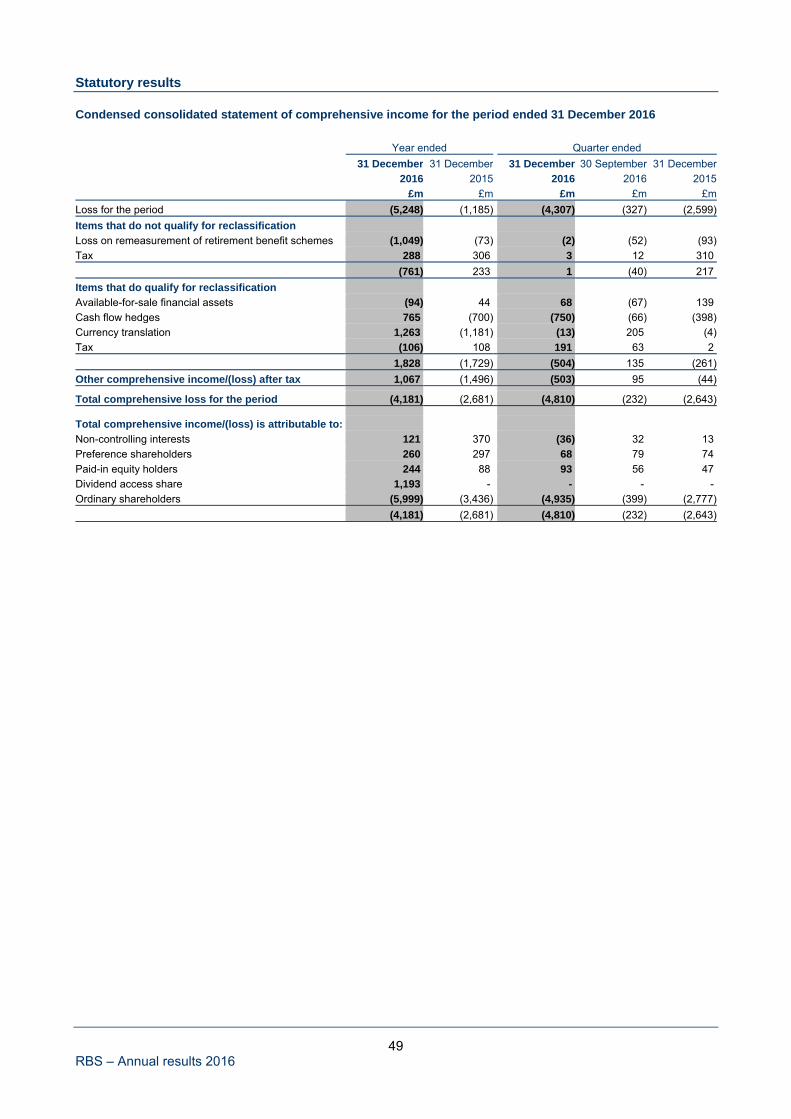
49 RBS – Annual results 2016
Statutory results Condensed consolidated statement of comprehensive income for the period ended 31 December 2016 Year ended Quarter ended 31 December 31 December 31 December 30 September 31 December
2016 2015 2016 2016 2015
£m £m £m £m £m
Loss for the period (5,248) (1,185) (4,307) (327) (2,599)
Items that do not qualify for reclassification
Loss on remeasurement of retirement benefit schemes (1,049) (73) (2) (52) (93)
Tax 288 306 3 12 310
(761) 233 1 (40) 217
Items that do qualify for reclassification
Available-for-sale financial assets (94) 44 68 (67) 139
Cash flow hedges 765 (700) (750) (66) (398)
Currency translation 1,263 (1,181) (13) 205 (4)
Tax (106) 108 191 63 2
1,828 (1,729) (504) 135 (261)
Other comprehensive income/(loss) after tax 1,067 (1,496) (503) 95 (44)
Total comprehensive loss for the period (4,181) (2,681) (4,810) (232) (2,643)
Total comprehensive income/(loss) is attributable to:
Non-controlling interests 121 370 (36) 32 13
Preference shareholders 260 297 68 79 74
Paid-in equity holders 244 88 93 56 47
Dividend access share 1,193 - - - -
Ordinary shareholders (5,999) (3,436) (4,935) (399) (2,777)
(4,181) (2,681) (4,810) (232) (2,643)
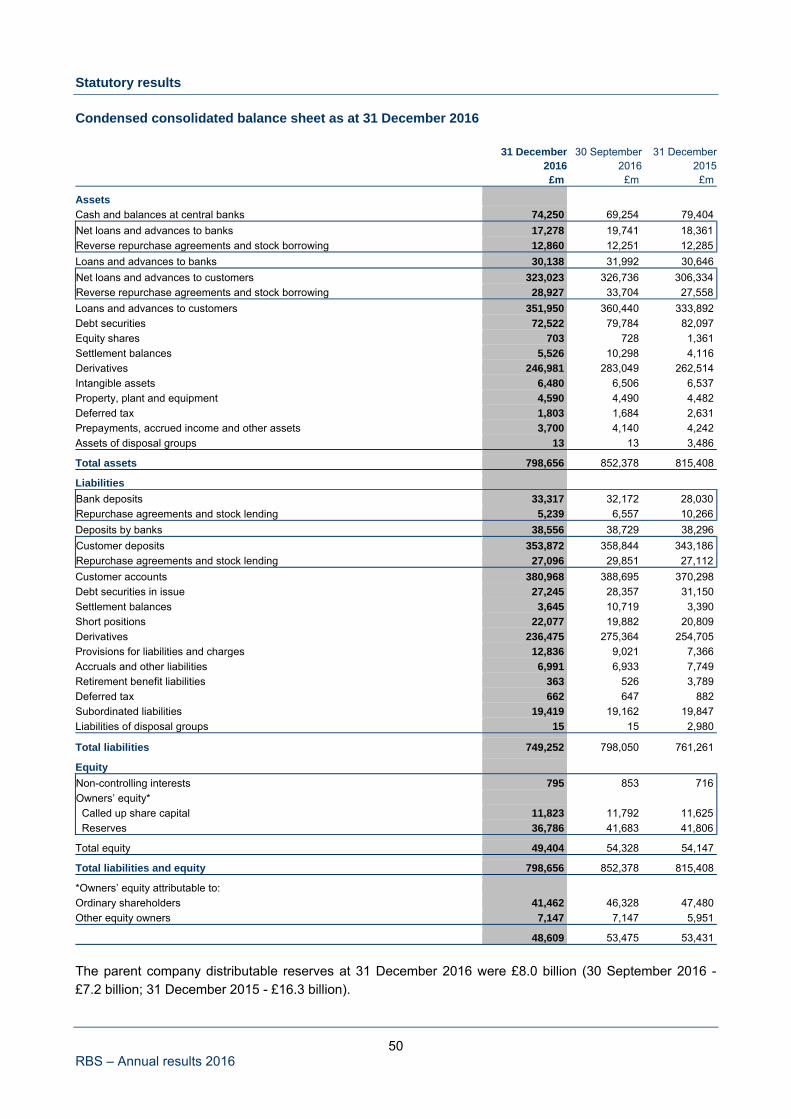
50 RBS – Annual results 2016
Statutory results
Condensed consolidated balance sheet as at 31 December 2016
31 December 30 September 31 December
2016 2016 2015 £m £m £m
Assets
Cash and balances at central banks 74,250 69,254 79,404
Net loans and advances to banks 17,278 19,741 18,361
Reverse repurchase agreements and stock borrowing 12,860 12,251 12,285
Loans and advances to banks 30,138 31,992 30,646
Net loans and advances to customers 323,023 326,736 306,334
Reverse repurchase agreements and stock borrowing 28,927 33,704 27,558
Loans and advances to customers 351,950 360,440 333,892
Debt securities 72,522 79,784 82,097
Equity shares 703 728 1,361
Settlement balances 5,526 10,298 4,116
Derivatives 246,981 283,049 262,514
Intangible assets 6,480 6,506 6,537
Property, plant and equipment 4,590 4,490 4,482
Deferred tax 1,803 1,684 2,631
Prepayments, accrued income and other assets 3,700 4,140 4,242
Assets of disposal groups 13 13 3,486
Total assets 798,656 852,378 815,408
Liabilities
Bank deposits 33,317 32,172 28,030
Repurchase agreements and stock lending 5,239 6,557 10,266
Deposits by banks 38,556 38,729 38,296
Customer deposits 353,872 358,844 343,186
Repurchase agreements and stock lending 27,096 29,851 27,112
Customer accounts 380,968 388,695 370,298
Debt securities in issue 27,245 28,357 31,150
Settlement balances 3,645 10,719 3,390
Short positions 22,077 19,882 20,809
Derivatives 236,475 275,364 254,705
Provisions for liabilities and charges 12,836 9,021 7,366
Accruals and other liabilities 6,991 6,933 7,749
Retirement benefit liabilities 363 526 3,789
Deferred tax 662 647 882
Subordinated liabilities 19,419 19,162 19,847
Liabilities of disposal groups 15 15 2,980
Total liabilities 749,252 798,050 761,261
Equity
Non-controlling interests 795 853 716
Owners’ equity*
Called up share capital 11,823 11,792 11,625
Reserves 36,786 41,683 41,806
Total equity 49,404 54,328 54,147
Total liabilities and equity 798,656 852,378 815,408
*Owners’ equity attributable to:
Ordinary shareholders 41,462 46,328 47,480
Other equity owners 7,147 7,147 5,951
48,609 53,475 53,431
The parent company distributable reserves at 31 December 2016 were £8.0 billion (30 September 2016 - £7.2 billion; 31 December 2015 - £16.3 billion).
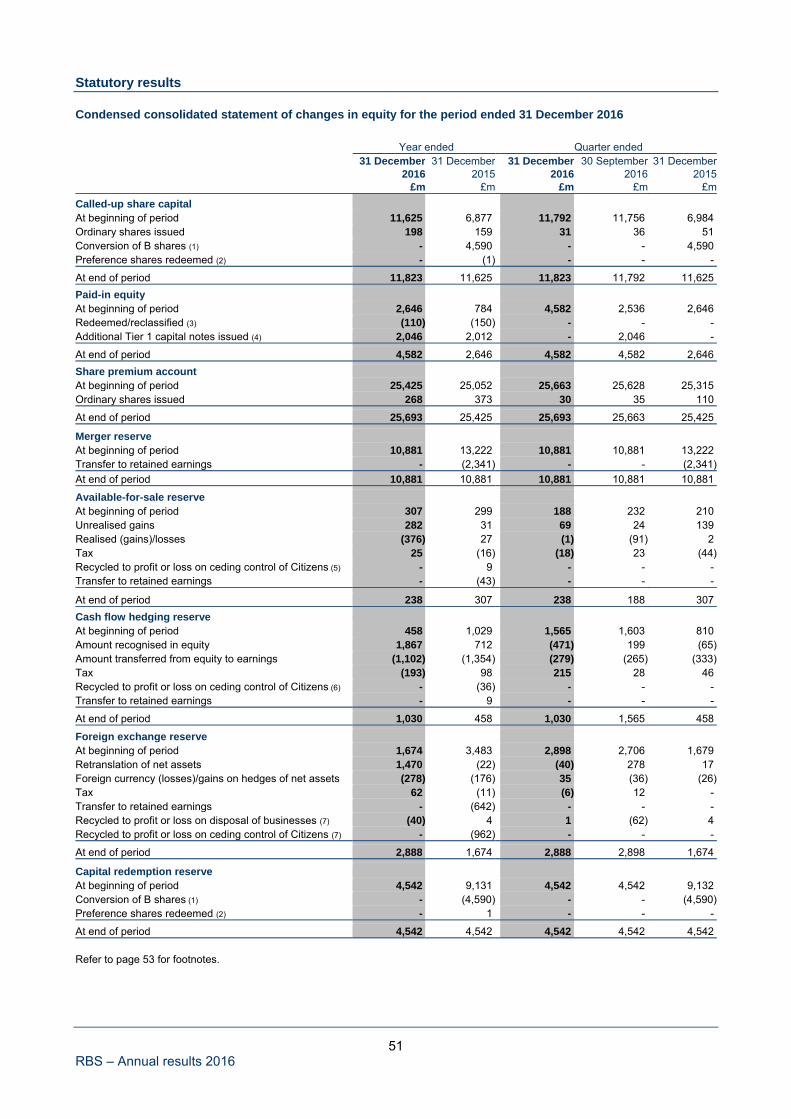
51 RBS – Annual results 2016
Statutory results Condensed consolidated statement of changes in equity for the period ended 31 December 2016 Year ended Quarter ended
31 December 31 December 31 December 30 September 31 December2016 2015 2016 2016 2015
£m £m £m £m £m
Called-up share capital At beginning of period 11,625 6,877 11,792 11,756 6,984 Ordinary shares issued 198 159 31 36 51 Conversion of B shares (1) - 4,590 - - 4,590 Preference shares redeemed (2) - (1) - - -
At end of period 11,823 11,625 11,823 11,792 11,625
Paid-in equity At beginning of period 2,646 784 4,582 2,536 2,646 Redeemed/reclassified (3) (110) (150) - - - Additional Tier 1 capital notes issued (4) 2,046 2,012 - 2,046 -
At end of period 4,582 2,646 4,582 4,582 2,646
Share premium account At beginning of period 25,425 25,052 25,663 25,628 25,315 Ordinary shares issued 268 373 30 35 110
At end of period 25,693 25,425 25,693 25,663 25,425
Merger reserve At beginning of period 10,881 13,222 10,881 10,881 13,222 Transfer to retained earnings - (2,341) - - (2,341)
At end of period 10,881 10,881 10,881 10,881 10,881
Available-for-sale reserve At beginning of period 307 299 188 232 210 Unrealised gains 282 31 69 24 139 Realised (gains)/losses (376) 27 (1) (91) 2 Tax 25 (16) (18) 23 (44)Recycled to profit or loss on ceding control of Citizens (5) - 9 - - - Transfer to retained earnings - (43) - - -
At end of period 238 307 238 188 307
Cash flow hedging reserve At beginning of period 458 1,029 1,565 1,603 810 Amount recognised in equity 1,867 712 (471) 199 (65)Amount transferred from equity to earnings (1,102) (1,354) (279) (265) (333)Tax (193) 98 215 28 46 Recycled to profit or loss on ceding control of Citizens (6) - (36) - - - Transfer to retained earnings - 9 - - -
At end of period 1,030 458 1,030 1,565 458
Foreign exchange reserve At beginning of period 1,674 3,483 2,898 2,706 1,679 Retranslation of net assets 1,470 (22) (40) 278 17 Foreign currency (losses)/gains on hedges of net assets (278) (176) 35 (36) (26)Tax 62 (11) (6) 12 - Transfer to retained earnings - (642) - - - Recycled to profit or loss on disposal of businesses (7) (40) 4 1 (62) 4 Recycled to profit or loss on ceding control of Citizens (7) - (962) - - -
At end of period 2,888 1,674 2,888 2,898 1,674
Capital redemption reserve At beginning of period 4,542 9,131 4,542 4,542 9,132 Conversion of B shares (1) - (4,590) - - (4,590)Preference shares redeemed (2) - 1 - - -
At end of period 4,542 4,542 4,542 4,542 4,542 Refer to page 53 for footnotes.
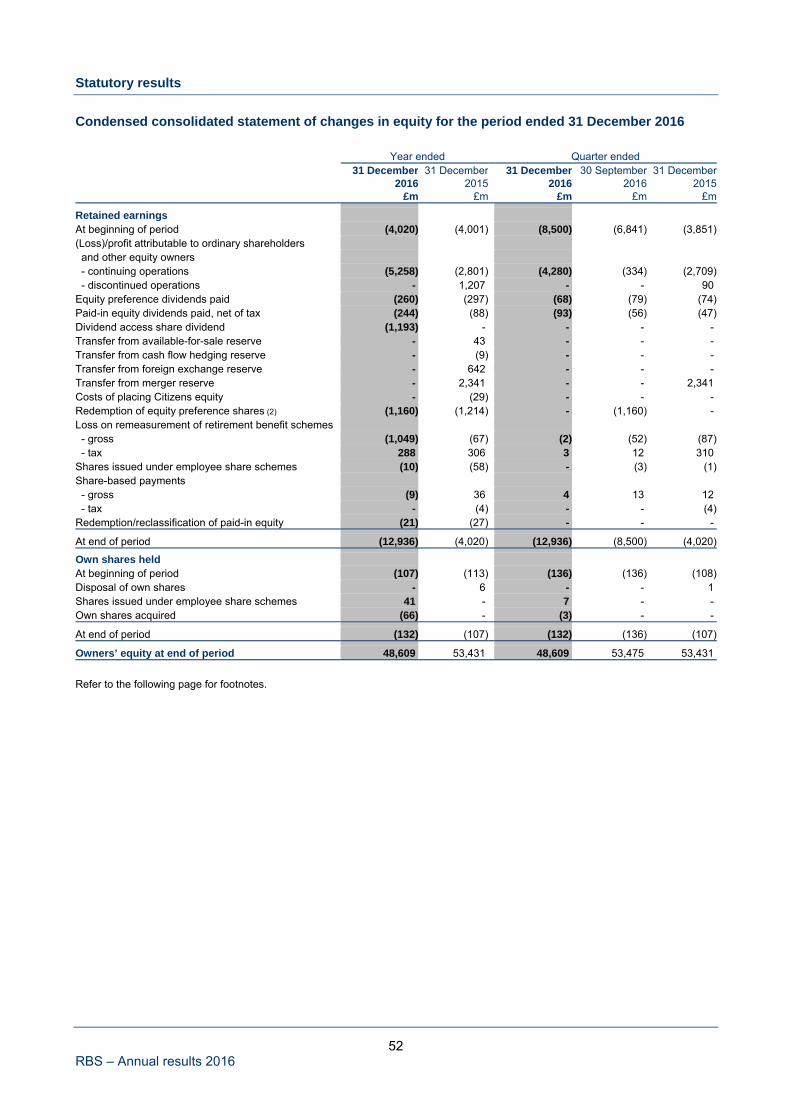
52 RBS – Annual results 2016
Statutory results
Condensed consolidated statement of changes in equity for the period ended 31 December 2016 Year ended Quarter ended
31 December 31 December 31 December 30 September 31 December
2016 2015 2016 2016 2015 £m £m £m £m £m
Retained earnings At beginning of period (4,020) (4,001) (8,500) (6,841) (3,851)(Loss)/profit attributable to ordinary shareholders and other equity owners - continuing operations (5,258) (2,801) (4,280) (334) (2,709) - discontinued operations - 1,207 - - 90 Equity preference dividends paid (260) (297) (68) (79) (74)Paid-in equity dividends paid, net of tax (244) (88) (93) (56) (47)Dividend access share dividend (1,193) - - - - Transfer from available-for-sale reserve - 43 - - - Transfer from cash flow hedging reserve - (9) - - - Transfer from foreign exchange reserve - 642 - - - Transfer from merger reserve - 2,341 - - 2,341 Costs of placing Citizens equity - (29) - - - Redemption of equity preference shares (2) (1,160) (1,214) - (1,160) - Loss on remeasurement of retirement benefit schemes - gross (1,049) (67) (2) (52) (87) - tax 288 306 3 12 310 Shares issued under employee share schemes (10) (58) - (3) (1)Share-based payments - gross (9) 36 4 13 12 - tax - (4) - - (4)Redemption/reclassification of paid-in equity (21) (27) - - -
At end of period (12,936) (4,020) (12,936) (8,500) (4,020)
Own shares held At beginning of period (107) (113) (136) (136) (108)Disposal of own shares - 6 - - 1 Shares issued under employee share schemes 41 - 7 - - Own shares acquired (66) - (3) - -
At end of period (132) (107) (132) (136) (107)
Owners’ equity at end of period 48,609 53,431 48,609 53,475 53,431
Refer to the following page for footnotes.
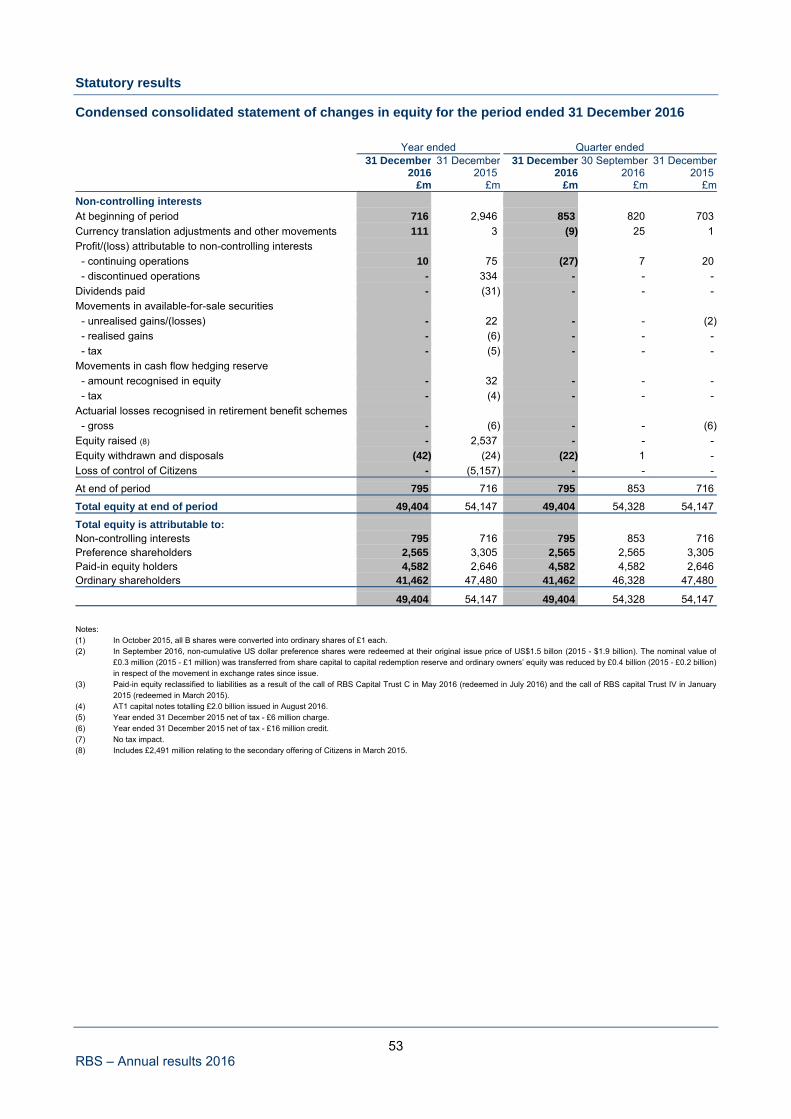
53 RBS – Annual results 2016
Statutory results
Condensed consolidated statement of changes in equity for the period ended 31 December 2016 Year ended Quarter ended 31 December 31 December 31 December 30 September 31 December 2016 2015 2016 2016 2015 £m £m £m £m £m
Non-controlling interests At beginning of period 716 2,946 853 820 703
Currency translation adjustments and other movements 111 3 (9) 25 1
Profit/(loss) attributable to non-controlling interests
- continuing operations 10 75 (27) 7 20
- discontinued operations - 334 - - -
Dividends paid - (31) - - -
Movements in available-for-sale securities
- unrealised gains/(losses) - 22 - - (2)
- realised gains - (6) - - -
- tax - (5) - - -
Movements in cash flow hedging reserve
- amount recognised in equity - 32 - - -
- tax - (4) - - -
Actuarial losses recognised in retirement benefit schemes
- gross - (6) - - (6)
Equity raised (8) - 2,537 - - -
Equity withdrawn and disposals (42) (24) (22) 1 -
Loss of control of Citizens - (5,157) - - -
At end of period 795 716 795 853 716
Total equity at end of period 49,404 54,147 49,404 54,328 54,147
Total equity is attributable to: Non-controlling interests 795 716 795 853 716 Preference shareholders 2,565 3,305 2,565 2,565 3,305 Paid-in equity holders 4,582 2,646 4,582 4,582 2,646 Ordinary shareholders 41,462 47,480 41,462 46,328 47,480
49,404 54,147 49,404 54,328 54,147
Notes: (1) In October 2015, all B shares were converted into ordinary shares of £1 each. (2) In September 2016, non-cumulative US dollar preference shares were redeemed at their original issue price of US$1.5 billon (2015 - $1.9 billion). The nominal value of
£0.3 million (2015 - £1 million) was transferred from share capital to capital redemption reserve and ordinary owners’ equity was reduced by £0.4 billion (2015 - £0.2 billion)in respect of the movement in exchange rates since issue.
(3) Paid-in equity reclassified to liabilities as a result of the call of RBS Capital Trust C in May 2016 (redeemed in July 2016) and the call of RBS capital Trust IV in January2015 (redeemed in March 2015).
(4) AT1 capital notes totalling £2.0 billion issued in August 2016. (5) Year ended 31 December 2015 net of tax - £6 million charge. (6) Year ended 31 December 2015 net of tax - £16 million credit. (7) No tax impact. (8) Includes £2,491 million relating to the secondary offering of Citizens in March 2015.
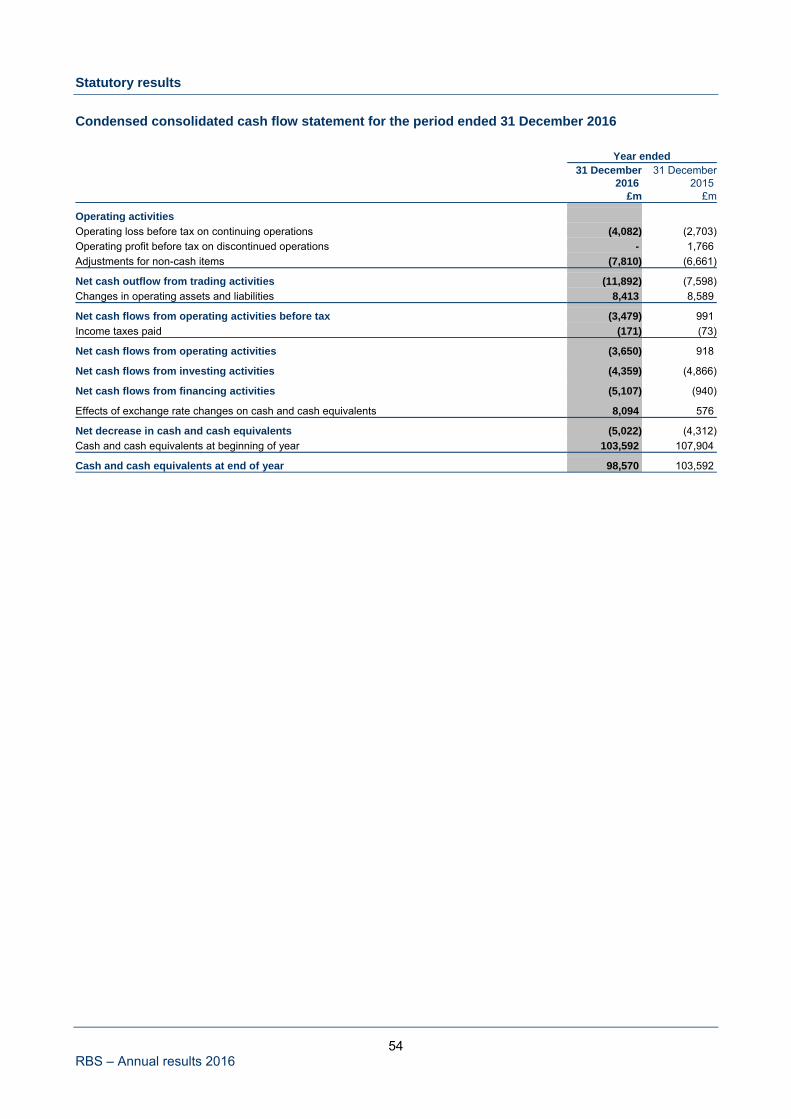
54 RBS – Annual results 2016
Statutory results
Condensed consolidated cash flow statement for the period ended 31 December 2016 Year ended 31 December 31 December 2016 2015 £m £m
Operating activities Operating loss before tax on continuing operations (4,082) (2,703)
Operating profit before tax on discontinued operations - 1,766
Adjustments for non-cash items (7,810) (6,661)
Net cash outflow from trading activities (11,892) (7,598)
Changes in operating assets and liabilities 8,413 8,589
Net cash flows from operating activities before tax (3,479) 991
Income taxes paid (171) (73)
Net cash flows from operating activities (3,650) 918
Net cash flows from investing activities (4,359) (4,866)
Net cash flows from financing activities (5,107) (940)
Effects of exchange rate changes on cash and cash equivalents 8,094 576
Net decrease in cash and cash equivalents (5,022) (4,312)
Cash and cash equivalents at beginning of year 103,592 107,904
Cash and cash equivalents at end of year 98,570 103,592
55 RBS – Annual results 2016
Notes
1. Basis of preparation The condensed consolidated financial statements should be read in conjunction with RBS’s 2016 Annual Report and Accounts which was prepared in accordance with International Financial Reporting Standards (IFRS) issued by the International Accounting Standards Board (IASB) and interpretations issued by the IFRS Interpretations Committee of the IASB as adopted by the European Union (EU) (together IFRS). Accounting policies RBS’s principal accounting policies are set out on pages 297 to 306 of the 2016 Annual Report and Accounts. Amendments to IFRSs effective for 2016 have not had a material effect on RBS’s 2016 results. IFRS 9, Financial Instruments, becomes effective from 1 January 2018. Pages 308 to 313 of the Annual Report and Accounts sets out the expected qualitative affects on RBS. Critical accounting policies and key sources of estimation uncertainty The judgements and assumptions that are considered to be the most important to the portrayal of RBS’s financial condition are those relating to pensions, goodwill, provisions for liabilities, deferred tax, loan impairment provisions and fair value of financial instruments. These critical accounting policies and judgements are described on pages 306 to 308 of RBS’s 2016 Annual Report and Accounts. Going concern Having reviewed RBS’s forecasts, projections and other relevant evidence, the directors have a reasonable expectation that RBS will continue in operational existence for the foreseeable future. Accordingly, the results for the period ended 31 December 2016 have been prepared on a going concern basis. 2. Pensions As at 31 December 2016, the Main scheme had an unrecognised surplus under IAS 19 valuation principles. The surplus is unrecognised because the trustee’s power to enhance member benefits could consume that surplus meaning that RBS does not control its ability to realise an asset. The existence of the asset, albeit unrecognised, limits RBS’s exposure to changes in actuarial assumptions and investment performance. See Note 4 on the 2016 Annual Report and Accounts for further details.
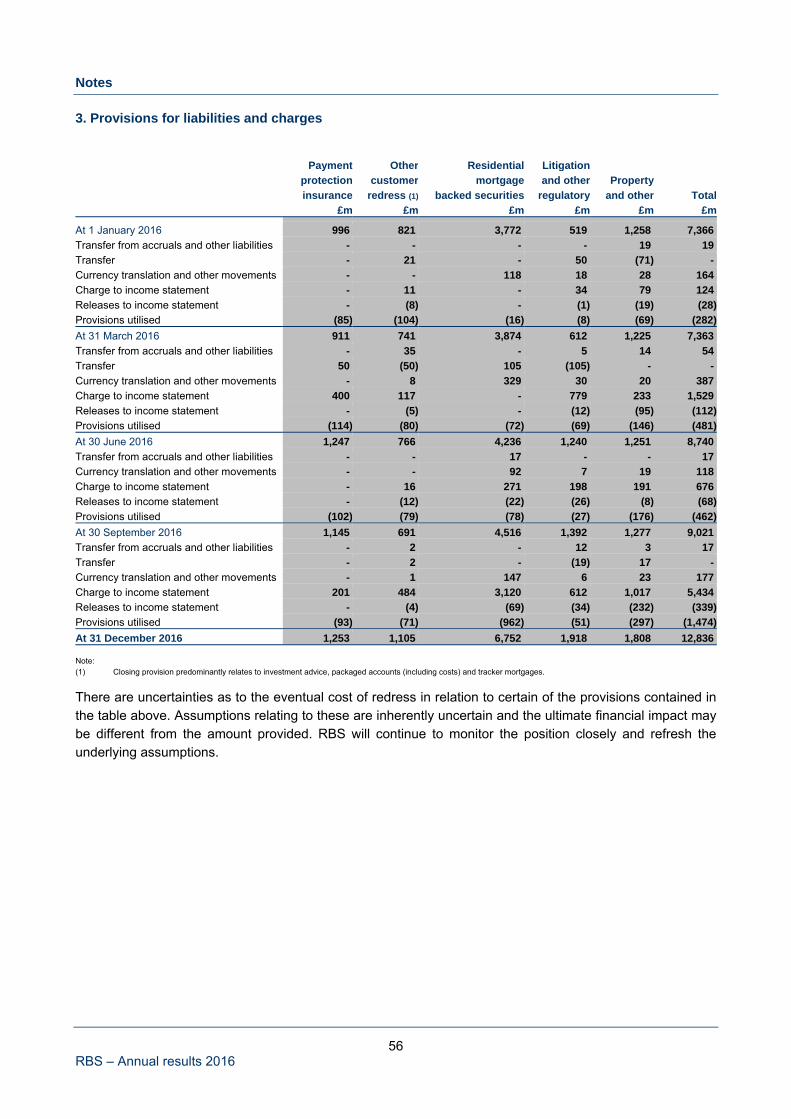
56 RBS – Annual results 2016
Notes
3. Provisions for liabilities and charges
Payment Other Residential Litigation
protection customer mortgage and other Property
insurance redress (1) backed securities regulatory and other Total
£m £m £m £m £m £m
At 1 January 2016 996 821 3,772 519 1,258 7,366
Transfer from accruals and other liabilities - - - - 19 19
Transfer - 21 - 50 (71) -
Currency translation and other movements - - 118 18 28 164
Charge to income statement - 11 - 34 79 124
Releases to income statement - (8) - (1) (19) (28)
Provisions utilised (85) (104) (16) (8) (69) (282)
At 31 March 2016 911 741 3,874 612 1,225 7,363
Transfer from accruals and other liabilities - 35 - 5 14 54
Transfer 50 (50) 105 (105) - -
Currency translation and other movements - 8 329 30 20 387
Charge to income statement 400 117 - 779 233 1,529
Releases to income statement - (5) - (12) (95) (112)
Provisions utilised (114) (80) (72) (69) (146) (481)
At 30 June 2016 1,247 766 4,236 1,240 1,251 8,740
Transfer from accruals and other liabilities - - 17 - - 17
Currency translation and other movements - - 92 7 19 118
Charge to income statement - 16 271 198 191 676
Releases to income statement - (12) (22) (26) (8) (68)
Provisions utilised (102) (79) (78) (27) (176) (462)
At 30 September 2016 1,145 691 4,516 1,392 1,277 9,021
Transfer from accruals and other liabilities - 2 - 12 3 17
Transfer - 2 - (19) 17 -
Currency translation and other movements - 1 147 6 23 177
Charge to income statement 201 484 3,120 612 1,017 5,434
Releases to income statement - (4) (69) (34) (232) (339)
Provisions utilised (93) (71) (962) (51) (297) (1,474)
At 31 December 2016 1,253 1,105 6,752 1,918 1,808 12,836 Note: (1) Closing provision predominantly relates to investment advice, packaged accounts (including costs) and tracker mortgages.
There are uncertainties as to the eventual cost of redress in relation to certain of the provisions contained in the table above. Assumptions relating to these are inherently uncertain and the ultimate financial impact may be different from the amount provided. RBS will continue to monitor the position closely and refresh the underlying assumptions.
57 RBS – Annual results 2016
Notes
4. Litigation, investigations and reviews RBS and certain members of the Group are party to legal proceedings and the subject of investigation and other regulatory and governmental action (“Matters”) in the United Kingdom (UK), the United States (US), the European Union (EU) and other jurisdictions. Note 31 on the RBS 2016 Annual Report and Accounts, issued on 24 February 2017 and available at rbs.com/results (“Note 31”), discusses the Matters in which RBS is currently involved and developments to those matters. Other than the Matters discussed in Note 31, no member of the Group is or has been involved in governmental, legal, or regulatory proceedings (including those which are pending or threatened) that are expected to be material, individually or in aggregate. Recent developments in the Matters identified in Note 31 which have occurred since the Q3 2016 results were issued on 28 October 2016, include, but are not limited to, those set out below. UK 2008 rights issue shareholder litigation As previously disclosed, claims have been issued against RBSG in the High Court of Justice of England and Wales alleging that untrue and misleading statements and/or improper omissions, in breach of the Financial Services and Markets Act 2000, were made in connection with the rights issue announced by RBS on 22 April 2008. In December 2016 RBS concluded full and final settlements with four of the five shareholder groups representing 78% of the claims by value. The maximum settlement figure of £800 million is covered by existing RBS provisions and that total figure assumes that agreement is reached with all groups, is split proportionally between each, and is subject to validation of claims. Should the remaining group’s claim not be settled, RBS will continue to defend it. Damages have not yet been quantified. The court timetable provides that a trial of the preliminary issue of whether the rights issue prospectus contained untrue and misleading statements and/or improper omissions will commence in May 2017. In the event that the court makes such a finding, further trial(s) will be required to consider whether any such statements and/or omissions caused loss and, if so, the quantum of that loss. RMBS-related litigation and investigations in the US As previously disclosed, RBS companies are defendants in a purported RMBS class action entitled New Jersey Carpenters Health Fund v. Novastar Mortgage Inc. et al., which remains pending in the United States District Court for the Southern District of New York. RBS has reached an agreement in principle to settle this matter, subject to documentation and court approval. The amount of the settlement is covered by an existing provision. In Q4 2016, a further £3.1 billion ($4.2 billion) provision was taken in respect of various RMBS-related litigation and investigations. As at 31 December 2016, the total aggregate of provisions in relation to certain of the RMBS litigation (set out under “Litigation” in Note 31) and RMBS and other securitised products investigations (set out under “Investigations and reviews” in Note 31) is £6.8 billion ($8.3 billion). The duration and outcome of these investigations and litigation matters remain uncertain, including in respect of whether settlements for all or any of such matters may be reached. Further substantial provisions and costs may be recognised and, depending on the final outcome, other adverse consequences may occur.
58 RBS – Annual results 2016
Notes
4. Litigation, investigations and reviews (continued) Trading of asset-backed securities As previously disclosed, RBS Securities Inc. (RBSSI) has been responding to an ongoing criminal investigation by the United States Attorney for the District of Connecticut relating to alleged misrepresentations in the trading of various forms of asset-backed securities, including RMBS, commercial mortgage-backed securities, CDOs, and CLOs. In March and September 2015, two former RBSSI traders entered guilty pleas in the United States District Court for the District of Connecticut, each to one count of conspiracy to commit securities fraud while employed at RBSSI. RBSSI is in advanced discussions to resolve the matter. FX antitrust litigation As previously disclosed, in September 2015 certain members of the Group, as well as a number of other financial institutions, were named as defendants in two purported class actions filed in Ontario and Quebec on behalf of persons in Canada who entered into foreign exchange transactions or who invested in funds that entered into foreign exchange transactions. The plaintiffs allege that the defendants violated the Canadian Competition Act by conspiring to manipulate the prices of currency trades. In January 2017, RBS reached an agreement in principle to settle these matters for approximately CAD 13 million, subject to settlement documentation and court approval. Interest rate hedging products litigation As previously disclosed, RBS is dealing with a large number of active litigation claims in relation to the sale of interest rate hedging products (IRHPs). In general claimants allege that the relevant interest rate hedging products were mis-sold to them, with some also alleging RBS made misrepresentations in relation to LIBOR. Claims have been brought by customers who were considered under the UK Financial Conduct Authority (FCA) redress programme, as well as customers who were outside of the scope of that programme, which was closed to new entrants on 31 March 2015. RBS encouraged those customers that were eligible to seek redress under the FCA redress programme to participate in that programme. RBS remains exposed to potential claims from customers who were either ineligible to be considered for redress or who are dissatisfied with their redress offers. Property Alliance Group (PAG) v The Royal Bank of Scotland plc was the leading case before the English High Court involving both IRHP mis-selling and LIBOR misconduct allegations. The amount claimed was approximately £33 million and the trial ended in October 2016. On 21 December 2016 the Court dismissed all of PAG’s claims. The decision (subject to any appeal by PAG) may have significance to other similar LIBOR-related cases currently pending in the English courts, some of which involve substantial amounts. The case of Wall v The Royal Bank of Scotland plc, which concerns similar allegations to those in PAG is currently scheduled to go to trial in October 2017. The sum claimed is between £400 million and £700 million.
59 RBS – Annual results 2016
Notes
4. Litigation, investigations and reviews (continued) Tax dispute HMRC issued a tax assessment in 2012 against RBS for approximately £86 million regarding a value-added-tax (“VAT”) matter in relation to the trading of European Union Allowances (“EUAs”) by an RBS joint venture subsidiary in 2009. RBS has commenced legal proceedings before the First-tier Tribunal (Tax), a specialist tax tribunal, challenging the assessment (the “Tax Dispute”). Separately, RBS is a named defendant in proceedings before the High Court brought in 2015 by ten companies (all in liquidation) (the “Liquidated Companies”) and their respective liquidators (together, “the Claimants”). The Liquidated Companies previously traded in EUAs in 2009 and are alleged to be defaulting traders within (or otherwise connected to) the EUA supply chains forming the subject of the Tax Dispute. The Claimants are claiming approximately £72.5 million by alleging that RBS dishonestly assisted the directors of the Liquidated Companies in the breach of their statutory duties and/or knowingly participated in the carrying on of the business of the Liquidated Companies with intent to defraud creditors. RBS strongly denies these allegations.
LIBOR and other trading rates In December 2016 the Swiss ComCo announced the closure of four separate investigations into RBS and certain other banks relating to interest rate derivatives and LIBOR. RBS received full immunity for fines relating to the Swiss franc LIBOR benchmark investigation. RBS has agreed to pay a total of CHF17.06m in fines to settle the other investigations. On 3 February 2017, it was announced that RBS and the CFTC entered into a civil settlement resolving the CFTC’s investigation of ISDAFIX and related trading activities. As part of the settlement, RBS has paid a penalty of US$85 million and agreed to certain undertakings. Foreign exchange related investigations As previously disclosed, on 20 May 2015, RBS plc announced that it had reached a settlement with the DOJ in relation to investigations into its FX business within its NatWest Markets segment. As part of its plea agreement with the DOJ, RBS plc pled guilty in the United States District Court for the District of Connecticut to a one-count information charging an antitrust conspiracy. On 5 January 2017, the United States District Court for the District of Connecticut imposed a sentence on RBS plc consisting of the US$395 million criminal fine previously agreed with the DOJ and a term of probation, which among other things, prohibits RBS plc from committing another crime in violation of US law or engaging in the FX trading practices that form the basis for the charged crime and requires RBS plc to implement a compliance program designed to prevent and detect the unlawful conduct at issue and to strengthen its compliance and internal controls as required by other regulators (including the FCA and the CFTC). A violation of the terms of probation could lead to the imposition of additional penalties. Subsequent to the sentencing, RBS plc paid the criminal fine, which had been covered by an existing provision.
FCA review of RBS’s treatment of SMEs As previously disclosed, the FCA is conducting a review into the treatment of small and medium enterprise (SME) customers in RBS’s former Global Restructuring Group (GRG) between 2008 and 2013.
On 8 November 2016, the FCA published an update on its review. In response, RBS announced steps that will impact SME customers in the UK and the Republic of Ireland that were in GRG between 2008 and 2013. These steps are (i) an automatic refund of certain complex fees; and (ii) a new complaints process, overseen by an Independent Third Party. These steps have been developed with the involvement of the FCA which agreed that they are appropriate for RBS to take.
60 RBS – Annual results 2016
Notes
4. Litigation, investigations and reviews (continued) RBS estimates the costs associated with the new complaints review process and the automatic refund of complex fees to be approximately £400 million, which has been recognised as a provision in Q4 2016. This includes operational costs together with the cost of refunded complex fees and the additional estimated redress costs arising from the new complaints process. The FCA has announced that its review will continue. RBS continues to cooperate fully with the review.
Payment Protection Insurance (PPI) As previously disclosed, on 26 November 2015, the FCA issued Consultation Paper 15/39, in which it set out proposed rules and guidance for how firms should handle PPI complaints fairly in light of the Plevin decision and how the FOS should consider relevant PPI complaints. The Consultation Paper also contained proposals for the introduction in 2018 of a deadline for submission of PPI complaints.
Following feedback received on its Consultation Paper, on 2 August 2016, the FCA issued a further Consultation Paper (CP 16/20) on certain aspects of the proposed rules and guidance.
Following feedback received on its second Consultation Paper (CP16/20), on 9 December 2016, the FCA issued a statement explaining that it is carefully considering the issues raised and will make a further announcement before 31 March 2017. In light of this statement, RBS expects that the implementation of the complaint deadline will be pushed back from end of June 2019 to 1 October or 31 December 2019. The introduction of new Plevin rules and guidance will also be delayed. An additional provision of £601 million was taken in 2016 in response to the anticipated further delay in guidance. UK retail banking As previously disclosed, in November 2014, the CMA announced its decision to proceed with a market investigation reference (MIR) into retail banking, which would cover PCA and SME banking. On 9 August 2016, the CMA published its final report. The CMA concluded that there are a number of competition concerns in the provision of PCAs, business current accounts and SME lending, particularly around low levels of customers searching and switching, resulting in banks not being put under enough competitive pressure, and new products and new banks not attracting customers quickly enough. The final report sets out remedies to address these concerns. These include remedies making it easier for customers to compare products, ensure customers benefit from technological advantages around open banking, improve the current account switching service and provide PCA overdraft customers with greater control over their charges along with additional measures targeted at SME customers. On 2 February 2017 the CMA published the Retail Banking Market Investigation Order 2017 which is the primary legal framework setting out the obligations for the implementation of the majority of remedies, including an implementation deadline for each. Other remedies are to be delivered via undertakings signed by Bacs and recommendations to be taken forward by other regulators (including the FCA). At this stage there remains uncertainty around the financial impact of the remedies once implemented and it is not practicable to estimate the potential impact on RBS, which may be material.
61 RBS – Annual results 2016
Notes
4. Litigation, investigations and reviews (continued) Enforcement proceedings and investigations in relation to Coutts & Co Ltd The Swiss Financial Market Supervisory Authority (FINMA) has been taking enforcement proceedings against Coutts & Co Ltd, a member of RBS incorporated in Switzerland, with regard to certain client accounts held with Coutts & Co Ltd relating to allegations in connection with the Malaysian sovereign wealth fund 1MDB. On 2 February 2017, FINMA announced that Coutts & Co Ltd had breached money laundering regulations by failing to carry out adequate background checks into business relationships and transactions associated with 1MDB. FINMA accordingly required Coutts & Co Ltd to disgorge profits of CHF 6.5 million. Coutts & Co Ltd is also cooperating with investigations and enquiries from authorities in other jurisdictions in relation to the same subject matter. In this context, the Monetary Authority of Singapore (MAS)’s supervisory examination of Coutts & Co Ltd’s Singapore branch revealed breaches of anti-money laundering requirements. MAS imposed on Coutts & Co Ltd financial penalties amounting to SGD 2.4 million in December 2016. The outcomes of other proceedings, investigations and enquiries are uncertain but may include financial consequences and/or regulatory sanctions.
62 RBS – Annual results 2016
Notes
5. Related party transactions UK Government The UK Government and bodies controlled or jointly controlled by the UK Government and bodies over which it has significant influence are related parties of the Group. The Group enters into transactions with many of these bodies on an arm’s length basis. Bank of England facilities In the ordinary course of business, the Group may from time to time access market-wide facilities provided by the Bank of England. The Group’s other transactions with the UK Government include the payment of taxes, principally UK corporation tax and value added tax; national insurance contributions; local authority rates; and regulatory fees and levies (including the bank levy and FSCS levies). Other related parties (a) In their roles as providers of finance, Group companies provide development and other types of capital support to businesses. These investments are made in the normal course of business and on arm's length terms. In some instances, the investment may extend to ownership or control over 20% or more of the voting rights of the investee company. However, these investments are not considered to give rise to transactions of a materiality requiring disclosure under IAS 24.
(b) The Group recharges The Royal Bank of Scotland Group Pension Fund with the cost of administration services incurred by it. The amounts involved are not material to the Group.
Full details of the Group’s related party transactions for the year ended 31 December 2016 are included in the 2016 Annual Report and Accounts.
6. Post balance sheet events Other than matters disclosed, there have been no further significant events between 31 December 2016 and the date of approval of this announcement.
63 RBS – Annual results 2016
Statement of directors’ responsibilities
The responsibility statement below has been prepared in connection with the Group's full Annual Report and Accounts for the year ended 31 December 2016. We, the directors listed below, confirm that to the best of our knowledge:
the financial statements, prepared in accordance with International Financial Reporting Standards, give a true and fair view of the assets, liabilities, financial position and profit or loss of the company and the undertakings included in the consolidation taken as a whole; and
the Strategic Report and Directors’ report (incorporating the Business review) include a fair review of the development and performance of the business and the position of the company and the undertakings included in the consolidation taken as a whole, together with a description of the principal risks and uncertainties that they face.
By order of the Board Howard Davies Ross McEwan Ewen Stevenson Chairman Chief Executive Chief Financial Officer 23 February 2017 Board of directors Chairman Executive directors Non-executive directors Howard Davies Ross McEwan
Ewen Stevenson
Sandy Crombie Frank Dangeard Alison Davis Morten Friis Robert Gillespie Penny Hughes Brendan Nelson Baroness Noakes Mike Rogers
64 RBS – Annual results 2016
Forward-looking statements
Cautionary statement regarding forward-looking statements Certain sections in this document contain ‘forward-looking statements’ as that term is defined in the United States Private Securities Litigation Reform Act of 1995, such as statements that include the words ‘expect’, ‘estimate’, ‘project’, ‘anticipate’, ‘commit’, ‘believe’, ‘should’, ‘intend’, ‘plan’, ‘could’, ‘probability’, ‘risk’, ‘Value-at-Risk (VaR)’, ‘target’, ‘goal’, ‘objective’, ‘may’, ‘endeavour’, ‘outlook’, ‘optimistic’, ‘prospects’ and similar expressions or variations on these expressions. In particular, this document includes forward-looking statements relating, but not limited to: future profitability and performance, including financial performance targets such as return on tangible equity; cost savings and targets, including cost:income ratios; litigation and government and regulatory investigations, including the timing and financial and other impacts thereof; structural reform and the implementation of the UK ring-fencing regime; the implementation of RBS’s transformation programme, including the further restructuring of the NatWest Markets business; the satisfaction of the Group’s residual EU State Aid obligations; the continuation of RBS’s balance sheet reduction programme, including the reduction of risk-weighted assets (RWAs) and the timing thereof; capital and strategic plans and targets; capital, liquidity and leverage ratios and requirements, including CET1 Ratio, RWA equivalents (RWAe), Pillar 2 and other regulatory buffer requirements, minimum requirement for own funds and eligible liabilities, and other funding plans; funding and credit risk profile; capitalisation; portfolios; net interest margin; customer loan and income growth; the level and extent of future impairments and write-downs, including with respect to goodwill; restructuring and remediation costs and charges; future pension contributions; RBS’s exposure to political risks, operational risk, conduct risk, cyber and IT risk and credit rating risk and to various types of market risks, including as interest rate risk, foreign exchange rate risk and commodity and equity price risk; customer experience including our Net Promotor Score (NPS); employee engagement and gender balance in leadership positions. Limitations inherent to forward-looking statements These statements are based on current plans, estimates, targets and projections, and are subject to significant inherent risks, uncertainties and other factors, both external and relating to the Group’s strategy or operations, which may result in the Group being unable to achieve the current targets, predictions, expectations and other anticipated outcomes expressed or implied by such forward-looking statements. In addition certain of these disclosures are dependent on choices relying on key model characteristics and assumptions and are subject to various limitations, including assumptions and estimates made by management. By their nature, certain of these disclosures are only estimates and, as a result, actual future gains and losses could differ materially from those that have been estimated. Accordingly, undue reliance should not be placed on these statements. Forward-looking statements speak only as of the date we make them and we expressly disclaim any obligation or undertaking to release publicly any updates or revisions to any forward-looking statements contained herein to reflect any change in the Group’s expectations with regard thereto or any change in events, conditions or circumstances on which any such statement is based. Important factors that could affect the actual outcome of the forward-looking statements We caution you that a large number of important factors could adversely affect our results or our ability to implement our strategy, cause us to fail to meet our targets, predictions, expectations and other anticipated outcomes or affect the accuracy of forward-looking statements we describe in this document including in the risk factors set out in the Group’s 2016 Annual Report and other uncertainties discussed in this document. These include the significant risks for RBS presented by the outcomes of the legal, regulatory and governmental actions and investigations that RBS is or may be subject to (including active civil and criminal investigations) and any resulting material adverse effect on RBS of unfavourable outcomes and the timing thereof (including where resolved by settlement); economic, regulatory and political risks, including as may result from the uncertainty arising from the EU Referendum; RBS’s ability to satisfy its residual EU State Aid obligations and the timing thereof; RBS’s ability to successfully implement the significant and complex restructuring required to be undertaken in order to implement the UK ring-fencing regime and related costs; RBS’s ability to successfully implement the various initiatives that are comprised in its transformation programme, particularly the proposed further restructuring of the NatWest Markets business, the balance sheet reduction programme and its significant cost-saving initiatives and whether RBS will be a viable, competitive, customer focused and profitable bank especially after its restructuring and the implementation of the UK ring-fencing regime; the exposure of RBS to cyber-attacks and its ability to defend against such attacks; RBS’s ability to achieve its capital and leverage requirements or targets which will depend in part on RBS’s success in reducing the size of its business and future profitability as well as developments which may impact its CET1 capital including additional litigation or conduct costs, additional pension contributions, further impairments or accounting changes; ineffective management of capital or changes to regulatory requirements relating to capital adequacy and liquidity or failure to pass mandatory stress tests; RBS’s ability to access sufficient sources of capital, liquidity and funding when required; changes in the credit ratings of RBS, RBS entities or the UK government; declining revenues resulting from lower customer retention and revenue generation in light of RBS’s strategic refocus on the UK; as well as increasing competition from new incumbents and disruptive technologies.
65 RBS – Annual results 2016
Forward-looking statements
In addition, there are other risks and uncertainties that could adversely affect our results, ability to implement our strategy, cause us to fail to meet our targets or the accuracy of forward-looking statements in this document. These include operational risks that are inherent to RBS’s business and will increase as a result of RBS’s significant restructuring initiatives being concurrently implemented; the potential negative impact on RBS’s business of global economic and financial market conditions and other global risks; the impact of a prolonged period of low interest rates or unanticipated turbulence in interest rates, yield curves, foreign currency exchange rates, credit spreads, bond prices, commodity prices, equity prices; basis, volatility and correlation risks; the extent of future write-downs and impairment charges caused by depressed asset valuations; deteriorations in borrower and counterparty credit quality; heightened regulatory and governmental scrutiny and the increasingly regulated environment in which RBS operates as well as divergences in regulatory requirements in the jurisdictions in which RBS operates; the risks relating to RBS’s IT systems or a failure to protect itself and its customers against cyber threats, reputational risks; risks relating to increased pension liabilities and the impact of pension risk on RBS’s capital position; risks relating to the failure to embed and maintain a robust conduct and risk culture across the organisation or if its risk management framework is ineffective; RBS’s ability to attract and retain qualified personnel; limitations on, or additional requirements imposed on, RBS’s activities as a result of HM Treasury’s investment in RBS; the value and effectiveness of any credit protection purchased by RBS; risks relating to the reliance on valuation, capital and stress test models and any inaccuracies resulting therefrom or failure to accurately reflect changes in the micro and macroeconomic environment in which RBS operates, risks relating to changes in applicable accounting policies or rules which may impact the preparation of RBS’s financial statements or adversely impact its capital position; the impact of the recovery and resolution framework and other prudential rules to which RBS is subject; the recoverability of deferred tax assets by the Group; and the success of RBS in managing the risks involved in the foregoing. The forward-looking statements contained in this document speak only as at the date hereof, and RBS does not assume or undertake any obligation or responsibility to update any forward-looking statement to reflect events or circumstances after the date hereof or to reflect the occurrence of unanticipated events. The information, statements and opinions contained in this document do not constitute a public offer under any applicable legislation or an offer to sell or solicit of any offer to buy any securities or financial instruments or any advice or recommendation with respect to such securities or other financial instruments.
RBS – Annual Results 2016
Appendix 1
Segmental income statement reconciliations
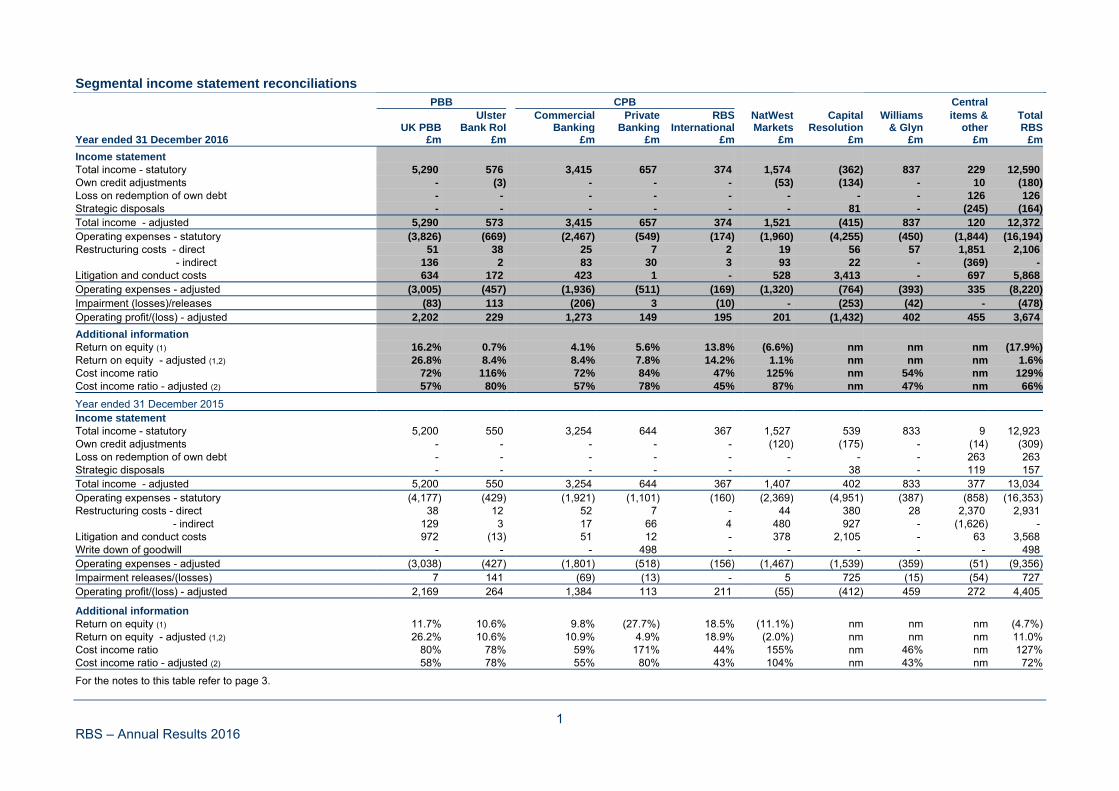
1 RBS – Annual Results 2016
Segmental income statement reconciliations PBB CPB Central Ulster Commercial Private RBS NatWest Capital Williams items & Total UK PBB Bank RoI Banking Banking International Markets Resolution & Glyn other RBSYear ended 31 December 2016 £m £m £m £m £m £m £m £m £m £m
Income statement Total income - statutory 5,290 576 3,415 657 374 1,574 (362) 837 229 12,590 Own credit adjustments - (3) - - - (53) (134) - 10 (180)Loss on redemption of own debt - - - - - - - - 126 126 Strategic disposals - - - - - - 81 - (245) (164)Total income - adjusted 5,290 573 3,415 657 374 1,521 (415) 837 120 12,372 Operating expenses - statutory (3,826) (669) (2,467) (549) (174) (1,960) (4,255) (450) (1,844) (16,194)Restructuring costs - direct 51 38 25 7 2 19 56 57 1,851 2,106 - indirect 136 2 83 30 3 93 22 - (369) - Litigation and conduct costs 634 172 423 1 - 528 3,413 - 697 5,868 Operating expenses - adjusted (3,005) (457) (1,936) (511) (169) (1,320) (764) (393) 335 (8,220)Impairment (losses)/releases (83) 113 (206) 3 (10) - (253) (42) - (478)Operating profit/(loss) - adjusted 2,202 229 1,273 149 195 201 (1,432) 402 455 3,674
Additional information Return on equity (1) 16.2% 0.7% 4.1% 5.6% 13.8% (6.6%) nm nm nm (17.9%)Return on equity - adjusted (1,2) 26.8% 8.4% 8.4% 7.8% 14.2% 1.1% nm nm nm 1.6%Cost income ratio 72% 116% 72% 84% 47% 125% nm 54% nm 129%Cost income ratio - adjusted (2) 57% 80% 57% 78% 45% 87% nm 47% nm 66%
Year ended 31 December 2015 Income statement Total income - statutory 5,200 550 3,254 644 367 1,527 539 833 9 12,923 Own credit adjustments - - - - - (120) (175) - (14) (309)Loss on redemption of own debt - - - - - - - - 263 263 Strategic disposals - - - - - - 38 - 119 157 Total income - adjusted 5,200 550 3,254 644 367 1,407 402 833 377 13,034 Operating expenses - statutory (4,177) (429) (1,921) (1,101) (160) (2,369) (4,951) (387) (858) (16,353)Restructuring costs - direct 38 12 52 7 - 44 380 28 2,370 2,931 - indirect 129 3 17 66 4 480 927 - (1,626) - Litigation and conduct costs 972 (13) 51 12 - 378 2,105 - 63 3,568 Write down of goodwill - - - 498 - - - - - 498 Operating expenses - adjusted (3,038) (427) (1,801) (518) (156) (1,467) (1,539) (359) (51) (9,356)Impairment releases/(losses) 7 141 (69) (13) - 5 725 (15) (54) 727 Operating profit/(loss) - adjusted 2,169 264 1,384 113 211 (55) (412) 459 272 4,405
Additional information Return on equity (1) 11.7% 10.6% 9.8% (27.7%) 18.5% (11.1%) nm nm nm (4.7%)Return on equity - adjusted (1,2) 26.2% 10.6% 10.9% 4.9% 18.9% (2.0%) nm nm nm 11.0%Cost income ratio 80% 78% 59% 171% 44% 155% nm 46% nm 127%Cost income ratio - adjusted (2) 58% 78% 55% 80% 43% 104% nm 43% nm 72%
For the notes to this table refer to page 3.
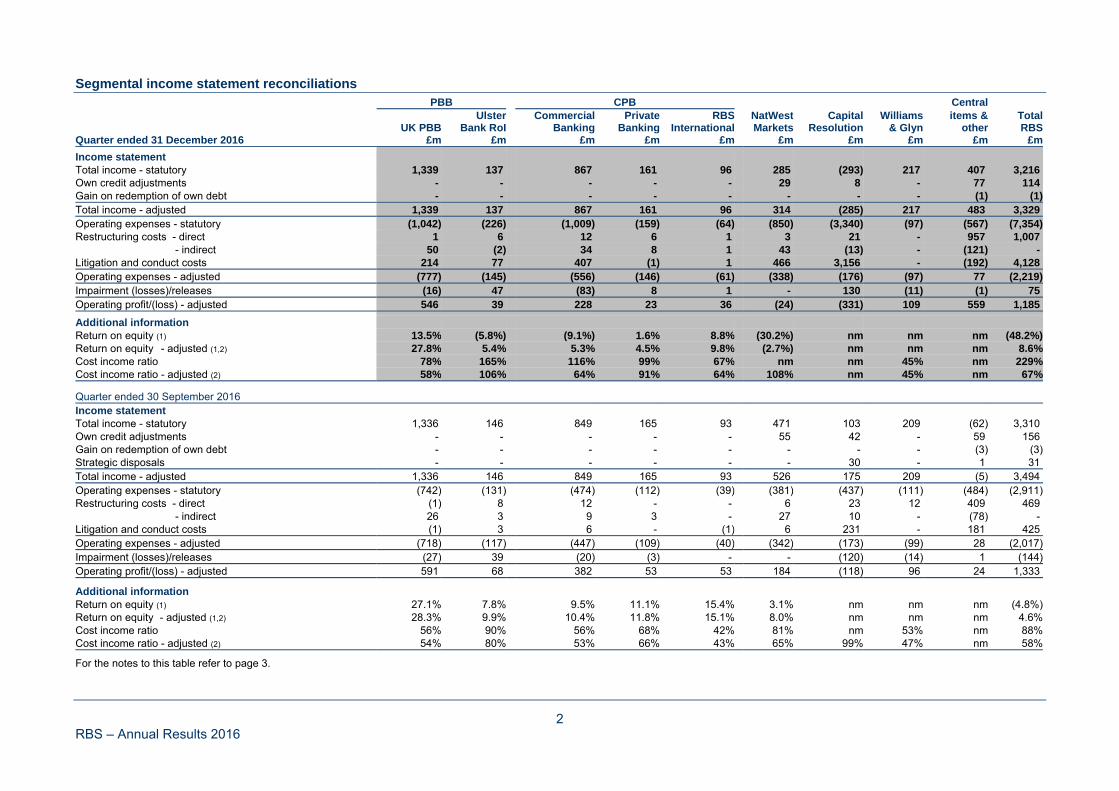
2 RBS – Annual Results 2016
Segmental income statement reconciliations PBB CPB Central Ulster Commercial Private RBS NatWest Capital Williams items & Total UK PBB Bank RoI Banking Banking International Markets Resolution & Glyn other RBSQuarter ended 31 December 2016 £m £m £m £m £m £m £m £m £m £m
Income statement Total income - statutory 1,339 137 867 161 96 285 (293) 217 407 3,216 Own credit adjustments - - - - - 29 8 - 77 114 Gain on redemption of own debt - - - - - - - - (1) (1)Total income - adjusted 1,339 137 867 161 96 314 (285) 217 483 3,329 Operating expenses - statutory (1,042) (226) (1,009) (159) (64) (850) (3,340) (97) (567) (7,354)Restructuring costs - direct 1 6 12 6 1 3 21 - 957 1,007 - indirect 50 (2) 34 8 1 43 (13) - (121) - Litigation and conduct costs 214 77 407 (1) 1 466 3,156 - (192) 4,128 Operating expenses - adjusted (777) (145) (556) (146) (61) (338) (176) (97) 77 (2,219)Impairment (losses)/releases (16) 47 (83) 8 1 - 130 (11) (1) 75 Operating profit/(loss) - adjusted 546 39 228 23 36 (24) (331) 109 559 1,185
Additional information Return on equity (1) 13.5% (5.8%) (9.1%) 1.6% 8.8% (30.2%) nm nm nm (48.2%)Return on equity - adjusted (1,2) 27.8% 5.4% 5.3% 4.5% 9.8% (2.7%) nm nm nm 8.6%Cost income ratio 78% 165% 116% 99% 67% nm nm 45% nm 229%Cost income ratio - adjusted (2) 58% 106% 64% 91% 64% 108% nm 45% nm 67%
Quarter ended 30 September 2016 Income statement Total income - statutory 1,336 146 849 165 93 471 103 209 (62) 3,310 Own credit adjustments - - - - - 55 42 - 59 156 Gain on redemption of own debt - - - - - - - - (3) (3)Strategic disposals - - - - - - 30 - 1 31 Total income - adjusted 1,336 146 849 165 93 526 175 209 (5) 3,494 Operating expenses - statutory (742) (131) (474) (112) (39) (381) (437) (111) (484) (2,911)Restructuring costs - direct (1) 8 12 - - 6 23 12 409 469 - indirect 26 3 9 3 - 27 10 - (78) - Litigation and conduct costs (1) 3 6 - (1) 6 231 - 181 425 Operating expenses - adjusted (718) (117) (447) (109) (40) (342) (173) (99) 28 (2,017)Impairment (losses)/releases (27) 39 (20) (3) - - (120) (14) 1 (144)Operating profit/(loss) - adjusted 591 68 382 53 53 184 (118) 96 24 1,333
Additional information Return on equity (1) 27.1% 7.8% 9.5% 11.1% 15.4% 3.1% nm nm nm (4.8%)Return on equity - adjusted (1,2) 28.3% 9.9% 10.4% 11.8% 15.1% 8.0% nm nm nm 4.6%Cost income ratio 56% 90% 56% 68% 42% 81% nm 53% nm 88%Cost income ratio - adjusted (2) 54% 80% 53% 66% 43% 65% 99% 47% nm 58%
For the notes to this table refer to page 3.
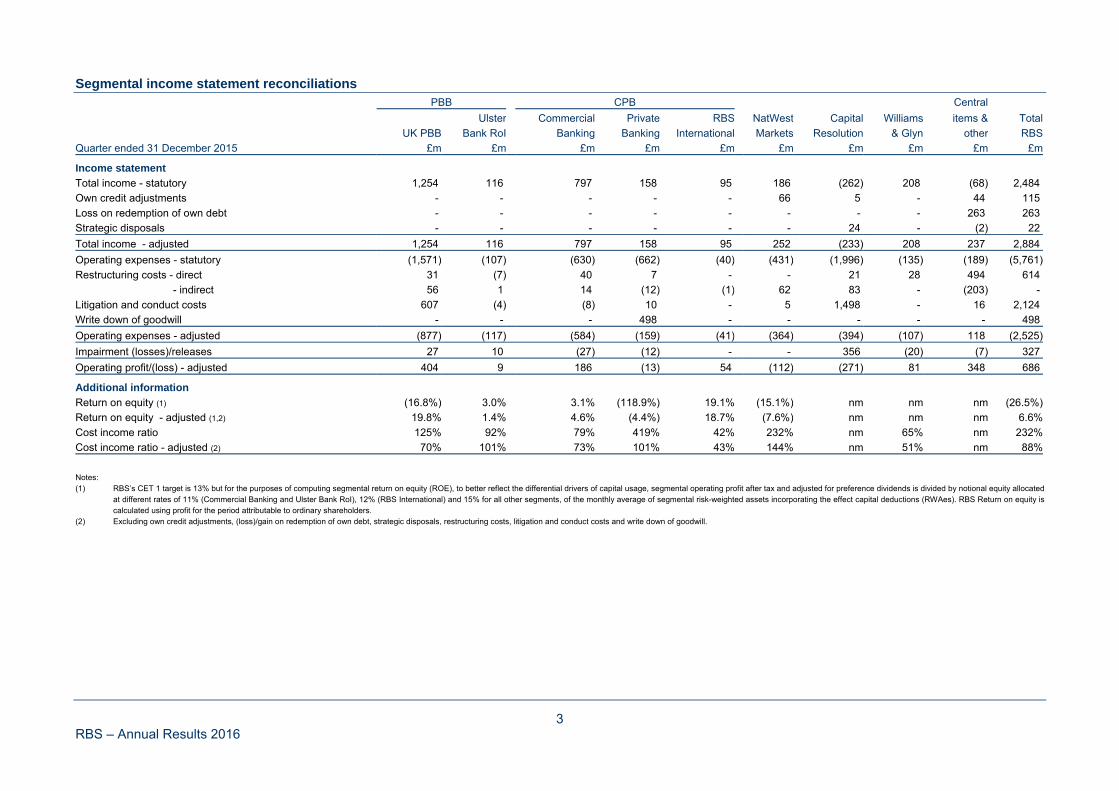
3 RBS – Annual Results 2016
Segmental income statement reconciliations PBB CPB Central
Ulster Commercial Private RBS NatWest Capital Williams items & Total
UK PBB Bank RoI Banking Banking International Markets Resolution & Glyn other RBS
Quarter ended 31 December 2015 £m £m £m £m £m £m £m £m £m £m
Income statement
Total income - statutory 1,254 116 797 158 95 186 (262) 208 (68) 2,484
Own credit adjustments - - - - - 66 5 - 44 115
Loss on redemption of own debt - - - - - - - - 263 263
Strategic disposals - - - - - - 24 - (2) 22
Total income - adjusted 1,254 116 797 158 95 252 (233) 208 237 2,884
Operating expenses - statutory (1,571) (107) (630) (662) (40) (431) (1,996) (135) (189) (5,761)
Restructuring costs - direct 31 (7) 40 7 - - 21 28 494 614
- indirect 56 1 14 (12) (1) 62 83 - (203) -
Litigation and conduct costs 607 (4) (8) 10 - 5 1,498 - 16 2,124
Write down of goodwill - - - 498 - - - - - 498
Operating expenses - adjusted (877) (117) (584) (159) (41) (364) (394) (107) 118 (2,525)
Impairment (losses)/releases 27 10 (27) (12) - - 356 (20) (7) 327
Operating profit/(loss) - adjusted 404 9 186 (13) 54 (112) (271) 81 348 686
Additional information
Return on equity (1) (16.8%) 3.0% 3.1% (118.9%) 19.1% (15.1%) nm nm nm (26.5%)
Return on equity - adjusted (1,2) 19.8% 1.4% 4.6% (4.4%) 18.7% (7.6%) nm nm nm 6.6%
Cost income ratio 125% 92% 79% 419% 42% 232% nm 65% nm 232%
Cost income ratio - adjusted (2) 70% 101% 73% 101% 43% 144% nm 51% nm 88%
Notes: (1) RBS’s CET 1 target is 13% but for the purposes of computing segmental return on equity (ROE), to better reflect the differential drivers of capital usage, segmental operating profit after tax and adjusted for preference dividends is divided by notional equity allocated
at different rates of 11% (Commercial Banking and Ulster Bank RoI), 12% (RBS International) and 15% for all other segments, of the monthly average of segmental risk-weighted assets incorporating the effect capital deductions (RWAes). RBS Return on equity iscalculated using profit for the period attributable to ordinary shareholders.
(2) Excluding own credit adjustments, (loss)/gain on redemption of own debt, strategic disposals, restructuring costs, litigation and conduct costs and write down of goodwill.