Embed Size (px)
Citation preview
The Route of HIV Escape fromImmune Response Targeting Multiple
Sites Is Determined by the Cost-Benefit Tradeoff of Escape Mutations
The Harvard community has made thisarticle openly available. Please share howthis access benefits you. Your story matters
Citation Batorsky, Rebecca Emily, Rinat Alexandrovich Sergeev, and IgorM. Rouzine. Forthcoming. "The Route of HIV Escape from ImmuneResponse Targeting Multiple Sites Is Determined by the Cost-Benefit Tradeoff of Escape Mutations." PLoS Computational Biology.
Citable link http://nrs.harvard.edu/urn-3:HUL.InstRepos:12670782
Terms of Use This article was downloaded from Harvard University’s DASHrepository, and is made available under the terms and conditionsapplicable to Other Posted Material, as set forth at http://nrs.harvard.edu/urn-3:HUL.InstRepos:dash.current.terms-of-use#LAA
1
The Route of HIV Escape from Immune Response Targeting
Multiple Sites is Determined by the Cost-Benefit Tradeoff of
Escape Mutations
Rebecca Batorsky1,3, Rinat A. Sergeev2†, Igor M. Rouzine2‡∗
1 Department of Physics and Astronomy, Tufts University, Medford, Massachusetts,
United States of America
2 Department of Microbiology, Tufts University, Boston, Massachusetts, United States of
America
3 Ragon Institute of MGH, MIT and Harvard, Boston, Massachusetts, United States of
America
† Present address: Institute for Quantitative Social Science, Harvard University,
Cambridge, United States of America
‡ Present address: Gladstone Institute of Virology and Immunology, University of
California, San Francisco, United States of America
∗ E-mail: [email protected]
Abstract
Cytotoxic T lymphocytes (CTL) are a major factor in the control of HIV replication. CTL arise in
acute infection causing escape mutations to spread rapidly through the population of infected cells. As a
result, the virus develops partial resistance to the immune response. The factors controlling the order of
mutating epitope sites are currently unknown and would provide a valuable tool for predicting conserved
epitopes. In this work, we adapt a well-established mathematical model of HIV evolution under dynamical
selection pressure from multiple CTL clones to include partial impairment of CTL recognition, ∆r, as well
as cost to viral replication, ∆f . The process of escape is described in terms of the cost-benefit tradeoff of
escape mutations and predicts a trajectory in the cost-benefit plane connecting sequentially escaped sites,
which moves from high recognition loss/low fitness cost to low recognition loss/high fitness cost and has
a larger slope for early escapes than for late escapes. The slope of the trajectory offers an interpretation
of positive correlation between fitness costs and HLA binding impairment to HLA-A molecules and a
protective subset of HLA-B molecules that was observed for clinically relevant escape mutations in the
2
Pol gene. We estimate the value of ∆r from published experimental studies to be in the range (0.01-0.86)
and show that the assumption of complete recognition loss (∆r = 1) leads to an overestimate of mutation
cost. Our analysis offers a consistent interpretation of the commonly observed pattern of escape, in which
several escape mutations are observed transiently in an epitope. This non-nested pattern is a combined
effect of temporal changes in selection pressure and partial recognition loss. We conclude that partial
recognition loss is as important as fitness loss for predicting the order of escapes and, ultimately, for
predicting conserved epitopes that can be targeted by vaccines.
Author Summary
Like many viruses, HIV has evolved mechanisms to evade the host immune response. As early as a
few weeks after infection is initiated, mutations appear in the viral genome that reduce the ability of
cytotoxic T lymphocytes (CTL) to control virus replication. However, of the many mutations in the
viral genome that could potentially mediate viral escape from the CTL response, a specific subset are
typically observed. This suggests that some mutations either entail too high a fitness cost for the virus, or
are relatively inefficient escape mutations. A successful vaccine would target the CTL response to these
regions in such a way that escape would not be possible. We use a computational model of HIV infection
in order to study the factors that determine whether a given escape mutation will occur, how long it
will be maintained in the population, and how these changes in the viral genome will affect the CTL
response. Our analysis highlights the important role of partial recognition loss conferred by a mutation
in producing the complex dynamics of escape that are observed during the course of infection.
Introduction
HIV replication continues for years despite a highly active immune response. Depletion of cytotoxic CD8+
T cells (CTL) in SIV infected animals causes rapid increase in viremia [1, 2] showing that CTL control
HIV/SIV replication; that this response is antigen-specific is evident from rapid genetic evolution of HIV
in antigenically important regions. Antigenic escape is one of the major mechanisms of HIV resilience in
face of an active immune response, impeding effective vaccine design [3] and implicated in the progression
to AIDS [4]. Shortly after infection is initiated, many CTL clones arise to target the transmitted virus
3
strain [5–7], each clone recognizing a distinct 8-10 amino acid viral peptide (epitope) presented on the
surface of an infected cell by MHC molecules. Escape mutations in CTL epitopes begin to be selected
within a month of infection and continue to be selected throughout chronic infection, sometimes causing
a decrease in the intrinsic replication rate of the virus (fitness cost) [8–10]. However, despite a sustained
CTL response, not all targeted epitopes escape. Moreover, among epitopes that do escape, the rate of
escape slows dramatically over the first 100 days post infection. It remains unclear which parameters
decide the timing and rate of escape in a given epitope as well as which epitopes escape and which are
preserved throughout chronic infection [11–13].
Mathematical models of HIV evolution in the presence of multiple CTL clones have been applied to
study the emergence of late escape mutations [14,15] and the effect of distributed CTL pressure on the rate
of escape [12,16]. Previous work has emphasized two parameters, the mutation cost (∆f) and the number
of active epitopes (n). It can be inferred that escape mutations come at a cost from the observation
of occasional reversion of escape mutations upon transmission between MHC mismatched individuals
[8, 9, 17, 18], as well as the frequent acquisition of compensatory mutations outside the epitope [19, 20].
Common escape mutations have been shown experimentally to have wide ranging fitness costs [10,21,22].
However, fitness costs and the number of CTL clones acting on the virus are not the sole determinants of
the dynamics of escape. It has been observed in HIV infected individuals [23] and SIV infected animals [24]
that CTL are capable of recognizing different variants of an epitope with different efficiencies. Thus, in
general, an escape mutant does not fully abrogate recognition of the corresponding CTL clone.
In the present work, we address the process of antigenic escape in terms of a cost-benefit diagram.
The benefit of an escape mutation is a partial CTL recognition loss and the mutation cost is a partial
reduction in viral replication rate. We extend the basic model introduced by Althaus and De Boer [14]
to include partially effective escape mutations and investigate how the two opposing evolutionary forces
together determine the observed rate of escape from the CTL response [12,25]. The model predicts that a
positive correlation between recognition and fitness losses emerges during sequential escape mutations, the
strength of which changes over time as pressure from the immune system wanes. We compare our model
predictions with existing data showing a correlation between fitness and recognition losses in clinically
relevant escape mutations from the Pol gene [26] and estimate the range of recognition losses that occurs
in commonly observed escape mutations from three published studies [27–29].
Furthermore, the inclusion of partially effective escape mutations in the model can reproduce the
4
diverse patterns of intra-epitope escape that are routinely observed in HIV infected patients. During the
majority of escape mutations that have been studied with time-resolved viral sequencing, 2-10 distinct
epitope sequences grow in number to replace the transmitted sequence and eventually one mutant epitope
spreads to the entire population. Furthermore, the dominant mutated epitope sequence changes over
time [11, 30, 31]. Although, in some epitopes, mutations are added at new sites in a nested fashion,
in a larger number of epitopes, mutations at new sites replace mutations at previous sites leading to
a non-nested pattern. This pattern is atypical for models assuming constant selection pressure. The
analysis below illustrates how time-dependent selection due to the changing CTL pressure and partial
CTL recognition loss can produce the non-nested pattern of escape (see [32] for review).
Results
Phases of HIV infection
In order to study escape from a the immune response we consider a model that includes target cells,
infected cells and multiple CTL clones which recognize various regions (epitopes) in the viral genome
with equal avidities (Figure 1A and Model). The model predicts three distinct phases of HIV infection
(Figure 1B), as follows. Phase 1: The transmitted HIV strain expands in the population of target cells.
Phase 2: All CTL clones that recognize cells infected by the transmitted strain are activated, expand,
and reduce the number of infected cells. A steady state is obtained with constant levels of infected cells
and CTL, which represents chronic HIV infection (see Equations S1-S3 in Text S1). Phase 3: Escape
mutations in viral epitopes emerge, changing the genetic composition of the population of infected cells
and the clonal composition of the CTL population but only weakly affecting their overall sizes.
The dynamics of infected cells and CTL during the escape phase (Phase 3) depends on the number
of epitopes that are targeted, n, and on the degree of recognition loss per mutation, ∆r (Table 1). In
the simplest case, if a single CTL clone is present in steady state and an escape mutation arises which
completely abrogates CTL recognition (∆r = 1), the CTL clone contracts and the population of infected
cells containing the escape mutation grows uncontrolled until target cells are depleted. In contrast, if the
recognition loss conferred by the escape mutation is partial (∆r < 1), the population of infected cells
grows only transiently, and the CTL clone expands until a new steady state is reached. When a group of
CTL clones with similar avidity target the infected cell population (as shown in Figure 1B), the spread
5
of either partly or fully effective escape mutation causes the corresponding CTL clone to contract, since
it recognizes infected cells less efficiently than other CTL clones (see Equation S5 in Text S2). Because
infected cells continue to be recognized by other CTL clones, the population of infected cells does not
grow out of control following the escape mutation. Thus, the model reproduces the three-phase dynamics
that can be inferred from kinetic data in HIV infected individuals including the waning of CTL responses
to escaped epitopes [11, 13,30,31].
The escape rate of a mutant strain is determined by the loss of CTL recognition and the
loss of viral fitness
Escape mutations begin to be selected once CTL reach sufficiently high levels (third phase in Figure 1B).
Mutations in all targeted epitopes begin to grow simultaneously, albeit with different rates due to variation
in the amounts of fitness and recognition losses caused by a mutation. The exponential growth rates
(escape rates) of mutant strains determine which mutant strain will have most selective advantage and
grow to dominate the population. Here we describe the growth of a mutated strain (Ii) with a single
mutation in epitope 1. An escape mutation results in both a fractional fitness cost, ∆fi, and a fractional
loss of CTL recognition, ∆ri. The mutant strain begins to grow as Ii(t) = Ii(0)e�it, with initial growth
rate �i:
�i =1
Ii
dIidt
= kEtot
�∆rin1
−∆fi
�− dI∆fi (1)
where 1/n1 is the fraction of CTL population recognizing epitope 1 (see Text S1). Thus, the escape rate
reflects the balance between the partial recognition loss and the partial fitness loss, which determines
whether a mutant strain has a selective advantage (� > 0). In order to infer, for example, the underlying
fitness cost of an escape mutation, it is necessary to measure not only the escape rate, but also the
fraction of the total CTL recognition that is abrogated by the mutation.
When multiple epitopes are targeted and recognition and fitness losses vary across epitopes, the growth
rates of escape mutants vary as well (Figure 1B). In data from HIV infected individuals, it is observed
that the rate of escape slows dramatically over the first 100 days post infection [11–13]. The rise of escape
mutants predicted by the model is consistent with these findings (Figure S2). Furthermore, assuming
only a minor fitness cost, the entire observed variation of escape rates over time and across sites can be
6
simulated from the variation of the recognition loss, ∆r.
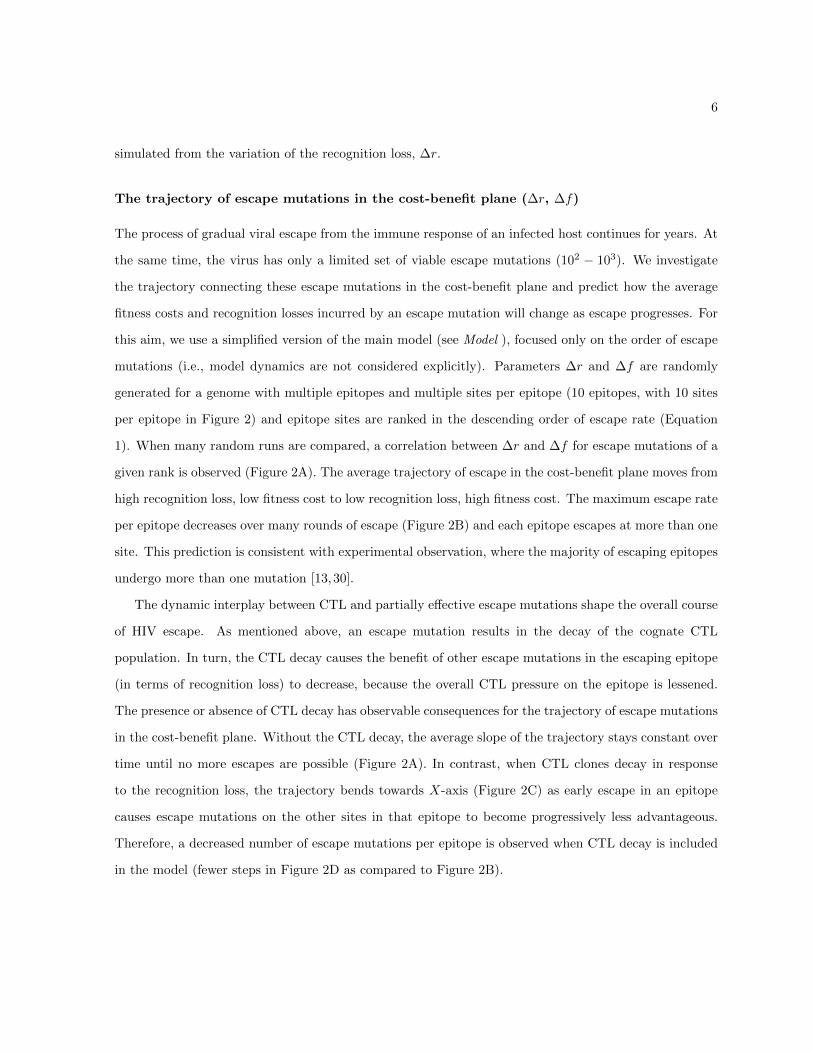
The trajectory of escape mutations in the cost-benefit plane (∆r, ∆f)
The process of gradual viral escape from the immune response of an infected host continues for years. At
the same time, the virus has only a limited set of viable escape mutations (102 − 103). We investigate
the trajectory connecting these escape mutations in the cost-benefit plane and predict how the average
fitness costs and recognition losses incurred by an escape mutation will change as escape progresses. For
this aim, we use a simplified version of the main model (see Model ), focused only on the order of escape
mutations (i.e., model dynamics are not considered explicitly). Parameters ∆r and ∆f are randomly
generated for a genome with multiple epitopes and multiple sites per epitope (10 epitopes, with 10 sites
per epitope in Figure 2) and epitope sites are ranked in the descending order of escape rate (Equation
1). When many random runs are compared, a correlation between ∆r and ∆f for escape mutations of a
given rank is observed (Figure 2A). The average trajectory of escape in the cost-benefit plane moves from
high recognition loss, low fitness cost to low recognition loss, high fitness cost. The maximum escape rate
per epitope decreases over many rounds of escape (Figure 2B) and each epitope escapes at more than one
site. This prediction is consistent with experimental observation, where the majority of escaping epitopes
undergo more than one mutation [13,30].
The dynamic interplay between CTL and partially effective escape mutations shape the overall course
of HIV escape. As mentioned above, an escape mutation results in the decay of the cognate CTL
population. In turn, the CTL decay causes the benefit of other escape mutations in the escaping epitope
(in terms of recognition loss) to decrease, because the overall CTL pressure on the epitope is lessened.
The presence or absence of CTL decay has observable consequences for the trajectory of escape mutations
in the cost-benefit plane. Without the CTL decay, the average slope of the trajectory stays constant over
time until no more escapes are possible (Figure 2A). In contrast, when CTL clones decay in response
to the recognition loss, the trajectory bends towards X-axis (Figure 2C) as early escape in an epitope
causes escape mutations on the other sites in that epitope to become progressively less advantageous.
Therefore, a decreased number of escape mutations per epitope is observed when CTL decay is included
in the model (fewer steps in Figure 2D as compared to Figure 2B).
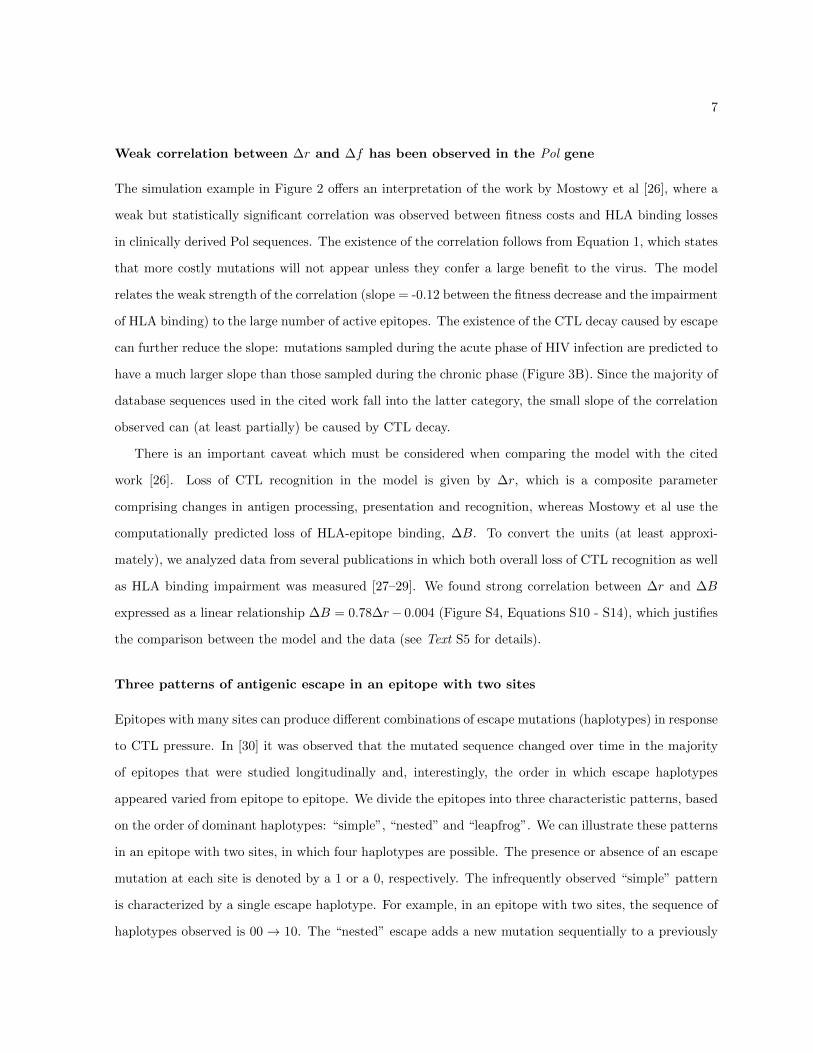
7
Weak correlation between ∆r and ∆f has been observed in the Pol gene
The simulation example in Figure 2 offers an interpretation of the work by Mostowy et al [26], where a
weak but statistically significant correlation was observed between fitness costs and HLA binding losses
in clinically derived Pol sequences. The existence of the correlation follows from Equation 1, which states
that more costly mutations will not appear unless they confer a large benefit to the virus. The model
relates the weak strength of the correlation (slope = -0.12 between the fitness decrease and the impairment
of HLA binding) to the large number of active epitopes. The existence of the CTL decay caused by escape
can further reduce the slope: mutations sampled during the acute phase of HIV infection are predicted to
have a much larger slope than those sampled during the chronic phase (Figure 3B). Since the majority of
database sequences used in the cited work fall into the latter category, the small slope of the correlation
observed can (at least partially) be caused by CTL decay.
There is an important caveat which must be considered when comparing the model with the cited
work [26]. Loss of CTL recognition in the model is given by ∆r, which is a composite parameter
comprising changes in antigen processing, presentation and recognition, whereas Mostowy et al use the
computationally predicted loss of HLA-epitope binding, ∆B. To convert the units (at least approxi-
mately), we analyzed data from several publications in which both overall loss of CTL recognition as well
as HLA binding impairment was measured [27–29]. We found strong correlation between ∆r and ∆B
expressed as a linear relationship ∆B = 0.78∆r− 0.004 (Figure S4, Equations S10 - S14), which justifies
the comparison between the model and the data (see Text S5 for details).
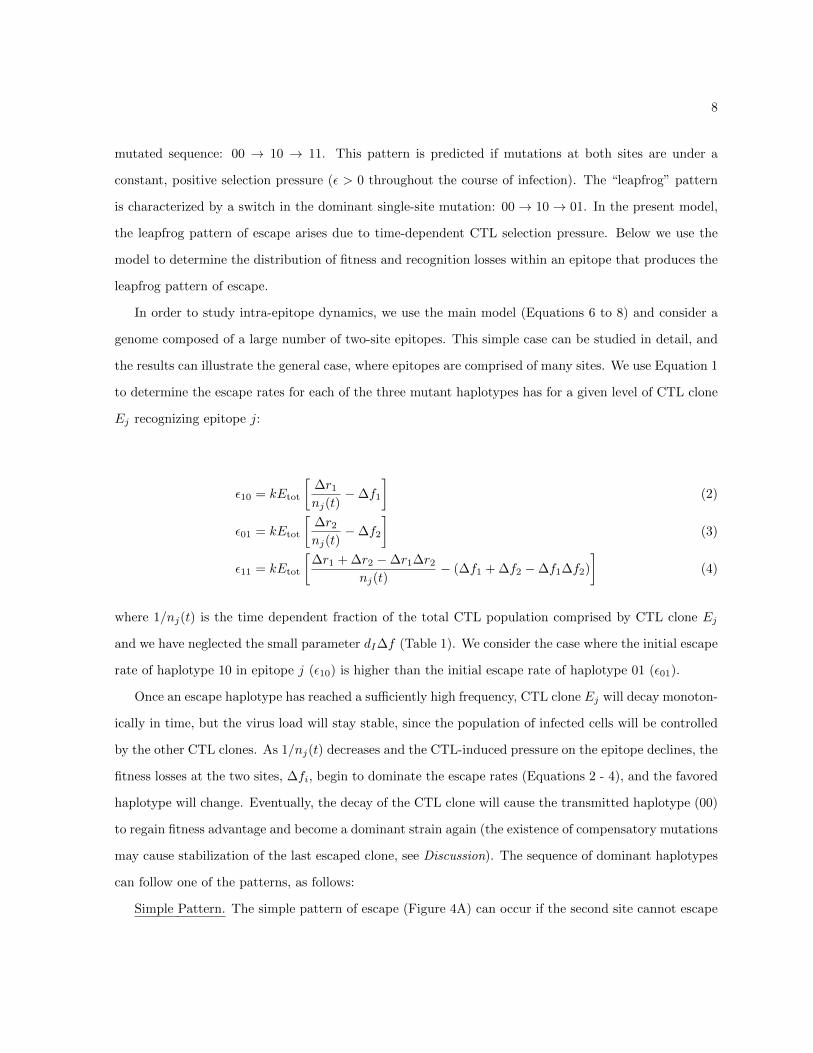
Three patterns of antigenic escape in an epitope with two sites
Epitopes with many sites can produce different combinations of escape mutations (haplotypes) in response
to CTL pressure. In [30] it was observed that the mutated sequence changed over time in the majority
of epitopes that were studied longitudinally and, interestingly, the order in which escape haplotypes
appeared varied from epitope to epitope. We divide the epitopes into three characteristic patterns, based
on the order of dominant haplotypes: “simple”, “nested” and “leapfrog”. We can illustrate these patterns
in an epitope with two sites, in which four haplotypes are possible. The presence or absence of an escape
mutation at each site is denoted by a 1 or a 0, respectively. The infrequently observed “simple” pattern
is characterized by a single escape haplotype. For example, in an epitope with two sites, the sequence of
haplotypes observed is 00 → 10. The “nested” escape adds a new mutation sequentially to a previously
8
mutated sequence: 00 → 10 → 11. This pattern is predicted if mutations at both sites are under a
constant, positive selection pressure (� > 0 throughout the course of infection). The “leapfrog” pattern
is characterized by a switch in the dominant single-site mutation: 00 → 10 → 01. In the present model,
the leapfrog pattern of escape arises due to time-dependent CTL selection pressure. Below we use the
model to determine the distribution of fitness and recognition losses within an epitope that produces the
leapfrog pattern of escape.
In order to study intra-epitope dynamics, we use the main model (Equations 6 to 8) and consider a
genome composed of a large number of two-site epitopes. This simple case can be studied in detail, and
the results can illustrate the general case, where epitopes are comprised of many sites. We use Equation 1
to determine the escape rates for each of the three mutant haplotypes has for a given level of CTL clone
Ej recognizing epitope j:
�10 = kEtot
�∆r1nj(t)
−∆f1
�(2)
�01 = kEtot
�∆r2nj(t)
−∆f2
�(3)
�11 = kEtot
�∆r1 +∆r2 −∆r1∆r2
nj(t)− (∆f1 +∆f2 −∆f1∆f2)
�(4)
where 1/nj(t) is the time dependent fraction of the total CTL population comprised by CTL clone Ej
and we have neglected the small parameter dI∆f (Table 1). We consider the case where the initial escape
rate of haplotype 10 in epitope j (�10) is higher than the initial escape rate of haplotype 01 (�01).
Once an escape haplotype has reached a sufficiently high frequency, CTL clone Ej will decay monoton-
ically in time, but the virus load will stay stable, since the population of infected cells will be controlled
by the other CTL clones. As 1/nj(t) decreases and the CTL-induced pressure on the epitope declines, the
fitness losses at the two sites, ∆fi, begin to dominate the escape rates (Equations 2 - 4), and the favored
haplotype will change. Eventually, the decay of the CTL clone will cause the transmitted haplotype (00)
to regain fitness advantage and become a dominant strain again (the existence of compensatory mutations
may cause stabilization of the last escaped clone, see Discussion). The sequence of dominant haplotypes
can follow one of the patterns, as follows:
Simple Pattern. The simple pattern of escape (Figure 4A) can occur if the second site cannot escape
9
(�01 < 0, Equation 3). It can also occur if the second site is weakly advantageous, yet the double mutant
(11) does not have time to grow to appreciable frequency before the transmitted haplotype (00) regains
the advantage in growth rate. Observation of this pattern implies a large difference in the fitness costs
and/or recognition loss magnitudes between the two sites in an epitope.
Leapfrog Pattern. The leapfrog pattern can occur if haplotype 01 gains the advantage over 10 before
the 10 loses the advantage over 00 (Figure 4C and D). In order for this to occur, site 1 must have both
a greater fitness and a greater recognition loss than site 2:
∆r1 > ∆r2,∆f1 > ∆f2 (5)
CTL to the escaping epitope decays at a faster rate during the time period when variant 10 dominates
the population than than during the period when 01 dominates the population. The difference is due
to the relatively higher recognition loss of the mutation at the first site (inset Figure 4D). The exact
conditions required for this pattern are given in Text S3.
Nested Pattern. When both single-mutant haplotypes continue to have a positive growth rate through-
out the course of infection, as in the case of constant selection pressure, the double-mutant haplotype
has the highest escape rate (Figure 4E, F). The nested pattern may occur if the escape rates of both
single-mutant haplotypes are similar (�10 ∼ �01).
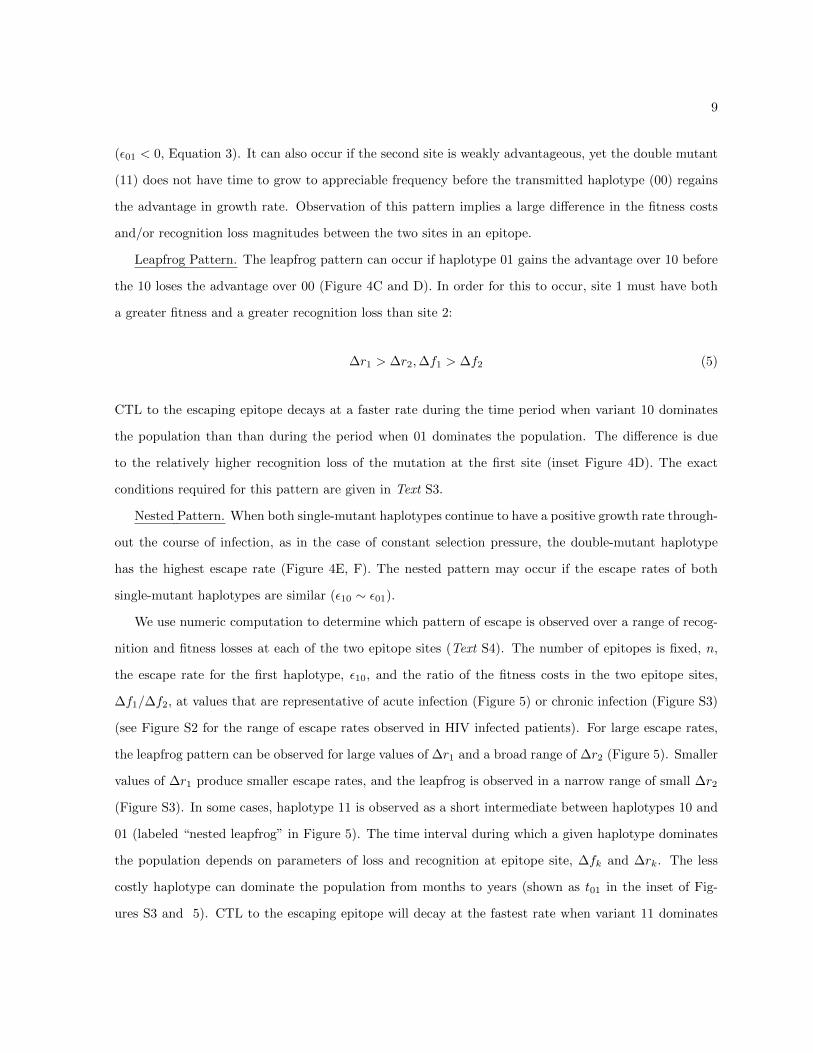
We use numeric computation to determine which pattern of escape is observed over a range of recog-
nition and fitness losses at each of the two epitope sites (Text S4). The number of epitopes is fixed, n,
the escape rate for the first haplotype, �10, and the ratio of the fitness costs in the two epitope sites,
∆f1/∆f2, at values that are representative of acute infection (Figure 5) or chronic infection (Figure S3)
(see Figure S2 for the range of escape rates observed in HIV infected patients). For large escape rates,
the leapfrog pattern can be observed for large values of ∆r1 and a broad range of ∆r2 (Figure 5). Smaller
values of ∆r1 produce smaller escape rates, and the leapfrog is observed in a narrow range of small ∆r2
(Figure S3). In some cases, haplotype 11 is observed as a short intermediate between haplotypes 10 and
01 (labeled “nested leapfrog” in Figure 5). The time interval during which a given haplotype dominates
the population depends on parameters of loss and recognition at epitope site, ∆fk and ∆rk. The less
costly haplotype can dominate the population from months to years (shown as t01 in the inset of Fig-
ures S3 and 5). CTL to the escaping epitope will decay at the fastest rate when variant 11 dominates
10
the population (inset of Figure 4F).
Model
Model of HIV Dynamics
We model SIV/HIV evolution in the presence of multiple CTL clones (Figure 1A). Each CTL clone
recognizes a distinct viral epitope that is presented by an infected cell. Mutations occur in the proviral
genomes of infected cell that allow an infected cell to partially evade CTL recognition, but come at a cost
in terms of viral replication. The model is given by the following equations:
dT
dt= λ− dTT − βT
�
i
fiIi (6)
dIidt
= βTfiIi − dIIi − κIi�
j
rijEj (7)
dEj
dt= σ + cEj
�
i
rijIihj +
�i rijIi
− dEEj (8)
where fi and rij are the relative viral replication rate of viral genome i and the relative CTL recognition
of sequence i by clone j, as compared to the transmitted sequence, respectively:
fi ≡ exp
−�
j,k
sjkaijk
(9)
rij ≡ exp
�−�
k
αjkaijk
�(10)
The processes described are, as follows. Target cells (T ) are replenished at a rate λ cells per day, die
with a rate dT and are infected by virus at a rate that depends on the fitness on the infecting strain, with
maximum rate per cell β, and the number of productively infected cells (Ii) in the system. We consider
n epitopes, each consists of m amino acid positions (sites), giving a total of 2mn possible strains. An cell
infected is labeled by proviral genome i with n epitopes denoted gi = ei1, ei2, ..., e
in, where each epitope,
eij , has m sites aij1, aij2, ..., a
ijm, and a ∈ 0, 1 indicates the presence or absence of a mutation at an epitope
site. The fitness of genome i is reduced by mutations. A mutation in epitope j at site k contributes cost
11
sjk to the logarithm of the reduction in replication rate. The strain with all 0 is the transmitted strain,
which has fitness 1.
Effector CTL (Ej) are replenished with a constant rate σ cells per day, divide with a rate dependent
on the number of infected cells that they recognize and their avidity, 1/hj , with maximum rate c, and die
with rate dE . CTL clones each respond to a distinct viral epitope that is presented by an infected cell and
kill infected cells at a maximum rate κ. The recognition ability of the CTL clone to epitope j in strain i is
reduced by mutations, as given by Equation 10. A mutation in epitope j at site k contributes αjk to the
logarithm reduction in CTL recognition. In the present work, we assume CTL of equal avidities, hj ≡ h.
Throughout the text, we describe the relative loss in fitness and recognition due to escape mutations in
terms of notation ∆rij ≡ 1− rij and ∆fi ≡ 1− fi.
Mutations are generated randomly with rate µ = 3 · 10−5 per site per generation of infected cells (i.e.,
the average lifespan of an infected cell, 1/dI) between strains that differ by one site. Strains with average
copy number above one infected cell are simulated deterministically according to the above equations;
below this threshold a strain is considered extinct. The basic model with one escape-conferring site per
epitope (m = 1) has been introduced by Althaus and De Boer [14]. In this work, we adapt the model
to focus on the effect of partial recognition and fitness losses during a narrow time interval after acute
infection (see Discussion for a detailed comparison of the two models). Further information on model
parameters and the estimated range of parameter values are listed in Table 1.
Following the original work [14], the model assumes that the majority of infected cells are killed by
CTL rather than by viral cytopathicity. It has also been proposed that CTL decrease the viral production
in infected cells in a non-lytic fashion, and that cells die within a fixed period of time (∼ 24h) due to viral
cytopathicity [33]. A specific choice of the mechanism of infected cell death (CTL or viral cytopathicity)
is not likely to affect the main conclusions about the dynamics of CTL escape. Furthermore, due to the
existence of the eclipse phase of viral production, it is difficult to distinguish between these mechanisms
using data from in vivo studies [34, 35]. Thus, we prefer to use the CTL-induced death model, which is
simpler to implement and easier to support immunologically.
Simplified model to study the order of escape mutations
We introduce a simplified model, which does not explicitly consider dynamics, in order to study the
sequence of escape mutations for a realistic size genome. Fractional fitness costs (∆f) and recognition
12
losses (∆r) are randomly generated from a uniform distribution [0, 1] for 100 sites (10 epitopes with
10 sites per epitope) in order to study the sequence of escaped sites. All sites are ranked in order of
∆r −∆f · n and escape sites in similar ranking over many runs are considered together. CTL decay is
introduced for all additional sites in an epitope once a site in the epitope escapes: after each round of
escape, ∆r is reduced for all sites in the epitope by: ∆r(n + 1) = ∆r(n) exp[−d�E�
i ∆ri(0)] for all i in
the epitope that have escaped. Here parameter d�E is defined as the decay rate per escape, in contrast to
dE in the main model which is defined per day.
Discussion
The recent availability of time-resolved, deep-sequencing data from HIV infected patients have illuminated
the complexity of interaction between CTL clones and the genetically diverse HIV population. Using a
model including multiple CTL clones, we demonstrate that the rate of viral escape depends on both the
partial recognition losses and fitness costs associated with an escape mutation as well as the number of
active CTL clones. Furthermore, the model predicts that CTL populations change their relative sizes
in response to viral escape, which has observable consequences for the sequence and number of escape
mutations that are possible over time. Changing selection pressure on an epitope due to declining CTL
levels can also cause the dominant escape variant in an epitope to change in a non-nested fashion. The
model contains several assumptions and simplifications, as follows.
Pre-existing mutations. We assume that the population of infected cells in acute infection and steady
state is large, so that all single escape mutants exist in the population before the rise of CTL (as in [14,15]).
The assumption is supported by estimates of the large effective HIV population size [4,36,37]. We can also
infer the fact of preexistence of CTL escape mutations from the observed preexistence of drug-resistant
mutations evident in the early emergence of resistance to mono-therapy (e.g. [38]). Furthermore, since
the number of escape mutations per epitope is typically larger than the number of drug resistance sites
per drug, the mutation cost of the least costly escape mutation can be assumed to be lower – and the
frequency of preexisting mutations higher – for escape mutations. The preexistence of single mutants
casts doubts on the interpretation of very late escape mutations as the result of the late appearance of
an escape mutation not initially present in the population [39].
13
Eventual reversion to the wild type is prevented by compensatory mutations. Mutations compensating
for fitness losses are widely spread in HIV genome [43], including drug-resistance mutations [40–42] and
immune-escape mutations [10, 19, 20]. They have been hypothesized to be a major driving force of HIV
evolution and high diversity [44]. However, the dynamics of compensation remains poorly understood.
Therefore, our model does not explicitly include compensatory mutations and, as a result, predicts
the eventual reversion of any escape mutation with a fitness cost. Instead of including compensation,
we calculate the period of time that a given mutation would be maintained in the population before
reversion occurs, which is the same time interval where compensation would be necessary in order to
prevent reversion (inset of Figures 5 and S3). When the non-nested pattern of escape is observed in
infected patients, the first escape variant is typically short-lived compared to the second escape variant,
and the transmitted variant is not observed after the initial escape [11,30,31]. Our interpretation is that
the fitness cost of the first variant is large relative to the second variant and does not have time to be
compensated before the second variant gains the advantage. The second variant either has a very small
fitness cost or is compensated gradually during its lifetime (compensation is not explicitly simulated). Our
calculation of the lifetimes of different escape variants in an epitope is a first step towards understanding
the timescales associated with compensation.
Multiple CTL clones of equal avidity. The present analysis is focused on the first year post-infection,
the time interval in which most escape mutations occur. Therefore, we consider a group of CTL clones
with similar avidities that are present initially in similar numbers. This is a reasonable assumption after
escape mutations have occured in the first few immunodominant epitopes during the resolution of acute
viremia. At this time, a large number of CTL clones are activated and are maintained for many months
at simular levels [6, 45]. Once all CTL clones are activated, our model predicts that the steady state
viral load is proportional to the inverse avidity of the most avid CTL clone (Equation S2). Kadolsky
and Asquith [46] estimated that the average viral load increases by only 0.051 log copies/ml per CTL
escape. This small increase, which we interpret to be the average difference avidity spacing between CTL
clones, justifies our assumption that CTL avidities are, indeed, very closely spaced. Our analysis shows
that, given closely spaced avidities, it is recognition and fitness losses that govern the order and timing
of escape mutations, rather than variation in CTL avidity.
Other assumptions. The model includes additional simplifying assumptions, as follows. i) The pro-
liferation rate of CTL clones saturates with the infected cell number, but not with the total CTL level.
14
In the original model [14], the authors postulate this saturation to predict that the total number of CTL
limits the growth of individual CTL clones, which causes clones to interact and enables the co-existence
of multiple CTL clones with different avidities. We believe that further study is needed to verify the
existence and the possible origin of the interclonal interaction. (Note that the target availability may
not be the cause of interclonal interaction, because most CTL are not bound to their targets even at the
peak of infection, and the overall effector to target ratio is less than two [47].) ii) CTL are short-lived
in the absence of antigen, with an average lifetime of 10 days, as is consistent with early studies of CTL
dynamics in SIV system [48, 49] and mathematical modeling of these data [50]. iii) We ignore recombi-
nation, which may increase the rate of emergence of escape mutations among different epitopes [15] as
well as the long term rate of evolution [51, 52]. For the intra-epitope dynamics of escape, recombination
between neighboring sites will be a small correction. (iv) CTL clones against escape mutants are not
included in the model. By including partial rather than full recognition loss, we allow CTL to escaped
epitopes to continue to exert selection pressure without incorporating additional CTL clones. Though
clones to escape mutants may exist, introducing extra CTL clones (5 clones for each two-site epitope,
instead of 1) would complicate analysis of the model without changing the essential results. (v) Small
fitness costs are assumed. Equation 1 states that costly escapes ∆f ∼ 1 cannot arise when recognition
losses are partial and many CTL clones target the viral genome. We choose to focus on the time interval
corresponding to the first year after the resolution of acute infection when these assumptions are fulfilled.
Escape mutations entailing a high fitness cost can only escape when only one or two CTL clones dominate
strongly, which we estimate from previous data to be during the 3-4 weeks post-infection. (vi) Fitness
costs are positive. A fraction of mutations that are transmitted to an individual that fall outside the
individuals HLA-restricted epitopes revert (i.e. may have a negative fitness cost). However, the rate of
reversion is very small [17] and hardly interferes with a faster dynamics of the within-epitope mutations.
(vii) We consider escape processes in different epitopes separately, because typically they do not overlap
much in time. In general, however, linkage effects (clonal interference, background selection) between
epitope mutations and compensatory mutations of same or different epitopes may complicate the picture
(see [32] for review of recent research in this area).
Thus, our model has demonstrated that partial recognition losses, in addition to fitness costs and
the breadth of the CTL response, dramatically affect the rate and the order of escape mutations during
an HIV infection. These findings help to interpret the positive correlation between fitness costs and
15
recognition losses observed in the Pol gene [26] and make the testable prediction that the strength of
the correlation should decrease with the time post-infection. Our results call for direct measurements
of recognition losses for different escape mutations. Combined with the proposed trajectory approach
(Figure 2), these data will serve as a basis for improved prediction of conserved epitopes for use in
vaccines.
Acknowledgments
We thank Todd Allen, Christian Boutwell, John Coffin, Richard Neher, Damien Tully, Alan Perelson,
and Leor Weinberger for helpful comments and discussion.
References
1. Schmitz JE (1999) Control of Viremia in Simian Immunodeficiency Virus Infection by CD8+
Lymphocytes. Science 283: 857–860.
2. Jin X, Bauer D, Tuttleton S, Lewin S, Gettie A, et al. (1999) Dramatic rise in plasma viremia
after CD8+ T cell depletion in simian immunodeficiency virus–infected macaques. The Journal of
experimental medicine 189: 991.
3. Finlay BB, McFadden G (2006) Anti-Immunology: Evasion of the Host Immune System by Bac-
terial and Viral Pathogens. Cell 124: 767–782.
4. Rouzine IM, Coffin JM (1999) Linkage disequilibrium test implies a large effective population
number for HIV in vivo. Proceedings of the National Academy of Sciences of the United States of
America 96: 10758–10763.
5. Turnbull EL, Wong M, Wang S, Wei X, Jones NA, et al. (2009) Kinetics of Expansion of Epitope-
Specific T Cell Responses during Primary HIV-1 Infection. The Journal of Immunology 182:
7131–7145.
6. Karlsson AC, Iversen AKN, Chapman JM, de Oliviera T, Spotts G, et al. (2007) Sequential broad-
ening of CTL responses in early HIV-1 infection is associated with viral escape. PLoS ONE 2:
e225.
16
7. Liu MKP, Hawkins N, Ritchie AJ, Ganusov VV, Whale V, et al. (2012) Vertical T cell immun-
odominance and epitope entropy determine HIV-1 escape. Journal of Clinical Investigation .
8. Leslie A (2005) Transmission and accumulation of ctl escape variants drive negative associations
between hiv polymorphisms and hla. Journal of Experimental Medicine 201: 891–902.
9. Friedrich TC, Dodds EJ, Yant LJ, Vojnov L, Rudersdorf R, et al. (2004) Reversion of ctl escape–
variant immunodeficiency viruses in vivo. Nat Med 10: 275–281.
10. Troyer RM, McNevin J, Liu Y, Zhang SC, Krizan RW, et al. (2009) Variable Fitness Impact
of HIV-1 Escape Mutations to Cytotoxic T Lymphocyte (CTL) Response. PLoS Pathogens 5:
e1000365.
11. Liu Y, Mcnevin JP, Holte S, Mcelrath MJ, Mullins JI (2011) Dynamics of viral evolution and ctl
responses in hiv-1 infection. PLoS ONE 6: e15639.
12. Ganusov VV, Goonetilleke N, Liu MKP, Ferrari G, Shaw GM, et al. (2011) Fitness Costs and
Diversity of the Cytotoxic T Lymphocyte (CTL) Response Determine the Rate of CTL Escape
during Acute and Chronic Phases of HIV Infection. Journal of Virology 85: 10518–10528.
13. Henn MR, Boutwell CL, Charlebois P, Lennon NJ, Power KA, et al. (2012) Whole Genome Deep
Sequencing of HIV-1 Reveals the Impact of Early Minor Variants Upon Immune Recognition During
Acute Infection. PLoS Pathogens 8: e1002529.
14. Althaus CL, Boer RJD (2008) Dynamics of immune escape during hiv/siv infection. PLoS Com-
putational Biology 4: e1000103.
15. Mostowy R, Kouyos RD, Fouchet D, Bonhoeffer S (2011) The Role of Recombination for the
Coevolutionary Dynamics of HIV and the Immune Response. PLoS ONE 6: e16052.
16. van Deutekom HWM, Wijnker G, De Boer RJ (2013) The Rate of Immune Escape Vanishes When
Multiple Immune Responses Control a HIV Infection. The Journal of Immunology .
17. Kearney M, Maldarelli F, Shao W, Margolick JB, Daar ES, et al. (2009) Human Immunodeficiency
Virus Type 1 Population Genetics and Adaptation in Newly Infected Individuals. Journal of
Virology 83: 2715–2727.
17
18. Fryer HR, Frater J, Duda A, Roberts MG, Phillips RE, et al. (2010) Modelling the evolution and
spread of HIV immune escape mutants. PLoS Pathogens 6: e1001196.
19. Kelleher AD, Long C, Holmes EC, Allen RL, Wilson J, et al. (2001) Clustered mutations in
HIV-1 gag are consistently required for escape from HLA-B27-restricted cytotoxic T lymphocyte
responses. The Journal of experimental medicine 193: 375–386.
20. Crawford H, Matthews PC, Schaefer M, Carlson JM, Leslie A, et al. (2011) The Hypervariable HIV-
1 Capsid Protein Residues Comprise HLA-Driven CD8+ T-Cell Escape Mutations and Covarying
HLA-Independent Polymorphisms. Journal of Virology 85: 1384–1390.
21. Song H, Pavlicek JW, Cai F, Bhattacharya T, Li H (2012) Impact of immune escape mutations on
HIV-1 fitness in the context of the cognate transmitted/founder genome. . . . .
22. Boutwell CL, Carlson JM, Lin TH, Seese A, Power KA, et al. (2013) Frequent and variable
cytotoxic-T-lymphocyte escape-associated fitness costs in the human immunodeficiency virus type
1 subtype B Gag proteins. Journal of Virology 87: 3952–3965.
23. Liu Y, Mcnevin JP, Holte S, Mcelrath MJ, Mullins JI (2011) Dynamics of Viral Evolution and
CTL Responses in HIV-1 Infection. PLoS ONE 6: e15639.
24. Cale EM, Hraber P, Giorgi EE, Fischer W, Bhattacharya T, et al. (2011) Epitope-specific cd8+
t lymphocytes cross-recognize mutant simian immunodeficiency virus (siv) sequences but fail to
contain very early evolution and eventual fixation of epitope escape mutations during siv infection.
Journal of Virology 85: 3746–3757.
25. Ganusov VV, De Boer RJ (2005) Estimating Costs and Benefits of CTL Escape Mutations in
SIV/HIV Infection. PLoS Computational Biology preprint: e24.
26. Mostowy R, Kouyos RD, Hoof I, Hinkley T, Haddad M, et al. (2012) Estimating the fitness cost of
escape from HLA presentation in HIV-1 protease and reverse transcriptase. PLoS Computational
Biology 8: e1002525.
27. Schneidewind A, Brockman MA, Sidney J, Wang YE, Chen H, et al. (2008) Structural and Func-
tional Constraints Limit Options for Cytotoxic T-Lymphocyte Escape in the Immunodominant
HLA-B27-Restricted Epitope in Human Immunodeficiency Virus Type 1 Capsid. Journal of . . . .
18
28. Kawashima Y, Pfafferott K, Frater J, Matthews P, Payne R, et al. (2009) Adaptation of HIV-1 to
human leukocyte antigen class I. Nature 458: 641–645.
29. Matthews PC, Koyanagi M, Kloverpris HN, Harndahl M, Stryhn A, et al. (2012) Differential Clade-
Specific HLA-B*3501 Association with HIV-1 Disease Outcome Is Linked to Immunogenicity of a
Single Gag Epitope. Journal of Virology 86: 12643–12654.
30. Goonetilleke N, Liu MK, Salazar-Gonzalez JF, Ferrari G, Giorgi E, et al. (2009) The first t cell
response to transmitted/founder virus contributes to the control of acute viremia in hiv-1 infection.
Journal of Experimental Medicine 206: 1253–1272.
31. Fischer W, Ganusov VV, Giorgi EE, Hraber PT, Keele BF, et al. (2010) Transmission of Single
HIV-1 Genomes and Dynamics of Early Immune Escape Revealed by Ultra-Deep Sequencing. PLoS
ONE 5: e12303.
32. Rouzine IM, Weinberger LS (2013) The quantitative theory of within-host viral evolution. Journal
of Statistical Mechanics: Theory and Experiment 2013: P01009.
33. Elemans M, Basatena NKSA, Klatt NR, Gkekas C, Silvestri G, et al. (2011) Why Don’t CD8+
T Cells Reduce the Lifespan of SIV-Infected Cells In Vivo? PLoS Computational Biology 7:
e1002200.
34. Klenerman P, Phillips RE, Rinaldo CR, Wahl LM, Ogg G, et al. (1996) Cytotoxic T lymphocytes
and viral turnover in HIV type 1 infection. Proceedings of the National Academy of Sciences of
the United States of America 93: 15323–15328.
35. Rouzine IM, Sergeev RA, Glushtsov AI (2006) Two types of cytotoxic lymphocyte regulation
explain kinetics of immune response to human immunodeficiency virus. Proceedings of the National
Academy of Sciences 103: 666–671.
36. Kouyos RD, Althaus CL, Bonhoeffer S (2006) Stochastic or deterministic: what is the effective
population size of HIV-1? Trends in microbiology 14: 507–511.
37. Pennings P, Kryazhimskiy S, Wakeley J (2014) PLOS Genetics: Loss and Recovery of Genetic
Diversity in Adapting Populations of HIV. PLoS Genetics .
19
38. Richman DD, Havlir D, Corbeil J, Looney D, Ignacio C, et al. (1994) Nevirapine resistance mu-
tations of human immunodeficiency virus type 1 selected during therapy. Journal of Virology 68:
1660–1666.
39. Liu Y, Mullins JI, Mittler JE (2006) Waiting times for the appearance of cytotoxic T-lymphocyte
escape mutants in chronic HIV-1 infection. Virology 347: 140–146.
40. Quinones-Mateu ME, Arts EJ (2002) Fitness of drug resistant HIV-1: methodology and clinical
implications. Drug Resistance Updates 5: 224–233.
41. Bonhoeffer S (2004) Evidence for Positive Epistasis in HIV-1. Science 306: 1547–1550.
42. Hinkley T, Martins J, Chappey C, Haddad M, Stawiski E, et al. (2011) A systems analysis of
mutational effects in HIV-1 protease and reverse transcriptase. Nature Genetics 43: 487–489.
43. Poon AFY, Swenson LC, Dong WWY, Deng W, Kosakovsky Pond SL, et al. (2010) Phylogenetic
Analysis of Population-Based and Deep Sequencing Data to Identify Coevolving Sites in the nef
Gene of HIV-1. Molecular Biology and Evolution 27: 819–832.
44. Rouzine IM, Coffin JM (1999) Search for the mechanism of genetic variation in the pro gene of
human immunodeficiency virus. Journal of Virology 73: 8167–8178.
45. Turnbull EL, Wong M, Wang S, Wei X, Jones NA, et al. (2009) Kinetics of expansion of epitope-
specific t cell responses during primary hiv-1 infection. The Journal of Immunology 182: 7131–7145.
46. Kadolsky UD, Asquith B (2010) Quantifying the Impact of Human Immunodeficiency Virus-1
Escape From Cytotoxic T-Lymphocytes. PLoS Computational Biology 6: e1000981.
47. Haase AT (2011) Early Events in Sexual Transmission of HIV and SIV and Opportunities for
Interventions. Annual review of medicine 62: 127–139.
48. Ogg GS (1998) Quantitation of HIV-1-Specific Cytotoxic T Lymphocytes and Plasma Load of Viral
RNA. Science 279: 2103–2106.
49. Kuroda MJ, Schmitz JE, Charini W, Nickerson C, Lifton M, et al. (1999) Emergence of CTL
coincides with clearance of virus during primary simian immunodeficiency virus infection in rhesus
monkeys. Journal of immunology (Baltimore, Md : 1950) 162: 5127–5133.
20
50. Sergeev RA, Batorsky RE, Rouzine IM (2010) Model with two types of CTL regulation and ex-
periments on CTL dynamics. Journal of Theoretical Biology 263: 369–384.
51. Batorsky R, Kearney MF, Palmer SE, Maldarelli F, Rouzine IM, et al. (2011) Estimate of effective
recombination rate and average selection coefficient for HIV in chronic infection. Proceedings of
the National Academy of Sciences 108: 5661–5666.
52. Neher RA, Shraiman BI, Fisher DS (2010) Rate of Adaptation in Large Sexual Populations. Ge-
netics 184: 467–481.
53. Li Q, Duan L, Estes JD, Ma ZM, Rourke T, et al. (2005) Peak SIV replication in resting memory
CD4+ T cells depletes gut lamina propria CD4+ T cells. Nature 434: 1148–1152.
54. Kuroda MJ, Schmitz JE, Charini W, Nickerson C, Lifton M, et al. (1999) Emergence of CTL
coincides with clearance of virus during primary simian immunodeficiency virus infection in rhesus
monkeys. Journal of immunology (Baltimore, Md : 1950) 162: 5127–5133.
55. Ogg GS, Jin X, Bonhoeffer S, Moss P, Nowak MA, et al. (1999) Decay kinetics of human immunod-
eficiency virus-specific effector cytotoxic T lymphocytes after combination antiretroviral therapy.
Journal of Virology 73: 797–800.
56. Klatt NR, Shudo E, Ortiz AM, Engram JC, Paiardini M, et al. (2010) CD8+ lymphocytes con-
trol viral replication in SIVmac239-infected rhesus macaques without decreasing the lifespan of
productively infected cells. PLoS Pathogens 6: e1000747.
57. Tomiyama H, Fujiwara M, Oka S, Takiguchi M (2005) Cutting Edge: Epitope-dependent effect of
Nef-mediated HLA class I down-regulation on ability of HIV-1-specific CTLs to suppress HIV-1
replication. Journal of immunology (Baltimore, Md : 1950) 174: 36–40.
21
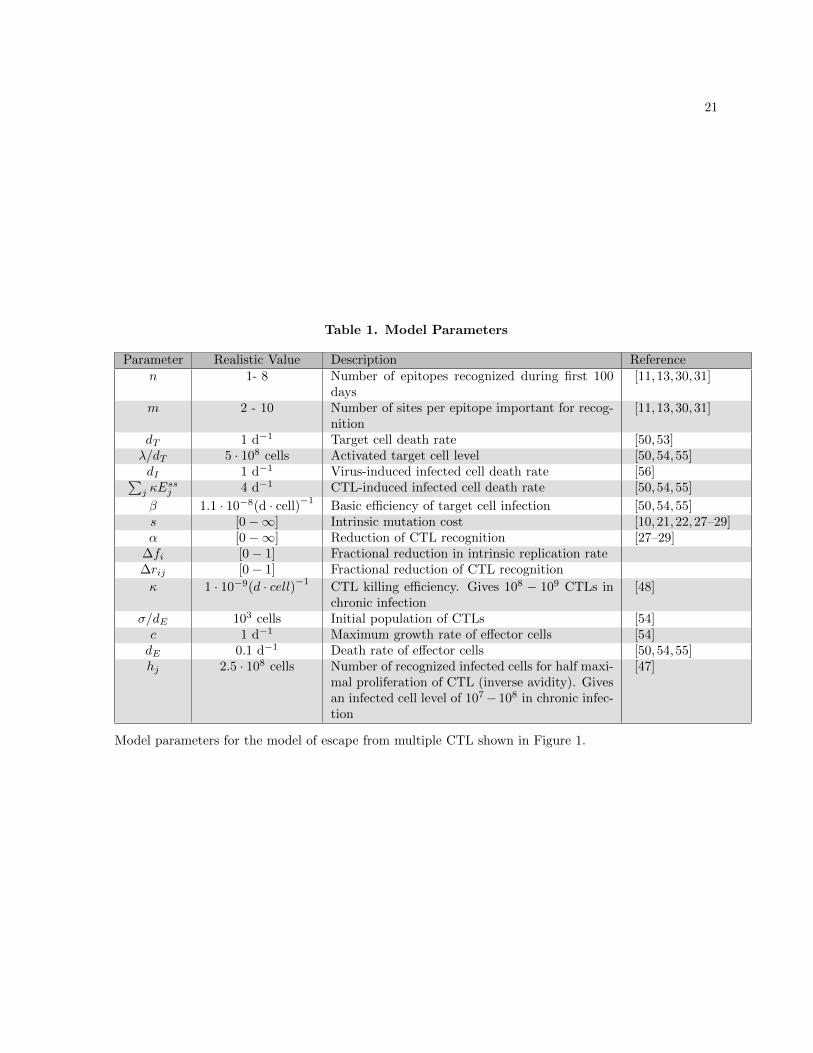
Table 1. Model Parameters
Parameter Realistic Value Description Referencen 1- 8 Number of epitopes recognized during first 100
days[11, 13,30,31]
m 2 - 10 Number of sites per epitope important for recog-nition
[11,13,30,31]
dT 1 d−1 Target cell death rate [50, 53]λ/dT 5 · 108 cells Activated target cell level [50, 54, 55]dI 1 d−1 Virus-induced infected cell death rate [56]�
j κEssj 4 d−1 CTL-induced infected cell death rate [50, 54,55]
β 1.1 · 10−8(d · cell)−1 Basic efficiency of target cell infection [50,54,55]s [0−∞] Intrinsic mutation cost [10, 21,22,27–29]α [0−∞] Reduction of CTL recognition [27–29]
∆fi [0− 1] Fractional reduction in intrinsic replication rate∆rij [0− 1] Fractional reduction of CTL recognitionκ 1 · 10−9(d · cell)−1 CTL killing efficiency. Gives 108 − 109 CTLs in
chronic infection[48]
σ/dE 103 cells Initial population of CTLs [54]c 1 d−1 Maximum growth rate of effector cells [54]dE 0.1 d−1 Death rate of effector cells [50, 54, 55]hj 2.5 · 108 cells Number of recognized infected cells for half maxi-
mal proliferation of CTL (inverse avidity). Givesan infected cell level of 107−108 in chronic infec-tion
[47]
Model parameters for the model of escape from multiple CTL shown in Figure 1.
31
Figure 1. A computational model of the interaction between HIV and multiple CTL
clones. (A) The model given by Equations 6 to 8 comprises three interacting cell compartments: targetcells (T), infected cells (I) and multiple CTL clones (E). Viral genomes contain multiple epitopes, whichcan mutate to partially abrogate CTL recognition. An escape mutation is denoted by an X. Each CTLclone recognizes a single viral epitope and is stimulated to divide at a rate proportional to the numberof infected cells with recognizable epitopes. The model is designed to study the rate of escape inepitopes when CTL pressure is distributed across multiple epitopes, as well as study intra-epitopeescape patterns when CTL respond dynamically to the infected cells that they recognize. Black arrows:flux of cells from one compartment to another. Blue arrows: dependence of the rate of flux from onecompartment on another. Dotted lines represent attenuation of the interaction strength. (B) Simulationexample showing three phases of HIV evolution. A single virus strain initiates the infection (transmittedstrain, black). In response to the growing number of infected cells, multiple CTL clones are activated(colored lines), and the system reaches a steady state. Finally, virus strains with escape mutations(dashed, colored lines) replace the transmitted strain. In response to lowered activation signals, someCTL clones decline. The escape strains are colored to match the CTL against which an escape wasmost recently acquired. Model parameters: number of epitopes, n = 6; number of sites per epitope,m = 1. Epitopes 1-3 have parameters that allow escape ∆ri = [0.1, 0.2, 0.3],∆f = 0.01, epitopes 4-6have parameters that prohibit escape, ∆fi = ∆ri = 0.1. Other parameters are listed in Table 1.
Figure 2. The escape trajectory in the cost-benefit plane bends over time due to CTL
decay. Fitness costs and recognition losses are randomly generated for 100 sites (10 epitopes with 10sites per epitope) in order to study the sequence of escaped sites (black line) in the whole genomewithout CTL decay (A,B) or with CTL decay (C,D) for 1000 simulation runs. (A) For each site thatescapes, the fractional fitness cost, ∆f , multiplied by the number of epitopes, n = 10, and fractionalrecognition loss, ∆r) (Equation 1 and Table 1) is shown. Colors show the predicted rank of escapemutations, from early escape mutations (blue) to late escape mutations (red). The average trajectoryover all runs (black) moves from high recognition loss, low fitness cost to low recognition loss, highfitness cost. Inset: The best-fit slope for each escape rank. A positive correlation is observed betweenthe fitness and recognition losses for all epitopes that escape at a given rank. (B) The maximum escaperate of any epitope site for all 10 epitopes for a representative simulation run. (C-D) As in (A-B),except including CTL decay. CTL decay is simulated by reducing recognition losses for all epitope sitesin epitopes that have partially escaped according to ∆r(n+ 1) = ∆r(n) exp[−d�E
�i ∆ri(0)], summing
over all i sites in the epitope that have escaped with d�E = 0.1 per escape . When CTLs decay inresponse to lost recognition caused by an escape in an epitope, the immune pressure and hence therecognition loss for all other sites in that epitope is decreased. The result is that the average trajectoryin the cost-benefit plane bends towards the horizontal axis.
32
Figure 3. Fitness loss and recognition losses of escape mutations are predicted to
correlated positively, with a slope that deceases in time. Sites are randomly sampled from thesimulation described in the caption to Figure 2 in order to simulate the effect of acute samples (highranking sites), late chronic samples (low ranking sites) or patient samples from random times (randomranks). (A) No CTL decay. The slope of the correlation from acute (blue) or late chronic (red) sampledescape mutations is the same, however, it is lower for escape mutations sampled at random times(green). (B) CTL decay causes the slope of the correlation to decrease in time, due to decrease of CTLselection pressure. CTL decay is introduced as described in the caption to Figure 2 and Model.
Figure 4. Dynamical selection pressure from CTLs causes three possible patterns of
intra-epitope escape: example for an epitope with two sites. Intra-epitope escape in oneepitope with two sites is studied for the model shown in Figure 1 and Model. The sequence in whichhaplotypes are selected depends on the distribution of fitness and recognition losses within an epitope.The fraction of the infected cell population containing each of the four haplotypes in the escapingepitope is shown in for “simple” (A), “leapfrog” (C) and “nested” pattern (E). For each pattern, thedependence of the escape rate (Equations 2 - 4) for each haplotype on the fraction of CTLs respondingto the epitope (B, D, F) . The inset shows CTL dynamics: the size of the CTL clone to escaping epitope(red) and the total CTL number (black). Parameters: (A,B) ∆r1k = [0.4, 0.1],∆f1k = [0.01, 0.01], (C,D)∆r1k = [0.6, 0.2],∆f1k = [0.1, 0.003], (E,F) ∆r1k = [0.4, 0.25],∆f1k = [0.003, 0.003] with n = 2, m = 2for all panels; other parameters are given in Table 1.
Figure 5. The pattern of emergence of escape variants in a single epitope contains
information about the fraction of recognition and fitness lost by single-site mutations in
the epitope. The pattern of escape (Figure 4) is obtained from simulation of the model (Figure 1,Equations 6 to 8) with two sites per epitope, m = 2 for a range of recognition and fitness losses. Thepattern that is obtained is plotted as a function of the parameters of recognition loss at the first andsecond site (∆r1 and ∆r2, respectively). Equations S6 (red line) and S9 (blue line) determine the regionwhere the leapfrog pattern can be observed. Regions that require ∆f1 < 0 are not allowed by definition(magenta line). The shaded regions between these three lines correspond to regions of parameter spacewhere both sites escape. The corresponding patterns are: “leapfrog” (10 → 01, Figure 4C), “nested”(10 → 11, Figure 4E), “nested leapfrog” (10 → 11 → 01). Observation of the leapfrog pattern in anepitope tightly constrains the fraction of CTL recognition loss conferred by sites in an epitope. Theinset shows the length of time during which haplotype 01 is dominant in the escaping epitope. Fixedparameters are: the escape rate of the first haplotype (�10 = 0.5) and the number of targeted epitopes(n = 3), values which correspond to escape mutations that occur in acute infection (see Figure S3 forparameters that correspond to later in infection). Fitness costs are chosen such that the second site isless costly than the first: ∆f1/∆f2 equal to 3 (A) or much less costly than the first, ∆f1/∆f2 = 10 (B).Other parameters given in Table 1.
33
Figure S1. Changing composition of CTL and infected cell populations. Simulation of modelgiven by Equations 6 to 8 with the same parameters as in Figure 1B. (A) Escape mutations in viralepitopes spread through the population of infected cells to abrogate CTL recognition. Once the systemhas reached steady state, the number of infected cells is roughly constant, and the prevalence of anescape mutation can be measured as a fraction of the total infected cell population. (B) Once an escapemutation has spread to the majority of infected cells, the corresponding CTL clone begins to decay witha rate proportional to the fraction of recognition lost. Since the total CTL population remains roughlyconstant in steady state, the prevalence of a given CTL clone can be shown as a fraction of the totalCTL population.
Figure S2. Escape rate and t50 are negatively correlated in two experimental studies. Thefrequency of a mutated epitope for epitopes over time is fit to the curve f(t) = {1 + exp[−�(t− t50)]}−1,which describes deterministic selection on a single site with selection coefficient �, in order to determineparameters � and t50. Colored dots show data from a single patient studied in [11] (blue) and multiplepatients studied in [30] CH40 (red), CH58 (green), CH77 (cyan). Inset: Simulation example showingthe correlation between escape rate, �, and the time that the mutation spreads to 50% of the populationof infected cells, denoted t50. Parameters � and t50 are found for the three escape mutations shown inFigure 1B that occur in the first 200 days post infection. Thus, variation in recognition and fitnesslosses across many epitopes successfully reproduces this feature of escape dynamics.
Figure S3. CTL lifetime changes the frequency with which intra-epitope escape patterns
are observed Here we show a modified version of Figure 5 for the case when CTL are long-lived,dE = 0.01 (other parameters are the same as Figure 5). When CTLs are long-lived, the leapfrog pattern(Figure 4C)) is observed more often, since the haplotype 01 has time to grow to dominate thepopulation. / Here, the death rate of CTL is dE = 0.01, ten times smaller than the value used inFigure 5. The difference between the predicted leapfrog region as determined by Equations S6 (red line)and S9 (blue line) and the shaded region where leapfrog is actually observed is lessened for long-livedCTL. This is the case because each time that haplotype 01 gains the advantage over haplotype 10, itgrows to dominate the population before CTL decay to the level where haplotype 01 also reverts.
Figure S4. Estimating the relationship between ∆r and ∆B approximately from three
published experiments. Our model contains one parameter for CTL recognition loss caused by amutation, ∆r. In order to compare model predictions with data from Mostowy et al [26], where HLAbinding impairment caused by mutations was considered rather than overall CTL recognition loss, wesought to compare HLA binding impairment with overall CTL recognition loss. By combine data fromthree references, Schneidewind et al [27], Kawashima et al [28] and Matthews et al [29], we were able todemonstrate a strong correlation between the two parameters. This justifies our comparison of ourmodel predictions with data from [26].
Text S1: Steady state and the escape rate
34
Text S2: Escape causes contraction of CTL clones
Text S3: General conditions for observing the leapfrog pattern of escape
Text S4: Simulation: Leapfrog pattern can occur in a broad range of fitness and
recognition losses
Text S5: Finding the relationship between ∆r and HLA binding loss from three different
experiments