Embed Size (px)
Citation preview

LUND UNIVERSITY
PO Box 117221 00 Lund+46 46-222 00 00
The Rotation Capacity of Plastic Hinges in Reinforced Concrete Beams : A TheoreticalStudy
Plem, Erik
1981
Link to publication
Citation for published version (APA):Plem, E. (1981). The Rotation Capacity of Plastic Hinges in Reinforced Concrete Beams : A Theoretical Study.(Report / Lund Institute of Technology, Lund, Sweden, Department of Structural Mechanics; Vol. R81-1). LundInstitute of Technology.
Total number of authors:1
General rightsUnless other specific re-use rights are stated the following general rights apply:Copyright and moral rights for the publications made accessible in the public portal are retained by the authorsand/or other copyright owners and it is a condition of accessing publications that users recognise and abide by thelegal requirements associated with these rights. • Users may download and print one copy of any publication from the public portal for the purpose of private studyor research. • You may not further distribute the material or use it for any profit-making activity or commercial gain • You may freely distribute the URL identifying the publication in the public portal
Read more about Creative commons licenses: https://creativecommons.org/licenses/Take down policyIf you believe that this document breaches copyright please contact us providing details, and we will removeaccess to the work immediately and investigate your claim.
LUND INSTITUTE OF TECHNOLOGY . LUND· SWEDENDEPARTMENT OF STRUCTURAL MECHANICSREPORT NO. R 81 -1
ERIK PLEM
THE ROTATION CAPACITY OF PLASTIC
HINGES IN REINFORCED CONCRETE BEAMS
- A THEORETICAL STUDY

THE ROTATION CAPACITY OF PLASTIC HINGES
IN REINFORCED CONCRETE BEAMS - A THEORETICAL STUDY
Erik Plem
Translated byL J Gruber, BSc(Eng), MICE, MIStructE
This translation relates to Research Grant No 770598-9 from the NationalSwedish Council for Building Research to the Department of StructuralMechanics and Concrete Construction, Lund Institute of Technology, Lund.

CONTENTS
SYMBOLS
INTRODUCTION
1.1 The limit state method of design1.2 Rotation requirement1.3 Rotation capacity1.4 The scope of the work
2. THE STRESS-STRAIN CURVES FOR STEEL AND CONCRETE
2.1 The stress-strain curve for concrete2.2 The stress-strain curve for reinforcing steel
3 THE DEPTH OF THE COMPRESSION ZONE
3.1 Calculation geometry3.2 Depth of the compression zone under elastic conditions3.3 Depth of the compression zone under elasto-plastic conditions
4 MOMENT-CURVATURE DIAGRAM
5 DEFORMATION ENERGY
6 ENERGY BALANCE
6.1 The external work6.2 The consumed deformation energy6.3 Energy balance
7 DEPENDENCE OF THE ROTATION CAPACITY ON THE SHAPES OF THESTRESS-STRAIN DIAGRAMS FOR THE STEEL AND CONCRETE
7.1 Different combinations of typical steels and concrete types
7.2 Deviations from the parameter values seleeted for the typicalsteels and the concrete types
8 CREEP OF THE CONCRETE
9 THE EFFECT OF COMPRESSION REINFORCEMENT
10 THE EFFECT OF SHEAR FORCE
1O. 1 Analytical model10.2 The length of the yield region10.3 Calculation results
11 THE EFFECT OF STIRRUPS
11.1 Phenomenological discussion11. 2 The tests of Mattock and Corley
12 DISCUSSION OF THE SAFETY ASPECT
13 OVERALL CONCLUSIONS
14 REFERENCES
APPENDIX
A.1 Calculation alternativesA.Z Procedure declarations associated with the main programA.3 The main programA.4 The complete program in ALGOL 60A.S Examples of printouts
SYMBOLS
Ac effective area of cross section
As cross sectional area of tension reinforcement
Ase cross sectional area of compression reinforcement
Asv cross sectional area of a bar in a stirrup
Ec initial modulus of elasticity of concrete for short-term loading
Es modulus of elasticity of reinforcing steel
El bending stiffness
Fe resultant force due to concrete stresses in the compression zone
Fs force in the tension reinforcement
Fsc force in the compression reinforcement
M bending moment
Mc reference moment
Mi bending moment at subdivision point No
Mm span moment
Mr moment which initiates eraeking
M ultimate momentu
My yield moment
Nc reference force
O point load
Ou ultimate load
Oy yield force
Vn shear force at subdivision point No n
Vy shear force at subdivision point No n at incipient plastic flow
at the plastic hinge
Vo shear force at subdivision point No o
We externa l work
Wi total consumed deformation energy
a moment shift
ai maximum elastic deflection at subdivision point No i
5
6
ananayaSOb
c
d
ecesfccfcck
fet
f scf stf stkf stuf sv
maximum elastic deflection at subdivision point No n
fictitious length of plastic hinge
length of yield region
length of plastic hinge over which the moment is greater than O.S Mu
width of beam
distance of compression reinforcement from compression face
effective depth of cross section
non-dimensional initial modulus of elasticity of concrete
non-dimensional modulus of elasticity of reinforcing steel
compressive strength of concrete
characteristic value of the compressive strength of concrete
tensile strength of concrete
compressive strength of compression reinforcement
tensile strength of tension reinforcement
characteristic value of the tensile strength of the reinforcement
maximum tensile strength of the reinforcement
tensile strength of stirrup reinforcement
span
lo length of rotation span
q distributed ultimate load
qy distributed yield load
r radius of curvature
r i radius of curvature at subdivision point No i
s spacing of stirrups
x depth of compression zone
xm depth of fictitious compression zone
Yc ordinate of the position of Fe
Yi ordinate of the centroid of strip No i
Ys ordinate of the centroid of tensile reinforcement
Ysc ordinate of the centroid of compression reinforcement
6Ac
6Q
ay
S
r
cross sectional area of a strip ln the compression zone
increment in Q
increment in deformation energy per unit length of beam
increment in mean strain in strip No i
increment in strain ln tensile reinforcement
increment in strain in compression reinforcement
6W in non-dimensional form
contribution of concrete to 6~
contribution of tensile reinforcement to 6~
contribution of compression reinforcement to 6~
Es/Ec
6Ac/Ac
a in non-dimensional form
ay in non-dimensional form
coefficient which determines the shape of the moment curve
non-dimensional dtstance of compression reinforcement from
compression face
7
re partial coefficient for concrete ln compression
Yr partial coefficient for rotation capacity
Ys partial coefficient for reinforcement in tension
6 non-di mens tonal bending stiffness
€ strain
Se strain in concrete
scu ultimate compressive strain in concrete
€cuk characteristic value of the ultimate compressive strain in concrete
si mean strain in concrete strip No i
So limit strain (strain at maximum stress)
Ss strain in tension reinforcement
ssc strain in compression reinforcement
8
ultimate strain in reinforeing steel
eharacteristic value of the ultimate strain in reinforcing steel
lower strain hardening limit of reinforcing steel
strain at limit of proportional ity for reinforcing steel
n
e
eeale
Bobs
er
eueuvK.
l
~.l
~u
~y
~1
~2
fstu/fst
non-dimensional ordinate of strip No i
Ys in non-dimensional form
Yse in non-dimensional form
rotation
calculated rotation capacity
observed rotation capacity
rotation requirement of a plastic hinge
rotation eapacity of a plastic hinge
rotation capacity calculated with shear force taken into consideration
non-dimensional deflection at subdivision point No i
non-dimensional deflection at subdivision point No n
slenderness of rotation span
bending moment in non-dimensional form
non-dimensional bending moment at subdivision point No i
ultimate moment in non-dimensional form
yield moment in non-dimensional form
moment variation in tension lone
moment variation in compression lone
v fsc/fst
c depth of compression lone in non-dimensional form
cm fictitious depth of compression lone in non-dimensional form
Co non-dimensional depth of eompression lone under elastic conditions
p non-dimensional radius of curvature
G stress
Ge stress in concrete at compression face
°ci
as
°sc
~
~e
~i
~
~c
~sc
~t
~1
~2
w
Wb
Wc
wcr
wfic
Wv
Wo
mean stress in strip No i
stress in tension reinforcement
stress in compression reinforcement
creep factor for concrete
external work in non-dimensional form
internal work of deformation in non-dimensional form
deformation energy per unit length of beam in non-dimensional form
contribution of concrete to ~
contribution of compression reinforcement to ~
contribution of compression zone to ~
deformation energy in tension zone per unit length of beams
deformation energy in compression zone per unit length of beam
effective reinforcement ratio for tension reinforcement
effective reinforcement ratio for balanced reinforcement
effective reinforcement ratio for compression reinforcement
critical value of W with respect to rotation capacity
fictitious value of w
effective reinforcement ratio for stirrups
esw/wc
9
Abbreviations
CEB Comite Euro-international du Beton
CW cold worked
HR hot rolled
PH plastic hinge

11
INTRODU cn ON
1.1 The limit state method of design
The loadbearing capacity of a statically indeterminate structure such as
a continous beam or a frame can be determined by means of the limit statemethod, based on the theory of plasticity, as follows.
If the construction material is assumed to possess ideal elasto-plastic pro
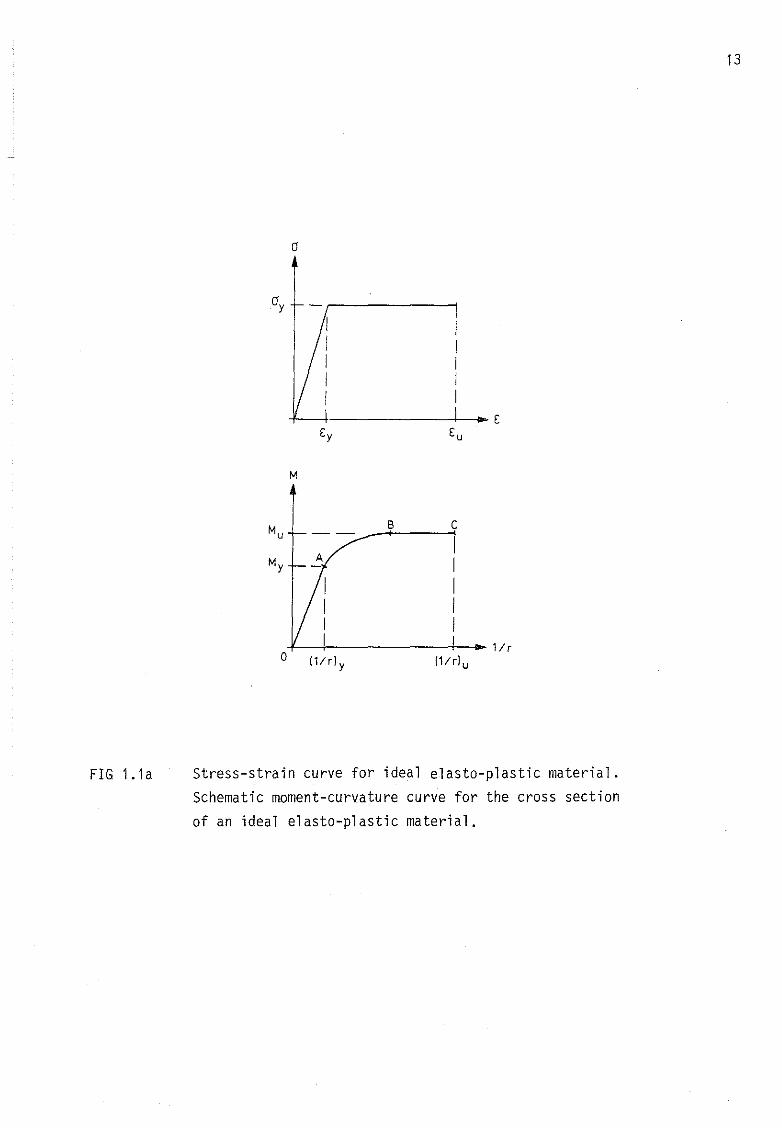
perties, with a stress-strain diagram according to FIG. 1.1a, it will reactin a purely elastic manner to externa l loads so long as the maximum stress
in the worst stressed section of the structure is less the n the yield stress
0y of the material. Over this loading range the moment-curvature relation ofthe section is represented by the straight line DA in the figure. If, as the
externa l load is increased, the yield stress 0y is reached, plastic flow
begins under the influence of the yield moment My' As the load is furtherincreased, plastic flow spreads out within the section until, at a certain
load level, the section is completely plastic. Sections situated adjacent to
that subjected to the highest stress are at the same time in a state of parti al
plastic flow. During the increase in moment while plastic flow spreads over
the most heavily stressed section, i.e. while the moment increased from My
to the ultimate moment Mu' the moment-curvature diagram of the section conforms to the portion AB in FIG. l.la. As the external load is further raised,
the moment in the section under consideration is constant and equal to Mu
while the curvature increases. During this stage of loading the moment-curvature diagram is represented by the straight line BC in the figure. Failure
of the material is assumed to occur when the curvature reaches the value (1/r)u
determined by attainment of the ultimate strain EU
of the material.
For purposes of simplification it is assumed in the following introductory
argument that the properties of the material and the sectional shape of the
beam element are such that an arbitrarily chosen section in the structure has
an ideal elasto-plastic moment-curvature diagram, i.e. that the length of the
portion AB of the curve is negligible. The diagram the n becomes bilinear.
The loads acting on the structure are assumed to be fixed in position in
relation to this and to increase continuously and proportionately from zero
until the value of the limiting load is reached. At a certain load level themost heavily stressed section of the structure will become completely plastic,
i.e. the moment in this section now reaches the maximum value, My=Mu' which
this section is capable of sustaining.
12
An initial plastic hinge will thus have been formed in the structure. Duringfurther increase in load the moment is constant and of known magnitude atthis plastic hinge, and the degree of static indeterminacy has thereforedecreased by one unit while load further increases from this load level.During the further increase in load, after same time another plastic hingewill be formed at same other point in the structure at a higher load level.The moment is now of known magnitude at this section also, and the degree ofstatic indeterminacy has decreased by another unit while load further rises.
As load is gradually increased, the degree of static indeterminacy thusdecreases as new plastic hinges are formed, and the structure will therefore,at a certain load level, change inta a statically determinate structurefor further increase in load. When, on further increase in load, one more
plastic hinge is formed, the structure finally changes inta a mechanismand collapse ensues.
The load which acts on the statically determinate structure immediately beforethe last plastic hinge is formed is thus a measure of the loadbearing capacityof the structure, its limiting or ultimate load.
As the load increases between two load levels at which two consecutive plastichinges are formed, there takes place, simultaneously with the increase inload, a plastic rotation at the already formed plastic hinges. In order there
fore that it should be possible for the load to be increased right up to thelimiting load determined by behaviour of the structure as a mechanism, it isessential that the necessary plastic rotation can take place at the plastichinges without material failure at these points.
The process described above can be illustrated by means of a worked example.
Let us study a beam of the configuration and loading shown in FIG. 1.1b.It is assumed that this beam has ideal elasto-plastic properties at every
section in conformity with the moment-curvature diagram shown in the figure.The ultimate moment Mu of the beam is then assumed to be the same for bothpositive and negative bending moments, and the symbol Mu therefore refersto the absolute value of the moment.
The structure is statically indeterminate in the first degree, and the formation of an initial plastic hinge therefore makes the structure staticallydeterminate for further increase in load. When a second plastic hinge isformed the structure changes inta a mechanism in response to attainment ofthe collapse load.
13
Cy Cu
M
Mu B C--
My A-
(1/rl u(11 r) y+-~I--------I--- lir
O
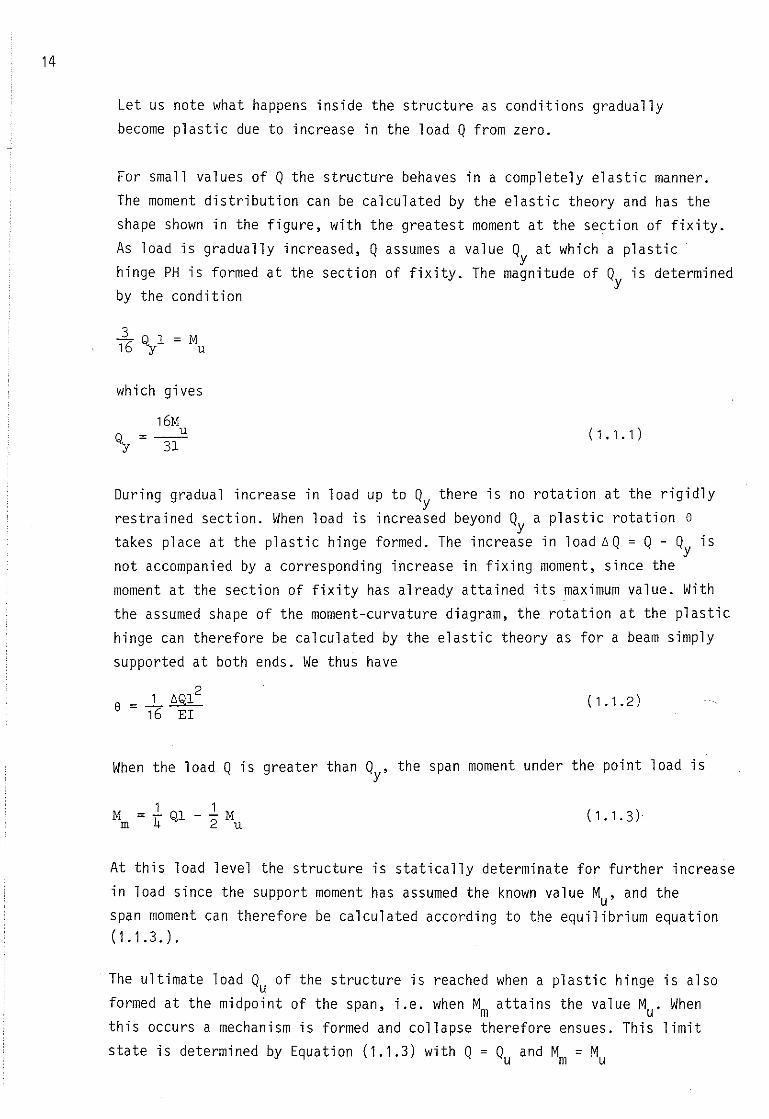
FIG lo1a Stress-strain curve for ideal elasto-plastic material.Schematic moment-curvature curve for the cross section
of an ideal elasto-plastic material.
14
Let us note what happens inside the structure as conditions gradually
become plastic due to increase in the load O from zero.
For small values of O the structure behaves in a completely elastic manner.
The moment distribution can be calculated by the elastic theory and has the
shape shown in the figure, with the greatest moment at the section of fixity.
As load is gradually increased, O assumes a value O at which a plasticy
hinge PH is formed at the section of fixity. The magnitude of O is determinedy
by the condition
which gives
(1.1.1)
(1.1.2)
During gradual increase in load up to Oy there is no rotation at the rigidly
restrained section. When load is increased beyond Oy a plastic rotation e
takes place at the plastic hinge formed. The increase in load ~O = O - Oy is
not accompanied by a corresponding increase in fixing moment, since the
moment at the section of fixity has already attained its maximum value. With
the assumed shape of the moment-curvature diagram, the rotation at the plastic
hinge can therefore be calculated by the elastic theoryas for a beam simply
supported at both ends. We thus have
__1 ~Q12e - 16 Er
When the load O is greater than O , the span moment under the point load isy
At this load level the structure is statically determinate for further increase
in load since the support moment has assumed the known value Mu' and the
span moment can therefore be calculated according to the equilibrium equation(1.1.3.).
The ultimate load Ou of the structure is reached when a plastic hinge is alsoformed at the midpoint of the span, i.e. when M attains the value M . Whenm uthis occurs a mechanism is formed and collapse therefore ensues. This limit
state is determined by Equation (1.1.3) with O = Ou and Mm = Mu
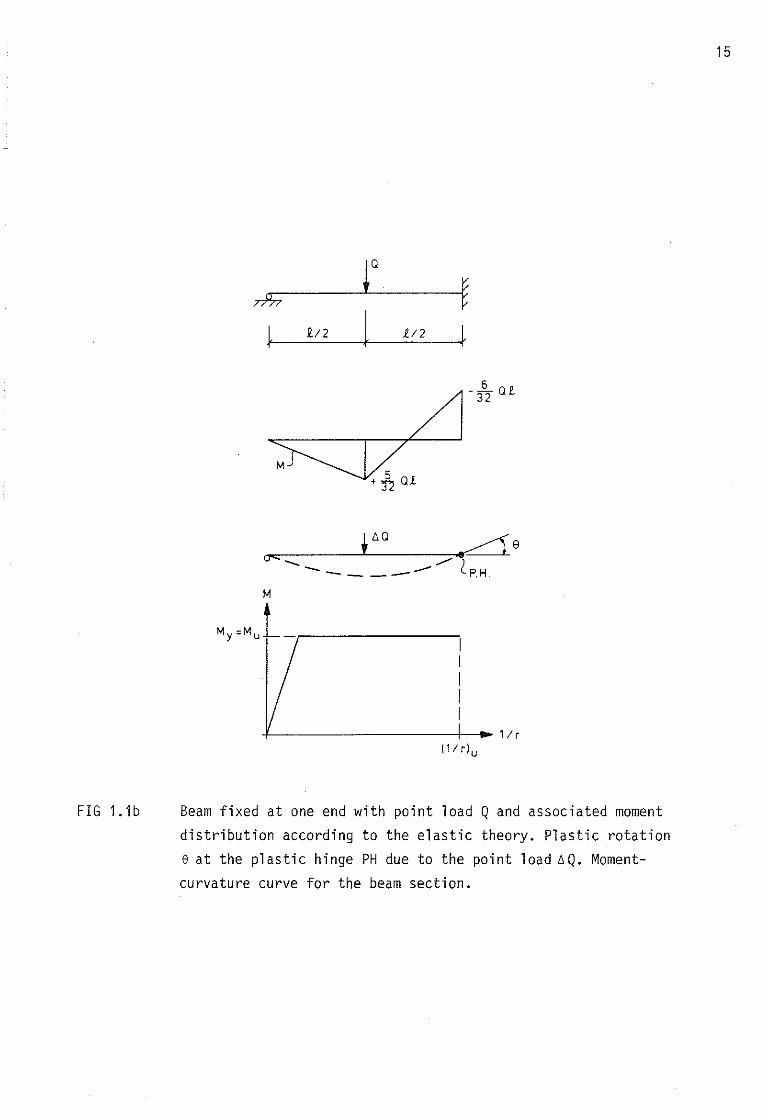
FIG 1.1b
r~~
j, 'v2 t V2 }
6-rr Q [
+ :f2 Q[
--,- t_6 _Q
__""",",,d_...L 8
o< -- ....,.., ..1.--- -- PH
M
+--------------+---11.. 1/r(1 I rl u
Beam fixed at one end with point load Q and associated moment
distribution according to the elastic theory. Plastic rotatione at the plastic hinge PH due to the point load lIQ. Momentcurvature curve for the beam section.
15
16
which gives
6MuQ =
u l(1.1.4)
(1.1.5)
After the first plastic hinge has been formed at the section of fixity, theload can therefore be further increased by
6M 16M 2M Q= ---"l _ __u_ = ---"l = -.X..
l 31 31 8llQ = Q -Q
u y
before the structure collapses.
During increase in the load from Qy to Qu there takes place a plastic rotationabout the plastic hinge at the section of fixity, which can be calculatedusing Equations (1.1.2) and (1.1.5).
(1.1.6)
The plastic rotation calculated from (1.1.6) is that required in order that
a beam mechanism may be formed at the ultimate load Qu' If material failureoccurs owing to excessive material strain in the first plastic hinge before
the load Q reaches the value Qu' the actual ultimate load is less than Quand the ultimate load determined by the limit state method is therefore toohigh. We can thus say that the plastic hinge has a rotation requirement Brwhich, in the case studied, is calculated from Equation (1.1.6). This rotationrequirement must be compared with the ability of the plastic hinge to rotatein a plastic manner without consequent material failure, i.e. without attainment of the ultimate curvature (1/r)u in FIG. 1.1b. This ability is denotedthe rotation capacity Bu of the plastic hinge.
One condition for the limit state method described above to be capable of usefor determination of the ultimate load of a structure is that the rotationrequirement should be no greater then the rotation capacity. The condition
e '" Br u(1.1.71
must therefore be satisfied for all plastic hinges in the statically determinatestructure which are needed to sustain the increase in load immediately prior toformation of the mechanism due to the limiting load.
17
For steel structures the condition (1.1.7) is generally satisfied. Apart fromextreme exeptional cases, there is therefore no need as a rule to pay muchattention to the rotation capacity of plastic hinges. The situation is diffenentin reinforced concrete structures where it has been found in experiments thatthe rotation capacity of plastic hinges in structures loaded to failure may beinsufficient to permit the redistribution of moments which a design accordingto the plastic theory assumes. It is therefore essential that it should be
possible to calculate, at the design stage, the rotation requirement androtation capacity for those plastic hinges which are assumed in design according to the limit state method.
It is evident from the above worked example that it is in pronciple easy tocalculate the rotation requirement of a plastic hinge. The rotation requirement will therefore be dealt with only in a summary manner in this report,and attention will instead be concentrated on an analysis of the rotation capa
city of plastic hinges in reinforced concrete structures.
1.2 Rotation requirement
The rotation requirement of plastic hinges in statically indeterminate beamstructures of reinforced concrete, acted upon by different external loads andimposed deformations, has been studied by Alemo (1976) and others. It appearsthat the rotation requirement of a plastic hinge can be given the general
form
(1.2.1)
i.e. the same form as in the above worked example - see Equation (1.1.6).
If any imposed deformations which may be present are ignored, then KO is acoefficient which is a function only of the configuration of the structureand the type and placing of the load. See also Plem (1973).
Mu is the ultimate moment of the plastic hinge under consideration, and canbe written
M = A f d(1 -~) (1.2.2)u s st 2
18
where
As ~
f st~
d ~
w ~
cross sectional area of reinforcement at the plastic hingetensile strength of tension reinforcementeffective depth of the section containing the plastic hingeeffective reinforcement ratio
A plastic hinge is often discontinous, for instance when it forms over anintermediate support in a continous beam. In such cases it is easiest tostudy rotation requirement and rotation capacity separately for each side.
The expression (1.2.1) refers to the rotation requirement on one side ofthe plastic hinge, and l is the length of the beam on the side beingconsidered.
El is the mean beam stiffness calculated for the concrete in Stage II, i.e.when it is cracked and elastic. The stiffness may be obtained from a diagramconstructed by Larsen &Vigerust (1966) in the form
El = A E d2~sm s
where
( 1.2.3)
A ~ a mean value over the length of the beam of the cross sectional areasmof the reinforcement, adapted in view of the moment distribution
Es ~ modulus of elasticity of the reinforcing steel~ ~ a function of ap where a ~ Es/Ec ' i.e. the ratio of the modulus of
elasticity of steel to that of concrete, and p is the geometrical
reinforcement ratio
If Asm is assumed to be proportional to As and Equations (1.2.2) and (1.2.3 )
are substituted into Equation (1.2.1), we have
(1.2.4)
According to the above equation, for a given reinforcement the rotationrequirement is directly proportional to the slenderness l/d of the beam. Ifthe ratio (1-w/2)/~ is studied for variable normal reinforcement ratios,
it is found that the rotation requirement er decreases for increasing valuesof w.
As will be seen from the example in Section 1.1, it is in principle easy tocalculate the rotation requirement of a plastic hinge. The calculation can be
carried out with the aid of information in the usual manuals or by means of
19
the energy equation. However, for structures of a high degree of static indeterminacy, such as multistorey frames, calculation can be laborious. For suchstructures, Baker (1956) developed a systematic calculation method which,when formulated in matrix notation, is suitable for computer programs.
Other factors, not studied in detail here, may affect the magnitude of therotation requirement. Brief comments on these are as follows.
Displacements of supports can, depending on the directions of the displacements, increase or decrease the rotation requirement.
Creep of the concrete is general ly dealt with in calculations by reducingthe modulus of elasticity of concrete. This increases the parameter ap,
and reduces C According to Equation (1.2.4), creep thus increases therotation requirement.
Depending on the geometrical design and reinforcement of the structure,shrinkage of the concrete may increase or decrease the rotation requirement.
Cracking of the concrete always reduces the rotation requirement. This iscommented on further in Section 1.3.
1.3 Rotation capacity
In principle, the rotation capacity of a plastic hinge in a reinforcedconcrete beam can be determined from the moment-curvature diagram ofthe beam section concerned. Such a diagram is shown to the right ot FIG. 1.3a,in which Mis the bending moment and 1/r the beam curvature. In the diagram
My is the moment at yield and Mu the ultimate moment. The figure in the centreillustrates a variation "b" in moment over the beam length lo between a plastichinge PH and the nearest point of zero moment. In the following, this sectionof the beam will be referred to as the rotation span of the plastic hinge.The variation "b" in moment may be considered to correspond to a uniformly
distributed load on a beam fixed at PH. On top of this diagram there isanother diagram which represents the variation in beam curvature along therotation span. It has been drawn up with the aid of the moment diagram andthe moment-curvature diagram.
A corresponding transformation of the beam curvature diagram by means of another
moment curve "a", which may be considered to correspond to the variation inmoment in the vicinity of a plastic hinge in the span in a beam subjected to
a uniformly distributed load, is shown to the left in the figure.
20
The rotation between the end cross sections of the portion lo of the beamis obtained as the integral of the curvature over the length lo' i.e. as thearea below the 1/r curve constructed. Part of this rotation is elastic andreversible, another part is plastic and irreversible. The latter has beenshaded in the figure and marked "B". According to the definition, this part
is the rotation capacity Bu of the plastic hinge. Traditionally, the rotationcapacity is regarded as though it were concentrated at the plastic hinge but,as will be seen, it is in real ity distributed over part of the length of therotation span. It is also evident from the figure that the magnitude of therotation capacity is dependent on the magnitude of the area "A" above theM-1/r diagram, and on the shape of the moment curve. Area "B" is larger atmoment curve "a" than at moment curve "b", which means that the rotation capacity in the former case is greater than in the latter case.
It will be evident from the above that the rotation capacity of a plastichinge in a given situation can be obtained by calculation of the area "B" inFIG. 1.3a. However, such an approach is not applied in the following,since in recent year interest has focussed on the study of the behaviour ofstructures under the action of extreme loads. Impact loads playa dominant partin this connection, and the effect of impact loads on a beam structure cannot
be studied without including the deformation energy of the structure in thecalculations. Calculation of the rotation capacity Bu in the following hastherefore been based on a study of the variation of energy in the part ofthe beam adjacent to a plastic hinge. In this way the calculation methoddevised attains such properties that it can relatively easily be further developed into a calculation method for analysis of statically indeterminate beams
subjected to impact loads. Such development has been planned, but has beendeferred until later work.
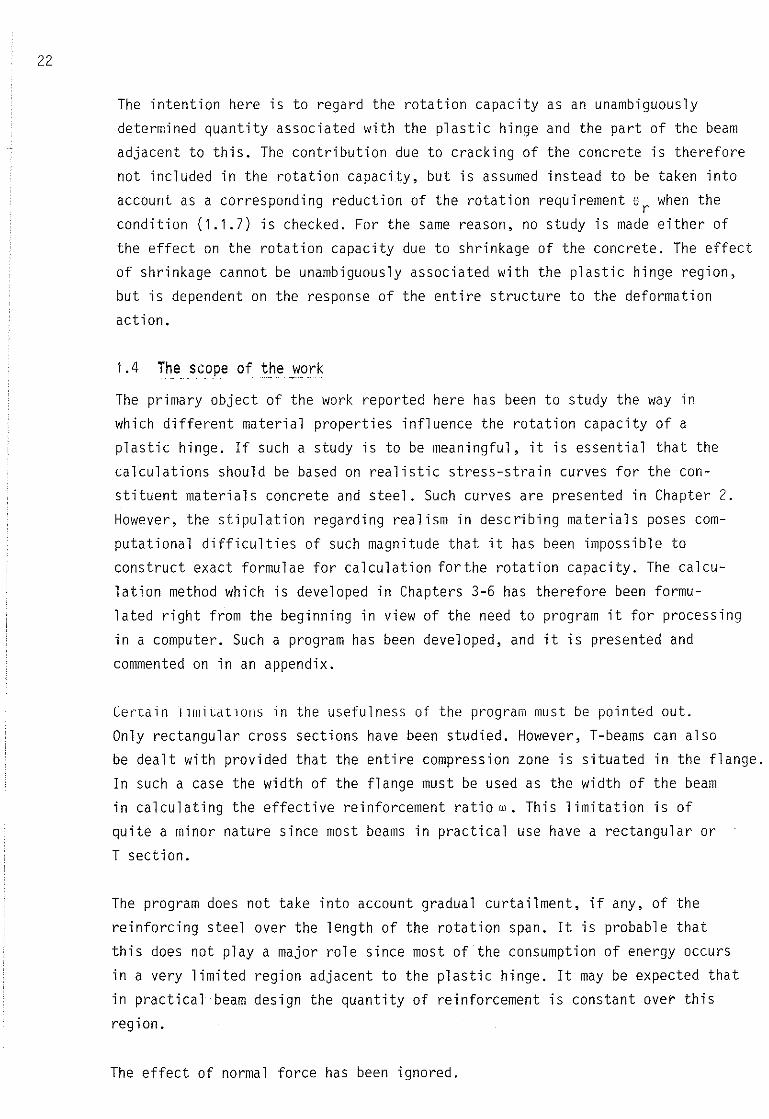
The moment-curvature diagram in FIG. 1.3a assumes a section cracked from theoutset. If an initial ly uncracked section is assumed, the general appearance of
the moment-curvature diagram will conform to the line OAFED in FIG. 1.3b. Theslope of the line DB represents the bending stiffness of the uncracked section,and the slope of the line DC represents the bending stiffness of the cracked
section. The moment Mr is the moment which initiates cracking. If the area AFCBAabove the moment curve is transformed and the corresponding curvature contributian is subsequently integrated over the length of the rotation span, therotation which occurs due to cracking is obtained. This phenomenon has been
studied by Rechardt (1968) and others.
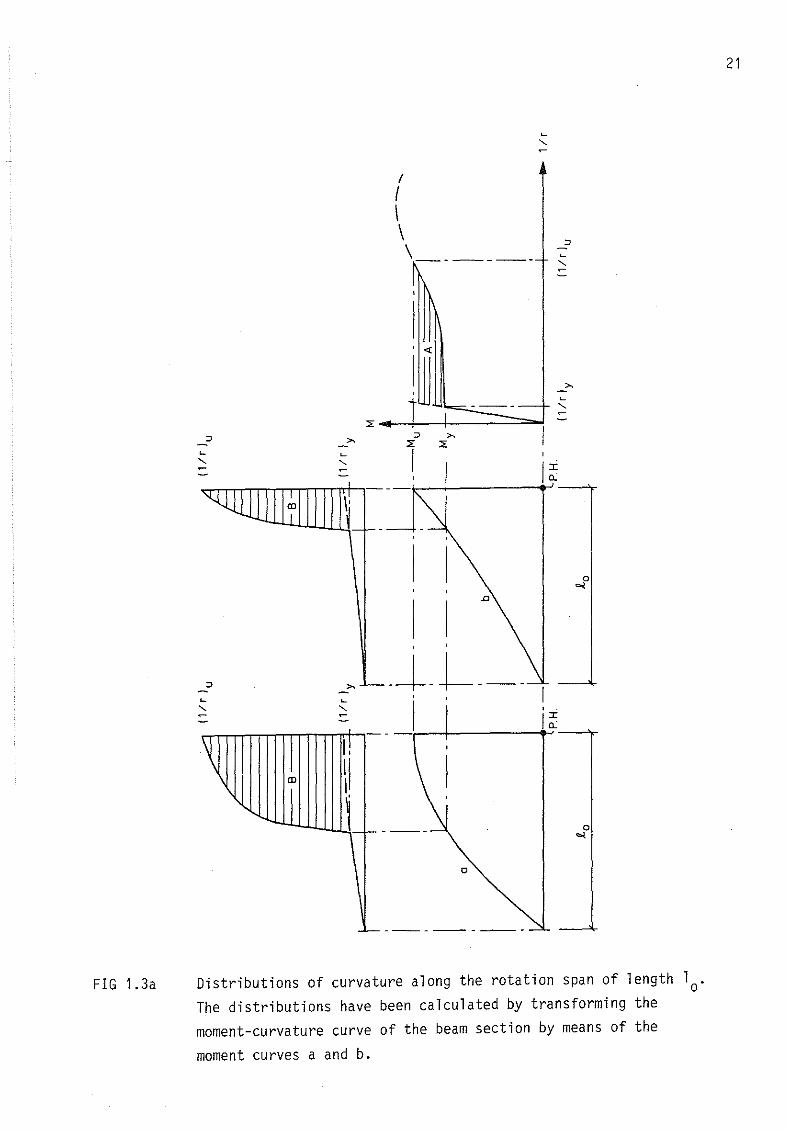
FIG 1.3a
/
I\\\
">,::> >,
" "~ I"-= ---
I I o, o<
I I.o
,
::> >, --l-L---~ ~
,"- "- __I~ ~ jIo.:
~ il\1CD
II ~ o...o
'-----------
Distributions of curvature along the rotation span of length lo·The distributions have been calculated by transforming the
moment-curvature curve of the beam section by means of the
moment curves a and b.
21
22
The intention here is to regard the rotation capacity as an unambiguously
determined quantity associated with the plastic hinge and the part of the beam
adjacent to this. The contribution due to cracking of the concrete is therefore
not included in the rotation capacity, but is assumed instead to be taken into
account as a corresponding reduction of the rotation requirement er when the
condition (1.1.7) is checked. For the same reason, no study is made either of
the effect on the rotation capacity due to shrinkage of the concrete. The effect
of shrinkage cannot be unambiguously associated with the plastic hinge region,
but is dependent on the response of the entire structure to the deformation
action.
1.4 The scope of the work
The primary object of the work reported here has been to study the way in
which different material properties influence the rotation capacity of a
plastic hinge. If such a study is to be meaningful, it is essential that the
calculations should be based on realistic stress-strain curves for the con
stituent materials concrete and steel. Such curves are presented in Chapter 2.
However, the stipulation regarding realism in describing materials poses com
putational difficulties of such magnitude that it has been impossible to
construct exact formulae for calculation for the rotation capacity. The calcu
lation method which is developed in Chapters 3-6 has therefore been formu
lated right from the beginning in view of the need to program it for processing
in a computer. Such a program has been developed, and it is presented and
commented on in an appendix.
Cet"tain 11lltiIattOnS in the usefulness of the program must be pointed out.
Only rectangular cross sections have been studied. However, T-beams can also
be dealt with provided that the entire compression zone is situated in the flange.
In such a case the width of the flange must be used as the width of the beam
in calculating the effective reinforcement ratio w. This limitation is of
quite a minor nature since most beams in practical use have a rectangular or
T section.
The program does not take into account gradual curtailment, if any, of the
reinforcing steel over the length of the rotation span. It is probable that
this does not playa major role since most of the consumption of energy occurs
in a very limited region adjacent to the plastic hinge. It may be expected that
in practical beam design the quantity of reinforcement is constant over this
region.
The effect of normal force has been ignored.
23
Results of calculations regarding combinations of typical steels and concretetypes, and also the calculated rotation capacity when the parameter valueschosen for the typical steels and concrete types have been departed from, areshown in Chapter 7.
The effect on rotation capacity due to creep of concrete within the rotationspan is studied in Chapter 8.
The effect of compression reinforcement and the effect of concrete creep inconjunction with compression reinforcement is dealt with in Chapter g.
In calculations regarding the above phenomena, discussed in Chapters 7-9, the
effect of shear force which may be present simultaneously with the bendingmoment has been ignored. In Chapter 10 the analytical model is modified in suchaway that it is possible, at least approximately, to study the effect of shear
force. It is found that the effect of shear force is considerable when therotation span is not slender.
The presence of stirrups around the compression zone of the beam has been
found to increase the rotation capacity considerably. This is studied inChapter 11 where an approximate method which also includes this beneficialeffect in the developed analytical model is derived in a semi-empirical manner.
The developed calculation method has been compared with theresults of testscarried out at the Department of Structural Engineering, Division of ConcreteStructures, Chalmers University of Technology, Gothenburg. It is found thatthere is reasonable agreement between the experimental and calculated rotationcapacities. One ~rtial result of this comparison is utilised in Chapter 10 ofthis report. It is planned that a complete report will be published elsewhere.
11 /r Ju
24
FIG 1.3b
M
B C D
-t------------ ,, ,I I
,
I,I
+--------------------1--.... 1/rO
Moment-curvature curve for an initially uncracked beam section.
The eraeking moment of the section is Mr'
- 1,0
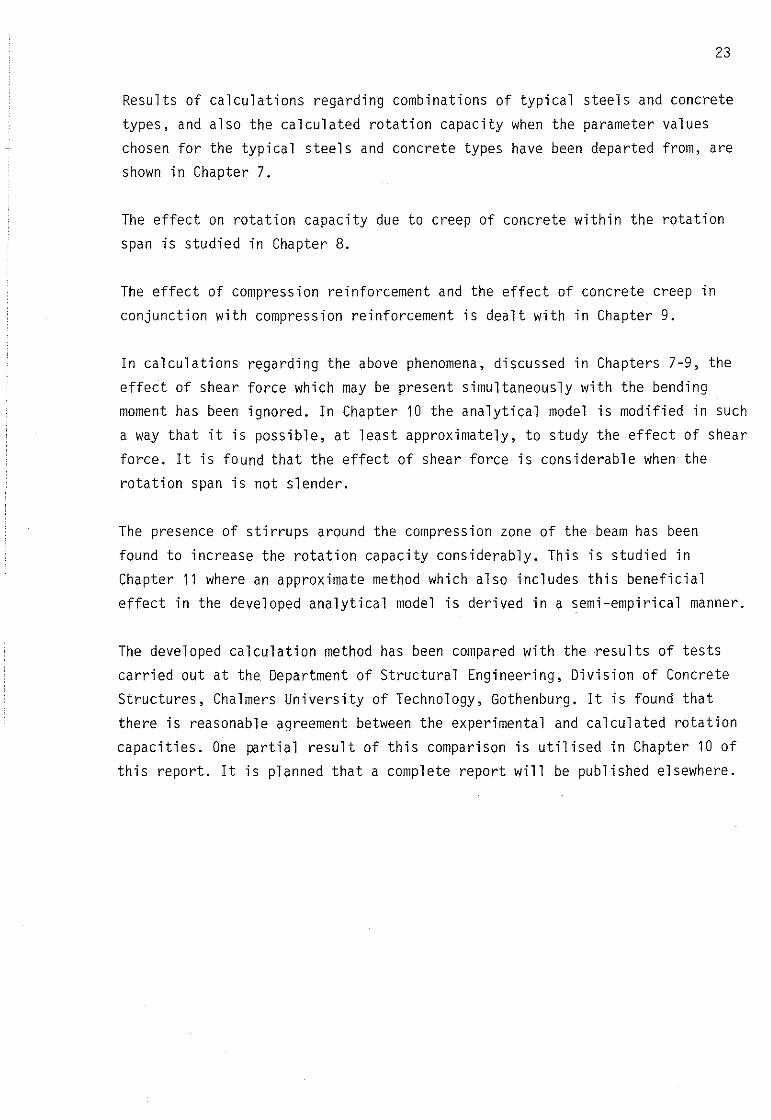
FIG 2.la Schematic form of the stress-strain diagram for concrete incompression in non-dimensional terms. The line AB representsremoval of the load.
x
b
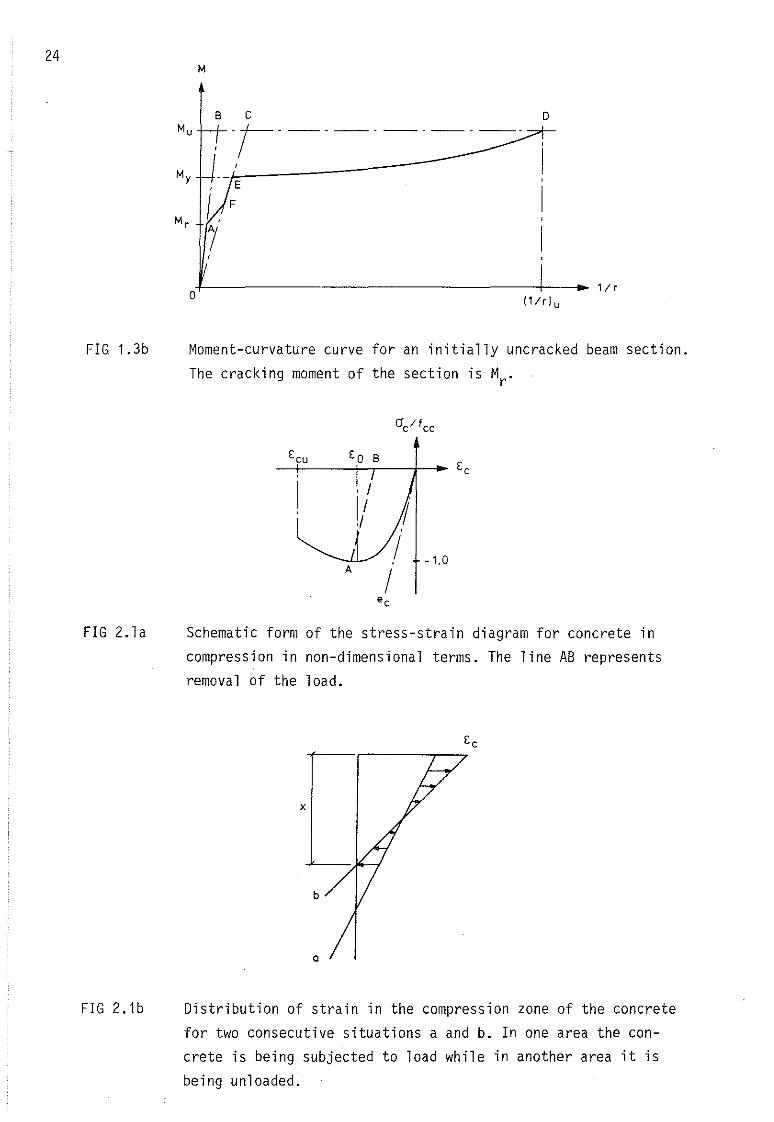
FIG2.1b
Q
Distribution of strain in the compression zone of the concretefor two consecutive situations a and b. In one area the concrete is being subjected to load while in another area it is
being unloaded.
25
2 THE STRESS-STRAIN CURVES FOR STEEL AND CONCRETE
The selected calculation procedure permits the application of realistic stressstrain curves for the steel and concrete. Analytical expressions which give agood approximation of the mechanical properties of these materials whensubjected to short-term loads are given below. Concrete and steel are dealtwith separately.
2.1 The stress-strain curve for concrete
Concrete in tension is assumed to be cracked. Active concrete is therefore only
found in the compression zone of the beam, with the stress-strain curve
generally in conformity with FIG. 2.1a. In order that the formulae derivedlater on may have the greatest possible general application, the stresses aremade non-dimensional by dividing them by the compressive strength f of theccconcrete. In this way the modulus of elasticity is also non-dimensional. Theexpression for the non-dimensional initial modulus of elasticity for short-termloading is
ec
c=-f
cc(2.1.1)
In FIG. 2.1b the compression zone of depth x is examined in a situation justbefore crushing failure. During the gradual increase in load up to failure,
the distribution of strain at a certain instant was represented by line a.A little later the distribution is given by line b. The figure shows that thecompression zone is divided inta two regions, an upper one where the concreteis being subjected to load and therefore conforms to the basic full-line curveof the stress-strain diagram, and a lower one in which the concrete is stillin compression but is being unloaded. For concrete in the latter region thestress-strain relation is described by an unloading curve which is assumed to
be a straight line of slope ec ' shown by the dashed line AB in FIG. 2.1a. Thisis taken into account in the developed computer program.
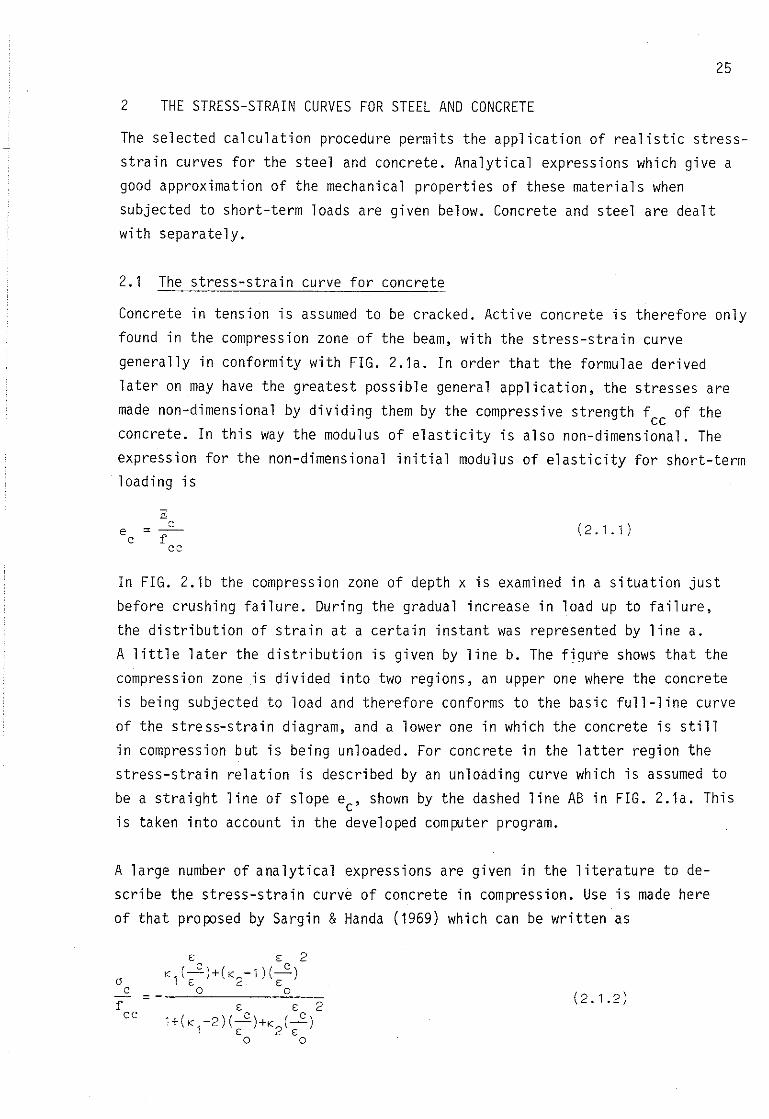
A large number of analytical expressions are given in the literature to describe the stress-strain curve of concrete in compression. Use is made hereof that proposed by Sargin &Handa (1969) which can be written as
ac
fcc
(2.1.2)
Z6
The coefficient Kl contained in this expression is obtained as
K = -e €1 c o
(2.1.3)
where EO
is the limit strain (with the appropriate sign) corresponding to
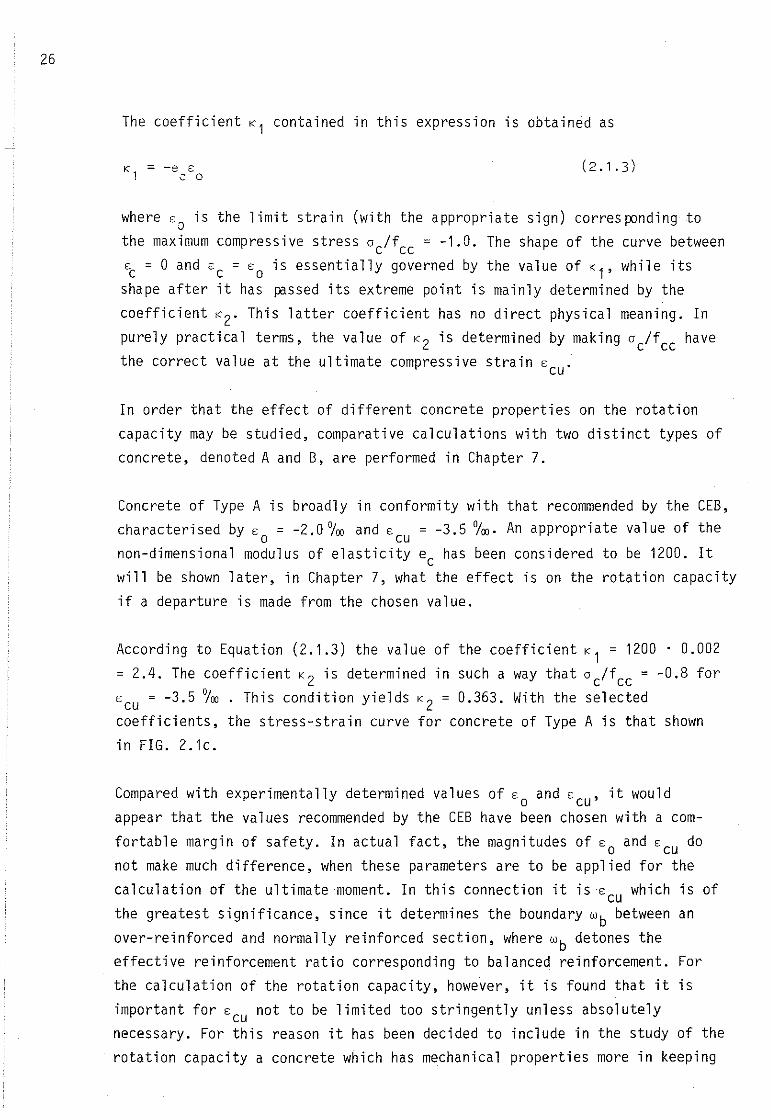
the maximum compressive stress 0c/fcc = -1.0. The shape of the curve betweenEC = O and EC = E
Ois essentially governed by the value of Kl' while its
shape after it has passed its extreme point is mainly determined by thecoefficient KZ' This latter coefficient has no direct physical meaning. Inpurely practical terms, the value of KZ is determined by making 0c/fcc havethe correct value at the ultimate compressive strain E
CU'
In order that the effect of different concrete properties on the rotation
capacity may be studied, comparative calculations with two distinct types ofconcrete, denoted A and B, are performed in Chapter 7.
Concrete of Type A is broadly in conformity with that recommended by the CEB,characterised by E = -Z.O °/00 and E = -3.5 °/00' An appropriate value of theo cunon-dimensional modulus of elasticity ec has been considered to be lZ00. Itwill be shown later, in Chapter 7, what the effect is on the rotation capacityif a departure is made from the chose n value.
According to Equation (Z.1.3) the value of the coefficient Kl = lZ00 . O.OOZ
= Z.4. The coefficient KZ is determined in such away that 0c/fcc = -0.8 forE
CU= -3.5 0/00 • This condition yields KZ = 0.363. With the selected
coefficients, the stress-strain curve for concrete of Type A is that shownin FIG. 2.1c.
Compared with experimental ly determined values of EO
and ECU
' it wouldappear that the values recommended by the CEB have been chosen with a comfortable margin of safety. In actual fact, the magnitudes of EO and E
CUdo
not make much difference, when these parameters are to be applied for thecalculation of the ultimatemoment. In this connection it iSE
CUwhich is of
the greatest significance, since it determines the boundary wb between an
over-reinforced and normally reinforced section, where wb detones theeffective reinforcement ratio corresponding to balanced reinforcement. Forthe calculation of the rotation capacity, however, it is found that it isimportant for E
CUnot to be limited too stringently unI ess absolutely
necessary. For this reason it has been decided to include in the study of therotation capacity a concrete which has mechanical properties more in keeping
-3,5 -2,0
27
310 x Ec
ec ; 1200
- 0,8
- 1. O
FIG 2.1c Non-dimensional stress-strain diagram for concrete type A in
compressian
- 7,0
TYPE "8"
-2,5310 x Ec
I
-----L-,
I
e_ ;1200c
- 0,5
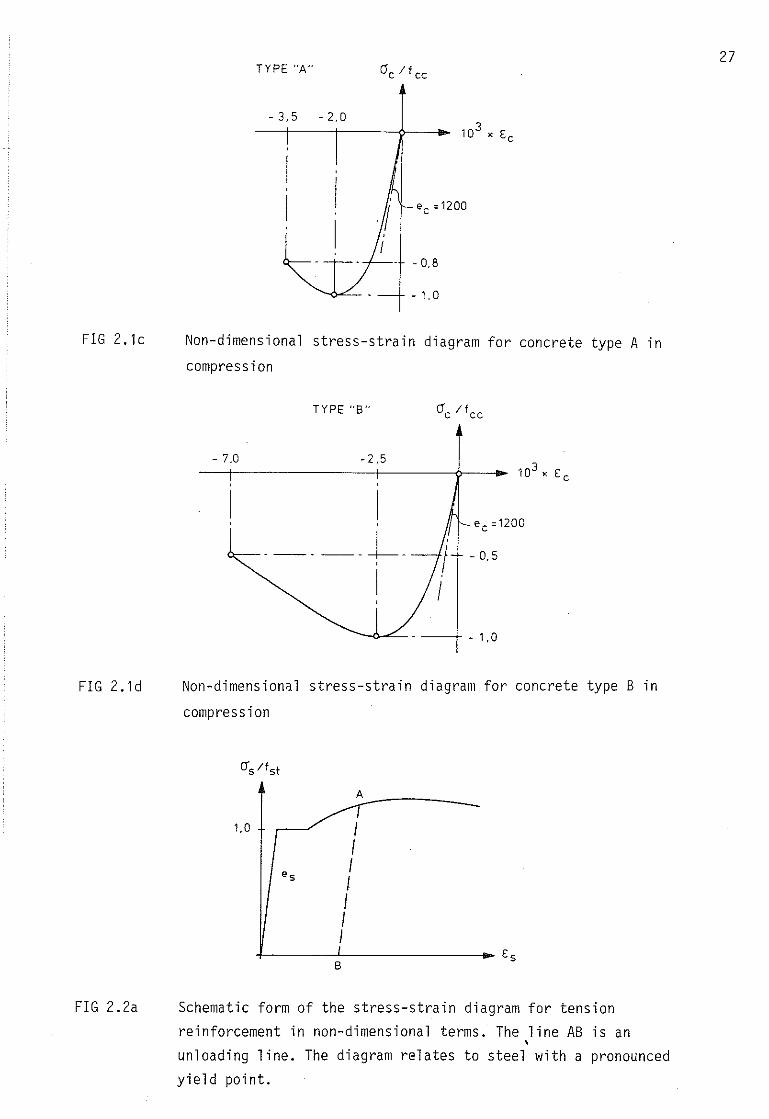
FIG 2.1d
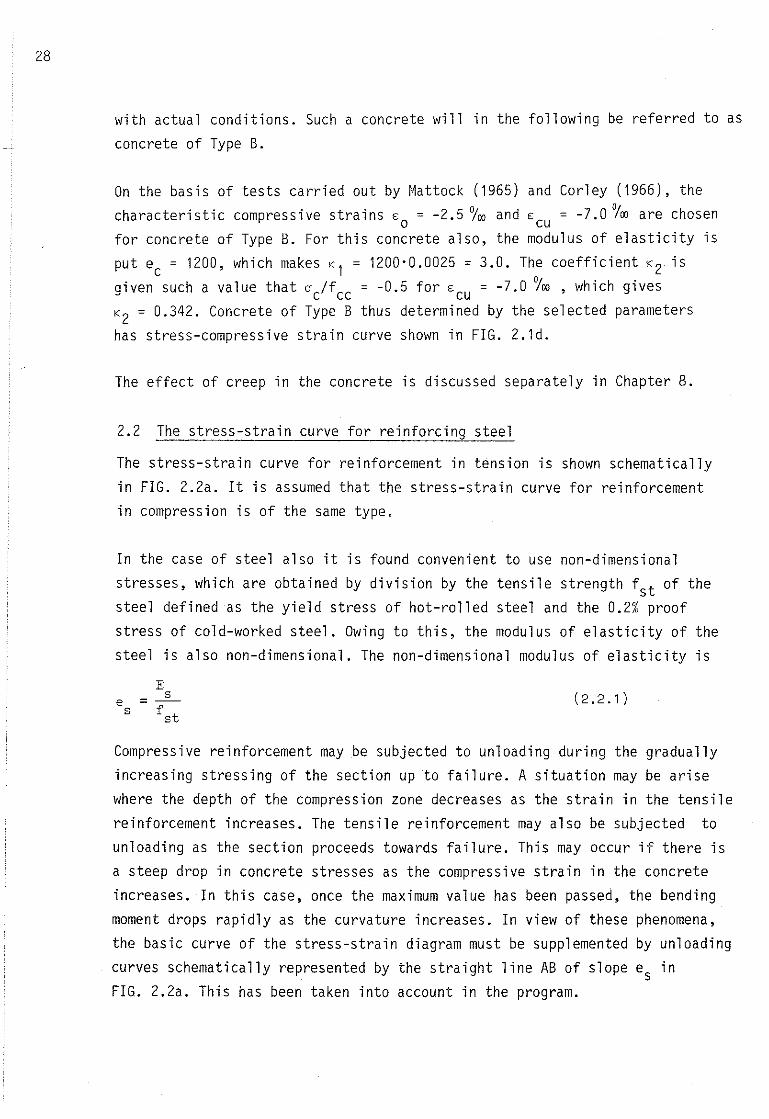
FIG 2.2a
--+ -1,0
Non-dimensionsl stress-strain diagram for concrete type B in
compressian
Schematic form of the stress-strain diagram for tensionreinforcement in non-dimensional terms. The line AB is an,unloading line. The diagram relates to steel with a pronouncedyield point.
28
with actual conditions. Such a concrete will in the following be referred to as
concrete of Type B.
On the basis of tests carried out by Mattock (1965) and Corley (1966), the
characteristic compressive strains €o ~ -2.5 ~oo and €cu ~ -7.0 ~oo are chosenfor concrete of Type B. For this concrete also, the modulus of elasticity isput ec ~ 1200, which makes K1 ~ 1200'0.0025 ~ 3.0. The coefficient K2 is
given such a value that 0 c/fcc ~ -0.5 for €cu ~ -7.0 ~oo , which givesK2 ~ 0.342. Concrete of Type B thus determined by the seleeted parameters
has stress-compressive strain curve shown in FIG. 2.1d.
The effect of creep in the concrete is discussed separately in Chapter 8.
2.2 The stress-strain curve for reinforcing steel
The stress-strain curve for reinforcement in tension is shown schematically
in FIG. 2.2a. It is assumed that the stress-strain curve for reinforcementin compression is of the same type.
In the case of steel also it is found convenient to use non-dimensionalstresses, which are obtained by division by the tensile strength fst of thesteel defined as the yield stress of hot-rolled steel and the 0.2% proof
stress of cold-worked steel. Owing to this, the modulus of elasticity of thesteel is also non-dimensional. The non-dimensional modulus of elasticity is
es
(2.2.1)
Compressive reinforcement may be subjected to unloading during the graduallyincreasing stressing of the section up to failure. A situation may be arisewhere the depth of the compression zone decreases as the strain in the tensile
reinforcement increases. The tensile reinforcement may also be subjected tounloading as the section proceeds towards failure. This may occur if there isa steep drop in concrete stresses as the compressive strain in the concreteincreases. In this case, once the maximum value has been passed, the bending
moment drops rapidlyas the curvature increases. In view of these phenomena,the basic curve of the stress-strain diagram must be supplemented by unloadingcurves schematically represented by the straight line AB of slope es inFIG. 2.2a. This has been taken into account in the program.
Z9
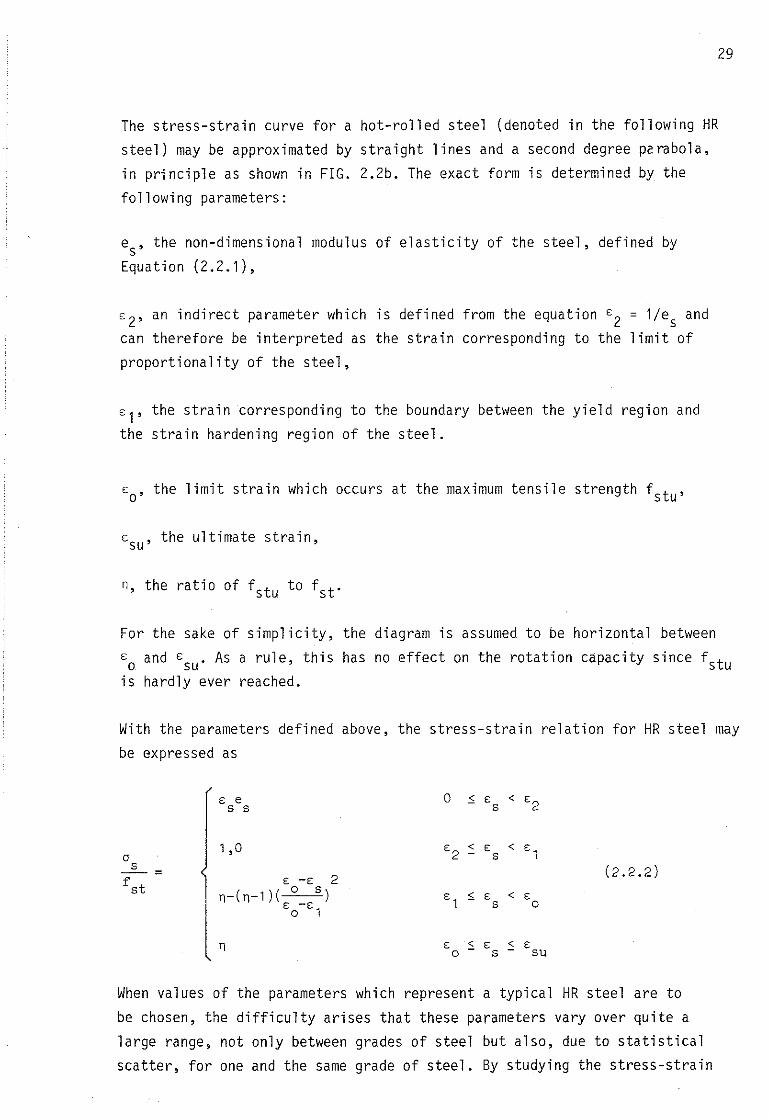
The stress-strain curve for a hot-rolled steel (denoted in the following HRsteel) may be approximated by straight lines and a second degree perabola,in principle as shown in FIG. Z.Zb. The exact form is determined by the
following parameters:
es ' the non-dimensional modulus of elasticity of the steel, defined byEquation (Z.Z.1),
E Z' an indirect parameter which is defined from the equation EZ = 1/es andcan therefore be interpreted as the strain corresponding to the limit ofproportional ity of the steel,
E1' the strain corresponding to the boundary between the yield region andthe strain hardening region of the steel.
EO
' the limit strain which occurs at the maximum tensile strength f stu '
ESU ' the ultimate strain,
n, the ratio of f stu to f st '
For the sake of simplicity, the diagram is assumed to be horizontal between
EO
and ESU
' As a rule, this has no effect on the rotation capacity since f stuis hardly ever reached.
With the parameters defined above, the stress-strain relation for HR steel may
be expressed as
E e O S s < s2s s s
1,0 E2
< E < sl(J - s
s (2.2.2)-- = 2f stS -E
n-(n-')( o s) s, S s < sS -E S o
o 1
n s S E S So s su
When values of the parameters which represent a typical HR steel are to
be chosen, the difficulty arises that these parameters vary over quite alarge range, not only between grades of steel but also, due to statisticalscatter, for one and the same grade of steel. By studying the stress-strain
30
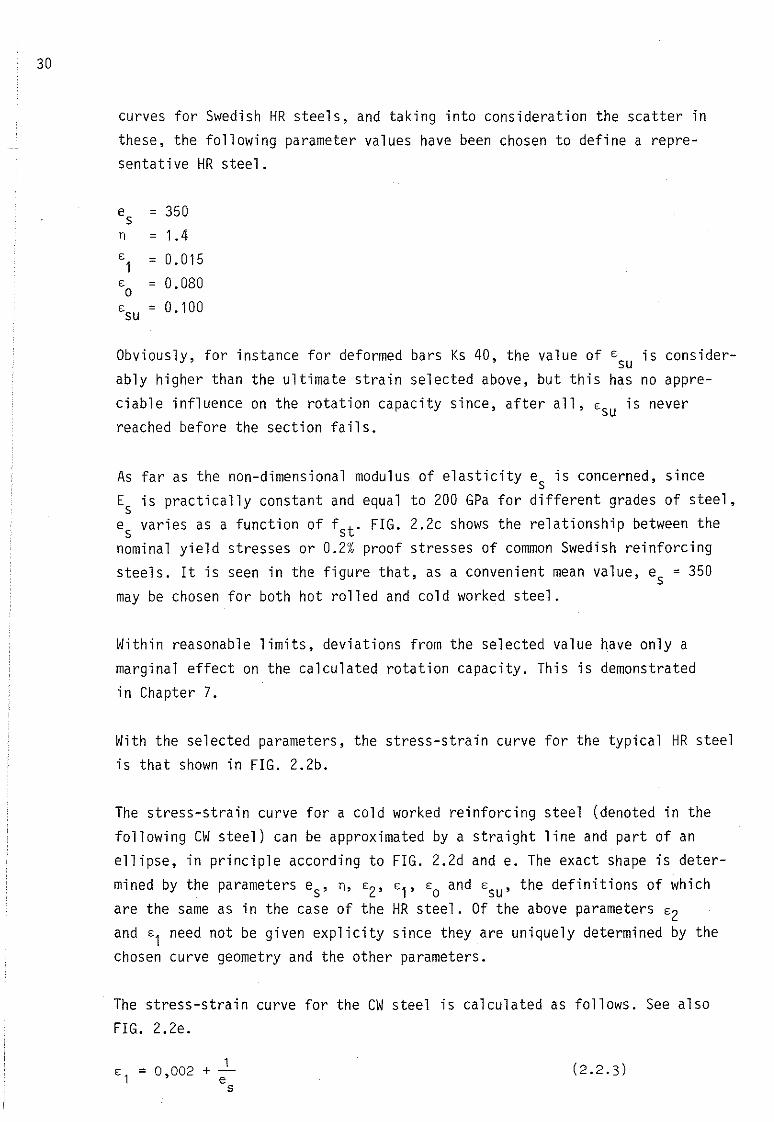
curves for Swedish HR steels, and taking into consideration the scatter inthese, the following parameter values have been chosen to define a representative HR steel.
e = 350sn = 1.4E = 0.0151E = 0.080oE = 0.100su
Obviously, for instance for deformed bars Ks 40, the value of E is consider-suably higher than the ultimate strain selected above, but this has no appre-ciable influence on the rotation capacity since, after all, E
SUis never
reached before the section fails.
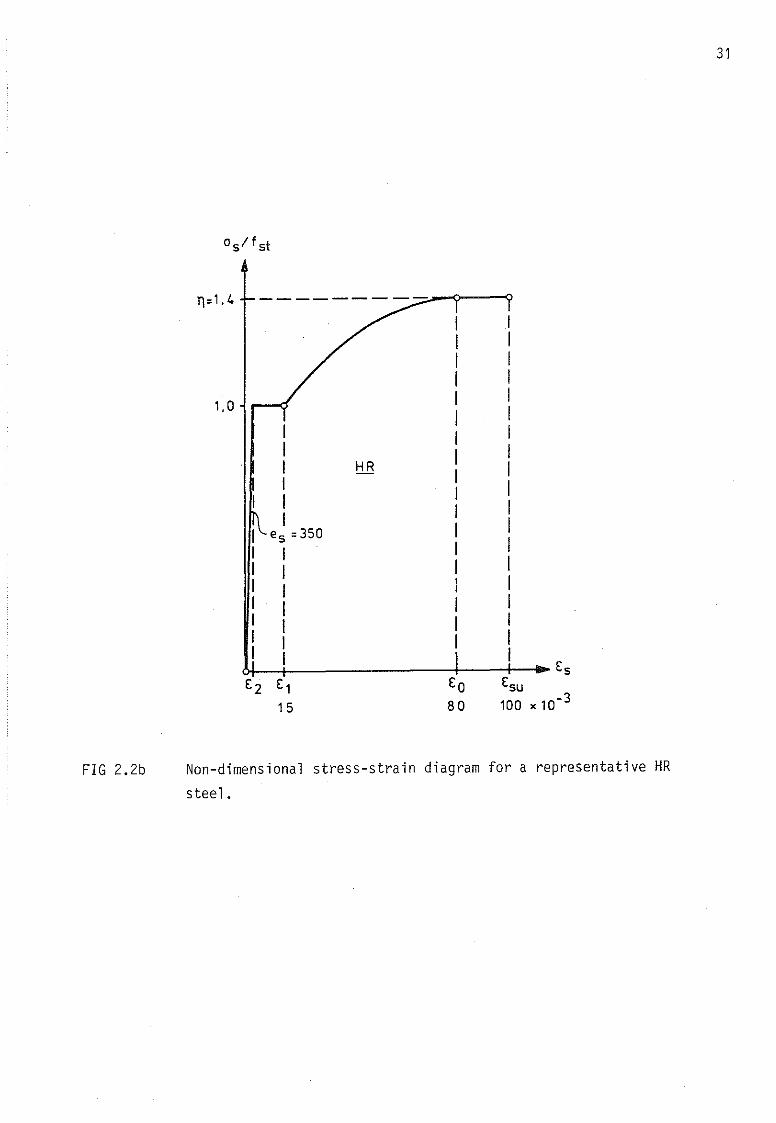
As far as the non-dimensional modulus of elasticity es is concerned, sinceEs is practically constant and equal to 200 GPa for different grades of steel,
e varies as a function of f t. FIG. 2.2c shows the relationship between thes snominal yield stresses or 0.2% proof stresses of common Swedish reinforcingsteels. It is seen in the figure that, as a convenient mean value, es = 350
may be chosen for both hot rolled and cold worked steel.
Within reasonable limits, deviations from the selected value have only a
marginal effect on the calculated rotation capacity. This is demonstratedin Chapter 7.
With the selected parameters, the stress-strain curve for the typical HR steelis that shown in FIG. 2.2b.
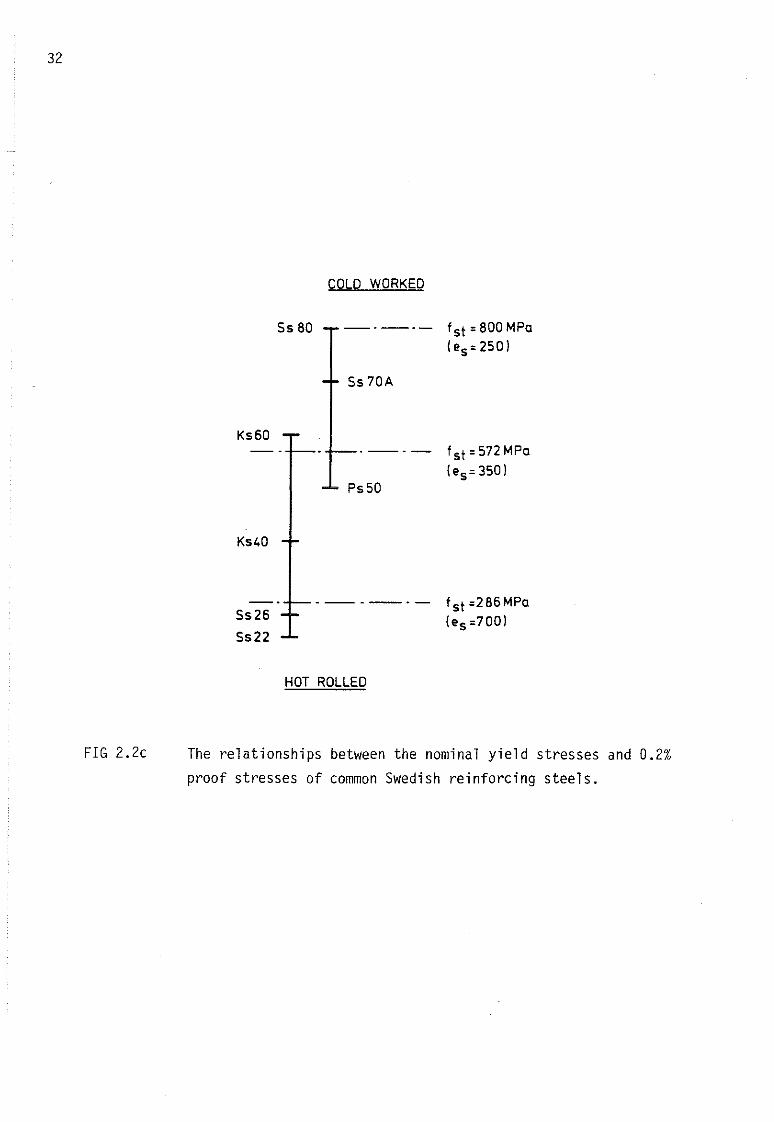
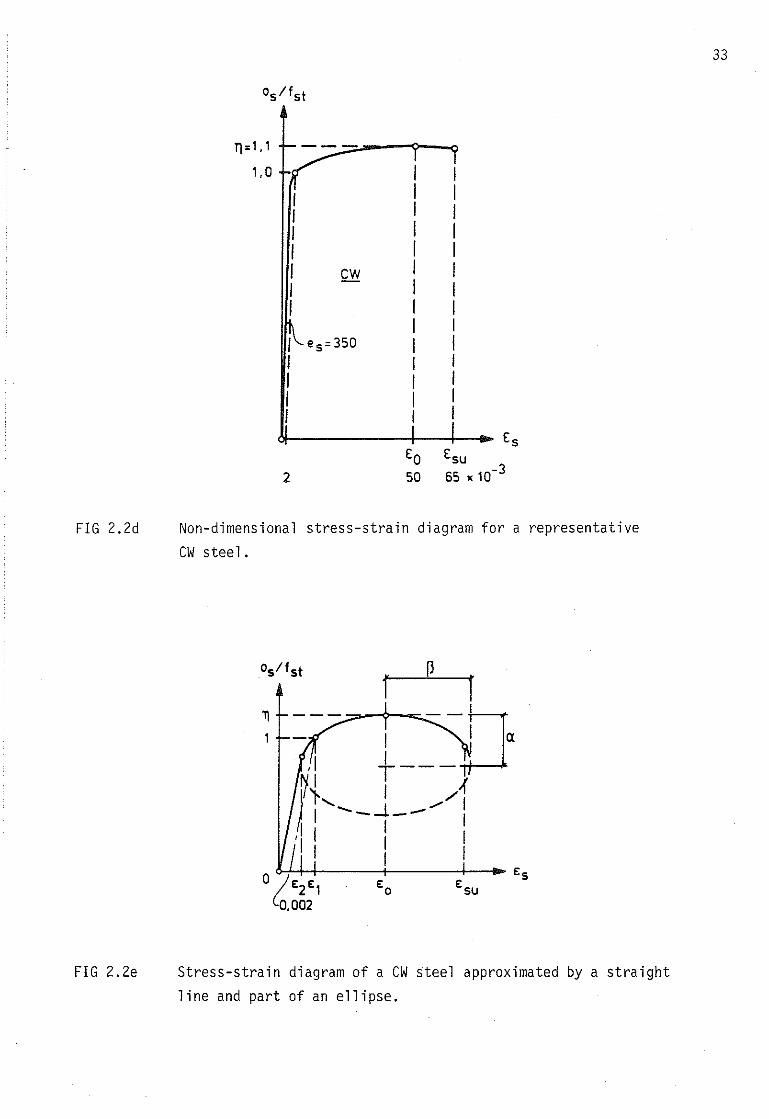
The stress-strain curve for a cold worked reinforcing steel (denoted in thefollowing CW steel) can be approximated by a straight line and part of anellipse, in principle according to FIG. 2.2d and e. The exact shape is deter
mined by the parameters es ' n, EZ' E1, EO
and ESU
' the definitions of whichare the same as in the case of the HR steel. Of the above parameters E2and E1 need not be given explicity since they are uniquely determined by thechosen curve geometry and the other parameters.
The stress-strain curve for the CW steel is calculated as follows. See alsoFIG. 2.Ze.
1E
1= 0,002 + ;-
s(2.2.3)
31
11='·4 ---------IIII
'. OII
I II II HR II II II Ies =350
III II II II II II I
EsE2 E1 EO Esu
15 80 100x10-3
FIG 2.2b Non-dimensional stress-strain diagram for a representative HR
steel.
32
Ks60
Ks40
5s26
5s22
5s 80
COLD WORKED
f st =800 MPa(es =250)
5s 70A
.-_.- f st=572MPa
(es=350)Ps50
fst =286MPa(es =700)
FIG 2.2c
HOT ROLLED
The relationships between the nominal yield stresses and 0.2%proof stresses of common Swedish reinforcing steels.
33
11=', ,
1, O
,IIIIII
I es =350
IIII
2
I I1 1I II 11 II II I1 1I II II II I1 II I
EsEO Esu50 65 x 10-3
FIG 2.2d Non-dimensional stress-strain diagram for a representative
CW steel.
i p r___ __I
- I ~r-1a,I +---~N,.... I ../1Ii I --.1_- I
'I' l II I I
1),
FIG 2.2e Stress-strain diagram of a CW steel approximated by a straightline and part of an ellipse.
34
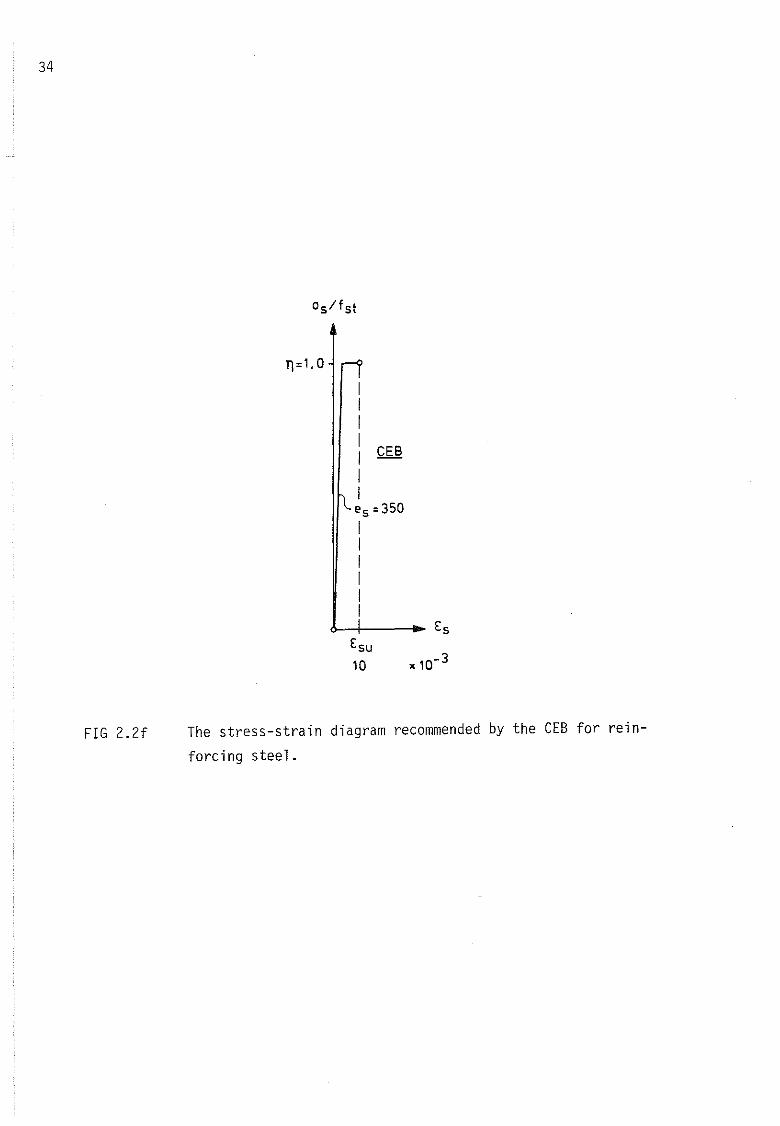
FIG 2.2f
T)=1.0
IIIII CES
IIes =350
IIIIII
The stress-strain diagram recommended by the CEB for rein
forcing steel.
35
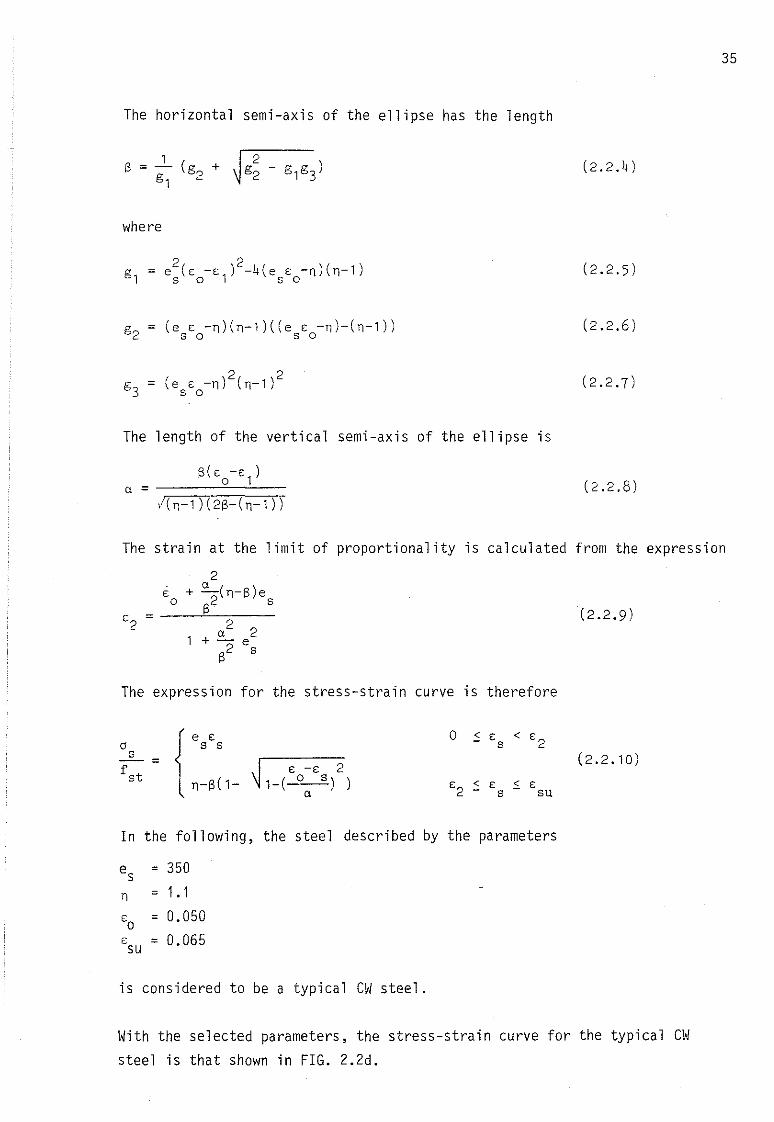
The horizontal semi-axis of the ellipse has the length
(2.2.4)
where
g2 = (e s -n)(n-1)((e s -n)-(n-1))s o s o
2 2g = (e s -n) (n-1)
3 s o
The length of the vertical semi-axis of the ellipse is
(2.2.5)
(2.2.6)
(2.2.7)
(2.2.8)
(2.2.9)
The strain at the limit of proportional ity is calculated from the expression
2s + ~(n-S)e
o S2 s
s2 = ",2 2+ - e
S2 s
The expression for the stress-strain curve is therefore
{
e s(J s s
sf = s -s 2st n-S(1-~1-(O",S)) E < E: :s. E:
2 - s su
(2.2.10)
In the following, the steel described by the parameters
es = 350
n = 1.1
So = 0.050s = 0.065su
is considered to be a typical CW steel.
With the seleeted parameters, the stress-strain curve for the typical CW
steel is that shown in FIG. 2.2d.
36
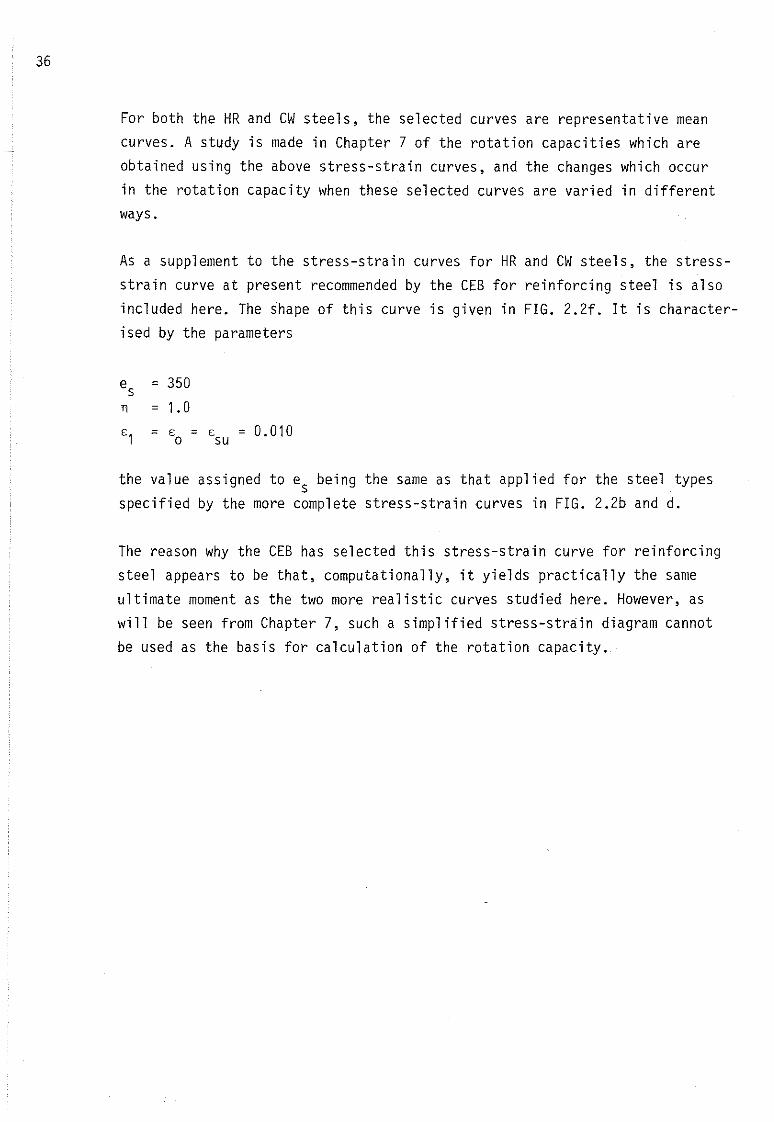
For both the HR and CW steels, the seleeted curves are representative meancurves. A study is made in Chapter 7 of the rotation capacities which areobtained using the above stress-strain curves, and the changes which occurin the rotation capacity when these selected curves are varied in differentways.
As a supplement to the stress-strain curves for HR and CW steels, the stressstrain curve at present recommended by the CEB for reinforcing steel is also
included here. The shape of this curve is given in FIG. 2.2f. It is characterised by the parameters
es = 350
n = 1.0
E1 = E = E = 0.010o su
the value assigned to es beingspecified by the more complete
the same as that applied for the steel typesstress-strain curves in FIG. 2.2b and d.
The reason why the CEB has selected this stress-strain curve for reinforcingsteel appears to be that, computationally, it yields practically the sameultimate moment as the two more realistic curves studied here. However, aswill be seen from Chapter 7, such a simplified stress-strain diagram cannotbe used as the basis for calculation of the rotation capacity.
37
3 THE DEPTH OF THE COMPRESSION ZONE
Using Bernoulli's hypothesis and a condition of equilibrium, the relationbetween beam curvature and depth of compression zone is calculated in thisChapter.
3.1 Calculation geometry
Using the symbols Fs for force in the tension reinforcement, Fsc for forcein the compression reinforcement and Fc for the resultant of the concretestresses in the compression zone of the beam, resolution of forces yieldsthe equilibrium condition.
F + F + F = Oc se s
(3.1.1)
The positions and positive directions of these forces are shown in FIG. 3.1a.
In the view of the numerical caluclation procedure, the compression zone isdivided into strips of equal depth parallel to the neutral axis. In principle,this division can be effected in two distinct ways. One is characterised by thefact that the depth of the compression zone which is applicable at a certaininstant is divided into a constant number of strips. This means that the
depth of a strip varies in step with the depth of the compression zone. Whenthis method of subdivision is applied, a strip will successively representdifferent parts of the concrete in the compression zone during the loadingprocess.
The second method of subdivision is characterised by the fact that a ficti
tious compression zone depth is introduced and that this is kept constantduring application of the load. The fictitious depth xm is made so large
that it will at all times accommodate the real compression zone applicableat that instant. When this method is applied, all the strips are not activeand the number of active strips changes during application of the load. Inreturn, there is the advantage that the depth of a strip remains constant,and that each strip always represents the same. concrete area. This latter
aspect is significant when the previous history of the concrete must be takeninto account, for instance when a strip is reJieved of load.
The latter alternative is chosen here. It is illustrated in FIG. 3.1b. Thestrips are numbered from 1 to n, and the ordinate Yi to the centroid of stripNo i is calculated according to the figure from the expression
38
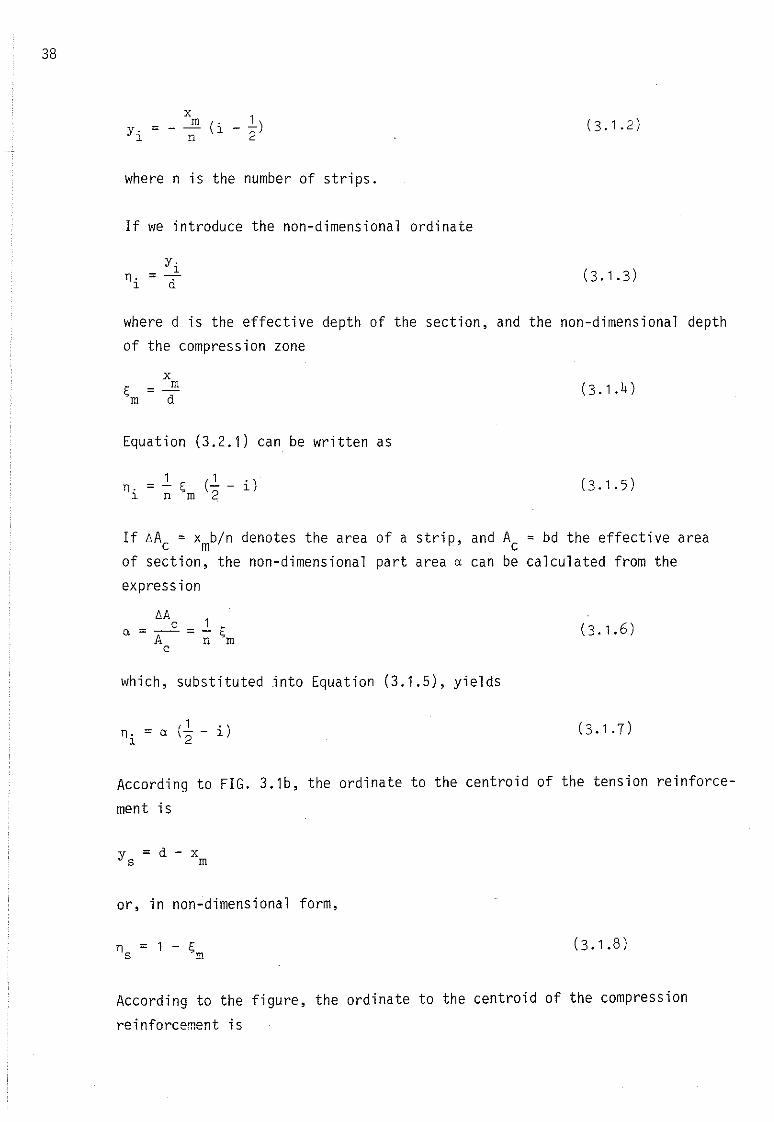
xy. = _ m (i _ l)
l n 2
where n is the number of strips.
If we introduce the non-dimensional ordinate
where d is the effective depth of the section, and the non-dimensional depthof the compression zone
(3.1.4)
Equation (3.2.1) can be written as
If ~Ac = xmb/n denotes the area of a strip, and Ac = bd the effective areaof section, the non-dimensional part area a can be calculated from theexpression
(3.1.6)
which, substituted into Equation (3.1.5), yields
n. = al
According to FIG. 3.1b, the ordinate to the centroid of the tension reinforce
ment is
y = d - xs m
or, in non-dimensional form,
n = 1 - Ss ffi
(3.1.8)
According to the figure, the ordinate to the centroid of the compression
reinforcement is
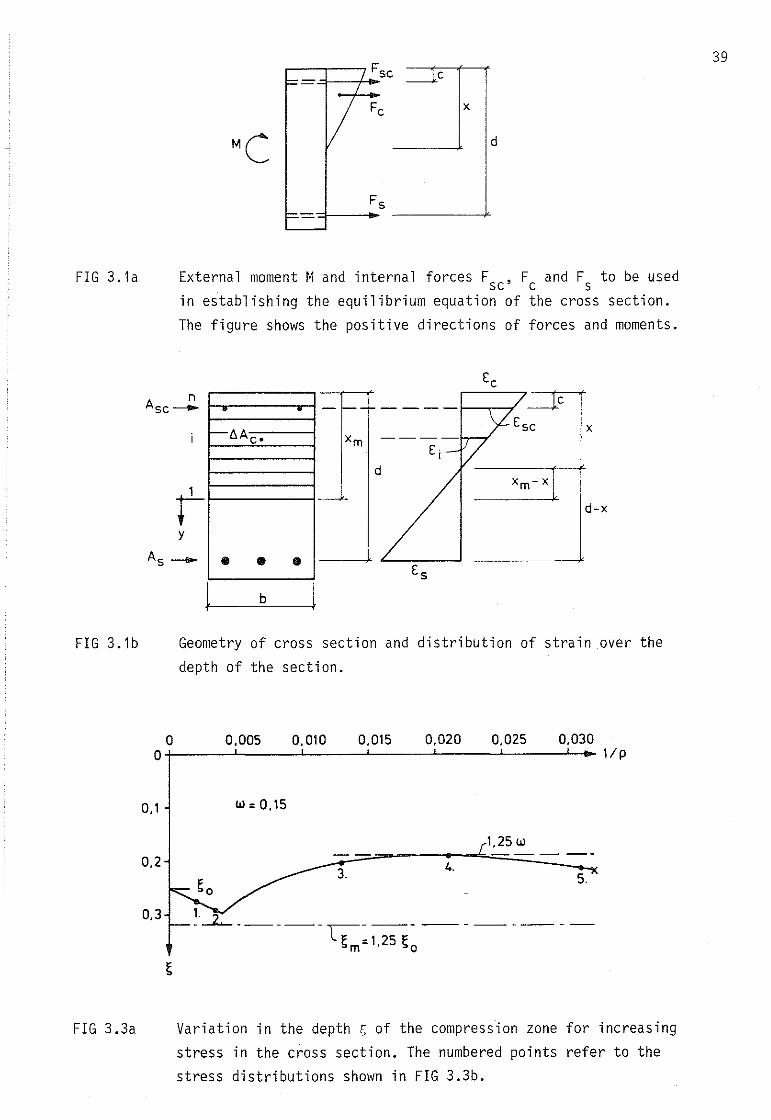
FIG3.1a
39
FFsc ----le
I1/ Fex
MC d
FsF'
External moment Mand internal forces F , F and F to be usedse c sin establishing the equilibrium equation of the cross section.The figure shows the positive directions of force s and moments.
nÄsc
_~-I--
-t>Ä co xm
-
III 411 III
t~-=-b_l
- - - -f--,--/ e
x
d-x
FIG 3.1b
FIG 3.3a
Geometry of cross section and distribution of strain over the
depth of the section.
o 0,005 0,010 0.015 0.020 0,025 0,030O l/p
0,1 w = 0,15
1,25 w0.2
-----4.3. 5.
0,3 -------------
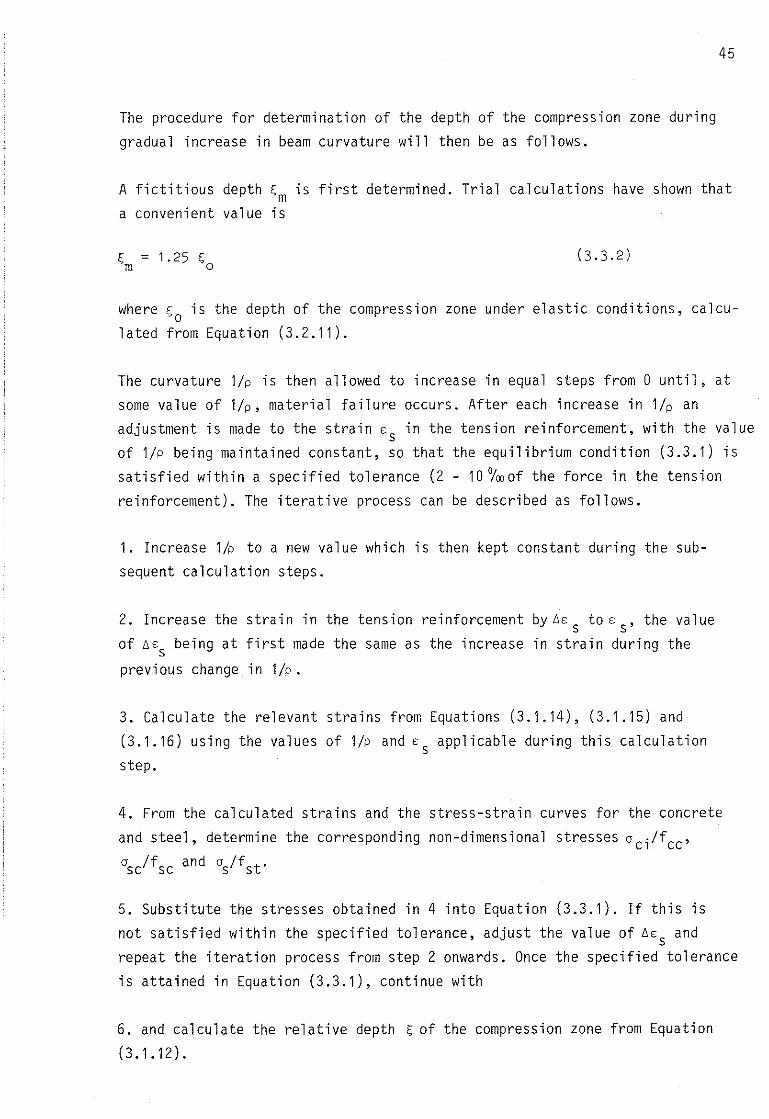
Variation in the depth ~ of the compression zone for increasing
stress in the cross section. The numbered points refer to thestress distributions shown in FIG 3.3b.
40
-x + cID
where c is the distance between the compression reinforcement and the mostheavily stressed edge. Using the notation
y = E.. (3.1.9)d
we obtain the non-dimensional ordinate of the compression reinforcement
(3.1.10)
r
The relevant strains are calculated as follows. According to Bernoulli'shypothesis and FIG. 3.1b, we obtain for the curvature of the beam the expression
1e
_ = _::;s_d - x
where r is the radius of curvature, es the strain in the tension reinforcement,and x the depth of the compression lone at that instant. If this is multiplied
by the effective depth d of the beam, we have
1 d es-=-=-:-=~
p r 1 - ~U.1.11)
where p is the non-dimensional radius of curvature and ~ denotes the nondimensional depth of the compression lone at the instant under consideration.The expression (3.1.11) gives the depth of the compression lone
~ = 1 - pes
(3.1.12)
as a function of the values of the radius of curvature and strain in the
tension reinforcement which are applicable at each particular instant.
Further, from FIG. 3.1b we derive the relation
e ec s- - =
x d - x
or
U.1.13)
e =cx
d - x
which, after substitution into it of Equations (3.1.11) and (3.1.12) yields
1 1e = -( 1 - pe ) - = e
c s p s p(3.1.14)
41
In the above, EC
is the maximum compressive strain in the concrete corresponding
to the gi ven parameter va 1ues 1/p and €s' The val ue of E c i s compared with the
ultimate compressive strain €cu in the concrete to see if crushing failure
occurs in the concrete.
According to FIG. 3.1b, the strain €sc in the compressian reinforcement is
obtained from the express ian
E se _ x-c _ b-€--7- ~
c
or, with ~ accord-ing to Equation (3.1.12) and EC
according to Equation (3.1.14),
1-pE -yE = _----"s'-- (€se 1-pE s
s
1- -) = E
P s1 (l-y)p
(3.1.15)
The mean strain for concrete strip No i is obtained from the expressian
E. -y.-(x -x) -n--~ +~l l ffi l ffi
- = =E
Cx
wh ich, using Equations (3.1.12) and (3.1.14), is re-wri tten to read
-n--~ +1-PE 1 1l m s (E ( 1-~ -n· )E_ = - -) = El 1-PE S P s p m ls
or, with n· according to Equation (3.1.7),l
(3.1.16)
All the relevant strains have now been expressed in terms of the parameters
1/ p and ES
'
3.2 Depth of the compressian zone under elastic conditions
The position of the neutral axis is calculated in the following from Equation
(3.1.1). The case characterised by purely elastic conditions is studied first.
The following relationships are obtained from FIG. 3.1b.
E~C =E - ~s
and
E~se - y=E 1 - ~s
(3.2.1)
42
From Equation (3.2.1), Hooke's law and Equations (2.1.1) and (2.2.1) we obtain
a E a f ec s c st s ~--=-----=-
E a f a e - ~c s cc s c
from which
a e a_c_ = c -;-:Z~-=- sf e - ~ f stcc s
From Equation (3.2.2) we similary obtain
a E a f f~2.=~2!2E.= _E a f a f
s s se s st
~ - y1 - ~
If we introduce the symbol
\J =f
scf st
(3.2.4)
we obtain the expression
a- y _s_- ~ f
st
The equilibrium condition (3.1.1) is now written as
1- a xb + A a + A a = O2 c se se s s
which, after multiplication by 2 and division by the reference force
N = bdf = A fc cc c cc
yields the equation
(3.2.6)
a_c_ -" +f dcc
A f a2~~~+
A f fc cc se
A f a2~~_s-=O
A f fc cc st
If the effective reinforcement ratios
As f stw =---A f
c cc
wc
A f=~~
A fc cc
(3.2.8)
43
are substituted in this, we have the expression
oc
fcc
~ + 2wc
ose-- +
fse
o2w _s_ = O
f st
The expressions (3.2.3) and (3.2.5) and the new quantity
es
w = - wo e
c(3.2.10)
are substituted into (3.2.9), which yields a second degree equation fordetermination of the depth ~ of the compression zone. The equation
~2+2W (1w w
1 c2w (1 + Y ---.S:.)+ - -)~ =o v w o v w
has the solution
w+ ~ (1
w2
w(-(1
. 1 c + .l ---.S:.)2 ( 1 + Y ---.S:.)} (3.2.11)~ = w + --) + -o v w v w w v w
o
3.3 Depth of the compression zone under elasto-plastic conditions
Under elasto-plastic conditions, the depth of the compression zone cannot be
determined explicitly. The depth is instead calculated by means of an iterativeprocess as follows. For this case, the equilibrium condition (3.1.1) is written
i n the form
il
'EI1Ao.+A o1 c el se se
+ A os s
= O
where the summation extends over the n strips into which the fictitious
compression zone is divided. If this is divided by the reference force Ncaccording to Equation (3.2.6), we have
il I1A o. A f o A f o'E __c ~ +~~~ + 2.~_s_ = OAf Aff Aff
1 c cc c cc se c cc st
or, making use of Equations (3.2.7), (3.2.8) and (3.1.6),
(3.3.1 )
When this method is selected to deal with variation of the compression zoneduring the load application process, a is a constant. It has therefore been
moved outside the summation sign. The ratio 0ci/fcc then remains inside thesummation sign. According to Chapter 2, it is this ratio which is read inthe non-dimensional stress-strain diagram for a given strain.
44
-1,0
w=O,1S
-o 5 o
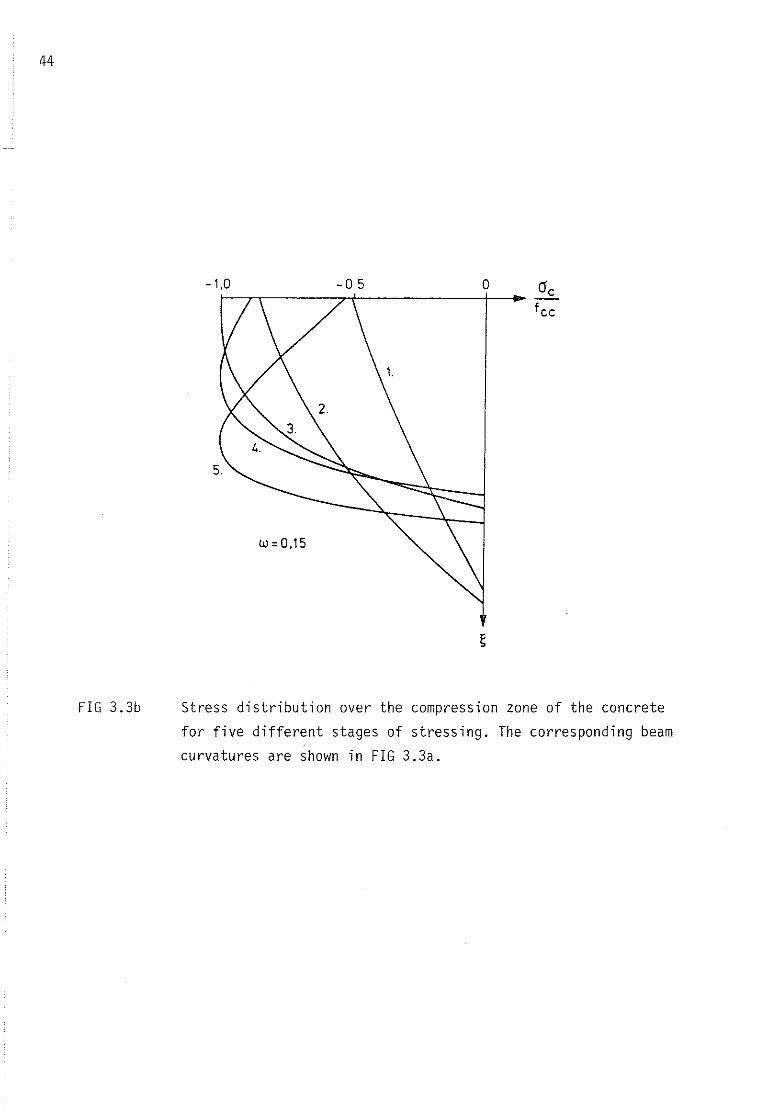
FIG 3.3b Stress distribution over the compressian zone of the concretefor five different stages of stressing. The corresponding beam
curvatures are shown in FIG 3.3a.
45
The procedure for determination of the depth of the compressian zone during
gradual increase in beam curvature will then be as follows.
A fictitious depth ~m is first determined. Trial calculations have shown that
a convenient value is
where ~o is the depth of the compressian zone under elastic conditions, calcu
lated from Equation (3.2.11).
The curvature 1/p is then allowed to increase in equal steps from O until, at
same value of l/p, material failure occurs. After each increase in 1/p an
adjustment is made to the strain ES
in the tension reinforcement, with the value
of 1/p being maintained constant, so that the equilibrium conditian (3.3.1) is
satisfied within a specified tolerance (2 - 10 °/00 of the force in the tension
reinforcement). The iterative process can be described as follows.
1. Increase 1/p to a new value which is then kept constant during the subsequent calculation steps.
2. Increase the strain in the tension reinforcement by 6E S to E s' the valueof 6E
Sbeing at first made the same as the increase in strain during the
previous change in l/p.
3. Calculate the relevant strains from Equations (3.1.14), (3.1.15) and
(3.1.16) using the values of 1/p and ES
applicable during this calculation
step.
4. From the calculated strains and the stress-strain curves for the concrete
and steel, determine the corresponding non-dimensional stresses 0Ci/fcc'
0sclfsc and o/fst '
5. Substitute the stresses obtained in 4 inta Equation (3.3.1). If this is
not satisfied within the specified tolerance, adjust the value of 6ES
and
repeat the iteration process from step 2 onwards. Once the specified tolerance
is attained in Equation (3.3.1), continue with
6. and calculate the relative depth ~ of the compressian zone from Equation
(3.1.12).
46
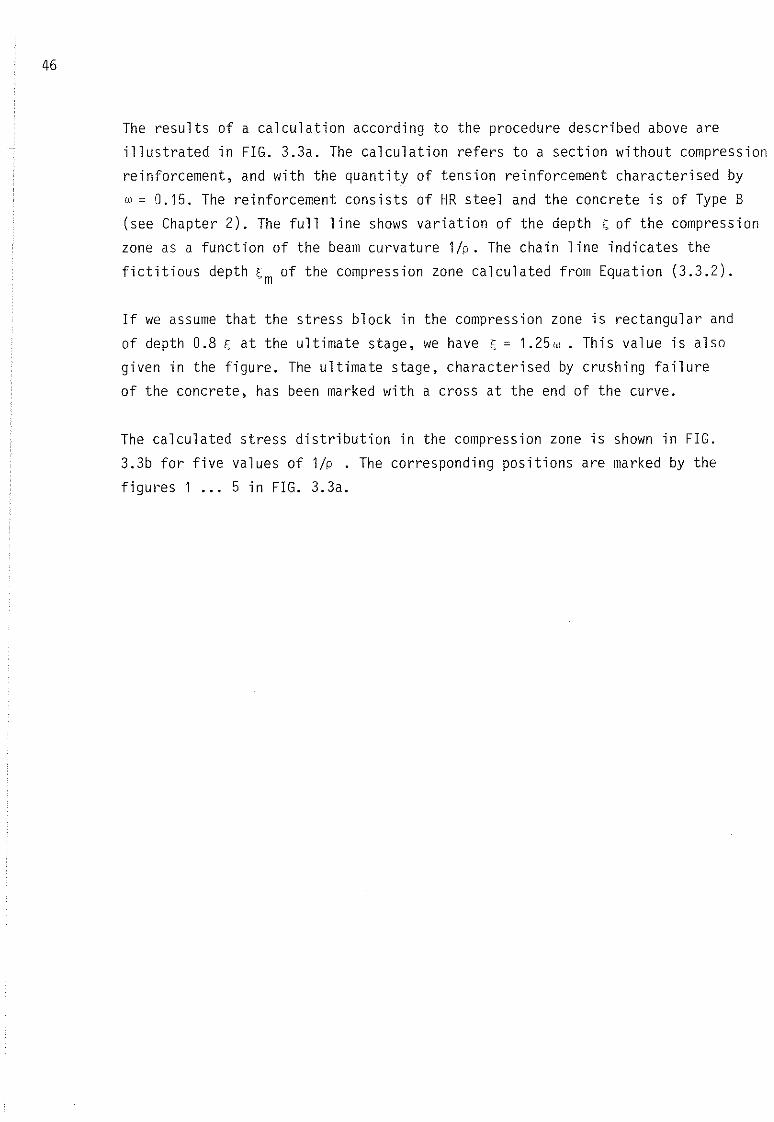
The results of a calculation according to the procedure described above are
illustrated ln FIG. 3.3a. The calculation refers to a section without compressionreinforcement, and with the quantity of tension reinforcement characterised by
w = 0.15. The reinforcement consists of HR steel and the concrete is of Type B
(see Chapter 2). The full line shows variation of the depth ~ of the compression
zone as a function of the beam curvature 1/p. The chain line indicates the
fictitious depth ~m of the compression zone calculated from Equation (3.3.2).
If we assume that the stress block in the compression zone is rectangular and
of depth 0.8 ~ at the ultimate stage, we have ~ = 1.25w . This value is also
given in the figure. The ultimate stage, characterised by crushing failure
of the concrete, has been marked with a cross at the end of the curve.
The calculated stress distribution in the compression zon e is shown in FIG.
3.3b for five values of 1/p . The corresponding positions are marked by the
figures 1 ... 5 in FIG. 3.3a.
47
4 MOMENT-CURVATURE DIAGRAM
Onee the depth of the compressian zone has been determined aeeording tothe proeedure deseribed in the previous ehapter (as a fundtion fo the eurvature 1/p ), the moment-eurvature diagram can be ealeulated.
For the purely elastie ease it is most eonvenient to relate the momentequilibrium to the position of the resultant of the eonerete stresses. Usingthe symbols in Chapter 3 and FIG. 3.1a, we thus have
M + F (l x-c) - F (d - l x) = ose 3 s 3
(4 . i )
where Mis the bending moment. If we introduee inta Equation (4.1) the
express ians Fse = Ase iJse and Fs = As iJs ' and di vi de by the referenee moment
M = N d (4.2)c c
we have the moment in a non-dimensional form
A f iJ-~~~
A f fc cc se
1(- ~-y)3
(4.3 )
Substitution of the effeetivereinforeementratios w and Wc according toEquations (3.2.7) and (3.2.8) respeetively, and of Equation (3.2.5), intaEquation (4.3) yields
iJ i~ = w __s__ (1 - -~) +
f st 3
iJs i~-y(l )w -- -~-y
c f st v 1 - ~ 3(4.4)
The beam curvature is calculated from the Equation (3.1.11) and Hooke's law,and i s written
es
iJS
- ~ f st(4.5)
If the ratio iJs/fst is eliminated from the expressions (4.4) and (4.5), wehave
(4.6)
48
where the non-dimensional bending stiffness 6 is
6 = we {( 1s
1 1 w 1-3 ~)(1 - ~) + - ~ (y - - s)(y - ~)}
\) w 3 (4.7)
Expressian (4.6) gives the relation between the curvature 1/p and the bending
moment ~, the stiffness 6 for elastic behaviour and the given depth ~ of the
compression lone being determined from Equation (4.7).
Under elasto-plastic conditions it is more convenient to relate the momentequilibrium to the bottom edge of the fictitious compression lone, see FIG.
3.1a and b. We then have the relation
M - F Y + F (x - c) - F (a - x ) = oeL c se ID s ID
(4.8)
where Yc is the ordinate of the position of the resultant Fc of the concrete
stresses. Equation (4.8) is re-written as
nM - ~ LA a .y. + A a (x - el - A a (a - x l = o
C el l se se ID s s ffi
which, after division by the reference moment Mc, yields the non-dimensional
moment
A f t as s s ( )+ - -- -- l-s
A f f mc cc st
A f a-~~~
A f fc cc se
Substitution of w, Wc and ni according to Equations (3.2.7), (3.2.8) and(3.1.7) into Equation (4.9) yields the expression
a+ w {(l-s) _s_ +
m fst
w a)
c se(y-s - --)m w f
se
(4.10)
For selected value of 1/p the procedure in Chapter 3 gives the correspondingdepth ~ of the compression lone. The strain distribution is then known and
the corresponding stresses 0ci/fcc' 0s/fst and asc/fsc can be determinedwith the aid of the stress-strain diagrams for the steel and concrete, afterwhich the moment is calculated from Equation (4.10). By successive repetitionof this procedure for values of l/p increasing in discrete steps, a momentcurvature curve is determined for the section.
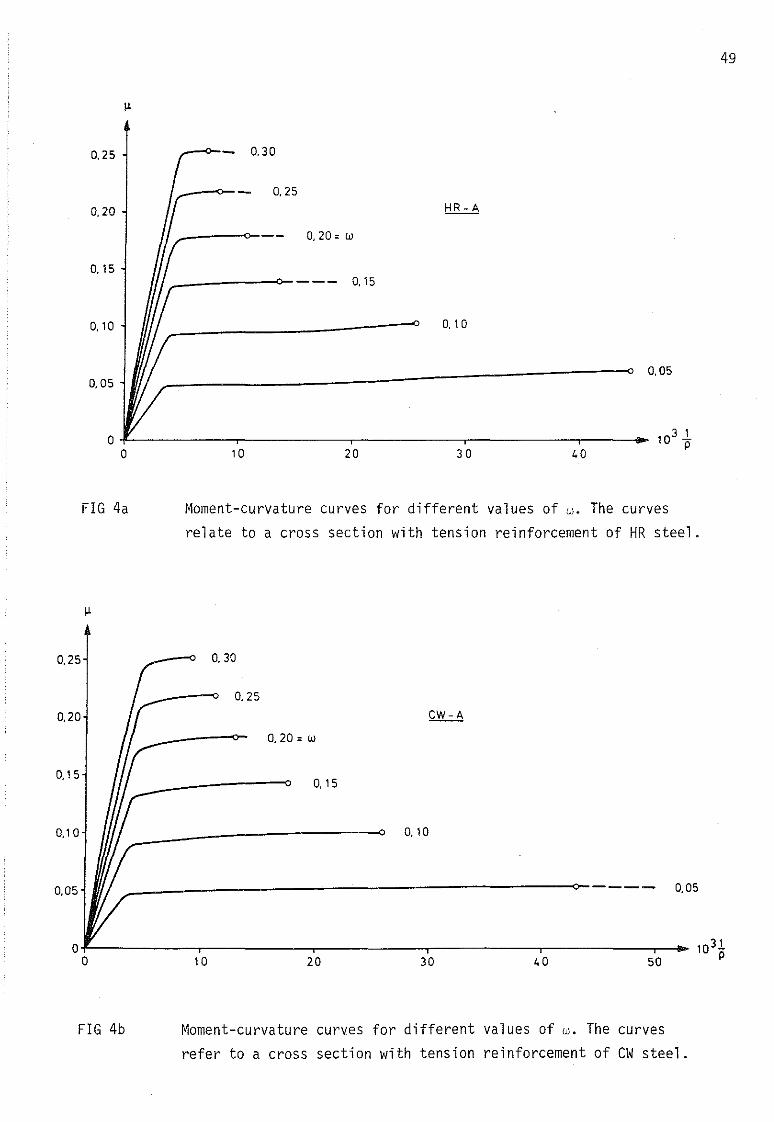
As an example of the results obtained according to the calculation techniquedescribed above, FIG. 4a shows the moment-curvature curve for a sectionwithout compression reinforcement for different values of w. The calculation
refers to HR steel and concrete of Type A.
0,25 r 0,30
r 0,25
0,20 HR-A
0,20 = w'f
0,15-- 0,15
If0,10 0,10
t0,05
0,05
103 l-oo 10 20 30 40
P
49
FIG 4a Moment-curvature curves for different values of w. The curvesrelate to a cross section with tension reinforcement of HR steel.
0,25 ~ 0,30
0,25
0,20If CW-A
0,20 = w
'r0,150,15
r-0,10 I 0,10
0,05 ~ 0.05
Vo 1031
o 10 20 30 40 50 P
FIG 4b Moment-curvature curves for different values of w. The curvesrefer to a cross section with tension reinforcement of CW steel.
50
0.25
0.20
0.15
0.10
0.05
CES - A
- 0.30
_-0-__ 0.25
_---0--- 0.20=w
0.15
0.10
0.05
10
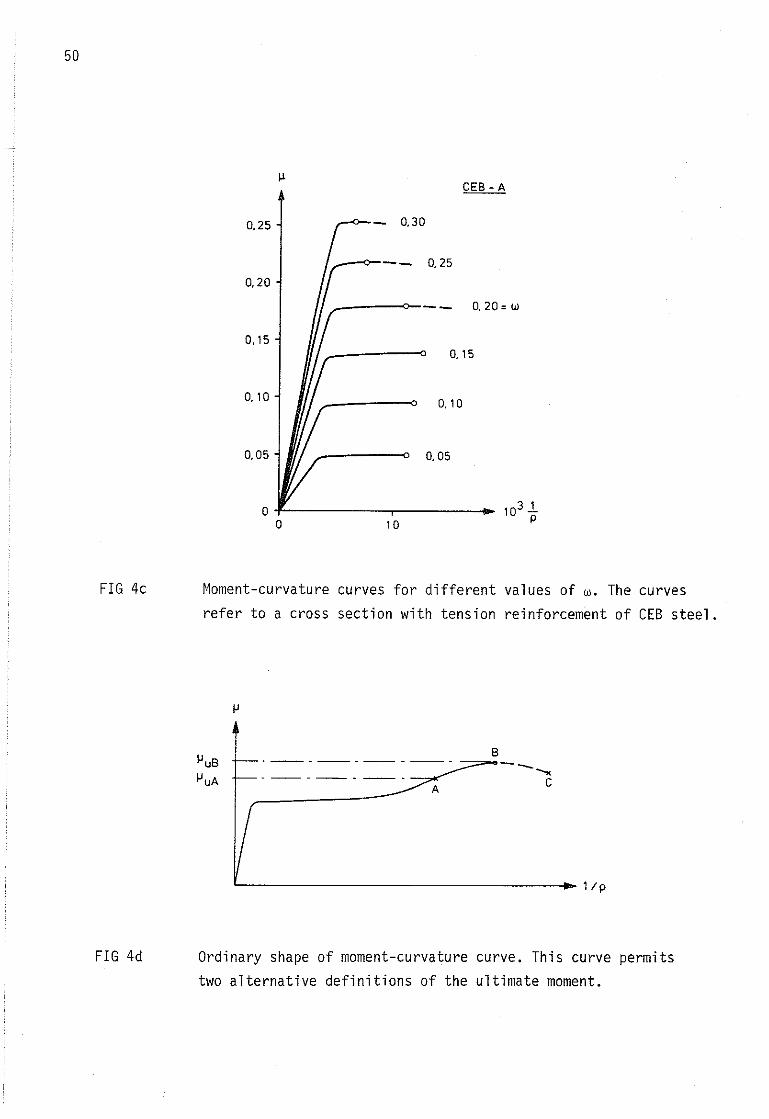
FIG 4c
O""------~-----O
Moment-curvature curves for different values of w. The curvesrefer to a cross section with tension reinforcement of CES steel.
~uB
~uA
B
._'-'-~ --~,--,--.--. CA
l/p
FIG 4d Ordinary shape of moment-curvature curve. This curve permitstwo alternative definitions of the ultimate moment.
51
For purposes of comparison, FIG. 4b and 4c show the corresponding momentcurvature-curves for CW steel and CEB steel. All calculations have beencarried as far as the ultimate strains of the steel and concrete permit.
When some convenient definition of the ultimate moment has been deci~ed on,this can be read off the moment-curvature diagram. If the loading processis assumed to be force-controlled, and this is the assumption made in the
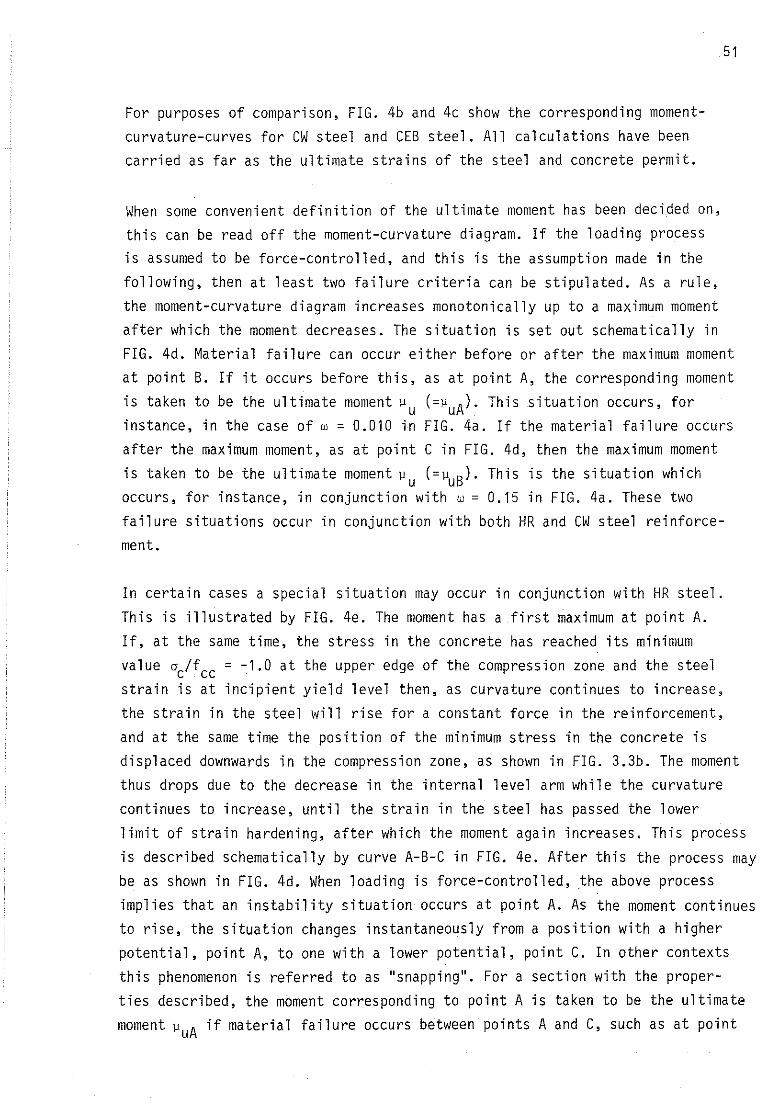
following, then at least two failure criteria can be stipulated. As a rule,the moment-curvature diagram increases monotonically up to a maximum momentafter which the moment decreases. The situation is set out schematically inFIG. 4d. Material failure can occur either before or after the maximum momentat point B. If it occurs before this, as at point A, the corresponding moment
is taken to be the ultimate moment ~u (=~uA)' This situation occurs, forinstance, in the case of w = 0.010 in FIG. 4a. If the material failure occursafter the maximum moment, as at point C in FIG. 4d, then the maximum moment
is taken to be the ultimate moment ~u (=~uB)' This is the situation whichoccurs, for instance, in conjunction with w = 0.15 in FIG. 4a. These twofailure situations occur in conjunction with both HR and CW steel reinforcement.
In certain cases a special situation may occur in conjunction with HR steel.This is illustrated by FIG. 4e. The moment has a first maximum at point A.If, at the same time, the stress in the concrete has reached its minimum
value Gc/fcc = -1.0 at the upper edge of the compression zone and the steelstrain is at incipient yield level then, as curvature continues to increase,the strain in the steel will rise for a eons tant force in the reinforcement,and at the same time the position of the minimum stress in the concrete isdisplaced downwards in the compression zone, as shown in FIG. 3.3b. The momentthus drops due to the decrease in the internal level arm while the curvature
continues to increase, until the strain in the steel has passed the lowerlimit of strain hardening, after which the moment again increases. This processis described schematically by curve A-B-C in FIG. 4e. After this the process maybe as shown in FIG. 4d. When loading is force-controlled, the above processimplies that an instabil ity situation occurs at point A. As the moment continuesto rise, the situation changes instantaneously from a position with a higherpotential, point A, to one with a lower potential, point C. In other con textsthis phenomenon is referred to as "snapping". For a section with the properties described, the moment corresponding to point A is taken to be the ultimatemoment ~uA if material failure occurs between points A and C, such as at point
52
~uE
~uD
~uA
E
~=~-=---=--~-----~D F-t-- -_="""'_ - -- - ---
A --""""----- CB
l- .,. 1lp
FIG 4e
FIG 4f
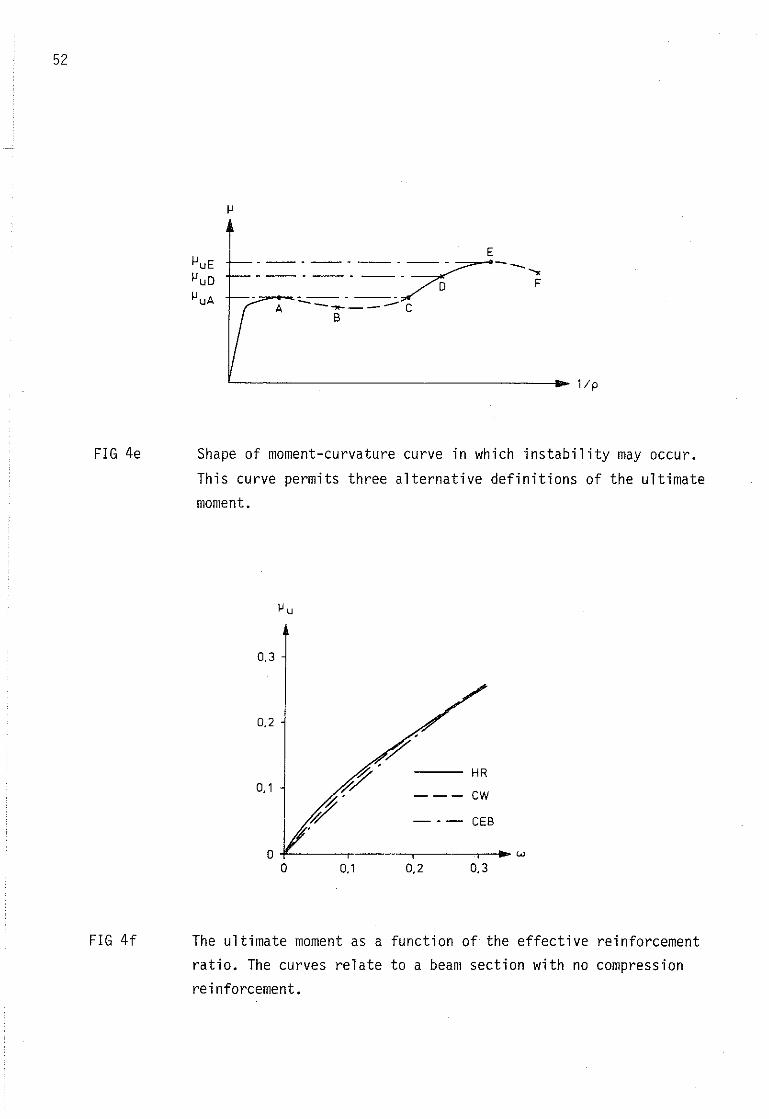
Shape of moment-curvature curve in which instabil ity may occur.
This curve permits three alternative definitions of the ultimatemoment.
~u
0,3
0,2
~
#' HR0,1
CW0' ---
f7 --- CEB
O w
O 0,1 0,2 0,3
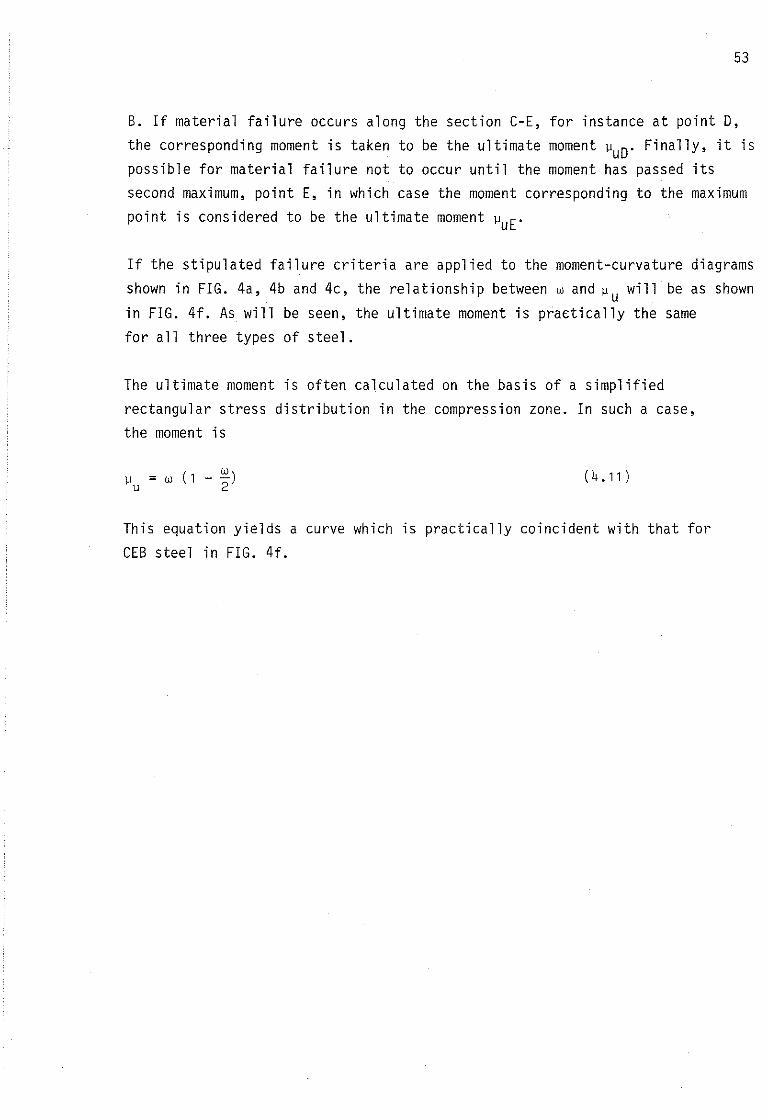
The ultimate moment as a function of the effective reinforcementratio. The curves relate to a beam section with no compressionreinforcement.
53
B. If material failure occurs along the section C-E, for instance at point D,
the corresponding moment is taken to be the ultimate moment ~uD. Finally, it ispossible for material failure not to occur until the moment has passed itssecond maximum, point E, in which case the moment corresponding to the maximum
point is considered to be the ultimate moment ~uE.
If the stipulated failure criteria are applied to the moment-curvature diagramsshown in FIG. 4a, 4b and 4c, the relationship between w and ~u will be as shown
in FIG. 4f. As will be seen, the ultimate moment is practical ly the samefor all three types of steel.
The ultimate moment is often calculated on the basis of a simplifiedrectangular stress distribution in the compression zone. In such a case,the moment is
~ =w(l--"'-) (4.11)il 2
This equation yields a curve which is practical ly coincident with that forCEB steel in FIG. 4f.

55
5 DEFORMATION ENERGY
The calculation technique which results in the derivation of the momentcurvature diagram for an arbitrarily selected section in a reinforced conbeam, under elastic and elasto-plastic conditions, was developed in Chapters3 and 4. This will be complemented below by calculation of the correspondingconsumption by the cross section of deformation energy per unit length ofthe beam, a moment-energy relation being constructed.
The quantity of internal energy 6W per unit length of the beam which is storedduring the increase in curvature 6(1/p), i.e. during one calculation step, is
nD~ = L DA o .D€.+A o DE +A o DE
1 C el l se se se s s s( 5 . 1 )
where 6W includes both reversible and irreversible energy consumption.
The increments in strain 6€sc and 6€i corresponding to the increase incurvature 6(1/p) are obtained by partial differentiation of the expressions(3.1.15) and (3.1.16). The following expressions are obtained
62se
1= -( l-y) ·6(-)+62
p s
6€. = (0.(-21 - i) + ~ -1) ·6(..1.-)+6€l ID P s
with the increment in strain 6€s determined by means of an equilibrium condition according to Chapter 3.
The stresses contained in Equation (5.1) are obtained from the stress-straindiagram of the section component concerned, the stresses being referred tothe centre of the corresponding strain interval 6€.
If 6W according to Equation (5.1) is divided by the reference force Nc 'the increase in consumed deformation energy per unit length of the beam is
obtained in non-dimensional form
n 6A eJ.I __c ~ M.
A f l1 c cc
A f (J
+~~~!J.EA f f se
c cc se
A f (Js st s+ - -- -- 62
A f f t sc cc s
Substitution into the above of Equations (3.1.6), (3.2.7) and (3.2.8) yields
56
n a .el1'.1); = 1'.1); +1'.1); +1'.1); =Ci. l: f I'.E.+W
C se s 1 cc l C
Use of Equations (5.2) and (5.3) yields the following for the contributionof the compressed concrete to the deformation energy per unit length of thebeam
= Ci.
n a .l: ~
f1 cc
For the contribution of the compression reinforcement, we have
1'.1);se
w ac se= w --
w fse
1((y-1)I'.(-)+I'.E )P s
and for the contribution of the tension reinforcement
a=w_s_ 1'.,
fst
s
The total deformation energy per unit length of the beam consumed at the
prevailing state of deformation is obtained by summation from zero up to theappropriate value of the curvature 1/p • We then have
With 1/p as the governing parameter, associated values of 1); and)J can now becalculated according to Equations (4.10) and (5.9). In this way the momentenergy relation sought is obtained.
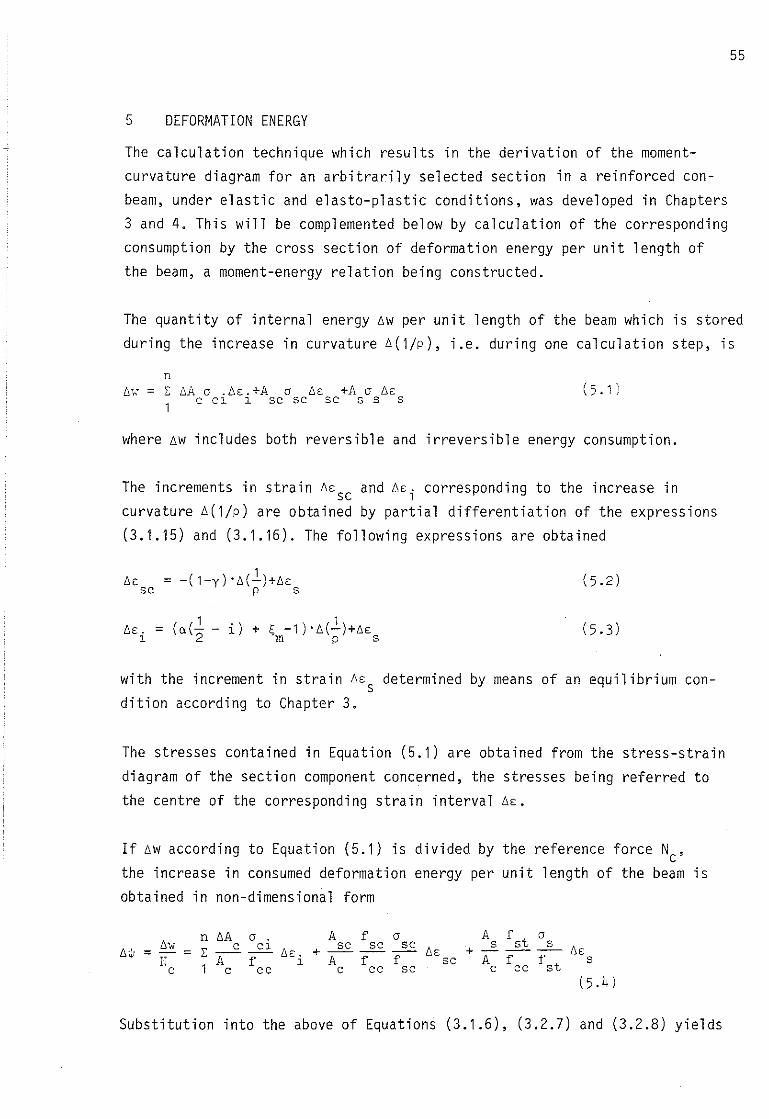
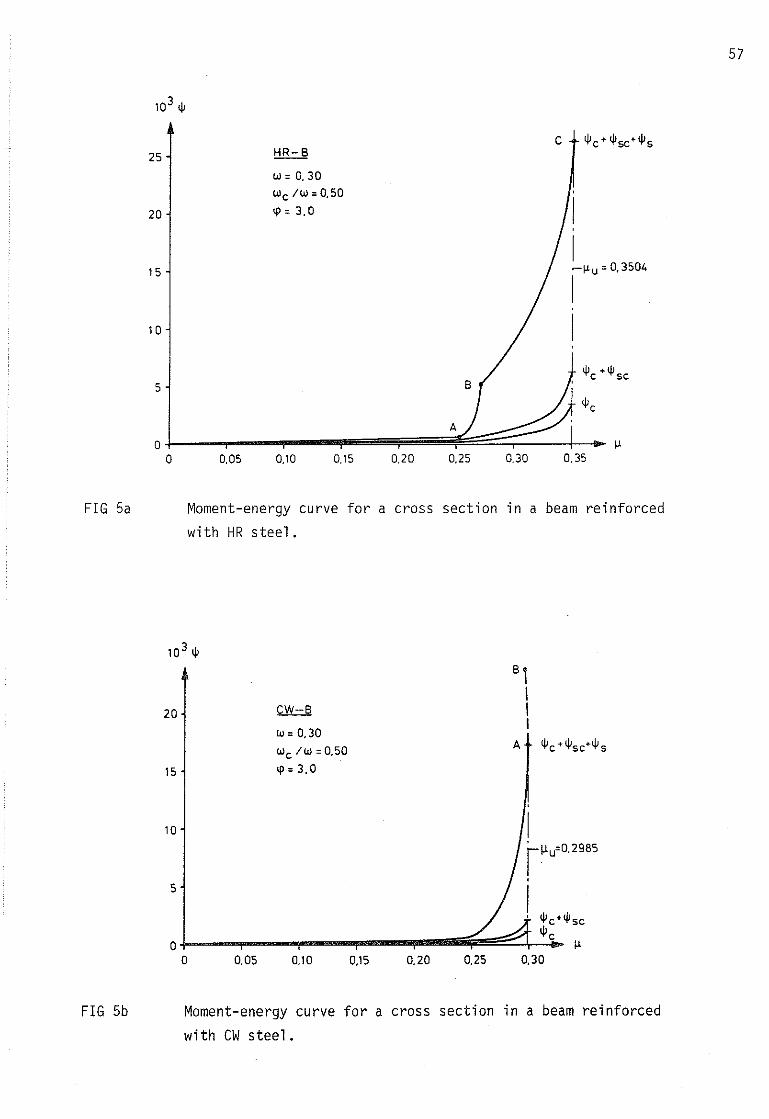
As an example of the results of such a calculation, FIG. 5a shows the)J - 1);
relation for a cross section of concrete Type B reinforced with HR steel.The effective reinforcement ratio is w = 0.30 on the tension side and
w = 0.15 on the compression side. The example chosen includes the effectof creep in the eonerete, the creep factor being ~= 3. The effect of creepon the rotation capacity is studied in Chapter 8. The only reason why creephas been included in this case is that the figure is clearer as a result. Thefigure shows three curves, of which the bottom one represents the share ofthe concrete 1);c in the energy consumption. The centre curve gives the energyconsumption in the compression zone of the beam
57
HR-S
w = 0.30
Wc /w =0.50tp = 3. O
25
20
15
10
5
0,05 0.10 0,15 0,20 0.25 0.30
I
I-I-'u =0.3504
I
I
0,35
FIG 5a Moment-energy curve for a cross 5ection in a beam reinforcedwith HR steel.
20
15
cW-S
W = 0.30
Wc /w =0.50
tp = 3. O
0.300.250.200.150.100.05
IrlJ.u=0.2985
,
I, <Pc+<P sc1 ...,..__""""iI"""__"I""_......,....._iiiiiiiE;;;::::::::+-<P:.c~
01'O
5
10
FIG 5b Moment-energy curve for a cross section in a beam reinforced
with CW steel.
58
i.e. the quantity of deformation energy per unit length of the beam which isstored by the compressed concrete and the compression reinforcement takentogether.
The top curve shows the total energy consumption of the cross section perunit length of the beam. Point A in the figure represents the state of affairsin the cross section when the tension reinforcement reaches the upper yieldstress, i.e. when E
S= EZ' Point B represents the state of affairs when the
tension reinforcement reaches the lower strain hardening limit E 1. Finally,point C represents the ultimate state which in this case is characterised bycrushing failure of the concrete.
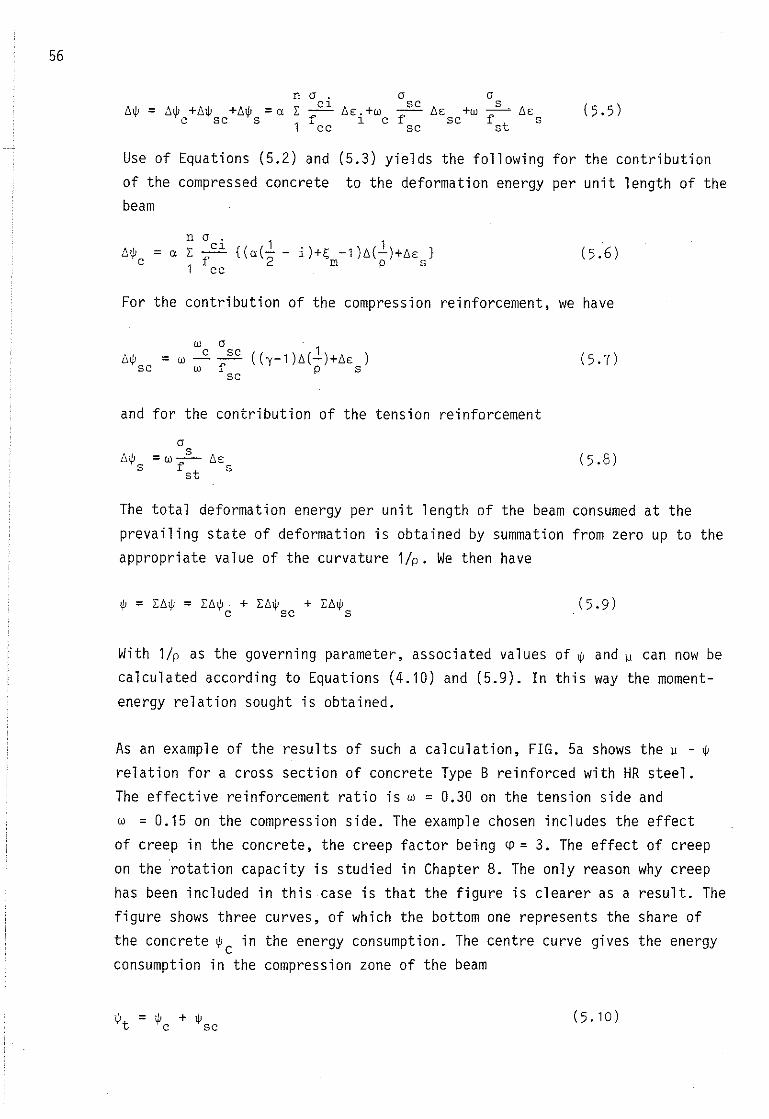
A corresponding ~ - ~ curve for a beam reinforced with CW steel but in otherrespects similar to the previous case is shown in FIG. 5b. The tension reinforcement fails at point B. However, this diagram is utilised only upto point A which is characterised by the fact that the ultimate moment ~u
here is equal to the maximum moment.
59
6 ENERGY BALANCE
In the following, the rotation span of a plastic hinge refers to the partof the beam between the plastic hinge and the nearest point where the momentis zero. A discontinuous plastic hinge has two rotation spans, one on eachside of the hinge, while a continuous plastic hinge, for instance one at afixed end, has only one rotation span. In the following, only conditions onone side of a plastic hinge will be studied, whether it is a discontinuousor continuous hinge.
The length of the rotation span is detoned lo' The value of lo generallyvaries somewhat during application of the load. However, the simplifyingassumption is made here that lo is constant and equal to the length corresponding to the ultimate moment Mu of the plastic hinge. Most of the energyinterchange during a complete loading process occurs for moments of thismagnitude, and the variation in the length of the rotation span which occursin the region around the zero moment can therefore be considered to have anegligible effect on the total energy situation of the span.
In the following, a calculation is first made of the external work requiredfor deformation of the rotation span, the deformation energy simultaneously
stored in the span is then determined according to Chapter 5, and final ly anenergy balance is drawn up from which the elasto-plastic rotation, the rotation capacity, is calculated.
6.1 The external work
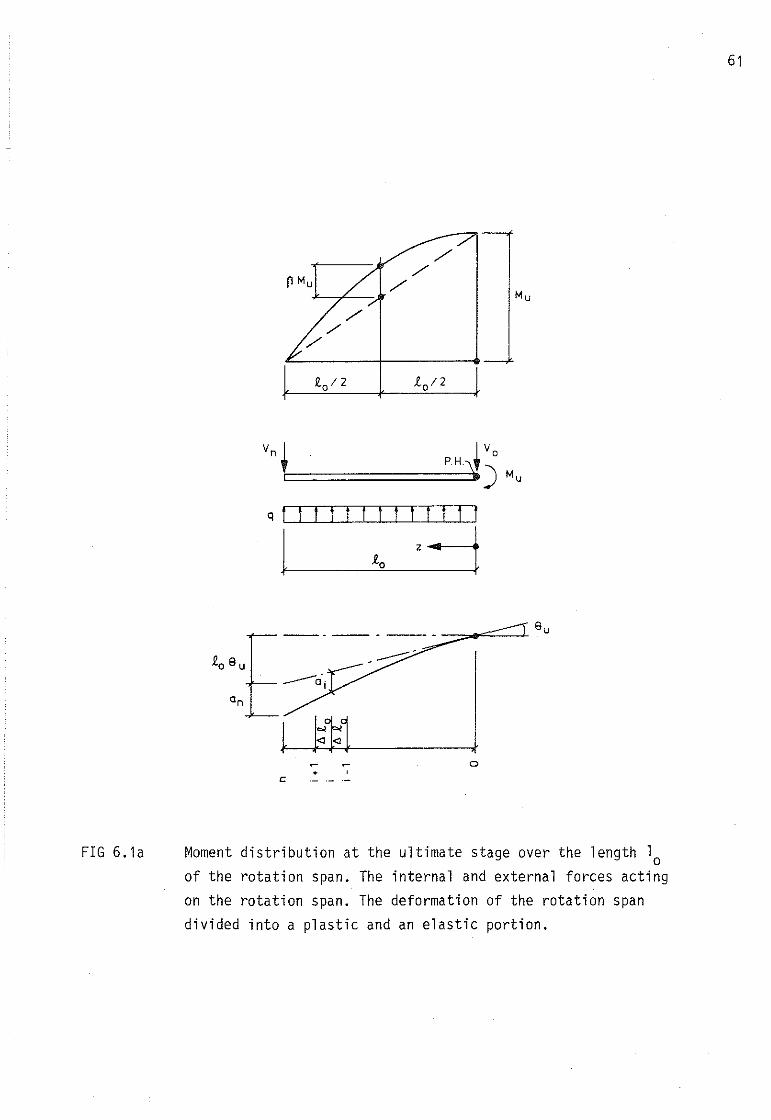
FIG. 6.1a shows the rotation span of length lo between a plastic hinge PHto the right and a point of zero moment to the left. At its left-hand end,the part of the beam is acted upon by the shear force Vn. At its right-hand
end it is acted upon by the ultimate moment Mu and the shear force Vo' Thespan is assumed to carry a uniformly distributed load q. The variation of
moment over the length of the span is thus parabolic, as shown in the uppermoment diagram in the figure. Under this assumption, the moment variation isuniquely characterised by a coefficient S according to the figure, whichexpresses the difference between this moment variation and a linear variation
shown das hed in the figure.
The above method of describing the moment variation does not cover all
conceivable situations. Examples of such cases are a uniformly distributedload over part of the span, and one or more point loads placed between the
60
plastic hinge and the point of zero moment. On the other hand, this methodpermits uncomplicated treatment of the loading situations which most oftenoccur in practice.
The following values of S can occur. See FIG. 6.1b.
S ~ -0.06 represents the moment variation adjacent to a plastic hinge neara support section when the beam carries a uniformly distributed load.
S ~ O represents the variation adjacent to a plastic hinge which is situatedeither near a support section or in the span when the beam is acted upon bypoint loads.
S ~ 0.25 represents the moment distribution near a plastic hinge in the span
when the beam carries a uniformly distributed load.
The moment distribution can be written as
M ~ (1 - ~)(1 + 4$ ~)Ml l il
o o
(6.1.1)
If the rotation span is divided into n equal parts each of length 610
, as
shown in FIG. 6.1a, the relation
z i-= -l n
o
applies at point No i.
(6.1.2)
Substitution of Equation (6.1.2) into Equation (6.1.1), and simultaneousdivision by the reference moment Mc according to Equations (3.2.6) and (4.2)
gives the non-dimensional moment at point No i as
M. ~
~. =~ = ~ (n-i)(n+4$i)/n~l M u
c
(6.1.3)
The relation between S and q is written according to the figure
J.. q12 = SM8 o il
/
~ Mu/
/Mu
././
./
Q.o/2 L o /2
Vn • roPH\) Mu!
q
l z ..
tLo
__ . __ • -:::::=o-<_==--1. 8 u
61
~. , o
FIG6.1a Moment distribution at the ultimate stage over the length lo
of the rotation span. The internal and external forces actingon the rotation span. The deformation of the rotation spandivided into a plastic and an elastic portion.
62
or
(6.1.4)
Moment equilibrium for the part of the beam under consideration gives
M + l q12 - V l = O
u 2 -o n o
from which, by making use of Equation (6.1.4), we calculate
MV = (1+4S)~
n lo
(6.1.5)
(6.1.6)
Under the influence of the forces acting on the beam, the rotation span is
deformed according to the lower figure in FIG. 6.1a. The deflection isdivided into an inelastic and an elastic part.
In an initial phase, all deformations are elastic. During this phase theexternal load rises from zero to a value qy which is attained when plasticflow begins in the section where the moment is a maximum, i.e. at the theoretical plastic hinge. At the same time as this occurs, the bending momentat the plastic hinge is My and the shear force at the point of zero moment isVy' In this situation, the relations corresponding to Equations (6.1.4) and(6.1.6) are
(6.1.7)
and
(6.1.8)
As the external load increases from the yield value qy to the ultimate value q,there is plastic rotation about the plastic hinge, and at the same time theelastic deflection at the point of zero moment increases to its maximum valuean' The elastic part of the deflection at the arbitrary point No i is corres
ponding denoted ai .
Computationally, the inelastic deformation is treated as a rotation of the
rotation span, considered as a rigid body, through an angel Bu about theplastic hinge. According to the definition, Bu represents the rotationcapacity of the plastic hinge on the side being considered. When failureoccurs, the maximum inelastic deflection at the point of zero moment is
loBu'
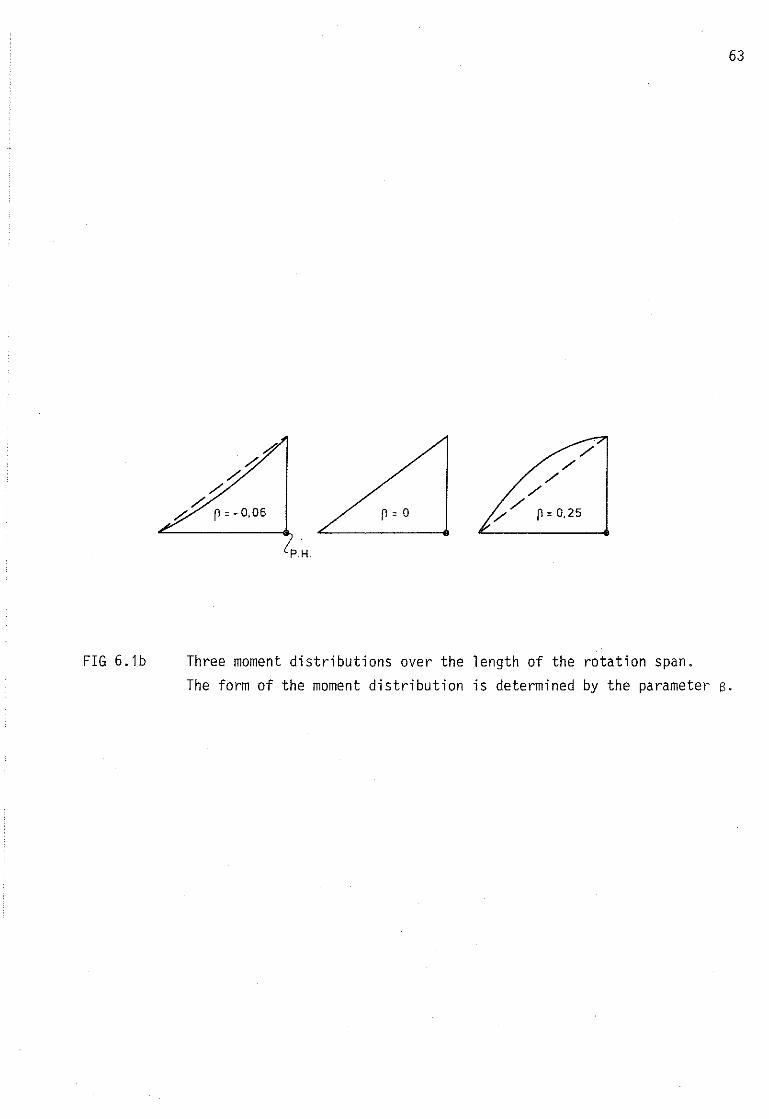
63
././
././
././ 0: 0.25
PH.
FIG6.1b Three moment distributions over the length of the rotation span.The form of the moment distribution is determined by the parameter s.
64
The relationship between beam deformation and plastic hinge moments overthe moment interval My - Mu' i.e. over the elasto-plastic loading range, isdependent on a number of factors among which the shape of the stress-straindiagram of the reinforcing steel is dominant. In view of all the other uncertainty which is associated with this type of calculation, the followingderivation has been based on the approximate assumption that the aboverelationship is linear.
The total external work which is performed during the loading phase up to
fa il ure i s thus
w = lv a + l(v +V )8 le 2 n n 2 y n u o
1n
- -1:'1./11 a.2
1o l
1 1- -(a +'1)1 '-8 l27 o2uo
(6.1.9)
With reference to FIG. 6.1a the following comments are made concerning thevarious terms in this relation.
The first term refers to the elastic work performed by the shear force at
the point of zero moment as the force rises from zero to its maximum valueVn, and at the same time the elastic part of the deflection at the same section
increases to its final value an'
The second term refers to the plastic work performed by theshear force atthe point of zero moment. Up to the value V no plastic work is done. As they .shear force then increases from Vy to Vn, the mean force during the plasticloading phase is (Vy + Vn)/2. This acts over the plastic part of the deflection
8ulo'
The third term refers to the elastic work performed by the ultimate load q
when the elastic part of the beam deflection, as the load increases, risesto the final value ai at the point No i.
The fourth term, final ly, refers to the plastic work performed by the dis
tributed load. Up to the value qy no plastic work is done. As the load thenrises from the yield value qy to the ultimate value q, the resultant of the
mean load during the plastic loading phase is (qy + q)lo/2. This resultant,which acts at the centre of this part of the beam, acts over the deflection
8ulo/2.
65
The section forces Vo~and Mu are also shown in FIG. 6.1a. All displacementshave been related to the plastic hinge which, in this derivation, has beenassumed to be a point incapable of displacement. The work done by the shearforce is therefore equal to zero. Nor has the ultimate moment Mu which actsat the plastic hinge been included in Equation (6.1.9) because, in thiscontext, Mu may be considered to be an internal moment. That this is so isevident if we imagine that the plastic hinge being considered occurs overan intermediate support in a continuous beam, and consequently envisage thepart of the beam being considered to comprise the section 21 0, placed symmetrically with regard to the plastic hinge.
Substitution of qyl02 according to Equation (6.1.7), ql02 according to Equation (6.1.4), and Vn and Vy according to Equations (6.1.6) and (6.1.8) respectively into Equation (6.1.9) yields
M 1 a+ --Z)M e + -( 1+4S)M --'"' -
M u u 2 ulu o
1\1 n a.4SM ~E--1o.
u l 1 lo o(6.1.10)
If this is divided by the reference moment Mc and it is noted that 1\1 0/1 0 =
1/n, we have the external work in a non-dimensional form
W 1~ =~=-(1~e M 2
c
1 d a+ -(1+4S)~ ---'"'-
2 u l do
(6.1.11)
If we introduce the symbol
lJe =.....2. (6.1.12)
d
for the non-dimensional length of the rotation span (the slenderness of thespan), the relation (6.1.11) can be written as
1~ = {-t 1
e 2
~ 1 1 a+ --Z) e + -( 1+4S)- --'"' -
~ u 2 Je du
(6.1.13)
The elastic deflection ai and an are calculated with the aid of finite dif
ferences. We thus have the relation
a. 1-2a.+a'+11- l l
(1\1 )2o
=-r.
l
(6.1.14)
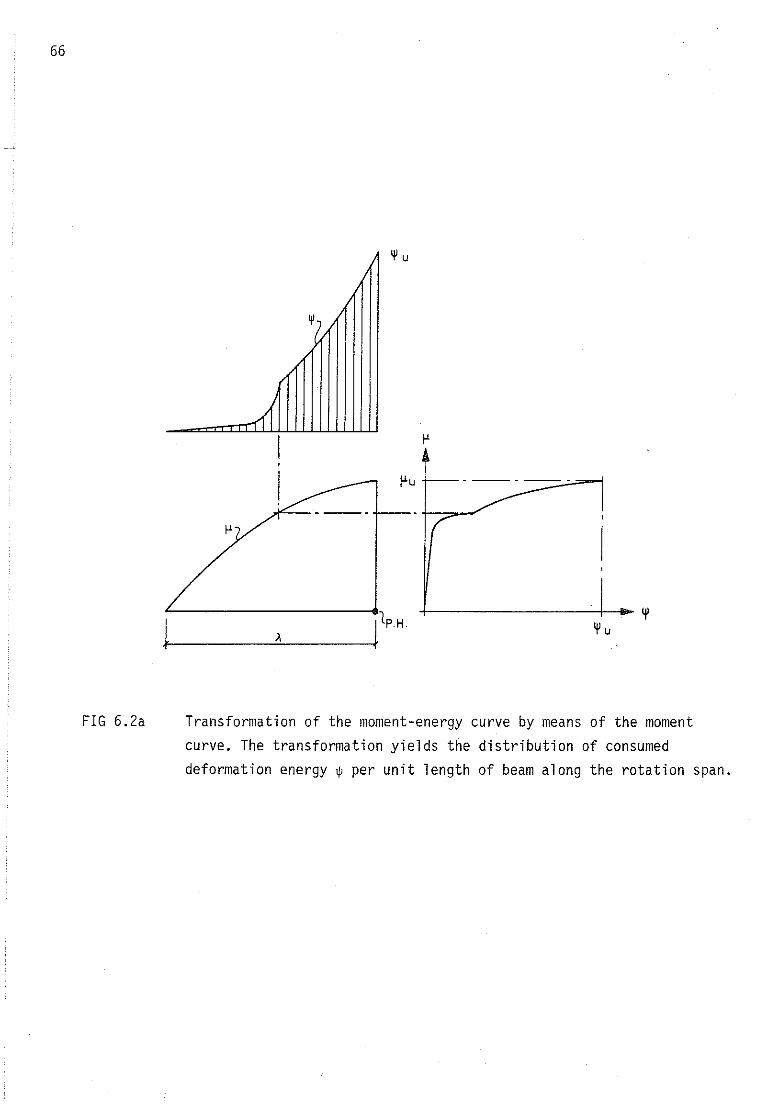
66
,;.::::...- ----+--
1I l PH~~--_---!!._---\
FIG 6.2a Transformation of the moment-energy curve by means of the moment
curve. The transformation yields the distribution of consumeddeformation energy ~ per unit length of beam along the rotation span.
67
where r i is the radius of curvature at point No i under elastic conditions.The relation is re-written as
111 2 l 2 d A2 1= (-.-Q) (-9.) _ = __
l d r. 2 p.o l n l
(6.1.15)
where Pi = ri/d is the non-dimensional radius of curvature at point No i.
If we introduce the non-dimensional deflection
(6.1.16)
into Equation (6.1.14), we have the difference equation
(6.1.17)
Since the portion of the beam is rigidly fixed at the plastic hinge withrespect to elastic deflection, the boundary conditions
K = Oo
apply there, and when these are substituted into Equation (6.1.17), we havethe deflection at the first subdivision point (i = 1) as
1 1K =--
l 2 Po
From Equation(6.t.U) we obtain the recursion formula
1K. 1 = 2K. -K. 1 + -
1+ l 1- p.l
(6.1.18)
(6.1.19)
for successive calculation of the elastic part of the deflection.
When the elastic beam curvature required for calculation of ai and an inEquation (6.1.13) is to be determined, the calculation cannot be based on thedepth of the compression zone which corresponds to purely elastic behaviourof the cross section. It must be borne in mind that, in actual fact, conditionsare elaste-plastic, and the corresponding compression zone depth must be used.
It was shown in Chapter 3 how the depth s to the compression zone can be determined as a function of the elasto-plastic curvature. Chapter 4 describes thecorresponding determination of the bending moment~. Using the elasto-plasticcurvature as the governing parameter, a ~ - s relation can be calculated in
this way.
68
It is now possible to calculate the moment ~i from the expression (6.1.3) forevery subdivision point in the rotation span, and then to determine the corresponding value of ~ from the ~ - ~ relation obtained as above. This, when
substituted into Equation (4.7), gives the bending stiffness 6. The soughtelastic curvature is then obtained from Equation (4.6).
Finally, substitution of the non-dimensional elastic deflection according toEquation (6.1.16) into Equation (6.1.13) gives the non-dimensional externalwork in the form
1~ = -( 1
e 2
~
+ -L)8 ~~ u uu
(6.1.20)
6.2 The consumed deformation energy
The way in which the relation between the non-dimensional deformation energy~ per unit length of beam and the non-dimensional bending moment ~ can bedetermined was shown in Chapter 5. Such a relation is shown, for instance,in FIG. 5a. This relation is reproduced in principle, but with another orientation, in FIG. 6.2a along the moment diagram of the rotation span. The waythe ~ - ~ relation can be transformed via the moment diagram so as to give
the distribution of ~ along the length A of the rotation span is evident fromthe figure. The total deformation energy consumed within the beam volume ofthe rotation span is thus equivalent to the dashed area in FIG. 6.2a. With thesame subdivision of the span as that applied in Section 6.1, we obtain thefollowing relation for the total energy - see also Equation (5.4)
lVI. = IN ~.lll . = N III I~. = N -2.I~. (6.2.1)
l elO COl cnl
If this expression is divided by the reference moment Mc = Ned, the totalconsumed deformation energy is obtained in non-dimensional form as
W. l 1~. = -l. = -2. - I~.
l H d n lc
A n= - I~.
n 1 l
(6.2.2)
6.3 Energy balance
The total consumed deformation energy ~i is equal to the work ~e performed bythe external forces within the rotation span, i.e.
(6.3.1)
69
If we substitute into this expression ~ according to Equation (6.1.20) ande~i according to Equation (6.2.2), we have
1 \l- (1 +.1)8 \l2 \l u il
il
A EK.+ ---2 {(1+4S)K -8s l }\l
2n n n u
A= - E1jJ.
n l
from which the rotation capacity is calculated as
1 E1jJ. 1 EK.{ l + t8s l _
\l n 22 nu n(6.3.2)
8u-=
Equation (6.3.2)
program. Results
foll owi ng.
( 1+4s) K )} ---"02_n \l
+.1\lu
has been used as the basis for the development of a computer
of calculations using this program are set out in the

71
7 DEPENDENCE OF THE ROTATION CAPACITY ON THE SHAPES OF THE STRESS-STRAINDIAGRAMS FOR THE STEEL AND CONCRETE
The rotation capacities for the three typical steels HR, CW and CEB, combinedwith the two concrete types A and B described in Chapter 2, are first calculated. The calculation is made for three moment distributions correspondingto S= 0.25, S = O and S = -0.06 according to Chapter 6. The object of thisinvestigation is to show the general effect on the rotation capacity due tothe different shapes of the stress-strain diagrams for the steel and eonerete.
The way the rotation capacity changes when there are deviations from theparameter values seleeted in Chapter 2 for the description of the stress-straindiagrams of the three typical steels and the two concrete types is then demonstrated. For the sake of clarity, results are only shown for a moment distribution corresponding to S = 0.25, i.e. the moment distribution which occursin conjunction with a plastic hinge which is not acted upon by large shearforces.
The results are set out in the form of diagrams, with the effective reinforce
ment ratio as the abscissa and 8u/A as the ordinate. The value of w is madeto vary between the limits 0.04 and 0.31, which ought to cover all situations
that normally occur.
7.1 Different combinations of typical steels and concrete types
If HR steel is combined with concrete types A and B, results according toFIG. 7.1a are obtained. The two families of curves have the same general form,characterised by the existence of a critical value ofw, wcr ' at which thereis a change in the shape of the curves.
For w <wcr ' there is a marked increase in rotation capacity with decreasingw, while for w >wcr the value of w is low and practically constant. If detailed calculations are made in order to find an explanation of this phenomenon, it is seen that at wcr failure occurs exactly whenthe strain in thesteel coincides with the lower strain hardening limit E 1 of the steel in FIG.
2.2b. When w< wcr ' failure occurs within the strain hardening region of thesteel.
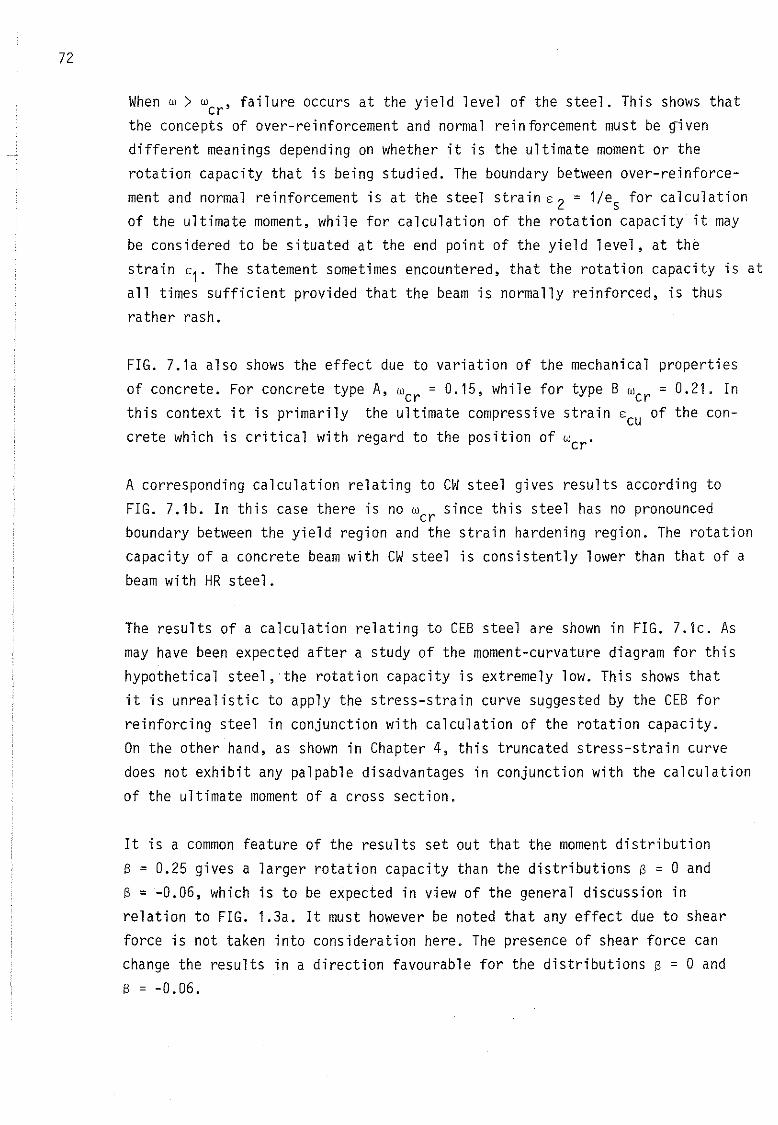
72
When w> wcr ' failure occurs at the yield level of the steel. This shows thatthe concepts of over-reinforcement and normal reinforcement must be givendifferent meanings depending on whether it is the ultimate moment or the
rotation capacity that is being studied. The boundary between over-reinforcement and normal reinforcement is at the steel strain E2 = 1/es for calculationof the ultimate moment, while for calculation of the rotation capacity it maybe considered to be situated at the end point of the yield level, at thestrain E1. The statement sometimes encountered, that the rotation capacity is atall times sufficient provided that the beam is normally reinforced, is thus
rather rash.
FIG. 7.1a also shows the effect due to variation of the mechanical properties
of concrete. For concrete type A, wcr = 0.15, while for type B wcr = 0.21. Inthis context it is primarily the ultimate compressive strain E
CUof the con
crete which is critical with regard to the position of wcr '
A corresponding calculation relating to CW steel gives results according toFIG. 7.1b. In this case there is no wcr since this steel has no pronouncedboundary between the yield region and the strain hardening region. The rotationcapacity of a concrete beam with CW steel is consistently lower than that of abeam with HR steel.
The results of a calculation relating to CEB steel are shown in FIG. 7.1c. Asmay have been expected after a study of the moment-curvature diagram for thishypothetical steel ,·the rotation capacity is extremely low. This shows thatit is unrealistic to apply the stress-strain curve suggested by the CEB forreinforcing steel in conjunction with calculation of the rotation capacity.On the other hand, as shown in Chapter 4, this truncated stress-strain curve
does not exhibit any palpable disadvantages in conjunction with the calculationof the ultimate moment of a cross section.
It is a common feature of the results set out that the moment distribution
S = 0.25 gives a larger rotation capacity than the distributions S = O andS = -0.06, which is to be expected in view of the general discussion inrelation to FIG. 1.3a. It must however be noted that any effect due to shearforce is not taken into consideration here. The presence of shear force canchange the results in a direction favourable for the distributions S = O and
S = -0.06.
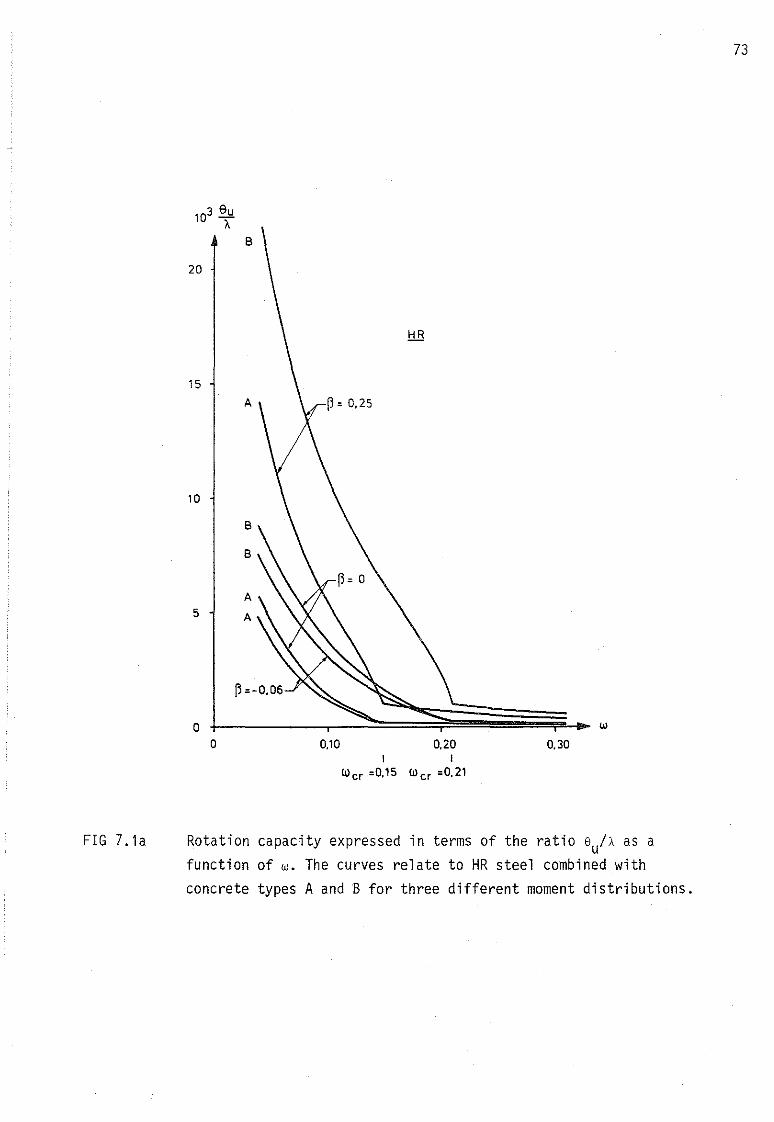
20
15
10
5
OO 0,10 0,20
I IWcr =0,15 Wcr =0,21
0,30
13
FIG1.1a Rotation capacity expressed in terms of the ratio BulA as afunction of w. The curves relate to HR steel combined withconcrete types A and B for three different moment distributions.
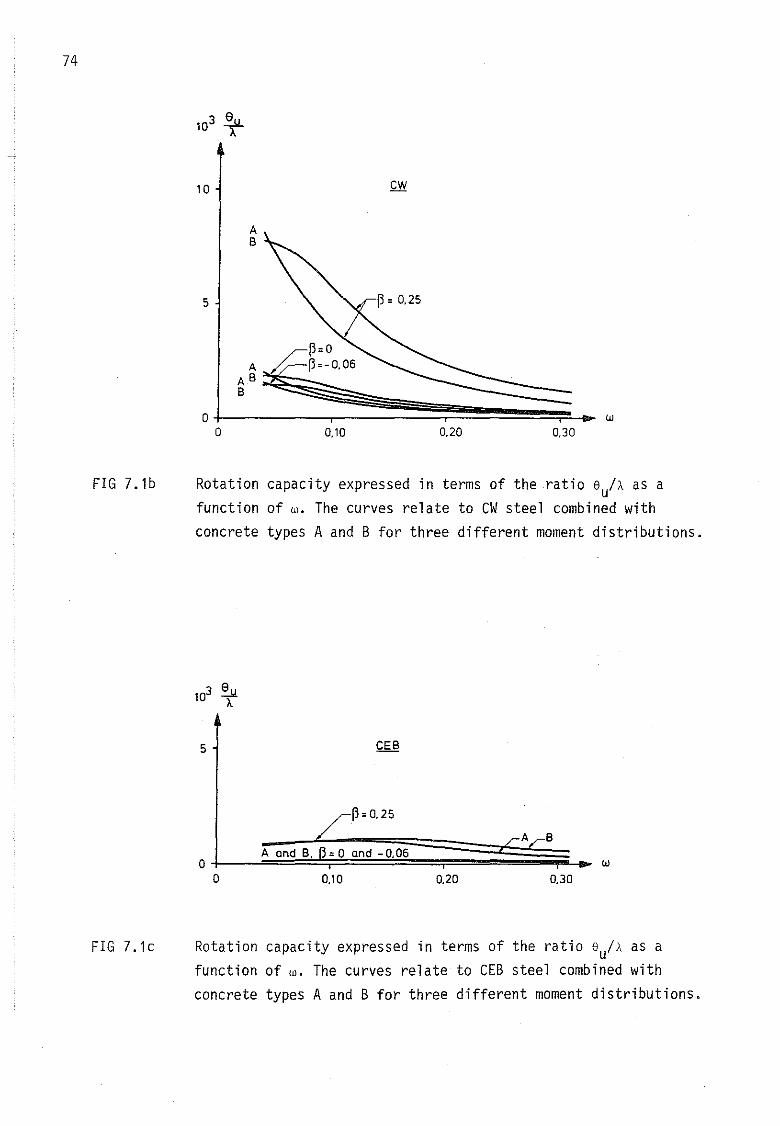
74
10
w
FIG7.1b Rotation eapaeity expressed in terms of the ratio sulA as afunction of w. The curves relate to CW steel combined witheoncrete types A and B for three different moment distributions.
5
w0.300.200.10
/C~=O.25
l__L~~;!~~~g~~~;;;;;;;cgAr§B~~A ond B. =Oond-0.06 I
OO
FIG7.le Rotation eapaeity expressed in terms of the ratio sulA as afunetion of w. The curves relate to CEB steel combined witheonerete types A and B for three different moment distributions.
75
7.2 Deviations from the parameter values selected for the typical steelsand the concrete types
All the calculation results given in this section refer to the momentdistribution S = 0.25.
In Section 2.1 representative parameters were determined for the descriptionof concretes type A and B. The value ec = 1200 was chosen for the nondimensional initial modulus of elasticity of the concrete. It is interestingto see what the effect of deviations from the selected value is for therotation capacity. In order to investigate this, two calculations have beenmade for CW steel, in one case combined with concrete type A, with ec = 1800,and in the other combined with concrete type B, with ec = 800. The resultsare shown inFIG. 7.2a where corresponding results using the normal valueec = 1200 are also shown with dashed lines for purposes of comparison. As willbe seen from this figure, the effect of variations in ec on the rotation
capacity is insignificant, and for this reason ec can be omitted as a variableparameter in the following, and the constant value of ec = 1200 used.
In section 2.2 a value es = 350 was chosen as the non-dimensional modulus ofelasticity of the steel, and this was then applied as normal value for allthree typical steels, HR, CW and CEB. In order to see what effect deviationsfrom the selected value have on the rotation capacity, two calculations havebeen made for HR steel and concrete type B, with e = 250 in one case ands .es = 700 in the other. See FIG. 2.2c. The results obtained are shown in FIG.
7.2b. Compared with the results for the normal value of es = 350, the differences are small, and for this reason it may be considered justified to omites also as a variable parameter and to use the constant value es = 350
irrespective of steel type and the value of f st .
For HR steel, the lower strain hardening limit El = 0.015 was chosen as normalvalue in Section 2.2. Comparative calculations for this value and the alternae
tive values E1 = 0.005 and E1 = 0.025 are of interest, during which processthe entire strain hardening region of the steel between E1 and E
Ois give~ a
corresponding sideways displacement as shown in FIG. 7.2c. The results ofcalculations using the alternative stress-strain curves for the HR steel incombination with concretes types A and B are shown in the same figure. In viewof the above explanation concerning the physical meaning of a critical valuewcr for the effective reinforcement ratio, it may be expected that a variation
in E1 will be reflected in a corresponding variation in wcr ' The figure showsthat this is actually the case. The value of wcr changes from approx. 0.10 to
76
0.29 when 81 is changed from 0.025 to 0.005 in combination with concretetype A. In combination with concrete type B, the corresponding change in wcris from about 0.15 to a value in excess of 0.31.
In order to throw further light on this subject, n = fstu/fst is vari ed foran HR steel as shown in FIG. 7.2d, the value of the lower strain hardening
limit being maintained at 8 1 = 0.015. Two values of n, 1.2 and 1.6, are combined with eoneretes types A and B. A variation in n has no effect on the
position of wcr ' nor on the rotation capacities corresponding to w >w er' sincefailure then occurs at steel strains less than the lower strain hardeninglimit. The calculation results set out in the figure also show that the varia
tion in rotation capacity with n is moderate for w <w er'
Finally, FIG. 7.2e shows what change is obtained in the rotation capacitywhen n for a CW steel is increased from the seleeted normal value of 1.1to 1.2. Calculated results are set out in the figure for the CW steel incombination with eoneretes types A and B. It is seen from the figure thatthe variation studied causes a moderate change in the rotation capacity.
Tho following conslusions may be drawn from the above analysis.
The non-dimensional initial modulus of elasticity of concrete may be considered constant and equal to ec = 1200 in all contexts.
For both HR and CW steels, the non-dimensional modulus of elasticity of steelmay be considered constant and equal to es = 350.
The stress-strain curve suggested by the CEB for reinforcing steel is notapplicable in conjunction with determination of the rotation capacity.
The boundary between over-reinforcement and normal reinforcement, which for
calculation of the ultimate moment is put at the steel strain 8z = 1/es 'should instead be related to the lower strain hardening limit 81 when therotation capacity is calculated.
The magnitude of the rotation capacity, within certain values of w, is greatlydependent on the position of the lower strain hardening limit of the steel.
The value of the ratio n = fstu/fst does not have the same significance.
77
10 cw[h 0.25
5
e c =1800
--0.300.200.10
O-r---------.-------.----------,r-_wO
F1G7.2a Rotation capacity as a function of the non-dimensional modulusof elasticity ec of the eonerete.
78
20
0.300.20
HR-B
~ =0.25
0.10
5
o.I------,-----,~-==-===;-=-- wO
10
15
FIG 7.2b Rotation capacity as a function of the non-dimensional modulus of
elasticity es of the reinforcing steel.
79
w
25 70 90 100W---I----:--+--I-_ (5.103
HR
~ = 0,25A
5
1°
1 5
103 ~A 05 /1 51
'.' -------25 -83,65 .-.-.-/
A.B~. 65
>.0 'HR
B
20
° 0,10 0,20 0,30
FIG 7.2c Stress-strain curve for HR steel modified by variation of the
lower strain hardening limit of the steel. The ratio 8u/A as afunction of w for combinations of the modified curves with
concrete types A and B.
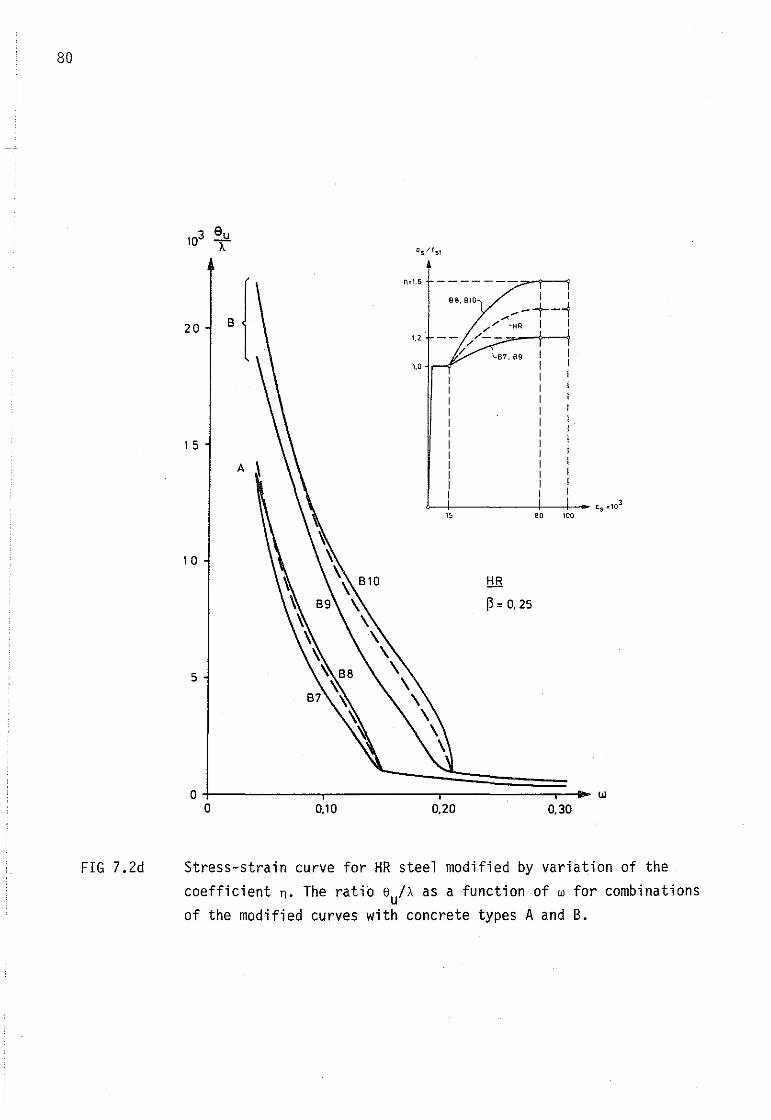
80
103 auT
0.30
80 100
HR
~ = 0,25
0,20
'.0
n=l.5 -------/'"-;----<[
68. BIO j I/-+--1
// 'HR I I1.2 - - //- -::.;:o-+--1
/
0,10
B20
5
'5
10
FIG 7.2d Stress-strain curve for HR steel modified by variation of thecoefficient n. The ratio 6u/A as a function of w for combinationsof the modified curves with concrete types A and B.
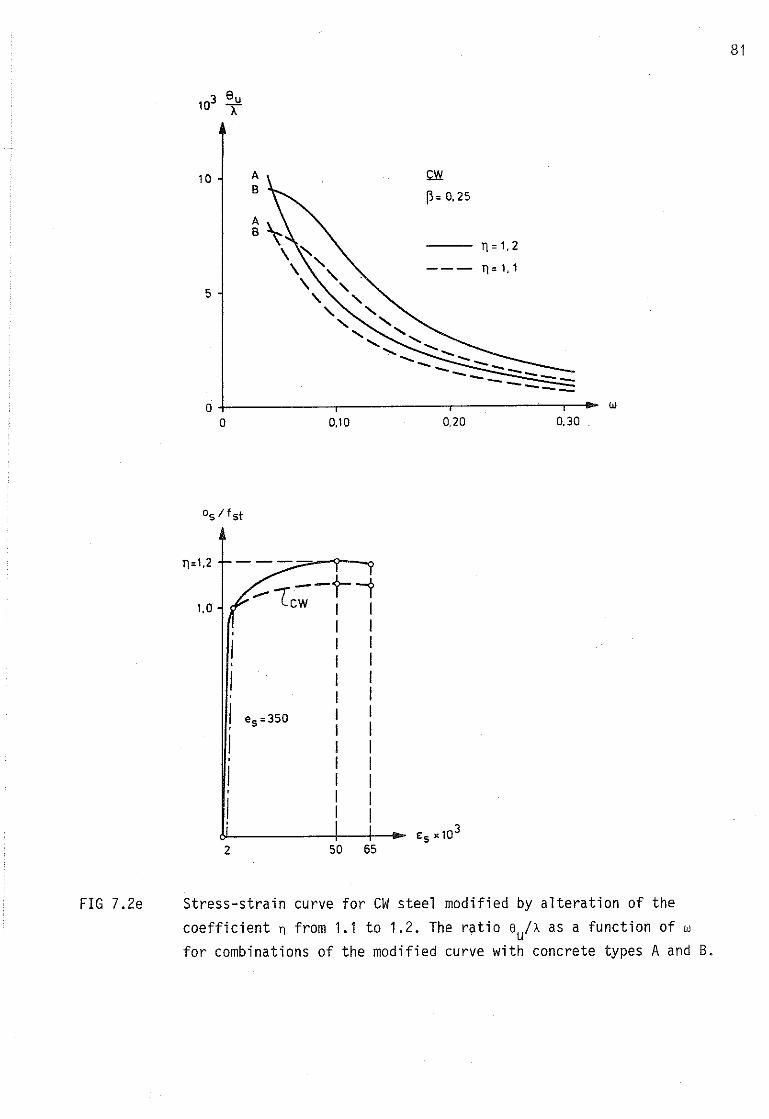
81
w0,300,20
Qfi
~ = 0,25
--- 11=1,2
--- 11= 1,1
0,10
AB
O+--------.------r----~_._-
O
5
10
50 65
__ --t--tlcw I
IIIIIIIIIIII
- - -'~~-<r---o
2
I,I,! es =350
I,I,I
1,0
FIG 7.2e Stress-strain curve for CW steel modified by alteration of thecoefficient 11 from 1.1 to 1.2. The ratio 8u/A as a function of w
for combinations of the modified curve with concrete types A and B.
82
The value of the rotation capacity is consistently somewhat greater when thecalculations are based on concrete type B, which is more in conformity withactual conditions, than when the calculations are based on concrete type Awhich is more restrictive as regards deformations.
83
8 CREEP OF THE CONCRETE
As a rule, the effect due to creep of the concrete is not taken into consideration when the rotation capacity of a concrete beam is calculated. Incases when an accurate check is made on the compatibility conditions andthe effect of creep is thus taken into account in determining the rotationrequirement of the plastic hinge, inclusion of the effect of creep incalculating the rotation capacity is also warranted.
Computationally, the effect of creep can be allowed for by transforming thecompressive stress-strain curve of the concrete by means of changing the
scale along the ~c axis, as shown in FIG. 8a. The scale factor is 1+~, where~ is the creep factor. Computationally, this implies that the appropriatestrain ~i in strip No i must be divided by 1~ and the modified strain thusobtained used for determination of the stress in the untransformed stress-straindiagram for the compressive stresses in the concrete. In consequence of this,the modulus of elasticity of concrete must be divided by 1~ in the previouslyderived formulae for calculation of the rotation capacity.
Calculations which take the creep of concrete into account give the resultsshown in FIG. Sb and Sc. In FIG. Sb the effect of creep on concrete type A,in combination with reinforcing steels of both types HR and CW, is studied.FIG. Sc shows the corresponding results for concrete type B in combinationwith the same reinforcing steels.
The figures show that an increase in the creep factor consistently raises therotation capacity. The reason for this is that the greater value of E
CUapplicable in conjunction with creep allows agreater strain in the tensionreinforcement before the concrete undergoes crushing failure. As a result,agreater quantity of deformation energy can be stored within the volume ofthe rotation span. In particular, the value of wcr for HR steel becomes
progressively higher as the creep factor increases.
When there is compression reinforcement within the section, creep of theconcrete causes a change in the distribution of force between the compressionreinforcement and the compressed concrete. If, prior to creep of the concrete,the stress in the compression reinforcement is below the yield stress, theconcrete will berelieved of load and a greater proportion of the force will
be transferred to the steel. If the compression reinforcement has alreadyattained its yield stress before the concrete begins to creep, there is no
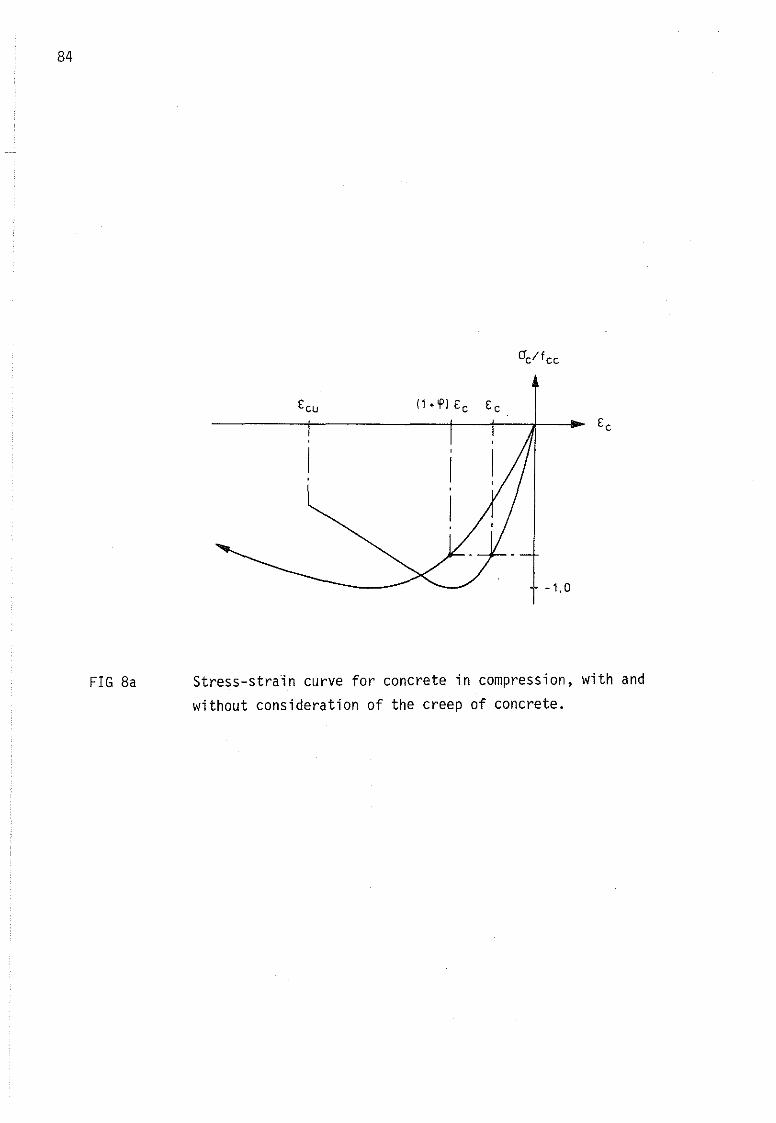
84
FIG 8a
(1 +'f'1 Ec Ec
-1, O
Stress-strain cllrve for concrete in compression, with andwithollt consideration of the creep of concrete.
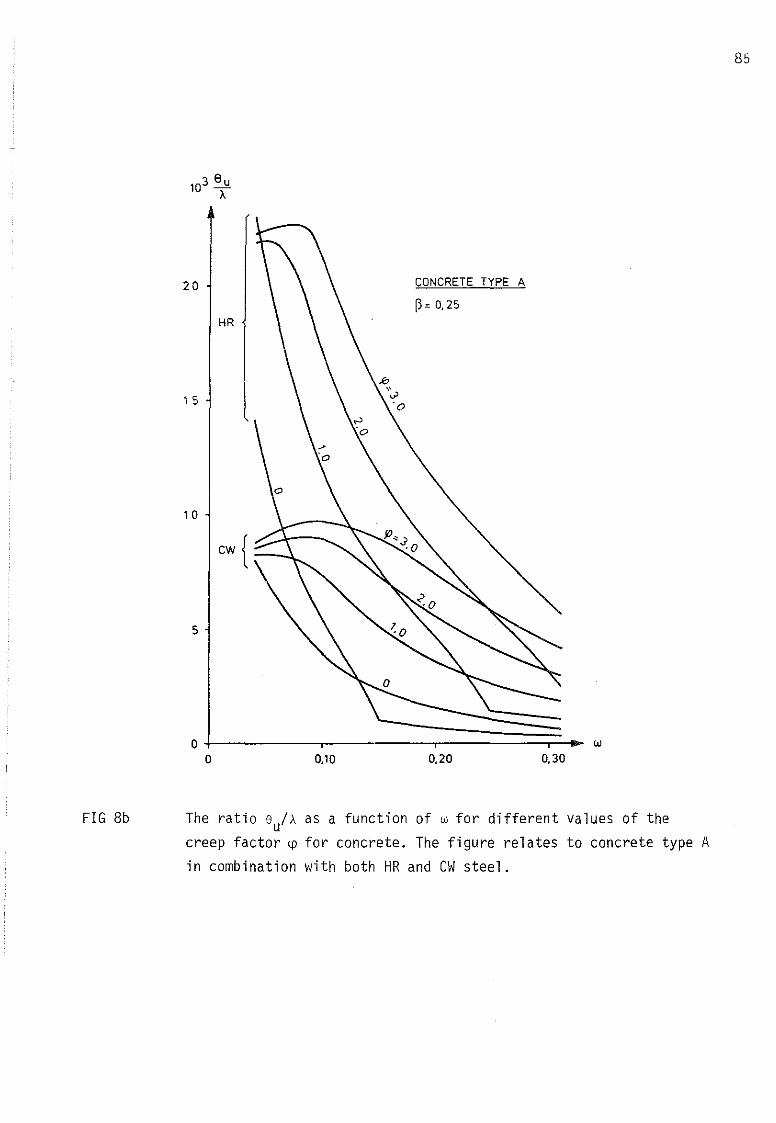
85
20
15
10
5
HR
CONCRETE TYPE A
~ = 0.25
0.300.200.10oL--.----~==~~~~.. w
O
FIG 8b The ratio 8u/A as a function of w for different values of thecreep factor ~ for eonerete. The figure relates to concrete type Ain combination with both HR and CW steel.
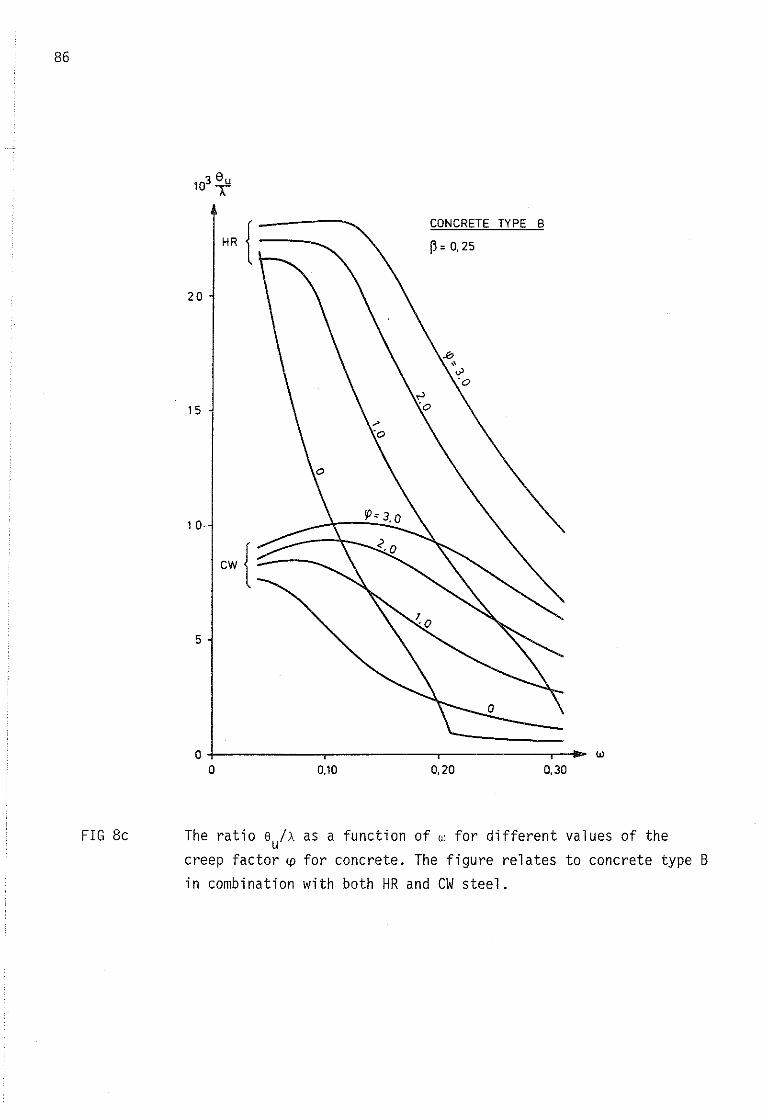
86
20
15
10·
5
eONeRETE TYPE B
P= 0.25
0.300.200.10O-f-------,.------.---------,.--_w
O
FIG 8e The ratio sulA as a funetion of w for different values of theereep faetor ~ for eonerete. The figure relates to eonerete type Bin eombination with both HR and CW steel.
redistribution of force. It may therefore be expected that creep of the concrete in a section containing compression reinforcement will cause agreaterincrease in rotation capacity for larger values of w than for small ones.See also Chapter 9.
87

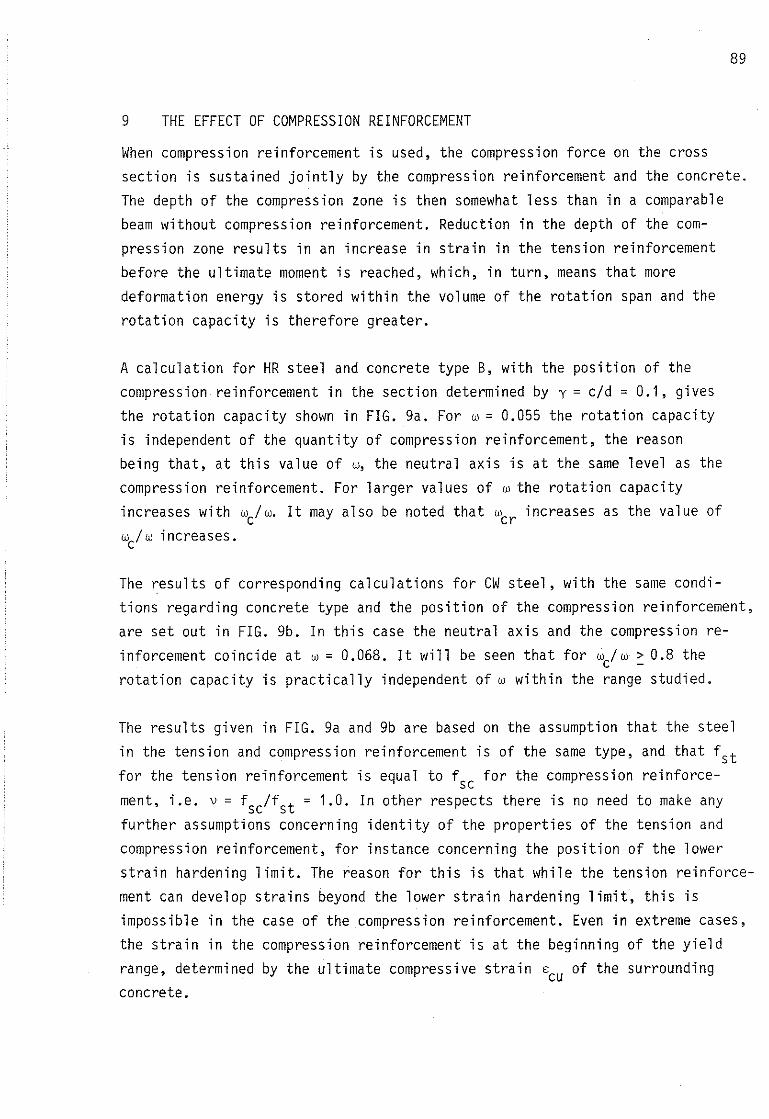
89
9 THE EFFECT OF COMPRESSION REINFORCEMENT
When compression reinforcement is used, the compression force on the crosssection is sustained jointly by the compression reinforcement and the concrete.The depth of the compression zone is then somewhat less than in a comparable
beam without compression reinforcement. Reduction in the depth of the compression zone results in an increase in strain in the tension reinforcementbefore the ultimate moment is reached, which, in turn, means that moredeformation energy is stored within the volume of the rotation span and therotation capacity is therefore greater.
A calculation for HR steel and concrete type B, with the position of thecompression reinforcement in the section determined by y = c/d = 0.1, givesthe rotation capacity shown in FIG. 9a. For w= 0.055 the rotation capacityis independent of the quantity of compression reinforcement, the reasonbeing that, at this value of w, the neutral axis is at the same level as the
compression reinforcement. For larger values of wthe rotation capacityincreases with wc/w. It may also be noted that wcr increases as the value of
wc/w increases.
The results of corresponding calculations for CW steel, with the same conditions regarding concrete type and the position of the compression reinforcement,are set out in FIG. 9b. In this case the neutral axis and the compression re
inforcement coincide at w= 0.068. It will be seen that for w/w> 0.8 thec -rotation capacity is practical ly independent of w within the range studied.
The results given in FIG. 9a and 9b are based on the assumption that the steel
in the tension and compression reinforcement is of the same type, and that f stfor the tension reinforcement is equal to f sc for the compression reinforce
ment, i.e. v = fsc/fst = 1.0. In other respects there is no need to make anyfurther assumptions concerning identity of the properties of the tension and
compression reinforcement, for instance concerning the position of the lowerstrain hardening limit. The reason for this is that while the tension reinforcement can develop strains beyond the lower strain hardening limit, this isimpossible in the case of the compression reinforcement. Even in extreme cases,the strain in the compression reinforcement is at the beginning of the yieldrange, determined by the ultimate compressive strain 8
CUof the surrounding
concrete.
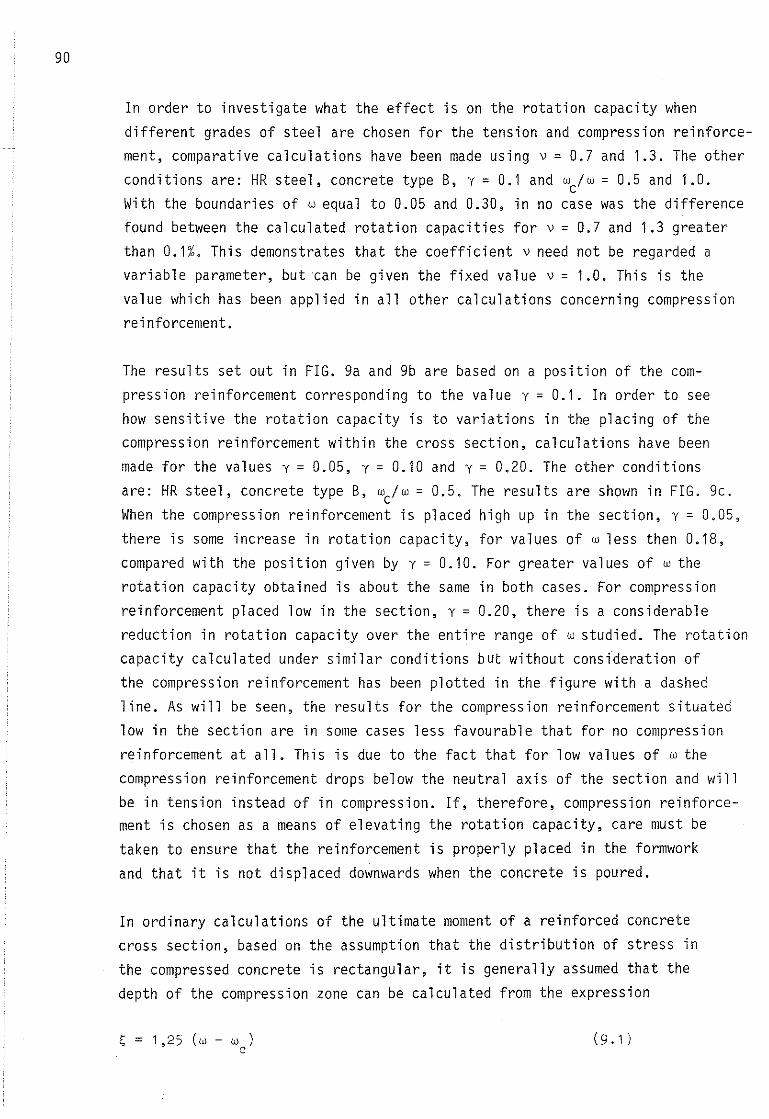
90
In order to investigate what the effect is on the rotation capacity whendifferent grades of steel are chosen for the tension and compressian reinforcement, comparative calculations have been made using v = 0.7 and 1.3. The otherconditions are: HR steel, concrete type B, y = 0.1 and wc/w = 0.5 and 1.0.With the boundaries of wequal to 0.05 and 0.30, in no case was the differencefound between the calculated rotation capacities for v = 0.7 and 1.3 greaterthan 0.1%. This demonstrates that the coefficient v need not be regarded avariable parameter, butcan be given the fixed value v = 1.0. This is thevalue which has been applied in all other calculations concerning compressianreinforcement.
The results set out in FIG. 9a and 9b are based on a position of the compression reinforcement corresponding to the value y = 0.1. In order to seehow sensitive the rotation capacity is to variations in the placing of thecompressian reinforcement within the cross section, calculations have beenmade for the values y = 0.05, y = 0.10 and y = 0.20. The other conditions
are: HR steel, concrete type B, wc/w = 0.5. The results are shown in FIG. 9c.When the compressian reinforcement is placed high up in the section, y = 0.05,
there is same increase in rotation capacity, for values of w less then 0.18,compared with the position given by y = 0.10. For greater values of w therotation capacity obtained is about the same in both cases. For compressianreinforcement placed low in the section, y = 0.20, there is a considerablereduction in rotation capacity over the entire range of wstudied. The rotationcapacity calculated under similar conditions but without consideration ofthe compressian reinforcement has been plotted in the figure with a dashedline. As will be seen, the results for the compressian reinforcement situatedlow in the section are in same cases less favourable that for no compressianreinforcement at all. This is due to the fact that for low values of w the
compressian reinforcement drops below the neutral axis of the section and willbe in tension instead of in compressian. If, therefore, compressian reinforcement is chosen as a means of elevating the rotation capacity, care must be
taken to ensure that the reinforcement is properly placed in the formworkand that it is not displaced downwards when the concrete is poured.
In ordinary calculations of the ultimate moment of a reinforced concretecross section, based on the assumption that the distribution of stress inthe compressed concrete is rectangular, it is generally assumed that thedepth of the compressian zone can be calculated from the expressian
~ = 1,25 (w - w )c
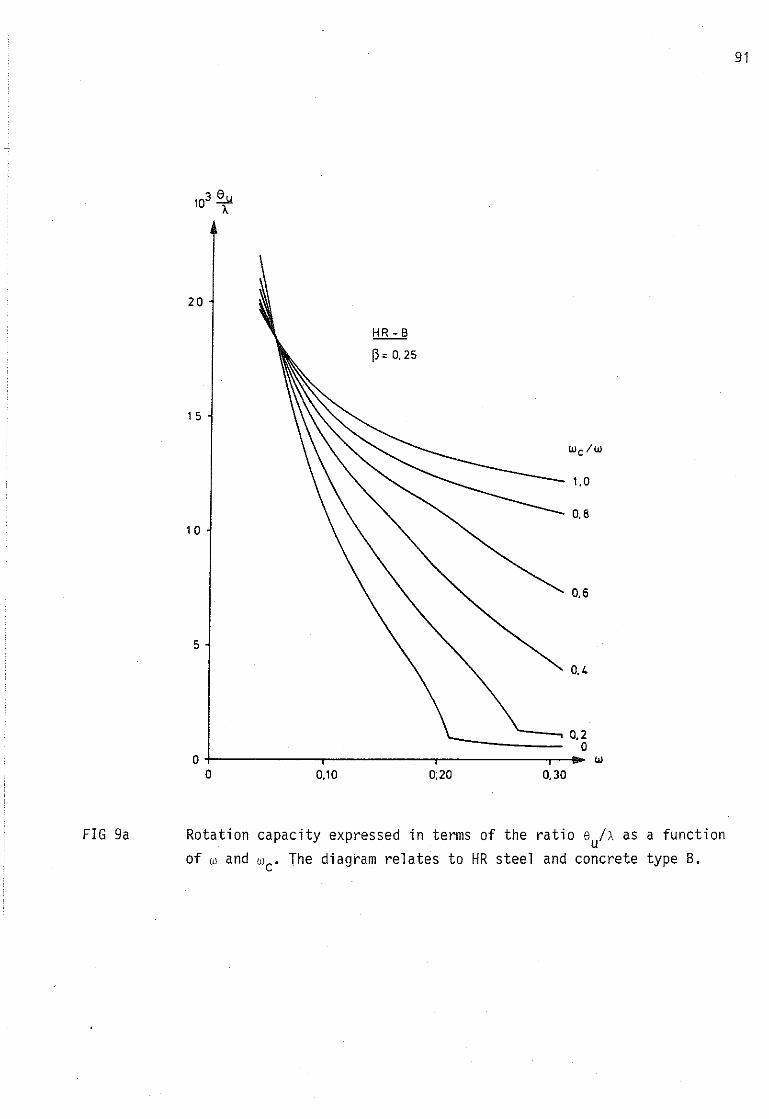
91
20
15
10
5
HR-B
~ = 0,25
1,0
0,8
0,6
0,4
--- 0.2O
0.300;200.10O+-------r------..,.------.--..... w
O
FIG 9a Rotation capacity expressed in terms of the ratio sulA as a functionof w and wc. The diagram relates to HR steel and concrete type B.
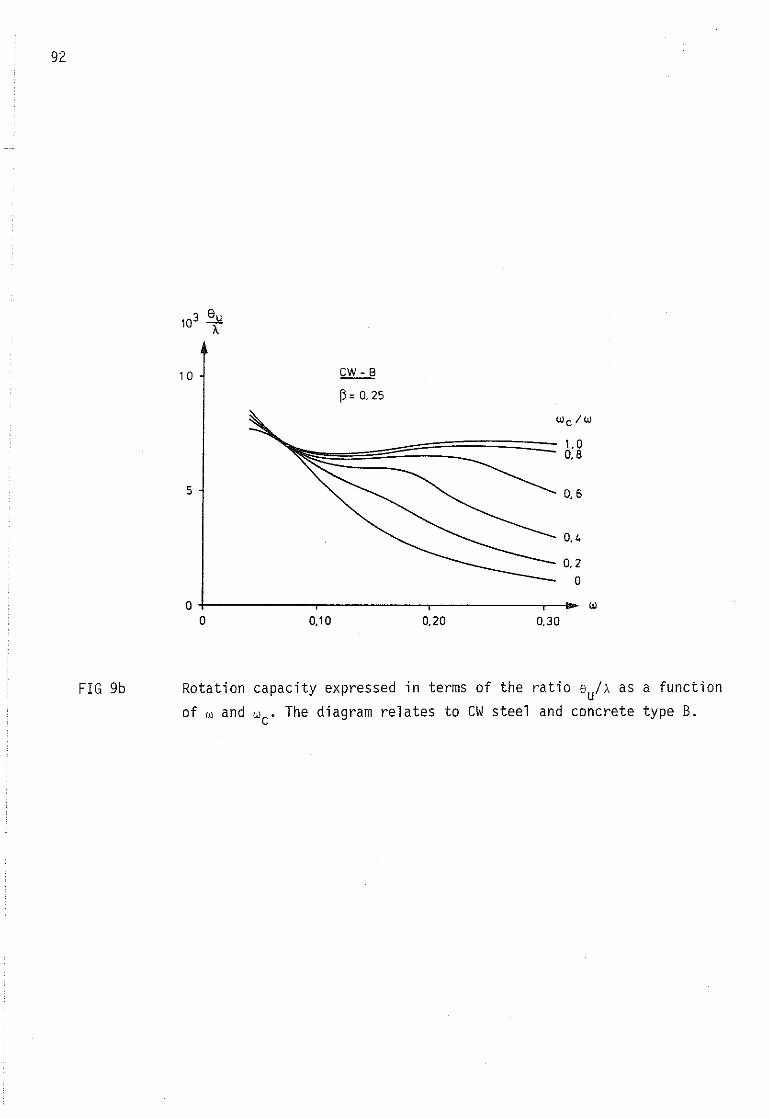
92
10 CW - 8
~: 0.25
5
wc/w
0.6
0.4
0.2O
w0.300.200.10
0+---------,------.-----,--......O
FIG 9b Rotation capacity expressed in terms of the ratio 8u/A as a function
of w and wc. The diagram relates to CW steel and concrete type B.
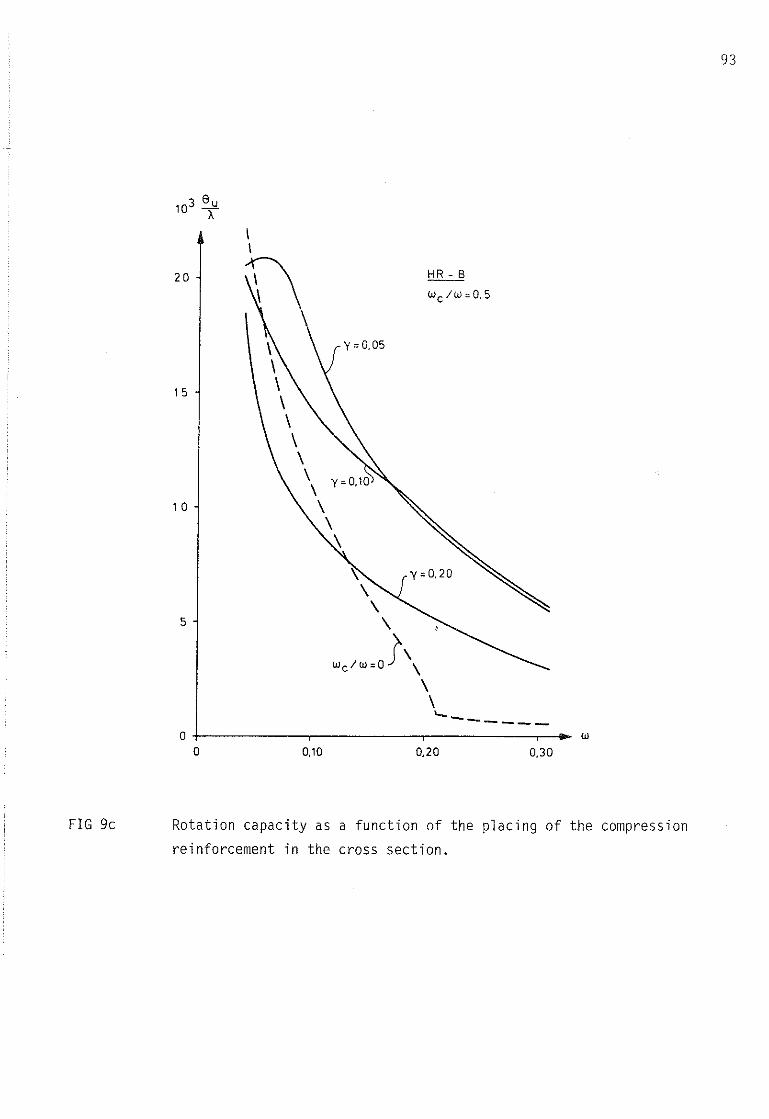
93
\\\\\\\\\\\\
20
15
1 O
5
'\\
\\
WC/W=oJ"\\\""-------
w0,300,200,10
0+---------,------,-------.---__O
FIG 9c Rotation capacity as a function of the placing of the compression
reinforcement in the cross section.
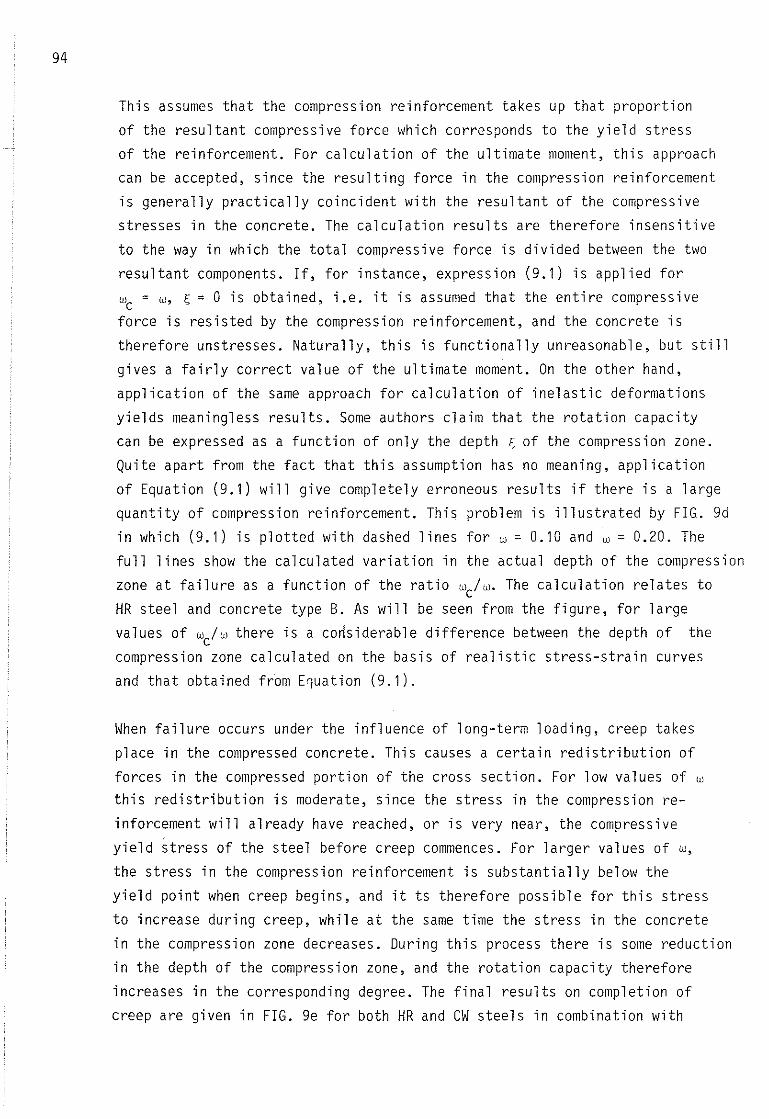
94
This assumes that the compressian reinforcement takes up that proportionof the resultant compressive force which corresponds to the yield stressof the reinforcement. For calculation of the ultimate moment, this approachcan be accepted, since the resulting force in the compressian reinforcementis generally practical ly coincident with the resultant of the compressivestresses in the eonerete. The calculation results are therefore insensitiveto the way in which the total compressive force is divided between the tworesultant components. If, for instance, expressian (9.1) is applied forWc = w, ~ = O is obtained, i.e. it is assumed that the entire compressiveforce is resisted by the compressian reinforcement, and the concrete istherefore unstresses. Naturally, this is functionally unreasonable, but stillgives a fairly correct value of the ultimate moment. On the other hand,application of the same approach for calculation of inelastic deformations
yields meaningless results. Same authors claim that the rotation capacitycan be expressed as a function of only the depth ~ of the compressian zone.Quite apart from the fact that this assumption has no meaning, application
of Equation (9.1) will give completely erroneous results if there is a largequantity of compressian reinforcement. This problem is illustrated by FIG. 9din which (9.1) is plotted with das hed lines for w = 0.10 and w = 0.20. The
full lines show the calculated variation in the actual depth of the compressianzone at failure as a function of the ratio wc/w. The calculation relates toHR steel and concrete type B. As will be seen from the figure, for large
values of wc/w there is a considerable difference between the depth of thecompressian zone calculated on the basis of realistic stress-strain curvesand that obtained from E~uation (9.1).
When failure occurs under the influence of long-term loading, creep takesplace in the compressed eonerete. This causes a certain redistribution offorces in the compressed portion of the cross sectian. For low values of wthis redistribution is moderate, since the stress in the compressian re
inforcement will already have reached, or is very near, the compressiveyield stress of the steel before creep commences. For larger values of w,the stress in the compressian reinforcement is substantially below theyield point when creep begins, and it ts therefore possible for this stressto increase during creep, while at the same time the stress in the concretein the compressian zone decreases. During this process there is same reductionin the depth of the compressian zone, and the rotation capacity thereforeincreases in the corresponding degree. The final results on completion ofcreep are given in FIG. ge for both HR and CW steels in combination with
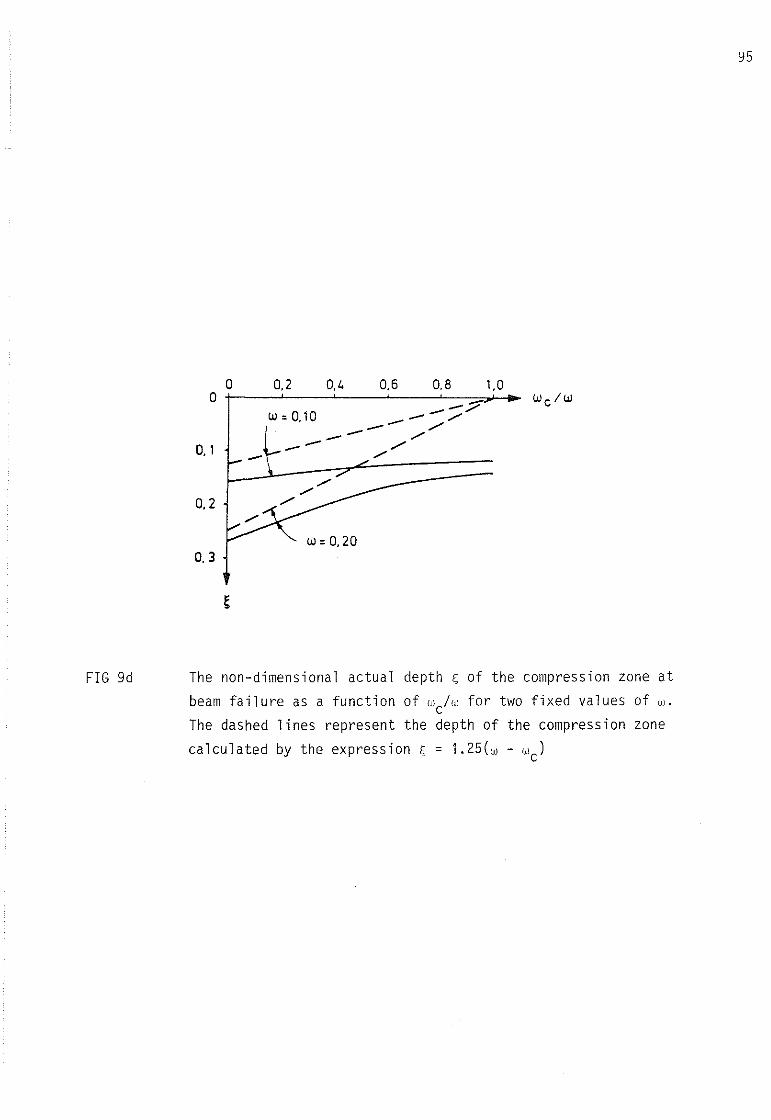
° 0,2 0,4 0,6 0,8 1,0
° ----;:::::- Wc/wW =0,10 ------ -- .//"-- ./
0, , -- -- /"-- ./
Y5
0,2
0, 3W = 0,20
FIG 9d The non-dimensional actual depth s of the compression zone atbeam failure as a function of wc!w for two fixed values of w.The das hed lines represent the depth of the compression zone
calculated by the expression s = 1.25(w - wc)
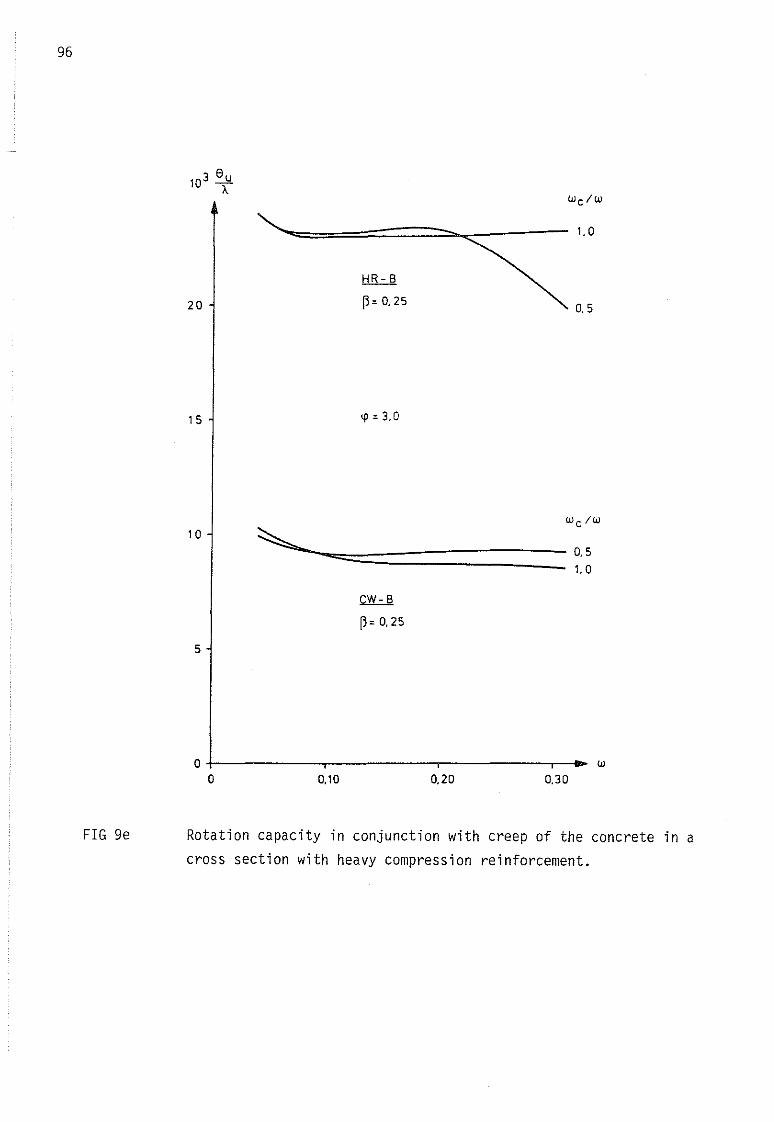
96
1. O
20
HR-B
~: 0.250.5
15 'l' : 3.0
1O
~......--============ Q51.0
CW-B
~: 0.25
5
w0.300.200.10
0+------.-----......------.-_O
FIG ge Rotation capacity in conjunction with creep of the concrete in across section with heavy compression reinforcement.
97
concrete type B. The creep factor is ~ ~ 3.0, and the compression reinforcement corresponds to wc/w ~ 0.5 and 1.0. As will be seen, the rotationcapacity obtained for both steel types is practically constant within therange of w considered.
The analytical model is based on the assumption that the compression reinforcement is rigidly fixed in the stipulated position during the entire
loading process. In experimental investigations of concrete beams with compression reinforcement, it is sometimes noted that local deflection of thecompression reinforcement occurs at moments near the ultimate moment. Withregard to the rotation capacity, in such cases the compression reinforcementdoes more harm than good, since the deflected reinforcement causes splittingof the concrete in the compression zone and thus accelerates crushing failure.In order therefore that the rotation capacity calculated by means of theanalytical mode l may be considered reliable, it is essential that the compression reinforcement is restrained by stirrups of suitably close spacing.

10 THE EFFECT OF SHEAR FORCE
99
The calculations set out so far have been consistently based on the validity
of e.g. Bernoulli's hypothesis, which indirectly implies that the effect on
the rotation capacity due to shear force acting simultaneously with the
ultimate moment has been ignored. Experiments reported in the literature
show that the incidence of a large shear force in the vicinity of the plastic
hinge increases the rotation capacity. An attempt should therefore be made
to modify the analytical model developed in such away that the favourable
effect of shear force may be included, if only approximately.
10.1 Analytical model
When the effect of shear force is to be included in the analytical model,
application of the Ritter-Marsch truss model is the obvious choice, and this
is therefore used as the basis of the following line of reasoning.
If the analytical model derived in the provious section is supplemented by
diagonals between the tension and compression zones in such away that a
truss is formed, and the model thus constructed is acted upon by shear force,
two principal phenomena occur,
a. The diagonals of the truss are deformed under the action of the applied
forces, and thus store deformation energy.
b. The variation of force along the compression and tension zones of theanalytical model is different from that in the original model, and the
energy stored in these zones i s therefore also modified correspondingly.
With regard to the effect in a, the following may be stated. If stirrupswhich in actual fact are uniformly distributed are assumed in the model to
be concentrated into discrete diagonals in tension, then the stresses, defor
mations and the associated energy storage in these can, in principle, be
calculated with reasonable accuracy. However, the calculations presuppose
that the distance between the diagonals in tension is known. For a given
stirrup inclination, this distance is dependent on the inclination of the
compressed concrete diagonals postulated in the truss model, i.e. dependenton the directions of the bending shear cracks which occur. Correct treatment
of this problem thus demands knowledge and consideration of the variation
in crack direction along the rotation span. If this is to be applied in
the analytical model, the number of primary parameters will be increased very
considerably, and the results will lose the clarity hitherto achieved. It is
therefore desirable that this situation be avoided by the use of some appro-
100
riate approximation.
It is a general rule in the design of a reinforced concrete beam that thefactor of safety with regard to shear failure should be greater than thatwith regard to bending failure. In view of this it is not unreasonable tointroduce the assumption that, when bending failure occurs subsequent toplastic flow, if any, the steel in the stirrups will just about have
attained its yield stress. All the deformation in the diagonals in tensionwill then have been elastic, and the deformation energy stored in these istherefore balanced by some of the work which the shear force performs duringshear deformation. The rotation capacity of the plastic hinge is thereforeunaffected by this.
As regards the compressed concrete diagonals in the model, the problem arises
as to what formal cross sectional area is to be assumed for these. It ispossible to assume a large area and small compressive stress, or vice versa,within limits determined by beam geometry and the compressive strength ofthe concrete. Whichever course is adopted, however, the total deformationenergy stored by these compressed diagonals will be very much less than thatstored by the diagonals in tension, and can therefore be ignored.The conclusion drawn concerning the effect according to a is thereforethat the rotation capacity of the plastic hinge can be calculated withoutconsideration of the contribution of the diagonals to the deformationenergy, with no major error being introduced in consequence.
The following may be said with regard to the effect according to b. Withoutconsideration of the shear force, the extent ay of the plastic hinge, i.e.
the region over which the reinforcement yields, is determined according to
figure a in FIG. 10.la by the ratio of the ultimate moment ~u to the yieldmoment ~y' For purposes of simplicity, it is assumed that variation of momentover the length of the rotation span is linear. If inclined shear cracks are
formed along the rotation span, conditions are altered, as will be seen fromFIG. 10.1b which shows the portion of the beam between the point of zero momentand an inclined shear crack. It is evident from the figure that deformationsand stresses in the tension reinforcement at section 2 are determined by the
moment ~1 at section 1, and that the corresponding stresses and deformationsin the compression zone of the concrete at section l are determined by themoment ~2 at section 2. For a constant shear crack direction along the rotationspan, this means that the moment curve must be shifted a distance a to theleft for calculation of the state of affairs in the tension reinforcement,
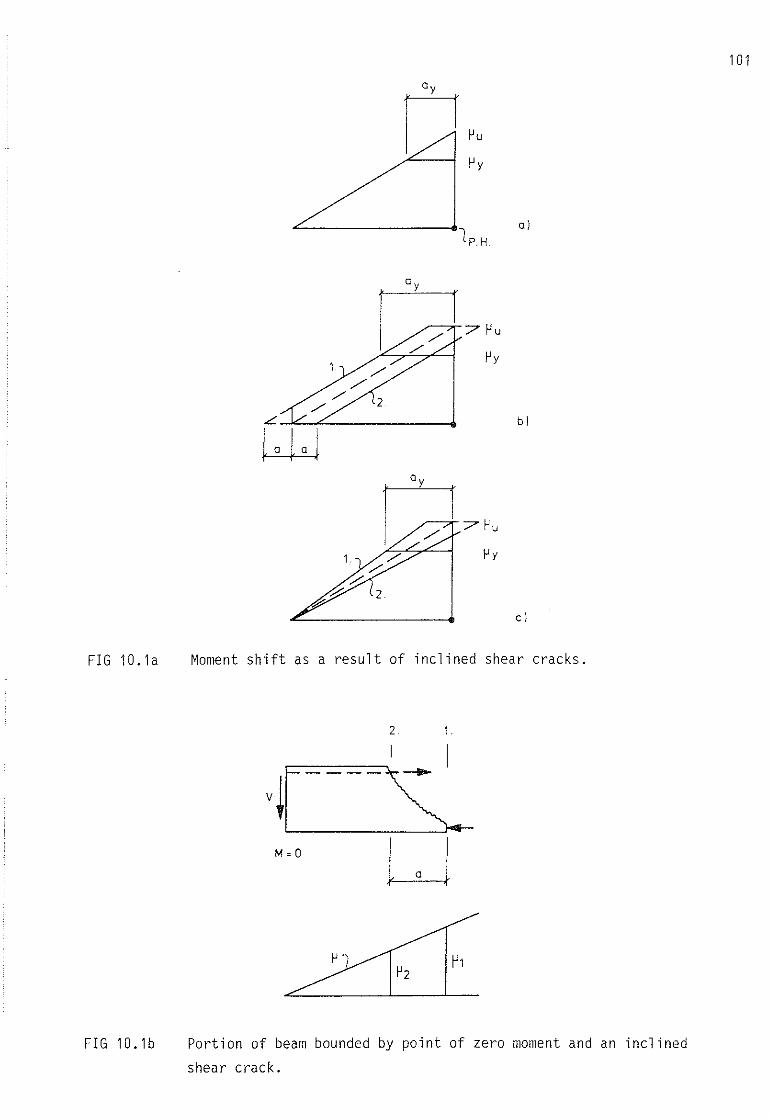
L-'<::......,."'- -..
kW
al
bl
c I
101
FIG 10. la
FlG 10.lb
Moment shift as a result of inclined shear cracks.
2. 1.
S.,(MoD LJ
~1
Portion of beam bounded by point of zero moment and an inclined
shear crack.
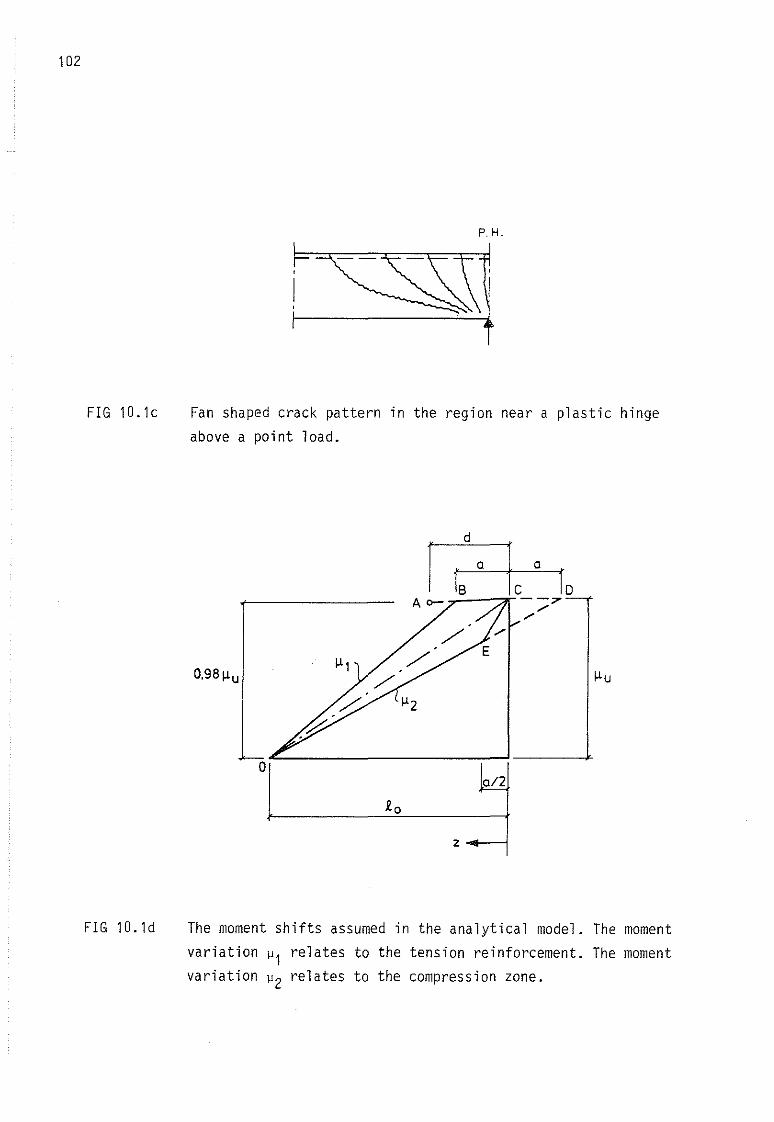
102
FIG 10.1e
P. H.
Fan shaped eraek pattern in the region near a plastie hinge
above a point load.
O,98~u
FIG 10.1d
o012
z __.--1
The moment shifts assumed in the analytieal model. The moment
variation ~1 relates to the tension reinforeement. The moment
variation ~2 relates to the eompression zone.
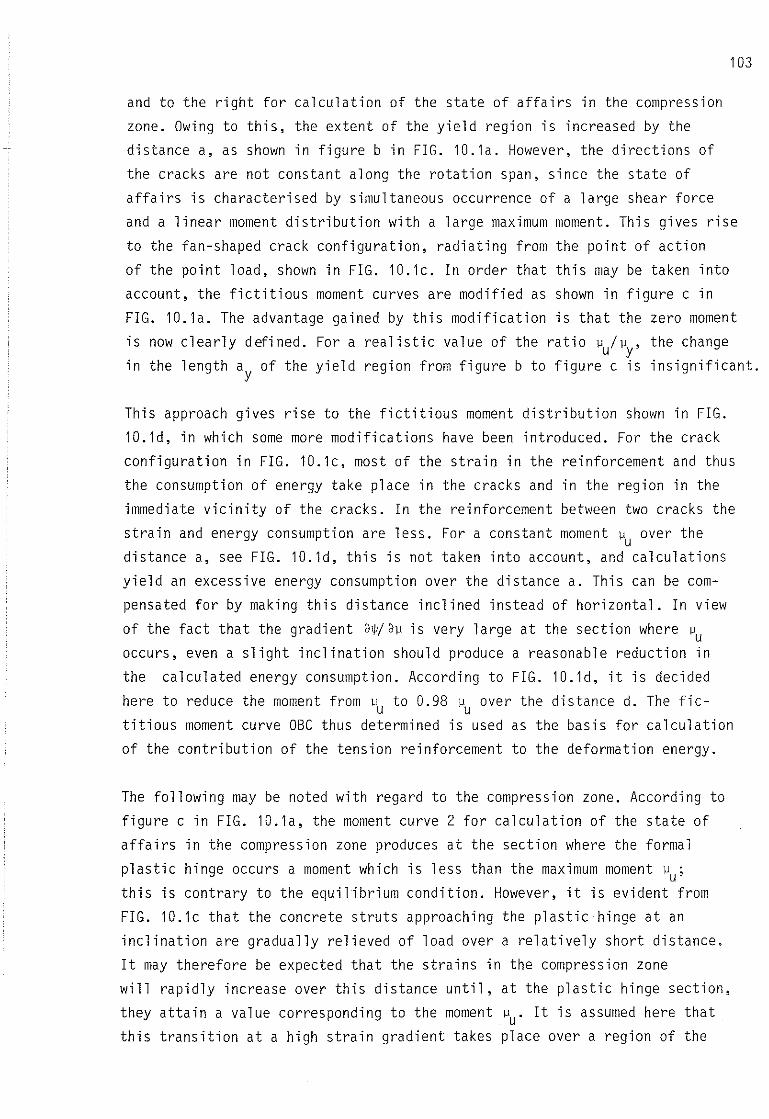
103
and to the right for calculation of the state of affairs in the compressionzone. Owing to this, the extent of the yield region is increased by the
distance a, as shown in figure b in FIG. 10.1a. However, the directions of
the cracks are not constant along the rotation span, since the state ofaffairs is characterised by simultaneous occurrence of a large shear force
and a linear moment distribution with a large maximum moment. This gives rise
to the fan-shaped crack configuration, radiating from the point of action
of the point load, shown in FIG. 10.1c. In order that this may be taken into
account, the fictitious moment curves are modified as shown in figure c in
FIG. 10.1a. The advantage gained by this modification is that the zero moment
is now clearly defined. For arealistic value of the ratio "u/"y' the changein the length ay of the yield region from figure b to figure c is insignificant.
This approach gives rise to the fictitious moment distribution shown in FIG.
10. Id, in which some more modifications have been introduced. For the crack
configuration in FIG. 10.1c, most of the strain in the reinforcement and thus
the consumption of energy take place in the cracks and in the region in the
immediate vicinity of the eraeks. In the reinforcement between two cracks the
strain and energy consumption are less. For a constant moment "u over thedistance a, see FIG. 10.ld, this is not taken into account, and calculations
yield an excessive energy consumption over the distance a. This can be com
pensated for by making this distance inclined instead of horizontal. In view
of the fact that the gradient dW/d" is very large at the section where "u
occurs, even a slight inclination should produce a reasonable reduction in
the calculated energy consumption. According to FIG. 10.1d, it is decided
here to reduce the moment from "u to 0.98 "u over the distance d. The fictitious moment curve OBC thus determined is used as the basis for calculation
of the contribution of the tension reinforcement to the deformation energy.
The following may be noted with regard to the compression zone. According to
figure c in FIG. 10. la, the moment curve 2 for calculation of the state of
affairs in the compression zone produces at the section where the formal
plastic hinge occurs a moment which is less than the maximum moment "u;
this is contrary to the equilibrium condition. However, it is evident from
FIG. 10.1c that the concrete struts approaching the plastichinge at an
inclination are gradually relieved of load over a relatively short distance.
It may therefore be expected that the strains in the compression zon e
will rapidly increase over this distance until, at the plastic hinge section,
they attain a value corresponding to the moment "u. It is assumed here thatthis transition at a high strain gradient takes place over a region of the
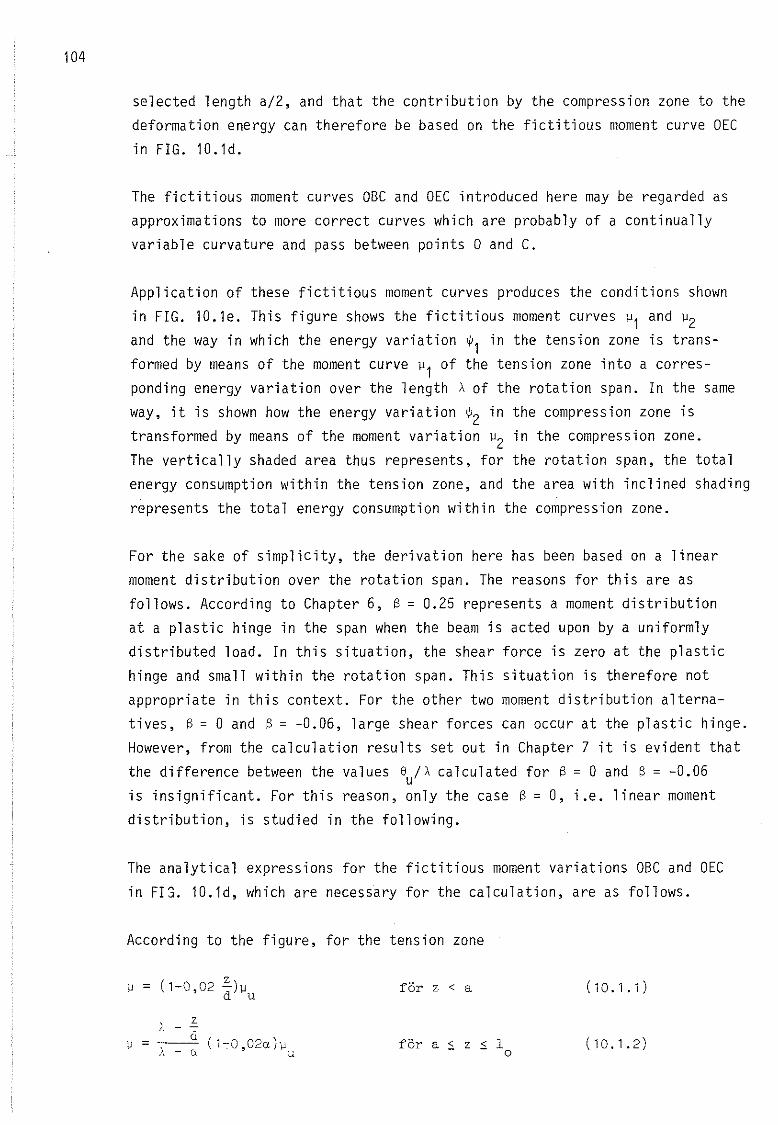
104
selected length a/Z, and that the contribution by the compression zone to thedeformation energy can therefore be based on the fictitious moment curve DECin FIG. 10.1d.
The fictitious moment curves OBC and DEC introduced here may be regarded asapproximations to more correct curves which are probably of a continuallyvariable curvature and pass between points O and C.
Application of these fictitious moment curves produces the conditions shown
in FIG. 10.1e. This figure shows the fictitious moment curves ~1 and ~Z
and the way in which the energy variation w1 in the tension zone is transformed by means of the moment curve ~1 of the tension zone into a corresponding energy variation over the length Aof the rotation span. In the sameway, it is shown how the energy variation Wz in the compression zone istransformed by means of the moment variation ~Z in the compression zone.The vertically shaded area thus represents, for the rotation span, the totalenergy consumption within the tension zone, and the area with inclined shading
represents the total energy consumption within the compression zone.
For the sake of simplicity, the derivation here has been based on a linearmoment distribution over the rotation span. The reasons for this are asfollows. According to Chapter 6, S = 0.Z5 represents a moment distributionat a plastic hinge in the span when the beam is acted upon by a uniformlydistributed load. In this situation, the shear force is zero at the plastichinge and small within the rotation span. This situation is therefore not
appropriate in this context. For the other two moment distribution alternatives, S = O and S = -0.06, large shear forces can occur at the plastic hinge.However, from the calculation results set out in Chapter 7 it is evident thatthe difference between the values 8
U/A calculated for S = O and S = -0.06
is insignificant. For this reason, only the case S = O, i.e. linear momentdistribution, is studied in the following.
The analytical expressions for the fictitious moment variations OBC and DEC
in FI3. 10.1d, which are necessary for the calculation, are as follows.
According to the figure, for the tension zone
~ = (1-0 02 ~)~, d u för z < a (10.1.1)
), _ zel
u = -,---",\ - r)
( 1-0, 02a ) ~U
för a ~ z :s lo
(10.1.2)
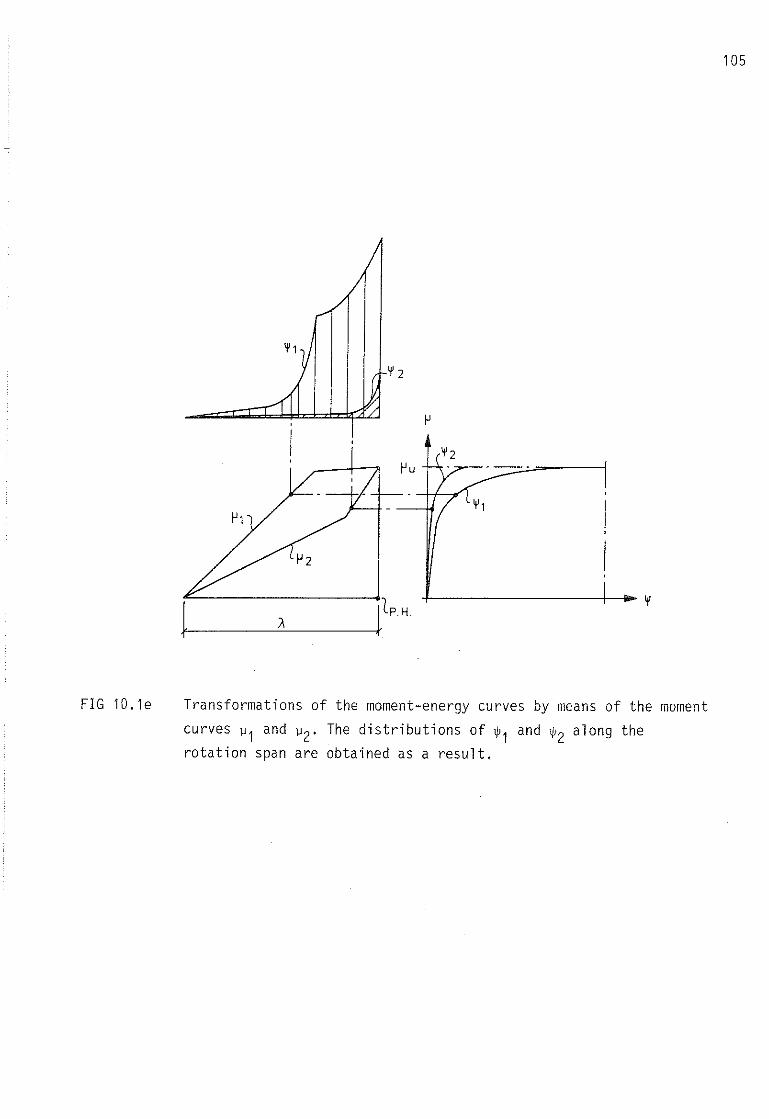
105
~1~1
FIG 10.1e Transformations of the moment-energy curves by means of the moment
curves ~1 and ~2· The distributions of ~1 and ~2 along therotation span are obtained as a result.
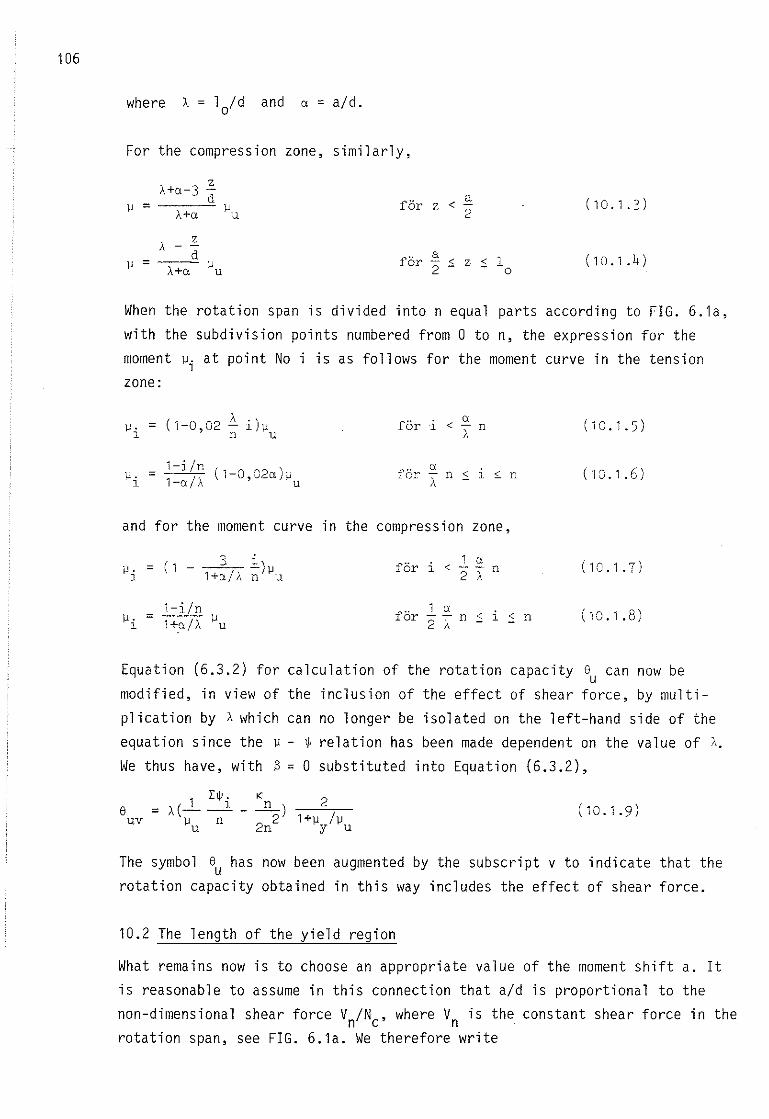
106
where A = lo/d and a = a/d.
For the compression zone, similarly,
A+a-3zd a
~ = ~ för z <A+a u 2
A - ~
d för al~ = ~
- ,; z SA+0. u 2 o
(10.1.3)
(10.1.4)
When the rotation span is divided into n equal parts according to FIG. 6.1a,with the subdivision points numbered from O to n, the expression for the
moment ~i at point No i is as follows for the moment curve in the tensionzone:
(1-0,02A
i)~ för i a(10.1.5)~. = < - n
l n u ),
l-i/n( 1-0,C2ah P" a
(10.1.6)u. = -- .l or - n S l ;: nl l-alA u A
and for the moment curve in the compression zone,
( 1 3 .!o )~ för1 a
(10.1.7)il. = - l < - nl 1+2[/), n u 2 A
l-i/nför
1 ai (10.1.8)~. = ~u
-- n S :: nl l+C'/A 2 A
(10.1.9)
Equation (6.3.2) for calculation of the rotation capacity 6u can now be
modified, in view of the inclusion of the effect of shear force, by multiplication by A which can no longer be isolated on the left-hand side of theequation since the ~ - ~ relation has been made dependent on the value of A.
We thus have, with B= O substituted into Equation (6.3.2),
l L~. K 2= ), (- _l - ~) -l-+"--=--/~"-
~ n 22 ""u n y u6
uv
The symbol 8u has now been augmented by the subscript v to indicate that therotation capacity obtained in this way includes the effect of shear force.
10.2 The length of the yield region
What remains now is to choose an appropriate value of the moment shift a. Itis reasonable to assume in this connection that a/d is proportional to thenon-dimensional shear force V /N , where V is the constant shear force in then c nrotation span, see FIG. 6.1a. We therefore write
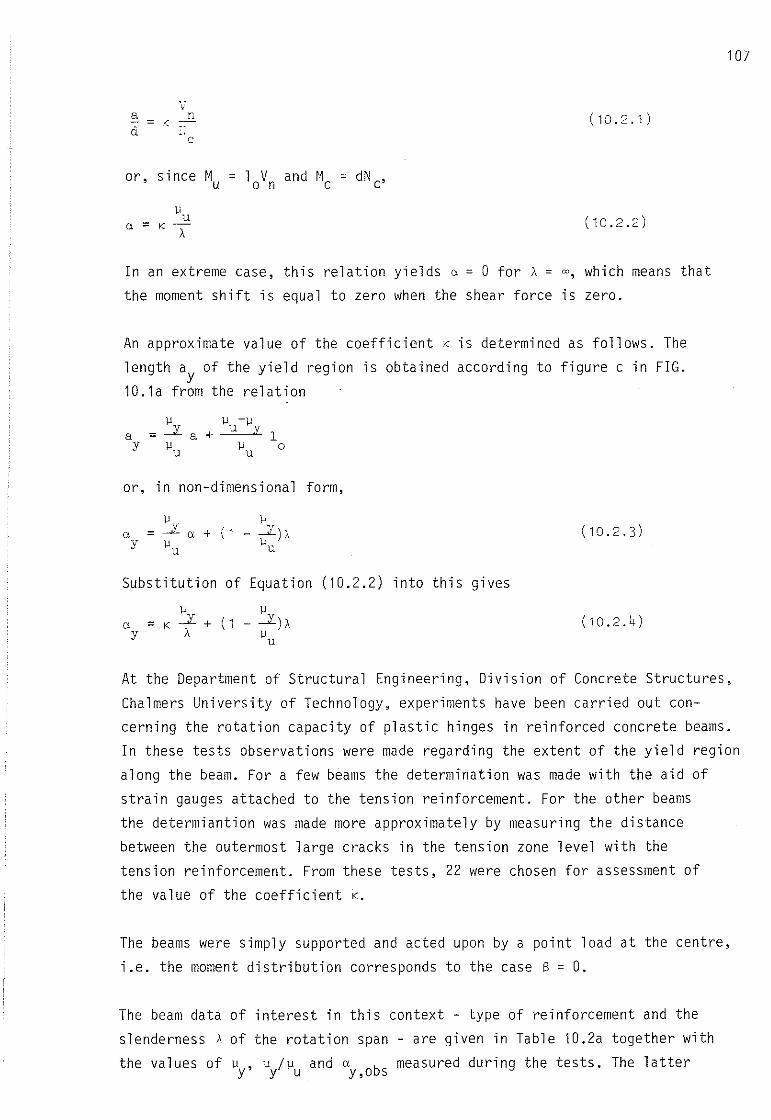
§: = Kd
c
(10.2.1)
107
or, since M ~ loV and M ~ dN c'u n c
lJu
a = K -A
(10.2.2)
In an extreme case, this relation yields a ~ O for A ~ 00, which means that
the moment shift is equal to zero when the shear force is zero.
An approximate value of the coefficient K is determined as follows. The
length ay of the yield region is obtained according to figure c in FIG.
10.la from the relation
ay
lJ -lJu y l
lJ ou
or, in non-dimensional form,
ay
lJ+ (1 - --.:L) A
Ilil
(10.2.3)
Substitution of Equation (10.2.2) into this gives
ay
( 10.2.4)
At the Department of Structural Engineering, Division of Concrete Structures,
Chalmers University of Technology, experiments have been carried out con
cerning the rotation capacity of plastic hinges in reinforced concrete beams.
In these tests observations were made regarding the extent of the yield region
along the beam. For a few beams the determination was made with the aid of
strain gauges attached to the tension reinforcement. For the other beams
the determiantion was made more approximately by measuring the distance
between the outermost large cracks in the tension zon e level with thetension reinforcement. From these tests, 22 were chosen for assessment of
the value of the coefficient K.
The beams were simply supported and acted upon by a point load at the centre,
i.e. the moment distribution corresponds to the case S ~ O.
The beam data of interest in this context - type of reinforcement and the
slenderness A of the rotation span - are given in Table lO.2a together with
the values of lJ , lJ IlJ and a b measured during the tests. The lattery y u y,o s
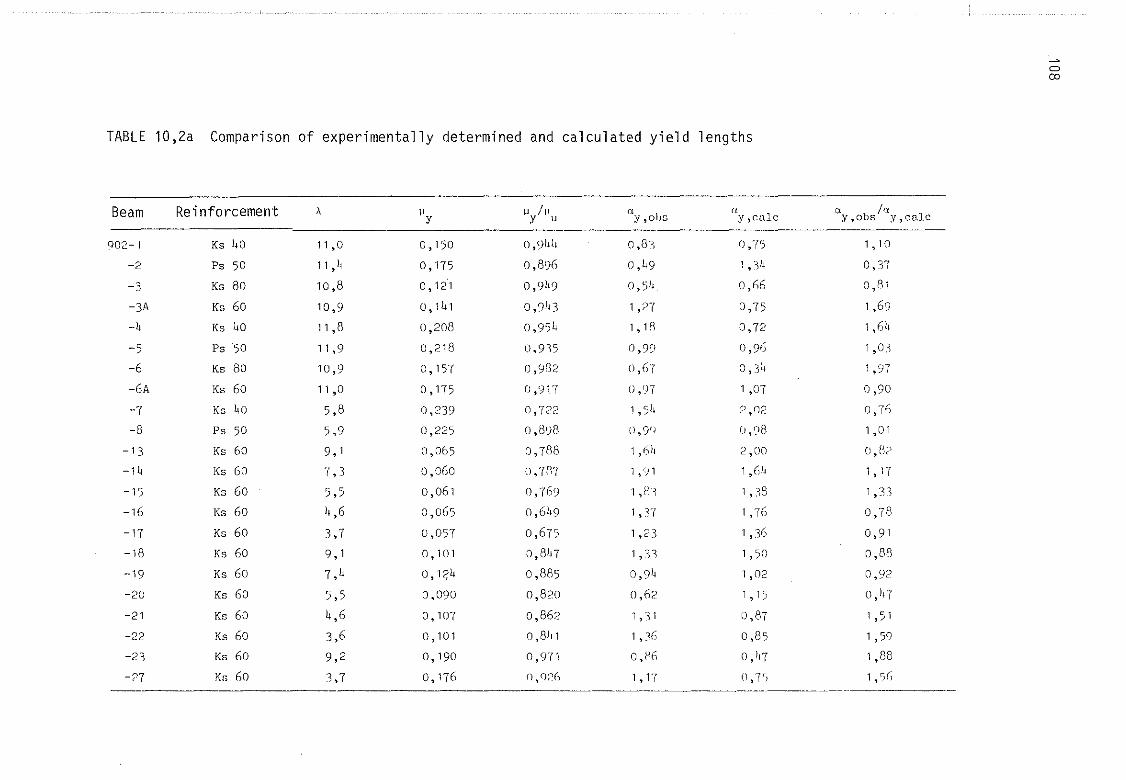
TABLE 10,2a Comparison of experimental ly determined and calculated yield lengths
Beam Reinforcement A l' \.J /11 a " a/eJ.y y u y,obs y,culc Y,obs y,calc
90'2-1 Ks )~O 11,0 0.150 O ,91~11 0,8') 0,"(5 ',10
-2 Ps 50 11 ,4 0,175 0,896 O,l19 1 "))-1 0,37
-3 Ks 80 10,8 0,121 O,SJl'9 O, )1<., 0,66 o,e,-3A Ks 60 10,9 0,141 O,9)d 1,27 0,75 1,69
-4 Ks 40 11,8 0,208 0,954 1, Hl 0,72 1,611
-5 Ps 50 11,9 0,218 0,935 () ,9~1 0,96 1,03
-6 Ks 80 10,9 0,157 0,982 0,67 0,34 1,97
-6A Ks 60 11 ,0 0,175 0,')17 0,91 1 ,er( 0,90
-7 Ks 40 5,8 0,239 0,722 1,5h ~J ,02 0,76
-8 Ps 50 5,9 0,225 o,8~8 0,9(,) () ,~)8 1 ,01
-13 Ks 60 9,1 0,065 0,788 1,611 2,00 O, f.t?
-14 Ks GO 7,3 0,060 (), 'r p" 1 ,'J 1 1 .6)~ 1,17
-15 Ks 60 5,5 O,OGl 0,769 1 ,H'~ 1,:i8 1,33
-lG Ks Go 4,G 0,065 0,G1I9 1,37 1,7G 0,78
-17 Ks 60 3,7 0,057 0,675 1,23 1,3G 0,91
-18 Ks Go 9,1 () , 101 O, Sin 1,:31 1,50 0,88
-19 Ks 60 7,4 o, 1?,l~ 0,885 0,91.1 1,02 0,92
-20 Ks 60 5,5 0,090 0,820 0,62 1,15 o, )+'[
-21 Ks 60 4,G 0,107 0,862 1,31 0,87 1,5 1
-22 Ks 60 3,6 0,101 O,8Jll 1,36 0,85 1,59
-23 Ks 60 9,2 0,190 0,971 o,fj6 0,117 1,88
-?7 Ko 60 3,7 0,17G O,q;-.C; 1,17 O, Tri 1 • r;(;--~-----~._._,---_._---- ---------_..,~
C)
CD
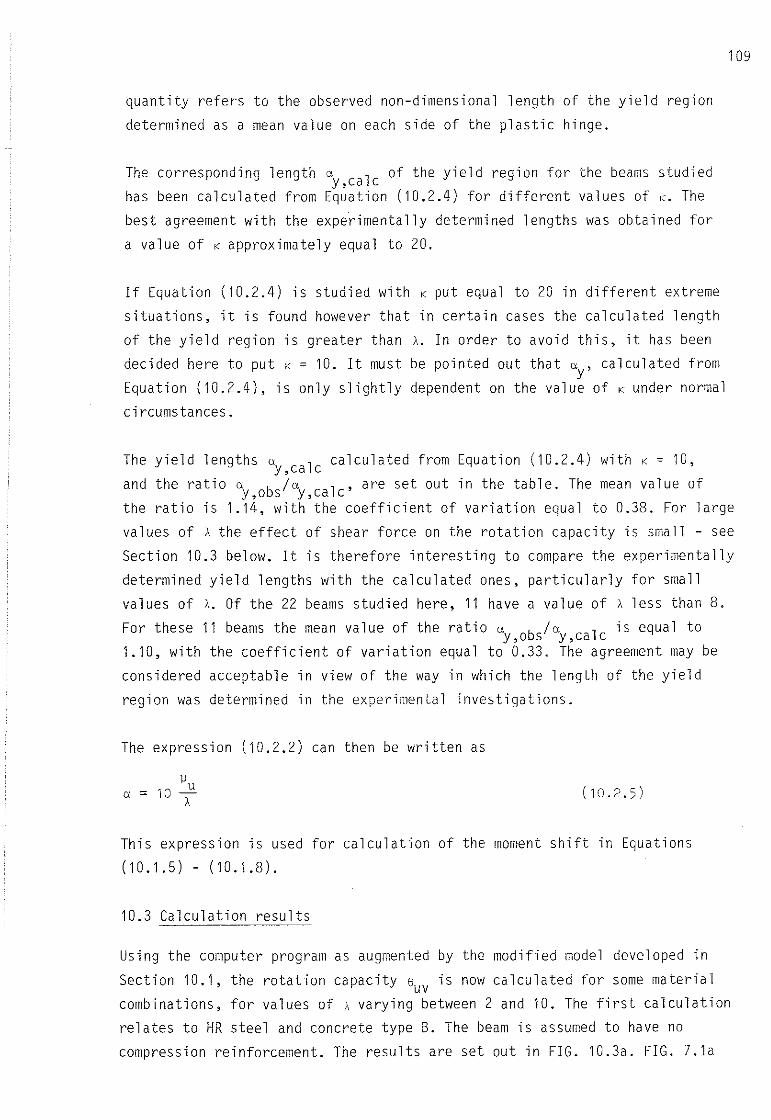
109
quantity refers to the observed non-dimensional length of the yield region
determined as a mean value on each side of the plastic hinge.
The corresponding length a l of the yield region for the beams studiedy,ca chas been calculated from Equation (10.2.4) for different values of K. The
best agreement with the experimental ly determined lengths was obtained for
a value of K approximately equal to 20.
If Equation (10.2.4) is studied with K put equal to 20 in different extreme
situations, it is found however that in certain cases the calculated length
of the yield region is greater than A. In order to avoid this, it has been
decided here to put K = 10. It must be pointed out that ay , calculated from
Equation (10.2.4), is only slightly dependent on the value of K under normal
circumstances.
The yield lengths a l calculated from Equation (10.2.4) with K = 10,y,ca cand the ratio a b la l' are set out in the table. The mean value ofy,o s y,ca cthe ratio is 1.14, with the coefficient of variation equal to 0.38. For large
values of A the effect of shear force on the rotation capacity is small - see
Section 10.3 below. It is therefore interesting to campare the experimental ly
determihed yield lengths with the calculated ones, particularly for small
values of A. Of the 22 beams studied here, 11 have a value of A less than 8.
For these 11 beams the mean value of the ratio a b la l is equal toy,o s y,ca c1.10, with the coefficient of variation equal to 0.33. The agreement may be
considered acceptable in view of the way in which the length of the yield
region was determined in the experimental investigations.
The expression (10.2.2) can then be written as
a = ( 10.2.5)
This expression is used for calculation of the moment shift ln Equations
(10.1.5) - (10.1.8).
10.3 Calculation results
Using the computer program as augmented by the modified model developed in
Section 10.1, the rotation capacity e is now calculated for some materialuvcombinations, for values of A varying between 2 and 10. The first calculation
relates to HR steel and concrete type B. The beam is assumed to have no
compression reinforcement. The results are set out in FIG. 10.3a. FIG. 7.1a
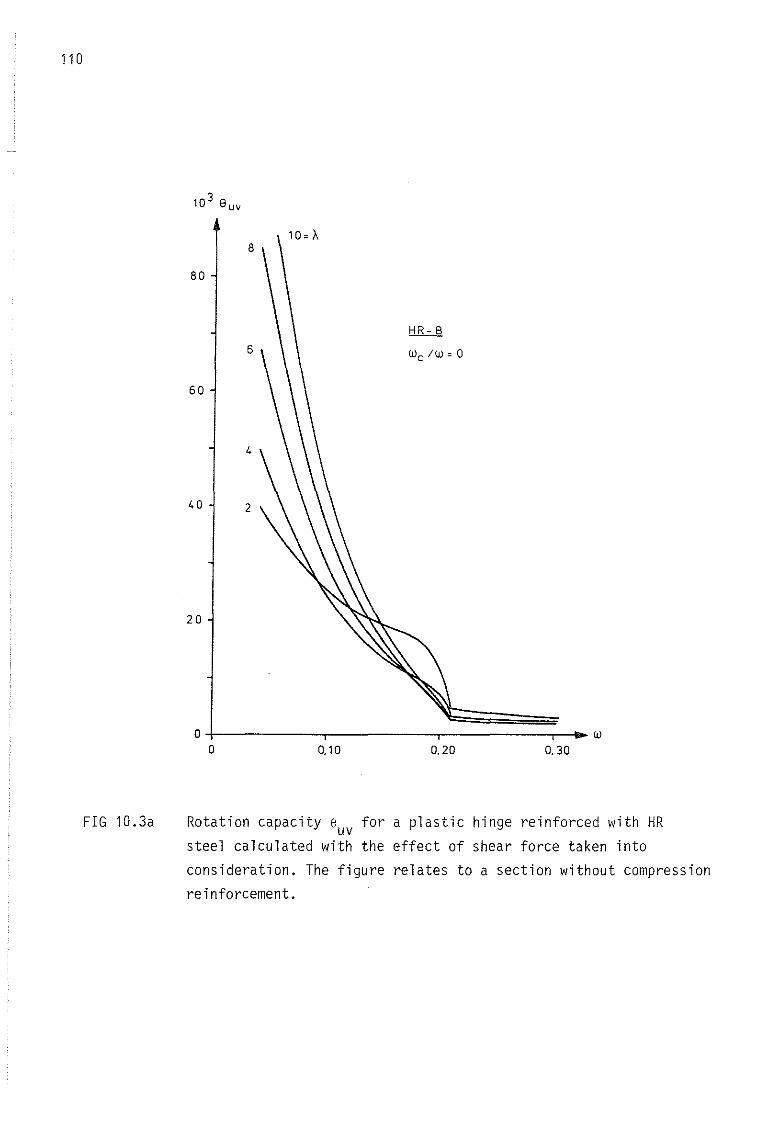
110
310 Suv
8
80
6
80
4
40 2
20
0+-------,-------,-------,-""" WO 0,10 0,20 0,30
FIG 10.3a Rotation capacity e for a plastic hinge reinforced with HRuvsteel calculated with the effect of shear force taken intoconsideration. The figure relates to a section without compressionreinforcement.
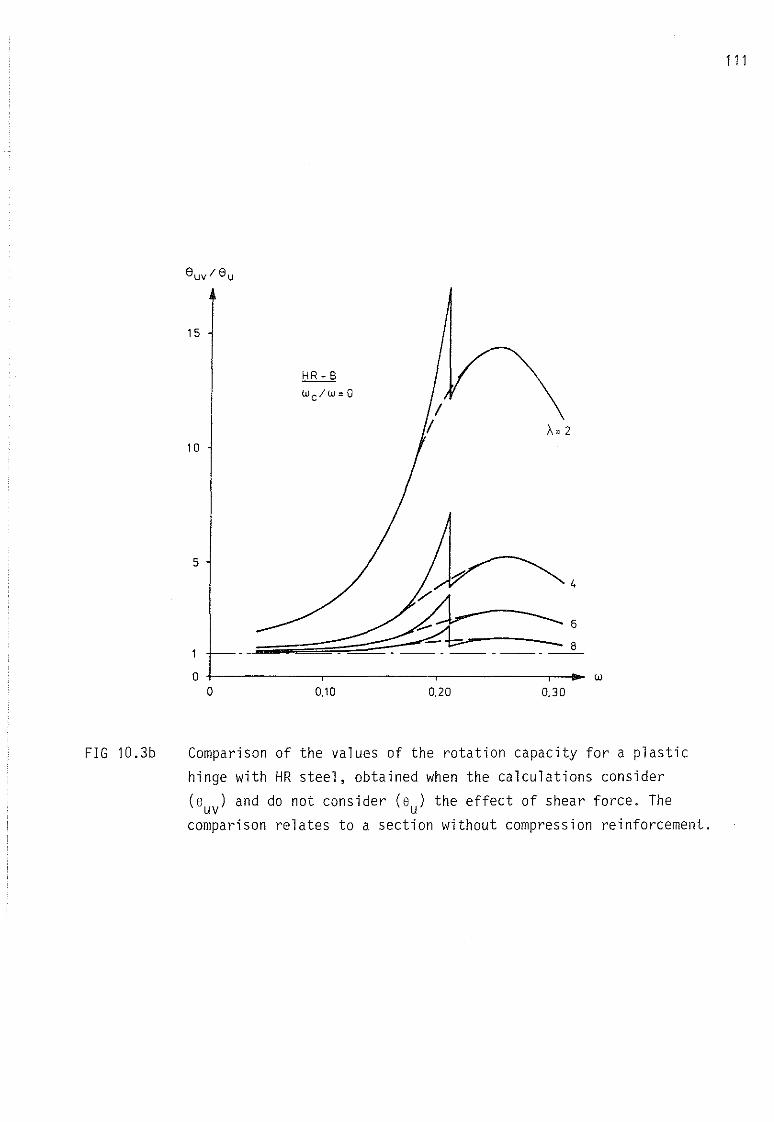
15
10
5
111
O+---~----.------..,----------,- ..... wO 0.10 0.20 0.30
FIG 10.3b Comparison of the yalues of the rotation capacity for a plastichinge with HR steel, obtained when the calculations consider
(SUy) and do not consider (su) the effect of shear force. Thecomparison relates to a section without compression reinforcement.
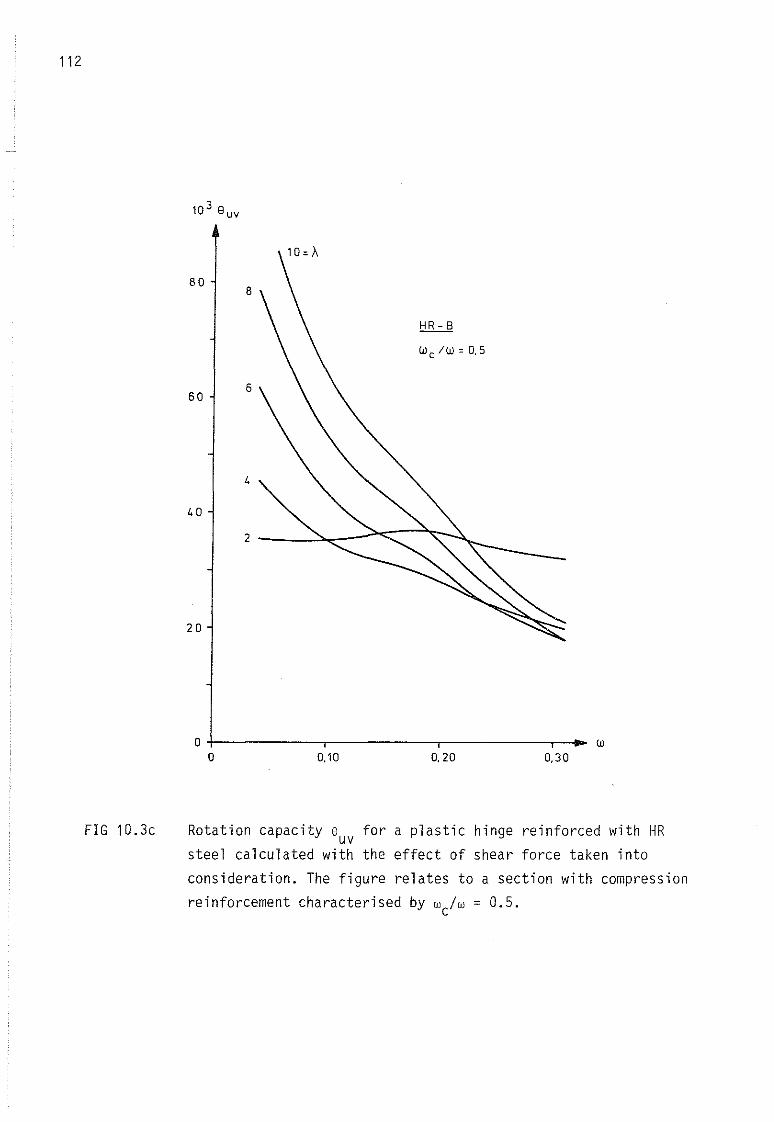
112
310 8 uv
80
60
40
20
w0.300.200.10
0-+-------,------.------,--__O
FIG 10.3c Rotation capacity e for a plastic hinge reinforced with HRuvsteel calculated with the effect of shear force taken intoconsideration. The figure relates to a section with compressionreinforcement characterised by wc/w ~ 0.5.
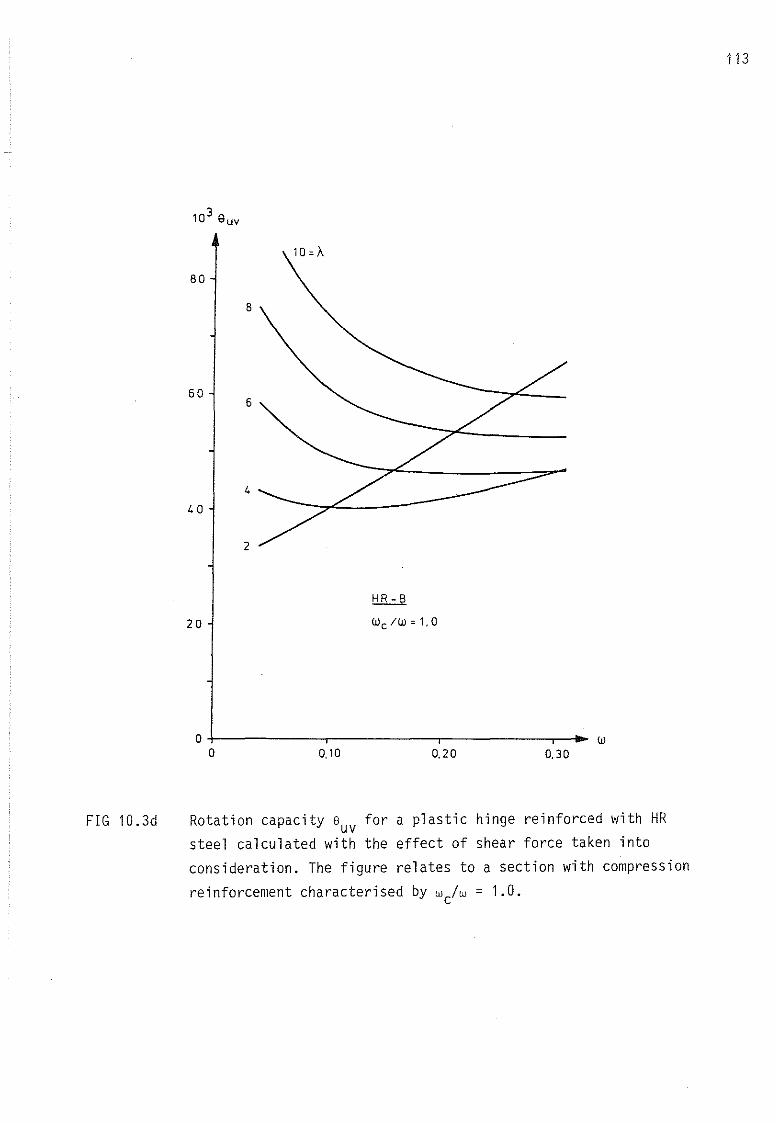
113
310 auv
10 ="80
8
606
4
40
2
20
0.300.200,100+------..,------,------,---....... W
O
FIG 10.3d Rotation capacity 8uv for a plastic hinge reinforced with HRsteel calculated with the effect of shear force taken intoconsideration. The figure relates to a section with compression
reinforcement characterised by wc/w = 1.0.
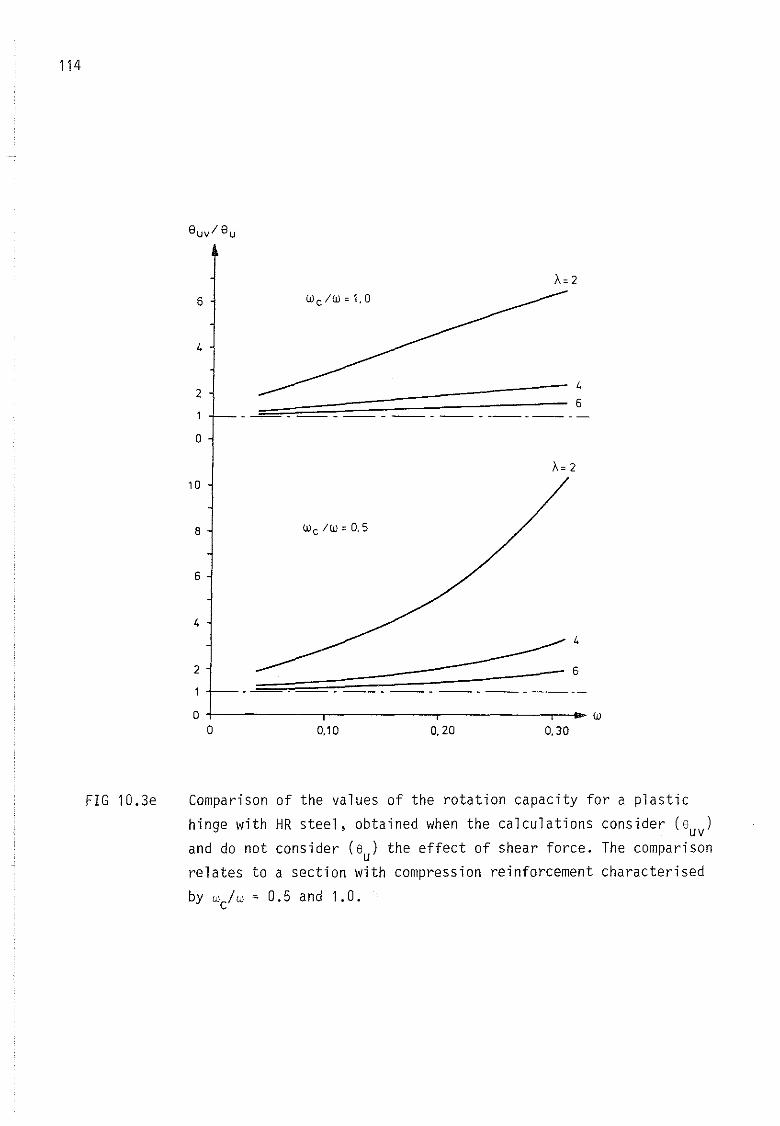
114
6
4
2
o
10
8 Wc /W, 0,5
6
4
2
______ 4
-6
O+-------r-------r-------~ WO 0,10 0.20 0.30
FIG 10.3e Comparison of the values of the rotation capacity for a plastichinge with HR steel, obtained when the calculations consider (suv)
and do not consider (su) the effect of shear force. The comparisonrelates to a section with compression reinforcement characterised
by wclw ~ 0.5 and 1.0.
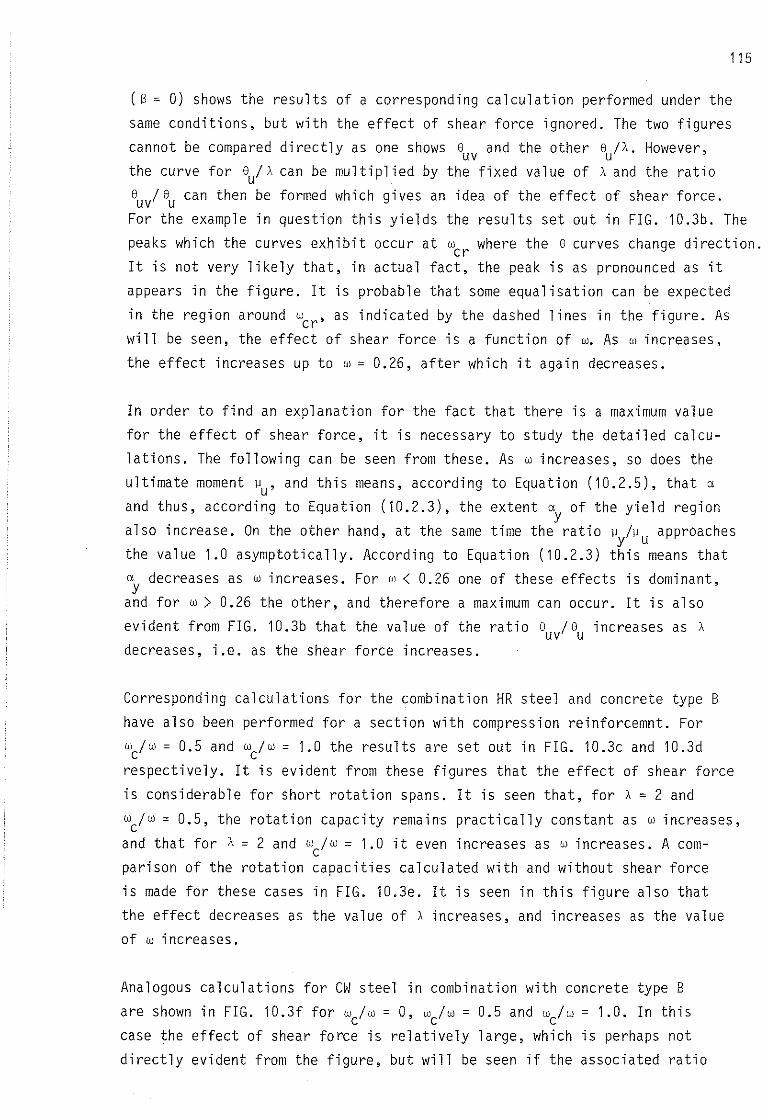
115
(s = O) shows the results of a corresponding calculation performed under thesame conditions, but with the effect of shear force ignored. The two figurescannot be compared directly as one shows 8uv and the other 8/A. However,the curve for 8/ Acan be multipl ied by the fixed value of Aand the ratio8u/8u can then be formed which gives an idea of the effect of shear force.For the example in question this yields the results set out in FIG. 10.3b. Thepeaks which the curves exhibit occur at w where the 8 curves change direction.erIt is not very likely that, in actual fact, the peak is as pronounced as itappears in the figure. It is probable that some equalisation can be expected
in the region around wcr ' as indicated by the das hed lines in the figure. Aswill be seen, the effect of shear force is a function of w. As w increases,
the effect increases up to w= 0.26, after which it again decreases.
In order to find an explanation for the fact that there is a maximum valuefor the effect of shear force, it is necessary to study the detailed calculations. The following can be seen from these. As w increases, so does theultimate moment ~u' and this means, according to Equation (10.2.5), that aand thus, according to Equation (10.2.3), the extent ay of the yield region
also increase. On the other hand, at the same time the ratio ~y/~u approachesthe value 1.0 asymptotically. According to Equation (10.2.3) this means thatay decreases as w increases. For w< 0.26 one of these effects is dominant,and for w> 0.26 the other, and therefore a maximum can occur. It is alsoevident from FIG. 10.3b that the value of the ratio 8u/8u increases as Adecreases, i.e. as the shear force increases.
Corresponding calculations for the combination HR steel and concrete type Bhave also been performed for a section with compression reinforcemnt. For
w/w = 0.5 and wc/w = 1.0 the results are set out in FIG. 10.3c and 10.3drespectively. It is evident from these figures that the effect of shear forceis considerable for short rotation spans. It is seen that, for A= 2 and
wc/w = 0.5, the rotation capacity remains practical ly eons tant as w increases,and that for A = 2 and w/w = 1.0 it even increases as w increases. A comparison of the rotation capacities calculated with and without shear forceis made for these cases in FIG. 10.3e. It is seen in this figure also thatthe effect decreases as the value of A increases, and increases as the valueof w i nereases .
Analogous calculations for CW steel in combination with concrete type B
are shown in FIG. 10.3f for wc/w = O, w/w = 0.5 and w/w = 1.0. In thiscase the effect of shear force is relatively large, which is perhaps notdirectly evident from the figure, but will be seen if the associated ratio
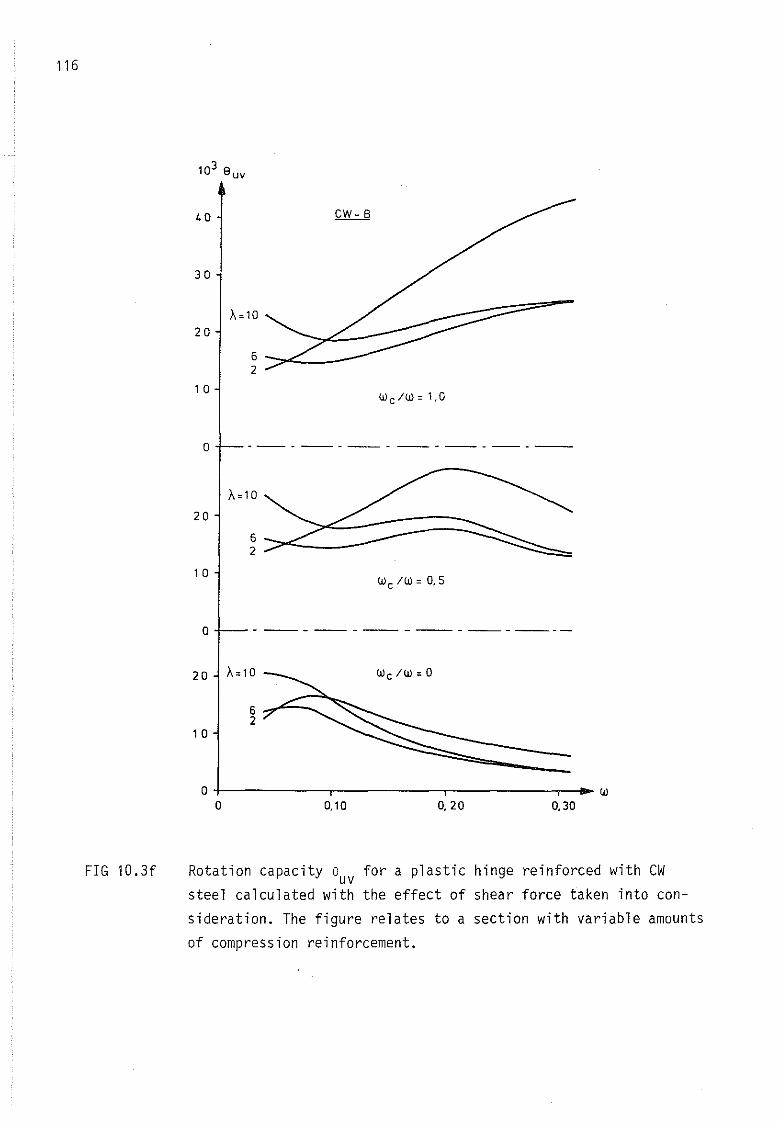
116
3lO auv
40
30
20
6-::;:;...c...__2
1 O
O
20
l O
O
20 ",10
6-~2l O
0,300,20O, laO+------r------r------,--w
O
FIG 10.3f Rotation capacity 8uv for a plastic hinge reinforced with CWsteel calculated with the effect of shear force taken into consideration. The figure relates to a section with variable amountsof compression reinforcement.
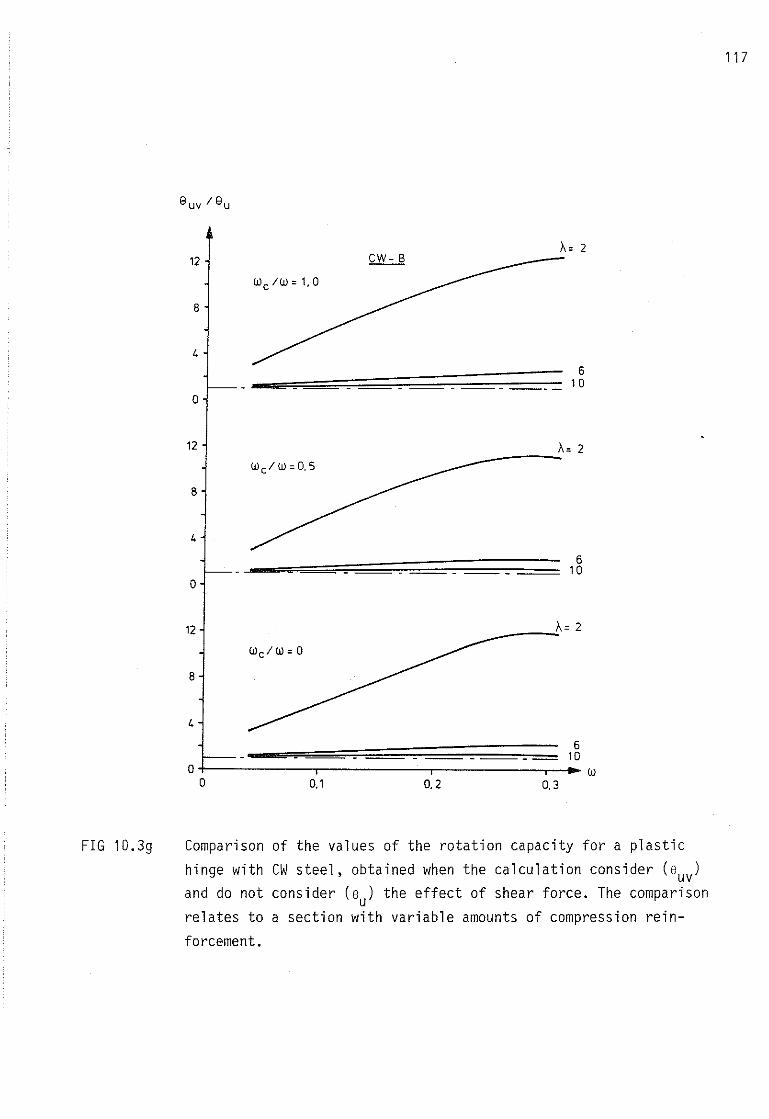
117
8 uv /8 u
A: 212 CW- B
Wc/W: 1.0
8
4
610
O
12 A: 2
Wc /W:0.5
8
4
610
O
12 A: 2
Wc / W: O
8
4
610
O WO 0.1 0.2 0.3
FIG 10.39 Camparison of the values of the rotation capacity for a plastic
hinge with CW steel, obtained when the calculation consider (suv)and do not consider (Bu) the effect of shear force. The camparisonrelates to a section with variable amounts of compressian rein
forcement.
118
8uv/8U
' which is plotted in FIG. 10.3g, is studied.
It is evident from the studied worked examples that the analytical modelconstructed yields results in good agreement with those to be expected inview of previous experimantal experiences.
119
11 THE EFFECT OF STIRRUPS
It is known from the literature that the presence of stirrups in the beamin the vicinity of a plastic hinge has the effect of raising the rotationcapacity. This effect is primarily due to the fact that the stirrups holdtogether the concrete in the compression zone in the stress interval ~y to~u' It is in consequence possible for compressive strains several timeshigher than the ultimate strain of the unreinforced concrete to occur without
splitting of the concrete in the compression zone.
Tests on concrete surrounded by stirrups and subjected to compressivestresses show that the presence of stirrups affects the stress-strain diagramof the concrete in different respects. 80th the ultimate compressive strainE
CUand the limit strain E
Ocorresponding to the maximum compressive stress
are increased, the latter more moderately. The compressive strength fcc ofthe concrete and the stress corresponding to the ultimate strain E
CUare also
raised. Taken together, the effect is that the area bounded by the stressstrain diagram increases owing to the application of stirrups, which in turnmeans that the ability of the compression zone to store deformation energy
is enhanced. In particular, the fact that \u increases also means that thetension reinforcement can develop alarger strain before crushing failureof the concrete occurs. The deformation energy of the tension reinforcementalso increases in consequence. The use of stirrups thus results in a totalincrease in the capacity of the concrete to store deformation energy within
the volume of the rotation span, which gives the plastic hinge a higherrotation capacity as most of the increment in energy consumption is of an
irreversible nature.
In the following, a method whereby the previously constructed analytical model
can be extended so as to take into account the effect of stirrups will bedeveloped semi-empirically.
11.1 Phenomenological discussion
The magnitudes of the above parameters which determine the stress-straincurve of the concrete are functions of the extent of stirrup reinforcement,i.e. the dimension, strength and spacing of the stirrups and the strengthof the surrounded concrete. The way one set of parameters is dependent onthe other is unknown at present. It is therefore necessary to group togethera number of parameters in a reasonable manner so as to constitute a singleparameter which is then used as a measure of the extent of the effect due
to the stirrups.
120
The effective reinforcement ratio of the stirrups, defined by the expression
wv
;;:, " s-"= ---~bs -'"'
-'-et
is used as the governing parameter, where
Asv = cross sectional area of one stirrup barf sv = tensile strength of the steel in the stil'rupb = width of the compression zones = stirrup spacing
fct = tensile strength of concrete
That the selected parameter combination is a reasonable one will be evidentfrom the following. The stirrups have the effect of holding together theconcrete in the compression zone which, under the influence of large compressive stresses in the axial direction, expands in the transverse direction.When the stirrups are rectangular in shape, the counterbalancing forces canprincipally be developed at the corners of a stirrup. This effect should
therefore decrease with increasing distance between the two interactingcorner forces, i.e. for the usual stirrup shape with increasing width b. Themaximum magnitude of the corner forces is directly proportional to both Asvand f sv ' and the maximum corner force per unit length of beam is inverselyproportional to the stirrup spacing s. Immediately prior to crushing failureof the concrete, this disintegrates while undegoing transverse expansion.This transverse expansion can not take place without the formation of a largenumber of microcracks in the concrete in the compression zone. It is therefore probable that the tensile strength of concrete is a more signi ficantparameter in this context than the compressive strength.
It is assumed in the following that the stirrup effect is a function onlyof the parameter wv'
In order to exemplify the above, let us first calculate the rotation capacltyfor a beam with Wv = O, i.e. for a beam without stirrup reinforcement. Thebeam is assumed to be of concrete type B, see FIG. 11.1a, in combination with
both CW steel and HR steel. The beam is then assumed to be provided withstirrup reinforcement corresponding to a value wv1' and as a result thestress-strain curve of the concrete in the compression zone is assumed tochange to the curve marked B1 in FIG. 11.1a. The rotation capacity is calculated for this curve. Finally, it is assumed that stirrup reinforcement
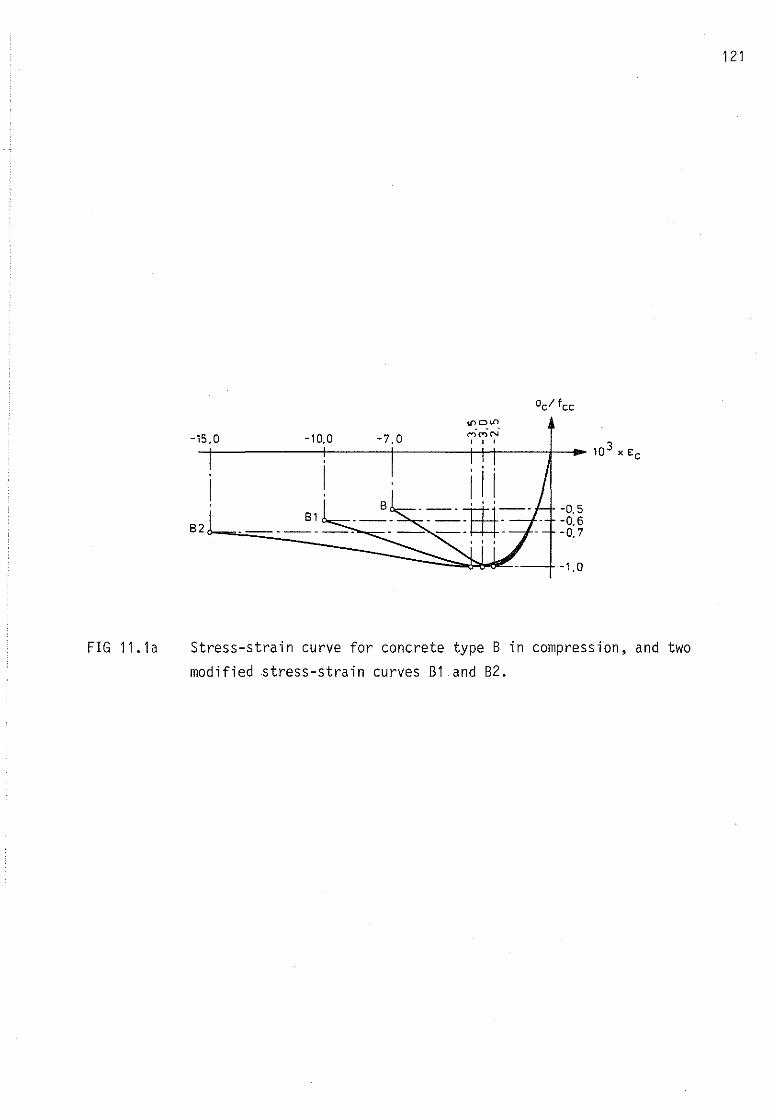
121
-7, o-10,0onoonC")"M(,..i
I l l 3-+------+---+------t-+t---+-i~ 10 x Ec
-15,0
81-0,5-0.6-0,7
-1,0
FIG 11. 1a Stress-strain curve for concrete type B in compression, and two
modified $tress-strain curves B1 and B2.
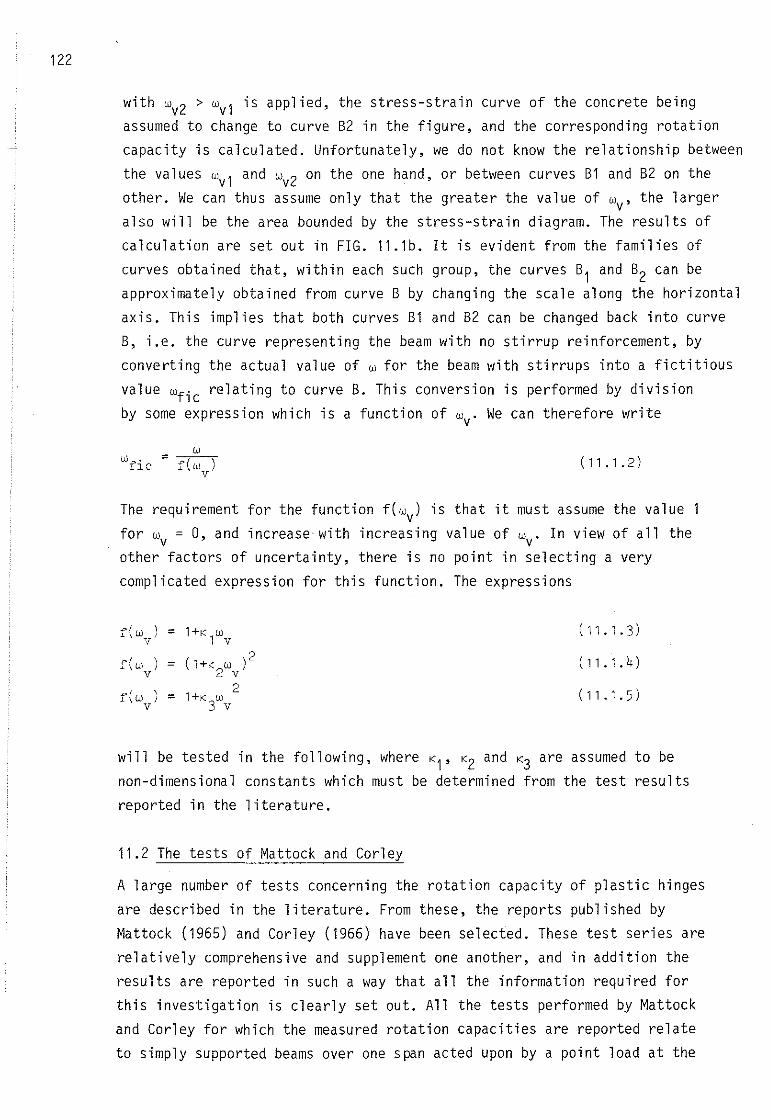
122
with wv2 > wv1 is applied, the stress-strain curve of the concrete beingassumed to change to curve B2 in the figure, and the corresponding rotationcapacity is calculated. Unfortunately, we do not know the relationship betweenthe values wv1 and wv2 on the one hand, or between curves B1 and B2 on theother. We can thus assume only that the greater the value of wv' the largeralso will be the area bounded by the stress-strain diagram. The results ofcalculation are set out in FIG. 11.1b. It is evident from the families ofcurves obtained that, within each such group, the curves B1 and B2 can beapproximately obtained from curve B by changing the scale along the horizontalaxis. This implies that both curves B1 and B2 can be changed back into curveB, i.e. the curve representing the beam with no stirrup reinforcement, byconverting the actual value of w for the beam with stirrups into a fictitious
value wfic relating to curve B. This conversion is performed by divisionby some expression which is a function of wv' We can therefore write
(11.1.2)
The requirement for the function f(wv) is that it must assume the value 1for Wv = O, and increase·with increasing value of wv' In view of all theother factors of uncertainty, there is no point in selecting a very
complicated expression for this function. The expressions
r(w \ = l+K w (11.1.3),v 1 v
r(w ) = (l+K w )2 (11.1.4)v ' 2 v
r(w , 2 (11.1.5)I = l+K Wv 3 v
will be tested in the following, where K1, K2 and K3 are assumed to benon-dimensional constants which must be determined from the test resultsreported in the literature.
11.2 The tests of Mattock and Corley
A large number of tests concerning the rotation capacity of plastic hinges
are described in the literature. From these, the reports published byMattock (1965) and Corley (1966) have been seleeted. These test series arerelatively comprehensive and supplement one another, and in addition theresults are reported in such away that all the information required forthis investigation is clearly set out. All the tests performed by Mattockand Corley for which the measured rotation capacities are reported relateto simply supported beams over one span acted upon by a point load at the
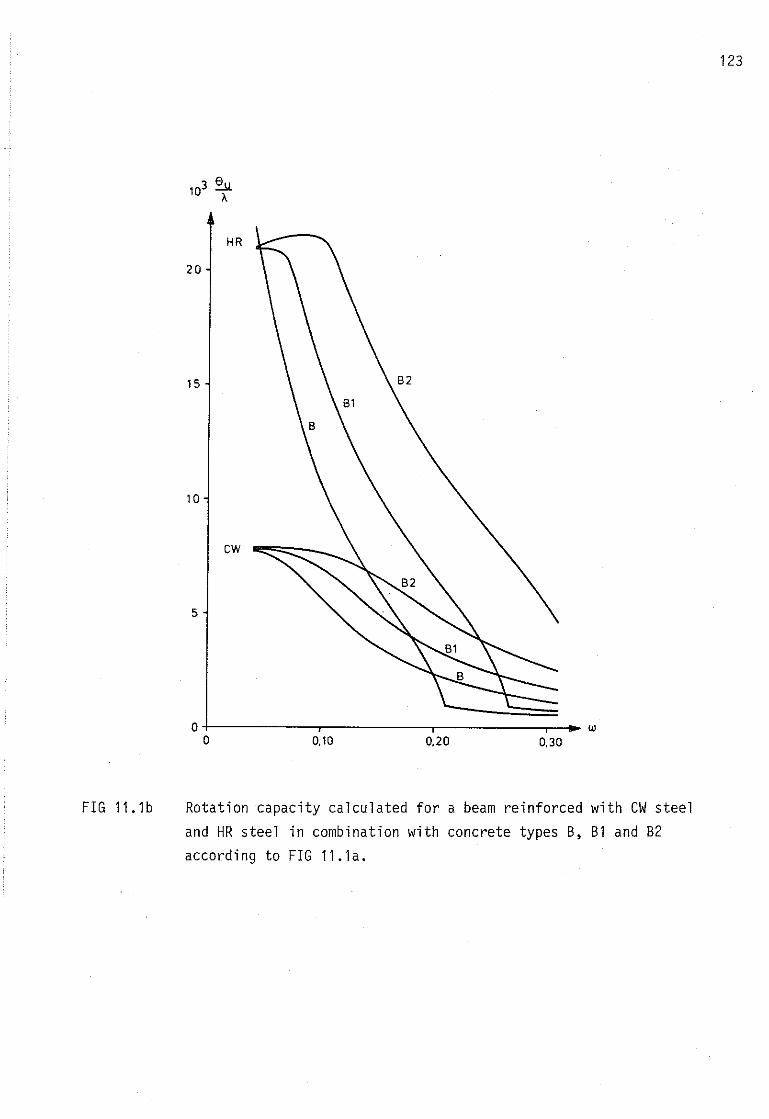
123
HR
20
15
10
cw
5
0,300,200,10O+------.-------.-------r-.... w
O
FIG 11.1b Rotation capacity calculated for a beam reinforced with CW steeland HR steel in combination with concrete types B, B1 and B2according to FIG 11.1a.
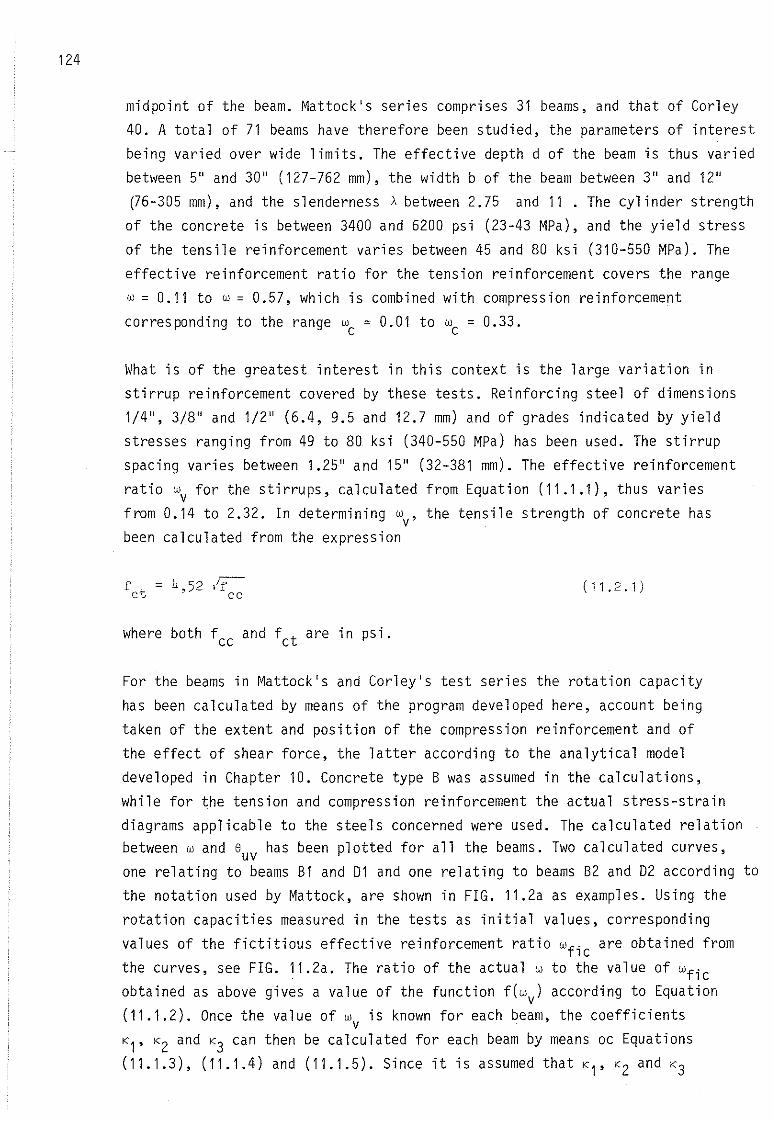
124
midpoint of the beam. Mattock's series comprises 31 beams, and that of Corley40. A total of 71 beams have therefore been studied, the parameters of interestbeing varied over wide limits. The effective depth d of the beam is thus variedbetween 5" and 30" (127-762 mm), the width b of the beam between 3" and 12"r6-305 mm), and the slenderness Abetween 2.75 and 11 . The cylinder strength
of the concrete is between 3400 and 6200 psi (23-43 MPa), and the yield stressof the tensile reinforcement varies between 45 and 80 ksi (310-550 MPa). The
effective reinforcement ratio for the tension reinforcement covers the rangew= 0.11 to w= 0.57, which is combined with compression reinforcement
corresponding to the range Wc = 0.01 to Wc = 0.33.
What is of the greatest interest in this context is the large variation instirrup reinforcement covered by these tests. Reinforcing steel of dimensions1/4", 3/8" and 1/2" (6.4, 9.5 and 12.7 mm) and of grades indicated by yieldstresses ranging from 49 to 80 ksi (340-550 MPa) has been used. The stirrupspacing varies between 1.25" and 15" (32-381 mm). The effective reinforcement
ratio Wv for the stirrups, calculated from Equation (11.1.1), thus variesfrom 0.14 to 2.32. In determining wv' the tensile strength of concrete hasbeen calculated from the expression
f = 4,52 ,Iret cc
where both fcc and fet are in psi.
(11.2.1)
For the beams in Mattock's and Corley's test series the rotation capacity
has been calculated by means of the program developed here, account beingtaken of the extent and position of the compression reinforcement and ofthe effect of shear force, the latter according to the analytical modeldeveloped in Chapter 10. Concrete type B was assumed in the calculations,while for the tension and compression reinforcement the actual stress-straindiagrams applicable to the steels concerned were used. The calculated relationbetween w and 8uv has been plotted for all the beams. Two calculated curves,one relating to beams B1 and Dl and one relating to beams B2 and D2 according tothe notation used by Mattock, are shown in FIG. 11.2a as examples. Using therotation capacities measured in the tests as initial values, correspondingvalues of the fictitious effective reinforcement ratio wfic are obtained from
the curves, see FIG. 11.2a. The ratio of the actual w to the value of wficobtained as above gives a value of the function f(wv) according to Equation(11.1.2). Once the value of w is known for each beam, the coefficients
vKl' K2 and K3 can then be calculated for each beam by means oc Equations(11.1.3), (11.1.4) and (11.1.5). Since it is assumed that K1, K2 and K3
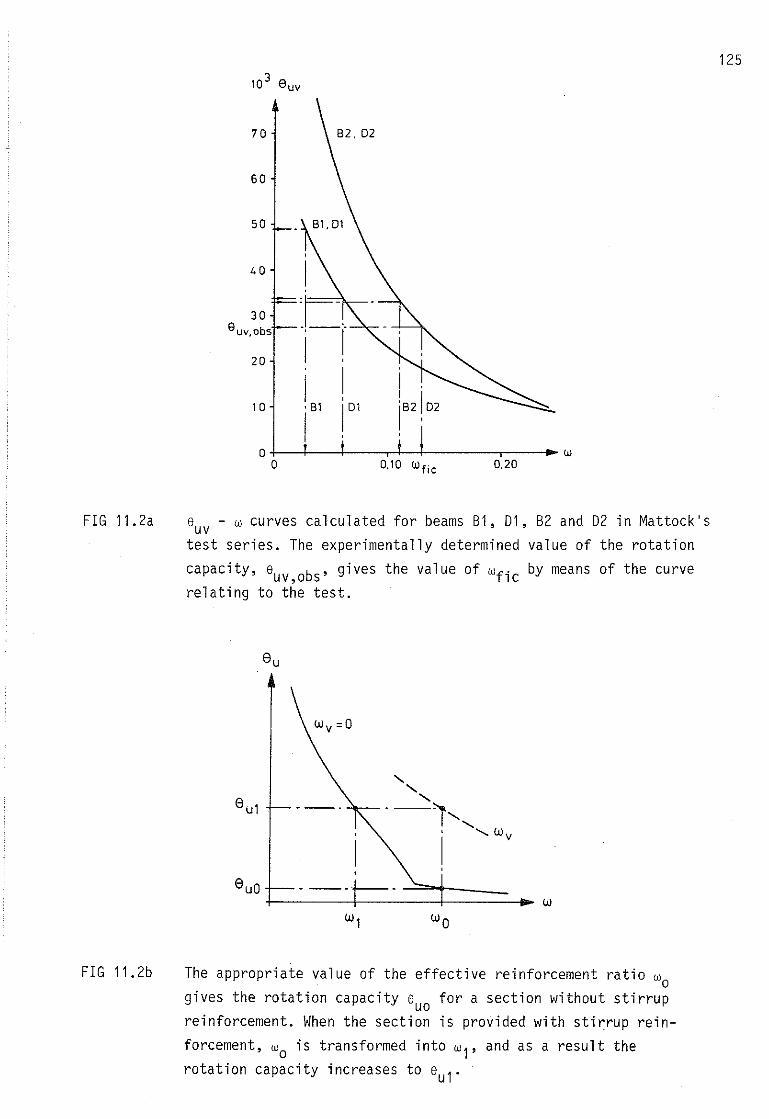
125310 8 uv
0,20+--f---l---,-+--1-----,--__ w
70
60
50
,
40 I30 _r: '_
euv,obs
II20 ,
I I,10 ' 81 IDl
IO
O 0,10 Wfic
FIG 11.2a s - w curves calculated for beams B1, D1, B2 and D2 in Mattock'suvtest series. The experimental ly determined value of the rotation
capacity, Suv,obs' gives the value of wfic by means of the curverelating to the test.
'- '-Gu'
,---- --I',
-""w V
IGuD - ---
ww, Wo
FIG 11.2b The appropriate value of the effective reinforcement ratio Wo
gives the rotation capacity Suo for a section without stirrupreinforcement. When the section is provided with stirrup rein
forcement, Wo is transformed into w1' and as a result therotation capacity increases to Su1'
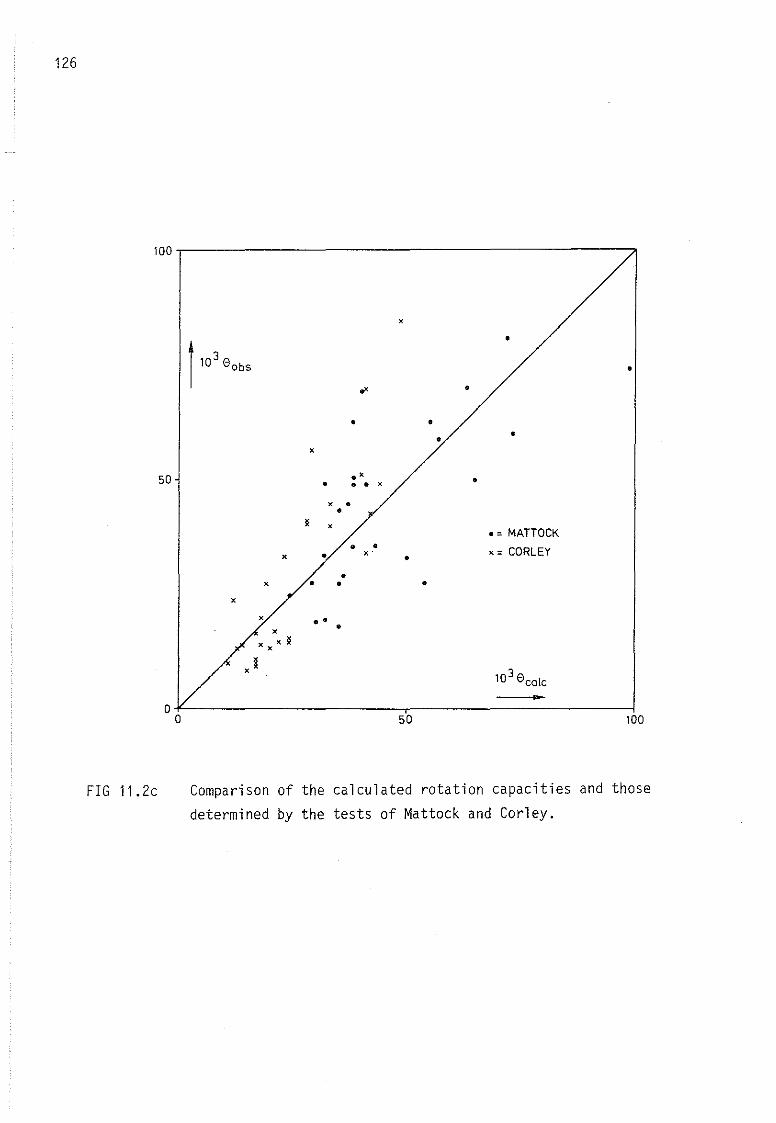
126
100,-----------------------------"
x
r 103
8 0bs
•
•,x •
• •• •
x
50 .x •• • • x
x ••l x
•• MATTOCK• • x. CORLEYx • x •
•x • • •x
x ••x •
x x x l
x l310 8 calc
•50 100
FIG 11.2c Comparison of the calculated rotation capacities and those
determined by the tests of Mattock and Corley.
127
are constants, they can be determined as the means of the individual values
calculated from the test material in the way described above. Of the suggestedexpressions (11.1.3), (11.1.4) and (11.1.5), the one which exhibits the leastscatter with respect to the mean is then selected. Such an analysis performedon the present test material verifies expression (11.1.4) as the best. Thisexpression yields the value ~ = 1.31 when all 71 tests are included. Whenseven extreme values are removed, the mean for the remaining 64 beams is
~ = 0.97. The approximation ~ = 1.0 is chosen. Equations (11.1.2) and(11.1.4) then yield the relation
ww = --"-----;o-fic (1+w)2
v
(11.2.2)
Calculation of the rotation capacity with respect to the effect of thestirrup reinforcement can now be carried out as follows, see FIG. 11.2b.The plastic hinge is assumed to have the actual effective reinforcement ratiowo' Without stirrup reinforcement, the rotation capacity 8uo is thus obtainedby means of a curve for Wv = O, calculated by means of the computer program.
With stirrup reinforcement corresponding to wv' the rotation capacity 8u1 forWo would be obtained by means of the dashed curve. The method adopted inpractice is to convert Wo to w, = wfic by means of Equation (11.2.2), andto obtain the sought rotation capacity 8u1 from the curve relating to Wv = O.
That it is functionally correct to adopt the above procedure is confirmed by
the following. The way the stress-strain curve of the concrete increases indeformation capacity for increasing Wv is indicated in FIG. 11.la. What thisfigure, which is non-dimensional, does not show is that fcc also increases forincreasing wv' An increase in fcc implies a reduction in w, which correspondsto some of the shift in the curve shown in FIG. 11.2b.
The power 2 in expression (11.2.2) for the scale factor f(wv) can be explainedby the dual effect of the stirrup reinforcement. Surrounding of the concrete
increases not only fcc but also scu' and the latter increase also results inan increase in rotation capacity, which in calculations according to the pro
posed method is taken into account by further reduction of w.
As mentioned above, the calculation procedure developed has been systematically
applied to the tests of Mattock and Corley. The measured rotation capacities80bs were then compared with the calculated rotation capacities 8calc by means
of the ratio 8obs/8calc' In the investigation a number of test results wererejected. These related to tests which exhibited such extreme discrepancies
from the general trend that there was justification to suspect a measuring
128
error or some other procedural error. Mattock and Corley themselves reportdifficulties in measurement. Two tests from Mattock's series, and 11 testsfrom Corley's series, have been omitted. The remaining tests yield thefollowing results.
For Mattock's tests, the mean value of 29 values of 8obs/8calc = 0.97, withthe coefficient of variation = 0.35.
For Corley's tests, the mean value of 29 values of 8obs/8calc = 1.08, withthe coefficient of variation = 0.40.
For all the 58 tests analysed, the mean value of 8obs/8calc = 1.03, with thecoefficient of variation = 0.38.
The comparative calculation performed is shown in detail in FIG. 11.2c. Thevalidity of the results obtained must be judged in view of the fact that in
these test series the value of Wv varies over very wide limits, viz. between0.14 and 2.32.
129
12 DISCUSSION OF THE SAFETY ASPECT
The following discussion relates to the safety philosophy advocated by theCEB (1976). In principle, it is the same philosophyas that on which theSwedish "General regulations for loadbearing structures" (AK 77) and "Regula
tions for concrete structures" (BBK 77) arebased.
According to the CEB, the ultimate limit state due to a bending moment is tobe checked by comparing the ultimate moment with the bending moment capacity
of the section concerned. Determination of the bending moment capacity is tobe based on the design compressive strength fcc of the concrete and thedesign tensile strength f st of the reinforcement. In turn, these designstrengths are to be obtained from the characteristic strengths fcck and f stkrespectively of the materials, defined in a certain manner, by dividing theseby partial coefficients. The following expressions apply
cc"~eek
= (12.1)
( 12.2)
where Yc is the partial coefficient for concrete in compression, and
fstk=--Ys
where Ys is the partial coefficient for reinforcement in tension.
An analogous procedure should be applicable when a deformation characteristicis studied. The rotation capacity of a plastic hinge is essentially determined by the strain capacities of the steel and concrete, and it therefore
appears reasonable to apply the factors of safety to these. We thereforeassume that the characteristic ultimate strain Esuk of the reinforcementand the characteristic ultimate compressive strain Ecuk of the concreteare quantities defined in a certain manner, and determine the correspondingdesign values from these. We thus have
"euk" =--eu Ye
and
( 12.3)
"su"suk=
Ys
( 12.4)
In principle, the partial coefficients relating to ultimate strains shouldbe chosen in view of the appropriate scatter characteristics of these strains.For the sake of simplicity, however, in the following calculations the partial
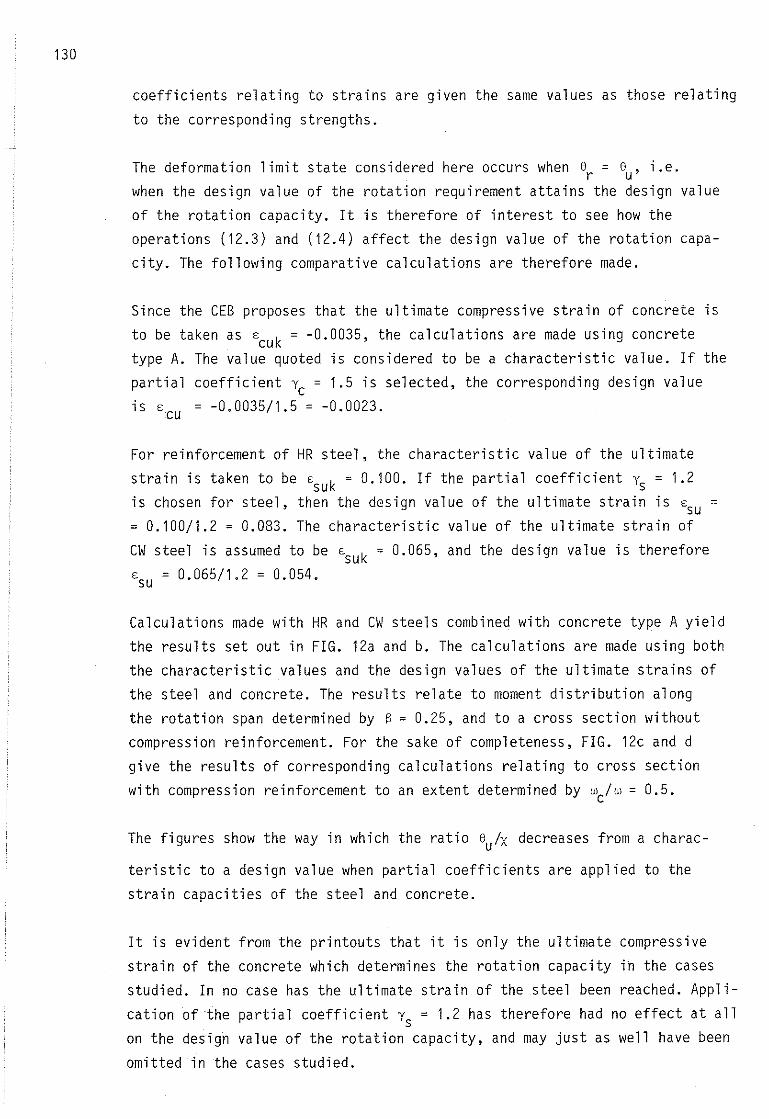
130
coefficients relating to strains are given the same values as those relating
to the corresponding strengths.
The deformation limit state considered here occurs when 8r = 8u' i.e.when the design value of the rotation requirement attains the design valueof the rotation capacity. It is therefore of interest to see how theoperations (12.3) and (12.4) affect the design value of the rotation capacity. The following comparative calculations are therefore made.
Since the CEB proposes that the ultimate compressive strain of concrete isto be taken as Ecuk = -0.0035, the calculations are made using concretetype A. The value quoted is considered to be a characteristic value. If thepartial coefficient Yc = 1.5 is selected, the corresponding design valueis E
CU= -0.0035/1.5 = -0.0023.
For reinforcement of HR steel, the characteristic value of the ultimatestrain is taken to be Esuk = 0.100. If the partial coefficient Ys = 1.2is chosen for steel, then the design value of the ultimate strain is E
SU=
= 0.100/1.2 = 0.083. The characteristic value of the ultimate strain ofCW steel is assumed to be Esuk = 0.065, and the design value is therefore
ESU
= 0.065/1.2 = 0.054.
Calculations made with HR and CW steels combined with concrete type A yield
the results set out in FIG. 12a and b. The calculations are made using boththe characteristic values and the design values of the ultimate strains ofthe steel and concrete. The results relate to moment distribution alongthe rotation span determined by S = 0.25, and to a cross section withoutcompression reinforcement. For the sake of completeness, FIG. 12c and dgive the results of corresponding calculations relating to cross sectionwith compression reinforcement to an extent determined by wc/w = 0.5.
The figures show the way in which the ratio 8u/X decreases from a charac
teristic to a design value when partial coefficients are applied to thestrain capacities of the steel and concrete.
It is evident from the printouts that it is only the ultimate compressive
strain of the concrete which determines the rotation capacity in the ca sesstudied. In no case has the ultimate strain of the steel been reached. Application of the partial coefficient Ys = 1.2 has therefore had no effect at allon the design value of the rotation capacity, and may just as well have been
omitted in the cases studied.
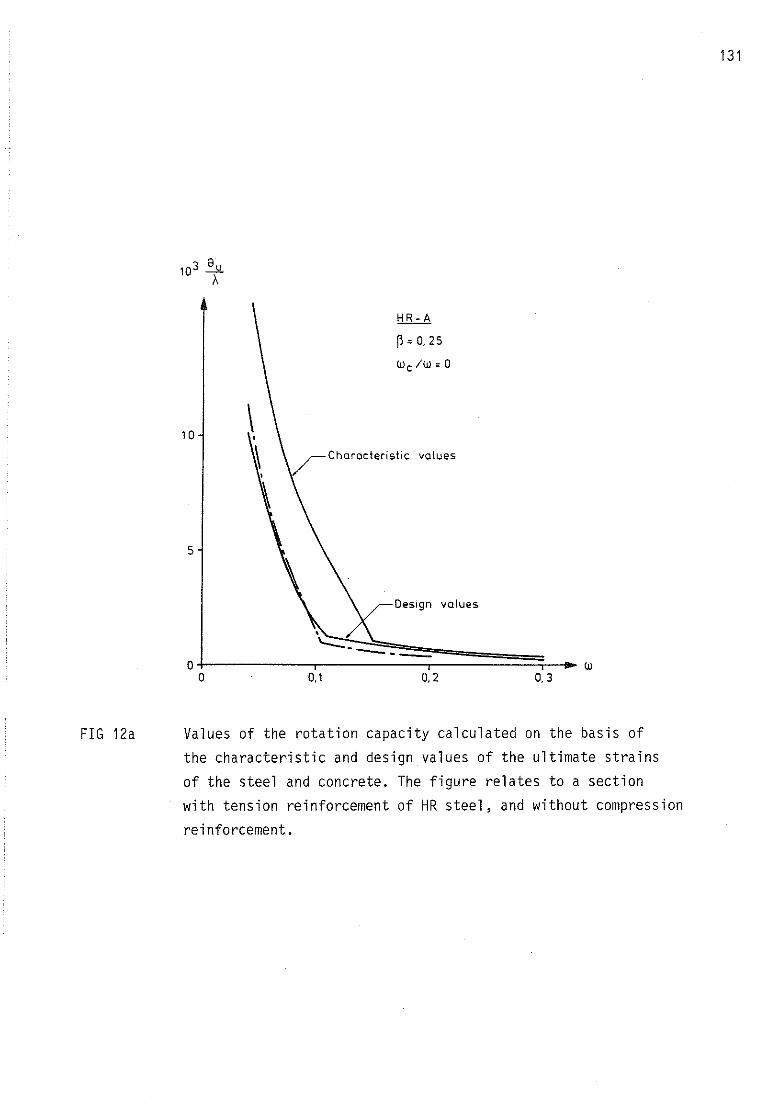
131
O. 30.2
Design values
0.1
HR-Ä
~" O. 25
Wc!W " O
5
10
FIG 12a Values of the rotation capacity calculated on the basis of
the characteristic and design values of the ultimate strainsof the steel and eonerete. The figure relates to a sectionwith tension reinforcement of HR steel, and without compression
reinforcement.
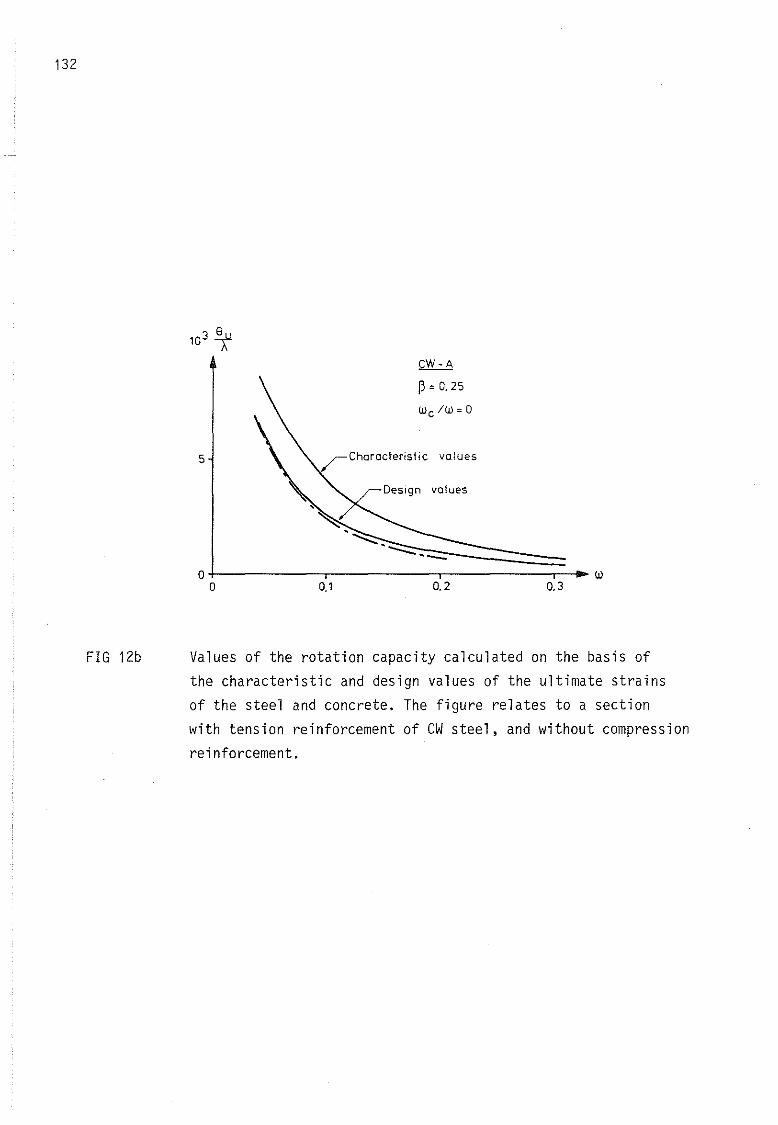
132
0.30.2
CW-Ä
~ = 0.25
Wc /W =O
rCharaeteriStic values
Design vatues
0.1
5
FIG 12b Values of the rotation capacity calculated on the basis ofthe characteristic and design values of the ultimate strainsof the steel and eonerete. The figure relates to a sectionwith tension reinforcement of CW steel, and without compression
reinforcement.
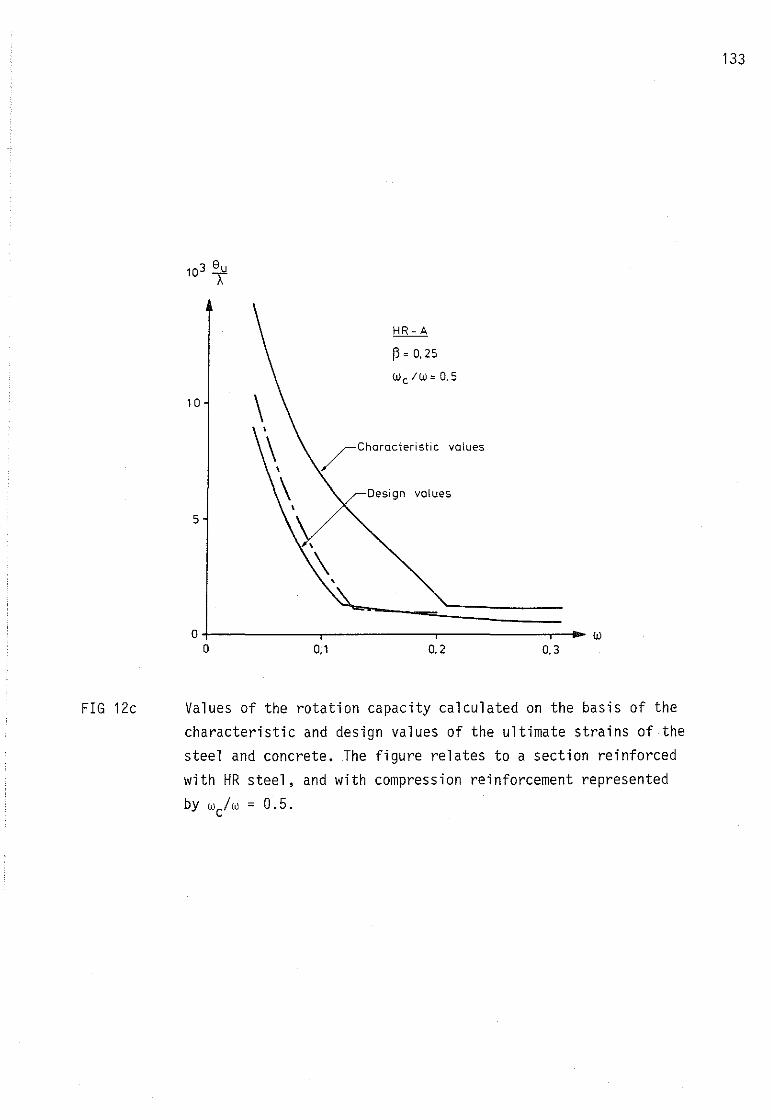
133
10
5
HR-Ä
~ = 0.25
Wc IW=0.5
/Characteristic va lues
Design volues
,
0.30.20.10+--------,.-------,------.,-""'" W
O
FIG 12c Values of the rotation capacity calculated on the basis of thecharacteristic and design values of the ultimate strains of thesteel and eonerete. The figure relates to a section reinforcedwith HR steel, and with compression reinforcement represented
by w/w = 0.5.
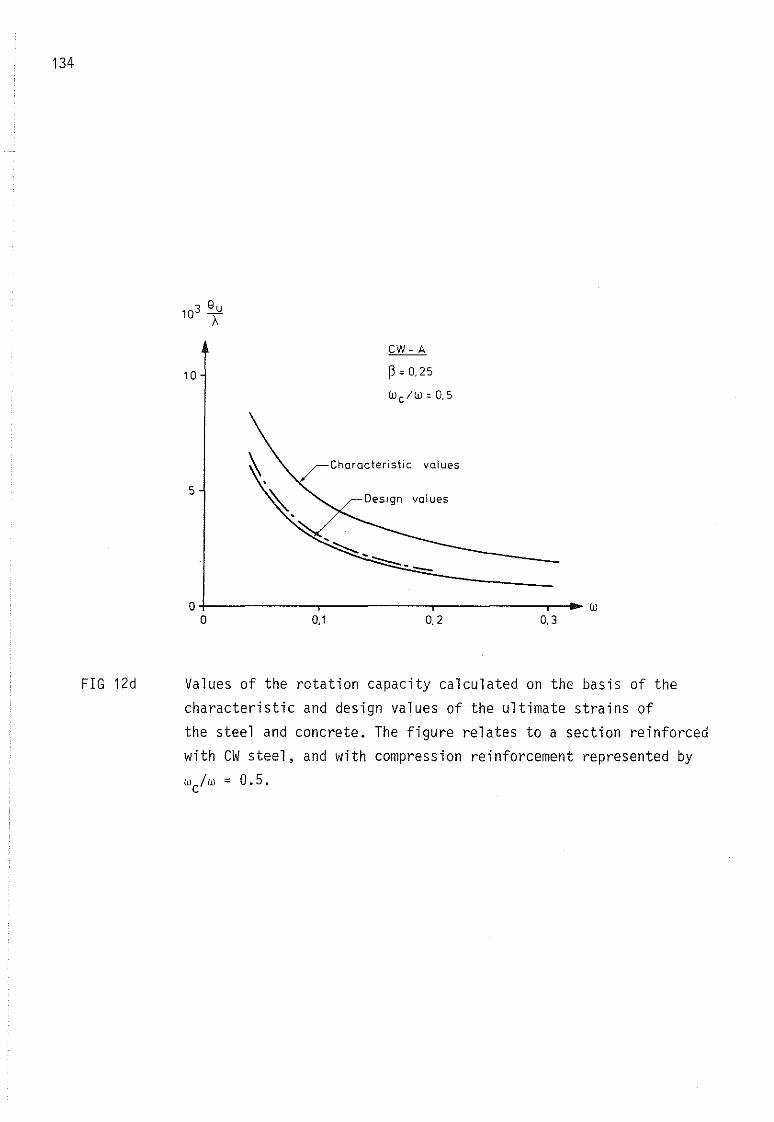
134
10
cw- A
~ ; 0,25
Wc/W; 0,5
5
rCharaeteristic va lues
Design values
0,30,20,10+-------,--------,------,-....... W°
FIG 12d Values of the rotation capacity calculated on the basis of the
characteristic and design values of the ultimate strains ofthe steel and eonerete. The figure relates to a section reinforcedwith CW steel, and with compression reinforcement represented by
w/w = 0.5.
135
In practice, it would be an advantage if the curves relating to the rotation
capacity could be calculated from the characteristic ultimate strains andthe factor of safety instead applied to w, i.e. by replacing the characteristicstrengths by the design strengths when w is calculated. This would give rise
to the expression
" fstk Ye Yest
w. '" o '" p '" wkel f f cck
y Yscc s( 12.5)
where wd is the design value of w and wk the corresponding characteristic value.
In view of the fact that in the cases studied, and probably also in ordinarypractical cases, y has no effect on the design value of the rotation capacity,sit should be possible to simplify Equation (12.5) to
W,="{UlkJ. c_~
( 12.6)
Expression (12.6) implies a change of scale in relation to the waxis, with
Yc as the scale factor. This hypothesis is checked for wc/w'" O by changingthe scale of the curves in FIG. 12a and b dividing w by Yc '" 1.5. The curvesshown by chain lines in the figures are obtained in this way. These arepractical ly completely coincident with the full lines based on the design
strains of the steel and concrete when wc/w = O.
For the sake of consistency, the characteristic value of the ratio wc/wk =
= (wc/w)k for a sectioll with compression reinforcement should be replacedby its design value
(w /w). '" w/w. '" w /Y w '" (w /w)k/Yc Q c G.. c ck c c(12.7)
For the case studied, this implies that the curve relating to the designvalue of the rotation capacity is obtained by the above change in scale in
relation to the curve calculated for wc/w'" 0.5/1.5 = 0.33. The curves plottedwith chain lines in FIG. 12c and d, which are a good approximation to thecurves calculated by means of the design values of the ultimate strains, areobtained in this way.
It is proposed on the basis of the above analysis that the curves which canbe calculated with the computer program described in this report should inpractice be applied by first determining w for the characteristic strengths
136
of the steel and eonerete and then introdueing the faetor of safety bymultiplying the value of w thus ealeulated by a partial eoeffieient Yrrelating to the rotation eapaeity. In ordinary cases, Yr should be madeequal to Ye , and equal to unity when abnormal loads are studied.
137
13 OVERALL CONCLUSIONS
The au thor has earlier analysed the rotation capacity of plastic hinges
see Plem (1973a), the following expression being derived for approximate
calculation of the rotation capacity 8ua
e ~ ?'ln-3 n (1+250p )il x V
(13.1)
x is the depth of the compression zone and an a fictitious yield length,
which can generally be made the length of that section of the beam adjacent
to the plastic hinge over which the ultimate moment exceeds n% of the ultimate
moment Mu' The effect of stirrups is taken into account by means of thequantity Pv which is the geometrical reinforcement percentage of the stirrups,
calculated in a certain way.
Expression (13.1) is discussed by Cederwall, Losberg & Palm (1974) who propose
certain additional rules in order that this expression may have agreater
degree of differentiation.
In some circumstances, aSO ' i.e. the section over which the moment is greater
than O.SMu' can be selected for an' If at the same time we assume a linearmoment distribution (6 ~ O) and ignore the effect of stirrups, Equation (13.1)
can be written
8u
( 13.2)
where A~ lo/d is the slenderness of the rotation span. If we apply the
rectangular stress distribution proposed by the CEB to the compression zone
of the beam cross section, we obtain the value x/d ~ 1.25w by means of an
equilibrium expression, which, substituted into Equation (13.2), yields
the expression
8uA
( 13.3)
This relation is plotted in FIG. 13a. As will be seen from the figure, the
curve (part of a hyperbol a) has the same general shape as the curves calcu
lated in another way and presented in the previous publication.
However, Equation (13.1) is far too undifferentiated to permit closer study
of the way in which different parameters affect the rotation capacity. This
is particularly true with regard to those parameters which describe the
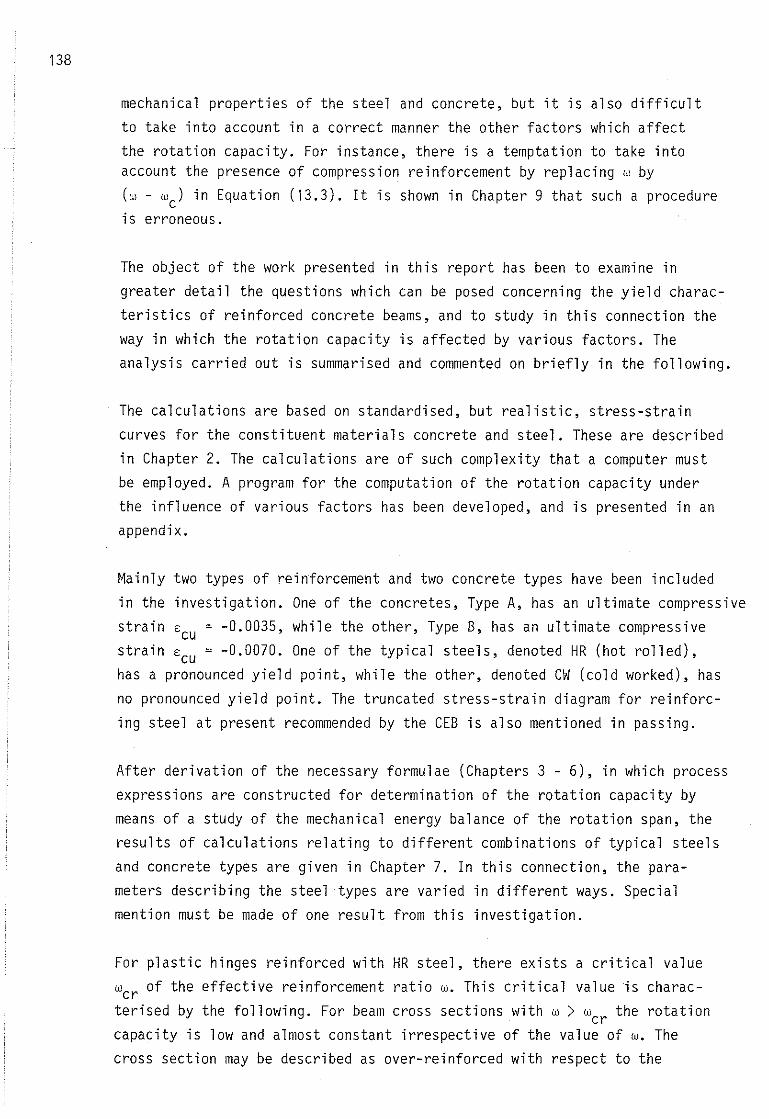
138
mechanical properties of the steel and concrete, but it is also difficultto take inta account in a correct manner the other factors which affectthe rotation capacity. For instance, there is a temptation to take intaaccount the presence of compressian reinforcement by replacing w by(w - wc) in Equation (13.3). It is shown in Chapter 9 that such a procedureis erroneous.
The object of the work presented in this report has been to examine ingreater detail the questions which can be posed concerning the yield characteristics of reinforced concrete beams, and to study in this connection theway in which the rotation capacity is affected by various factors. Theanalysis carried out is summarised and commented on briefly in the following.
The calculations are based on standardised, but realistic, stress-strain
curves for the constituent materials concrete and steel. These are describedin Chapter 2. The calculations are of such complexity that a computer mustbe employed. A program for the computation of the rotation capacity underthe influence of various factors has been developed, and is presented in anappendix.
Mainly two types of reinforcement and two concrete types have been includedin the investigation. One of the concretes, Type A, has an ultimate compressivestrain E
CU= -0.0035, while the other, Type B, has an ultimate compressive
strain ECU
= -0.0070. One of the typical steels, denoted HR (hot rolled),has a pronounced yield point, while the other, denoted CW (cold worked), hasno pronounced yield point. The truncated stress-strain diagram for reinforc
ing steel at present recommended by the CEB is also mentioned in passing.
After derivation of the necessary formulae (Chapters 3 - 6), in which processexpressions are constructed for determination of the rotation capacity bymeans of a study of the mechanical energy balance of the rotation span, theresults of calculations relating to different combinations of typical steels
and concrete types are given in Chapter 7. In this connection, the parameters describing the steel types are varied in different ways. Special
mentian must be made of one result from this investigation.
For plastic hinges reinforced with HR steel, there exists a critical valuewcr of the effective reinforcement ratio w. This critical valueis characterised by the following. For beam cross sections with w > wcr the rotationcapacity is low and almost constant irrespective of the value of w. Thecross section may be described as over-reinforced with respect to the
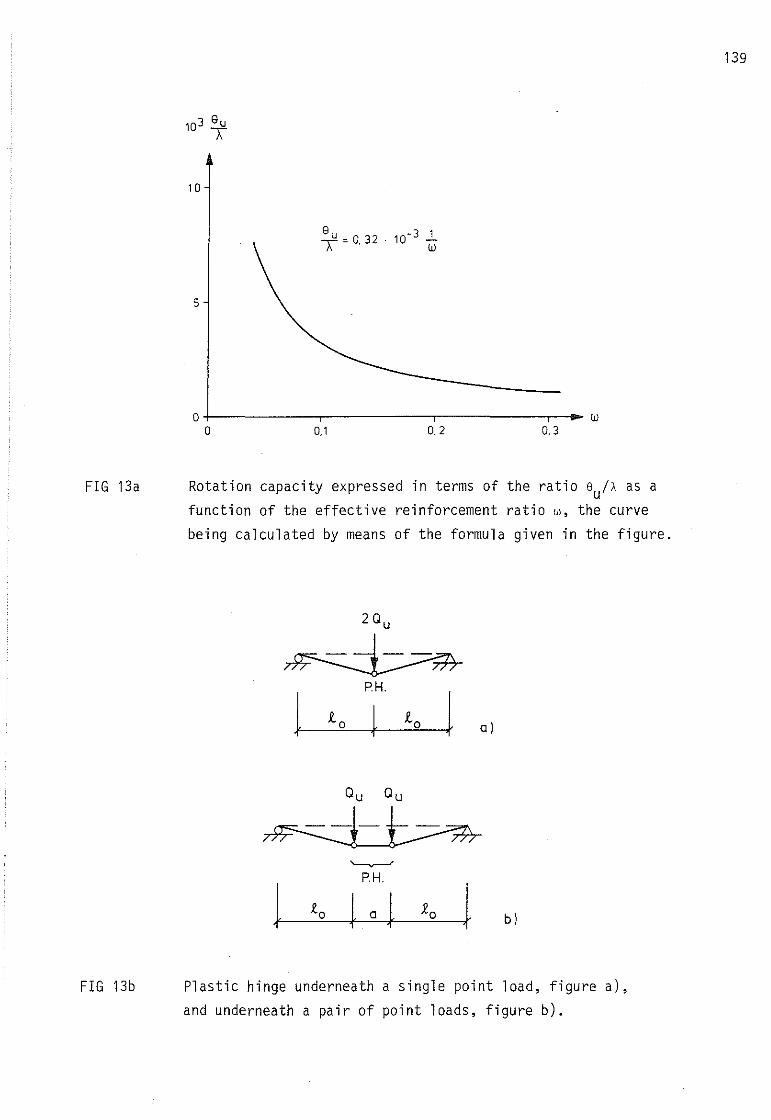
139
10
~ =O. 32 . 10-3 ~
5
0,30,20,10+-------,--------,-------,--""" W°
FIG 13a Rotation capacity expressed in terms of the ratio 8U/A as afunction of the effective reinforcement ratio w, the curve
being calculated by means of the formula given in the figure.
2 Qu
--
PH.
Jto } to al
Qu Qu
-- -
~
PH.
l .eo W .eo J bl
FIG 13b Plastic hinge underneath a single point load, figure al,and underneath a pair of point loads, figure bl.
140
rotation capacity. For beam cross sections with w < w the rotation capacityincreases rapidlyas the value of w decreases. The cross section may bedescribed as normally reinforced with respect to the rotation capacity. Thisphenomenon will be understood most easily by examination of FIG. 1.3a.The rotation capacity of a plastic hinge is represented by the hatched areaB in the figure. This area has been obtained by transformation of the area A
above the moment-curvature relation for the beam cross section by means ofthe moment diagram. For large values of w failure of the beam occurs at
small values of the curvature, with the result that area A and thus therotation capacity are small. For small values of w beam failure ensues atsuch large values of the curvature that the lower strain hardening limit ofthe steel has been passed, and the part of the moment-curvature relation whichis again increasing has been entered. In this case, the area A and thus therotation capacity will be large.
The value of wcr ' i.e. the boundary between a cross section over-reinforcedand normally reinforced with respect to the rotation capacity, is determinedfor a given concrete by the value of the lower strain hardening limit of the
steel, i.e. the end of the yield region of the steel.,This is quite analogousto the determination by the initial point of the yield region of a balanced
reinforcement expressed in terms of wb' i.e. the boundary between a beam crosssection over-reinforced and normally reinforced with respect to bending failure.It will be evident from this that a beam cross section may be under-reinforcedwith respect to bending failure (w < wb) while at the same time it is overreinforced with respect to the rotation capacity (w > wcr )' Generally, wb> w cr'and the rotation capacity is therefore at all times extremely small for a
beam cross section over-reinforced with respect to bending moment. A beamwhich is over-reinforced with respect to bending moment should therefore neverbe used when reinforced concrete structures are designed purely by the plastictheory.
In Chapters 8 - 11, a study is made of the way in which factors other than
the shape of the stress strain curves of the steel and concrete affect therotation capacity of plastic hinges.
Creep of the concrete increases rotation capacity. However, inclusion of this
effect in determining the rotation capacity is no guarantee that it will beeasier to satisfy the condition in (1. 1.7), since the rotation requirementof the plastic hinge also increases as a result of creep, as mentioned in
Section 1.2. The overall effect is dependent on the design of the structure.
141
For values of w in excess of 0.05 - 0.07. the presence of compression reinforcement increases the rotation capacity. The increase in relation to crosssections without compression reinforcement, for usual values of w, is dependent on the value of this, a higher value of w resulting in agreater increase.This is a favourable effect since the rotation capacity for the crosssection without compression reinforcement decreases as the value of w increases. In order that this effect may be utilised to the full, it is
essential that the compression reinforcement should be fixed within thecross section by means of stirrups in order to prevent buckling of the reinforcing bars.
If the effect of shear force on the rotation capacity is not taken into accountin calculating the rotation capacity, it is found for a given cross sectionthat the rotation capacity is directly proportional to the slenderness A
of the rotation span. See Equation (13.3). If the effect of shear force isallowed for in calculations, it is found that the rotation capacity increasesconsiderably and disproportionately for small values of A, i.e. for A= approx.2. This increase diminishes for increasing values of A, and vanishes for valuesof A of about 8 - 10.
The effect of shear force is explained by the fact that the inclined shearcracks which occur in the part of the beam acted upon by shear force causeyield of the tension reinforcement to take place over a larger region of therotation span. For alarger yield length, the capacity of the rotation spanto store deformation energy increases, and the rotation capacity increasesin consequence. It must be realised, however, that this favourable effect
is never fully developed in practice, since intensive yield characterisedby contraction of the cross section general ly occurs only within a limitedregion of a reinforcing bar stressed up to the yield point. This is also
taken into account in the computer program. The above fact must also beborne in mind in conjunction with determination of the rotation capacity ofa plastic hinge which develops in a beam acted upon by a constant bendingmoment over a certain distance. The rotation capacity of the plastic hingeover the distance a in FIG. 13b, b), is thus hardly greater than that oftha plastic hinge shown in a), in spite of the fact that, computationally,yield in the tension reinforcement takes place over a longer distance in
the former case than in the latter.
If the concrete in the compression zone is surrounded by stirrups, thedeformation capacity of the compressed concrete is enhanced, and this meansthat the rotation capacity also increases. The report outlines the way in
142
which this effect can be approximately calculated. This method involves a
downward correction of the value of w, which generally results in anincrease of the rotation capacity.
143
14 REFERENCES
Alemo, J, 1976, The Effects of Imposed Deformations on the Behaviour ofLoaded Concrete Structures. (Lund Institute of Technology, Division ofStructural Mechanics and Concrete Construction). Bulletin 53. Lund.
Baker, L L L, 1956, The Ultimate-Load Theory Applied to the Design ofReinforced and Prestressed Concrete Frames. (Concrete Publications Ltd).London.
Cederwall, K, Losberg, A,& Palm, G, 1974, Armerade betongbalkarsrotationskapacitet. (The Rotation Capacity of Reinforced Concrete Beams).(Nordic Concrete Association). Nordisk betong, No 4, Volume 18. Malmö.
Code modele pour les structures en beton, 1976. (Comite Euro-internationaldu Beton). Bulletin d'information no 117-F. Paris.
Corley, WG, 1966, Rotational Capacity of Reinforced Concrete Beams.(Portland Cement Association, Development Department). Bulletin 0108.Skokie.
Larsen, P K & Vigerust, G, 1966, Praktisk beregning av stivhet og nedb0yning for revnet, armert betong. (Practical Calculation of the Stiffnessand Deflection of Cracked Reinforced Concrete). (Nordic Concrete Association).Nordisk betong, No 3, Volume 10. Stockholm.
Mattock, A H, 1965, Rotational Capacity of Hinging Regions in ReinforcedConcrete Beams. (Portland Cement Association, Development Department).Bulletin 0101. Skokie.
Plem, E, 1973, Plasticeringsförmåga hos tvåsidigt inspänd betongbalk.(Nordiska betongförbundet). Nordisk betong, 2, årg. 17. Malmö.
Plem, E, 1973a, The Plastic Flow Capacity of Concrete Beams Fixed at BothEnds. (Nordic Concrete Association). Nordisk betong, No 1, Volume 17. Malmö.
Rechardt, T, 1968, Flexural Behaviour of Reinforced Concrete Beams atWorking Loads. (National Technical Research Institute). Publication 126.Helsinki.
Sargin, M& Handa, V K, 1969, A General Formulation for the Stress-StrainProperties of Concrete. (Solid Mechanics Division, University of Waterloo).
Report No 3. Ontario.

145
APPENDIX
The computer program developed for calculation of the rotation capacityof a plastic hinge in a reinforced concrete beam is presented and commentedon in this appendix. The program has been written in ALGOL 60, with notationaccording to the conventions applied in conjunction with the computersystem UNIVAC 1108.
The computational potential of the program is outlined in the introduction.The program is then described and reproduced, and finally examples of theprintout are given.
A.l Calculation alternatives
•Three alternative calculation methods are possible. All begin with a computation
of the following quantities which relate to the cross section under consideration. The non-dimensional curvature 1/p is employed as the governing parameter.The curvature is increased in discrete steps from zero to the value whichresults in material failure. The length of the increment prior to the yieldmoment is ~(1/p) = 0.5 • 10-3, and after the yield moment ~(1/p) = 2.0 • 10-3.
The calculated quantities, all of which are given in non-dimensional form,are as follows:
~ bending moment~depth of compression zone
maximum compressive strain in the concretecompressive strain in compression reinforcement, if anystrain in tension reinforcement
contribution of compressed concrete to ~
contribution of compression zone to ~
total deformation energy stored in the cross section per unit length
of the beam
The values obtained in this introductory section are printed out in tabularform by means of the procedure SKRIV(K).
Computation can then proceed in two ways.
146
Alternative 1 relates to calculation without consideration of the effectof shear force on the rotation capacity. This yields the ratio 8u/A
according to Equation (6.3.2) for the required moment variations expressedin terms of the coefficient s. The results of calculations according to
this alternative are printed out by means of the procedure SKRIW 1.
Alternative 2 relates to calculation with regard to the effect of shearforce according to the analytical model described in Chapter 10. In thisalternative the value of S is at all times zero, i.e. variation of momentover the length of the rotation span is assumed to be linear. The calcula
tion yields the rotation capacity 8u corresponding to read-in values ofthe slenderness A of the rotation span. Results according to this alternative are printed out by means of the procedure SKRIW 2.
Alternative 3 is a combination of Alternatives 1 and 2. It is used when itis desired to calculate the rotation capacity in the same run both withand without consideration of the effect of shear force. When this alternativeis selected, values of both B and A must be read.
A.2 Procedure declarations associated with the main program
Before the main program there are a number of procedure declarations which
are commented on in the following. The numbers in brackets refer to thestatement number in the program reproduced in Section A.4.
INDATA (12 - 26)
This procedure comprises reading of data cards. The following input datacards may be used.
TYP card. Contains an integer which specifies the desired calculationalternative. This integer may be 1, 2, 3 or a negative number. A negative
number indicates the end of the input list.
STEEL card. Contains a description of the stress-strain curve of thereinforcing steel. The following data are punched consecutively.Steel type, 1 for HR steel, 2 for CW steel.Non-dimensional modulus of elasticity es of the steel.
The ratio n = fst/fst 'The lower strain hardening limit E1. For CW steel E1 = O is put.Limit strain E
O'
Ultimate strain ESU
'
CONCRETE card. Contains a description of the stress-strain curve of theeonerete. The following data are punched consecutively.
Non-dimensional modulus of elasticity ec of the eonerete.The coefficient KZ in Equation (Z.1.2)
Limit strain EO
' with a negative sign.Ultimate strain E
CU' with a negative sign.
Creep facto r ~. If creep is not taken into account, ~ = O is put.
FC card. This card contains the ratio of the strength of the compression
reinforcement to that of the tension reinforcement, i.e. u = fsc/fst ' andthe non-dimensional distance y = e/d of the compression reinforcement fromthe extreme fibre in compression. This card must be included even whenthere is no compression reinforcement, in which case 1.0 0.1 is punched.
OMEGA card. This card must begin with an integer which specifies the numberof the values of w which follow. The values of w for which the calculationis to be performed are then given consecutively. If required, the values ofw may extend over several cards.
OMEGAC card. This card must begin with an integer which specifies the number
of the values of wc/w which follow. The values of wc/w for which thecalculation is to be performed are then punched consecutively. If required,
these may extent over several cards. When there is no compression reinforcement, 1 0.0 is punched on this card.
BETA card. This card must begin with an integer which specifies the numberof the values of S which follow. The values of S for which the calculationis to be performed are then punched consecutively. The following values of Smay occur: - 0.06, O and 0.25. This card is to be omitted in Alternative 2.
LAMBDA card. This card must begin with an integer which specifies the numberof the values A which follow. The values of A for which the calculation
is to be performed are then given consecutively. This card is to be omittedin Alternative 1.
147
148
N card. This card contains an integer which specifies the number of strips
in the fictitious compression zone. The length of the rotation span isdivided into the same number of parts.
The cards must be read in the order specified.
A run may comprise a series of computations where each computation isdescribed by a complete series of input data cards as above. The last datacard in a run must be a TYP card containing a negative integer.
RUBRIC (28 - 38)
Call of this procedure causes shifting of the paper in the line printerto a new side and the printout of a heading which includes input data.The extent of the heading is shown in the example in Section A.5.
SKRIV(K) (40 - 46)
This procedure causes printout of one row in the table of results referredto in Section A.1.
SKRIW 1 (48 - 51)
Call of this procedure causes printout of a read value of S and the value
of BulA calculated for this.
SKRIW 2 (53 - 56)
Call of this procedure causes printout of a read value of A and the valueof Buv calculated for this.
TRYCK (58 - 71)
Call of this procedure causes printout of the appropriate distribution ofcompressive stresses in the compression zone of the beam. Ordinarily, thisprocedure is not called in the main program, but the program thus incorpo
rates a provision for the study of the stress distribution which can be
made use of if required.
CONCRETE (E,DE,SI,EM,FI,EO,CR,I) (73 - 97)
149
This proeedure gives the non-dimensional eompressive stress 0e/fee in the
eonerete as a funetion of the strain "c in strip No i in the eompressionzone. During applieation of load the stress is eomputed from Equation (2.1.2),
and during removal of load from the expression for line AB in FIG 2.la.This proeedure requires two globally deelared quantities, namely array EA,
EB (1:N). Initially, these are zeroed, but when a strip is relieved of load,data whieh determines the position of the unloading line in the stress-straindiagram of the eonerete is inserted into the eorresponding positions in EA
and EB. This proeedure yields the value of 0e/fee with a negative sign.
The parameters listed are as follows:
E the appropriate value "ei of the eonerete strain in strip No iDE the inerement in "ei during a ealeulation step. Whether the eonerete
is being loaded or unloaded is determined by the sign
SI the value of 0e/fee eomputed by the proeedureEM the instantaneous modulus of elastieity of eonerete in a non-
dimensional formFl the eoeffieient K2 in Equation (2.1.2)
ED limit strain "o of the eonereteCR the ereep faetor ~
I the number of the strip eoneerned.
STEEL (Z,E,DE,SI,EM,Y,E1,EO) (99 - 146)
This proeedure gives the non-dimensional stress 0s/fst in the reinforeementas a funetion of the strain "s in the tension reinforeement, or the stress
0se/fse as a funetion of the strain "se in the eompression reinforeement.During applieation of load the stress is eomputed from the stress-straindiagram applieable to the steel type in question, see Seetion 2.2, and duringremoval of load from the expression for an unloading line, in prineiple inconformity with FIG 2.2a. The proeedure requires two globally deelaredquantities, namely real TA,TB. Initially, these are zeroed, but when the re
is removal of load they are assigned values whieh determine the position ofthe unloading line in the stress-strain diagram of the steel. This proeedure
yields the non-dimensional stress with a positive sign. The main program musttherefore perform a eorreetion of sign when the proeedure is applied toeompression reinforeement.
150
The parameters listed are as follows:
Z indication of steel type, 1 for HR steel, 2 for CW steelE the appropriate value of the steel strain E
SDE the increment in E
Sduring the calculation step in question. Whether
the steel is being loaded or unloaded is determined by the sign
SI the value of 0s/fst or 0sc/fsc computed by the procedureEM the non-dimensional modulus of elasticity es of the steel
y the coefficient n ; fstu/fstEl the lower strain hardening limit El of the steel (; O for CW steel)ED the limit strain E
Oof the steel
INTERPOL (A,E,X,AE) (148 - 160)
This procedure is used for linear interpolation in the tables computedby the program. Application will be evident from the following parameterlist.
A the name of the column in the table, declared as an array, in whichinterpolation is to be effected
E the name of the argument column declared as an arrayX the argument value in questionAE the highest row number in columns A and E. It is stipulated that
numbering of rows begins with 1.
This procedure is a real procedure. The procedure name INTERPOL thereforeassumes the computed value when called.
A.3 The main program
The main program begins on line 162 by reading the actual data. The programstructure is characterised by two loops, the outer one of which relates tosuccessive values of wclw and the inner one to successive values of w.
Inside these loops the program can be divided into a number of sections.The first of these, which extends to statement 221, determines by iterationthe internal equilibrium according to Equation (3.3.1) for each new increasein the curvature lip. This section thus yields at the same time the distri
bution of strain over the depth of the cross section, and therefore thedepth c of the compression zone also.
151
The iteration proceeds by variation of the strain Ss in the tension reinforcement until Equation (3.3.1) has been satisfied with a certain tolerance. Inorder to save computatian time, this tolerance has been made variable asfollows. For a start, it is 0.2% of the force in the tension reinforcement.If equilibrium is not achieved within five iterations, the tolerance isincreased by another 0.2%. This procedure is repeated, but the maximum toleranceis 1%. Control printouts have shown that the tolerance is normally 0.2 - 0.4%.
A subsequent sectian of the program, statement 222 to statement 238, calculates
the non-dimensional bending.moment ~ according to Equation (4.10) whichcorresponds to the equilibrium postian found. In conjunction which this acheck is made to see if the ultimate moment ~u has been reached, the value of
~u being determined according to one of the definitions given in Chapter 4.If the increase in moment in any one computatian step is less than 1/10 ofthe increase in moment in the first computatian step, then the yield moment
~y is considered to have been reached. The step length of the governingparameter ~(1/p) is then quadrupled.
The program sectian which extends from statement 239 to statement 267determines, by means of Equation (5.5), the increase in deformation energy Wper unit length of the beam which occurred during the calculation step. Thecontributians of the eonerete, compressian reinforcement and tension reinforcement are calculated separately. The calculated energy is summatedaccording to Equation (5.9). This program sectian is concluded by printout
of the tabulated values listed in Sectian A.1.
The next program sectian extends from statement 268 to statement 294. A check
is now made to see if material failure has occurred during the computational
step, i.e. whether Is 1>ls or whether s >s . If this is not the case,c - cu s- suthe curvature is increased by yet another increment and the above calculations
are repeated. If material failure is found the n either se or Ss is a littletoo large. The quantities listed in Section A.1, which were determined duringthe last computational step, are therefore adjusted by interpolation so that
they just correspond to scu or to ssu' depending on whether material failureoccurs in the concrete or in the steel. After this correction, the new valuesrelating to the last computational step are again printed out. This correctionis made only when the ultimate moment is determined by material failure.
152
The next program section, statement 298 to statement 316, is employed forcalculation alternatives 1 and 3. Tt calculates the rotation caoacity without consideration of the effect of shear force for the desired moment distributions described by the coefficient S. See FTG 6.1b. The calculation iscarried out using Equation (6.3.2). The appropriate values of S and thecalculated values of the ratio 8 lA are printed out.
u
The last program section, statement 317 to statement 340, relates to calculation alternatives 2 and 3. Tt calculates the rotation capacity with theeffect of shear force taken into consideration by means of Equation (10.1.9)for desired values of A for the non-dimensional length of the rotation span.The appropriate values of A and the calculated values of the rotationcapacity 8uv are printed out.
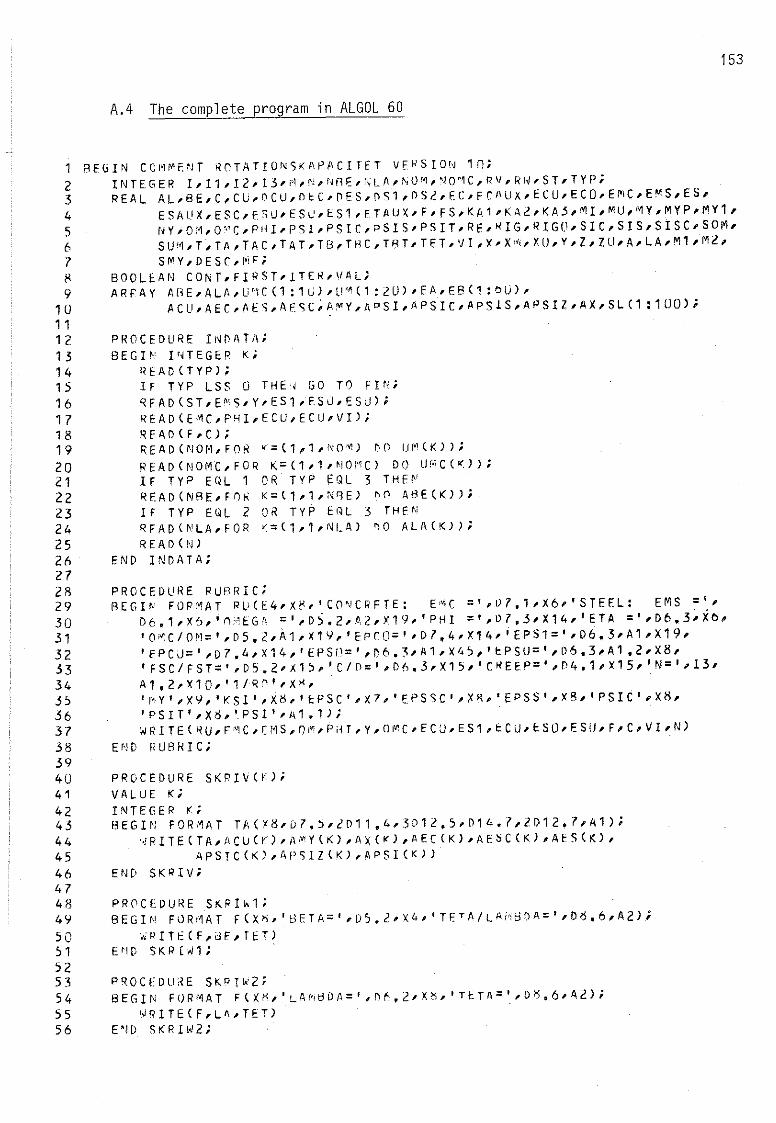
153
A.4 The complete program in ALGOL 60
1 REGIN CCMMENT ROTATIONSKAPACITET VERSION ln;2 INTEGER I,I1,I2,r3'iq,N,NAE,hlA,~OM,NO~C,PV,R\~'ST,TYP;
3 REAL AL,BE,C,CU,OCU,OcC'OES,~Sl,OS2,EC,FCI\UX,ECU,ECO,EMC,EMS,ES,
4 ESAliX,ESC,ESU,ESU,cSl,FTAUX,F,FS,KA1,KA2,KA5,MI,MU,MY,MYP,MY1,5 NY,OM,OMC,PIII,PSI,PSIC,PSIS,PSIT,RE,NIG,RIGn,SIC,SIS,SISC,SOM,6 SUM,T,TA,TAC,TAT,T8,THC,TBT,TET,VI,X,I~,XU,Y,Z,ZU'A,LA,Ml,Ml,
7 SMY,DESC,MF;H BOOLEAN CONf,FIRST,lTER,VAl;9 ARRAY AB E, ALA, U '/1 CC1 : 1u) dl'~ C1 : 2 U) , EA, EB C1 : " U) ,
10 ACU,AEC,AES,AESC;AMy,APSI,APSIC,APSlS,APSIZ,AI,SlCl:10O);1 112 PROCEDURE INDATn;13 BEGIN INTEGER K;14 READCTYPJ;15 IF TYP LSS O THE~ GO TO FIN;16 READCST,E~S,Y,ES1,ESJ,ESU);
17 READCEMC,PHI,ECU,ECU,VI);18 READCF,C);19 READCNOM,FOR K=C1,1,NO~) ~O UMCK));20 READCNOMC,FOR K=Cl,I,NOMC) DO UMCCK»;21 lE TYP EQL 1 OR TYP EQl 3 THEN22 READCNBE,FOR K=ll,1,NQE) DO A8ECK»);23 IF TYP EQL 2 OR TYP ERl 3 THEN24 RFADlNLA,FOR <=ll,I,NLA) DO AlACKl);25 READOl!26 END INDATA;272R PROCEDURE RURRIC;29 BEGIN FORMAT RUCE4,XK,'CO~CRFfE: E~C =',P7.1,X6,'STEEL: EMS =',30 D6.1,X6,'n~EGA =',DS.2,A2,X19,'PHI =',D7.3,XI4,'ETA =',D6.3~io,31 'OMC!OM=',OS.2,Al,X19,'EPrO=',D7.4,XI4,'EPS1=',D6.3,Al,119,32 ' f PCU= , , D7 .4, Xl 4 , , EPS1'= , , ~ 6 • 3, A1 , XI, 5 , , t:. PSU= , , 116 • 3,A 1 • 2 , 18,53 'FSC!FST=',D5.2'X1;,'C!1l=',D6.5,11;,'C~EEP=',D4.1,X1S,'N=',13,
34 Al.2,Xl0,'lfR0',XK,35 'MY',X9,'KSI',X~"EPSC"X7"EPSSC',XK"EPSS"X8"PSIC',X8,
36 'PSIT',II3,'.PSI',Al.1l;3 l wRI TE l ~ U, F '1 C, U'I S , O"1 , f' il I , Y, () " C, ECU, ES 1 , lo CU, ESO, E SII, F, C, VI , N)
38 END RUBRIC;394U PROCEDURE SKRIVCK);41 VALUE K;42 INTEGER K;43 BEGIN FORMAT TACXS,D7.;,iDll.4,3D12.;,D14.7,2D12.7,A1);44 ~PITE(TA,Acucr),AMYlK),AxCK),AEC(K),AEtiClK),AE5CK),
45 APSICCK),APSIZlK),APSICK)46 END SKRIV;4748 PR0CEDU~E SKPI~l;
49 8EGIN FORMAT FCXK,'8ETA=',D5.2,X4"TETA/LA~8DA=',D5.6,A2);
50 "PITECF,dE,TET)5 l E 'I D SKR [ w1 ;5253 PROCEDURE SKRl~2;
54 8EGIN Fl)RMAT F(XX"LAMBDA=',nf,2,xx,ITETA=',O~.6,A2);
55 ~RITECF,lA,TET)
56 E~D SKRIWZ;
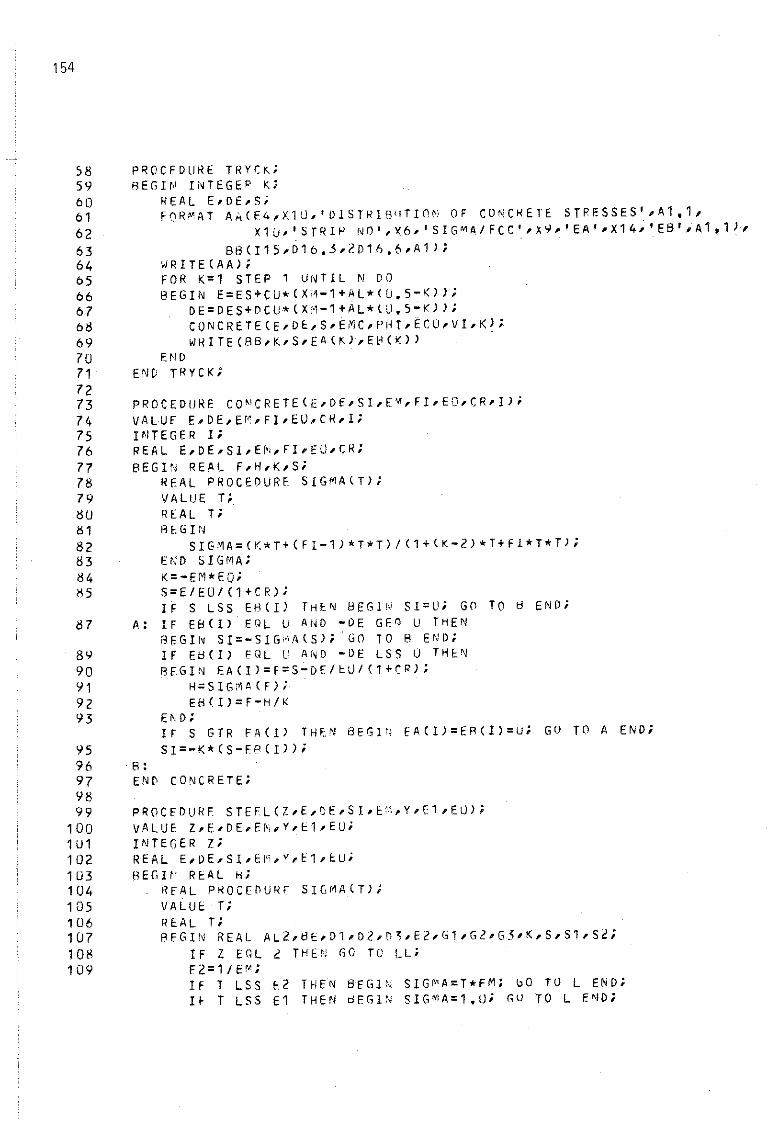
154
58 PROCFDURE TRYCK;59 REGIN INTEGEP K;60 REAL E,DE,S;61 FORI" AT Ail ( E4, X1 U, , DI STRl B'! TI O~i OF CONC~ ETE STp ESSES ' , Al, 1 ,62 x10,'srRIP NO',X6,'SIGMA/FCC',XY,'EA',X14,'EB',Al,l J ,63 BB<I1 5,016 ,5,2D1I':> ,6,Al);64 ,IRITE(AAJib5 FOR K=l STEP 1 UNTIL N DO66 BEGIN E=ES+CU*(Xi1-1+AL*(U,5-K»;67 OE=DES+DCU*(XM-1+AL*(U,S-KJ);66 CONCRETE(E,DE,S,EMC,PHT,EcU,VI,K);69 WNIrE(8B,K,S'EA(KJ,E~(K»
70 UJD71 END TRYCK;7273 PROCEDUR E CO~CRETE(E,DE,SI,Ey,FI,EO,CR'I);
74 VALUE E,DE,E~,FI,EU,CR,I;
75 INTEGER Ii76 REAL E,DE,SI,EM,FI,EO,CR;77 BEGIN REAL F,H,K,S;78 REAL PROCEDURE SIGMA(T);79 VALUE T;60 REAL T;81 AE.GIN82 SIGMA=(K*T+(Fl-1J*T*TJ/(1+(K-Z)*T+FI*T*T);83 END SIGMA;84 K=-EM*EO;~5 S=E/EO/(1+CR);
IF S LSS ES(l) THEN BEGIN SI=U; GO TO ~ END;67 A: IF EB(IJ EQL U AND -DE GEQ U THEN
AEGIN SI=-SIG~A(S);GO TO B END;89 IF E~(IJ EQL C AND -DE LSS U THE~
90 REGIN EA(IJ=F=S-DE/oU/(l+C R);91 H=SIGMA(F);92 EH(I)=F-H/K93 END;
Ir S GTR FA(IJ THEN ~EGJ~ EA(I)=ER(I)=u; GU TO A END;95 SI=-K*(S-EP(IJ);96 . B:97 EN~ CONCRETE;9899 PROCeDURE STEFL(l,E,OE,SI,E~,Y,f:1,EUJ;
100 vALUE l,E,DE,E~,Y,El,EU;
1 U1 pJTEGER Z;102 REAL E,DE,SI,EM,·,E1,EU;103 REGIN REAL H;104 ReAL PROCEnURE SIGMA(T);105 VALUE T;106 REAL T;107 BEGIN REAL AL2,~E,D1,D2,D',E2,Gl,G2'G5,K,S,S1,S2;
108 IF l EaL 2 THEN GO TO LL;109 F2=1/EM;
IF T LSS E2 THeN BEGIN SIGMA=T*EM; bO TU L END;I~ T LSS E1 THEN ~EGIN SIGMA=1,U; GU TO L END;
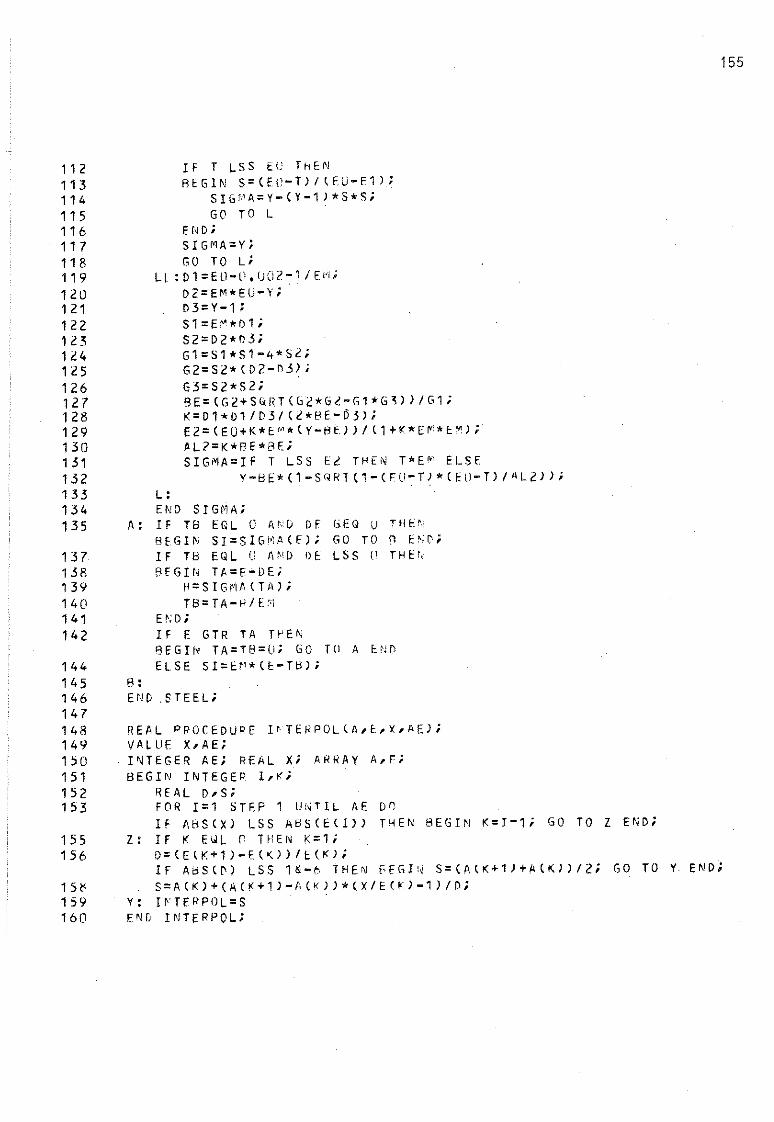
155
112 IF T LSS EU THEN113 REGIN S=CEII-T)/IFU-E1);114 SIG<'A=Y-(Y-l)*S*S;115 GOTOL116 ENO;117 SIGMA=Y;118 GO TO Li119 Ll :D1=EO-II.UO?~1/Ei'I;
120 D2=EMOEU-Y;121 03=Y-1;122 S1=EM*o1;123 S2=02*D3;124 G1=Sl*S1-4*S2;125 G2=S2*(D2-D3);126 G3=S2*S2;127 BE=(G2+SQRT(G2*G2-Gl*G~»/Gl;
128 K=01*Dl/D3/(2*8E-D5);129 E2=(EO+K*E~O(Y-BE»/11+K*EMOE~);
130 AL2=KoPE*BE;131 SIGMA=IF T LSS E2 THEN T*E~ ELSE132 y- El E* ( 1 - SIl R T( 1- CFD- T) * ( Eil - Tl / • L2 ) ) ;133 L:134 END SIGMA;135 A: IF TB EQL O AND DE GEQ u THE<
BEGIN Sr=SIGMA(F); GO TO 8 END;137 IF TEl EQL U AND DE LSS U THEI,138 8EGIN TA=E-DE;139 H=SIGMA(TA);140 TB=TA-H/E~
141 Ef:O;142 IF E GTR TA T~EN
BEGIN TA=TS=U; GO TU A END144 ELSE SI=EM*CE-TEl);145 R"146 END .STEEL;147148 REAL PROCEDUPE I<TERPOLIA,E,X,AE);149 VALUE X,AE;150 I~TEGER AE; REAL X; ARRAY A,F;151 BEGIN INTEGEP I,K;152 REAL D,S;153 FOR 1=1 STEP 1 UNTIL AE 00
IF A8S(X) LSS ASS(E(I» THEN ElEGIN K=I-l; GO TO Z ENO;155 Z: IF K EWL n THEN K=l;156 D=(EIK+l)-E(K»/ECK);
IF ABS(D) LSS l~-b THEN fEGIN S=(AIK+ll+A(K)/Z; GO TO Y END;lS~ S=A(K)+CA(r+ll-A(K)IO(X/E(KI-l)/O;159 Y: !~TERPOL=S
160 ENu INTERPOL;
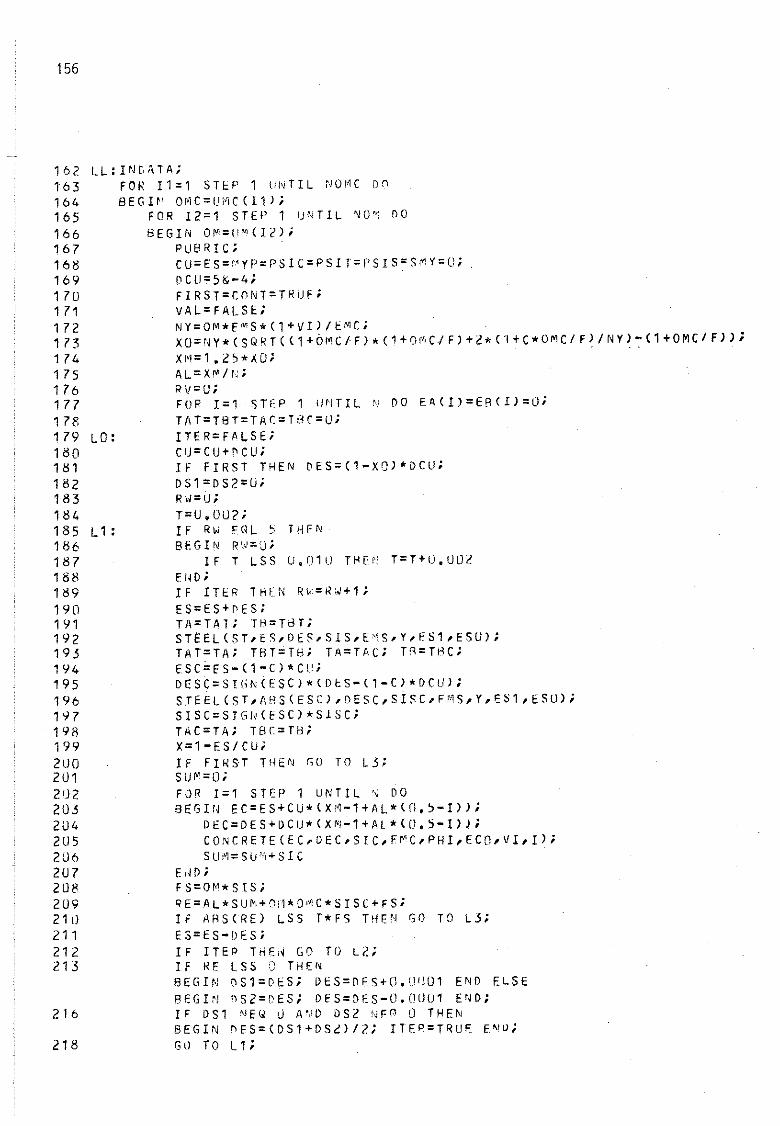
156
1 62 LL : I ~n H A;163 FOR 11=1 SHoP 1 UIHIL NOIH DD
164 BEGI~ OMC=UMCCI11;165 FOR 12=1 STEP 1 UNTIL ~O~ DO
166 8EGIN OM=u·CIZ);167 RUBRIC;168 CU=ES=~YP=PSIC=PSIT=PSIS=SMV=O;
169 DCU=5&-4;170 FIRST=CDNT=TRUF;171 VAL=FALSE;172 NY=OM*E~S*C1+VI)/EMC;
173 XO=NY*CSQRT«1+ÖMC/F)*C1+DMCjF)+2*Cl+C*OMC/F)/NY)~(1+0MC/F»;
1 74 XI'I=1. 25*XU;175 AL=XM/N;176 RV=U;177 FOR 1=1 STEP 1 u'nIL ,.) DO EA(1)=ER(IJ=O;178 TAT=TBT=TAC=TBC=U;179 LO: ITER=FALSE;180 cu=cu+ncu;181 IF FIRST THEN DES=C1-xOJ*ocu;182 OS1=oS2=U;183 RW=U;184 T=U,002;185 Ll: IF RW FGL , THEN186 BEGIN RW=U;187 IF T LSS U.01U THE~ T=T+U.UOZ18B E"D;189 IF ITER THEN Rw=RW+1;190 ES=Es+nES;191 TA=TAU TI:l= TtH;192 STEEL(ST,ES,DES,SIS,E0S,V,FS1,ESU);193 TAT=TA; T8T=T8; TA=TI,c; TR=TIJC;194 ESC=ES-C1-C)*CU;195 DESC=STGNCESCJ*(DES-(1-CJ*DCUJ;196 SJEELCST,APS(ESCJ,DESC,SISC,FMS,V,Eti1,ESU);197 SISC=SJG~CESC)*S15C;
191\ TAC=TA; T8c=T8;199 X=1-ES/CU;2UO IF FIRST THEN GO TO L3;201 SUM=O;2U2 FOR 1=1 STEP 1 UNTIL , DO203 BEGI~ EC=ES+CU*(XM-1+AL*(U,,-I)J;2U4 DEC=DES.DCU*(XM~1+Al*(O.5-I»);
2U5 CONCRETECEC,DEC,SJC,FMC,PHI,ECO,VI,I);206 SlI,~=SlI'YI"'SIC
2U7 E,lD;20B FS=OM*SIS;2U9 RE=AL*SUM+0M*O~c*5rSc.FS;
210 IF ARSCRE) LSS T*FS THEN GO TO L3;211 ES=ES-DES;212 IF ITER THE,l GO TO L2;213 IF RE ess U THEN
REGIN ~S1=DES; OES=DES+O.UUU1 END ELSEREGIN nS2=DES; DES=DES-O.OIJU1 END;
216 IF 051 NEW U AND DS2 NEO O THENBEGIN nFS=(DS1+DS~)/2; ITER=TRUF END;
218 GO TO L1;
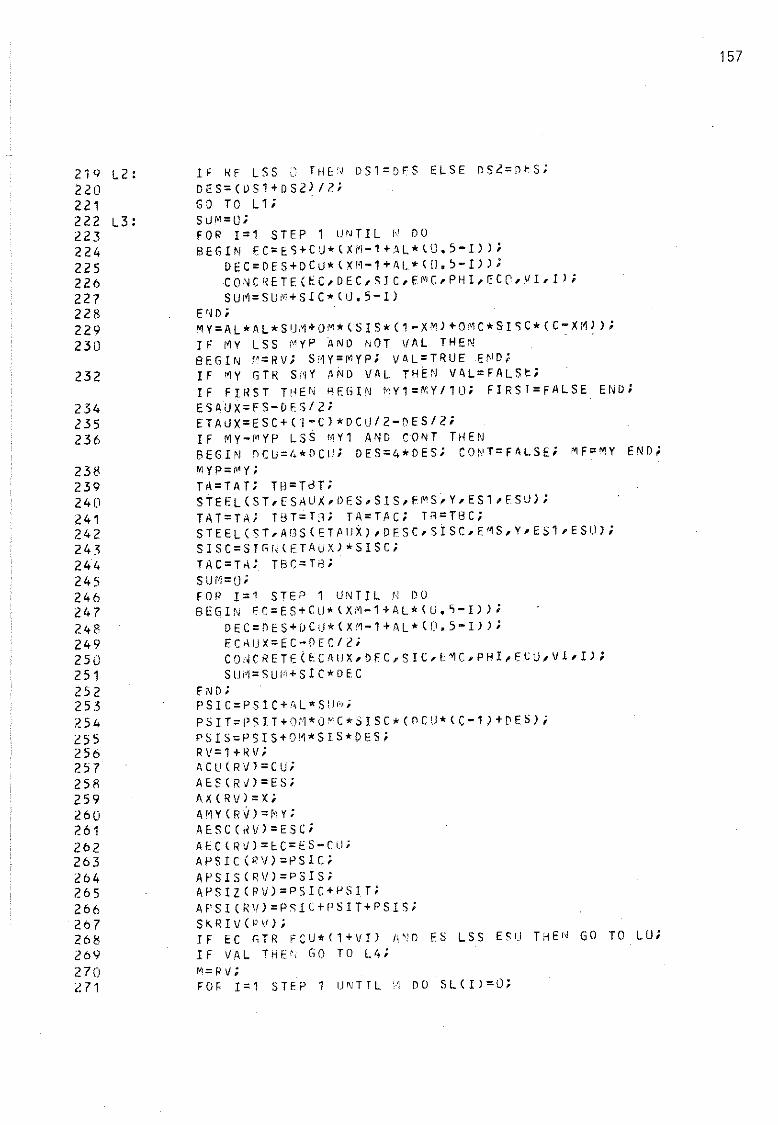
219 L2 :~20
221222 L3:223224225226227228229230
232
234235236
238239240241242243244245246247248249250251252253254255256257258259260261262263264265266267268269270271
IF RE LSS C TH~N DS1=DFS ELS E nsZ=ntS;DES=(US1+DSZ>lZ;GO TO L1;SLJM=O;FOR 1=1 STEP 1 LJNTIL N DOBEGIN EC=ES+CU*CXM-1+AL*CC.5-I»;
DEC=OES+OCLJ*(XM-1+AL*CO.5-I»;CONCRETE(EC,DEC,SIC,EMC,PHI,ECC,VI,I);SUM=SUM+SIC*(U.5-I)
E r4 D;MY=AL*AL*SUM+OM*<SIS*(1-XM)+OMC*SISC*(C-XM»;IF MY LSS MYP ÄNO NOT VAL THEN8EGIN P=RV; SMY=MYP; VIL=TRUEENO;IF MY GTR SMY Aho VAL TH~N VAL=FALSt;IF FINST TIIEN ~EGIN ~Y1=~Y/1U; FIRsr=FALSE END;ESAUX=ES-DFS/Z;ETAUX=ESC+(1-C)*OCU/2-DES/Z;IF MY-MYP LS~ ~Y1 AND CONT THENBEGIN nCU=I.*DCiI; OES=4*OES; CO~'T=FALSEi MF=MY END;MYP='-Y;TA=TA T; TfJ=TtH;STEEL(ST,ESAUX,DES,SIS,EMS,Y,ES1,ESU);TAT=TA; H;r=TJ; TA=TAC; TB=T8C;STEEL(ST,AflS<ETAUX),DFSC,SISC,EMS,Y,ES1,ESU);SISC=SIGN(ETAUX)*SISC;TilC=TA: TBC=T8;Slm=o;FOR 1=1 STEP 1 UNTIL N DOBEGIN EC=ES+CU*lXM-1+AL*CU.5-1»;
DEC=nES+UCU*(XM-1+AL*(O.5-I));EC;\UX=EC-DEClZ;CO,< CRETE ( ECAII X, DEC, S I C, E", C, PHI , E' i; U, V! , I ) ;S lJi1= S Uf"+ S I C*D EC
END;PS I C=PS I c+r,L *S',,",';PSIT=rSIT+OM*O~C*Slsc.(nCU*<C-1)+DES);
PSIS=PSIS+OM*SIS*DES;RV=1+RV;AClI(RV)=CU;AES(RIi)=ES;AX(RV)=X;AMY(RV)=r"y;AESC (/lV)=ESC;AEC<RV)=EC=ES-CU;APSIC (RV) =psrc;APSIS(R\I)=PSIS;APSIZ(R\I)=PSIC+PSrT;AFSI(RV)=PSIC+PSIT+PSIS;SKRIV(pl);IF EC GTR FCU*ll+vI) A~D ES LSS ESU THE~ GO TO LO;IF VAL THE~ GO TO L4;M= RV;FOR 1=1 STEP 1 UNTIL '4 DO SL(I)=O;
157
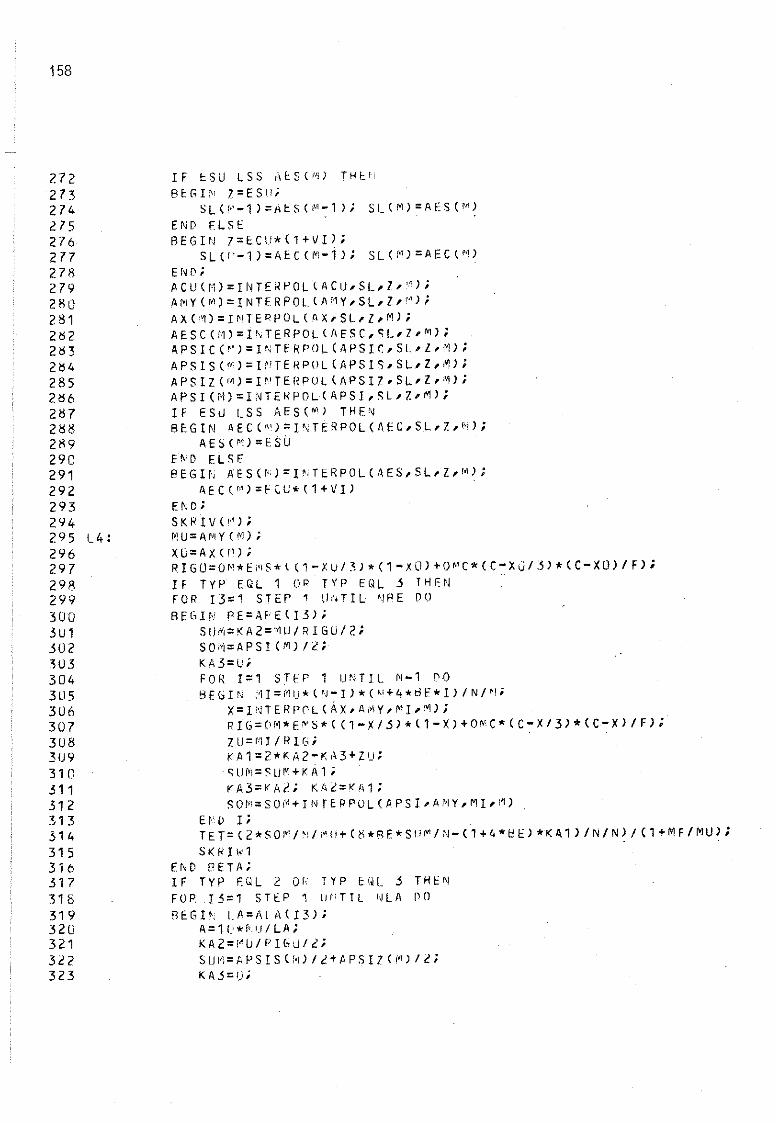
158
2722732742152762772782792802812~2
2~3
2~4
2852~6
2~7
2~8
289290291292293294295 1_4:2962972982993003U13023U330430530630730831)9
310311312313314315316317318319320321322323
IF tSU LSS AtSlM) THtfJBEGHi Z=EStt;
SLl~-1)=MtSIM-T); SLIM)=AESlM)END FLSEBEGIN ?=ECU*l'+VI);
SLlr'-')=AtClt~-i); SLlfl)=AECI''i)EI, D;ACUlM)=INTEAPOL(ACU,SL,l,~);
AMYlM)=INTERPOLIAMY,SL,l,M);AXlM)=IMTERPOLIAX,SL,Z,M);AESClM)=I~TERPOLIAE5C,SL,?,M);
APSIC(P)=INTERPOL(APSIC,SL,Z,M);APSISl~)=INrERPOLlAPSIS,SL,l,M);
APSIIlM)=INTERPOLlAPSIZ,SL,Z,M);APSI(M)=INTERPOLIAPSI,SL,Z,M);IF ESU LSS AES(M) THE NBEGIN AEC(")=INTERPOL(AEC,St,Z,M);
AESli")=ESUEND ELSFBEGIN AES(~)=IMTERPOL(AES,SL,l,M);
AECIM)=ECU*11+VI)O.D;SKRIV(i'');~;U=AI'tY U~);
XG=AX (r1);
RIGU=OM*EMS*I('-XU/3)*11-XO)+OMC*IC-XO/3)*IC-XU)/F);IF TYP EQL T 0 R TYP EQL 3 THENFOR 13=1 STEP' llNTIL ~PE DOBEGIN PE=APEII3);
SIi"I=KA2='~UIR 1 GUl 2;SO"i=APSI (M) re;K.A3=U;FOR T=1 STEP 1 UNTIL N-T DOBEGIN ~I=MU*IN-I)*IM+4*dE*I)/N/~;
X=INTERP0LIAX,AMy,MI,M);RIG=0M*E~5*ll'-X/3)*l1-X)+OMC*lC-X/3)*IC-X)/F);
zu=rn/Rre;;KA1=2*KA2-KA3+zu;·SU~'=SU~I+KA1;rA3=rAZ; KAZ=KA1;SOM=SOM+INrERPOLIAPSI,AMY,MI,M)
EtiD r;TET= 12 * SM' I '" i~ Ii + l~. Hl E* SIi MI !II - l T+4 * to El * KA1 ) / N I N) I ( 1 H1F / MU) ;
SKRI",U.D BETf\;IF TYP EQL 2 o~ TYP EQL 3 THENFOR 13=, STEP 1 1i"TTL NLA roBEGI fl I. A=1\ l A( I 3) ;
A=1U*t'u/LA;KA 2=i"LJ I P I GLiI Z;SUM=APSISIM)/Z+APSIZIM)/Z;KA.3=I);
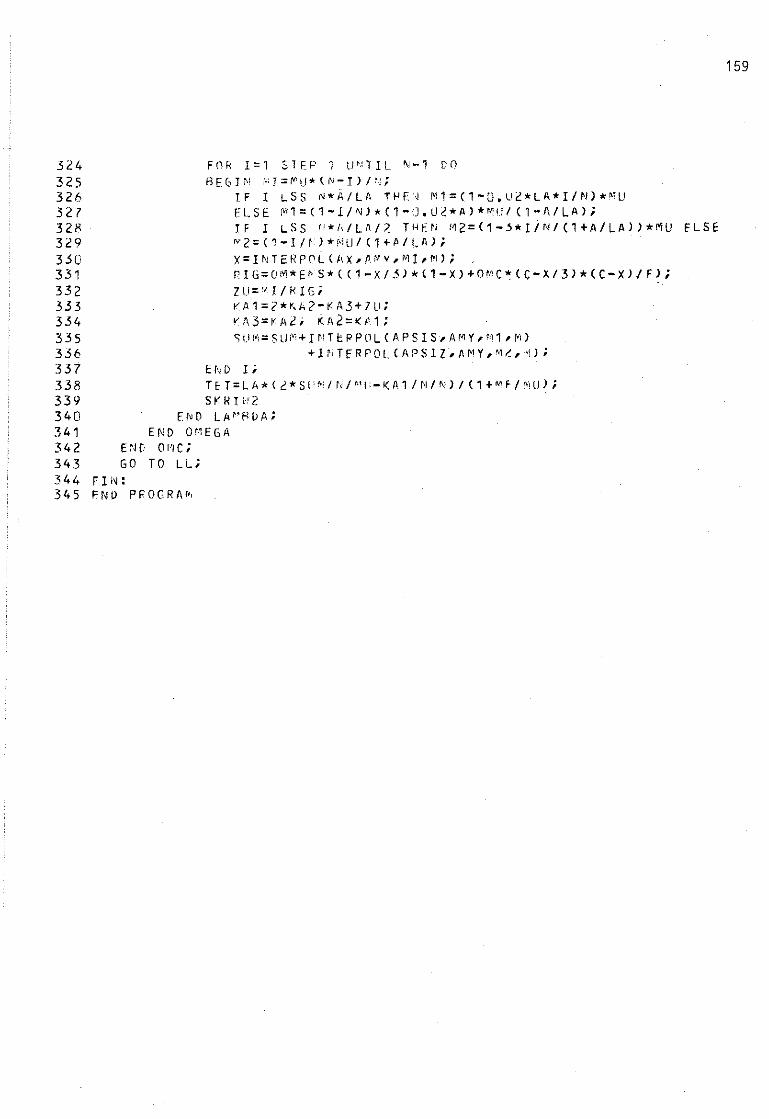
32432532632732~
329350331332333334335356337338339340341342343344345
FOR 1=1 SIPP 1 U~lIL N-l DOBEGJN 0J=~U*IN-I)/~;
JF I LSS N*Ä/LA T~E~ Ml=(1-O.u2*LA*I/N)*MUELSE ~l=(l-IIN)*(l-U.U~*A)*MU/(l-A/LA);
If I LSS 1"*{,/LA/2 THEN '~2=(1-j*IiN/(1+A/LA)*"IU"2 =( 1- lit) * r,j UI ( 1 H II. A) ;X=INTERP0l(,\x,p~v,MI,M);
rIG=OM*E~S*(11-X/3)*11-X)+OMC*(C-X/3)*(C-X)/F);
zU='q/RIGiKA1=Z*KA2-KA3+zu;vA3=KAt; KA2=KA1;SUM=SU~+Ir'lEPPOL(APSIS~AMy,Ml,M)
+INTERPOL(APSIl,AMy,.t,~);
EhD IiTET=I. A* l 2* SI'" IIU "I' - KAl/N I ") I ( 1PH / '" U) ;SKRIH2
END LA"!"D;,;END Or1EGA
E~H' or1C;GO TO LL;
Fl i~:
ENO PPOGRA~,
EI.SE
159
160
A.5 Examples of printouts
Two examples of the printout of the results are shown. The first relatesto ealeulation alternative 1. The eonditions are as follows.
Conerete Type A, see Seetion 2.1.Tension reinforeement of HR steel, see Seetion 2.2, with the effeetivereinforeement ration w = 0.07.No eompression reinforeement.Creep of the eonerete is not taken into consideration.
The printout of the results is reprodueed in FIG A.5a. The proeedure RUBRIC
results in printout ot the input values and table heading. The proeedureSKRIV (K) causes printout of the table in whieh the different quantities arefunetions of the parameter 1/p (1/RO in the printout). As will be seen, theultimate moment ~u is determined by material failure in the eonerete. In thepenultimate line se = -0.00356. All the values in this line have thereforebeen eonverted so as to eorrespond to se = -0.0035. The modified values aregiven in the last line of the table. The example studied does not inelude
compression reinforeement, and the strains given in the eolumn for sse aretherefore fietitious - they relate to strains at a level within the crossseetion determined by y = e/d = 0.1. Since there is no compression reinforee
ment, the contents of the eolumns for ~c and ~t are equal.
Three values of S and the values of the ratio sulA ealculated for thesevalues are printed out underneath the table. This printout is eontrolledby the proeedure SKRIW 1.
The second example relates to ealeulation alternative 2. The eonditions areas follows.
Conerete Type B.
Tension and eompression reinforeement of CW steel, with w = 0.20 and Wc = 0.05,
u = fsclfst = 1.0, and y = e/d = 0.1.Creep of the eonerete is not taken into consideration.
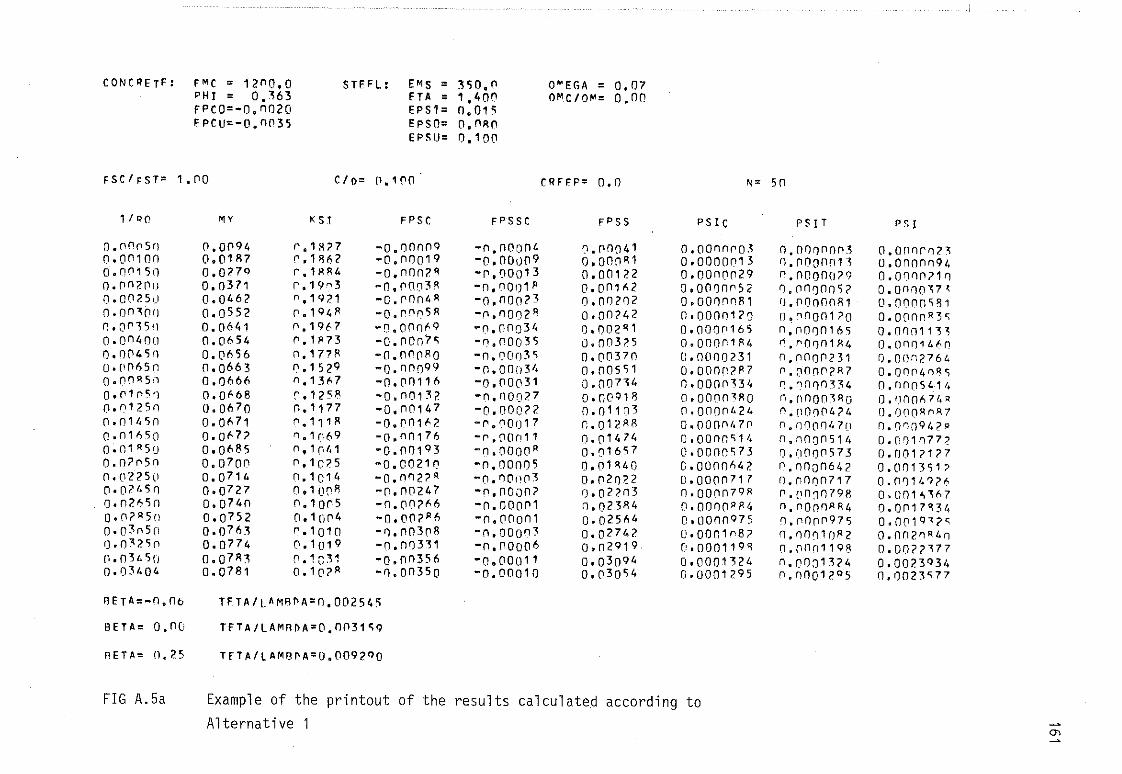
CONCRETF: FMC = 1200.0PHI = 0.~63
fPCO=-0.0020FPCU=-0.0035
fSClFST= 1.00
1/00
0.0 0 0500.001000. 0 01500.0°2000.0025U0.00~01)
0.OO~50
0.004000.004500.('0~50
0.00"5n0.0105'10.0125n0.01l.5n0.n1~50
0.01"500.n?050n. 0225[10·Q?1.500.02~50
0.0?"5(10.0305(10.0~250
n.0 345 (j
0.03404
MY
0.00940.01R70.0?7Q0.03710.04620.0 5 520.06410.Ob540.Ob560.06 630.06660.Ob680.Ob 7 00.Ob71O.Ob??0.06850.0 7 000.0 7 140.0 7 270.074(\0.07520.0 7 630.07740.07R30.0781
STFFL: EMS = 350.0 O"EGA = 0.07HA = 1.40('1 OMClOM= 0.00EPS1= 0.015EPSO= O.OROEPSU= 0.10(\
ClD= 0.100 CRFEP= 0.0 N= 50
KST FPSC FPSSC FPSS PSIC PS TT PSI
f'I.1~?7 -O.OOOOQ -0.noo0 4 0.00041 0.000000.\ 0.000000.\ o.onoronr.1R~2 -0.00019 -0.0000 9 0.00n o1 O.oOOor13 o.00onn1'l 0.0000094r.1~84 -0.00n20 -0.000 13 0.00122 0.00n0029 0.nOoo029 0.0000?10r.19n3 "'O,00(l3R -0.0001 P 0.001 A2 0.0000r52 n'00a005? 0.0(\00~7'0.1921 -0.00Q40 -0.000?3 0.00202 O.OOOOORl 'J.nOOOORl 0.0000S.1r.194P -0.000 58 -0.00n2° 0.00242 0.0000120 n.o oon120 0.oonn"3~0.19b7 -D.000~9 -0.000 34 0.002"1 0.0000165 n.0000165 0.000113~r.1P73 -0.00n?5 -0.00035 0.00325 0.00nn1~4 ~.roon1~4 0.00014600.177~ -O.OOO~O -0.0003~ 0.003 7 n 0.0000231 n.on00231 0.00027640.152 9 -0.00099 -n.ono3/~ 0,00551 O.000f\2P7 0.0000?"7 0.00040050.13A7 -0.00116 -0.00031 0.00714 O.0000~3/. r) '" r~nf)n334 n.nnn541J.r.125~ -0.00132 -n.00027 0.OO91~ O.OOOO'po n.()nOO~"O O.onOb?I••0.1177 -0.00147 -0.00022 0.01103 0.0000424 0.[10004 ?4 [Looo"r"?r.11 18 -0.n01b2 -(".00017 C.012 R8 O. 000nt. 70 0.nn004711 n.Oo09/.2·0.11'69 -0. 0 01 7 6 -r.C10n11 0.01474 Oloonn~1/. n.nOon511. 0.001n772n,1[o',1 -0.001 9 3 -0.0000" 0.01657 0.00n0573 O. nOo0573 0.001?1270.1025 -0.00210 -0.nOO05 0.01840 G.0000A42 0.nOo0642 0.00135170.10110 -0.on2?" -n.r)(lnf13 0.02022 0.0000?11 n.0000717 0.OO14??60.1 008 -0.00247 -O.nOOO? 1).0??n3 n.00n079~ O. (lOO079R 0.On1 .. ~b70.1005 -0.002b~ -0.00001 n.023R4 0.0000·P4 n.ooonp84 0.0017~31.0.1004 -0.002"6 -0.00001 0.025A4 0.0000Q75 0.00no9?5 0.001Q'2~0.1010 -0.00308 -0.00003 0.02742 0.000108? 0.00010R2 0.on2O R4 00.101 9 -0.On331 -0.0000 6 0.0291 9 D.000119~ 0.00011Q~ 0.On22'170.1C31 -0.0 0 356 -0.00011 0.030 94 0.0001324 0.000 1324 0.0023 0 340.102" -0.003 5 0 -0.00010 0.03054 0.0001295 0.f\0012 Q 5 n.1)023~77
RETA=-n.Ob
BETA= o.nu
RETA= n.25
FIG A.Sa
TFTA/L·MR~A=0.002545
TFT'/LAMRDA=0.0031~9
TfTA/LAMB~A=0.0092QO
Example of the printout of the results calculateo accoroing toAlternative 1
(J)
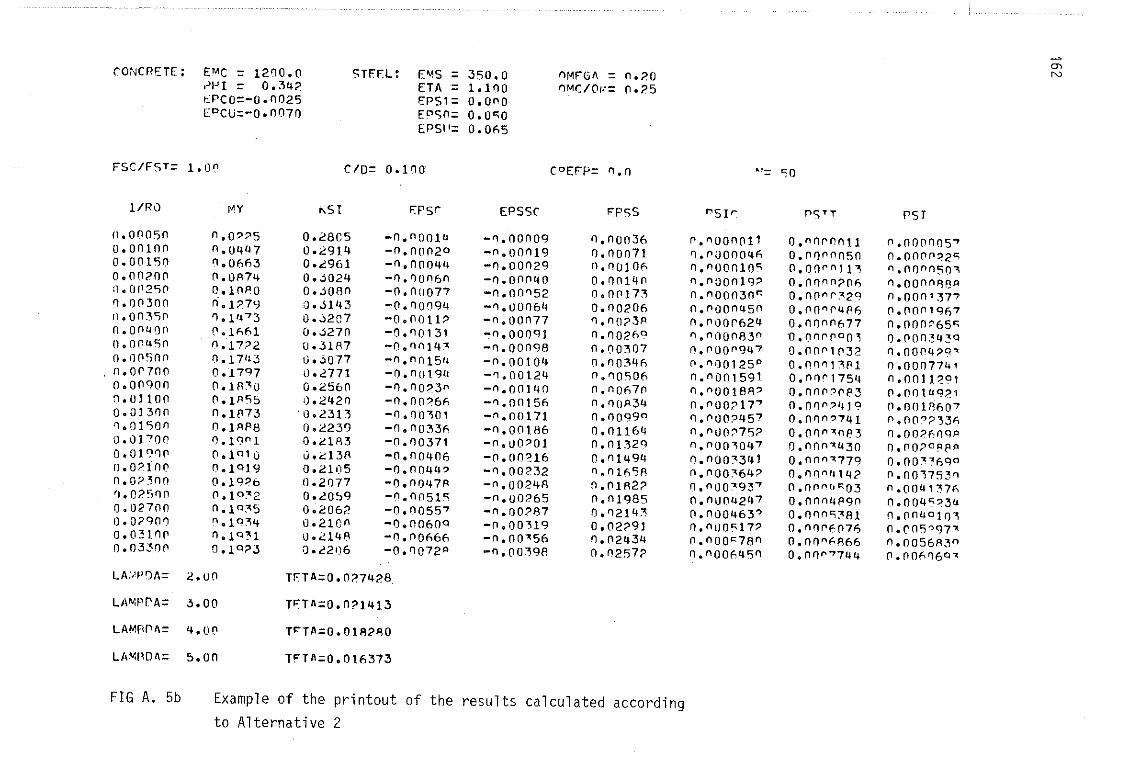
"SI EPsc EPsSC FPSs
0.28C5 -0.0001 4 -0.00009 0.000360.291.4 -0.00020 -0.00019 0.000710.2961 -0.00044 -0.00029 0.OO10l'0.';024 -1').')on60 -0.00040 0.001400";000 -o.nOO77 -0.00052 0.001730.';143 -0.00094 -0.UU064 0.002060 • .)207 -0.00ll2 -0.00077 0.00231'O• .j270 -0.00131 .,0.00091 0.00260u.311'7 -0.00143 -0.00090 0.00307U";077 -".nn15'~ -0.00104 0.00346U.2771 -0.00194 -0.00124 0.005060.2560 -0.00230 -0.00140 0.006700.2420 -0.00?66 -0.00156 0.001'34
'o .2313 -O.on~OI -n.00171 0.0099°0.2239 -0.00336 -0.00186 0.0116~O.21fJ3 -0.00371 -o.uO?OI 0.01320u.2131' -0.00406 -0.OO~16 0.014940.2105 -0'0044? -0.00232 0.01 n 51'0.2077 -o.nOq·7A -0.00241' 0.010220.20~9 -0.0051~ -0.00::'65 0.019850.2062 -0.00557 -n.00::'87 0.021430.2100 -0.00600 -0.00~19 0.02291Q.214B -0.0066n -0.00"56 0.024340.221)6 -0.0072" -0.00~91l 0.02572
TFTA=0.0?7428
T·P=0.021413
T·T~=0.01A21l0
T""Tn=0.016373
"l:: ~o
CONCRETE: EMC = 1200.0,'HI = 0.342I::PCO=-0.0025["CU=-0.0070
FSClFST= 1.00
1/R0 MY
0.00050 n.O??50.00100 0.04 4 70.00150 0.06630.00200 0.01'174:1.0P2S0 O.1OPO0.00:\00 ri.1 27')1).00350 ').1,.-.730.00400 0.11',610.00450 O.17?2o.n(l~n0 0.17"30.or700 0.17970.00900 0.11'1300.01100 0.11'550.01300 0.111730.01500 0.I A1'80.01700 n.1<J°l0.01900 0.1°100.02100 0.1 0 19n.0?300 0.19:'6(I. 02~)fln (l.1°~2
0.02700 0.1 0350.0?900 0.19340.03100 n.1Q~1
0.03300 0.1 0 23
LA:.1Pf)/\= 2.0(1
LA-:orA= 3.00
LAMR[\~= Lj..o!'\
LAMRD~= 5.00
STFEL: EMS = 350.0ETA = 1.100EPS1= 0.000E"So= 0.0<;0EPSI '= 0.065
CID= 0.100'
OMFG~ = 0.20O"'1C/O,'.'= 0.25
C"EFP= 0.0
"SIr-
0. 00000110.0000041',0.000010~
0.000019?0. 0 00030"0.00004500.ouor6240. 0 00083 00.oUo 094 70. 0 00125"0.0001591O.oOOISIl?O.flOO?17'"0.000?457".("IllO;,,7,?n.oOO~047
O. oOO"3'~ ln.I"lOO~64?
n.('lOO~93"7
0. 0 0042470.000463 70.OOO"17?0.000"78 00.n006450
PSTT
o.noroo110.00000500.00,.nl130.00 0 0206o.np"r;t.2g0.00n04P60.0000677'O.000000~
0.00 0 10320.000131'10.00"17540.no('l'08.30.000?4190.00 07 7410.00n"0830.000"430o.nn"~77q
O.nnn/!t42o .nn"11~03
0.0004P900.0005:"810.00060760.00""1166O.nn"'744
PSJ
0.000005 70.0000?2<;n.oooosO"f'l.OQ(lnF38.A0.00013770.00019670.000~65~
O.(lon:~43Q
0.000420'0.00077410.0011?010.00149;>10.OOIr,60 70.007?3360.00?6091'f) " f10?O~et:l
O.OO::-::'6qo0.OO~7530
0.00413760.004"?340.004°1030.rOS797'n.0056A3°0.006060'
O'>N
FIG A. 5b Example of the printout of the results calculated accordingto Alternative 2
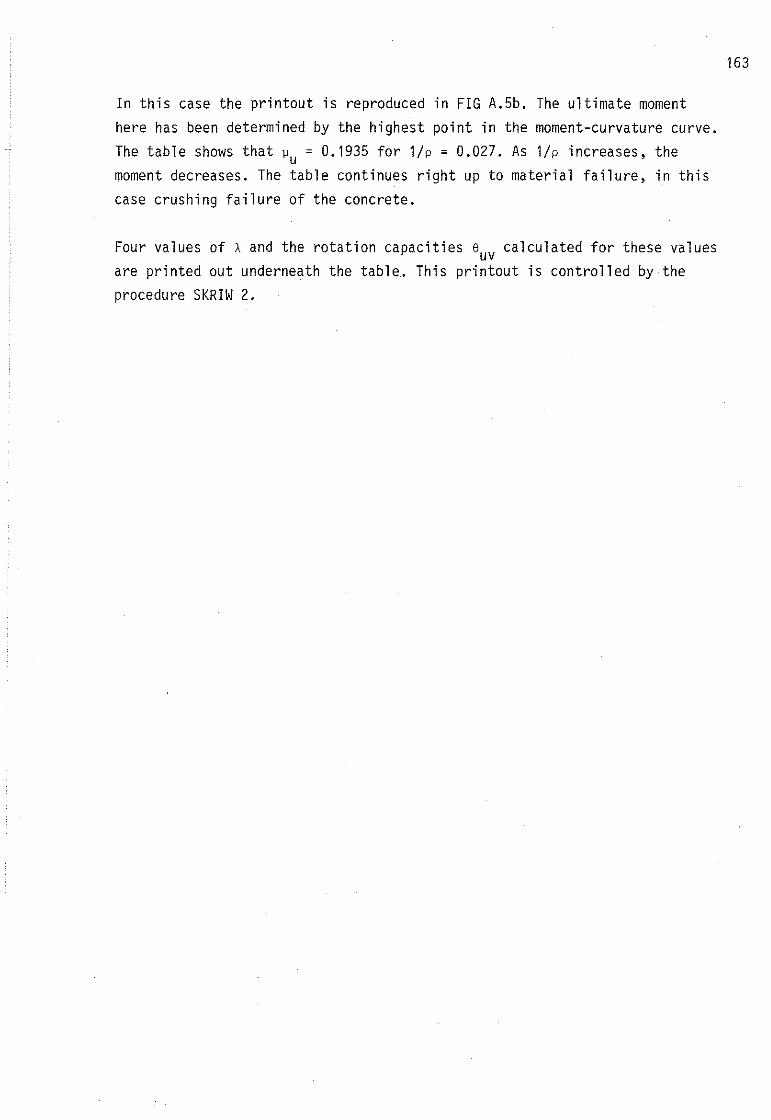
In this case the printout is reproduced in FIG A.5b. The ultimate momenthere has been determined by the highest point in the moment-curvature curve.
The table shows that ~u = 0.1935 for 1/p = 0.027. As 1/p increases, themoment decreases. The table continues right up to material failure, in this
case crushing failure of the eonerete.
Four values of A and the rotation capacities 8uv calculated for these valuesare printed out underneath the table. This printout is controlled by theprocedure SKRIW 2.
163

Lunds universitetReprocentralen 1981