Embed Size (px)
Citation preview

Proc. Natl. Acad. Sci. USAVol. 93, pp. 7749-7754, July 1996Evolution
The root of the universal tree and the origin of eukaryotes basedon elongation factor phylogenySANDRA L. BALDAUF*t, JEFFREY D. PALMERt, AND W. FORD DOOLITTLE**Canadian Institute for Advanced Research and Department of Biochemistry, Dalhousie University, Halifax, NS B3H 4H7, Canada; and tDepartment of Biology,Indiana University, Bloomington, IN 47405
Communicated by John C. Avise, University of Georgia, Athens, GA, April 12, 1996 (received for review December 12, 1995)
ABSTRACT The genes for the protein synthesis elonga-tion factors Tu (EF-Tu) and G (EF-G) are the products of anancient gene duplication, which appears to predate the diver-gence of all extant organismal lineages. Thus, it should bepossible to root a universal phylogeny based on either proteinusing the second protein as an outgroup. This approach wasoriginally taken independently with two separate gene dupli-cation pairs, (i) the regulatory and catalytic subunits of theproton ATPases and (ii) the protein synthesis elongationfactors EF-Tu and EF-G. Questions about the orthology of theATPase genes have obscured the former results, and theelongation factor data have been criticized for inadequatetaxonomic representation and alignment errors. We haveexpanded the latter analysis using a broad representation oftaxa from all three domains of life. All phylogenetic methodsused strongly place the root of the universal tree between twohighly distinct groups, the archaeons/eukaryotes and theeubacteria. We also find that a combined data set of EF-Tuand EF-G sequences favors placement of the eukaryoteswithin the Archaea, as the sister group to the Crenarchaeota.This relationship is supported by bootstrap values of 60-89%with various distance and maximum likelihood methods,while unweighted parsimony gives 58% support for archaealmonophyly.
The use of primordially duplicated proteins to root the tree oflife was pioneered by Gogarten et al. (1) for the catalytic andregulatory subunits of the V- and F-type ATPases and byIwabe et al. (2) for the elongation factors Tu (EF-Tu) and G(EF-G). These analyses divide all living organisms into twoclades, one consisting of the true bacteria, or eubacteria, andthe other consisting of the archaeons and eukaryotes. TheATPase analyses are now complicated by the discoveries ofeukaryotic/archaeal (V-type) ATPases in some eubacteriaand of a eubacterial (F-type) ATPase in at least one archae-bacterium, raising the possibility of multiple horizontal genetransfers (3). The elongation factor analyses have also beencriticized, for the limited size of the homologous region, foralignment errors, and for inadequate taxonomic sampling [twoeukaryotes, two eubacteria, and one archaebacterium forEF-G; and a few additional animal/fungal and organellarsequences for EF-Tu (4)].We have reanalyzed the elongation factor rooting with the
much larger and more broadly representative data base nowavailable for both proteins. This joint analysis now includesthree to five representatives of each of the two archaealkingdoms and a broad sampling of both eukaryotes andeubacteria. We have also modified and expanded the align-ment of Iwabe et al. (2) using consensus sequences and crystalstructures for both proteins. We find that rooted phylogeniesfor both elongation factors strongly support the Iwabe/Gogarten rooting for the universal tree.
These analyses address a second major issue, the origin ofeukaryotes. Most data argue for a monophyletic Archaeacomposed of two kingdoms, crenarchaeotes and euryarchae-otes, with eukaryotes and eubacteria each arising separately(5-9). However, Lake et al. (10, 11) have argued for apolyphyletic Archaea, with a paraphyletic Euryarchaeota giv-ing rise to eubacteria (the photocyte hypothesis) and a mono-phyletic Crenarchaeota arising with eukaryotes (the eocytehypothesis). These hypotheses were originally based on ribo-some morphology (10) and were later supported by Lake'sanalyses of small subunit rRNA (11). However, these smallsubunit rRNA analyses have been challenged (12). In addition,the ribosome data have been criticized as artifactual (13) andare further challenged by the presence of "eocyte-specificcharacters" in two taxa now known to be euryarchaeotes(Thermoplasma and Thermococcus; refs. 5-9). Our results witha combined EF-Tu/EF-G data set strongly reject both theoriginal and rerooted (14) forms of the photocyte hypothesis,but they support the sisterhood of crenarchaeotes and eu-karyotes.
METHODSSequences were initially aligned by computer using the Ge-netics Computer Group (Madison, WI) program PILEUP (15)with default gap penalties. Minor modifications were made byeye to minimize within-kingdom insertion/deletion events,and the alignments were used to construct separate, kingdom-specific consensus sequences for both proteins. For EF-Tu,sites were scored as conserved if 85% of all eukaryotes or alleubacteria or 80% of all archaebacteria shared the same aminoacid at a given position; for EF-G, a value of 85% conservationwas used for all three kingdoms. More stringent criteria(85-90% identity for eubacteria and eukaryotes, respectively)were required if the variation was found primarily in earlybranching lineages, and a 5-10% lower stringency was used ifthe variation was mostly restricted to a single phylum. Use ofstringent criteria to construct the consensus sequences avoidedthe necessity of using a phylogenetic method for this purpose,which might bias the results of subsequent analyses. Theconsensus sequences covered a total of 59%, 65%, and 71% ofall positions of EF-G for archaebacteria, eubacteria, andeukaryotes, respectively, and -75% of all positions for all taxafor EF-Tu. The Dayhoff PAM 250 matrix (16) was used todefine conservative substitutions.These consensus sequences and crystallographically deter-
mined secondary structures (17, 18) and the structure-basedalignment of iEvarsson (19) were then used to refine thealignment among kingdoms and to identify regions of likelyhomology. Priority was given to placing gaps at the edges ofstructural elements or within loops connecting elements. Seg-ments of the alignment were accepted as homologous if their
Abbreviations: EF-Tu, elongation factor Tu; EF-G, elongation factorG.te-mail: [email protected].
7749
The publication costs of this article were defrayed in part by page chargepayment. This article must therefore be hereby marked "advertisement" inaccordance with 18 U.S.C. §1734 solely to indicate this fact.

Proc. Natl. Acad. Sci. USA 93 (1996)
consensus sequences were readily alignable throughout andbordered by well-conserved sequence in all kingdoms. The"Oryzadopsis" EF-G is a composite of partial cDNA se-quences from the angiosperms Oryza and Arabidopsis andincludes 634 out of 824 total amino acid positions. (Sequencesand alignments are available upon request from S.L.B.)
All trees were constructed from amino acid sequences, withsome results also tested using first and second codon positionnucleotides. Parsimony analyses used PAUP version 3.1.1 (20).Shortest tree searches consisted of 50 replicates of randomsequence addition with TBR (tree-bisection-reconnection)branch swapping. Bootstrap analyses used 100-500 replicatesof a single round of random addition each. For these (parsi-mony) analyses only, the joint data set was augmented with anadditional 173 EF-Tu-specific and 300 EF-G-specific posi-tions, which were scored as missing data for each other. Thisincreased the resolution in terminal clades, thus greatly re-ducing analysis times. This use of missing data should not affectthe branching order in deeper lineages (21).
Distance analyses used the neighbor-joining algorithms ofPHYLIP version 3.5c (22) and MEGA 1.0 (23). PHYLIP analysesconsisted of 100 or 500 bootstrap replicates using two differentsubstitution matrices-the Dayhoff PAM250 and the George-Hunt-Barker chemical index (22). MEGA analyses consisted of500 bootstrap replicates using a gamma distribution to correctfor rate variation among sites. The gamma variable alpha wasestimated as described (24) using parsimony trees (20) and wasfound to be -0.7 for both proteins with various combinationsof taxa.Maximum likelihood analyses used the program PROTML
version 2.2 (25). The combined data set was analyzed by theRELL (resampling of estimated log-likelihood) bootstrapmethod using the 1000 best trees found from an exhaustivesearch of a partially constrained starting tree. Bootstrap andSE values were also determined from individual EF-Tu andEF-G data sets using fully resolved trees. All PROTML analysesused the Jones-Taylor-Thornton (JTT; ref. 26) substitutionmatrix. Maximum likelihood analyses were also performedusing the PAML version 1.1 program CODEML (27). Fullyresolved trees were analyzed using the JTT matrix and aneight-component gamma model with the starting alpha valueset at 0.7.
All nucleotide-level analyses used the PHYLIP version 3.5C(22) programs for maximum likelihood (DNAML) or distance(DNADIST). DNA maximum likelihood analyses were done forthe combined data only and consisted of 50 bootstrap repli-cates using a transition/transversion ratio of 1.0, empiricalbase frequencies, and global branch rearrangement to searchfor the best tree. The EF-G nuicleotide data was analyzed bydistance using Jukes-Cantor weighting with 100 bootstrapreplicates and trees constructed by neighbor-joining (22).
RESULTSRoot of the Universal Tree. The alignment of consensus
sequences, which covers the entire GTP-binding domain ofboth proteins, confirms the homology of the amino termini ofEF-Tu and EF-G (Fig. 1). These domains contain sevencolinear blocks of conserved, alignable sequence interspersedwith more rapidly evolving regions of variable size and uncer-tain alignment. In all cases, the latter regions correspond tovariable-sized loops predicted to lie at the surface of theprotein (Fig. 1; refs. 17 and 18). Altogether, 158 amino acidpositions of likely homology between EF-Tu and EF-G (over-lining in Fig. 1), corresponding to "60-75% of the GTP-binding domains of both proteins (Fig. 1), were identified. Ofthese, 102 positions were identified as alignable with strongconfidence (underlining in Fig. 1).Our alignment (Fig. 1) differs from that of Iwabe et al. (2)
in that we include three additional blocks of apparent homol-ogy (F-H), for which weak sequence similarity is strengthenedby secondary structure data (17-19). In addition, Iwabe et al.(2) aligned our positions 30-37 of archaeal and eukaryoticEF-Tu with positions 56-63 of all other sequences. This isprobably incorrect, because it is a much poorer match and alsorequires two additional, large gaps. Our alignment also differsin placing a single amino acid gap at position 4 of EF-G andin placing the single amino acid gap of region E at position 146instead of 133. In the latter case, results were tested with bothversions of the alignment (see below). Our alignment uses thepredicted G and H regions of AEvarsson but differs from hisalignment of region F in that he aligned our positions 158-170of EF-Tu with positions 160-173 of EF-G (19).
All analyses of the joint EF-Tu/EF-G data set support theGogarten/Iwabe rooting of the universal tree (1, 2), by con-
1 A 30 31K HiNiVVIGHVDSGKSTtTGHLIYKCGGIKPHlNlv IGHVDHGKST'vGRLLydGo iKPHvNiGTIGHVDHGKTTLTAAIT' *Lao.
-----_X------_~
NIR-NMSVIAHVDHGKSTLTDSLv. *AGIIqiR-NIGI *AHvDHGKTTLSDnLLAgaGmik- R-NIGI *AHIDAGKTTTTERILfYTG*-
106 D 117D-AiLii'a- G
DAAvLVVsA--GDGAILVVsAaDG
DGALVWDCv CGDGC iVVvDAVEGDG-v-VFea-' G
_4
rD* R*IEKFEKEaaEmGKGSF'KYAWV[-e-' * EEae**GK.sF.FAw,
[---a'.*--AG.-.........
[---a..* AG--------------* Rf[---S-*lAG--- ------L[* iGEV-eG -- ------- AT
55 56 B/Cr] LDKLKAERERGITIDIaLWKF]
mDrLKEERERGVTId-a-'kF]- ID#APEEkaRGITIn-aHVEYe
.......... ......2...}TDTR'DEQER ITIKSTgiS13LDyoe.EQ*RGITi*AAN-Sm-
d3 'DWMOEERGITITaAa-t'f....... ...... A-10 -A
79 80 D 105ErT 0 3 KY *TiIDAPGHRDFIKNMITGTSQAT-, [ 0 YfTIIDAPGHRDFVlNMITGASQAeT* C 0 RHYAHVDCPGHADYvKNMITGAAQM
33 ---aB----yyE [14+] *FLINLIDSPGHVDFSSEVTAALRV'TH [ 4 ] *YLINLIDTPGHVDFgG.VTRamRRifW- [ 0+] * rINIIDTPGHVDFTiEVERSmRVL6^A - `^,3^AA ----a-B----
118 127 128 E 155 158 F 173 175 G 186 189 H 200[EFEAGISKdG] ---QTREHALLAfTLGVKQmIV' NKMD -- [8+] yeEI-K-EvSoylKKv Gy [4+] vpFvPISGwCG DN [15+1 LleALD'-i'-P[EfEAGMS*EGC ---
[---- ##----] v.pQTrEH'fLArTlGi-qiVAvNKMD -- [8+] y'ev-* ...KLLk- Gf [2+] --FiPvSAw'G dN [15 ] L'E'LD*-*s'P-----------] PMPQTREHiLLArQVGVP'IvVFlNK*D -- [6+] LLeLVEnEvReLLs*Y *f [3+] *PiirGSAL.A LE [11+] LnmdavD# *iP*P
--acA-5----D A) p6 --A ---aF-t----------I VCVQTETVLRQAlaERik-Pv' iNKvD Re 1LEL**-*eEe'y-sF [28+ GtVaFGSGLHG -- 112+] iLeMi. HLPSP----------]I vM'QTETVIRQaL-E-Vk-PvLFINKvD RL I*ELk*-t*qEm**R- [29+ GCV&FGSAn -- 39 ] iLDM*ik-'PnP----------]I VePQSEtVWRQAdkY-oVP-RIeFvNKMD r- GADFy.-. ..*i. rL [96+ *PV*CGSA'KN -- 5 1LDAVv-*LP-P
OXC-"13-^5 --- -aD6----- "j36 - "-aE---
FIG. 1. Consensus alignment of the amino termini of EF-Tu and EF-G for eukaryotes (K), Archaea (A), and eubacteria (B). Universal or highlyconserved positions are shown in uppercase letters; positions with only conservative substitutions are shown in lowercase letters corresponding tothe most common amino acid found at that position (16). Capital letters above the alignment indicate blocks of homology; blocks A-E correspondto regions A-E of Iwabe et al. (2). The Crenarchaeota (AC) and Euryarchaeota (AE) are indicated separately for positions 118-130; the symbols## correspond to the sequence GE in Thermoplasma acidophilum and AKS in Methanococcus vanellii. Homologous positions are indicated byoverlining, with the conservative, 102-position core further indicated by underlining. Nonconservative but universally present sites are indicatedby', gaps by -, and positions that are not present in all taxa are indicated by *. Unalignable regions are indicated by numbers corresponding totheir overall length; a number followed by + indicates the minimum size of a region that differs in length among taxa. Secondary structure elementsare indicated below the alignment by ^ for beta strands, and - for alpha helices. The trypsin-sensitive effector region, for which the EF-G structureis unknown, is indicated under the alignment by '. Bracketed regions were omitted from all analyses.
[4+][3+]19 ]
[17]
[6+]
Tu-KAB
G-KAB
Tu-KACAEB
G-KAB
7750 Evolution: Baldauf et aL

Proc. Natl. Acad. Sci. USA 93 (1996) 7751
sistently placing the Archaea together with the eukaryotes tothe exclusion of all eubacteria (Fig. 2). Maximum parsimony(20) and neighbor-joining analyses (22) of the conservativelydefined 102-site data set gave 87-93% bootstrap support forthis rooting for the EF-Tu subtree and 81-95% support for theEF-G subtree (Fig. 2). Similar results were found with thevariation of the 102-site alignment (ref. 2, see above) modifiedat positions 133-146 (85-94% for EF-Tu and 88-95% forEF-G). Consistently stronger values were found for the larger,158-site data set (97-98% for EF-Tu and 95-96% for EF-G).
97 ~ DrosophilaHomo
SaccharomycesEntamcebaDictyostelium
- Dictyosteliunm H6~~Giardia00Z
Sufhlorella
~100 Sulfolobus acidocaldariusSufolobus solfataricusN/urococcusAfthanococcus~E :----- Thermoplasma
PyrococcusHalobacterium
10 MicrococcuXs[a aterium leprae
tQO - AnacystisSpiruinaEIt-Termus
Aquifex 25 stepsThermotoga
Euk
Arc
Eub
Euk
Arc
Eub
FIG. 2. A joint EF-Tu/EF-G protein phylogeny roots the universaltree between eubacteria and Archaea/eukaryotes. The tree shown isone of six shortest trees derived by parsimony analysis. Branches aredrawn to scale (see bar). Brackets on the right indicate eukaryotic(euk), archaeal (arc), and eubacterial (eub) derived sequences. Thearrow indicates the proposed point of gene duplication. The tree is3416 steps long and has a consistency index of 0.580, exclusive ofuninformative characters, and a retention index of 0.756. Parsimonybootstrap values >50% are indicated above the branches. Bootstrapvalues for distance analyses using the substitution matrices of Dayhoffand George-Hunt-Barker are indicated in that order below thebranches of primary interest only. The branch connecting the EF-Tuand EF-G subtrees is short due to the fact that it is based on the 102shared amino acid positions only, while the terminal branches arebased on 173 and 300 additional sites for EF-Tu and EF-G, respec-tively. Alternative trees at this length place Pyrococcus and Thermo-coccus EF-Tu as a separate branch from Halobacterium and Meth-anococcus EF-Tu, and switch the branching position of the Gram-positive bacteria with that of the proteobacteria EF-Tus.
This rooting for the universal tree was also supported by highbootstrap values (91-99% with EF-Tu and 94-97% for EF-G)when three-way analyses were performed using another mem-ber of the GTPase-protein superfamily (28), protein synthesisinitiation factor 2, as an additional outgroup (data not shown).
Origin of Eukaryotes. Both protein-specific subtrees of thejoint analysis of Fig. 2 support, albeit weakly, the crenarchae-otes as the sister group to eukaryotes. To further investigatethis issue, individual EF-Tu and EF-G data sets were analyzedmore thoroughly. These data sets were restricted to regions forwhich homology could be determined with confidence basedon the alignment of domain-specific consensus sequences, andconsisted of 295 amino acid positions for EF-Tu and 382positions for EF-G. Most analyses of both data sets weaklysupport the crenarchaeotes as the sister group to eukaryotes,with bootstrap values of 35-52% for EF-Tu and 50-60% forEF-G. Consistently stronger support was found with maximumlikelihood analyses. These showed both data sets as supportingtheir specific topologies in Fig. 2 over ones showing mono-phyletic Archaea by 84% bootstrap (0.935 SEs) for EF-G and89-93% bootstrap (1.15-1.39 SEs) for EF-Tu. The two datasets were then combined for further analysis into a single dataset totaling 677 sites and consisting of all taxa sequenced forboth proteins.With the exception of parsimony, all analyses of this com-
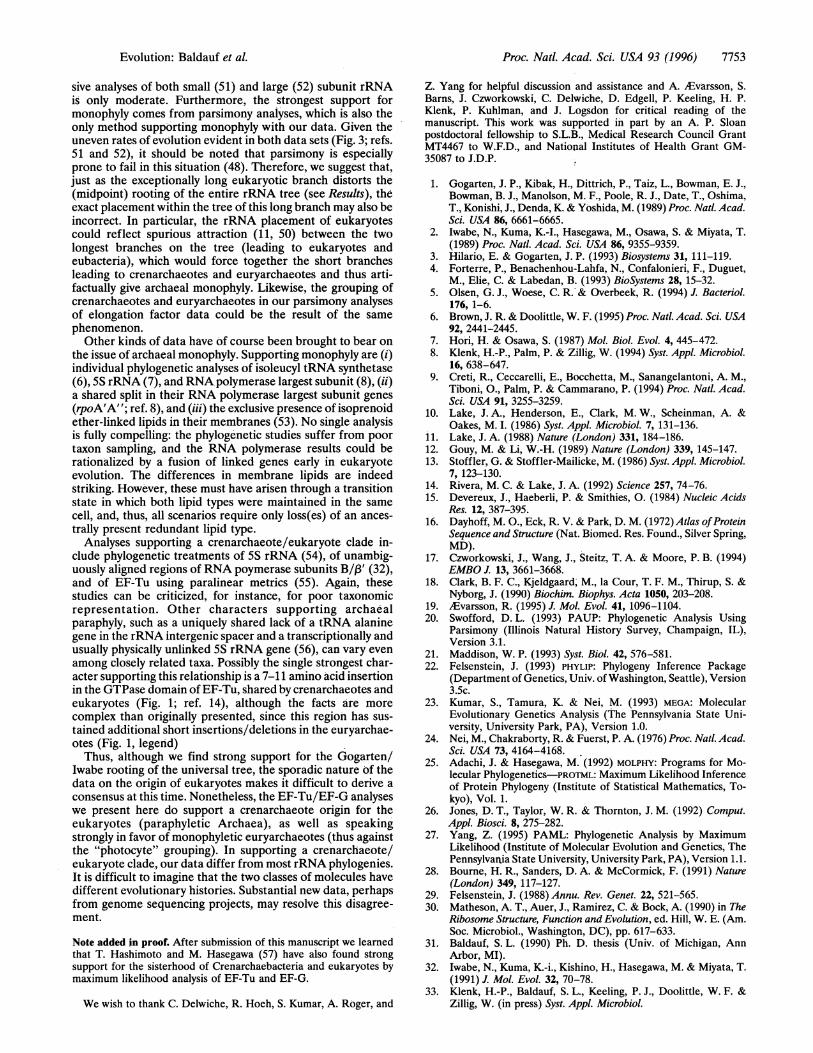
bined amino acid data set support a paraphyletic Archaea withthe crenarchaeotes as the sister group to eukaryotes (Fig. 3).Strongest support came from maximum likelihood analyses ofamino acids, which found 89% bootstrap support for thisaffiliation (Fig. 3). Only a single tree supporting monophyleticArchaea was found within one SE of the best tree (Fig. 3), andthis tree also required placement of Halobacterium as thedeepest branch among euryarchaeotes. The topology shown inFig. 3 was favored over an otherwise identical tree showingmonophyletic Archaea by a difference in log-likelihood of 5.7,corresponding to a confidence level of 72% by the Kishino-Hasegawa test (SE = 5.3; ref. 25). Similarly, a 6.03 differencein log-likelihood between these trees was found by maximumlikelihood analysis using a gamma distribution to correct forrate variation among sites. Neighbor-joining analyses usinggamma-corrected distances gave moderate support for
Drosophila
0 1 replacennercodm 94 Saccharomyces97 tz "chiorophlyta"
- Dictyos~~~~~feliltniEntaroeba
89 GiardiaSulfolobuts acidocaldariusSulfolobus solfataricus
Desuxlfurococculs59, HaIobacterXitm
93 Methnococccus9Thermoplasma
Pyrococcuts78 -Mycobacteritum
7MicrococcusEscherichia
.. Anacystis4ZSpintlina
ThermusThermotoga
Euk
Cren
Eury
Eub
FIG. 3. A Combined EF-Tu/EF-G phylogeny places the origin ofeukaryotes within the Archaea. The tree shown is the single best treederived by maximum likelihood analysis of combined EF-Tu and EF-Gsequences. Analyses utilized a semiconstrained starting tree; con-strained nodes are indicated by *. Branches are drawn to scale asindicated by the scale bar; numbers above the nodes indicate bootstrapvalues. Brackets on the right are as in Fig. 2, except that the Archaeaare divided into crenarchaeotes (cren) and euryarchaeotes (eury). Thetree shown has a log-likelihood of -16054.19, while an identical treewith monophyletic Archaea has a log-likelihood of -16059.9 (25).When a gamma correction is used (27), these two topologies havelog-likelihoods of -14189.26 and -14195.29, respectively. "Chloro-phyta" is a composite of the Arabidopsis EF-Tu and Chlorella EF-Gsequences. The tree is rooted based on the data presented in Fig. 2.
Evolution: Baldauf et aL

Proc. Natl. Acad. Sci. USA 93 (1996)
paraphyly (79% bootstrap), while neighbor-joining analyseswithout this correction gave weak support (60-65% boot-strap). Unweighted parsimony analysis, on the other hand,weakly supported monophyly (58% bootstrap). Limited jack-knife analyses (29) showed that while the distance methodswere fairly robust to the taxonomic composition of the data set,parsimony was not, with bootstrap values ranging from 69%support for monophyletic Archaea to 89% support forparaphyly, depending on which taxa were used. Analyses offirst and second codon nucleotide positions by maximumlikelihood, which did not require the use of constraints, alsosdpported paraphyly (66% bootstrap).
DISCUSSIONRoot of the Universal Tree. The strong similarity in the
amino termini of EF-Tu and EF-G, both in terms of structureand of sequence (Fig. 1), supports a relationship of homolo-gy-i.e., they appear to be the products of an ancient geneduplication. In fact, secondary structure comparisons stronglysuggest that this homology also includes the second domain ofboth proteins (18, 19). Thus, "40% of EF-G appears to behomologous to 75% of EF-Tu (19). The antiquity of thisduplication is shown by the presence of the EF-Tu- andEF-G-encoding genes in all major groups of organisms (Fig. 2).In fact, these genes may be the products of a tandem dupli-cation, as they follow one another in the str operon (30). Thisarrangement occurs in both Archaea and eubacteria (30), afact that further weakens the possibility of deep paralogyconfusing these analyses.
Phylogenetic analyses of the aligned amino-termini ofEF-Tu and EF-G, including a broad representation of taxa forall three domains of life for both proteins, places the root ofthe universal tree between the eubacteria and the Archaea/eukaryotes. These results are supported by high bootstrapvalues for both proteins by all methods used. This rooting ofthe universal tree is also supported by a recent analysis ofanother ancient gene duplication, involving tRNA synthetases(6). Our analyses strengthen and expand the findings of Iwabeet al. (2) by including a large, broadly representative group oftaxa, correcting and extending the EF-Tu/EF-G alignment,and examining the results with multiple methods of analysis.
Striking similarity between archaeal and eukaryotic se-quences, sometimes including large insertions/deletions (1, 8,31, 32), is also seen with 5S rRNA (7), nearly all ribosomalproteins with known homologs from all three domains (30), thelargest and second largest subunits ofRNA polymerase (8, 32),protein synthesis initiation factor 2 (33), and the key recom-bination protein RecA (34). Archaea also contain homologs ofthe eukaryote TATA-binding protein and transcription factorsTFIIB and BRF and have eukaryote-like promoters, whichinteract efficiently with eukaryotic transcription factors in vitro(35). Archaea, like eukaryotes, have short tRNA introns, mostof which are located one nucleotide 3' of the anticodon (36),uniformly add the 3'-terminal CCA to their tRNAs posttran-scriptionally (37), and use the protein fibrillarin and a U3-likeRNA in rRNA processing (38, 39). Both groups probably alsouse family B-type DNA polymerases for replication, whereaseubacteria use this enzyme exclusively for repair (40).
Thus, most aspects of archaeal DNA, RNA, and proteinsynthesis resemble those of eukaryotes. The most notableexceptions to this are 16S and 23S rRNA, for which Archaeaare closer to eubacteria in sequence (5, 41). We suggest thatthis reflects high rates of rRNA sequence evolution in eu-karyotes rather than a fundamental difference in the phylog-eny ofrRNA and protein genes. A similar situation is seen withthe isoleucyl-tRNA synthetases, which also show greater over-all sequence similarity between Archaea and eubacteria, butwhich unite Archaea and eukaryotes when analyzed phyloge-netically, using an outgroup (6). In principle, then, if outgroup
sequences were available for the rRNAs, they should also rootthese trees in the same place as the gene duplications (Fig. 2).Widely conflicting results to both our trees (Fig. 2) and trees
based on rRNA are found with glutamine synthetase (42),glutamate dehydrogenase (43), and the 70-kDa heat-shockproteins (44). However, phylogenetic trees based on theseproteins tend to be deeply incongruent with each other as well,supporting various combinations of paraphyletic or evenpolyphyletic eubacteria and/or Archaea. This is more consis-tent with independent horizontal gene transfers or compari-sons of paralogous sequences (45). One or both of theseexplanations now appears to be the case with nitrogenase (46)and with glyceraldehyde-3-phosphate dehydrogenase (47),which was originally interpreted as an exception to the uni-versal rooting presented here (Fig. 2).
Origin of Eukaryotes. The elongation factor data nowcomprise a sufficiently large data set-i.e., they are broadlysampled in eukaryotes, eubacteria, and both branches ofArchaea-that we may begin to test the relationship betweenArchaea and eukaryotes using these sequences. We find thata combined data set of both proteins most consistently sup-ports the crenarchaeotes as the sister group to eukaryotes,albeit at varying levels of confidence depending on the methodof analysis. Strongest support comes from maximum likelihoodanalyses of amino acids (Fig. 3) and from neighbor-joininganalyses of gamma-corrected distances (89% and 79% boot-strap, respectively). Recent simulations suggest that thesemethods are probably the most robust at large evolutionarydistances, since they are least affected by rate variation amongsites and among lineages (48, 49). Nonetheless, while ourresults are certainly suggestive, they should be interpreted withcaution, as the data set is still limited in terms of taxonsampling, especially among Archaea and eukaryotes. Thus,long branch effects (50) and other artifacts could still beproblematic and difficult to detect, as suggested by the lack ofconsistent results among methods. Greater resolution of thisissue will require the development of other molecular data setsas well as further development of the elongation factor data.However, in terms of the euryarchaeotes, our combined
EF-Tu/EF-G data strongly support their monophyly (Fig. 3),as do almost all other relevant molecular phylogenetic data(5-9). Thus, the photocyte hypothesis, which postulatesparaphyletic euryarchaeotes in either its original (11) orrerooted (14) form, can be soundly rejected.The results of our analyses of EF-G contradict those of Creti
et al. (9), who found 63-99% bootstrap support for monophy-letic Archaea versus our 50-84% support for paraphyly. Ouranalyses differ from theirs in that we have largely used aminoacids rather than nucleotides and included a broader taxo-nomic sampling. However, the primary difference appears tobe the fact that we did not use roughly 30% of the Creti et al.alignment (169 amino acid positions; ref. 9), because we do notfind evidence clearly supporting the homology of these regionsamong the major groups. Consistent with this, even when weanalyze our character set at the nucleotide level using thesmaller taxon sample of Creti et al. (9), we find only 61%bootstrap support for monophyly with first and second codonpositions and 58% support with second positions alone. If weexpand the data set to include the same taxa as in Fig. 2, thesevalues fall to 50%o bootstrap for monophyly versus paraphyly.We suggest that the use of ambiguously aligned regions forphylogeny is questionable, since it cannot be assumed that thesequences found in these regions in different taxa are homol-ogous, and phylogenetic results based on these data can beeasily influenced by any bias in the method of sequencealignment.Undoubtedly the most widely used and influential source of
evidence for archaeal monophyly has been ribosomal RNA. Itis important to realize, however, that the level of support formonophyly in the latest and in some senses most comprehen-
7752 Evolution: Baldauf et al.
Proc. Natl. Acad. Sci. USA 93 (1996) 7753
sive analyses of both small (51) and large (52) subunit rRNAis only moderate. Furthermore, the strongest support formonophyly comes from parsimony analyses, which is also theonly method supporting monophyly with our data. Given theuneven rates of evolution evident in both data sets (Fig. 3; refs.51 and 52), it should be noted that parsimony is especiallyprone to fail in this situation (48). Therefore, we suggest that,just as the exceptionally long eukaryotic branch distorts the(midpoint) rooting of the entire rRNA tree (see Results), theexact placement within the tree of this long branch may also beincorrect. In particular, the rRNA placement of eukaryotescould reflect spurious attraction (11, 50) between the twolongest branches on the tree (leading to eukaryotes andeubacteria), which would force together the short branchesleading to crenarchaeotes and euryarchaeotes and thus arti-factually give archaeal monophyly. Likewise, the grouping ofcrenarchaeotes and euryarchaeotes in our parsimony analysesof elongation factor data could be the result of the samephenomenon.
Other kinds of data have of course been brought to bear onthe issue of archaeal monophyly. Supporting monophyly are (i)individual phylogenetic analyses of isoleucyl tRNA synthetase(6), SS rRNA (7), and RNA polymerase largest subunit (8), (ii)a shared split in their RNA polymerase largest subunit genes(rpoA'A"; ref. 8), and (iii) the exclusive presence of isoprenoidether-linked lipids in their membranes (53). No single analysisis fully compelling: the phylogenetic studies suffer from poortaxon sampling, and the RNA polymerase results could berationalized by a fusion of linked genes early in eukaryoteevolution. The differences in membrane lipids are indeedstriking. However, these must have arisen through a transitionstate in which both lipid types were maintained in the samecell, and, thus, all scenarios require only loss(es) of an ances-trally present redundant lipid type.
Analyses supporting a crenarchaeote/eukaryote clade in-clude phylogenetic treatments of SS rRNA (54), of unambig-uously aligned regions of RNA poymerase subunits B/f3' (32),and of EF-Tu using paralinear metrics (55). Again, thesestudies can be criticized, for instance, for poor taxonomicrepresentation. Other characters supporting archaealparaphyly, such as a uniquely shared lack of a tRNA alaninegene in the rRNA intergenic spacer and a transcriptionally andusually physically unlinked 5S rRNA gene (56), can vary evenamong closely related taxa. Possibly the single strongest char-acter supporting this relationship is a 7-11 amino acid insertionin the GTPase domain of EF-Tu, shared by crenarchaeotes andeukaryotes (Fig. 1; ref. 14), although the facts are morecomplex than originally presented, since this region has sus-tained additional short insertions/deletions in the euryarchae-otes (Fig. 1, legend)
Thus, although we find strong support for the Gogarten/Iwabe rooting of the universal tree, the sporadic nature of thedata on the origin of eukaryotes makes it difficult to derive aconsensus at this time. Nonetheless, the EF-Tu/EF-G analyseswe present here do support a crenarchaeote origin for theeukaryotes (paraphyletic Archaea), as well as speakingstrongly in favor of monophyletic euryarchaeotes (thus againstthe "photocyte" grouping). In supporting a crenarchaeote/eukaryote clade, our data differ from most rRNA phylogenies.It is difficult to imagine that the two classes of molecules havedifferent evolutionary histories. Substantial new data, perhapsfrom genome sequencing projects, may resolve this disagree-ment.
Note added in proof. After submission of this manuscript we learnedthat T. Hashimoto and M. Hasegawa (57) have also found strongsupport for the sisterhood of Crenarchaebacteria and eukaryotes bymaximum likelihood analysis of EF-Tu and EF-G.
We wish to thank C. Delwiche, R. Hoeh, S. Kumar, A. Roger, and
Z. Yang for helpful discussion and assistance and A. AFvarsson, S.Barns, J. Czworkowski, C. Delwiche, D. Edgell, P. Keeling, H. P.Klenk, P. Kuhlman, and J. Logsdon for critical reading of themanuscript. This work was supported in part by an A. P. Sloanpostdoctoral fellowship to S.L.B., Medical Research Council GrantMT4467 to W.F.D., and National Institutes of Health Grant GM-35087 to J.D.P.
1. Gogarten, J. P., Kibak, H., Dittrich, P., Taiz, L., Bowman, E. J.,Bowman, B. J., Manolson, M. F., Poole, R. J., Date, T., Oshima,T., Konishi, J., Denda, K. & Yoshida, M. (1989) Proc. Natl. Acad.Sci. USA 86, 6661-6665.
2. Iwabe, N., Kuma, K.-I., Hasegawa, M., Osawa, S. & Miyata, T.(1989) Proc. Natl. Acad. Sci. USA 86, 9355-9359.
3. Hilario, E. & Gogarten, J. P. (1993) Biosystems 31, 111-119.4. Forterre, P., Benachenhou-Lahfa, N., Confalonieri, F., Duguet,
M., Elie, C. & Labedan, B. (1993) BioSystems 28, 15-32.5. Olsen, G. J., Woese, C. R. & Overbeek, R. (1994) J. Bacteriol.
176, 1-6.6. Brown, J. R. & Doolittle, W. F. (1995) Proc. Natl. Acad. Sci. USA
92, 2441-2445.7. Hori, H. & Osawa, S. (1987) Mol. Biol. Evol. 4, 445-472.8. Klenk, H.-P., Palm, P. & Zillig, W. (1994) Syst. Appl. Microbiol.
16, 638-647.9. Creti, R., Ceccarelli, E., Bocchetta, M., Sanangelantoni, A. M.,
Tiboni, O., Palm, P. & Cammarano, P. (1994) Proc. Natl. Acad.Sci. USA 91, 3255-3259.
10. Lake, J. A., Henderson, E., Clark, M. W., Scheinman, A. &Oakes, M. I. (1986) Syst. Appl. Microbiol. 7, 131-136.
11. Lake, J. A. (1988) Nature (London) 331, 184-186.12. Gouy, M. & Li, W.-H. (1989) Nature (London) 339, 145-147.13. Stoffler, G. & Stoffler-Mailicke, M. (1986) Syst. Appl. Microbiol.
7, 123-130.14. Rivera, M. C. & Lake, J. A. (1992) Science 257, 74-76.15. Devereux, J., Haeberli, P. & Smithies, 0. (1984) Nucleic Acids
Res. 12, 387-395.16. Dayhoff, M. O., Eck, R. V. & Park, D. M. (1972)Atlas ofProtein
Sequence and Structure (Nat. Biomed. Res. Found., Silver Spring,MD).
17. Czworkowski, J., Wang, J., Steitz, T. A. & Moore, P. B. (1994)EMBO J. 13, 3661-3668.
18. Clark, B. F. C., Kjeldgaard, M., la Cour, T. F. M., Thirup, S. &Nyborg, J. (1990) Biochim. Biophys. Acta 1050, 203-208.
19. ,Evarsson, R. (1995) J. Mo. Evol. 41, 1096-1104.20. Swofford, D. L. (1993) PAUP: Phylogenetic Analysis Using
Parsimony (Illinois Natural History Survey, Champaign, IL),Version 3.1.
21. Maddison, W. P. (1993) Syst. Biol. 42, 576-581.22. Felsenstein, J. (1993) PHYLIP: Phylogeny Inference Package
(Department of Genetics, Univ. of Washington, Seattle), Version3.5c.
23. Kumar, S., Tamura, K. & Nei, M. (1993) MEGA: MolecularEvolutionary Genetics Analysis (The Pennsylvania State Uni-versity, University Park, PA), Version 1.0.
24. Nei, M., Chakraborty, R. & Fuerst, P. A. (1976) Proc. Natl. Acad.Sci. USA 73, 4164-4168.
25. Adachi, J. & Hasegawa, M. (1992) MOLPHY: Programs for Mo-lecular Phylogenetics-PROTML: Maximum Likelihood Inferenceof Protein Phylogeny (Institute of Statistical Mathematics, To-kyo), Vol. 1.
26. Jones, D. T., Taylor, W. R. & Thornton, J. M. (1992) Comput.Appl. Biosci. 8, 275-282.
27. Yang, Z. (1995) PAML: Phylogenetic Analysis by MaximumLikelihood (Institute of Molecular Evolution and Genetics, ThePennsylvania State University, University Park, PA), Version 1.1.
28. Bourne, H. R., Sanders, D. A. & McCormick, F. (1991) Nature(London) 349, 117-127.
29. Felsenstein, J. (1988) Annu. Rev. Genet. 22, 521-565.30. Matheson, A. T., Auer, J., Ramirez, C. & Bock, A. (1990) in The
Ribosome Structure, Function and Evolution, ed. Hill, W. E. (Am.Soc. Microbiol., Washington, DC), pp. 617-633.
31. Baldauf, S. L. (1990) Ph. D. thesis (Univ. of Michigan, AnnArbor, MI).
32. Iwabe, N., Kuma, K-i., Kishino, H., Hasegawa, M. & Miyata, T.(1991) J. Mol. Evol. 32, 70-78.
33. Klenk, H.-P., Baldauf, S. L., Keeling, P. J., Doolittle, W. F. &Zillig, W. (in press) Syst. Appl. Microbiol.
Evoliition: Baldauf et aL

7754 Evolution: Baldauf et al.
34. Clark, A. J. & Sandler, S. J. (1994) Crit. Rev. Microbiol. 20,125-142.
35. Baumann, P., Qureshi, S. A. & Jackson, S. P. (1995) TrendsGenet. 11, 279-283.
36. Kaine, B. P. (1989) J. Mol. Evol. 23, 248-254.37. Langer, D. & Zillig, W. (1993) Nucleic Acids Res. 21, 2251.38. Reiter, W. D., Hudepohl, U. & Zillig, W. (1990) Proc. Natl. Acad.
Sci. USA 87, 9509-9513.39. Potter, S., Durovic, P. & Dennis, P. P. (1995) Science 268,
1056-1060.40. Forterre, P., Bergerat, A., Gadelle, D., Elie, C., Gottspeich, F.,
Confalonieri, F., Duguet, M., Holmes, M. & Dyall-Smith, M.(1994) Syst. Appl. Microbiol. 16, 746-758.
41. Leffers, H., Kjems, J., Ostergaard, L., Larson, N. & Garrett, R. A.(1987) J. Mol. Biol. 195, 43-61.
42. Brown, J. R., Masuchi, Y., Robb, F. T. & Doolittle, W. F. (1994)J. Mol. Evol. 38, 566-576.
43. Benachenhou-Lahfa, N., Forterre, P. & Labedan, B. (1993) J.Mol. EvoL 36, 335-346.
44. Gupta, R. S. & Golding G. B. (1993) J. Mo. Evol. 37, 573-582.
Proc. Natl. Acad. Sci. USA 93 (1996)
45. Doolittle, R. F., Feng, D. F., Anderson, K. L. & Alberro, M. R.(1990) J. Mol. Evol. 31, 383-388.
46. Chien, Y.-T. & Zinder, S. H. (1994)J. Bacteriol. 176, 6590-6598.47. Martin, W., Brinkmann, H., Savonna, C. & Cerff, R. (1993) Proc.
Natl. Acad. Sci. USA 90, 8692-8696.48. Kuhner, M. K. & Felsenstein, J. (1994) Mol. Biol. Evol. 11,
459-468.49. Tateno, Y., Takezaki, N. & Nei, M. (1994) Mol. Biol. Evol. 11,
261-277.50. Felsenstein, J. (1978) Syst. Zool. 27, 401-409.51. Barnes, S., Delwiche, C. F., Palmer, J. D. & Pace, N. R. (1996)
Proc. Natl. Acad. Sci. USA, in press.52. De Rijk, P., Van de Peer, Y., Van den Broeck, I. & De Wachter,
R. (1995) J. Mo. Evol. 41, 366-375.53. Gambacorta, A., Trincone, A., Nicolaus, B., Lama, L. & De
Rosa, M. (1994) Syst. Appi. Microbio. 16, 518-527.54. Wolters, J. & Erdmann, V. A. (1989) Can. J. Microbiol. 35,43-51.55. Lake, J. A. (1994) Proc. Natl. Acad. Sci. USA 91, 1455-1459.56. Garrett, R. A., Dalgaard, J., Larsen, N., Kjems, J. & Mankin,
A. S. (1991) Trends Biochem. Sci. 16, 22-27.57. Hashimoto, T., & Hasegawa, M. (1996) Adv. Biophys. 32, 73-120.