Embed Size (px)
Citation preview
THE ROLES OF MOTIVATIONAL BELIEFS AND LEARNING STYLES ON TENTH GRADE STUDENTS’ BIOLOGY ACHIEVEMENT
A THESIS SUBMITTED TO THE GRADUATE SCHOOL OF NATURAL AND APPLIED SCIENCES
OF THE MIDDLE EAST TECHNICAL UNIVERSITY
BY
ŞULE ÖZKAN
IN PARTIAL FULFILLMENT OF THE REQUIREMENTS FOR THE DEGREE OF MASTER OF SCIENCE
IN THE DEPARTMENT OF SECONDARY SCIENCE AND MATHEMATICS
EDUCATION
JULY 2003
Approval of the Graduate School of Natural and Applied Sciences.
Prof. Dr. Canan ÖZGEN
Director
I certify that this thesis satisfies all the requirements as a thesis for the degree of
Master of Science.
Prof. Dr. Ömer GEBAN
Head of Department
This is to certify that we have read this thesis and that in our opinion it is fully
adequate, in scope and quality, as a thesis for the degree of Master of Science.
Prof. Dr. Ömer GEBAN Assist. Prof. Dr. Ceren TEKKAYA
Co-Supervisor Supervisor
Examining Committee Members
Prof. Dr. Musa DOĞAN ____________________________ Prof. Dr. Hamide ERTEPINAR ____________________________ Prof. Dr. Ömer GEBAN ____________________________ Assist. Prof. Dr. Ceren TEKKAYA ____________________________
Assist. Prof. Dr. Jale ÇAKIROĞLU ________________________
ABSTRACT
THE ROLES OF MOTIVATIONAL BELIEFS AND LEARNING STYLES ON TENTH GRADE STUDENTS’ BIOLOGY ACHIEVEMENT
Özkan, Şule
M.S., Department of Secondary Science and Mathematics Education
Supervisor: Assist. Prof. Dr. Ceren TEKKAYA
Co-Supervisor: Prof. Dr. Ömer GEBAN
July 2003, 125 pages
This study aimed to explore the roles of students’ motivational beliefs
(self-efficacy, intrinsic value, test anxiety) and learning styles on tenth grade
students’ biology achievement. In this study Turkish version of the Motivated
Strategies for Learning Questionnaire, Learning Style Inventory, and Biology
Achievement Test were used as measuring instruments.
Motivated Strategies for Learning Questionnaire was adapted into Turkish
and pilot tested with 238 tenth grade students from two representative schools.
The main study was conducted in 11 randomly selected schools throughout the
iii
Çankaya and Yenimahalle districts of Ankara with a total of 980 tenth grade
students in fall 2002-2003 semester.
The data obtained from the administration of the measuring instruments
were analyzed by using analyses of covariance (ANCOVA) and bivariate
correlations. Results of the statistical analyses indicated that students’ learning
styles had a significant effect on their biology achievement when students’
motivational beliefs were controlled. The most common learning style type was
found to be assimilating for the subjects of this study. Moreover, the biology
achievement test mean scores of assimilators were found to be higher than that of
convergers, divergers, and accommodators. Bivariate correlations revealed low
positive correlations between each of the three components of motivational belief
and students’ biology achievement.
Keywords: Biology Education, Biology Achievement, Motivational Belief, Self-
Efficacy, Intrinsic Value, Test Anxiety, Learning Style.
iv
ÖZ
GÜDÜSEL İNANÇLARIN VE ÖĞRENME STİLLERİNİN ONUNCU SINIF
ÖĞRENCİLERİNİN BİYOLOJİ BAŞARISINDAKİ ROLÜ
Özkan, Şule
Yüksek Lisans, Orta Öğretim Fen ve Matematik Alanları Eğitimi Bölümü
Tez Yöneticisi: Yrd. Doç. Dr. Ceren TEKKAYA
Yardımcı Tez Yöneticisi : Prof. Dr. Ömer GEBAN
Temmuz 2003, 125 sayfa
Bu çalışmanın amacı ; onuncu sınıf öğrencilerinin güdüsel inançlarının
(öz-yeterlik, içsel değer, sınav kaygısı) ve öğrenme stillerinin biyoloji
başarısındaki rolünü araştırmaktır. Bu çalışmada, ölçüm araçları olarak
Öğrenmede Güdüsel Stratejiler Anketi’nin Türkçe versiyonu, Öğrenme Stilleri
Envanteri ve Biyoloji Başarı Testi kullanılmıştır.
Öğrenmede Güdüsel Stratejiler Anketi Türkçeye adapte edilmiş ve iki
okuldan toplam 238 öğrencinin katılımı ile pilot çalışması gerçekleştirilmiştir.
v
Esas çalışma, 2002-2003 sonbahar döneminde, Çankaya ve Yenimahalle
ilçelerindeki 11 okuldan seçilen 980 onuncu sınıf öğrencisi ile yapılmıştır.
Elde edilen veriler, tek yönlü varyans (ANCOVA) istatistiksel tekniği ve
basit ilişki analizi kullanılarak değerlendirilmiştir. İstatistiksel sonuçlar,
öğrencilerin güdüsel inançları kontrol edildiğinde, öğrenme stillerinin biyoloji
başarısına anlamlı bir etkisi olduğunu göstermiştir. Çalışmaya katılan öğrenciler
arasında özümseyen öğrenme stilinin son derece yaygın olduğu ve bu öğrenme
stiline sahip olan öğrencilerin biyoloji başarı testi ortalamalarının diğer öğrenme
stillerine sahip olan öğrencilerinkinden daha yüksek olduğu saptanmıştır. Basit
ilişki analizleri, güdüsel inanç bileşenlerinden her birinin öğrencilerin biyoloji
başarısıyla düşük positif bir ilişki içerisinde olduğunu göstermiştir.
Anahtar Kelimeler: Biyoloji Eğitimi, Biyoloji Başarısı, Güdüsel İnanç, Öz-
Yeterlik, İçsel Değer, Sınav Kaygısı, Öğrenme Stili
vi

To My Parents
Zekiye and Necmettin ÖZKAN
vii
ACKNOWLEDGEMENT
The completion of my degree of master and this thesis represents the work,
encouragement, and support of many people to whom I am very thankful.
First and foremost, I am grateful to my parents who provided moral
support and encouragement throughout the process and never stopped believing in
me. Thank you for your patience, optimism, and support. I could not have
completed this without you. You both mean much more to me than I will ever be
able to express.
I would like to thank my supervisor Assist. Prof. Dr. Ceren TEKKAYA
for her valuable advice and assistance throughout the duration of my thesis. Thank
you Sincerely.
I would also like to thank my co-supervisor Prof. Dr. Ömer GEBAN for
his knowledgeable recommendations.
I wish to express my sincere gratitude to Assist. Prof. Dr. Ali ERYILMAZ
and Assist. Prof. Dr. Jale ÇAKIROĞLU for their suggestions and guidance.
Special heartfelt thanks to my fiancée, Özgür who started with me at first
and proceeded with me in every step with an unbelievable support, inspiration and
understanding. Our time together was cut short, and this journey took away some
of the precious time we did have together. Thank you for your patience and
acceptance. Your love is a blessing and the endless joy in my life that I hold on.
viii
I feel very fortunate that I have friends like you. Pınar, Emel and Aslı: you
deserve my heartfelt and sincere thanks. Your close friendships, inspiration, help,
suggestions, and support helped me a lot to keep me on this path I have just
completed. The anxiety and stress that I have experienced have gone away with
the enjoyable moments we shared together. Thank you for everything.
I would also like to thank Nehir, Eren, Zuhal, Selen and Birikim for their
valuable help during the entire process.
Sincere gratitude also is extended to Ministry of Education, school
principals, biology teachers, and students who agreed to participate in this
research.
Finally, I thank the members of my committee for their willingness to
serve on the committee and their valuable feedback.
Thank you all very much indeed.
ix

TABLE OF CONTENTS
ABSTRACT ...................................................................................................... iii
ÖZ... .................................................................................................................... v
DEDICATION ................................................................................................. vii
ACKNOWLEDGMENT ................................................................................. viii
TABLE OF CONTENTS ................................................................................... x
LIST OF TABLES........................................................................................... xiv
LIST OF FIGURES ......................................................................................... xvi
LIST OF SYMBOLS...................................................................................... xvii
CHAPTERS
1.INTRODUCTION……………………………………………………………1
1.1 The Main Problems and Sub-problems ……………………………………5
1.1.1 The Main Problems……………………………………………………5
1.1.2 The Sub-problems……………………………………………………..5
1.2 Hypotheses………………………………………………………………....6
1.3 Definition of Important Terms……………………………………………..8
1.4 Significance of the Study…………………………………………………..9
2. REVIEW OF THE LITERATURE………………………………………...11
2.1 Literature on Student Motivation…………………………………………12
2.1.1 Expectancy Component of Student Motivation……………………...14
x
2.1.2 Value Component of Student Motivation…………………………....15 2.1.3 Affect Component of Student Motivation…………………………...17 2.1.4 Expectancy-Value Theory of Achievement Motivation……………..19 2.1.4.1 The Role of Task Values……………………………………..21 2.1.4.2 The Role of Task-Specific Beliefs……………………………21 2.1.4.3 The Role of Task-Specific Goals……………………………..23 2.1.5 Science Achievement and Student Motivation………………………24
2.2 Literature on Learning Style………………………………………………25
2.2.1 Definitions of Learning Style………………………………………..27 2.2.2 Learning Theories……………………………………………………30 2.2.3 Kolb's Model for Learning Style and Experiential Learning Theory..32 2.2.4 Learning Style and Achievement……………………………………38
2.3 Gender Differences in Science……………………………………………43
2.4 State of Science Education in Turkey…………………………………….44
3. METHOD…………………………………………………………………46
3.1 Population and Sample……………………………………………………46
3.2 Variables…………………………………………………………………..49
3.2.1 Dependent Variables................................................................................ 50
3.2.2 Independent Variables ............................................................................. 50
3.3 Data Collection Instruments ....................................................................... 50
3.3.1 Motivated Strategies for Learning Questionnaire-Turkish Version ........ 51
3.3.2 Learning Style Inventory ......................................................................... 53
3.3.3 Biology Achievement Test ...................................................................... 54
3.3.4 Validity and Reliability of the Measuring Tools ..................................... 56
3.4 Procedure .................................................................................................... 58
xi
3.5 Analyses of Data........................................................................................ 59
3.5.1 Descriptive Statistics ............................................................................... 59
3.5.2 Inferential Statistics ................................................................................. 59
3.6 Power Analysis ........................................................................................... 60
3.7 Assumptions and Limitations of the Study................................................. 60
3.7.1 Assumptions of the Study................................................................. 61
3.7.2 Limitations of the Study……………………………………………62
4. RESULTS..................................................................................................... 63
4.1 Descriptive Statistics ................................................................................ 63
4.1.1 Descriptive Statistics of the Biology Achievement Test ......................... 63
4.1.2 Descriptive Statistics of the Self-Efficacy Component of
MSLQ-TV………………………………………………………….64
4.1.3 Descriptive Statistics of the Intrinsic Value Component of
MSLQ-TV………………………………………………………….65
4.1.4 Descriptive Statistics of the Test Anxiety Component of
MSLQ-TV………………………………………………………….66
4.1.5 Descriptive Statistics of the Learning Style Inventory……………..69
4.2 Factor Analysis……………………………………………………………71
4.2.1 Factor Extraction…………………………………………………...71
4.2.2 Factor Rotation……………………………………………………..73
4.3 Inferential Statistics……………………………………………………….75
4.3.1 Determination of Covariates.................................................................... 75
4.3.2 Assumptions of Analysis of Covariance ................................................. 77
4.3.3 Analysis of Covariance Model ................................................................ 78
4.3.4 Null Hypothesis 1 .................................................................................... 79
xii
4.3.5 Null Hypothesis 2 .................................................................................... 81
4.3.6 Null Hypothesis 3 .................................................................................... 81
4.3.7 Null Hypothesis 4 .................................................................................... 82
4.3.8 Null Hypothesis 5 .................................................................................... 82
4.3.9 Null Hypothesis 6………………………………………………….. 82
4.4 Summary of the Results.............................................................................. 83
5. CONCLUSIONS, DISCUSSION AND IMPLICATIONS.......................... 85
5.1 Summary of the Research Study ................................................................ 85
5.2 Conclusions ................................................................................................ 86
5.3 Discussion of the Results............................................................................ 87
5.4 Internal Validity of the Study ..................................................................... 93
5.5 External Validity of the Study .................................................................... 94
5.6 Implications of the Study............................................................................ 95
5.7 Recommendations for Further Research .................................................... 98
REFERENCES ................................................................................................. 99
APPENDICES
A. TURKISH VERSION OF THE MOTIVATED STRATEGIES FOR
LEARNING QUESTIONNAIRE (MSLQ-TV) ........................................ 113
B. LEARNING STYLE INVENTORY (LSI)................................................ 115
C. BIOLOGY ACHIEVEMENT TEST ......................................................... 117
xiii
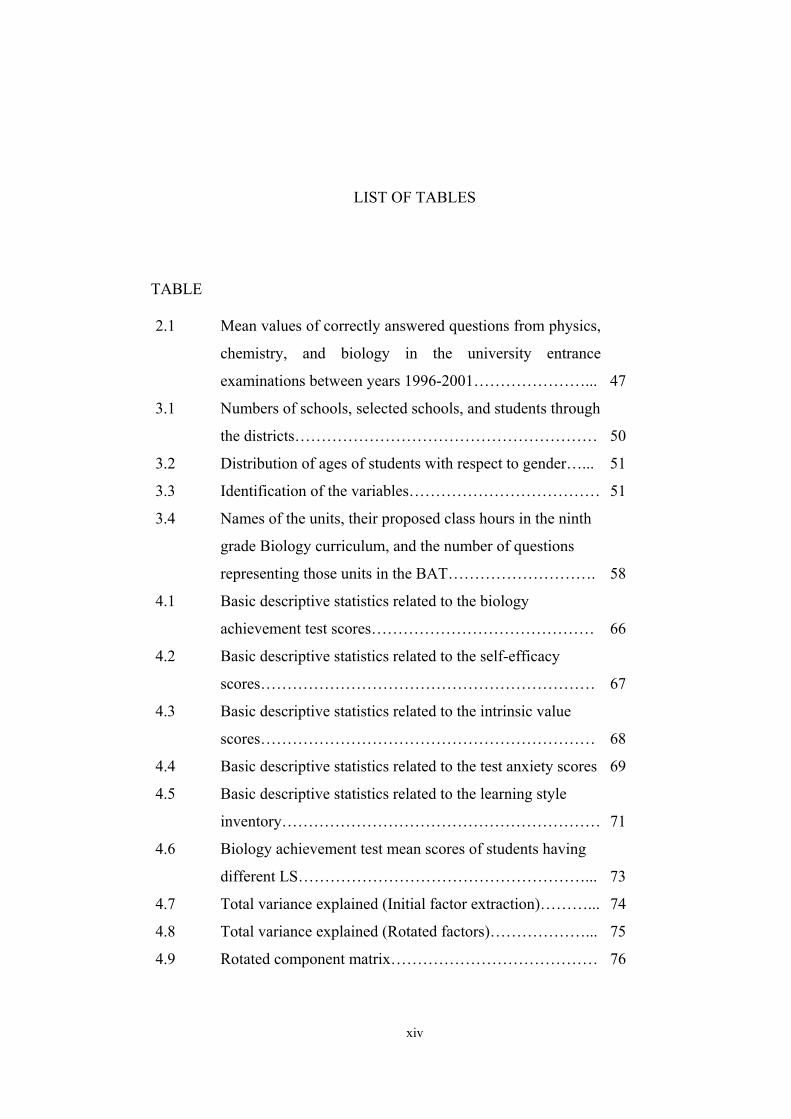
LIST OF TABLES
TABLE
2.1 Mean values of correctly answered questions from physics,
chemistry, and biology in the university entrance
examinations between years 1996-2001…………………...
47
3.1 Numbers of schools, selected schools, and students through
the districts…………………………………………………
50
3.2 Distribution of ages of students with respect to gender…... 51
3.3 Identification of the variables……………………………… 51
3.4 Names of the units, their proposed class hours in the ninth
grade Biology curriculum, and the number of questions
representing those units in the BAT……………………….
58
4.1 Basic descriptive statistics related to the biology
achievement test scores……………………………………
66
4.2 Basic descriptive statistics related to the self-efficacy
scores………………………………………………………
67
4.3 Basic descriptive statistics related to the intrinsic value
scores………………………………………………………
68
4.4 Basic descriptive statistics related to the test anxiety scores 69
4.5 Basic descriptive statistics related to the learning style
inventory……………………………………………………
71
4.6 Biology achievement test mean scores of students having
different LS………………………………………………...
73
4.7 Total variance explained (Initial factor extraction)………... 74
4.8 Total variance explained (Rotated factors)………………... 75
4.9 Rotated component matrix………………………………… 76
xiv
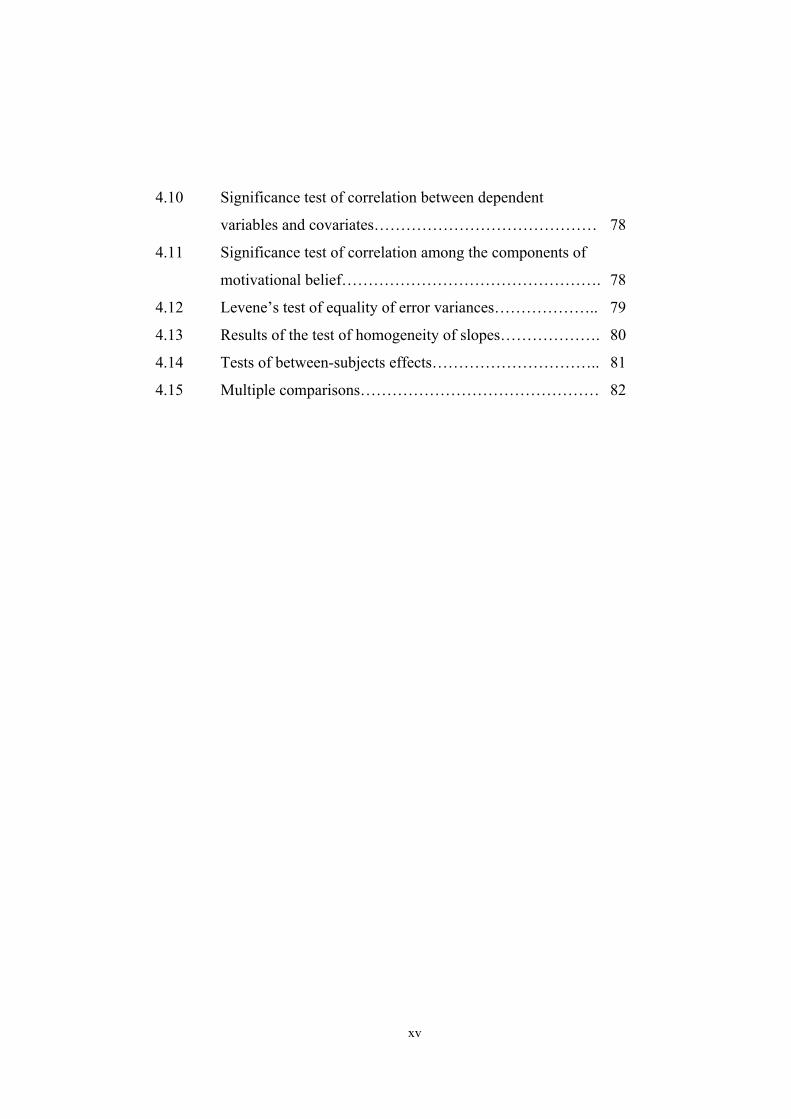
4.10 Significance test of correlation between dependent
variables and covariates……………………………………
78
4.11 Significance test of correlation among the components of
motivational belief………………………………………….
78
4.12 Levene’s test of equality of error variances……………….. 79
4.13 Results of the test of homogeneity of slopes………………. 80
4.14 Tests of between-subjects effects………………………….. 81
4.15 Multiple comparisons……………………………………… 82
xv
LIST OF FIGURES
FIGURE
2.1 The revised expectancy-value model……………………….. 20
2.2 The experiential learning cycle and basic learning styles…... 34
3.1 Distributions of students’ gender and age…………………... 50
3.2 Learning style grid………………………………………….. 56
4.1 Histogram with normal curve related to Biology
achievement test scores……………………………………...
69
4.2 Histogram with normal curve related to self-efficacy scores. 70
4.3 Histogram with normal curve related to intrinsic value
scores…………………………………………………………
70
4.4 Histogram with normal curve related to test anxiety scores… 70
4.5 Frequencies of the four learning style types………………… 72
4.6 Percentages of the four learning style types………………… 72
4.7 Scree plot of the eigenvalues………………………………... 75
xvi
LIST OF SYMBOLS
SYMBOLS
MSLQ-TV : Turkish version of the Motivated Strategies for Learning
Questionnaire LSI : Learning Style Inventory
BAT : Biology Achievement Test
SES : Self-efficacy scores
IVS : Intrinsic value scores
TAS : Test anxiety scores
BACH : Biology achievement test scores
MOTB : Motivational beliefs of students toward biology
LS : Learning style
DV : Dependent Variable
IV : Independent Variable
ANCOVA : Analysis of covariance
Df : Degree of Freedom
N : Sample Size
α : Significance Level
xvii
CHAPTER 1
INTRODUCTION
The state of biology education in Turkish high schools has been very
poor for many years and there is a great need for improvement. Over the
years, learning biology without understanding has been a common outcome
of biology instruction. Students have seemed to memorize facts without
fully understanding and such students often are not sure when or how to use
what they know. The results of such learning are evident in the number of
questions answered correctly in the university entrance examinations in
Turkey over the last few years. It is clear that many students are not learning
science they need in order to be productive citizens in the 21st century.
The need to understand and make use of science in the workplace
and daily life has been greater today than past, and will continue to increase.
The level of science required for intelligent citizenship and the scientific
knowledge required in the workplace and in professional areas has increased
dramatically. Consequently, all students need to receive a high quality
science education and learn science in order to guarantee the production of
quality in many professional areas ranging from education to health care to
technology and to engineering.
1
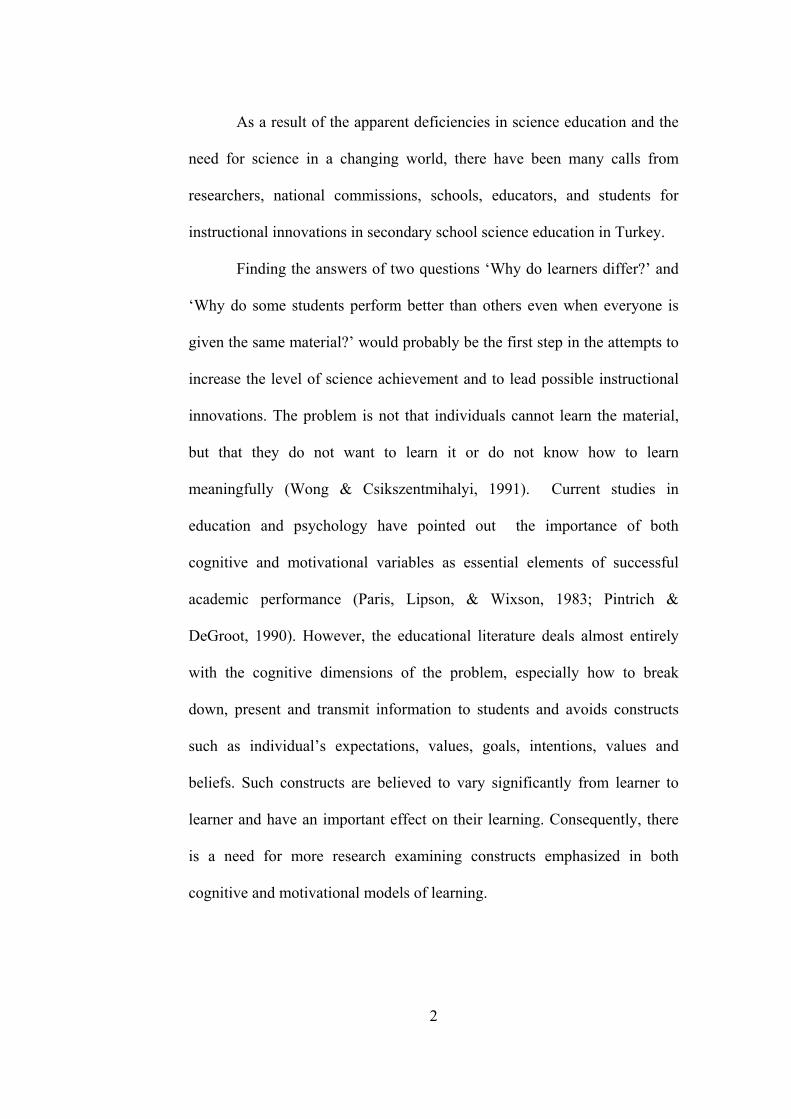
As a result of the apparent deficiencies in science education and the
need for science in a changing world, there have been many calls from
researchers, national commissions, schools, educators, and students for
instructional innovations in secondary school science education in Turkey.
Finding the answers of two questions ‘Why do learners differ?’ and
‘Why do some students perform better than others even when everyone is
given the same material?’ would probably be the first step in the attempts to
increase the level of science achievement and to lead possible instructional
innovations. The problem is not that individuals cannot learn the material,
but that they do not want to learn it or do not know how to learn
meaningfully (Wong & Csikszentmihalyi, 1991). Current studies in
education and psychology have pointed out the importance of both
cognitive and motivational variables as essential elements of successful
academic performance (Paris, Lipson, & Wixson, 1983; Pintrich &
DeGroot, 1990). However, the educational literature deals almost entirely
with the cognitive dimensions of the problem, especially how to break
down, present and transmit information to students and avoids constructs
such as individual’s expectations, values, goals, intentions, values and
beliefs. Such constructs are believed to vary significantly from learner to
learner and have an important effect on their learning. Consequently, there
is a need for more research examining constructs emphasized in both
cognitive and motivational models of learning.
2
Cognitive models of learning provide information regarding ‘how’
students develop an understanding of classroom academic task through the
use of cognitive resources and tools (e.g., learning styles), whereas models
of motivation provide an understanding of the ‘why’ of student choice, level
of activity and effort, and persistence at classroom academic tasks (Yu,
1996). Therefore, cognitive or motivational models alone cannot account for
the different aspects of students learning. In classroom environment, both
cognitive and motivational factors operate simultaneously, so both types of
constructs are needed to be examined in the school setting.
With respect to cognitive factors, research has shown that what
students learn is significantly affected by their learning styles. Learning
style can be defined as the way each learner perceives and processes new
information for storage and retrieval (Williams, 2001). Students have
different learning style preferences for taking in and processing information
(Felder, 1996). Learning style is not an ability, but rather a preference, and
is facilitated by the individual’s perceptual and sensory strengths (Taylor,
1997). It is known that learning styles are identifiable, and greater academic
achievement results when students’ learning styles are considered in the
selection of instructional methods (Shaughnessy, 1998). Thus, one of the
purposes of this study is to examine the effect of students’ learning styles on
their biology achievement.
Despite the benefits that cognitive factors can afford learners,
students must be motivated to become engaged with the course material.
3
Current models of learning tend to take a less isolated view toward
cognition by including more ‘hot’ constructs like affect and motivation (Yu,
1996). Motivation can be defined as the process by which goal-directed
activity is initiated and sustained and it is an important quality that pervades
all aspects of education (Pintrich & Schunk, 1996, as cited in Yu, 1996). A
number of constructs have been theorized to play a role in motivation to
learn. These constructs include, among many others, self-competence and
self-efficacy, task value, intrinsic goal orientation, and test anxiety (Yu,
1996). Thus, this study also intended to examine the relationship between
students’ motivational belief and their biology achievement.
The dynamic interaction of cognitive and motivational factors with
students’ science achievement in Turkey has not been widely acknowledged
by researchers. Affective constructs have been usually avoided. Instead
much emphasis has been given on the effects of different treatments and
teaching methods on student understanding. Models of academic
achievement that attempt to improve students’ science achievement without
determining the underlying reasons of low school performance generally do
not seem to do a very good job for solving our educational problems in
science. For the reasons already discussed, we can confirm that there is an
urgent necessity of specifying both cognitive and affective determinants of
science education in our schools. Since students’ learning styles and
motivational beliefs were found as important determinants of school
performance by previous researches and little study exists on how learning
4
styles and motivational factors influence science achievement in our
schools, this study attempts to investigate the relationship between
motivational belief and biology achievement and the effect of learning style
on biology performance of students.
1.1 Main Problems and Sub-problems
1.1.1 The Main Problems
The two main problems of this study are stated as follows;
1) Do students’ learning style and gender have significant effects on the
biology achievement of the tenth grade students?
2) Is there a significant contribution of students’ motivational beliefs to
their biology achievement?
1.1.2 The Sub-problems
1) Is there a significant difference between the biology achievement test
scores of tenth grade students with different learning styles when the
effect of student motivational belief is controlled?
2) Is there a significant difference between the biology achievement test
scores of tenth grade female and male students when the effect of
student motivational belief is controlled?
5
3) Is there a significant difference between the biology achievement test
scores of tenth grade male and female students with different learning
styles when the effect of student motivational belief is controlled?
4) Is there a significant contribution of students’ self-efficacy beliefs to
their biology achievement test scores?
5) Is there a significant contribution of students’ intrinsic value beliefs to
their biology achievement test scores?
6) Is there a significant contribution of students’ test anxiety beliefs to their
biology achievement test scores?
1.2 Hypotheses
The problems stated above were tested with the following
hypotheses which are stated in null form.
Null Hypothesis 1: There will be no significant difference between the
biology achievement test scores of tenth grade students with different
learning styles when the effect of student motivational belief is controlled.
Null Hypothesis 2: There will be no significant difference between the
biology achievement test scores of tenth grade female and male students
when the effect of student motivational belief is controlled.
6
Null Hypothesis 3: There will be no significant difference between the
biology achievement test scores of tenth grade female and male students
with different learning styles when the effect of student motivational belief
is controlled.
Null Hypothesis 4: There will be no significant contribution of students’
self-efficacy beliefs to their biology achievement test scores.
Null Hypothesis 5: There will be no significant contribution of students’
intrinsic value beliefs to their biology achievement test scores.
Null Hypothesis 6: There will be no significant contribution of students’ test
anxiety beliefs to their biology achievement test scores.
7
1.3 Definition of the Important Terms
Motivational Belief: As used in this study, motivational belief is defined in
terms of self-efficacy, intrinsic value and test anxiety.
Self-Efficacy: A measurement of the extent to which the learner perceives
his ability to master a task. It includes the learner’s judgments about his
ability to complete a task and confidence in his skills to conduct the task.
Involves students’ answers to the question, ‘Can I do this task?’
Intrinsic Value: The value component of motivational belief involves
students’ goals for the task and their beliefs about the importance of, interest
in, and value of the task. Involves students’ answers to the question, ‘Why
am I doing this task?’
Test Anxiety: Anxiety is the affective component of motivational belief
which includes students’ emotional reactions to the tasks and taps into
students’ worry and concern over taking exams. Involves students’ answers
to the question, ‘How do I feel about this task?’
Learning style: The interaction of cognitive, affective, and physiological
behaviors as the learner perceives, interact with, and responds to the
learning environment. As used in this research, learning style is a measure
of an individual’s relative emphasis on the four learning modes or
8
orientations as identified by Kolb in his Learning Style Inventory (Concrete
Experience-CE, Reflective Observation-RO, Abstract Conceptualization-
AC, and Active Experimentation-AE) and on two combinations scores that
indicate the extent to which the individual emphasizes abstractness over
concreteness (AC-CE) and action over reflection (AE-RO).
Biology Achievement: Biology performance of students as measured by the
grades taken from the Biology Achievement Test (BAT) used in the study.
Science-Mathematics Group: One of the groups selected by tenth grade high
school students in Turkey in which students heavily take mathematics and
science lessons during their education.
1.4 Significance of the Study
Current study can provide a framework for the recognition of some
of the affective and cognitive variables underlying science education in
Turkey. One of the major priorities of science educators should be to
identify those variables and to help all students improve their science
learning. In a world where the focus of science education has begun to shift
from the preparation of a few students for scientific and technical careers to
the preparation of all students for scientifically and technologically rapid
changing life, the need to improve science education in Turkey has been
greater than ever. Consequently, one of the initial attempts for improving
9
science learning is to identify the affective and cognitive determinants of
science education. Only after specifying the determinants of science
achievement, the efforts for improvement would be meaningful.
Further research is needed to identify the importance of both
cognitive and motivational variables as predictors of success in school
performance. Accordingly, this study represents an effort to address and fill
this gap in the literature and is designed to add to the growing body of
literature regarding learning styles, motivational beliefs, and their
relationships to biology achievement. It is hoped that this investigation will
serve as a motivating force for future interest and research in the area of
learning styles, motivational beliefs and their effects on school performance
in different areas; thereby enhancing systematic educational approaches for
optimum learning success and increasing the awareness of learners and
educators on the fact that cognitive factors together with motivational
variables play an important role in school performance and science
achievement.
10

CHAPTER 2
LITERATURE REVIEW
Some students perform better than others at acquiring knowledge
about a new topic, even when everyone was given the same instruction
(Vollmeyer & Rheinberg, 2000). Why do learners differ? One possible
reason is that successful learners start with a good learning strategy and
know how to find out ways for acquiring the new material. This is a
cognitive explanation. However, there can also be a motivational
explanation: Learners may vary in the nature of their motivation to learn the
new topic. Highly motivated students may try harder to learn whereas lowly
motivated ones do not struggle enough to learn. Combining these two
explanations related to learner difference yields a third alternative: a
cognitive-motivational explanation (Vollmeyer & Rheinberg, 2000).
This literature review starts by discussing how motivation can affect
learning and then continues with the effects of cognitive characteristics,
specifically the effects of students’ preferred learning styles on learning.
11
2.1 Literature on Student Motivation
Simon (1967, p.29) defined motivation as a ‘goal terminating
mechanism, permitting goals to be processed serially’. People have many
goals in their lives and according to Simon, motivation is the mechanism
that determines which goal is activated. If the goal to learn about a new
topic is activated, the learner tries to reach it and starts learning. Learning
itself, however, is a cognitive process.
Rheinberg (1997, as cited in Vollmeyer & Rheinberg, 2000) defined
motivation as something that acts as a driving force towards a goal for all
current processes. By doing so, motivation influences the way people learn.
Bandura (1991, p.158) combines motivation and cognition into a
cognitive-motivational perspective. He defined motivation as a
‘multidimensional phenomenon indexed in terms of selection of pursits
from competing alternatives, intensity of effort, and persistence of exerion’.
In terms of learning this means that motivation not only affects what people
learn, but also the intensity and the duration of the learning activities.
The interaction between motivation and cognition is described in a
more detailed way by Schiefele and Rheinberg (1997, as cited in Vollmeyer
& Rheinberg, 2000). They claimed that motivation can affect three aspects
of learning: (1) persistence and frequency of learning activities; (2) mode of
performed learning activities; (3) motivational and functional states of the
learner during learning.
12

Motivation is considered as a critical determinant of students’
classroom learning and achievement in part because students who are more
highly motivated tend to provide greater effort and persist longer at
academic tasks than do students who are less motivated (Wolters &
Rosenthal, 2000). In cognitive models of motivation, this greater effort and
persistence for academic tasks is thought to result mainly from various
beliefs, attitudes, and perceptions of the student (Weiner, 1990). Among
these beliefs, the extent to which students value the material or skills they
are learning, students’ perceived self-efficacy, and the goals or reasons
students adopt for completing academic tasks, have often been used to
understand and explain students’ motivation, effort, and persistence for
academic task (Wolters & Rosenthal, 2000).
In their conceptualization of the expectancy-value model of
achievement, Pintrich and De Groot (1990) describe three factors that
characterize student motivation: an expectancy component, a value
component, and an affective component. The expectancy component
includes students’ beliefs about their ability to perform a task. The value
component includes students’ goals and beliefs about the importance and
interest of the task. The affective component includes students’ emotional
reactions to the task. Each component of student motivation and their
interaction with student performance is described in more detail below.
13
2.1.1 Expectancy Component of Student Motivation
The expectancy component of student motivation has been
conceptualized in a variety of ways in motivational literature like perceived
competence, self-efficacy, attributional style, and control beliefs, but the
basic construct involves students’ beliefs that they are able to perform a task
and that they are responsible for their own performance (Pintrich & De
Groot, 1990). In this study, the expectancy component of student motivation
was evaluated by be assessment of students’ self-efficacy.
Students’ perceived self-efficacy for a task has been used to
understand and explain students’ choice, effort, and persistence for
academic tasks and it is defined as their judgments about their ability to
complete a task successfully, (Schunk, 1991). In an achievement context,
self-efficacy involves students’ confidence in their cognitive skills to learn
and perform the academic course work (Pintrich, 1999). Bandura (1993) has
stated that individuals with greater self-efficacy set higher goals, provide
greater efforts and persist longer when faced with difficulties than people
with lower levels of self-efficacy for the same activity. Similarly, Schunk
(1990, 1991) has shown that perceived self-efficacy affects many aspects of
student motivation including their choice, effort, and persistence for a task.
Students may avoid tasks for which they have a low sense of self-efficacy
while they are likely to choose challenging tasks when they feel efficacious,
and are more likely to work harder and persist longer when engaged in these
task (Schunk, 1991). As a specific indicator of students’ effort, previous
14
research has also found that self-efficacy can be used to predict students’
use of self-regulated learning strategies (Wolters & Pintrich, 1998;
Zimmerman, 1990). Further, self-efficacy has also been tied more directly to
students’ performance level on academic tasks. For example, Zimmerman,
Bandura, and Martinez-Pons (1992) found that self-efficacy for academic
achievement was predictive of final grades among high school students.
According to Pintrich (1999), self-efficacy was strongly related to academic
performance including examinations, lab reports, papers, and overall final
grades of students. Self-efficacy also has been hypothesized to influence
individuals’ thought pattern and emotional reactions (Pajares, 1996).
Individuals with low self-efficacy may believe that tasks are harder than
they really are and this belief may lead to anxiety and ineffective strategies
(Pajares, 1996).
2.1.2 Value Component of Student Motivation
The value component of student motivation includes students’ goals
for the task and their beliefs about the importance and interest of the task
(Pintrich & De Groot, 1990). Although this component has been
conceptualized in a variety of ways (e.g., learning vs. performance goals,
intrinsic vs. extrinsic orientation, task value, and intrinsic interest), this
motivational component primarily focus on the reasons why students engage
in an academic task (Pintrich & De Groot, 1990). In this study, the value
component was examined in terms of students’ intrinsic task value.
15
Task value reflects students’ beliefs about whether the material or
skills they are learning are useful, important, or intrinsically appealing for
them (Eccles & Wigfield, 1995; Wigfield, 1994; Wigfield & Eccles, 1992).
Theoretically, students who view what they are learning as more useful,
more important, or more appealing are more likely to engage in a task, to
provide greater effort for completing the task, and persist longer at the task
than other students (Wolters & Rosenthal, 2000).
Eccles (1983, as cited in Pintrich, 1999) has suggested that three
components of task value are important in achievement dynamics: the
learners’ perception of the importance of the task, their personal interest in
the task, and their perception of the utility value of the task for future goals.
The importance component of task value refers to the individuals’
perceptions of the task’s importance for them. Interest is assumed to be
learner’s general attitudes or linking of the task that is somewhat stable over
time and a function of personal characteristics. Utility value is determined
by the learner’s perceptions of the usefulness of the task for them. For
students utility value may include beliefs that the course will be useful for
them immediately in some way (e.g., help them cope with college), in their
major (e.g., they need this information for upper level course), or their
carrier and life in general (e.g., this will help them somehow in graduate
school) (Pintrich, 1999).
Empirical research in this area has found a relation between
students’ value for the material they are learning and their choice behavior.
16
For example, Eccles and her colleagues (Meece, Wigfield & Eccles, 1990;
Wigfield & Eccles, 1992) have found that students who believe skill in
mathematics to be valuable are more likely to report that they will take
additional math courses in the future when compared to students who do not
value the material in math. With respect to learners’ effort or level of
cognitive engagement, other researches have found a positive relation
between students’ valuing of academic tasks and their use of cognitive and
self-regulatory strategies (Pintrich & De Groot, 1990). Wolters and Pintrich
(1998) found that middle school students who showed greater valuing of the
material in a specific subject area were more likely to report using cognitive
and self-regulatory strategies with regard to that subject area. Pintrich and
his colleagues (Pintrich, Smith, Garcia & McKeachie, 1993) also found that
task value was correlated to performance but those relations were weaker
than those for self-efficacy.
2.1.3 Affect Component of Student Motivation
The third motivational component is concerned about students’
affective or emotional reactions to the task. Affect component of student
motivation involves students’ answer to the question, ‘How do I feel about
this task?’ (Pintrich & De Groot, 1990). There are a variety of affective
reactions that might be relevant like anger, pride, or guilt, but in a school
context one of the most important seems to be test anxiety (Wigfield &
Eccles, 1989).
17
Current theories of test-anxiety is based primarily on an interference
model. High anxiety level produces task-irrelevant responses like concern of
passing, error tendencies, thoughts of leaving, etc. in the testing situation
that interfere with the task-relevant responses necessary for good test
performance. A different approach was taken by Culler and Holahan (1980),
who studied the role of ability and study habits in academic performance for
low and high test-anxious students. Their results show that high test-
anxious students have poorer ability and poorer study skills. They concluded
that at least some part of the decrement in academic performance for high
test-anxious students might be due to less knowledge of the relevant
material as a function of differential study skills. According to this
conclusion, high test-anxious students have good reason to be anxious. Not
only anxiety produces poor performance but also poor ability results in
anxiety. These two approaches to test anxiety show that the problems of
high test–anxious students may lie along the continuum from poor study
habits to worry in the test situation that cause attention defect so that they
are not able to retrieve the required information (Benjamin, McKeachie,
Lin, & Holinger, 1981).
Research on test anxiety has been linked to learners’ metacognition,
cognitive strategy use, and effort management (Benjamin et al., 1981; Culler
& Holahan, 1980; Tobias, 1985). Benjamin et al., (1981) found that even
though high anxious students seemed to be as effortful and persistent as
low-anxious students, they appeared to be very ineffective and inefficient
18
learners who often did not use appropriate cognitive strategies for
achievement. On the other hand, other research shows that high-anxious
children are not persistent or avoid difficult tasks (Hill & Wigfield, 1984).
Studies conducted in the last 30 years have most of the time
supported the view that high test anxiety is correlated with performance
decrements (Benjamin et al., 1981). Correlations ranging to -.60 show that
anxiety has a strong negative relationship to performance in evaluative
situations (Hill & Wigfield, 1984).
2.1.4 Expectancy-Value Theory of Achievement Motivation
Achievement motivation theorists have identified a variety of
constructs to explain how motivation influences people’s choice of
achievement tasks, persistence on those tasks, and performance on them
(Wigfield & Eccles, 2000). One long-standing perspective on achievement
motivation is expectancy-value theory. Theorists in expectancy-value
perspective believe that individuals’ choice, persistence, and performance
can be explained by their beliefs about how well they will do on the activity
and the extent to which they value the activity (Wigfield, 1994; Wigfield &
Eccles, 1992). Researchers using the expectancy-value model of
achievement motivation are interested in how different aspects of an
individual’s valuing of academic tasks, together with the individual’s
expectancies for success, contribute to achievement behaviors (DeBacker &
Nelson, 1999).
19
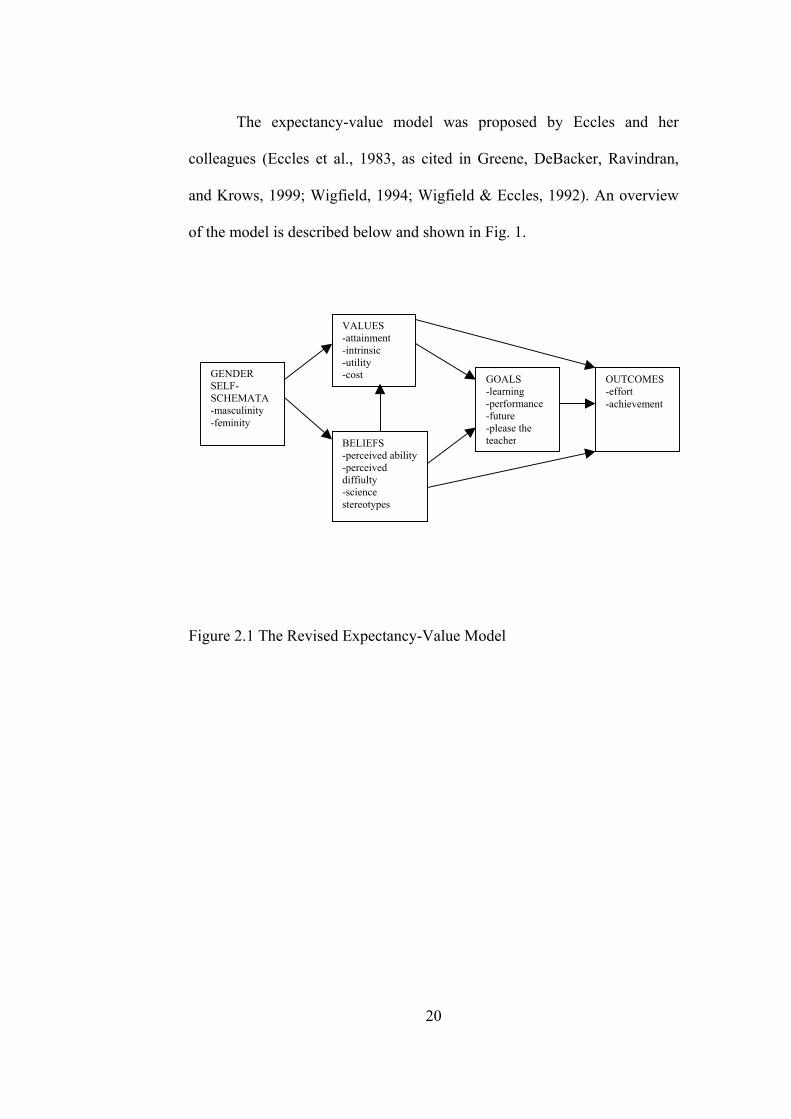
The expectancy-value model was proposed by Eccles and her
colleagues (Eccles et al., 1983, as cited in Greene, DeBacker, Ravindran,
and Krows, 1999; Wigfield, 1994; Wigfield & Eccles, 1992). An overview
of the model is described below and shown in Fig. 1.
VALUES -attainment -intrinsic -utility -cost
BELIEFS -perceived ability-perceived diffiulty -science stereotypes
GOALS -learning -performance -future -please the teacher
OUTCOMES -effort -achievement
GENDER SELF-SCHEMATA -masculinity -feminity
Figure 2.1 The Revised Expectancy-Value Model
20
2.1.4.1 The Role of Task Values
There are four task values (intrinsic, utility, attainment, and cost)
proposed in the model that are interested in how a task meets the different
needs of an individual (Wigfield, 1994; Wigfield & Eccles, 1992). Intrinsic
value is the measurement of one’s personal enjoyment or satisfaction from
engaging in tasks in science domain. Utility value is the degree to which
students value science for its usefulness in a future endeavor. Attainment
value is the importance an individual places on accomplishments in the
science domain. The fourth aspect of valuing, cost value is conceptualized
as the worthwhileness of the time and effort for learning tasks in science.
Debacker and Nelson (1999) reported that valuing variables predicted effort
and persistence in science for both girls and boys, and science achievement
for boys.
2.1.4.2 The Role of Task-Specific Beliefs
Like task values, expectancies for success are indicated to be direct
predictors of achievement-related choices in the Eccles et al. model (Greene
et al., 1999). Expectancies for success are a learner’s beliefs about whether
she/he will be successful on a future task. In their earlier work Eccles et al.
showed expectancies and ability perceptions as separate constructs, but they
have expressed that competence beliefs and expectancies are often not
separate (Wigfield, 1994; Wigfield & Eccles, 1992). Other researchers have
also found that these two constructs are indistinguishable (Greene et al.,
21
1999), so a single perception of ability construct which includes both task-
specific competency and expectancy beliefs was used in the model.
The second task-specific belief is the perceived task difficulty.
According to Eccles and Wigfield (1995, as cited in Greene et al., 1999),
task difficulty perception should be negatively related to perception of
ability and task values. If a task is viewed as very difficult, the learner
should be less confident in his/her ability to succeed in the task, which
should decrease the valuing of that task.
The last task-specific belief is the measurement of the extent to
which a learner believes that science is a male domain. The literature
indicates that stereotypical beliefs related to science exist among students
(DeBacker & Nelson, 2000). Studies of motivation to learn science suggest
that perceptions of the gender appropriateness of a task or academic domain
may affect motivation to learn (Greene et al., 1999). Studies using the
Draw-A-Scientist test with follow-up interviews reported that both male and
female students of all school ages have stereotypic images of science as
male domain (Mason, Kahle, & Gardner, 1991). With regard to motivation
to learn science, DeBacker and Nelson (1999) found that viewing science as
a male domain was correlated negatively with achievement and persistence
for high school girls. Those relationships were not found for boys.
22
2.1.4.3 The Role of Task-Specific Goals
Task-specific goals are the reasons students report for doing the work
in a particular achievement situation (Miller, Greene, Montalvo, Ravindran,
& Nichols, 1996). The two goals primarily described in goal theory
literature were the learning goal and the performance goal (DeBacker &
Nelson, 1999). Learning goals which are also called as mastery or task-
oriented goals, have been characterized by reflecting a desire for mastery of
a task and deep understanding. DeBacker and Nelson (1999) indicated that
learning goals are related to greater effort and persistence in science
learning and higher achievement. Performance goals which are also called
ego-oriented goals, reflect a wish to perform better than others and protect
one’s ego. Findings from studies of learning and performance goals have
been consistent in showing that students’ effort, engagement, and
achievement in science are related to the extent to which they persue the two
goals (DeBacker & Nelson, 2000). There is a much smaller, new appearing,
literature that expands the range of goals beyond learning and performance
goals to include future goals and pleasing the teacher (Miller et al., 1996).
Future goals refer to distant goals (e.g., eligibility for extracurricular
activities, college admission, and carrier opportunities) that to some extent
are rely on current task performance but not inherent in the performance
itself. Pleasing the teacher is one of the examples of social responsibility
goal that has been found in Wentzel’s (1989) research, to have a positive
influence on achievement. Miller et al. (1996) provided evidence for
23
positive relationships between both future goals and desire to satisfy the
teacher and self-regulation, which was positively linked to achievement.
2.1.5 Science Achievement and Student Motivation
Researchers have proposed that science achievement in secondary
school is a function of many interrelated variables such as students’ ability,
attitudes and perceptions, socioeconomic variables, parent and peer
influences and school-related variables (Singh, Granville, & Dika, 2002).
Many of these variables are home- and family-related and consequently are
difficult to change and are outside the control of educators. However, there
are school-related variables such as motivation, interest, attitudes, and
academic engagement that can be improved and modified and amenable to
change by educational interventions. Thus, comprehending the role of such
affective factors on achievement in science has attracted serious attention in
recent years (Singh et al., 2002).
A considerable amount of research has accumulated in the last two
decades that has examined the correlates of success in academic
achievement in general and in science in particular. Attitudinal and affective
constructs such as self-concept, confidence in learning science, science
interest and motivation, and self-efficacy have emerged as salient predictors
of science achievement. (Singh et al., 2002).
Motivation to learn is of special interest in science education
(Pintrich, Marx, & Boyle, 1993). Evidences suggest that decisions to engage
24
in effortful learning in science may be influenced by individual students’
motivation, including their goals for engaging in an activity, their beliefs
about their abilities and the nature of the task, and their valuing of the task
(Greene & Miller, 1996).
Many studies have investigated the relations between students’
motivation to learn and their achievement in science, mainly their
performance and scores in science tests (Trumper, 1995). In Uguroglu and
Walberg’s (1979) survey of 40 studies which contained more than 200
correlations between motivation and achievement, 11.4% of the variance in
achievement was accounted by motivation. Kremer and Walberg (1981)
reviewed 20 studies dealing with student motivation and concluded that
there is a positive relationship between motivational constructs and science
learning. Later, Napier and Riley (1985), in a study that analyses various
affective determinants, found that the highest correlate to achievement in
science was student motivation.
2.2 Literature on Learning Style
There has always been great interest in the analysis of individual
variations in educational psychology. Educational psychologists have
understood that an important key to facilitate individuals' learning is to deal
with the differences in their cognitive functions (Cano-Garcia & Hewitt
Hughes, 2000). Part of the research literature is mainly focused on the
analysis of the most relevant differences not only from the point of view of
25
intelligence but also from the point of view of learning (intellectual styles
and learning styles).
Most educators have recognized that understanding the ways in
which individuals learn is a key element for the improvement of education
(Collinson, 2000). All people show differences in how they perceive and
acquire information, conceptualize, form ideas, process and memorize, form
value judgments, and in the way they behave (Hickson & Baltimore, 1996).
In the classroom, each student has unique personality and motivational
factors that influence the way they respond to school and gain basic
educational skills (Collinson, 2000).
A substantial amount of research in education and psychology has
been directed toward identifying the effects of individual differences in
learning styles (Collinson, 2000). Educators are becoming increasingly
aware that an essential element in improving the academic success of
learners is recognizing the way in which they learn.
As Brandt (1990) has indicated, the last ten years have witnessed
considerable experimentation with learning styles and their relation to
student learning. Proponents of this approach believe that, by exploring
learning styles, positive effects upon student motivation and achievement
are produced (Matthews, 1996).
26
2.2.1 Definitions of Learning Style
There has been an extreme increase in the number of learning style
theories and definitions presented by educational researchers over the past
25 years. Many researchers have built upon the works of others, and as a
result, many theories and definitions overlap. However, each researcher who
develops a new theory originates new terms to establish originality,
authenticity and ownership (Collinson, 2000).
Although learning style may be simply defined as the way people
understand and remember information, the literature is filled with more
complex variations on this theme. Learning styles are defined and classified
in many different ways. It is very difficult to offer one particular definition
of `learning style’; each researcher gives his or her own individual definition
for various reasons (Cano-Garcia & Hewitt Hughes, 2000). First, because
they are usually only interested in one of the dimensions of the learning
process. Second, because they use different measurement instruments.
Third, because their theoretical bases are very different.
According to Kirby (1979, as cited in Collinson, 2000) the term
"learning style" came into use when researchers began looking for ways to
combine course presentation and materials to match the needs of each
student.
In 1978, Claxton and Ralston stated that learning style is an
individual’s typical way of reacting to and utilizing stimuli in the context of
learning (Claxton & Ralston, 1978, as cited in Bailey, Onwuegbuzie, and
27
Daley, 2000). In the following year a new definition was added to the
literature and Keefe (1979, as cited in Park, 2001) described the learning
style as cognitive, affective, and physiological characteristics that are
relatively stable indicators of how learners perceive, interact with, and
respond to the learning environment.
More recently, Davidson (1990) and DeBello (1990) suggested
that learning style refers to an individual's characteristic mode of acquiring,
processing, and storing information. Similarly, Felder and Henriques (1995)
described the learning style as the manner through which individuals
typically gain, retain, and retrieve information. In the same year, James and
Gardner (1995) defined learning style as the complex manner in which, and
conditions under which, learners most efficiently and most effectively
perceive, process, store, and recall what they are trying to learn.
As described by Vermunt (1996, 1998) learning style consists of
four aspects: processing strategies, regulation strategies, mental models of
learning and learning orientations. Processing strategies are thinking
activities students utilize to process information to obtain certain learning
outcomes like knowing the most important points in the study material
(Busato, Prins, Elshout, & Hamaker, 2000). Regulation strategies are the
activities learners use to monitor, to plan and to control the processing
strategies and their own learning process (Busato et al., 2000). Mental
models of learning are conceptions/misconceptions students have about
learning processes and learning orientations are personal aims, intentions,
28
expectations, doubts that students may experience during education (Busato
et al., 2000).
According to Dunn and Dunn (1993, as cited in Dunn &
Stevanson, 1997), learning style is the way each learner begins to
concentrate on, process, internalize, and remember new and difficult
academic information or skills.
Dunn and Dunn (1993) describe learning style in terms of each
individual’s ability to master new and difficult knowledge
1. Environmentally (with either sound versus quiet; soft versus bright light;
warm versus cool temperatures; or formal versus informal seating),
2. Emotionally (through consistent versus inconsistent motivation,
persistence, conformity or non-conformity, and either internally or
externally imposed structure),
3. Sociologically (alone, with peers, with either a collegial or authoritative
teacher, and/or with varied approaches as opposed to in patterns or
routines),
4. Physiologically (auditorially, visually, tactually, and/or kinesthetically;
with identifiable time-of-day energy highs and lows; with or without
intake; and by sitting for long periods of time versus by frequently
moving from one location to another),
5. Globally versus analytically as determined through correlations among
sound, light, design, persistence, sociological preference, and intake.
29
Learning style may also be thought of as ways learners
concentrate, process, internalize, and remember new and difficult academic
information or skills. Learning styles often show variations with age,
achievement level, culture, global versus analytic processing preference, and
gender (Shaughnessy, 1998).
While researchers may not agree with a common definition of
learning style, there appears to be some general agreement that a person’s
learning style is composed of a number of personality and environmental
traits (Williams, 2001).
2.2.2 Learning Theories
During the 20th century, there was a drastic shift in the views of the
learning theorists regarding human learning. In the first half of the century,
stimulus-response theories of human learning, developed by Watson and
Thorndike, were dominant. These theorists limited their measurements to
what was going into the brain (the stimulus) and what was coming out (the
response). However, such a simplistic model of learning left many
questions unanswered. In particular, this model could not explain what
Piaget had observed, ‘that children go through stages of development that
have no relation to external stimuli.’ (Kelly, 1997). Consequently, these
theories were replaced by more complex theories of learning in the second
half of the century. Cognitive and humanist theories were dominant during
the sixties and seventies. Proponents of these theories acknowledged the
30
importance of experience in the learning process, but they could not
formulate an adequate theory as to its function in learning. The works of
Kolb, Gregorc, Mezirow, and Freire all stressed that ‘the heart of all
learning lies in the way we process experience, in particular, our critical
reflection on experience’ (Kelly, 1997).
Today, a number of learning style models exists. These can be
classified as: personality models, information processing (cognitive)
models, social interaction models and instructional preference models
(Teixeira, 2001).
Different layers of an onion can be used to illustrate the various
learning styles. Personality models, which describe the fundamental
characteristics of personality, are found at the core of the onion. Information
processing models, which describe how learners tend to take in and process
information, form the second layer of the onion. Social interaction models,
which deals with how students tend to behave and interact in a classroom
environment, forms the third layer. Learning environment and instructional
preference models form the fourth and final layer (see Teixeira, 2001).
Regarding the stability of these various styles of learning Claxton
and Murrell state that the traits at the core are the most stable and thus are
least vulnerable to change in response to intervention by the researcher or
instructor. As level proceeds outward, the characteristics are less stable and
more likely to change (see Teixeira, 2001).
31
For the purpose of this study the information-processing model is
appropriate since the researcher is interested in the cognitive aspects of
students’ learning style. That is, how students take in and process
information.
2.2.3 Kolb’s Model for Learning Style and Experiential Learning Theory
The model developed by Kolb is one of the various information-
processing models. Kolb’s learning style model is based on the works of
Lewin, who emphasized that an student must be active in the learning
process; Piaget, who believed that intelligence was more a result of one’s
interaction with the environment and not so much innate; and Dewey, who
believed that learning is based on experience (Teixeira, 2001). His model
was developed from a specific learning theory called ‘experiential learning’.
The theory is called “Experiential Learning” to emphasize the key
role that experience plays in the learning process, an emphasis that
differentiates Experiential learning theory (ELT) from other learning
theories. The theory defines learning as the process whereby knowledge is
created through the transformation of experience. Knowledge results from
the combination of grasping and transforming experience.
In ELT model, learning is conceived as a four-stage cycle. Kolb
(1985) believes that people learn through experience, and as they learn they
move through this four-stage cycle. The stages are:
32
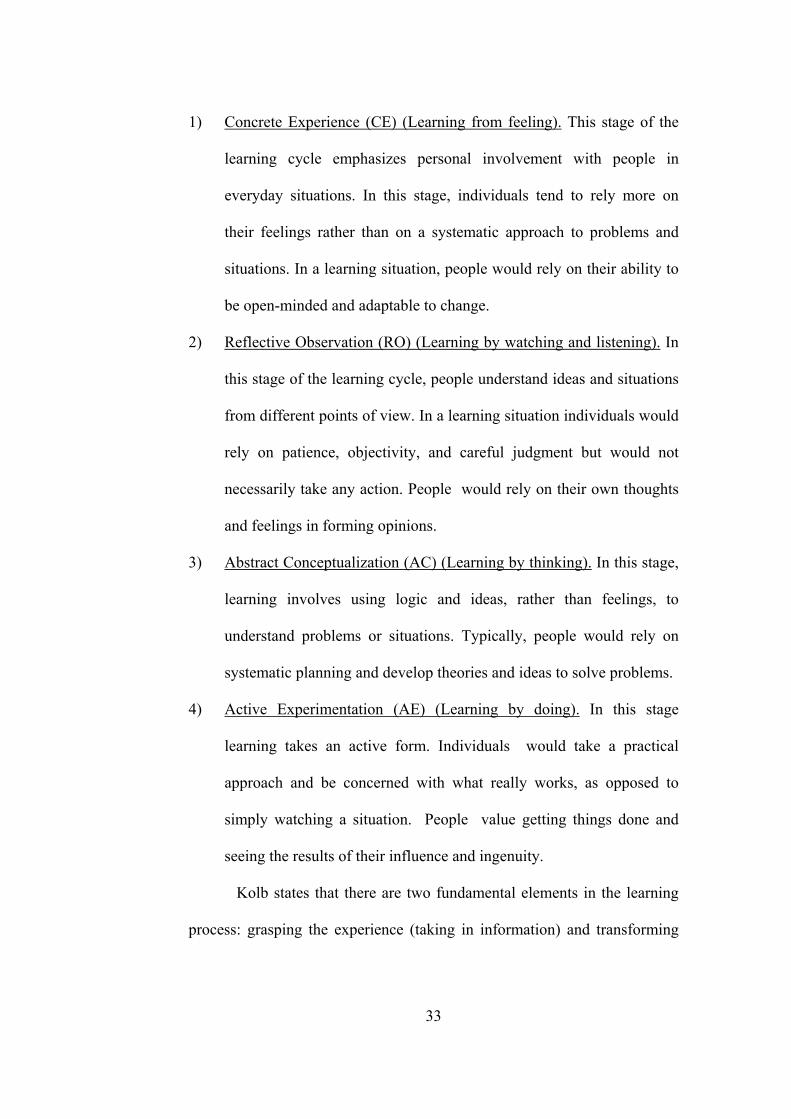
1) Concrete Experience (CE) (Learning from feeling). This stage of the
learning cycle emphasizes personal involvement with people in
everyday situations. In this stage, individuals tend to rely more on
their feelings rather than on a systematic approach to problems and
situations. In a learning situation, people would rely on their ability to
be open-minded and adaptable to change.
2) Reflective Observation (RO) (Learning by watching and listening). In
this stage of the learning cycle, people understand ideas and situations
from different points of view. In a learning situation individuals would
rely on patience, objectivity, and careful judgment but would not
necessarily take any action. People would rely on their own thoughts
and feelings in forming opinions.
3) Abstract Conceptualization (AC) (Learning by thinking). In this stage,
learning involves using logic and ideas, rather than feelings, to
understand problems or situations. Typically, people would rely on
systematic planning and develop theories and ideas to solve problems.
4) Active Experimentation (AE) (Learning by doing). In this stage
learning takes an active form. Individuals would take a practical
approach and be concerned with what really works, as opposed to
simply watching a situation. People value getting things done and
seeing the results of their influence and ingenuity.
Kolb states that there are two fundamental elements in the learning
process: grasping the experience (taking in information) and transforming
33
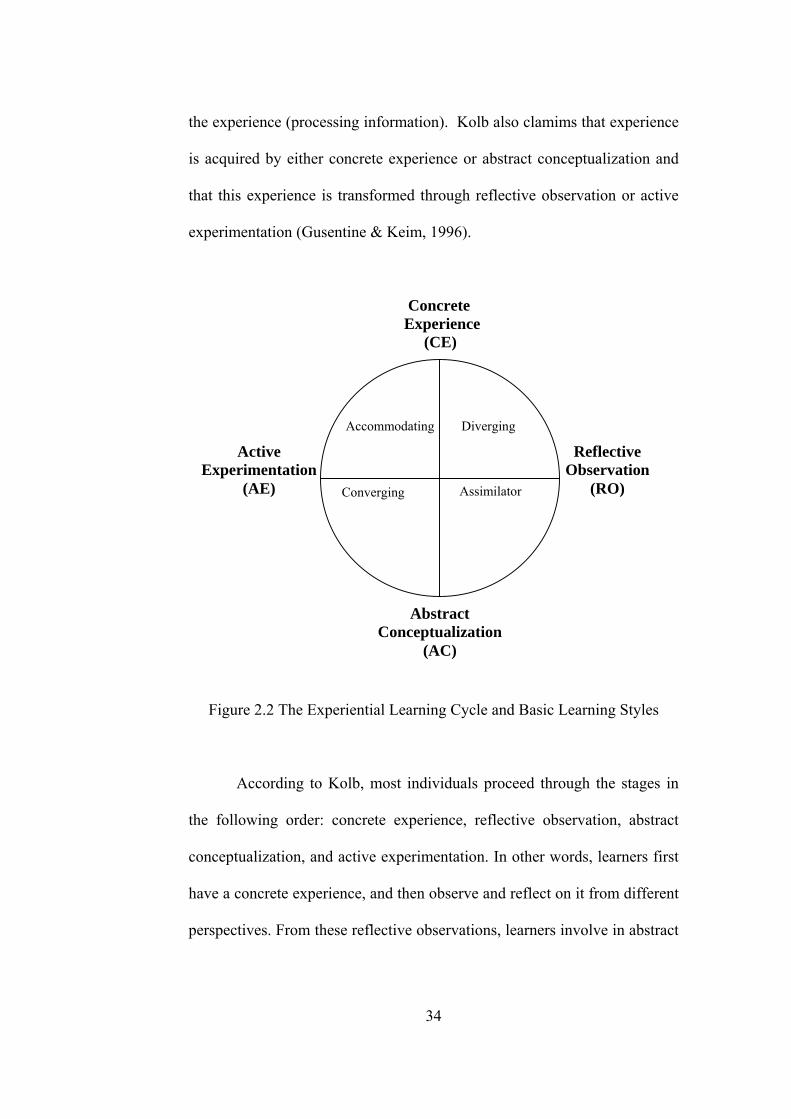
the experience (processing information). Kolb also clamims that experience
is acquired by either concrete experience or abstract conceptualization and
that this experience is transformed through reflective observation or active
experimentation (Gusentine & Keim, 1996).
Concrete Experience (CE)
Active Experimentation
(AE)
Accommodating D Assimilator
iverging
Converging
Reflective Observation
(RO)
Abstract Conceptualization
(AC)
Figure 2.2 The Experiential Learning Cycle and Basic Learning Styles
According to Kolb, most individuals proceed through the stages in
the following order: concrete experience, reflective observation, abstract
conceptualization, and active experimentation. In other words, learners first
have a concrete experience, and then observe and reflect on it from different
perspectives. From these reflective observations, learners involve in abstract
34
conceptualization, in which they form abstract concepts and generalizations
that integrate their observations into sound theories. Finally, they utilize
these theories to actively experiment, testing what they have learned in more
complex situations. This results in another concrete experience and the cycle
is repeated again. However, not every individual follows this sequence all
the time. The needs and the aims of the individual determine the direction
that learning takes.
In 1976, David Kolb developed the Learning Style Inventory (LSI)
in order to measure the learning style preferences defined by his theory of
experiential learning (Atkinson, 1991). In 1985, Kolb and his associates
revised the LSI to improve its psychometric properties (Atkinson, 1991).
With the revision, Kolb started a new phase of research in the attempt to
measure learning styles effectively according to experiential learning theory.
While people tested on the LSI show many different patterns of
scores, research on the instrument has identified four statistically prevailing
learning styles: Diverger, Assimilator, Converger, and Accommodator. In
his manual, Kolb (1985) describes individuals who fall into these four basic
learning style categories. Brief descriptions of the four basic learning styles
are presented below.
35
Diverger: The Diverging style’s dominant learning abilities are concrete
experience (CE) and reflective observation (RO). People with this learning
style grasp the experience through concrete experience and transform the
experience through reflective observation. Divergers are best at viewing
concrete situations from many different points of view. It is labeled as
“Diverging” because a person with it performs better in situations that call
for generation of ideas, such as a brainstorming session. People with a
Diverging learning style have broad cultural interests and like to gather
information. Research shows that they are interested in people, tend to be
imaginative and emotional, and tend to specialize in the arts. In formal
learning situations, people with the Diverging style prefer to work in groups,
listening with an open mind and receiving personalized feedback (Kolb,
1985).
Assimilator: The Assimilating style’s dominant learning abilities are
abstract conceptualization (AC) and reflective observation (RO). People
with this learning style grasp the experience through abstract
conceptualization and transform it through reflective observations.
Assimilators are best at understanding a wide range of information and
putting into concise, logical form. Individuals with an Assimilating style
are less focused on people and more interested in ideas and abstract
concepts. Generally, people with this style find it more important that a
theory have logical soundness than practical value. The Assimilating
36
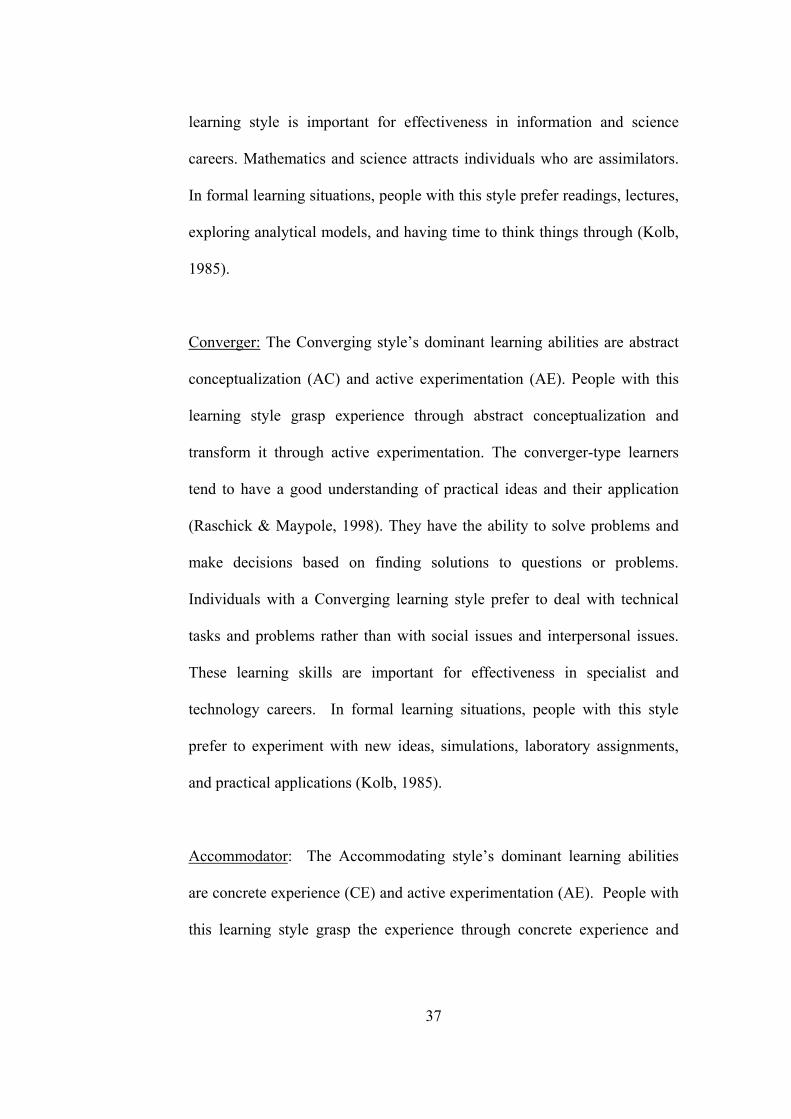
learning style is important for effectiveness in information and science
careers. Mathematics and science attracts individuals who are assimilators.
In formal learning situations, people with this style prefer readings, lectures,
exploring analytical models, and having time to think things through (Kolb,
1985).
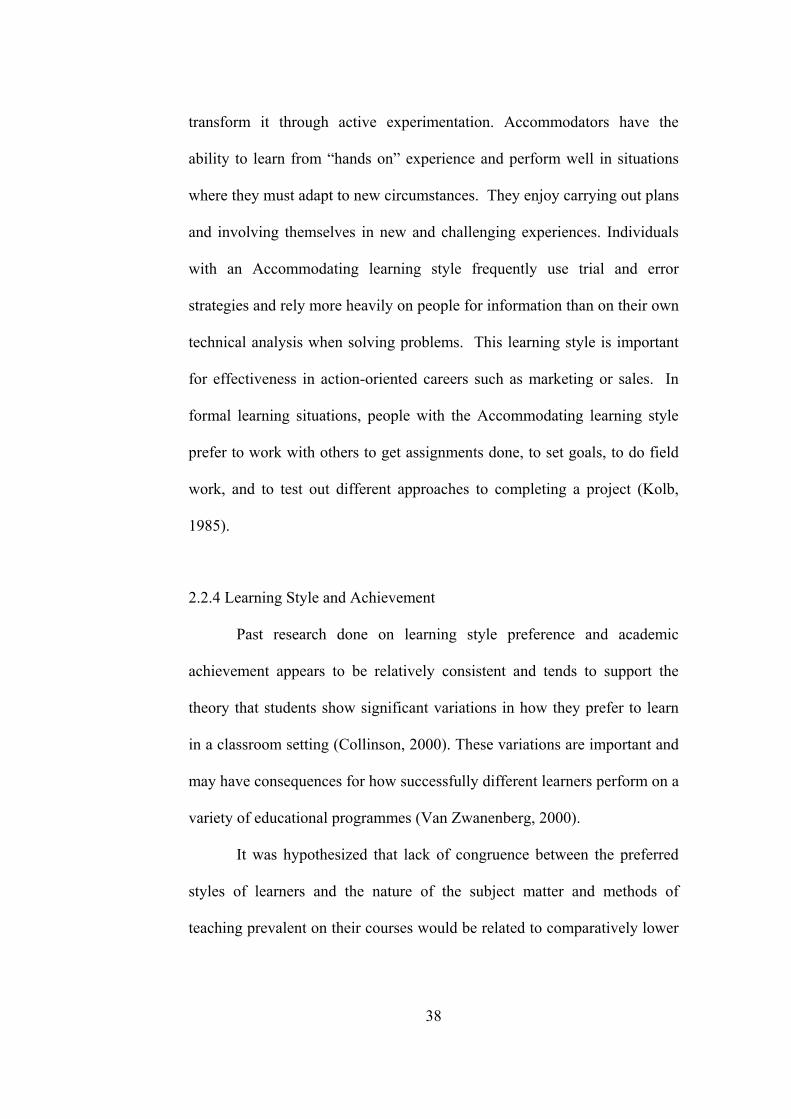
Converger: The Converging style’s dominant learning abilities are abstract
conceptualization (AC) and active experimentation (AE). People with this
learning style grasp experience through abstract conceptualization and
transform it through active experimentation. The converger-type learners
tend to have a good understanding of practical ideas and their application
(Raschick & Maypole, 1998). They have the ability to solve problems and
make decisions based on finding solutions to questions or problems.
Individuals with a Converging learning style prefer to deal with technical
tasks and problems rather than with social issues and interpersonal issues.
These learning skills are important for effectiveness in specialist and
technology careers. In formal learning situations, people with this style
prefer to experiment with new ideas, simulations, laboratory assignments,
and practical applications (Kolb, 1985).
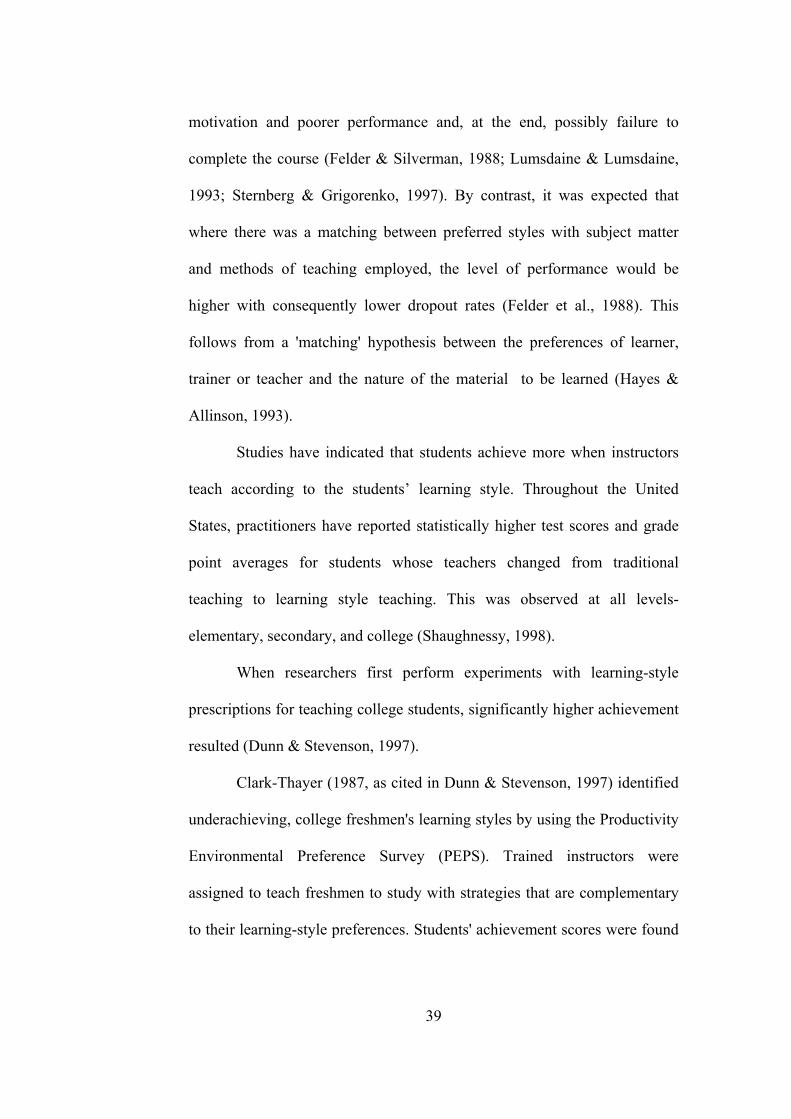
Accommodator: The Accommodating style’s dominant learning abilities
are concrete experience (CE) and active experimentation (AE). People with
this learning style grasp the experience through concrete experience and
37
transform it through active experimentation. Accommodators have the
ability to learn from “hands on” experience and perform well in situations
where they must adapt to new circumstances. They enjoy carrying out plans
and involving themselves in new and challenging experiences. Individuals
with an Accommodating learning style frequently use trial and error
strategies and rely more heavily on people for information than on their own
technical analysis when solving problems. This learning style is important
for effectiveness in action-oriented careers such as marketing or sales. In
formal learning situations, people with the Accommodating learning style
prefer to work with others to get assignments done, to set goals, to do field
work, and to test out different approaches to completing a project (Kolb,
1985).
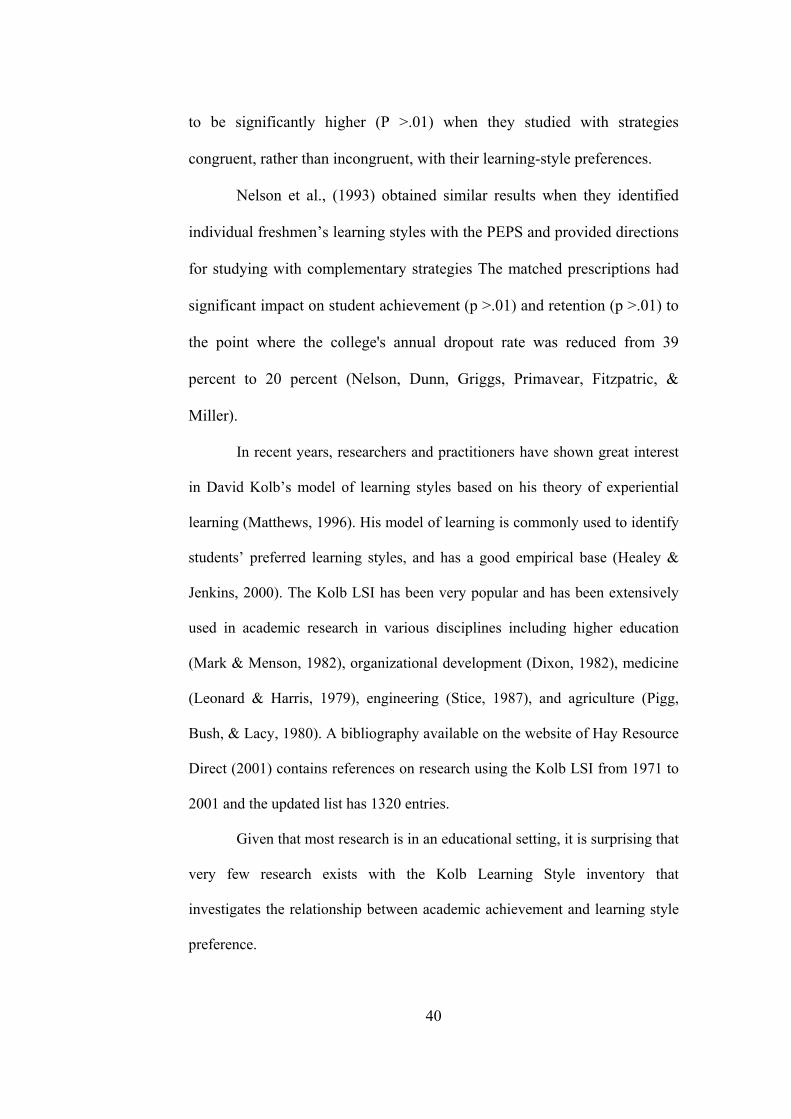
2.2.4 Learning Style and Achievement
Past research done on learning style preference and academic
achievement appears to be relatively consistent and tends to support the
theory that students show significant variations in how they prefer to learn
in a classroom setting (Collinson, 2000). These variations are important and
may have consequences for how successfully different learners perform on a
variety of educational programmes (Van Zwanenberg, 2000).
It was hypothesized that lack of congruence between the preferred
styles of learners and the nature of the subject matter and methods of
teaching prevalent on their courses would be related to comparatively lower
38
motivation and poorer performance and, at the end, possibly failure to
complete the course (Felder & Silverman, 1988; Lumsdaine & Lumsdaine,
1993; Sternberg & Grigorenko, 1997). By contrast, it was expected that
where there was a matching between preferred styles with subject matter
and methods of teaching employed, the level of performance would be
higher with consequently lower dropout rates (Felder et al., 1988). This
follows from a 'matching' hypothesis between the preferences of learner,
trainer or teacher and the nature of the material to be learned (Hayes &
Allinson, 1993).
Studies have indicated that students achieve more when instructors
teach according to the students’ learning style. Throughout the United
States, practitioners have reported statistically higher test scores and grade
point averages for students whose teachers changed from traditional
teaching to learning style teaching. This was observed at all levels-
elementary, secondary, and college (Shaughnessy, 1998).
When researchers first perform experiments with learning-style
prescriptions for teaching college students, significantly higher achievement
resulted (Dunn & Stevenson, 1997).
Clark-Thayer (1987, as cited in Dunn & Stevenson, 1997) identified
underachieving, college freshmen's learning styles by using the Productivity
Environmental Preference Survey (PEPS). Trained instructors were
assigned to teach freshmen to study with strategies that are complementary
to their learning-style preferences. Students' achievement scores were found
39
to be significantly higher (P >.01) when they studied with strategies
congruent, rather than incongruent, with their learning-style preferences.
Nelson et al., (1993) obtained similar results when they identified
individual freshmen’s learning styles with the PEPS and provided directions
for studying with complementary strategies The matched prescriptions had
significant impact on student achievement (p >.01) and retention (p >.01) to
the point where the college's annual dropout rate was reduced from 39
percent to 20 percent (Nelson, Dunn, Griggs, Primavear, Fitzpatric, &
Miller).
In recent years, researchers and practitioners have shown great interest
in David Kolb’s model of learning styles based on his theory of experiential
learning (Matthews, 1996). His model of learning is commonly used to identify
students’ preferred learning styles, and has a good empirical base (Healey &
Jenkins, 2000). The Kolb LSI has been very popular and has been extensively
used in academic research in various disciplines including higher education
(Mark & Menson, 1982), organizational development (Dixon, 1982), medicine
(Leonard & Harris, 1979), engineering (Stice, 1987), and agriculture (Pigg,
Bush, & Lacy, 1980). A bibliography available on the website of Hay Resource
Direct (2001) contains references on research using the Kolb LSI from 1971 to
2001 and the updated list has 1320 entries.
Given that most research is in an educational setting, it is surprising that
very few research exists with the Kolb Learning Style inventory that
investigates the relationship between academic achievement and learning style
preference.
40
In her study that was aimed to investigate the relationship of
perceived academic achievement and learning style preference in a large
representative sample of high school students, Matthews (1996) noted that,
learning style had a significant main effect on the perceived academic
achievement of students. Kolb’s learning style inventory was used to
determine students’ learning style. Students who selected the Converger
style of learning rated themselves as higher achievers than students who
selected the Diverger, Assimilator, or Accommodator styles. The results of
this study verify the findings of other researchers who used various learning
style instruments (Matthews, 1991; Miller, Alway & McKinley 1987;
Witkin, Moore, Goodenough, & Cox, 1977) to examine the relationship
between learning style and achievement. Even on self-ratings, a relationship
is present between learning style and academic achievement.
Cano-Garcia and Hewitt Hughes (2000) investigated whether the
students’ academic achievement can be predicted by their learning styles. A
learning style questionnaire, having the scales Concrete Experience,
Abstract Conceptualization, Reflective Observation, and Active
Experimentation, was administered to 220 college students. The results of
the study indicated that students' academic achievement and learning styles
were not independent; the students who obtained the best results preferred to
learn in a certain way. More specifically, those students showing a style of
learning directly related to experience (Concrete Experience), obtained
higher academic achievement. The Concrete Experience scale significantly
41
distinguishes between individuals with high or low academic achievement
(the first scored higher than the second on Concrete Experience) consistent
with a previous research (Cano & Justicia, 1994) which used the same
Learning Style Questionnaire and revealed that students with better
academic achievement scored higher in Concrete Experience, Abstract
Conceptualization, and Reflective Observation than those with poorer
academic achievement.
Lynch et al., (1998) conducted a study to determine if learning style
correlates with objective multiple-choice type measures of performance of
227 third-year medical students. The Kolb’s Learning Style Inventory was
used in order to measure the students’ preferences for different learning
style types. The analysis of variance indicated a statistically significant (p≤
0.05) relationship between learning style and performance. The results
showed that convergers and assimilators perform better on the multiple-
choice type measure of performance (Lynch, Woelfl, Steele, & Hanssen,
1998).
Although an extensive review of the literature has been carried out,
scarcely any reported research study using the Kolb LSI has been found
investigating the relationships between learning styles and science
achievement. The only reference came from the study of Çakır, Berberoğlu,
Alpsan, and Uysal (2002), in which they found that learning styles of tenth
grade students in an Anatolian High School in Ankara did not have an
observable effect on their biology performance.
42
2.3 Gender Differences in Science
It is well known that there are noticeable differences between
academic performance of girls and boys in science and mathematics.
According to National Assessment of Educational Progress (NAEP), data
from 1976 to 1990 indicate that a male advantage in science achievement
emerges and grows as learners progress through school: although gender
differences are small or even nonexistent in 9-year-olds, by the age of 17,
males significantly outperform females and this gender gap has known to be
existed as early as 1969 (NAEP, 1991, as cited in Greenfield, 1995).
Jones and Wheatley (1989), have stated that gender differences in
science achievement may be due to (a) innate differences in visual-spatial
abilities, (b) differential socialization experiences at home and at school, (c)
gender-role stereotypes, and (d) differences in boys’ and girls’ participation
in science within and outside the school. Research has clearly showed that
girls and boys do not seem to be receiving the same kinds of science-related
experiences in schools even when they enroll in the same classes
(Greenfield, 1996). For example, boys demand and receive more attention
from their teachers, they are allowed to give answers more often than girls,
they receive more process feedback than girls, and they are more likely to
use science equipment and perform science activities than girls (Jones &
Wheatley, 1989; Kahle & Lakes, 1983). Differences in science-related
experiences extend outside the classroom environment. It has been found
that girls are involved in much less out-of-school experience than boys with
43
many of the kinds of skills and experiences that can later serve to enhance
their interest and success in science, including exploration and assembly and
even tinkering with science-related hobbies, exploration of toys, and so
forth (Rennie, 1987, as cited in Greenfield, 1996).
Another possible reason of the observed gender difference may be
the motivational disparities among students. Dweck (1986) suggested that
girls are less likely than boys to develop a set of motivational traits that
facilitate achievement in science and mathematics at higher grade levels.
Dweck argued that girls are more likely than boys to exhibit a ‘learned
helpless’ response pattern, because girls usually lack confidence in their
abilities. As a result they show low persistence, attribute their failure to a
lack of ability, and exhibit deterioration in performance when they face a
difficulty or failure. Thus, motivational research suggests that girls may not
have the confidence or motivational characteristics needed to enhance their
learning in science and mathematics (Meece & Jones, 1996).
2.4 State of Science Education in Turkey
The number of science questions answered correctly in the
university entrance examination every year was considered as an evidence
of poor science education in Turkey. The mean values of correctly answered
questions in physics, chemistry, and biology between years 1996-2002 were
presented in Table 2.1. As indicated in Table 2.1, science achievement has
been very poor for many years in Turkey. It seems that the image is getting
44

even worse till 1999. Moreover, biology achievement appears to be the
lowest when the mean values of questions answered correctly in physics,
chemistry, and biology are compared.
Table 2.1 Mean Values of Correctly Answered Questions From Physics,
Chemistry, and Biology in the University Entrance Examinations Between
Years 1996-2001
Year Physics Chemistry Biology
1996 2.72 2.14 1.73
1997 5.27 6.07 3.36
1998 7.12 4.10 3.93
1999 1.65 1.25 0.65
2000 1.58 1.70 1.17
2001 2.15 1.39 0.61
45
CHAPTER 3
METHOD
In the previous chapters, problems and hypotheses of the study were
presented, related literature was reviewed accordingly and the significance
of the study was justified. In the following chapter, population and
sampling, description of the variables, instruments of the study, procedure,
and methods used to analyze data and assumptions and limitations will be
explained briefly.
3.1 Population and Sample
All tenth grade regular and Anatolian high school students attending
Mathematics and Science group in Turkey were identified as the target
population of this study. However, it is appropriate to define an accessible
population since it is not easy to come into contact with this target
population. The accessible population was determined as all tenth grade
regular and Anatolian high school students attending Mathematics and
Science group in Çankaya and Yenimahalle districts of Ankara. This is the
population which the results of the study will be generalized.
46
The population being sampled in this study was 13078 students
according to the Provincial Directorate of National Education in Ankara.
This population is composed of all tenth grade students attending
Mathematics-Science, Turkish-Mathematics, Turkish-Social Sciences, and
Foreign Languages groups in high schools. Accordingly, the desired sample
size was determined as 1300 students, which is approximately 10 % of the
whole population. But since the population being sampled includes students
attending all groups indicated above, a sample of 1000 students is thought to
be enough to represent the accessible population.
Cluster random sampling integrated with convenience sampling was
used to obtain representative sample. The two districts in Ankara from
which the sample of the study was chosen, were selected by convenience
sampling method. Schools which were thought as clusters were randomly
selected from each of these districts.
Table 3.1 presents number of schools throughout the districts,
number of selected schools throughout these districts and number of
students from each of the districts. An average of 90-100 students per school
corresponding to 2 or 3 classes were participated in the study.
47
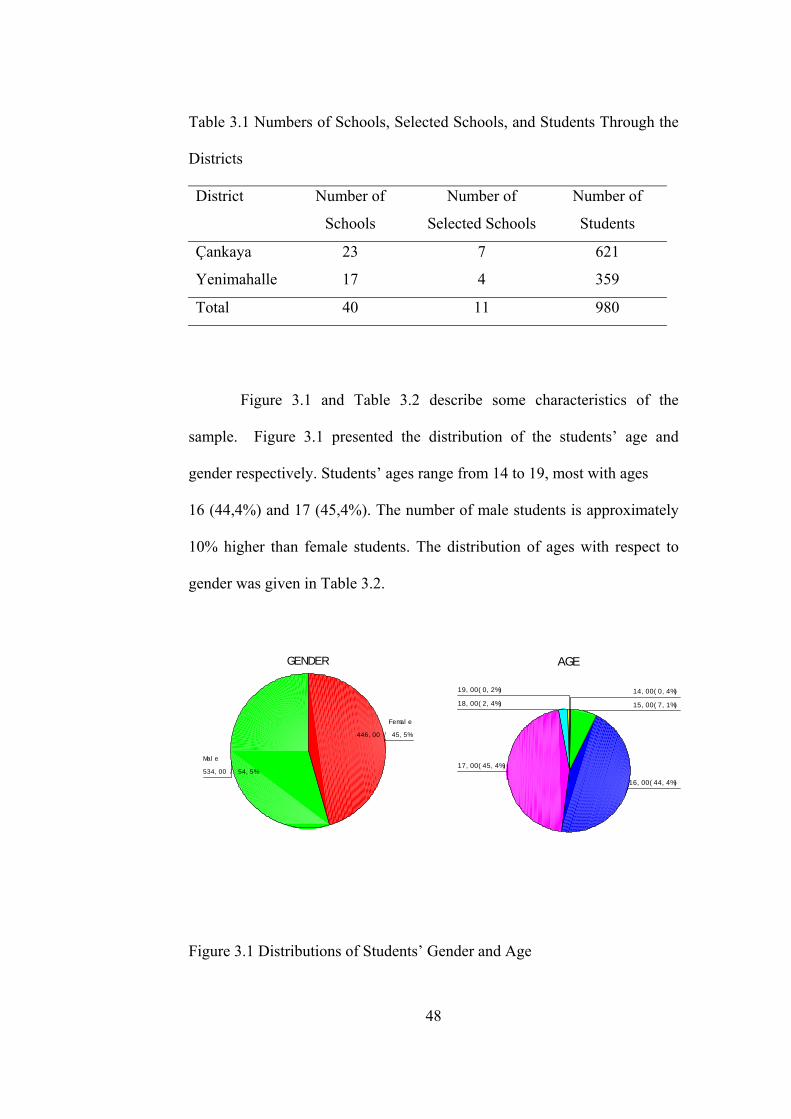
Table 3.1 Numbers of Schools, Selected Schools, and Students Through the
Districts
District Number of
Schools
Number of
Selected Schools
Number of
Students
Çankaya 23 7 621
Yenimahalle 17 4 359
Total 40 11 980
Figure 3.1 and Table 3.2 describe some characteristics of the
sample. Figure 3.1 presented the distribution of the students’ age and
gender respectively. Students’ ages range from 14 to 19, most with ages
16 (44,4%) and 17 (45,4%). The number of male students is approximately
10% higher than female students. The distribution of ages with respect to
gender was given in Table 3.2.
GENDER
534,00 / 54,5%
446,00 / 45,5%
Male
Female
AGE
19,00(0,2%)
18,00(2,4%)
17,00(45,4%)
16,00(44,4%)
15,00(7,1%)
14,00(0,4%)
Figure 3.1 Distributions of Students’ Gender and Age
48
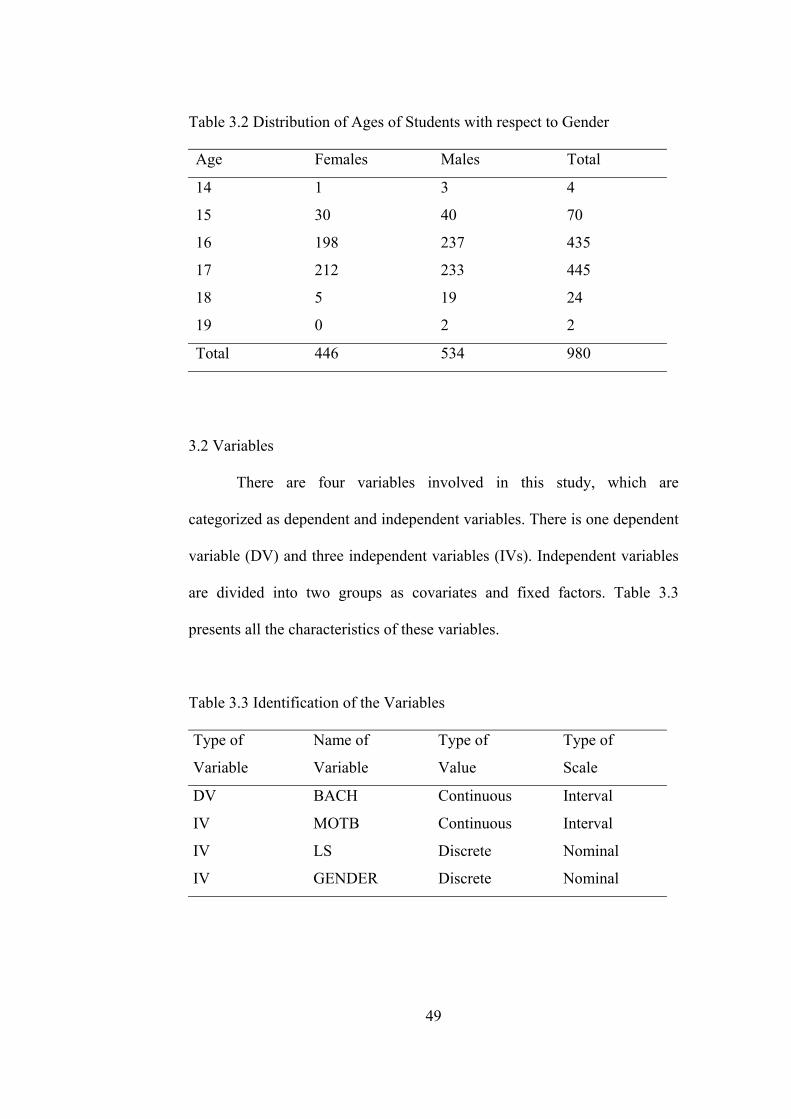
Table 3.2 Distribution of Ages of Students with respect to Gender
Age Females Males Total
14 1 3 4
15 30 40 70
16 198 237 435
17 212 233 445
18 5 19 24
19 0 2 2
Total 446 534 980
3.2 Variables
There are four variables involved in this study, which are
categorized as dependent and independent variables. There is one dependent
variable (DV) and three independent variables (IVs). Independent variables
are divided into two groups as covariates and fixed factors. Table 3.3
presents all the characteristics of these variables.
Table 3.3 Identification of the Variables
Type of
Variable
Name of
Variable
Type of
Value
Type of
Scale
DV BACH Continuous Interval
IV MOTB Continuous Interval
IV LS Discrete Nominal
IV GENDER Discrete Nominal
49
3.2.1 Dependent Variable
The dependent variable of the study is students’ biology
achievement test mean scores as measured by the biology achievement test.
It is a continuous variable and measured on interval scale. Students’
possible minimum and maximum scores range from 0 to 20 for this variable.
3.2.2 Independent Variables
The independent variables included in the study are gender,
motivational believes of students towards biology (MOTB), and learning
styles of students (LS). MOTB is considered as covariate, gender and LS are
considered as fixed factors in the analysis. MOTB is a continuous variable
and measured on interval scale. Gender and PLS are considered as discrete
variables and measured on nominal scale. Students’ gender was coded as
one for female and two for male. PLS was coded as one for Accommodator,
two for Diverger, three for Converger, and four for Assimilator.
3.3 Data Collection Instruments
In this study three instruments were used in order to obtain data from
students. These are the Turkish version of Motivated Strategies for Learning
Questionnaire (MSLQ-TV), Learning Style Inventory (LSI), and Biology
Achievement Test (BAT).
50
3.3.1 Motivated Strategies for Learning Questionnaire- Turkish Version
(MSLQ-TV)
Motivated Strategies for Learning Questionnaire (MSLQ) was
developed by Pintrich and De Groot (1990). It is a 44-item, self-report
measure which includes five subscales. Three subscales (Self-Efficacy,
Intrinsic Value, and Test Anxiety) in the questionnaire assess students’
motivational belief and two subscales (Cognitive Strategy Use and Self-
Regulation) measures students’ self-regulated learning. On this
questionnaire students are asked to respond each item by using a 7-point
Likert scale (1=not at all true of me to 7=very true of me) in terms of their
behavior in specific classes.
The items of the three subscales of the MSLQ (Self-Efficacy,
Intrinsic Value, and Test Anxiety) were adapted into Turkish in order to
assess students’ motivational belief.
The Self-Efficacy subscale (α=.79) consisted of seven items
regarding perceived competence and confidence in performance of class
work (e.g., ‘I expect to do very well in this class’). Students scoring high on
this subscale were sure they could learn and understand the material being
taught in the class and perform well in the class. The Intrinsic Value
subscale (α=.82) consisted of eleven items concerning intrinsic interest in
(e.g., ‘I think that what we are learning in this class is interesting’) and
perceived importance of class work (e.g., ‘It is important for me to learn
what is being taught in this class’) as well as preference and for challenge
51
and mastery goals (e.g., ‘I prefer class work that is challenging so I can
learn new things’). Students scoring high on this scale viewed the material
within a particular subject as personally useful, interesting, and important.
Test Anxiety subscale (α=.74) consisted of four items (e.g., ‘I worry a great
deal about tests’) concerning worry and cognitive interference on tests.
Higher scores on this scale reflected greater anxiety associated with tests
and classroom performance.
The questionnaire (MSLQ-TV) used in this study (see Appendix A)
is different from original one (MSLQ) in three ways. The first difference is
that, only three of the five subscales in the MSLQ were adapted and used in
this study. Second, the items in the MSLQ are field independent and not
specific to any class. For the purpose of this study however, all the items
were adapted in such a way that they all reflect student behavior in the
Biology class. The items were adapted in this fashion so that students were
all aware of the fact that the MBQ measures their behavior in the Biology
class, but not in any other class or not their behavior in general. The last
difference was the type of the Likert scale used. The original questionnaire
(MSLQ) is a 7-point Likert type, but the adapted form (MSLQ-TV) required
students’ responses to the items in a 5-point Likert scale.
52
3.3.2 Learning Style Inventory (LSI)
All research participants were administered the Turkish version of
the revised Learning Style Inventory (Kolb, 1985) that was translated and
standardized by Aşkar and Akkoyunlu (1993) (see Appendix B).
The Learning Style Inventory (Kolb, 1985) is a 12- item self-
reporting instrument in which individuals attempt to describe their learning
styles. The 12 items consist of short statements concerning learning
situations and each of the items asks respondents to rank four sentence
endings that correspond to the four learning modes- Concrete Experience
(whose characteristic word is feeling), Reflective Observation (watching),
Abstract Conceptualization (thinking), and Active Experimentation (doing).
The inventory measures the respondent’s relative emphasis on the
four modes of learning- Concrete Experience (CE), Reflective Observation
(RO), Abstract Conceptualization (AC), and Active Experimentation (AE).
The raw scores for each of the four learning modes ranges from 12 to 48.
Higher scores indicate greater emphasis on a particular learning mode. The
inventory also measures an individual’s relative emphasis across two
dimensions, CE versus AC and AE versus RO. These two dimensions bisect
on a learning style grid to form four quadrants reflecting four learning
styles: accommodator, diverger, assimilator, and converger (Figure 3.2). In
order to find the dominant learning style of an individual, the scores from
four learning modes are combined and subtracted. The combination score
(AC-CE) reflects the extent to which the respondent emphasizes
53

abstractness over concreteness. The score (AE-RO) indicates the extent to
which the respondent emphasizes action over reflection. The score of AC-
CE and AE-RO are then plotted on the learning style grid to determine the
learner’s dominant learning style is accommodating, diverging, converging
or assimilating.
Figure 3.2 Learning Style Grid
3.3.3 Biology Achievement Test (BAT)
The biology achievement of students was assessed by using the
Biology Achievement Test (BAT) (see Appendix C). The test was prepared
by making use of the biology questions taken from the University Entrance
Examinations between years 1981-2001 and consisted of 20 multiple-choice
54
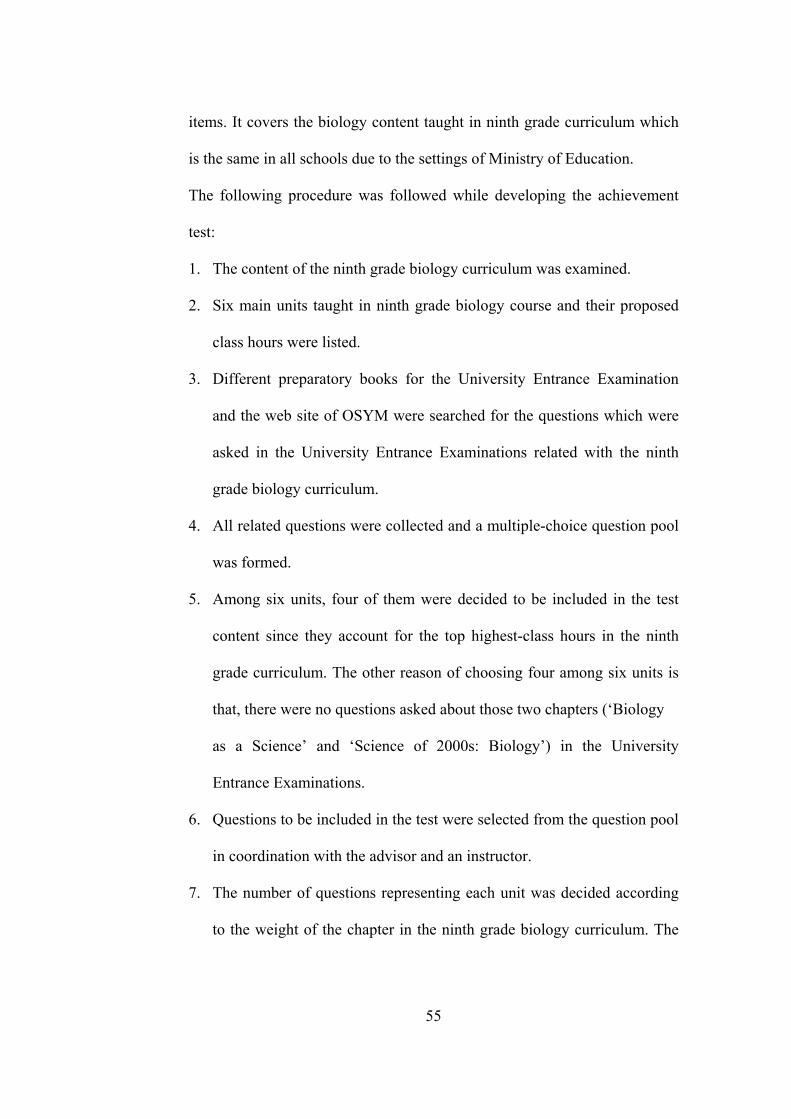
items. It covers the biology content taught in ninth grade curriculum which
is the same in all schools due to the settings of Ministry of Education.
The following procedure was followed while developing the achievement
test:
1. The content of the ninth grade biology curriculum was examined.
2. Six main units taught in ninth grade biology course and their proposed
class hours were listed.
3. Different preparatory books for the University Entrance Examination
and the web site of OSYM were searched for the questions which were
asked in the University Entrance Examinations related with the ninth
grade biology curriculum.
4. All related questions were collected and a multiple-choice question pool
was formed.
5. Among six units, four of them were decided to be included in the test
content since they account for the top highest-class hours in the ninth
grade curriculum. The other reason of choosing four among six units is
that, there were no questions asked about those two chapters (‘Biology
as a Science’ and ‘Science of 2000s: Biology’) in the University
Entrance Examinations.
6. Questions to be included in the test were selected from the question pool
in coordination with the advisor and an instructor.
7. The number of questions representing each unit was decided according
to the weight of the chapter in the ninth grade biology curriculum. The
55
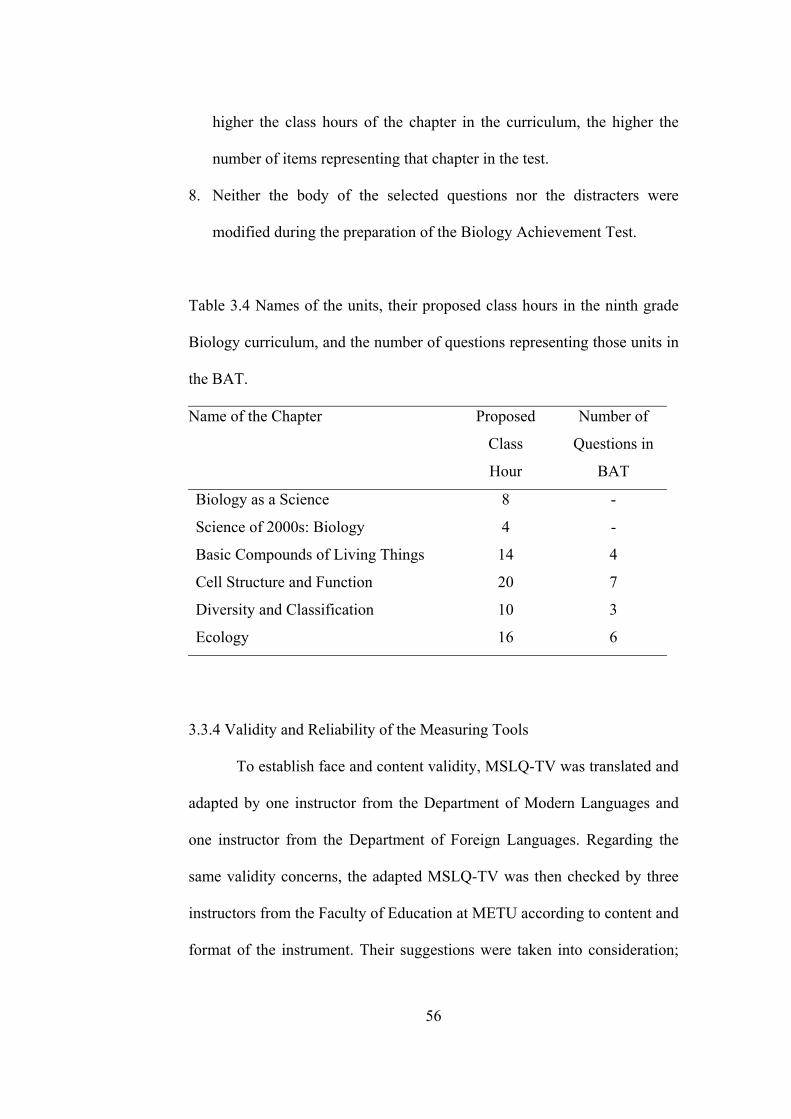
higher the class hours of the chapter in the curriculum, the higher the
number of items representing that chapter in the test.
8. Neither the body of the selected questions nor the distracters were
modified during the preparation of the Biology Achievement Test.
Table 3.4 Names of the units, their proposed class hours in the ninth grade
Biology curriculum, and the number of questions representing those units in
the BAT.
Name of the Chapter Proposed
Class
Hour
Number of
Questions in
BAT
Biology as a Science 8 -
Science of 2000s: Biology 4 -
Basic Compounds of Living Things 14 4
Cell Structure and Function 20 7
Diversity and Classification 10 3
Ecology 16 6
3.3.4 Validity and Reliability of the Measuring Tools
To establish face and content validity, MSLQ-TV was translated and
adapted by one instructor from the Department of Modern Languages and
one instructor from the Department of Foreign Languages. Regarding the
same validity concerns, the adapted MSLQ-TV was then checked by three
instructors from the Faculty of Education at METU according to content and
format of the instrument. Their suggestions were taken into consideration;
56

the necessary changing was done accordingly and the final revision of the
questionnaire was prepared.
During the pilot study, MSLQ-TV, containing three subscales and 22
items, was administered to 238 tenth grade students from two schools. The
data were collected and a factor analysis together with a reliability analysis
was performed. Factor analysis based on data from 238 students revealed
that the items of the adapted questionnaire were fit to three distinct
motivational factors (self-efficacy, intrinsic value, and test anxiety) when
factor number is limited. Internal reliability coefficient of the questionnaire
was obtained as .88 by using Cronbach alpha coefficient. The reliability
coefficients of the self-efficacy, intrinsic value, and test anxiety subscales
are .79, .82, and .74 respectively. All items of the questionnaire have
discriminating powers more than .20 which means that all items were
discriminating high and low motivational believes successfully.
Reliability analysis was also performed for the BAT and internal
reliability of the test was calculated as .70. As a result, the validity and
reliability estimates for MSLQ-TV and BAT imply that the scores obtained
on these tests can be considered as valid and reliable.
57
3.4 Procedure
The study started with defining the research problem specifically and
formulating the search terms pertinent to the problem of interest. Next, the
related literature was reviewed in detail. Previous studies done abroad were
searched systematically from Educational Resources Information Center
(ERIC), International Dissertation Abstracts, Ebscohost, Social Science
Citation Index (SSCI), and Science Direct. MS and PhD thesis made in
Turkey were also searched from YOK, Eğitim ve Bilim Dergisi, and
Hacettepe Eğitim Dergisi. Photocopies of available documents were
obtained from METU library, library of Bilkent University and TUBITAK
Ulakbim. Moreover, some of the documents that could not be reached were
requested from abroad. All of the relevant documents were organized and
read carefully by the researcher.
After a detailed review of literature, the measuring instruments were
prepared. Following the selection of the schools which will be involved in
the study, necessary permission was taken from the Ministry of Education
for the administration of the measuring instruments.
In November 2002, MSLQ-TV was pilot tested with a sample of 238
tenth grade students from two representative schools. The results of the pilot
study were analyzed and evaluated by the researcher.
The researcher administered all of the measuring instruments
(MSLQ-TV, LSI, and BAT) to the selected 980 tenth grade students from
11 schools during the last four weeks of the fall 2002-2003 semester. One
58

class hour was given to the participants to complete all instruments.
Directions were made clear and necessary explanations were done by the
researcher. Students were also assured that any data collected from them
would be held in confidence and that the grades of the BAT would not
effect their biology grades. They were warned to complete each measuring
tool without leaving any empty item as well.
Due to the time restriction and impossibility of being present in each
class during administration, the researcher occasionally requested teacher
support. The teachers were informed about the study and about the
directions that should be done prior to the administration. No specific
problems were encountered during the administration of the measuring
instruments.
3.5 Analysis of Data
The data obtained in the study were analyzed by using both
descriptive statistics and inferential statistics.
3.5.1 Descriptive Statistics
The mean, median, mode, standard deviation, skewness, kurtosis and
histograms of the variables were presented.
3.5.2 Inferential Statistics
In order to test the null hypotheses, statistical technique named
Analysis of Covariance (ANCOVA) and Bivariate Correlations were used.
59
3.6 Power Analysis
An essential and primary decision in the power analysis is the
determination of the effect size. The ratio of explained variance to
unexplained variance should be preset before the study. At the beginning of
the study, effect size was set to low (f2= 0.08 for variance and 0.3 for mean
differences). The significance level was set to .05 since it is the mostly used
value in educational statistics. Therefore, the probability of rejecting the true
null hypothesis (probability of making Type-1 error) was set to .05. The
power was calculated for the sample (N=980) and four variables involved in
the study. Power was found as close to 1. Therefore, the probability of
failing to reject a false null hypothesis (probability of making Type-2 error)
was calculated as approximately 0.
3.7 Assumptions and Limitations of the Study
As in any research study, several considerations may affect the
overall findings, or effective usefulness of the results. The following
assumptions and limitations should serve to enrich the conclusions of this
study by identifying both positive and negative aspects of the basic study’s
design.
60
3.7.1 Assumptions of the Study
The researcher made the following assumptions for this study:
1. Multiple survey method was best for obtaining a large amount of
information quickly and easily. Thus, all information-gathering
instruments were administered at the same time.
2. The administration of the instruments was under standard conditions.
3. The students of the pilot study were assumed to have approximately the
same characteristics as the actual subjects of the study.
4. Reducing the fear of personal exposure would be important in obtaining
the most reliable self-report measures possible. Thus, a numeral coding
system was used rather than names to ensure anonymity.
5. Multiple visits to the schools would be a problem, and that all data
should be obtained in a single session. Thus, optimum cooperation of
subjects and school personnel was ensured prior to test administration.
6. All cooperated instructors were pleased, as they were able to support
educational research. Therefore, instructors were expected to be
sincerely involved in the study.
7. All students involved in the study responded sincerely and correctly to
the items of the BAT, LSI, and MBQ.
61
3.7.2 Limitations of the Study
The study was subjected to the following limitations:
1. The timing of the conduct of measuring instruments was less than
optimal since all data should be obtained in a single class hour.
2. Learner characteristics (e.g., demographic variables, family
characteristics, health related factors, financial insecurity etc.) were not
considered beyond the determination of the learner’s learning style,
motivation and biology achievement.
3. The entry behaviors of the respondents such as depression, anxiety,
attention-defect, or hyperactivity were not examined. While these
behaviors can play a major role on the learner’s achievement, the
determination of these behaviors is beyond the scope of this study, and
would be worthy of a future study.
4. The teaching styles of the instructors were not measured during the
study. While it is recognized that the teaching style employed by the
instructor has a significant impact on the learning outcome, there was no
opportunity to modify or experiment with different teaching styles.
Therefore, teaching style was not evaluated during the study.
62
CHAPTER 4
RESULTS
This chapter is divided into four different sections. First section
deals with the descriptive statistics. The second section summarizes the
results of the factor analysis of the items of the Turkish version of
Motivated Strategies for Learning Questionnaire (MSLQ-TV). The third
section presents inferential statistics in which the null hypotheses are tested.
Finally, the last section summarizes the findings of the study.
4.1 Descriptive Statistics
4.1.1 Descriptive Statistics of the Biology Achievement Test
Descriptive statistics related to students’ scores on the Biology
Achievement Test (BAT) were categorized according to students’ gender
and presented in Table 4.1. Scores could range from 0 to 20 in which higher
scores mean greater biology achievement. As Table 4.1 indicated, both male
and female students had approximately close mean values but scores favor
female students more than males’ students. Female students had a mean of
10.10 from achievement scores while male students had a mean of 9.55,
which means that female students’ biology achievement is slightly higher
63
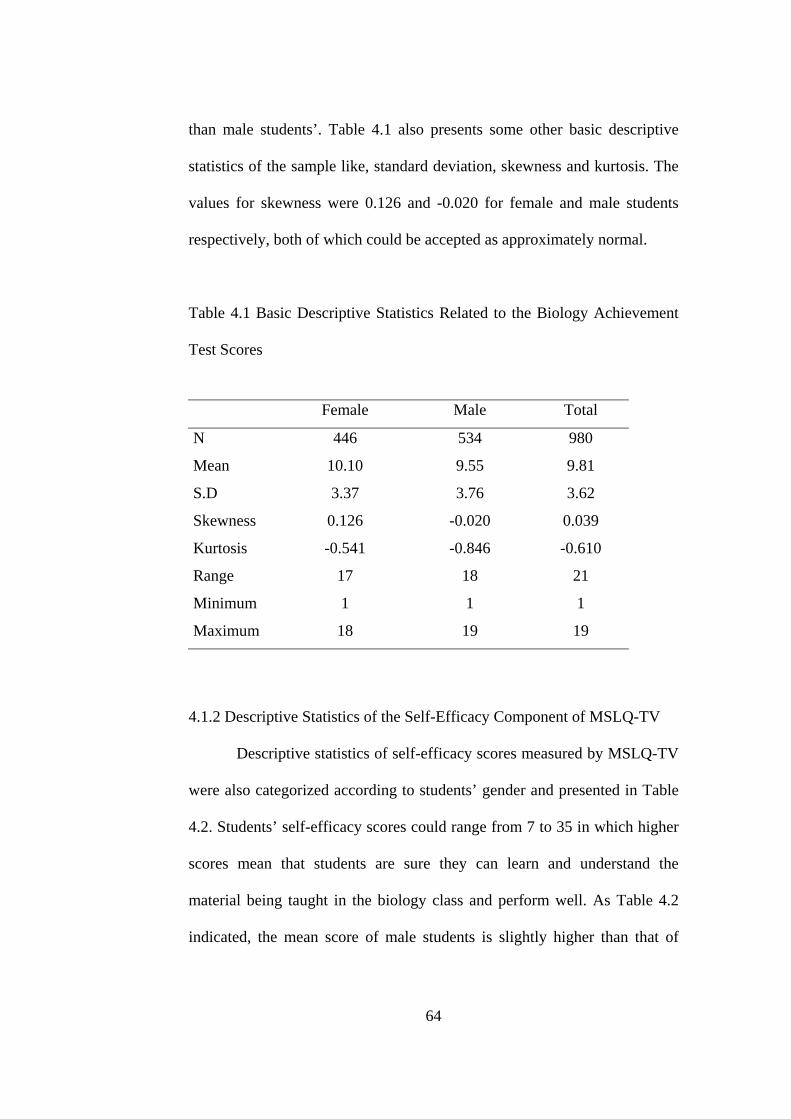
than male students’. Table 4.1 also presents some other basic descriptive
statistics of the sample like, standard deviation, skewness and kurtosis. The
values for skewness were 0.126 and -0.020 for female and male students
respectively, both of which could be accepted as approximately normal.
Table 4.1 Basic Descriptive Statistics Related to the Biology Achievement
Test Scores
Female Male Total
N 446 534 980
Mean 10.10 9.55 9.81
S.D 3.37 3.76 3.62
Skewness 0.126 -0.020 0.039
Kurtosis -0.541 -0.846 -0.610
Range 17 18 21
Minimum 1 1 1
Maximum 18 19 19
4.1.2 Descriptive Statistics of the Self-Efficacy Component of MSLQ-TV
Descriptive statistics of self-efficacy scores measured by MSLQ-TV
were also categorized according to students’ gender and presented in Table
4.2. Students’ self-efficacy scores could range from 7 to 35 in which higher
scores mean that students are sure they can learn and understand the
material being taught in the biology class and perform well. As Table 4.2
indicated, the mean score of male students is slightly higher than that of
64

female students. While the male students had a mean of 24.39, female
students had a mean value of 23.31. Table 4.2 also presents some other
basic descriptive statistics about the self-efficacy subscale of the MSLQ-
TV.
Table 4.2 Basic Descriptive Statistics Related to the Self-Efficacy Scores Gender Female Male Total
N 446 534 980
Mean 23.31 24.39 24.81
S.D 4.34 4.58 4.49
Skewness -0.247 -0.365 -0.347
Kurtosis 0.099 0.494 0.353
Range 23 27 27
Minimum 12 8 8
Maximum 35 35 35
4.1.3 Descriptive Statistics of the Intrinsic Value Component of MSLQ-TV
Table 4.3 presents descriptive statistics of intrinsic value scores that
was measured by MSLQ-TV and categorized according to students’ gender.
Students’ intrinsic value scores could range from 11 to 55 in which higher
scores mean that students view biology as personally useful, interesting, and
important. According to the Table 4.3, female students mean score (44.06)
is higher than the mean score of male students (40.31). Table 4.3 also
65
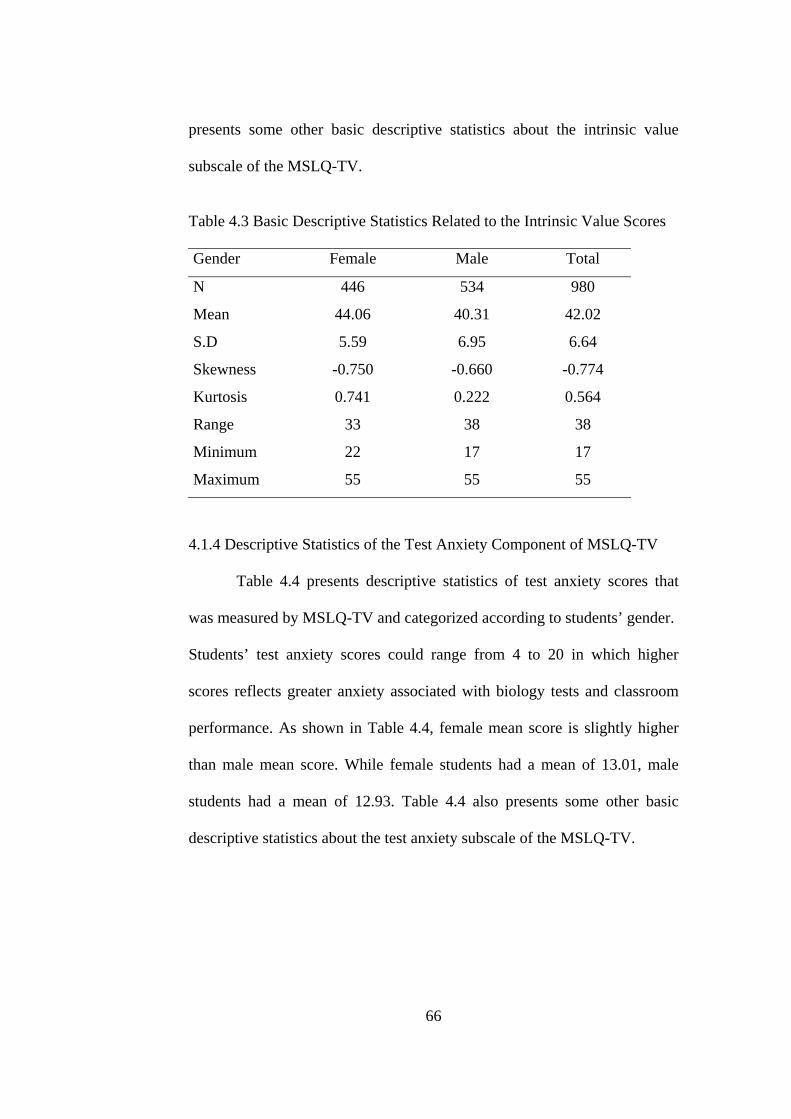
presents some other basic descriptive statistics about the intrinsic value
subscale of the MSLQ-TV.
Table 4.3 Basic Descriptive Statistics Related to the Intrinsic Value Scores Gender Female Male Total
N 446 534 980
Mean 44.06 40.31 42.02
S.D 5.59 6.95 6.64
Skewness -0.750 -0.660 -0.774
Kurtosis 0.741 0.222 0.564
Range 33 38 38
Minimum 22 17 17
Maximum 55 55 55
4.1.4 Descriptive Statistics of the Test Anxiety Component of MSLQ-TV
Table 4.4 presents descriptive statistics of test anxiety scores that
was measured by MSLQ-TV and categorized according to students’ gender.
Students’ test anxiety scores could range from 4 to 20 in which higher
scores reflects greater anxiety associated with biology tests and classroom
performance. As shown in Table 4.4, female mean score is slightly higher
than male mean score. While female students had a mean of 13.01, male
students had a mean of 12.93. Table 4.4 also presents some other basic
descriptive statistics about the test anxiety subscale of the MSLQ-TV.
66

Table 4.4 Basic Descriptive Statistics Related to the Test Anxiety Scores Gender Female Male Total
N 446 534 980
Mean 13.01 12.93 12.97
S.D 3.77 3.60 3.68
Skewness -0.393 -0.156 -0.270
Kurtosis -0.504 -0.463 -0.488
Range 16 17 17
Minimum 4 3 3
Maximum 20 20 20
Figure 4.1, Figure 4.2, Figure 4.3, and Figure 4.4 show the
histograms with normal curves related to the biology achievement test
scores (BACH), self-efficacy scores (SES), intrinsic value scores (IVS), and
test anxiety scores (TAS). These are also an evidence for the normal
distribution of those variables.
Biology Achievement Test Scores (BACH)
20,017,515,012,510,07,55,02,50,0
Freq
uenc
y D
istri
butio
n
300
200
100
0
Std. Dev = 3,60 Mean = 9,8
N = 980,00
Figure 4.1 Histogram with normal curve related to BACH
67
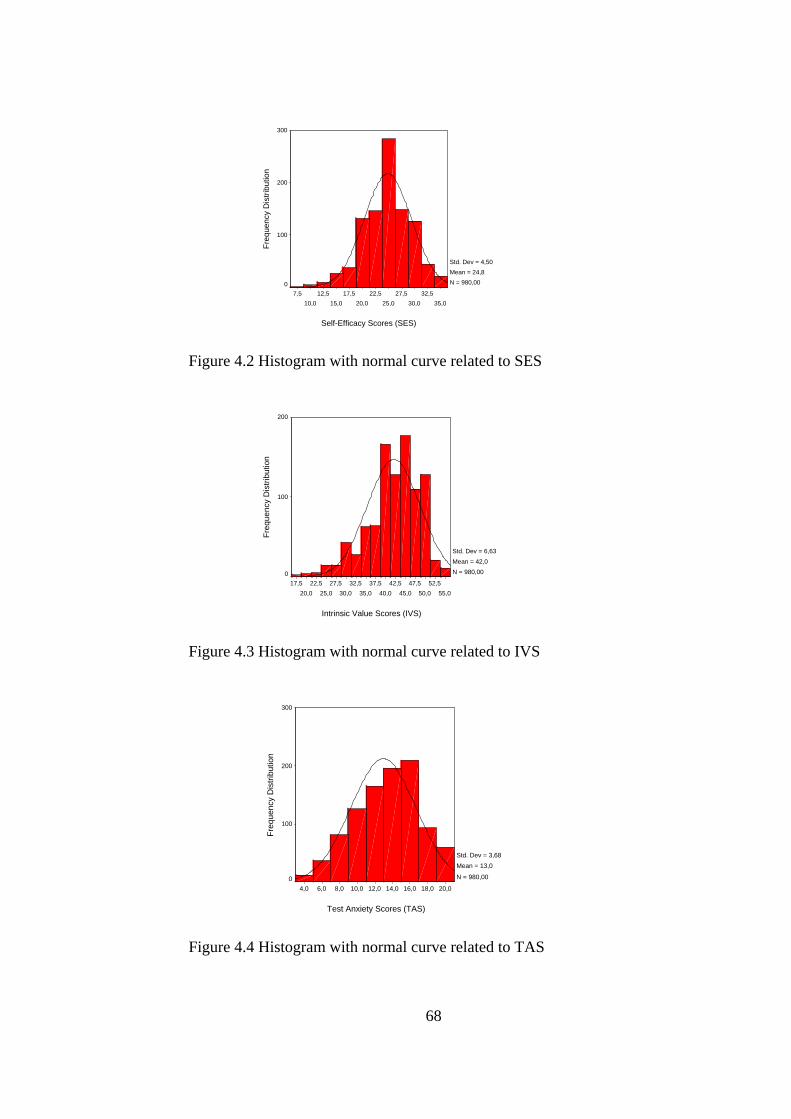
Self-Efficacy Scores (SES)
35,032,5
30,027,5
25,022,5
20,017,5
15,012,5
10,07,5
Freq
uenc
y D
istri
butio
n
300
200
100
0
Std. Dev = 4,50 Mean = 24,8N = 980,00
Figure 4.2 Histogram with normal curve related to SES
Intrinsic Value Scores (IVS)
55,052,5
50,047,5
45,042,5
40,037,5
35,032,5
30,027,5
25,022,5
20,017,5
Freq
uenc
y D
istri
butio
n
200
100
0
Std. Dev = 6,63 Mean = 42,0N = 980,00
Figure 4.3 Histogram with normal curve related to IVS
Test Anxiety Scores (TAS)
20,018,016,014,012,010,08,06,04,0
Freq
uenc
y D
istri
butio
n
300
200
100
0
Std. Dev = 3,68 Mean = 13,0
N = 980,00
Figure 4.4 Histogram with normal curve related to TAS
68
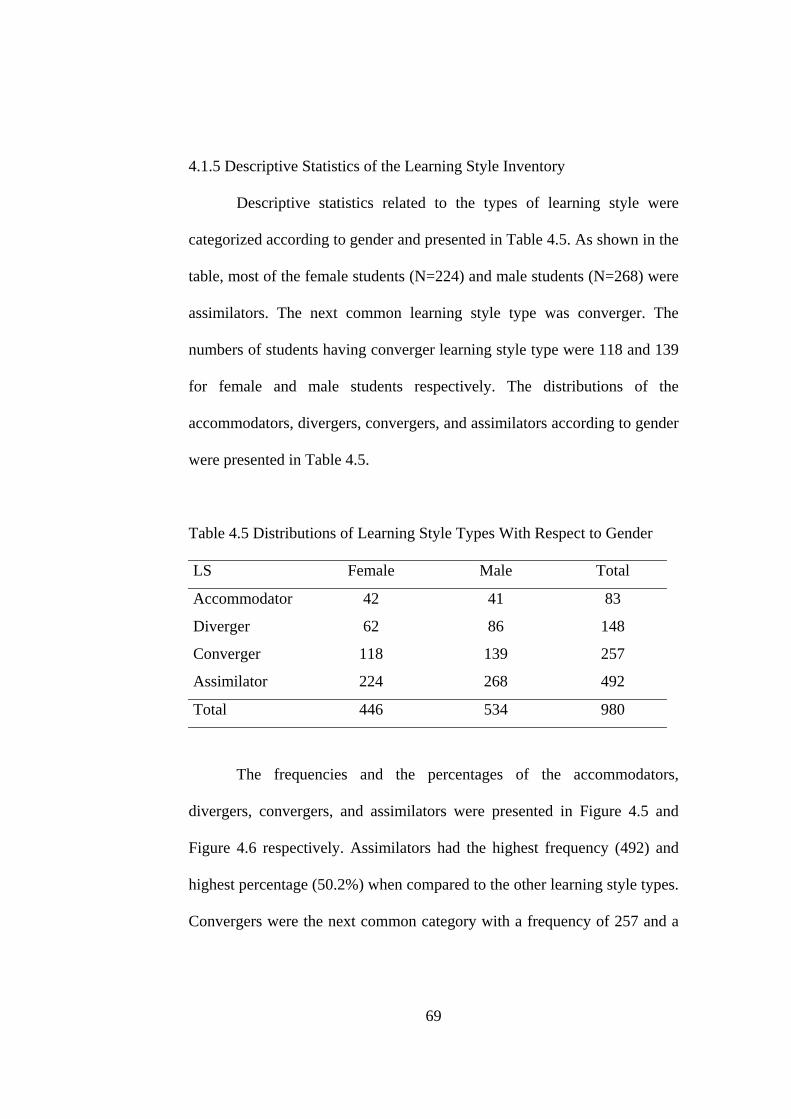
4.1.5 Descriptive Statistics of the Learning Style Inventory
Descriptive statistics related to the types of learning style were
categorized according to gender and presented in Table 4.5. As shown in the
table, most of the female students (N=224) and male students (N=268) were
assimilators. The next common learning style type was converger. The
numbers of students having converger learning style type were 118 and 139
for female and male students respectively. The distributions of the
accommodators, divergers, convergers, and assimilators according to gender
were presented in Table 4.5.
Table 4.5 Distributions of Learning Style Types With Respect to Gender
LS Female Male Total
Accommodator 42 41 83
Diverger 62 86 148
Converger 118 139 257
Assimilator 224 268 492
Total 446 534 980
The frequencies and the percentages of the accommodators,
divergers, convergers, and assimilators were presented in Figure 4.5 and
Figure 4.6 respectively. Assimilators had the highest frequency (492) and
highest percentage (50.2%) when compared to the other learning style types.
Convergers were the next common category with a frequency of 257 and a
69
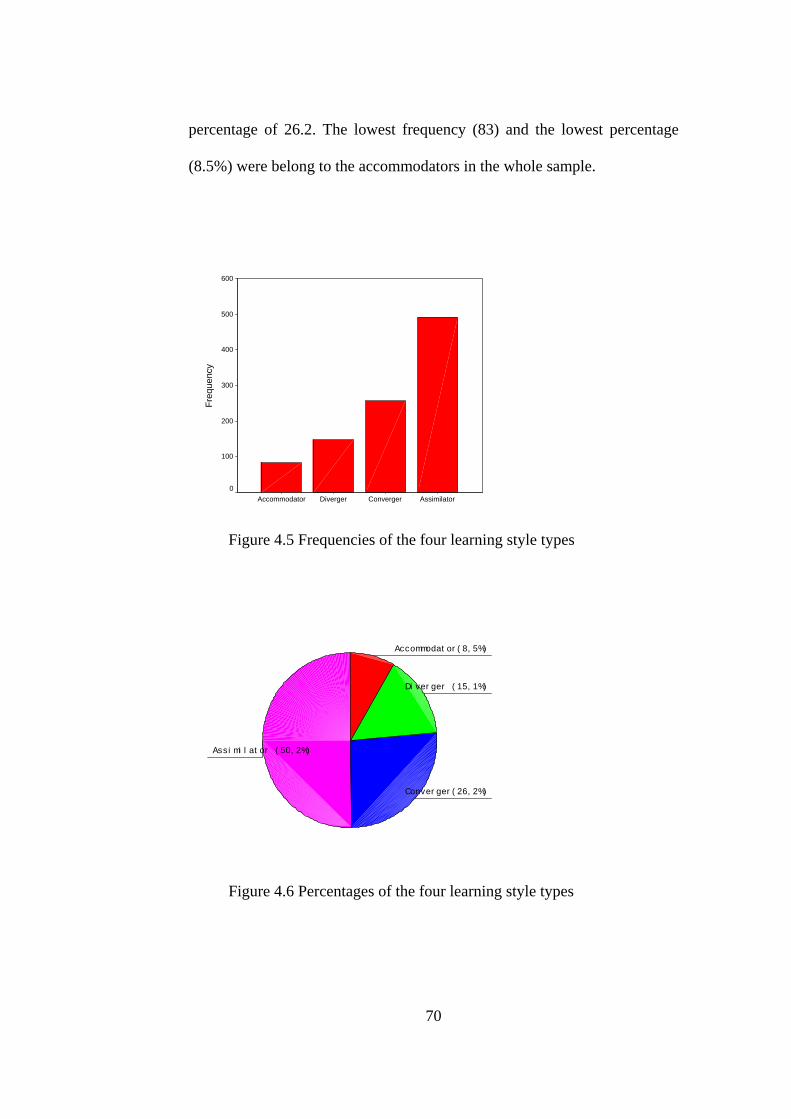
percentage of 26.2. The lowest frequency (83) and the lowest percentage
(8.5%) were belong to the accommodators in the whole sample.
AssimilatorConvergerDivergerAccommodator
Freq
uenc
y
600
500
400
300
200
100
0
Figure 4.5 Frequencies of the four learning style types
Assimilator (50,2%)
Converger(26,2%)
Diverger (15,1%)
Accommodator(8,5%)
Figure 4.6 Percentages of the four learning style types
70
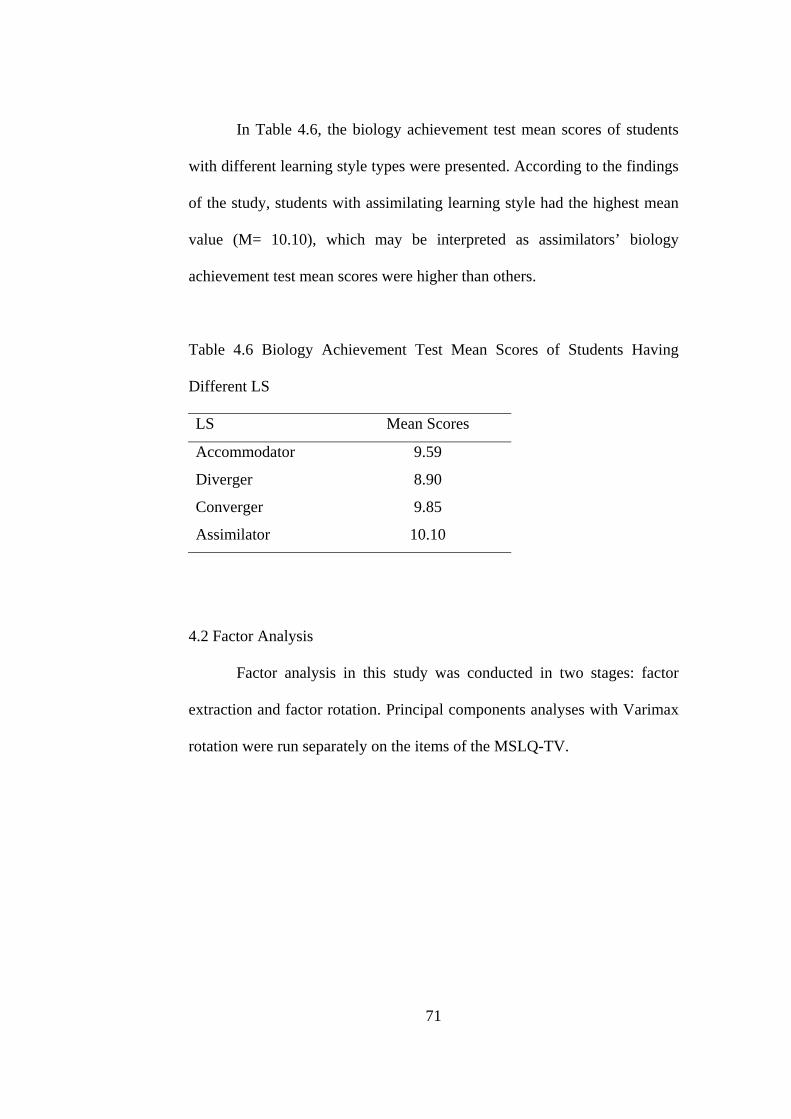
In Table 4.6, the biology achievement test mean scores of students
with different learning style types were presented. According to the findings
of the study, students with assimilating learning style had the highest mean
value (M= 10.10), which may be interpreted as assimilators’ biology
achievement test mean scores were higher than others.
Table 4.6 Biology Achievement Test Mean Scores of Students Having
Different LS
LS Mean Scores
Accommodator 9.59
Diverger 8.90
Converger 9.85
Assimilator 10.10
4.2 Factor Analysis
Factor analysis in this study was conducted in two stages: factor
extraction and factor rotation. Principal components analyses with Varimax
rotation were run separately on the items of the MSLQ-TV.
71
4.2.1 Factor Extraction
In order to decide the number of extracted factors, eigenvalues based
on the principal components solution were obtained. The results showing
the initial factor extraction statistics and the scree plot from the principal
components analysis were shown in Table 4.7 and Figure 4.7 respectively.
One criterion to decide the number of components is to retain all
factors that have eigenvalues greater than one. As indicated in Table 4.7,
only five of the components have eigenvalues greater than one. Another
criterion is to examine the plot of eigenvalues (scree plot) and to retain all
factors with eigenvalues in the sharp descent part of the plot before the
eigenvalues start to level off. Based on the Figure 4.7, three of the factors
were decided to be rotated.
72
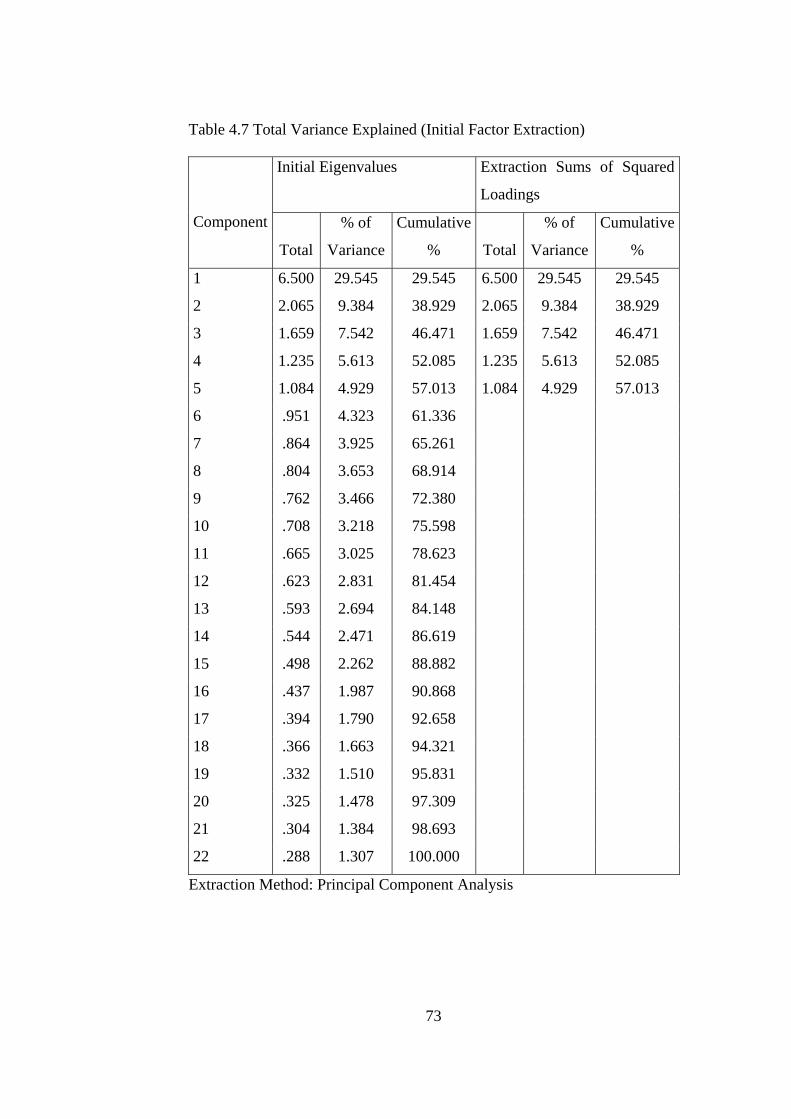
Table 4.7 Total Variance Explained (Initial Factor Extraction)
Initial Eigenvalues Extraction Sums of Squared
Loadings
Component
Total
% of
Variance
Cumulative
%
Total
% of
Variance
Cumulative
%
1 6.500 29.545 29.545 6.500 29.545 29.545
2 2.065 9.384 38.929 2.065 9.384 38.929
3 1.659 7.542 46.471 1.659 7.542 46.471
4 1.235 5.613 52.085 1.235 5.613 52.085
5 1.084 4.929 57.013 1.084 4.929 57.013
6 .951 4.323 61.336
7 .864 3.925 65.261
8 .804 3.653 68.914
9 .762 3.466 72.380
10 .708 3.218 75.598
11 .665 3.025 78.623
12 .623 2.831 81.454
13 .593 2.694 84.148
14 .544 2.471 86.619
15 .498 2.262 88.882
16 .437 1.987 90.868
17 .394 1.790 92.658
18 .366 1.663 94.321
19 .332 1.510 95.831
20 .325 1.478 97.309
21 .304 1.384 98.693
22 .288 1.307 100.000
Extraction Method: Principal Component Analysis
73
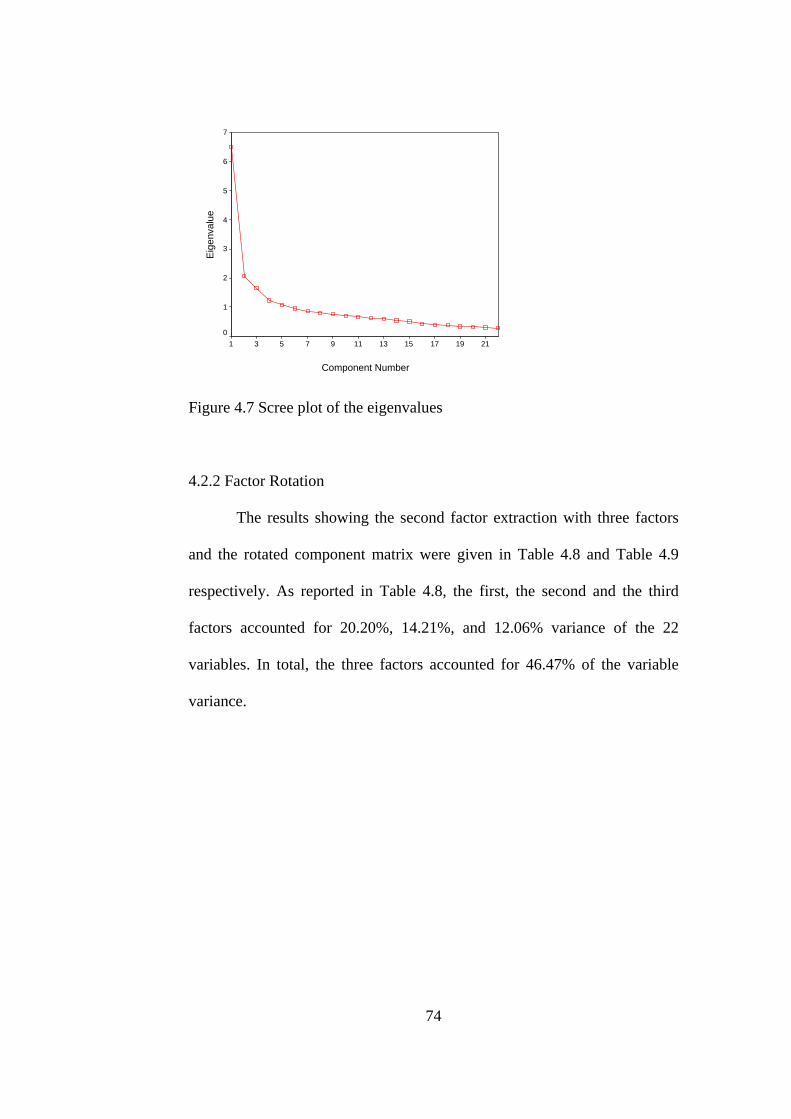
Component Number
21191715131197531
Eig
enva
lue
7
6
5
4
3
2
1
0
Figure 4.7 Scree plot of the eigenvalues
4.2.2 Factor Rotation
The results showing the second factor extraction with three factors
and the rotated component matrix were given in Table 4.8 and Table 4.9
respectively. As reported in Table 4.8, the first, the second and the third
factors accounted for 20.20%, 14.21%, and 12.06% variance of the 22
variables. In total, the three factors accounted for 46.47% of the variable
variance.
74
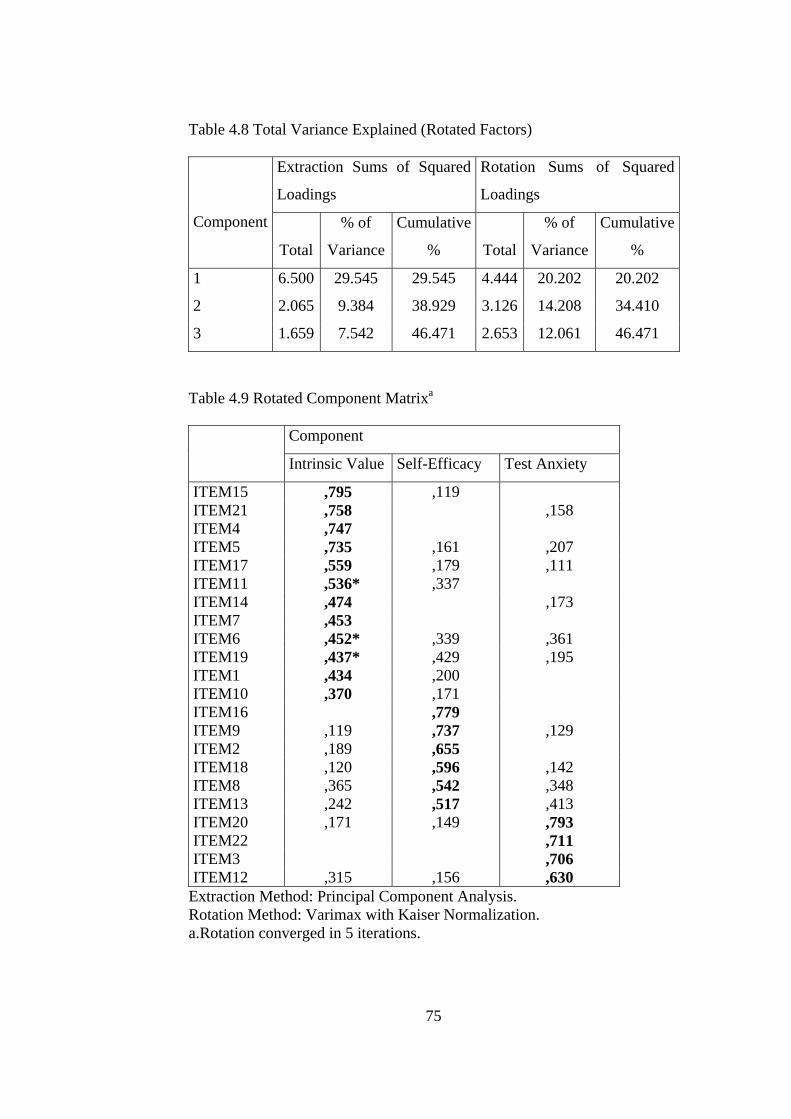
Table 4.8 Total Variance Explained (Rotated Factors)
Extraction Sums of Squared
Loadings
Rotation Sums of Squared
Loadings
Component
Total
% of
Variance
Cumulative
%
Total
% of
Variance
Cumulative
%
1 6.500 29.545 29.545 4.444 20.202 20.202
2 2.065 9.384 38.929 3.126 14.208 34.410
3 1.659 7.542 46.471 2.653 12.061 46.471
Table 4.9 Rotated Component Matrixa
Component
Intrinsic Value Self-Efficacy Test Anxiety
ITEM15 ,795 ,119 ITEM21 ,758 ,158 ITEM4 ,747 ITEM5 ,735 ,161 ,207 ITEM17 ,559 ,179 ,111 ITEM11 ,536* ,337 ITEM14 ,474 ,173 ITEM7 ,453 ITEM6 ,452* ,339 ,361 ITEM19 ,437* ,429 ,195 ITEM1 ,434 ,200 ITEM10 ,370 ,171 ITEM16 ,779 ITEM9 ,119 ,737 ,129 ITEM2 ,189 ,655 ITEM18 ,120 ,596 ,142 ITEM8 ,365 ,542 ,348 ITEM13 ,242 ,517 ,413 ITEM20 ,171 ,149 ,793 ITEM22 ,711 ITEM3 ,706 ITEM12 ,315 ,156 ,630
Extraction Method: Principal Component Analysis. Rotation Method: Varimax with Kaiser Normalization. a.Rotation converged in 5 iterations.
75
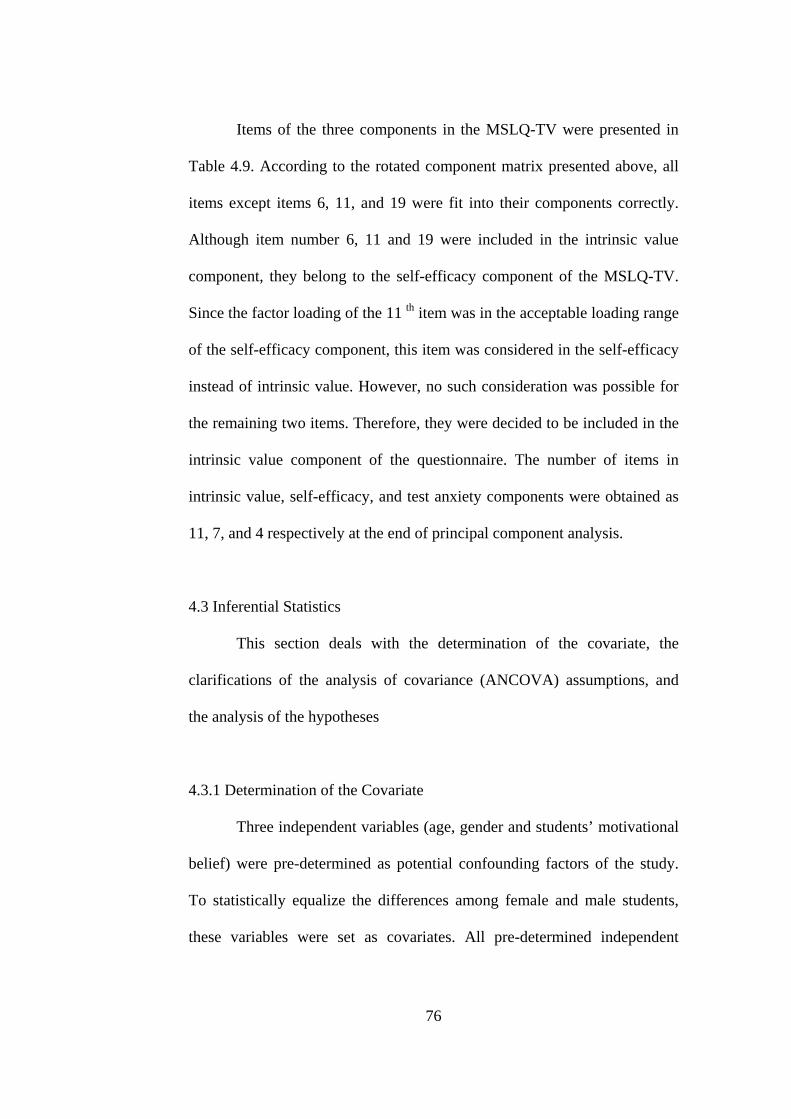
Items of the three components in the MSLQ-TV were presented in
Table 4.9. According to the rotated component matrix presented above, all
items except items 6, 11, and 19 were fit into their components correctly.
Although item number 6, 11 and 19 were included in the intrinsic value
component, they belong to the self-efficacy component of the MSLQ-TV.
Since the factor loading of the 11 th item was in the acceptable loading range
of the self-efficacy component, this item was considered in the self-efficacy
instead of intrinsic value. However, no such consideration was possible for
the remaining two items. Therefore, they were decided to be included in the
intrinsic value component of the questionnaire. The number of items in
intrinsic value, self-efficacy, and test anxiety components were obtained as
11, 7, and 4 respectively at the end of principal component analysis.
4.3 Inferential Statistics
This section deals with the determination of the covariate, the
clarifications of the analysis of covariance (ANCOVA) assumptions, and
the analysis of the hypotheses
4.3.1 Determination of the Covariate
Three independent variables (age, gender and students’ motivational
belief) were pre-determined as potential confounding factors of the study.
To statistically equalize the differences among female and male students,
these variables were set as covariates. All pre-determined independent
76
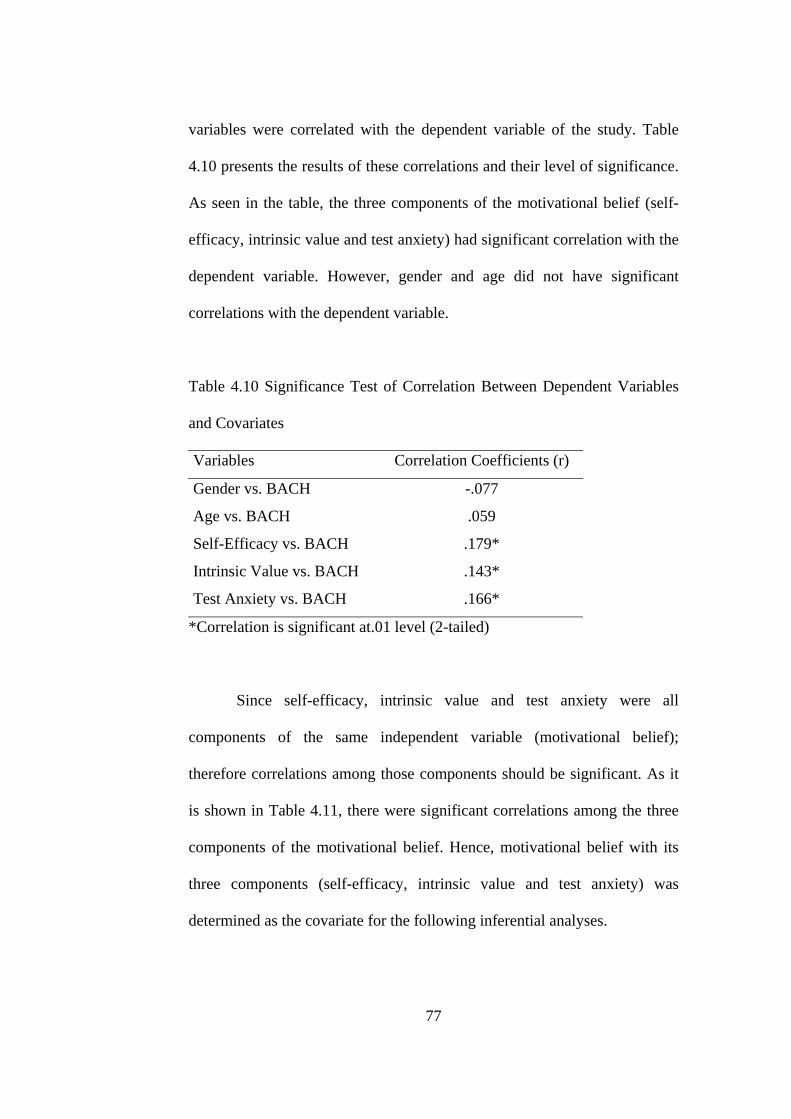
variables were correlated with the dependent variable of the study. Table
4.10 presents the results of these correlations and their level of significance.
As seen in the table, the three components of the motivational belief (self-
efficacy, intrinsic value and test anxiety) had significant correlation with the
dependent variable. However, gender and age did not have significant
correlations with the dependent variable.
Table 4.10 Significance Test of Correlation Between Dependent Variables
and Covariates
Variables Correlation Coefficients (r)
Gender vs. BACH -.077
Age vs. BACH .059
Self-Efficacy vs. BACH .179*
Intrinsic Value vs. BACH .143*
Test Anxiety vs. BACH .166*
*Correlation is significant at.01 level (2-tailed)
Since self-efficacy, intrinsic value and test anxiety were all
components of the same independent variable (motivational belief);
therefore correlations among those components should be significant. As it
is shown in Table 4.11, there were significant correlations among the three
components of the motivational belief. Hence, motivational belief with its
three components (self-efficacy, intrinsic value and test anxiety) was
determined as the covariate for the following inferential analyses.
77
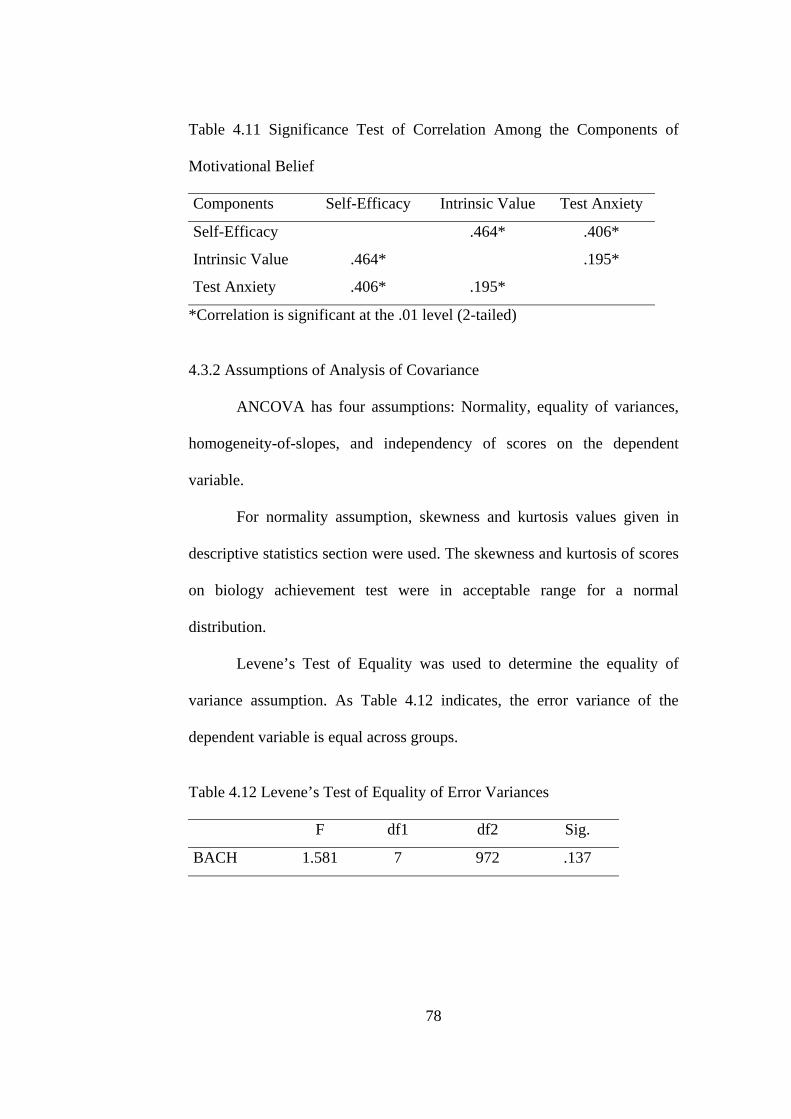
Table 4.11 Significance Test of Correlation Among the Components of
Motivational Belief
Components Self-Efficacy Intrinsic Value Test Anxiety
Self-Efficacy .464* .406*
Intrinsic Value .464* .195*
Test Anxiety .406* .195*
*Correlation is significant at the .01 level (2-tailed)
4.3.2 Assumptions of Analysis of Covariance
ANCOVA has four assumptions: Normality, equality of variances,
homogeneity-of-slopes, and independency of scores on the dependent
variable.
For normality assumption, skewness and kurtosis values given in
descriptive statistics section were used. The skewness and kurtosis of scores
on biology achievement test were in acceptable range for a normal
distribution.
Levene’s Test of Equality was used to determine the equality of
variance assumption. As Table 4.12 indicates, the error variance of the
dependent variable is equal across groups.
Table 4.12 Levene’s Test of Equality of Error Variances
F df1 df2 Sig.
BACH 1.581 7 972 .137
78
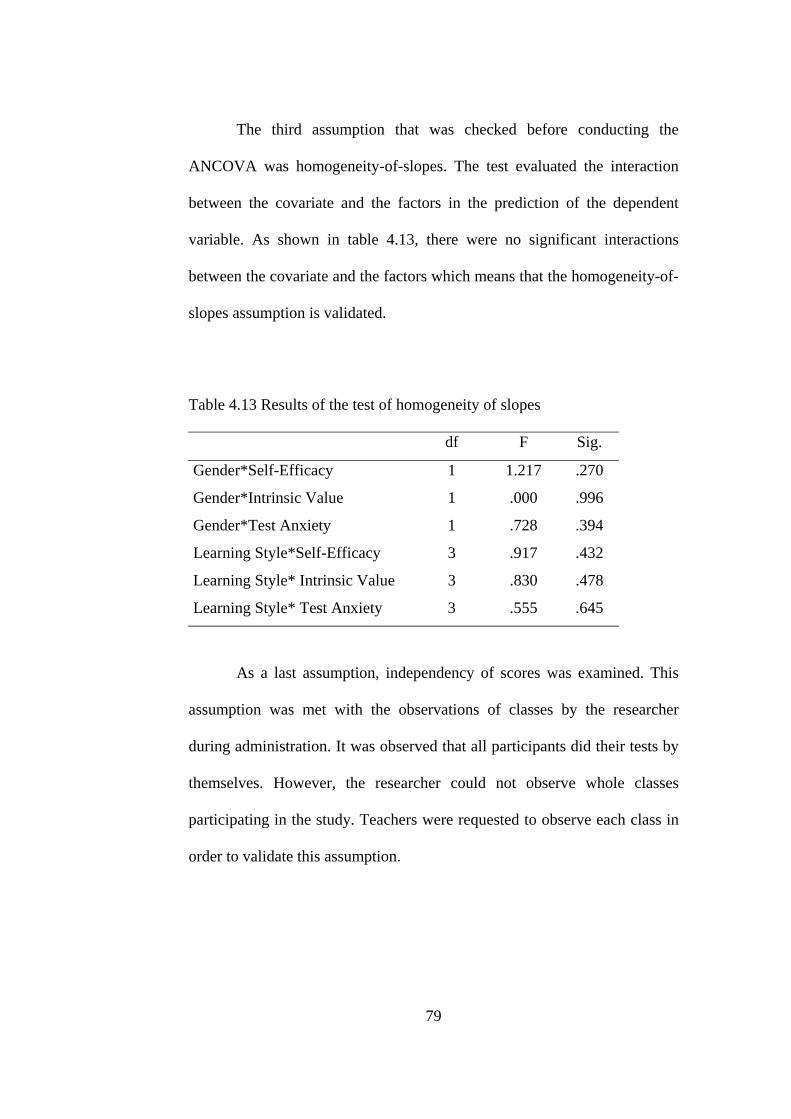
The third assumption that was checked before conducting the
ANCOVA was homogeneity-of-slopes. The test evaluated the interaction
between the covariate and the factors in the prediction of the dependent
variable. As shown in table 4.13, there were no significant interactions
between the covariate and the factors which means that the homogeneity-of-
slopes assumption is validated.
Table 4.13 Results of the test of homogeneity of slopes
df F Sig.
Gender*Self-Efficacy 1 1.217 .270
Gender*Intrinsic Value 1 .000 .996
Gender*Test Anxiety 1 .728 .394
Learning Style*Self-Efficacy 3 .917 .432
Learning Style* Intrinsic Value 3 .830 .478
Learning Style* Test Anxiety 3 .555 .645
As a last assumption, independency of scores was examined. This
assumption was met with the observations of classes by the researcher
during administration. It was observed that all participants did their tests by
themselves. However, the researcher could not observe whole classes
participating in the study. Teachers were requested to observe each class in
order to validate this assumption.
79

4.3.3 Analysis of Covariance Model
The dependent variable of the study is BACH. The scores taken
from the three components of the MSLQ-TV (self-efficacy, intrinsic value,
test anxiety) are the covariates of the study. Students’ learning styles and
gender are the independent variables in the ANCOVA model. Table 4.14
indicates the results of the ANCOVA.
Table 4.14 Tests of Between-Subjects Effects
Source
DV
Type III
Sum of
Squares
Df
Mean
Square
F
Sig.
Eta
Squared
Observed
Power
Corrected
Model
BACH
777.3
10
77.7
6.2
.000
.06
1.0
Intercept BACH 608.5 1 608.5 48.9 .000 .05 1.0
SES BACH 103.8 1 103.8 8.3 .004 .01 .82
IVS BACH 9.9 1 9.9 .79 .374 .00 .14
TAS BACH 128.7 1 128.7 10.3 .001 .01 .90
Gender BACH 56.2 1 56.2 4.5 .034 .00 .57
LS BACH 113.0 3 37.7 3.0 .029 .01 .71
Gender*LS BACH 46.8 3 15.6 1.3 .289 .00 .33
Error BACH 12054.9 969 12.4
Total BACH 107226.0 980
Corrected
Total
BACH 12832.2 979
80
4.3.4 Null Hypothesis 1
There will be no significant difference between the biology
achievement test scores of tenth grade students with different learning styles
when the effect of student motivational belief (Self-efficacy, intrinsic value
and test anxiety) is controlled.
ANCOVA was conducted to determine the effect of learning style
on the BACH by controlling the effect of student motivational belief. This
null hypothesis was rejected and ANCOVA was significant (F (3,969) = 3.0,
p = .029). In other words, learning style had a significant effect on the
BACH when the effect of student motivational belief is controlled.
In order to conduct the pairwise comparisons among the four types
(accommodator, diverger, converger, and assimilator) of learning style,
Tukey’s Honestly Significant Difference (HSD) Test was performed
following ANCOVA. As Table 4.15 indicates, there is a significant mean
difference between divergers and assimilators which means that the
observed mean difference in the BACH is due to the mean difference
between divergers and assimilators. The results of the Tukey’s HSD Post
Hoc Test are given in Table 4.15.
81
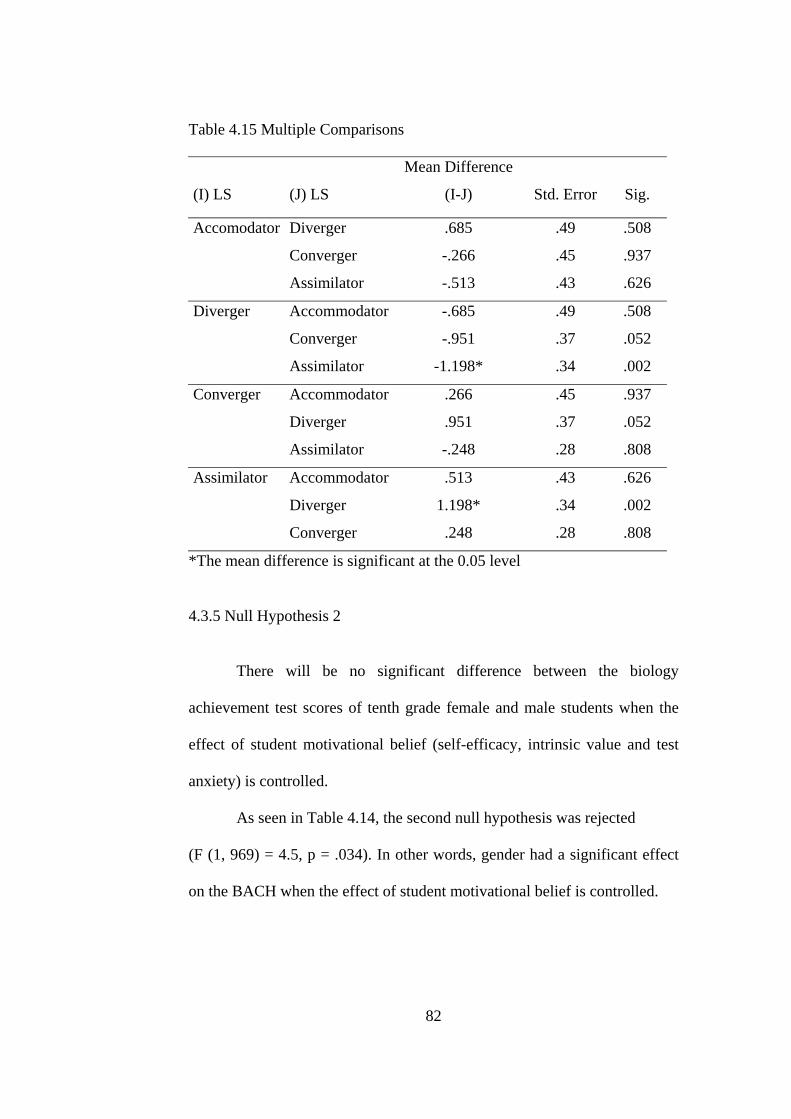
Table 4.15 Multiple Comparisons
(I) LS
(J) LS
Mean Difference
(I-J)
Std. Error
Sig.
Accomodator Diverger .685 .49 .508
Converger -.266 .45 .937
Assimilator -.513 .43 .626
Diverger Accommodator -.685 .49 .508
Converger -.951 .37 .052
Assimilator -1.198* .34 .002
Converger Accommodator .266 .45 .937
Diverger .951 .37 .052
Assimilator -.248 .28 .808
Assimilator Accommodator .513 .43 .626
Diverger 1.198* .34 .002
Converger .248 .28 .808
*The mean difference is significant at the 0.05 level
4.3.5 Null Hypothesis 2
There will be no significant difference between the biology
achievement test scores of tenth grade female and male students when the
effect of student motivational belief (self-efficacy, intrinsic value and test
anxiety) is controlled.
As seen in Table 4.14, the second null hypothesis was rejected
(F (1, 969) = 4.5, p = .034). In other words, gender had a significant effect
on the BACH when the effect of student motivational belief is controlled.
82
4.3.6 Null Hypothesis 3
There will be no significant difference between the biology
achievement test scores of tenth grade female and male students with
different learning styles when the effect of student motivational belief (self-
efficacy, intrinsic value and test anxiety) is controlled.
As seen in Table 4.14, the third null hypothesis was not rejected
(F (3,969) = 1.3, p = .289) which means that gender and learning style
together do not have a significant effect on the BACH. This statistic
therefore did not provide support for this research hypothesis.
4.3.7 Null Hypothesis 4
There will be no significant contribution of students’ self-efficacy
beliefs to their biology achievement test scores.
As indicated in Table 4.10, the fourth null hypothesis was rejected
(r= .179) which means that there was a low positive correlation between
students’ self-efficacy beliefs and their biology achievement test scores.
4.3.8 Null Hypothesis 5
There will be no significant contribution of students’ intrinsic value
beliefs to their biology achievement test scores.
As indicated in Table 4.10, the fifth null hypothesis was rejected
(r=.143) which means that there was a low positive correlation between
students’ intrinsic value beliefs and their biology achievement test scores.
83
4.3.9 Null Hypothesis 6
There will be no significant contribution of students’ test anxiety
beliefs to their biology achievement test scores.
As indicated in Table 4.10, the sixth null hypothesis was rejected
(r=.166) which means that there was a low positive correlation between
students’ test anxiety beliefs and their biology achievement test scores.
4.4 Summary of Results
The results of this study can be summarized as follows:
• It can be easily understood from the mean achievement scores that
biology achievement was very low for the subjects of this study.
• Females’ biology achievement test mean scores were slightly higher
than that of males.
• Males’ self-efficacy mean scores were slightly higher than that of
females.
• Females’ intrinsic value mean scores were higher than that of males.
• Females’ test anxiety mean scores were slightly higher than that of
males.
• The most common learning style type was assimilating for the subjects
of this study. Convergers were the second highest learning style type
observed in this study.
84
• Diverging and accommodating learning style types were rare among the
subjects of the study.
• The biology achievement test mean scores of the assimilators were
higher than that of convergers, divergers, and accommodators.
• Students’ learning styles had a significant effect on biology achievement
test scores when the effect of student motivational belief was controlled.
• Students’ gender had a significant effect on biology achievement test
scores when the effect of student motivational belief was controlled.
• Gender and learning style together did not have a significant effect on
biology achievement test scores when the effect of student motivational
belief was controlled.
• There was a significant low positive correlation between students’ self-
efficacy beliefs and their biology achievement test scores.
• There was a significant low positive correlation between students’
intrinsic value beliefs and their biology achievement test scores.
• There was a significant low positive correlation between students’ test
anxiety beliefs and their biology achievement test scores.
85
CHAPTER 5
CONCLUSIONS, DISCUSSIONS AND IMPLICATIONS
This chapter presents the summary of the research study,
conclusions and discussion of the results, internal and external validity of
the study, and finally announces the implications of the study and
recommendations for further studies.
5.1 Summary of the Research Study
In order to investigate the specified purposes of this study, 980 tenth
grade students chosen from an accessible population were administered the
Turkish version Motivated Strategies for Learning Questionnaire (MSLQ-
TV), Learning Style Inventory (LSI), and Biology Achievement Test (BAT)
during the last four weeks of the fall 2002-2003 semester. To obtain the
representative sample, clustered random sampling integrated with
convenience random sampling was used. Correlational and causal
comparative research were the two research methodologies utilized during
the course of this study.
86
5.2 Conclusions
The results of the current study revealed that student’s learning style
had a significant effect on their biology achievement. Students having the
assimilating learning style type were found to be were more successful than
divergers, accomodators, and convergers in terms of their scores on the
Biology Achievement Test. As expected, the most common types of
learning style among the students of this study were assimilating and
converging, the former being the highest.
Although most of the previous studies pointed out the fact that male
students’ science achievement were higher than females’, results of this
study indicated that females slightly outperform males in the Biology
Achievement Test. However, learning style and gender together did not
have an effect on students’ biology achievement.
The results also underlined the relationship of the three motivational
belief components with students’ biology achievement. It was observed that
there was a low positive correlation between students’ self-efficacy
believes, test anxiety believes, intrinsic value believes and their biology
achievement. The highest correlate to biology achievement for this
population was found to be students’ self-efficacy believes.
87
5.3 Discussion of the Results
The identification of some of the variables affecting biology
achievement and their relationships with achievement has been the major
concern of this discussion. Contributions of specific affective determinants
to biology achievement have been emphasized; the effects of gender and
learning style on biology achievement have been discussed below.
When the results of this research were compared with those of
previous ones, current research supports some findings from other studies
while it contradicts with some of them.
As Singh, Granville, and Dika (2002) reported affective variables
such as science interest and motivation have emerged as silent predictors of
achievement in science. Also, in their review of 20 studies dealing with
student motivation, Kremer and Walberg (1981) concluded that there is a
positive relationship between motivational variables and science learning.
Findings of our study are in agreement with the results of this review. There
was a low positive correlation (r= .197) between students’ motivational
belief and their biology achievement. In their study of motivation and
achievement, Uguroglu and Walberg (1979) concluded that the mean
correlation between motivation and achievement from samples of studies in
psychological and educational literature is .338 (with a standard error of
.009), the highest and the lowest correlations being .71 and .07 respectively.
They also suggested that motivation and achievement were more highly
88

correlated in students in later grades and motivation accounts for 11.4
percent of the variance in achievement.
The correlation found between motivation and achievement in this
study, however, is not as high as the mean correlation found by Uguroglu
and Walberg (1979), but fall into the range of observed correlations stated
above.
When the correlations of each motivational component (self-
efficacy, intrinsic value and test anxiety) with biology achievement were
examined, similar conclusions can be drawn out: There were low positive
correlations between each component and student biology achievement.
Among those three components, the highest correlate to biology
achievement was students’ self-efficacy beliefs. In an achievement context,
self-efficacy includes students’ confidence in their cognitive skills to learn
and perform the academic course work (Pintrich, 1999). Although Pintrich
(1999) stated that self-efficacy was strongly related to academic
performance including examinations, no such strong relationship was found.
Pintrich and his colleagues (1993) suggested that intrinsic task value
was correlated to performance but those relations were not as strong as
those for self- efficacy. The findings of this research supported this
suggestion. There was a low positive correlation between students’ intrinsic
value believes and their biology achievement and this correlation was
smaller than those for self-efficacy. Accordingly, for the students involved
in current study, their perceptions of the importance and usefulness of
89
biology and their interest in biology were not highly correlated with their
biology achievement.
The third correlate was the students’ emotional reactions to the task
in terms of test anxiety. According to the results of the study, there was a
low but positive correlation between students’ test anxiety believes and their
biology achievement. This finding does not support previous research
indicating that test anxiety interferes with students’ achievement. Benjamin,
McKeachie and Lin (1987) suggested that high test anxiety is correlated
with performance decrements. Correlations ranging to -.60 indicate that test
anxiety has a strong negative relationship to performance in evaluative
situations (Hill & Wigfield, 1984). The disagreement of the findings from
the study with the previous research shows that test anxiety is not an
inhibitory factor in the study of science for the population under study. It
appears that test anxiety may be a driving force in the efforts to study
biology so that there is a positive relation between two.
Overall, the correlations between biology achievement and each
component of student motivation were lower than expected. This ‘lower
than expected’ finding suggest that the relationship between motivation and
achievement may be somewhat weaker than previous findings indicate. It
may also reveal that other affective characteristics may play more important
role than motivation in explaining the observed difference in student
performance for this population. Factors such as home and school
environment, peer and teacher influences, socio-economic variations, family
90
demands, and other student characteristics such as attitudes, interests, prior
knowledge, cognitive strategies may account more in explaining the
variations among student performance for the population of interest.
According to the results of this study, gender was one of the other
determinants of biology achievement. Inconsistent with many other studies,
the results of this study showed that girls outperform boys to a small extent.
It is well known that there are disparities between academic performance of
girls and boys in science and mathematics (Greenfield, 1995). According to
National Assessment of Educational Progress (NAEP), data from 1976 to
1990 indicate that a male advantage in science achievement emerges and
grows as students progress through school: although gender differences are
small or nonexistent in 9-year-olds, by the age of 17, males significantly
outperform females and this gender gap has existed as early as 1969 (NAEP,
1991, as cited in Greenfield, 1995). Research in science education also
indicates that gender may also influence attitudes toward science
(Weinburgh, 1995). It appears that, boys in general, have a more positive
attitude toward science than girls. However, if specific disciplines of science
are considered, this is not always the case. Schibeci (1984) reported that
girls show a more positive attitude toward biology and boys toward physics
and chemistry. Moreover, the results of few studies examining the
correlation between attitude toward science and achievement in science by
gender, reported a higher correlation between positive attitudes in science
and higher achievement scores for girls than boys (Cannon and Simpson
91
1983). Therefore, the observed achievement difference favoring girls may
be due to the attitudinal differences among girls and boys for biology. As
Schibeci (1984) reported, girls’ attitude for biology may be higher than that
of boys’ and this higher attitude may result in higher biology achievement
for girls in this study.
Learning style has been emerged as an other factor affecting biology
achievement at the end of current study. The variations on the learning style
preferences are important and may have consequences for how successfully
different students learn biology. Our findings showed that assimilators’
biology achievement mean scores were higher than that of convergers,
divergers, and accommodators. Since higher scores mean greater biology
achievement, it can be concluded that assimilators were more successful in
biology when compared with the others for this population. One possible
reason of this result may be the teaching methods generally preferred by our
teachers. The most commonly used teaching method is lecturing in our
schools. People with assimilator learning style type prefer mostly readings
and lectures (Kolb, 1985). Therefore, the matching between teaching and
learning style may lead to higher achievement of students with assimilator
learning style type. This finding supports the expectations of Sternberg and
Grigorenko (1997) who stated that the level of performance would be higher
when there was a congruence of preferred learning style and the teaching
method.
92
The results of the study also supported the theory of Collinson
(2000) that students manifest significant variations in how they prefer to
learn in a classroom setting. Assimilators and convergers have emerged as
the most frequent learning style types in our population. Kolb (1985), stated
that mathematics and science attracts individuals who are assimilators and
the findings of this research supported that view. Since our population
included only students attending to mathematics and science groups, those
results were not surprising. According to Raschick and Maypole (1998), the
converger-type learners tend to have a good understanding of practical ideas
and their application. In formal learning situations, people with this style
prefer to experiment with new ideas, simulations, laboratory assignments,
and practical applications (Kolb, 1985). Since science is accompanied
closely with experimentation, laboratory work and application assignments,
high frequency of convergers in the population was consistent with the
statements of Kolb (1985).
As described in Chapter 3, small effect size was expected. The
statistical result of the SPSS calculated R2 as .051 for BACH. The observed
value of effect size was calculated by using formula f2= R2/ (1- R2) for the
dependent variable and found as .1. The effect size measured here matched
the small effect size. Based on the findings presented the practical
significance of this study is low.
93
5.4 Internal Validity of the Study
Internal validity means that the observed differences on the
dependent variable are directly related to the dependent variable, not due to
some other extraneous variable. Possible threats to internal validity and the
methods used to cope with them are discussed in this section.
Although schools involved in this study were thought as clusters and
randomly selected, random assignment of subjects was not possible. Since
the groups were already formed, not the individuals, but the groups were
randomly assigned. Hence, many subject characteristics (age, gender,
attitude, motivation, socioeconomic status, previous knowledge) could be
the major threat to the internal validity for this study. To be able to cope
with some of these potential threats, age and gender were assessed with the
questionnaire. However, they were not found to be highly correlated with
the dependent variable. Instead, the correlation of the self-efficacy, intrinsic
value, and test anxiety components of student motivation were correlated
significantly with the dependent variable. Therefore, they were considered
as covariates. The amount of previous biology knowledge of students was
assumed to be equal.
Location and instrumentation could not be threats to the study since
the instruments were administered to all groups in similar conditions and
mostly by the researcher.
94
Data collector characteristics and data collector bias threats were
assumed to be controlled by training and informing the teachers to ensure
Standard procedures under which the data were collected.
Finally, confidentially was not a possible threat for this study since
names of the students were not collected and used anywhere.
5.5 External Validity of the Study
Subjects of the study were randomly selected from the accessible
population and 980 tenth grade students were involved in the study. Hence,
generalization of this study’s findings does not have any limitations. So the
results and conclusions found at the end of this study can easily be applied
to accessible population.
Since all the administration procedure took place in ordinary
classrooms during regular class hours, there were possibly no remarkable
differences among the environmental conditions. Therefore, it was believed
that external effects were sufficiently controlled by the settings used in the
study.
95
5.6 Implications of the Study
Based on the findings of this study and previous research following
suggestions can be offered:
1. Educators and teachers should be aware of the differences that exist
among students rather than assuming that everyone learns the same way.
2. A preliminary mission of teacher educators can be to provide future
teachers with the knowledge and skills needed to diagnosis their
students’ learning styles and adapt their instruction accordingly.
3. Kolb Learning Style Inventory can be used as an effective tool by
teachers at the beginning of the semester to identify each student’s
learning style.
4. If students are able to accurately identify their preferred style of
learning, then teachers may use the information gathered to design
classroom environments, teaching strategies and classroom activities
that may potentially enhance the learning of all students.
5. Lectures, model buildings, analogies, readings, papers, and projects may
be preferred as instructional activities for assimilators.
6. Laboratory experiments, simulations, field works, problem solving, and
practical applications may be preferred as instructional activities for
convergers.
7. Group working, cooperative learning, and brainstorming may be
preferred as instructional activities for divergers.
96
8. Hands-on activities, group working, field working, and projects may be
preferred as instructional activities for accomodators.
9. Although there is no magic formula for motivating all students, teachers
should try to motivate students in their classrooms by using the
suggestions below:
• De-emphasize grading (an extrinsic motivator) as much as possible
and encourage students to develop their intrinsic motivation.
• Overemphasizing exams and making them difficult to complete in
the allotted time may promote anxiety and focus on rote
memorization. To increase interest and motivation in learning, use
evaluative methods that encourage conceptual learning without
threatening students.
• Try to encourage the growth of intrinsic satisfaction and the
rewards of learning in students.
• Communicate to students that you believe each of them can learn
biology meaningfully without memorizing. The belief that some
students cannot learn biology is a myth of our society that must
be overcome. Students should know they can learn biology and
that the teacher expects them to do so.
• Praise student effort and performance only when it is deserved.
Teachers must be specific with their praise and use their
professional judgment to decide the frequency of praise that is
most appropriate for each student in their class.
97
• Stress the importance of self-improvement rather than
performing better than others in the class.
• Stress the usefulness and importance of biology. Students who
believe that learning biology is necessary to succeed in school,
daily life and in jobs will be more highly motivated than students
who see no real purpose for learning biology.
• Employ a variety of teaching strategies and materials. A teacher
who effectively uses models, pictorial aids, simulations, and
activities instead of textbook explanations is likely to keep all
students motivated.
• When students make a mistake or get a low grade, encourage
them to try again and harder rather than letting them broad about
their failure. Students who learn to keep trying are believed to go
a long way toward becoming highly motivated and are more
likely to learn how to handle with the classroom difficulties.
10. Teachers and teacher educators should work together to eliminate the
strong belief in our society that girls remain behind boys in science
achievement.
11. Not only boys but also girls should be encouraged in science classes.
12. Teachers, parents, educators, and even peers should try to develop girls’
self-esteem towards science.
98
5.7 Recommendations for Further Research
Current study has suggested a variety of useful topics for further
studies. These are briefly as follows:
1. The affective determinants found to correlate with biology achievement
in this study cannot be shown to ‘cause’ achievement. Thus,
experimental research is needed to help to determine a causal link
between motivational belief and biology achievement.
2. Future research can examine gender differences in motivational belief.
3. Experimental research is needed to examine the effect of instruction
done according to the students’ learning styles on students’ biology
achievement.
4. Future research can perform a replication of this study for different
grade levels.
5. Impacts of other affective and cognitive variables on students’ biology
achievement can be investigated in future studies.
99
REFERENCES Atkinson, G. (1991). Kolb’s learning style inventory: A practitioner’s
perspective. Measurement & Evaluation in Counseling & Development,
23(4), 149-162.
Bailey, P., Onwuegbuzie, A.J., & Daley, C.E. (2000). Using learning style to
predict foreign language achievement at college level. System, 28, 115-
133.
Bandura, A. (1993). Perceived self-efficacy in cognitive development and
functioning. Educational Psychologist, 28, 117-148
Bandura, A. (1991). Human agency: The rhetoric and the reality. American
Psychologist, 46, 157-162.
Benjamin, M., McKeachie, W.J., & Lin, Y.G. (1987). Two types of test-
anxious students: support for an information processing model. Journal
of Educational Psychology, 79(2), 131-136.
Benjamin, M., McKeachie, W.J., Lin, Y.G., & Holinger, D.P. (1981). Test
anxiety: Deficts in information processing. Journal of Educational
Psychology, 73, 816-824.
100
Brandt, R. (1990). On learning styles: A conversation with Pat Guild.
Educational Leadership, 48, 10-13.
Busato, V.V., Prins, J.F., Elshout, J.J., & Hamaker, C. (2000). Intellectual
ability, learning style, personality, achievement motivation and
academic success of psychology students in higher education.
Personality and Individual Differences, 29, 1057-106
Cannon, R.K., Jr., & Simpson, R.D. (1983). Relationships among attitude,
motivation, and achievement of ability-grouped, seventh-grade life
science students. Science Education, 69, 121-138.
Cano, F., & Justica, F. (1994). Learning strategies and styles: an analysis of
their interrelationships. Higher Education, 27, 239-260.
Cano-Garcia, F., & Hewitt Hughes, E. (2000). Learning and Thinking Styles:
an analysis of their interrelationship and influence on academic
achievement. Educational Psychology, 20(4), 413-431.
Collinson, E. (2000). A Survey of Elementary Students' Learning Style
Preferences and Academic Success. Contemporary Education, 71(4),
42-49.
Culler, R.E., & Holahan, C.J. (1980). Test anxiety and academic performance:
The effects of study related behaviors. Journal of Educational
Psychology, 72, 16-20.
101
Çakır, Ö.S., Berberoğlu, G., Alpsan, D., & Uysal, C. (2002, September). Örnek
olaya dayalı öğrenim yönteminin, öğrenme stillerinin ve cinsiyetin, lise
öğrencilerinin üst düzey öğrenme yeteneklerine, biyoloji dersine karşı
tutumlarına ve performanslarına etkisi. V. Ulusal Fen Bilimleri ve
Matematik Eğitimi Kongresi, Ankara, Türkiye.
Davidson, G. V. (1990). Matching learning styles with teaching styles: Is it a
useful concept in instruction? Performance and Instruction, 29, 36-38.
DeBacker, T.K., & Nelson, R.M. (2000). Motivation to learn science:
Differences related to gender, class type, and ability. Journal of
Educational Research, 93(4), 245-255.
DeBacker, T.K., & Nelson, R.M. (1999). Variations on an expectancy-value
model of motivation in science. Contemporary Educational Psychology,
24, 71-94.
DeBello, T. C. (1990). Comparison of eleven major learning style models:
Variables, appropriate populations, validity of instrumentation, and the
research behind them. International Journal of Reading, Writing, and
Learning Disabilities, 6, 203-222.
Dixon, N. (1982). Incorporating learning styles into training design. Training
and Developmental Journal, 36(7), 62-64.
102
Dunn, R., & Stevenson, J.M. (1997). Teaching diverse college students to study
within a learning-styles prescription. College Student Journal, 31(3),
333-340.
Dweck, C. (1986). Motivation processes affecting learning. American
Psychologist, 41, 1040-1048.
Eccles, J., & Wigfield, A. (1995). In the mind of the actor: The structure of
adolescents’ achievement task values and expectancy-related beliefs.
Personality and Social Psychology Bulletin, 21, 215-225.
Felder, R.M. (1996). Matters of style. ASEE Prism, 6 (4), 18-23.
Felder, R.M., & Henriques, E.R. (1995). Learning and teaching styles in foreign
and second language education. Foreign Language Annals, 28, 21-31.
Felder, R.M., & Silverman, L.K. (1988) Learning styles and teaching styles in
engineering education. Engineering Education, 78, 674-681.
Greene, B.A., DeBacker, T.K., Ravindran, R., & Krows, A.J. (1999). Goals,
values, and beliefs as predictors of achievement and effort in high
school mathematics classes. Sex Roles, 40, 421-458.
Greene, B.A., & Miller, R.B. (1996). Influences on achivement: Goals,
perceived ability, and cognitive engagement. Contemporary Educational
Psychology, 21, 181-192.
Greenfield, T.A. (1996). Gender, ethnicity, science achievement, and attiudes.
Journal of Research in Science Teaching, 33(8), 901-933.
103
Greenfield, T.A. (1995). An exploration of gender participation patterns in
science competitions. Journal of Research in Science Teaching, 32(7),
735-748.
Gusentine, S., & Keim, M. (1996). The learning styles of community college
art students. Community College Review, 24, 17-26.
Hayes, J., & Allinson, C.W. (1993) Matching learning styles and instructional
strategy: an application of the person-environment interaction paradigm.
Perceptual and Motor Skills, 76, 63-79.
Hayes Resources Direct (2001). Experiential learning theory bibliography.
Retrieved march, 2003 from:
http://trgmcber.haygroup.com/Products/learning /bibliography.htm
Healey, M., & Jenkins, A. (2000). Learning cycles and learning styles: Kolb’s
experiential learning theory and its application in geography in higher
education. Retrieved march, 2003 from the World Wide Web:
http://www.chelt.ac.uk/el/philg/gdn/discuss/kolb1.htm
Hickson, J., & Baltimore, M. (1996). Gender related learning style patterns of
middle school pupils. School Psychology International, 17(1), 59-70.
Hill, K., & Wigfield, A. (1984). Test anxiety: A major educational problem and
what can be done about it. Elementary School Journal, 85, 105-126.
104
James, W.B., & Gardner, D.L. (1995).learning styles: Implications for distance
learning. New Directions for Adult and Continuing Education, 67, 19-
32.
Jones, G. (1991). Gender differences in science competitions. Science
Education, 75, 159-167.
Jones, M.G., & Wheatley, J. (1989). Gender influences in classroom displays
and student-teacher behaviors. Science Education, 73, 535-545.
Kahle, J.B., & Lakes, M.K. (1983). The myth of equality in science classrooms.
Journal of Research in Science Teaching, 20, 131-140.
Kelly, C. (1997, September). David Kolb, The Theory of Experiential Learning
and ESL. The Internet TESL Journal, 3(9). Retrieved March 2003 from
the World Wide Web:
http://www.aitech.ac.jp/~iteslj/Articles/Kelly-Experiential
Kolb, D.A. (1985). Learning-style inventory: Self-scoring inventory and
interpretation booklet (2nd ed.). Boston: McBer & Co.
Kremer, B., & Walberg, H. (1981). A synthesis of social and psychological
influences on science learning. Science Education, 65, 11-23.
Leonard, A., & Harris, I. (1979). Learning style in a primary care internal
medicine residency program. Archives of Internal Medicine, 139, 872-
875.
105
Lumsdaine, M., & Lumsdaine, E. (1993) Thinking preferences of engineering
students: implications for curriculum restructuring. Journal of
Engineering Education, 84, 193-204.
Lynch, T.G., Woelfl, N.N., Steele, D.J., & Hanssen, C.S. (1998). Learning style
ınfluences student examination performance. The American Journal of
Surgery, 176, 62-66.
Mark, M., & Menson, B. (1982). Using David Kolb’s experiential learning in
potfolio development courses. New Directions for Experiential
Learning, 16, 65-74.
Mason, C.L., Kahle, J.B., & Gardner, A.L. (1991). Draw-a scientist test: Future
implications. School Science and Mathematics, 91, 193-198.
Matthews, D.B. (1996). An investigation of learning styles and perceived
academic achievement for high school students. Clearing House, 69(4),
249-255.
Matthews, D.B. (1991). The effects of learning style on grades of first-year
college students. Research in Higher Education, 32 (3), 253-267.
Meece, J.L, & Jones, M.G. (1996). Gender differences in motivation and
strategy use in science: Are girls rote learners? Journal of Research in
Science Teaching, 33(4), 393-406.
106
Meece, J., Wigfield, A., & Eccles, J. (1990). Predictors of math anxiety and its
influence on young adolescents’ course enrollment intentions and
performance in mathematics. Journal of Educational Psychology, 77,
115-126.
Miller, C.D., Alway, M., & McKinley, D.L. (1987). Effects of learning styles
and strategies on academic success. Journal of College Student
Personel, 28 (5), 400-404.
Miller, R.B., Grene, B.A., Montalvo, G.P., Ravindran, B., & Nichols, J.D.
(1996). Engagement in academic work: The role of learning goals,
future consequences, pleasing others and perceived ability.
Contemporary Educational Psychology, 21, 388-422.
Napier, J., & Riley, J. (1985). Relationship between affective determinants and
achievement in science for seventeen-year-olds. Journal of Research in
Science Teaching, 22, 365-383.
Nelson, B., Dunn, R., Griggs, S.A., Primavera, L., Fitzpatrick, M., & Miller, R.
(1993). Effects of learning-style intervention on college students'
retention and achievement. Journal of College Student Development,
34(5), 364-369.
Pajares, F. (1996). Self-efficacy beliefs in academic setting. Review of
Educational Research, 66, 543-578.
107
Paris, S.G., Lipson, M.Y., & Wixson, K.K. (1983). Becoming a strategic
reader. Contemporary Educational Psychology, 8, 293-316.
Park, C.C. (2001). Learning Style Preferences of Armenian, African, Hispanic,
Hmong, Korean, Mexican, and Anglo Students in American Secondary
Schools. Learning Environment Research, 4, 175-191.
Pigg, K.E., Bush, L., & Lacy, W.B. (1980). Learning styles in adult education:
A study of country extension agents. Adult Education, 30(4), 233-244.
Pintrich, P. (1999). The role of motivation in promoting and sustaining self-
regulated learning. International Journal of Educational Research, 31,
459-470.
Pintrich, P.R., & De Groot, E. (1990). Motivational and self-regulated learning
components of classroom academic performance. Journal of
Educational Psychology, 82, 33-40.
Pintrich, P.R., Marx, R.W., & Boyle, R.A. (1993). Beyond cold conceptual
change: The role of motivational beliefs and classroom contextual
factors in the process of conceptual change. Review of Educational
Research, 63, 167-199.
Pintrich, P.R., Smith, D.F., Garcia, T., & McKeachie, W.J. (1993). Reliability
and predictive validity of the motivated strategies for learning
questionnaire. Educational and Psychological Measurement, 53, 801-
813.
108
Raschick, M., & Maypole, D.E. (1998). Improving field education through
Kolb learning theory. Journal of Social Work Education, 34 (1), 31-43.
Schibeci, R.A. (1984). Attitudes to science: An update. Studies in Science
Education, 11, 26-59,
Schunk, D. (1991). Self-efficacy and academic motivation. Educational
Psychologist, 26, 207-231.
Schunk, D. (1990). Goal setting and self-efficacy during self-regulated learning.
Educational Psychologist, 25, 71-86.
Shaughnessy, M. F. (1998). An interview with Rita Dunn about learning styles.
The Clearing House, 71(3), 141-145.
Simon, H.A. (1967). Motivational and Emotional controls of cognition.
Psychological Review, 74, 29-39
Singh, K., Granville, M., & Dika, S. (2002). The Journal of Educational
Research, 95(6), 323-332.
Sternberg, R.J., & Grigorenko, E.L. (1997). Re cognitive styles still in style?
American Psychologist, 52, 700-712.
Stice, J.E. (1987). Using Kolb’s reaming cycle to improve student reaming.
Journal of Engineering Education, 77, 291-296.
Taylor, M. (1997). Learning styles. Inquiry, 1(1), 45-48.
109
Teixeira, K. (2001). An experimental study comparing critical thinking growth
and learning styles in a traditional and workshop based introductory
mathematics course. Dissertation Abstracts International, 62(10).
(University Microfilms No. AAT3031321). Retrieved January 11, 2003
from Digital Dissertations Database.
Tobias, S. (1985). Test anxiety: Interference, defective skills, and cognitive
capacity. Educational Psychologist, 20, 135-142.
Trumper, R. (1995). Students’ motivational traits in science: A cross-age study.
British Educational Research Journal, 21(4), 505-516.
Uguroglu, M. & Walberg, H. (1979). Motivation and achievement: a
quantitative synthesis. American Educational Research Journal, 16, 375-
389.
Van Zwanenberg, N. (2000). Felder and Silverman's Index of Learning Styles
and Honey and Mumford's Learning Styles Questionnaire: how do they
compare and do they predict academic performance? Educational
Psychology, 20(3), 365-381.
Vermunt, J.D. (1996). Metacognitive, cognitive and affective aspects of
learning styles and strategies: a phenomenographic analysis. Higher
Education, 31, 25-50.
Vermunt, J.D. (1998). The regulation of constructive learning process. British
Journal of Educational Psychology, 68, 149-171.
110
Vollmeyer, R., & Rheinberg, F. (2000). Does motivation affect performance via
persistence. Learning and Instruction, 10, 293-309.
Weinburgh, M. (1995). Gender differences in student attitudes toward science:
A meta-analysis of the literature from 1970 to 1991. Journal of Research
in Science Teaching, 32(4), 387-398.
Weiner, B. (1990). History of motivational research in education. Journal of
Educational Psychology Review, 6, 49-78.
Wentzel, K.R. (1989). Adolescent classroom goals, standards for performance,
and academic achievement: An interactionist perspective. Journal of
Educational Psychology, 81(2), 131-142.
Wigfield, A. (1994). Expectancy-Value theory of achievement motivation: A
developmental perspective. Educational Psychology Review, 6, 49-78.
Wigfield, A., & Eccles, J. A. (2000). Expectancy-Value Theory of
Achievement Motivation. Contemporary Educational Psychology, 25,
68-81.
Wigfield, A., & Eccles, J. (1992). The development of achievement task values:
A theotetical analysis. Developmental Review, 12, 265-310.
Wigfield, A., & Eccles, J. (1989). Test anxiety in elementary and secondary
school students. Educational Psychologist, 24, 159-183.
111
Williams, R.A. (2001). Learning styles and achievement motivation of
community college students. Dissertation Abstracts International,
62(02). (University Microfilms No. AAT3005850). Retrieved January
11, 2003 from Digital Dissetations Database.
Witkin, H.A., Moore, C.A., Goodenough, D.R., & Cox, P.W. (1977). Field-
dependent and field-independent cognitive styles and their educational
implications. Review of Educational Research, 47, 1-64.
Wolters, C.A., & Pintrich, P.R. (1998). Contextual differences in student
motivation and self-regulated learning in mathematics, English, and
social studies classrooms. Instructional Science, 26, 27-47.
Wolters, C.A., & Rosenthal, H. (2000). The relation between students’
motivational beliefs and their use of motivational regulation strategies.
International Journal of Educational Research, 33, 801-820.
Wong, M.M., & Csikzentmihalyi, M. (1991). Motivation and academic
achievement: The effects of personality traits and the quality of
experience. Journal of Personality, 59 (3), 539-574.
Yu, S.L. (1996). Cognitive strategy use and motivation in underachieving
students. Dissertation Abstracts International, 57(11). (University
Microfilms No. AAT9712133). Retrieved January 11, 2003 from Digital
Dissertations Database.
112
Zimmerman, B. (1990). Self-regulated learning and academic achievement: An
overview. Educational Psychologist, 25, 3-17.
Zimmerman, B., Bandura, A., & Martinez-Pons, M. (1992). Self-motivation for
academic attainment: The role of self-efficacy beliefs and personal goal
setting. American Educational Research Journal, 29, 663-676.
113
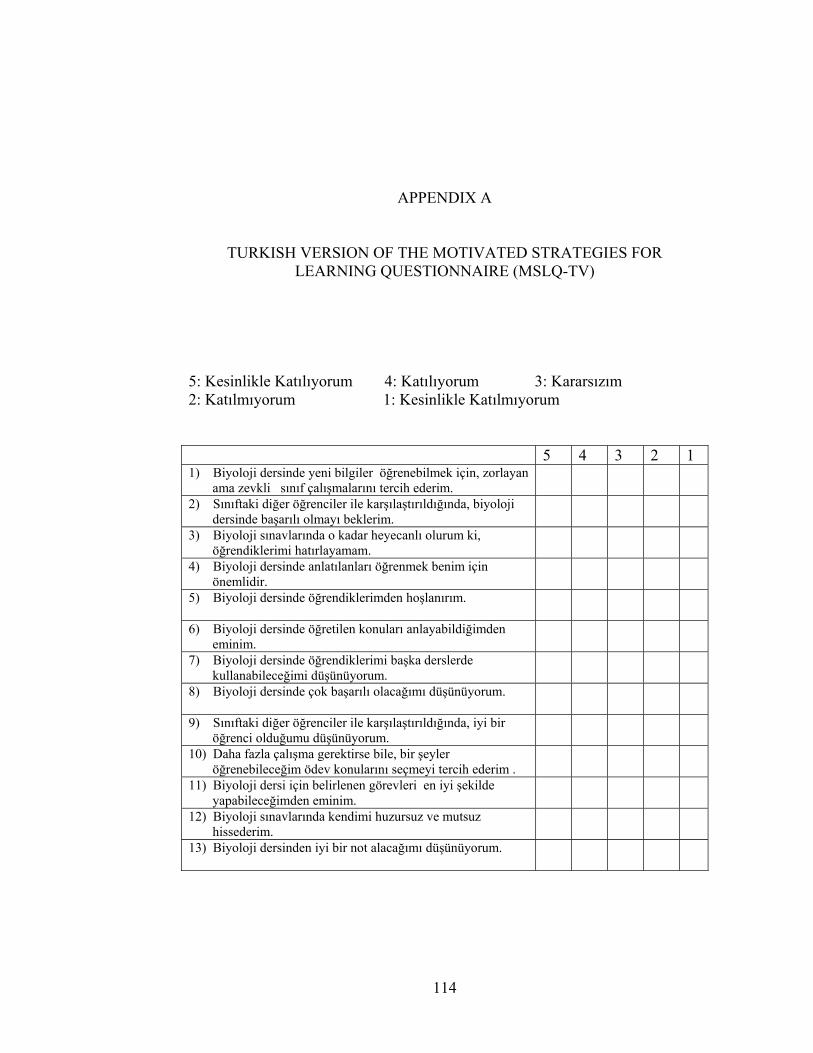
APPENDIX A
TURKISH VERSION OF THE MOTIVATED STRATEGIES FOR LEARNING QUESTIONNAIRE (MSLQ-TV)
5: Kesinlikle Katılıyorum 4: Katılıyorum 3: Kararsızım 2: Katılmıyorum 1: Kesinlikle Katılmıyorum 5 4 3 2 1 1) Biyoloji dersinde yeni bilgiler öğrenebilmek için, zorlayan
ama zevkli sınıf çalışmalarını tercih ederim.
2) Sınıftaki diğer öğrenciler ile karşılaştırıldığında, biyoloji dersinde başarılı olmayı beklerim.
3) Biyoloji sınavlarında o kadar heyecanlı olurum ki, öğrendiklerimi hatırlayamam.
4) Biyoloji dersinde anlatılanları öğrenmek benim için önemlidir.
5) Biyoloji dersinde öğrendiklerimden hoşlanırım.
6) Biyoloji dersinde öğretilen konuları anlayabildiğimden eminim.
7) Biyoloji dersinde öğrendiklerimi başka derslerde kullanabileceğimi düşünüyorum.
8) Biyoloji dersinde çok başarılı olacağımı düşünüyorum.
9) Sınıftaki diğer öğrenciler ile karşılaştırıldığında, iyi bir öğrenci olduğumu düşünüyorum.
10) Daha fazla çalışma gerektirse bile, bir şeyler öğrenebileceğim ödev konularını seçmeyi tercih ederim .
11) Biyoloji dersi için belirlenen görevleri en iyi şekilde yapabileceğimden eminim.
12) Biyoloji sınavlarında kendimi huzursuz ve mutsuz hissederim.
13) Biyoloji dersinden iyi bir not alacağımı düşünüyorum.
114
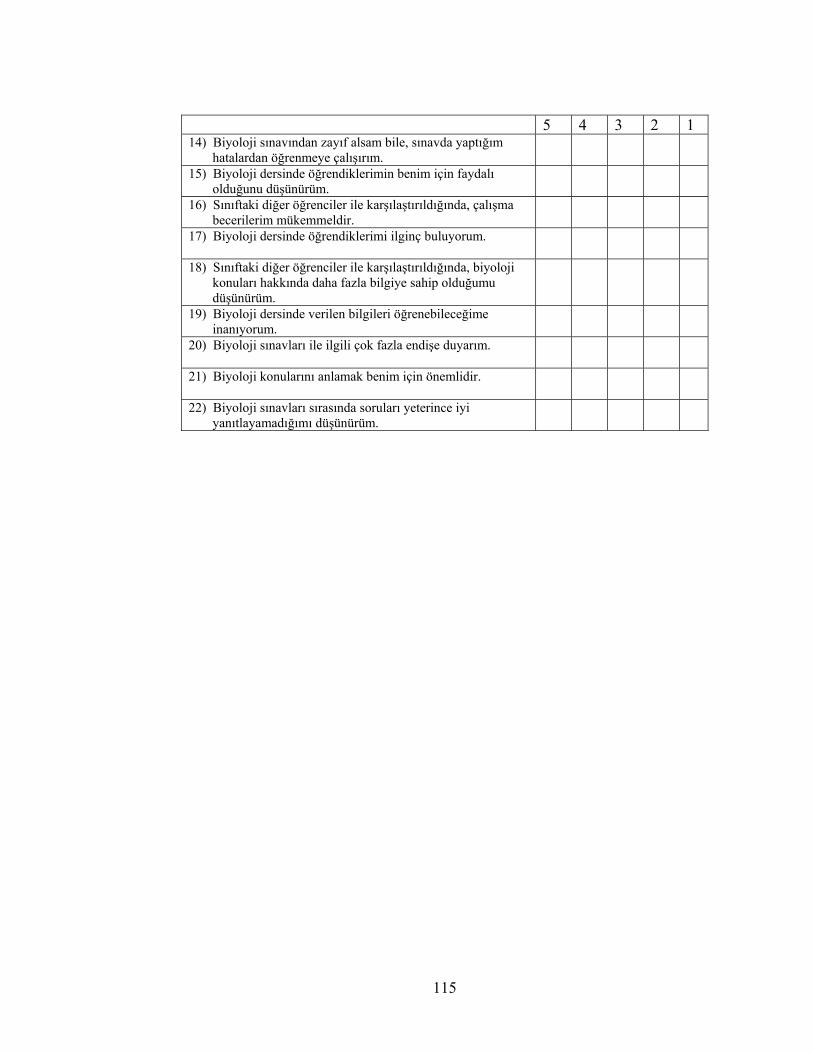
5 4 3 2 1 14) Biyoloji sınavından zayıf alsam bile, sınavda yaptığım
hatalardan öğrenmeye çalışırım.
15) Biyoloji dersinde öğrendiklerimin benim için faydalı olduğunu düşünürüm.
16) Sınıftaki diğer öğrenciler ile karşılaştırıldığında, çalışma becerilerim mükemmeldir.
17) Biyoloji dersinde öğrendiklerimi ilginç buluyorum.
18) Sınıftaki diğer öğrenciler ile karşılaştırıldığında, biyoloji konuları hakkında daha fazla bilgiye sahip olduğumu düşünürüm.
19) Biyoloji dersinde verilen bilgileri öğrenebileceğime inanıyorum.
20) Biyoloji sınavları ile ilgili çok fazla endişe duyarım.
21) Biyoloji konularını anlamak benim için önemlidir.
22) Biyoloji sınavları sırasında soruları yeterince iyi yanıtlayamadığımı düşünürüm.
115
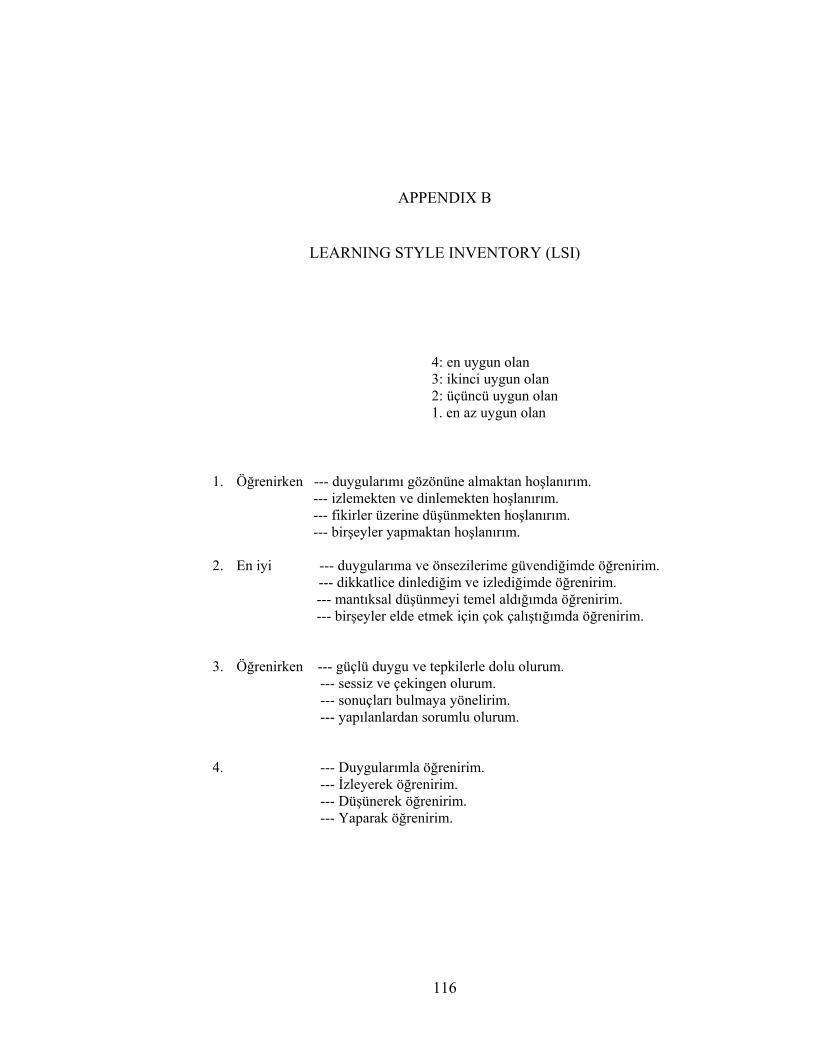
APPENDIX B
LEARNING STYLE INVENTORY (LSI)
4: en uygun olan 3: ikinci uygun olan 2: üçüncü uygun olan 1. en az uygun olan
1. Öğrenirken --- duygularımı gözönüne almaktan hoşlanırım. --- izlemekten ve dinlemekten hoşlanırım. --- fikirler üzerine düşünmekten hoşlanırım. --- birşeyler yapmaktan hoşlanırım.
2. En iyi --- duygularıma ve önsezilerime güvendiğimde öğrenirim. --- dikkatlice dinlediğim ve izlediğimde öğrenirim.
--- mantıksal düşünmeyi temel aldığımda öğrenirim. --- birşeyler elde etmek için çok çalıştığımda öğrenirim.
3. Öğrenirken --- güçlü duygu ve tepkilerle dolu olurum.
--- sessiz ve çekingen olurum. --- sonuçları bulmaya yönelirim. --- yapılanlardan sorumlu olurum.
4. --- Duygularımla öğrenirim. --- İzleyerek öğrenirim. --- Düşünerek öğrenirim. --- Yaparak öğrenirim.
116
5. --- Yeni deneyimlere açık olurum.
--- Konunun her yönüne bakarım. --- Analiz etmekten ve onları parçalara ayırmaktan hoşlanırım. --- Denemekten hoşlanırım.
6. Öğrenirken --- sezgisel biriyim. --- gözleyen biriyim. --- mantıklı biriyim. --- hareketli biriyim.
7. En iyi --- kişisel ilişkilerden öğrenirim.
--- gözlemlerden öğrenirim. --- akılcı kuramlardan öğrenirim. --- uygulama ve denemelerden öğrenirim.
8. Öğrenirken --- kişisel olarak o işin bir parçası olurum.
--- işleri yapmak için acele etmem. --- kuram ve fikirlerden hoşlanırım. --- çalışmamdaki sonuçları görmekten hoşlanırım.
9. En iyi --- duygularıma dayandığım zaman öğrenirim.
--- gözlemlerime dayandığım zaman öğrenirim. --- fikirlerime dayandığım zaman öğrenirim. --- öğrendiklerimi uyguladığım zaman öğrenirim.
10. Öğrenirken --- kabul eden biriyim.
--- çekingen biriym. --- akılcı biriyim. --- sorumlu biriyim.
11. Öğrenirken --- katılırım.
--- gözlemekten hoşlanırım. --- değerlendiririm. --- aktif olmaktan hoşlanırım.
12. En iyi --- akılcı ve açık fikirli olduğum zaman öğrenirim.
--- dikkatli olduğum zaman öğrenirim. --- fikirleri analiz ettiğim zaman öğrenirim. --- pratik olduğum zaman öğrenirim.
117
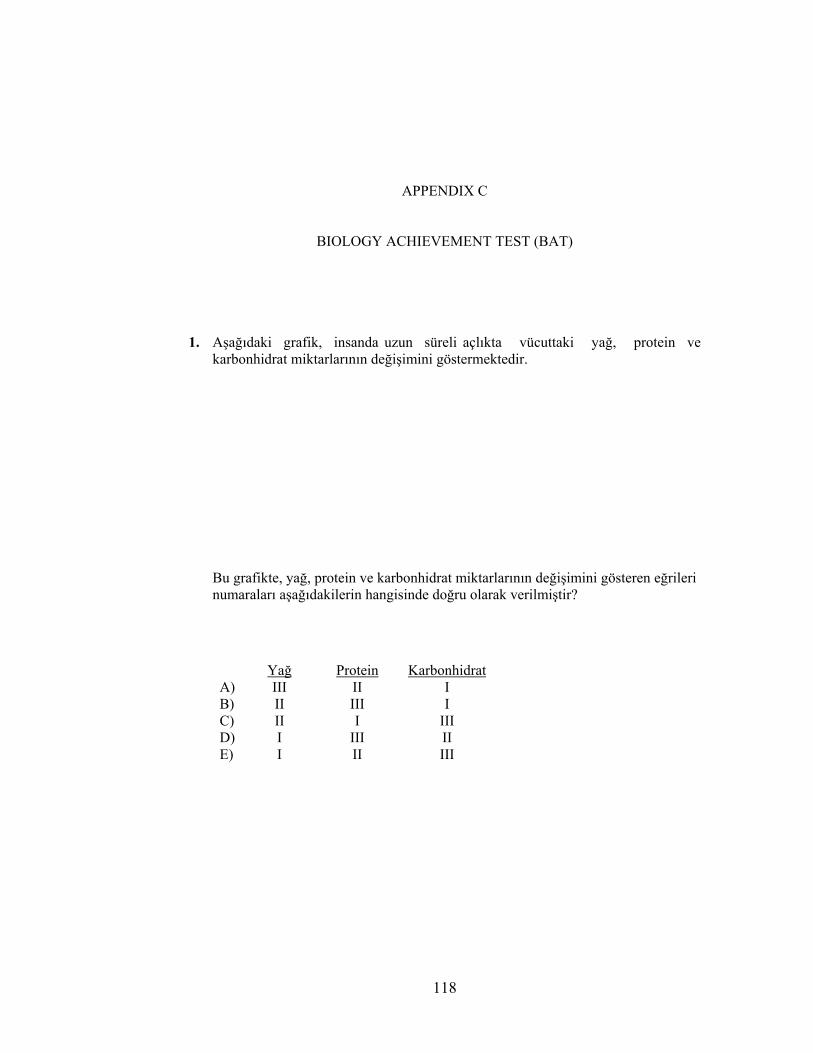
APPENDIX C
BIOLOGY ACHIEVEMENT TEST (BAT)
1. Aşağıdaki grafik, insanda uzun süreli açlıkta vücuttaki yağ, protein ve karbonhidrat miktarlarının değişimini göstermektedir.
Bu grafikte, yağ, protein ve karbonhidrat miktarlarının değişimini gösteren eğrileri numaraları aşağıdakilerin hangisinde doğru olarak verilmiştir?
Yağ Protein KarbonhidratA) III II I B) II III I C) II I III D) I III II E) I II III
118
2. Bir hücrenin bir molekülü pasif taşıma (difüzyon) ile içine alamamasının
nedeni aşağıdakilerden hangisi olabilir?
A) Hücrede ATP miktarının az olması B) Hücrede ilgili enzimin bulunmaması C) Molekülün hücre içindeki derişiminin az olması D) Molekülün suda çözünebilir olması E) Molekülün yapısının büyük olması
3. Bir balık türü, yaşamının,
- I. evresinde bakteriler, su pireleri ve küçük bitkilerle
- II. evresinde eklembacaklılar, salyongozlar ve küçük balıklarla
beslenmektedir.
Bu balık türünün I. ve II. evrelerindeki beslenme biçimlerinin adları aşağıdakilerinin hangisinde doğru olarak verilmiştir?
I IIA) Karışık Etobur B) Karışık Otobur C) Otobur Etobur D) Etobur Etobur E) Otobur Karışık
4. Aşağıdaki yapılardan hangisinin, karşısındaki olayla ilişkisi yoktur?
A) Ribozom – Protein sentezi B) Kloroplast – Fotosentez C) Mitokondri – Fermentasyon D) Çekirdek – Mitoz bölünme E) Hücre zarı – Osmoz
119
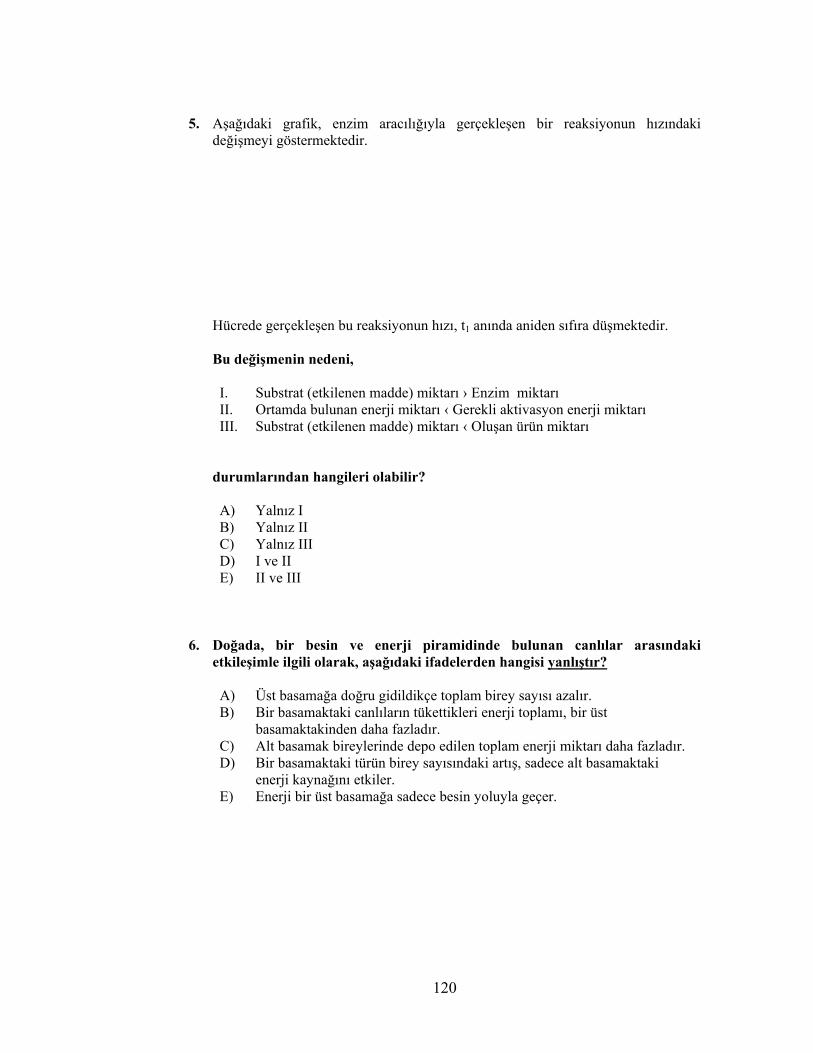
5. Aşağıdaki grafik, enzim aracılığıyla gerçekleşen bir reaksiyonun hızındaki
değişmeyi göstermektedir.
Hücrede gerçekleşen bu reaksiyonun hızı, t1 anında aniden sıfıra düşmektedir.
Bu değişmenin nedeni, I. Substrat (etkilenen madde) miktarı › Enzim miktarı II. Ortamda bulunan enerji miktarı ‹ Gerekli aktivasyon enerji miktarı III. Substrat (etkilenen madde) miktarı ‹ Oluşan ürün miktarı
durumlarından hangileri olabilir? A) Yalnız I B) Yalnız II C) Yalnız III D) I ve II E) II ve III
6. Doğada, bir besin ve enerji piramidinde bulunan canlılar arasındaki etkileşimle ilgili olarak, aşağıdaki ifadelerden hangisi yanlıştır?
A) Üst basamağa doğru gidildikçe toplam birey sayısı azalır. B) Bir basamaktaki canlıların tükettikleri enerji toplamı, bir üst
basamaktakinden daha fazladır. C) Alt basamak bireylerinde depo edilen toplam enerji miktarı daha fazladır. D) Bir basamaktaki türün birey sayısındaki artış, sadece alt basamaktaki
enerji kaynağını etkiler. E) Enerji bir üst basamağa sadece besin yoluyla geçer.
120
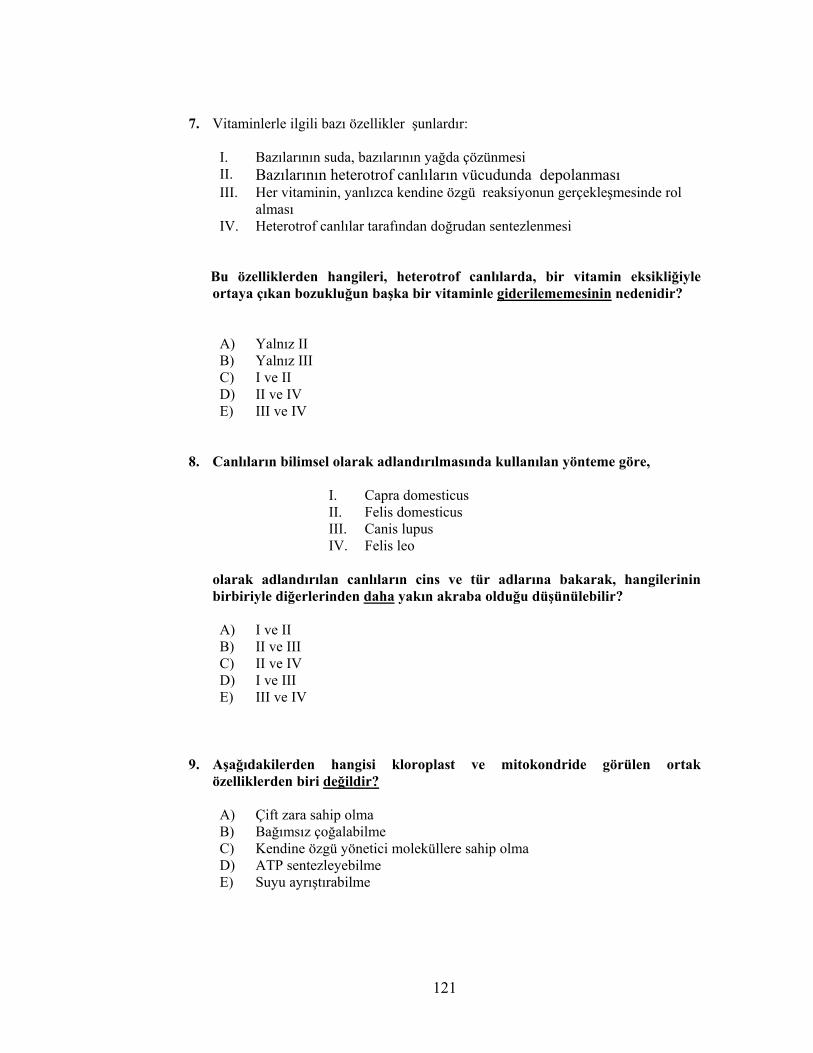
7. Vitaminlerle ilgili bazı özellikler şunlardır:
I. Bazılarının suda, bazılarının yağda çözünmesi II. Bazılarının heterotrof canlıların vücudunda depolanması III. Her vitaminin, yanlızca kendine özgü reaksiyonun gerçekleşmesinde rol
alması IV. Heterotrof canlılar tarafından doğrudan sentezlenmesi
Bu özelliklerden hangileri, heterotrof canlılarda, bir vitamin eksikliğiyle
ortaya çıkan bozukluğun başka bir vitaminle giderilememesinin nedenidir?
A) Yalnız II B) Yalnız III C) I ve II D) II ve IV E) III ve IV
8. Canlıların bilimsel olarak adlandırılmasında kullanılan yönteme göre,
I. Capra domesticus II. Felis domesticus III. Canis lupus IV. Felis leo
olarak adlandırılan canlıların cins ve tür adlarına bakarak, hangilerinin birbiriyle diğerlerinden daha yakın akraba olduğu düşünülebilir?
A) I ve II B) II ve III C) II ve IV D) I ve III E) III ve IV
9. Aşağıdakilerden hangisi kloroplast ve mitokondride görülen ortak
özelliklerden biri değildir?
A) Çift zara sahip olma B) Bağımsız çoğalabilme C) Kendine özgü yönetici moleküllere sahip olma D) ATP sentezleyebilme E) Suyu ayrıştırabilme
121

10.
Bir populasyonun birey sayısı, yukarıdaki büyüme eğrisinde görüldüğü gibi, I.zaman aralığında artmış, II. zaman aralığında azalmıştır.
Aşağıdakilerin hangisinde verilenler, birey sayısında iki zaman aralığında görülen bu değişmeleri doğrudan sağlayabilecek nedenler arasındadır?
I. zaman aralığında II. zaman aralığındaA) Avcı sayısının artması Populasyon dışına göçün azalması B) Populasyon dışına göçün artması Avcı hayvan sayısının azalması C) Avcı hayvan sayısının artması Hastalıkların azalması D) Doğum oranının artması Besin miktarının azalması E) Hastalıkların artması Besin rekabetinin azalması
11. ‘Bitkilerde nişastanın yıkımını sağlayan enzimler vardır.’ hipotezini doğrulamak için düzenlenen deneyde, bitki özütünün, aşağıdaki karışımlardan hangisinin bulunduğu tüpe konması gerekir?
A) Nişasta + Monosakkarit ayıracı B) Nişasta yıkan enzim + Monosakkarit ayıracı C) Nişasta ayıracı + Nişasta yıkan enzim D) Monosakkarit + Nişasta yıkan enzim E) Monosakkarit + Monosakkarit ayıracı
12. Bir enzimin hücrede sentezinin başlamasından dışarıya salgılanmasına kadar gerçekleşen olaylarda, aşağıdaki yapı ve organellerden hangisinin doğrudan işlevi yoktur?
A) Ribozom B) Endoplazmik retikulum C) Hücre zarı D) Lizozom E) Golgi aygıtı
122
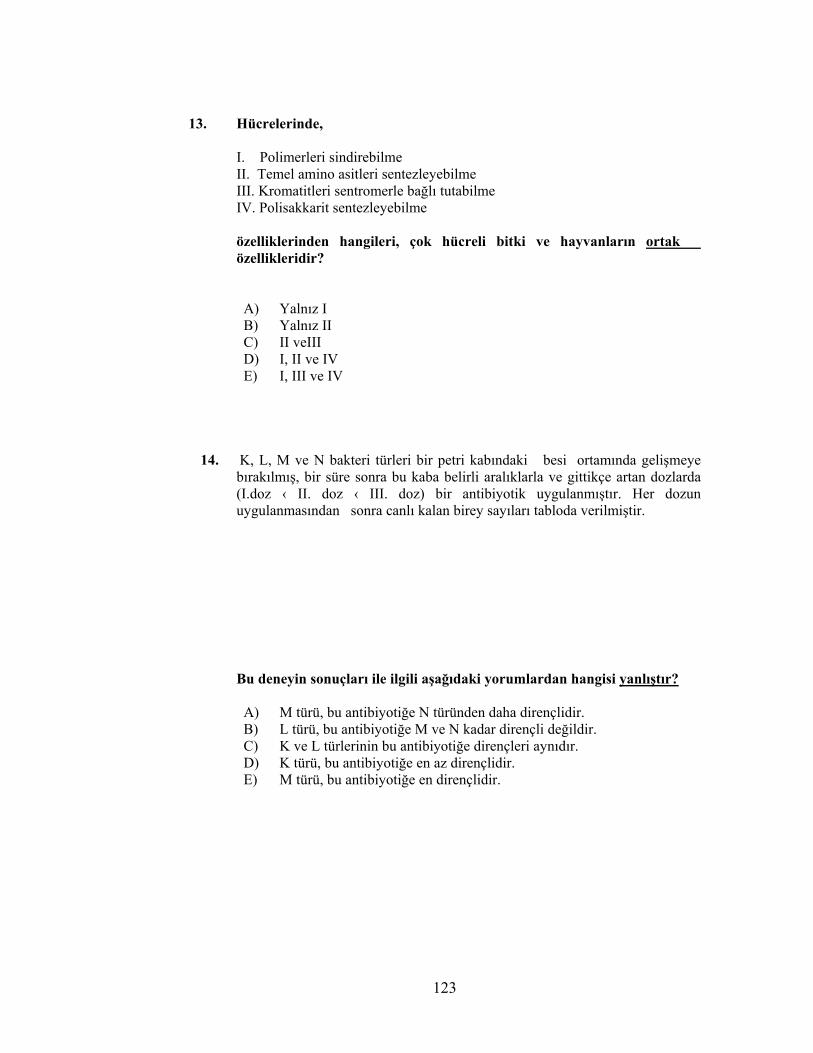
13. Hücrelerinde,
I. Polimerleri sindirebilme II. Temel amino asitleri sentezleyebilme III. Kromatitleri sentromerle bağlı tutabilme IV. Polisakkarit sentezleyebilme özelliklerinden hangileri, çok hücreli bitki ve hayvanların ortak özellikleridir? A) Yalnız I B) Yalnız II C) II veIII D) I, II ve IV E) I, III ve IV
14. K, L, M ve N bakteri türleri bir petri kabındaki besi ortamında gelişmeye
bırakılmış, bir süre sonra bu kaba belirli aralıklarla ve gittikçe artan dozlarda (I.doz ‹ II. doz ‹ III. doz) bir antibiyotik uygulanmıştır. Her dozun uygulanmasından sonra canlı kalan birey sayıları tabloda verilmiştir.
Bu deneyin sonuçları ile ilgili aşağıdaki yorumlardan hangisi yanlıştır? A) M türü, bu antibiyotiğe N türünden daha dirençlidir. B) L türü, bu antibiyotiğe M ve N kadar dirençli değildir. C) K ve L türlerinin bu antibiyotiğe dirençleri aynıdır. D) K türü, bu antibiyotiğe en az dirençlidir. E) M türü, bu antibiyotiğe en dirençlidir.
123
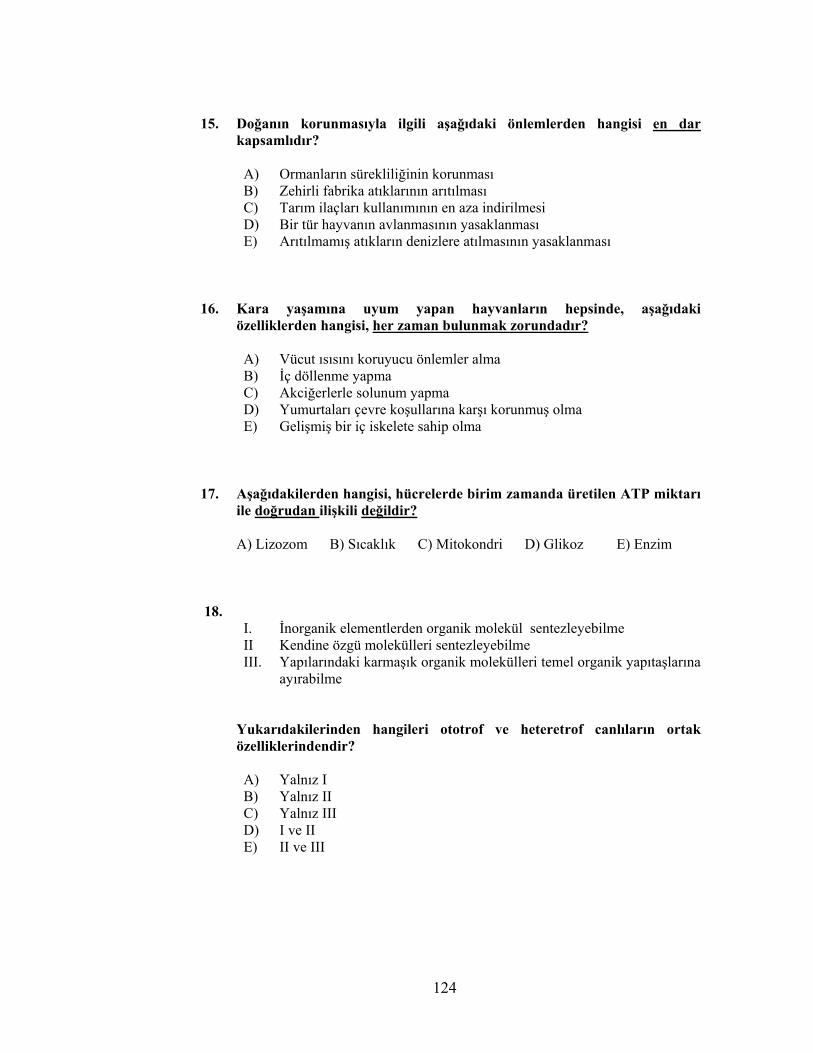
15. Doğanın korunmasıyla ilgili aşağıdaki önlemlerden hangisi en dar
kapsamlıdır? A) Ormanların sürekliliğinin korunması B) Zehirli fabrika atıklarının arıtılması C) Tarım ilaçları kullanımının en aza indirilmesi D) Bir tür hayvanın avlanmasının yasaklanması E) Arıtılmamış atıkların denizlere atılmasının yasaklanması
16. Kara yaşamına uyum yapan hayvanların hepsinde, aşağıdaki özelliklerden hangisi, her zaman bulunmak zorundadır?
A) Vücut ısısını koruyucu önlemler alma B) İç döllenme yapma C) Akciğerlerle solunum yapma D) Yumurtaları çevre koşullarına karşı korunmuş olma E) Gelişmiş bir iç iskelete sahip olma
17. Aşağıdakilerden hangisi, hücrelerde birim zamanda üretilen ATP miktarı
ile doğrudan ilişkili değildir? A) Lizozom B) Sıcaklık C) Mitokondri D) Glikoz E) Enzim
18. I. İnorganik elementlerden organik molekül sentezleyebilme II Kendine özgü molekülleri sentezleyebilme III. Yapılarındaki karmaşık organik molekülleri temel organik yapıtaşlarına
ayırabilme
Yukarıdakilerinden hangileri ototrof ve heteretrof canlıların ortak özelliklerindendir? A) Yalnız I B) Yalnız II C) Yalnız III D) I ve II E) II ve III
124
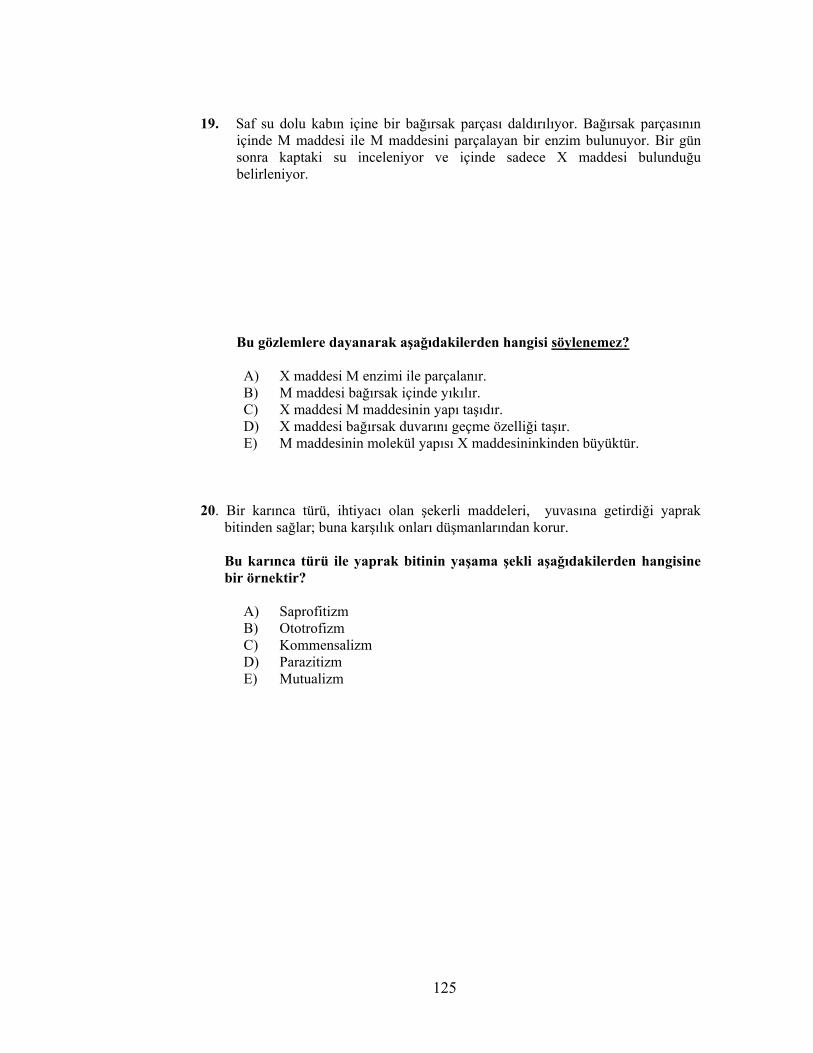
19. Saf su dolu kabın içine bir bağırsak parçası daldırılıyor. Bağırsak parçasının
içinde M maddesi ile M maddesini parçalayan bir enzim bulunuyor. Bir gün sonra kaptaki su inceleniyor ve içinde sadece X maddesi bulunduğu belirleniyor.
Bu gözlemlere dayanarak aşağıdakilerden hangisi söylenemez? A) X maddesi M enzimi ile parçalanır. B) M maddesi bağırsak içinde yıkılır. C) X maddesi M maddesinin yapı taşıdır. D) X maddesi bağırsak duvarını geçme özelliği taşır. E) M maddesinin molekül yapısı X maddesininkinden büyüktür.
20. Bir karınca türü, ihtiyacı olan şekerli maddeleri, yuvasına getirdiği yaprak bitinden sağlar; buna karşılık onları düşmanlarından korur.
Bu karınca türü ile yaprak bitinin yaşama şekli aşağıdakilerden hangisine bir örnektir?
A) Saprofitizm B) Ototrofizm C) Kommensalizm D) Parazitizm E) Mutualizm
125

126