Embed Size (px)
Citation preview
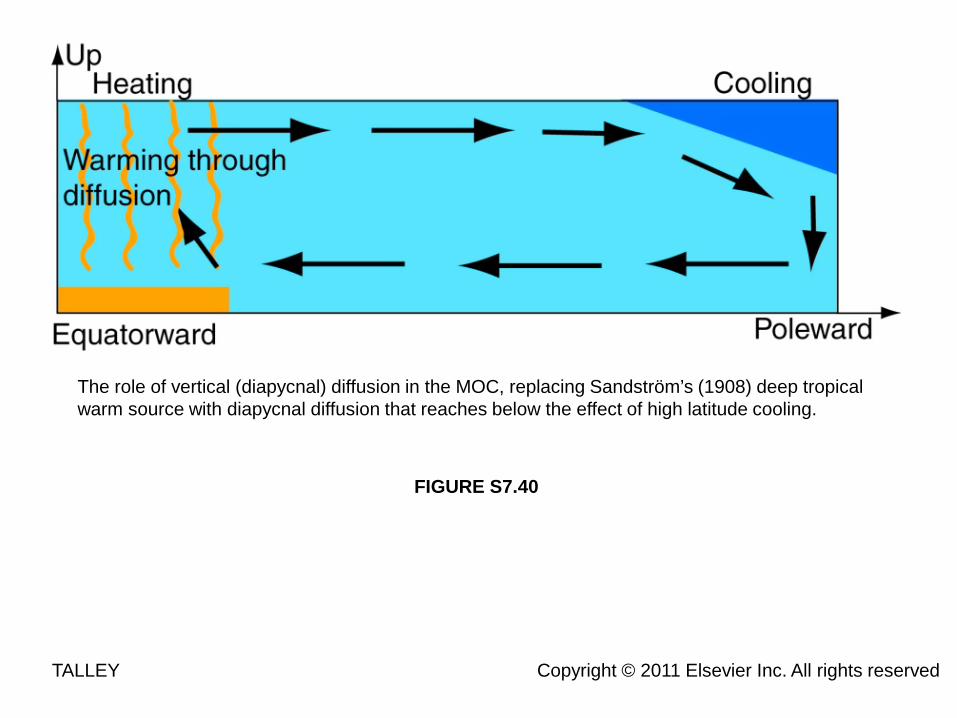
FIGURE S7.40
TALLEY Copyright © 2011 Elsevier Inc. All rights reserved
The role of vertical (diapycnal) diffusion in the MOC, replacing Sandström’s (1908) deep tropical warm source with diapycnal diffusion that reaches below the effect of high latitude cooling.

FIGURE S1.2
Overturning circulation of the Atlantic Ocean according to Merz and Wüst (1923).
TALLEY Copyright © 2011 Elsevier Inc. All rights reserved
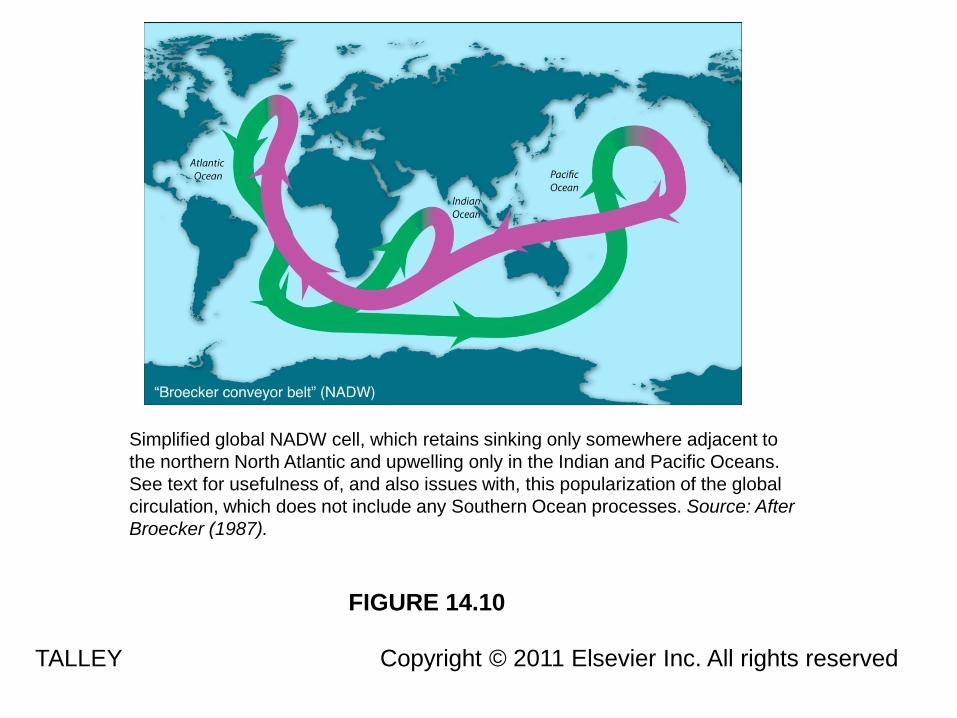
FIGURE 14.10
Simplified global NADW cell, which retains sinking only somewhere adjacent to the northern North Atlantic and upwelling only in the Indian and Pacific Oceans. See text for usefulness of, and also issues with, this popularization of the global circulation, which does not include any Southern Ocean processes. Source: After Broecker (1987).
TALLEY Copyright © 2011 Elsevier Inc. All rights reserved

FIGURE 14.11a
Global overturning circulation schematics. (a) The NADW and AABW global cells and the NPIW cell. (b) Overturn from a Southern Ocean perspective. Source: After Gordon (1991), Schmitz (1996b), and Lumpkin and Speer (2007). (c) Two-dimensional schematic of the interconnected NADW, IDW, PDW, and AABW cells. The schematics do not accurately depict locations of sinking or the broad geographic scale of upwelling. Colors: surface water (purple), intermediate and Southern Ocean mode water (red), PDW/IDW/UCDW (orange), NADW (green), AABW (blue). See Figure S14.1 on the textbook Web site for a complete set of diagrams. This figure can also be found in the color insert. Source: From Talley (2011).
TALLEY Copyright © 2011 Elsevier Inc. All rights reserved


FIGURE 5.3
TALLEY Copyright © 2011 Elsevier Inc. All rights reserved
Schematic diagrams of inflow and outflow characteristics for (a) Mediterranean Sea (negative water balance; net evaporation), (b) Black Sea (positive water balance; net runoff/precipitation).

FIGURE S8.18
Schematic diagram of various types of circulation in seas adjacent to the oceans. (a) Vertically separated inflow and outflow, typified by the Mediterranean and Red Seas (surface inflow and subsurface outflow with transformation within the sea), Baltic Sea and Hudson Bay (subsurface inflow and surface outflow, with transformation within the sea), andBlack Sea (subsurface inflow and surface ouflow, with no deep ventilation within the sea). (b) Horizontally separated inflowand outflow, typified by the Arctic Ocean and Caribbean Sea and also by the North Pacific marginal seas (surface inflow andsurface outflow, usually through a different strait from the inflow), and by the Nordic Seas, Labrador Sea/Baffin Bay, andalso the Persian Gulf (surface inflow and both surface and subsurface outflow).
TALLEY Copyright © 2011 Elsevier Inc. All rights reserved
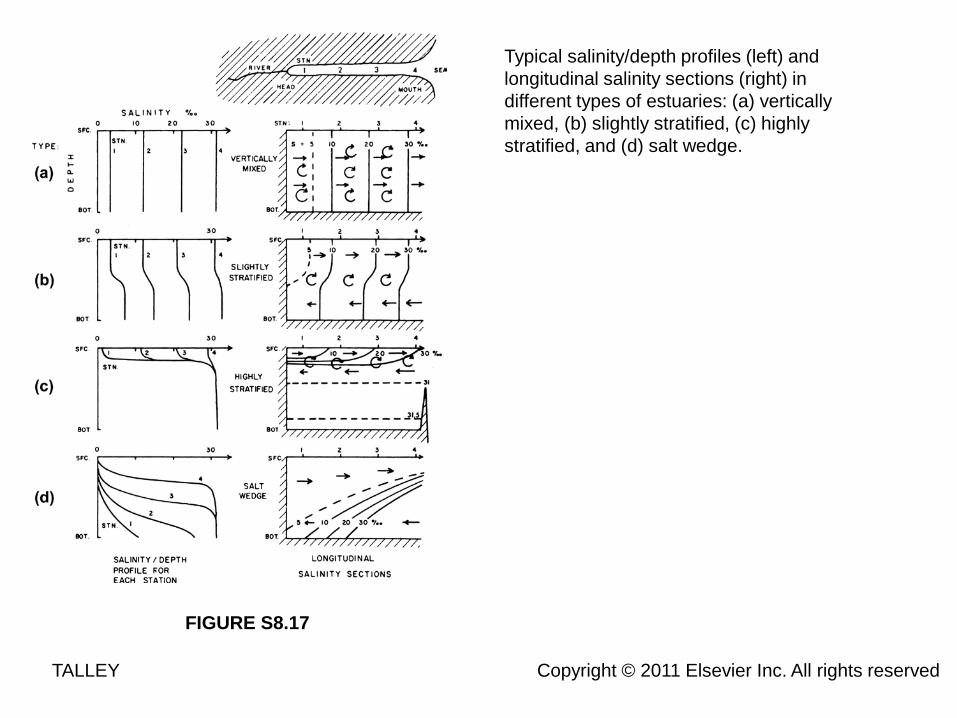
FIGURE S8.17
Typical salinity/depth profiles (left) and longitudinal salinity sections (right) in different types of estuaries: (a) vertically mixed, (b) slightly stratified, (c) highly stratified, and (d) salt wedge.
TALLEY Copyright © 2011 Elsevier Inc. All rights reserved


Waves


Vindbølger
• Genereres av vind• Genererer blanding av overflatelaget• Påvirker derved diffusjon av varme mellom
atmosfære og hav

FIGURE 8.1
TALLEY Copyright © 2011 Elsevier Inc. All rights reserved
Schematic of a sinusoidal wave.


• En første-ordenseffekt er at vannpartiklene beveger seg i sirkler.
• I middel ligger altså partiklene i ro, mens bølgeformen beveger seg.
• Radien r avtar eksponensielt med dybden z (positiv nedover). Når H er bølgehøyde, k=2π/L er bølgetall, L er bølgelengde, blir r(z):
kzeHzr −=2
)(

• Når z=0 blir
• Når z=L/2 blir
• Når z=L blir
12
/)0( 0 == −keHr
%40433.02
/)2
( ≈== −πeHLr
%2.000187.02
/)( 2 ≈== − πeHLr

• En annen-ordenseffekt av bølgene er en partikkelhastighet i bølgens retning. Denne bevegelsen kalles Stokes-drift.

Wind speed

Wave height
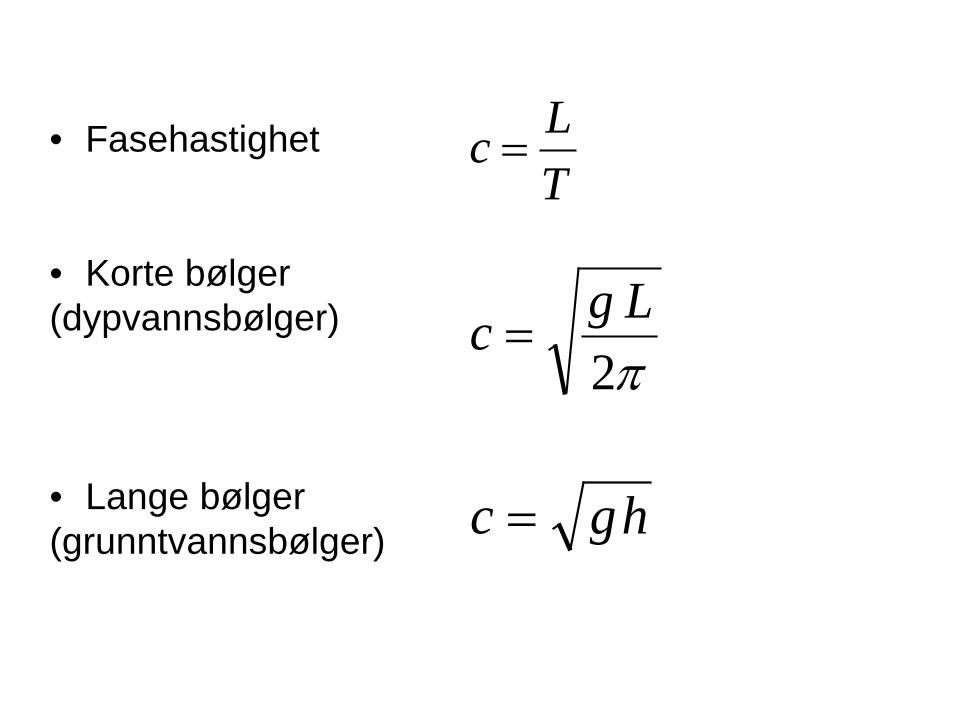
• Fasehastighet
• Korte bølger(dypvannsbølger)
• Lange bølger(grunntvannsbølger)
TLc =
π2Lgc =
hgc =


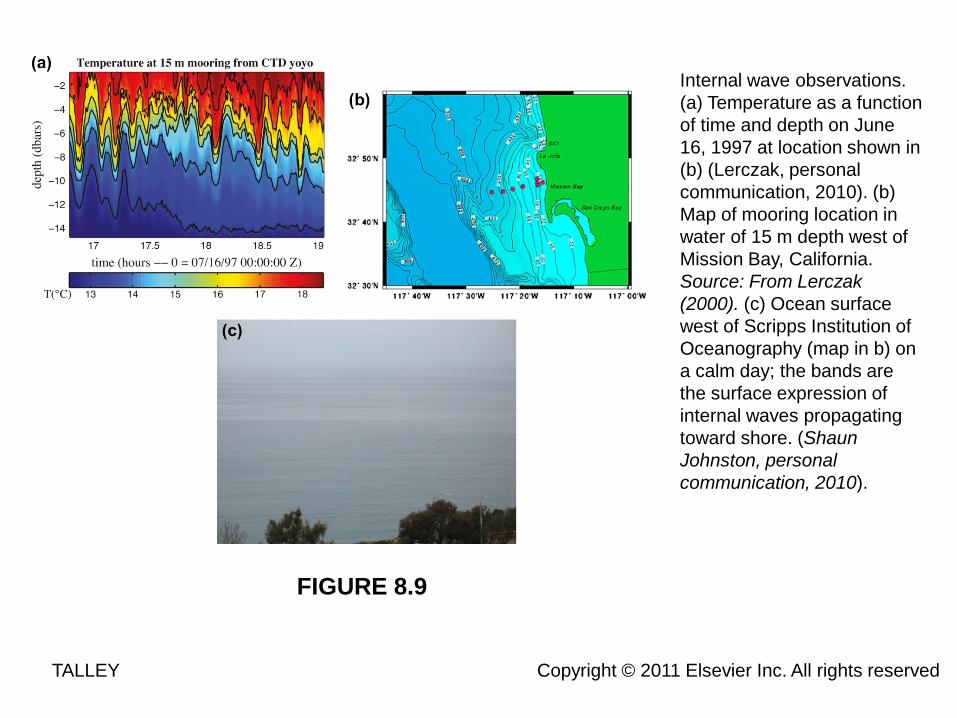
FIGURE 8.9
TALLEY Copyright © 2011 Elsevier Inc. All rights reserved
Internal wave observations. (a) Temperature as a function of time and depth on June 16, 1997 at location shown in (b) (Lerczak, personal communication, 2010). (b) Map of mooring location in water of 15 m depth west of Mission Bay, California. Source: From Lerczak (2000). (c) Ocean surface west of Scripps Institution of Oceanography (map in b) on a calm day; the bands are the surface expression of internal waves propagating toward shore. (Shaun Johnston, personal communication, 2010).