Embed Size (px)
Citation preview

Critical Care Medicine www.ccmjournal.org 255
Series Editor, Jonathan E. Sevransky, MD, MHS
In the modern era, the typical hemodynamic analysis of cardiovascular function focuses on left ventricular (LV) physiology. The reason for this is the primacy of ischemic
heart disease (which most obviously affects LV function) as a cause of death in the developed world as well as the complex pathophysiology of the right ventricle (RV)/venous system, which results in practical difficulties in assessing RV/venous performance in the critically ill. An approach that centers on LV function is appropriate for most cardiologists given their focus on management of myocardial infarction and congestive heart fail-ure. However, intensivists deal with a broader array of cardiovas-cular perturbations including shock states in which vascular dys-function and other extracardiac perturbations may dominate the clinical picture (e.g., septic, hypovolemic, or obstructive shock). An approach to cardiovascular physiology that incorporates both cardiac and vascular elements may be more useful to intensiv-ists than one that focuses exclusively on LV physiology.
This two-part review discusses the role of the heart and venous system in regulating venous return (VR) and cardiac output (CO). The primary determinants of VR are explained and alterations in VR in different pathophysiologic states are described. In the second part of this review, the physiology of VR is graphically integrated with RV physiology in the con-text of a variety of pathophysiologic states including shock. In addition, the effects of common therapies for the shock states (fluid administration, vasopressor and inotropic support, and mechanical ventilation) are examined in relation to their impact on VR and CO interactions.
FUNCTION OF THE VENOUS SYSTEMThe main functions of the systemic venous system are to act as a conduit to return blood to the heart from the periphery and to serve as a reservoir of the circulating blood volume. Al-though the cardiovascular circuit is a two-compartment model comprising both a systemic and pulmonary circuit, >80% of the blood volume held in veins is in the systemic venous circu-lation with three fourths of that in small veins and venules (1, 2) (Table 1). The pulmonary veins contain only a small blood volume and left atrial pressure has a relatively modest effect on left heart function. For these reasons, the physiology of VR can be described, in practical terms, as the physiology of VR to the heart.
Veins have a compliance 30 times greater than arteries and contain approximately 70% of the total blood volume com-pared with only 18% for the arteries (3–5). Because of the
Objective: To provide a conceptual and clinical review of the phys-iology of the venous system as it is relates to cardiac function in health and disease.Data: An integration of venous and cardiac physiology under nor-mal conditions, critical illness, and resuscitation.Summary: The usual teaching of cardiac physiology focuses on left ventricular function. As a result of the wide array of shock states with which intensivists contend, an approach that takes into account the function of the venous system and its interaction with the right and left heart may be more useful. This two-part review focuses on the function of the venous system and right heart under normal and
stressed conditions. The first part describes the basic physiology of the venous system, and part two focuses on the role of the venous system in different pathophysiologic states, particularly shock.Conclusion: An improved understanding of the role of the venous system in health and disease will allow intensivists to better ap-preciate the complex circulatory physiology of shock and may al-low for better hemodynamic management of this disorder. (Crit Care Med 2013; 41:255–262)Key Words: cardiogenic shock; cardiovascular physiology; hemodynamics; hemorrhagic shock; obstructive shock; septic shock
Concise Definitive Review
The Role of Venous Return in Critical Illness and Shock—Part I: Physiology
Duane J. Funk, MD1,2; Eric Jacobsohn, MD1,2; Anand Kumar, MD1,3
1 Section of Critical Care Medicine, Department of Medicine, University of Manitoba, Winnipeg, Manitoba, Canada.
2 Department of Anesthesiology and Perioperative Medicine, University of Manitoba, Winnipeg, Manitoba, Canada.
3 Section of Critical Care Medicine, Cooper University Hospital, Cooper Medical School of Rowan University, Camden, NJ.
The authors have not disclosed any potential conflicts of interest.
For information regarding this article, E-mail: [email protected]
Copyright © 2013 by the Society of Critical Care Medicine and Lippincott Williams & Wilkins
DOI: 10.1097/CCM.0b013e3182772ab6
CCM
CCM
Critical Care Medicine
Crit Care Med
Lippincott Williams & Wilkins
Hagerstown, MD
10.1097/CCM.0b013e3182772ab6
204217
Deepa & Naresh
Funk et al
256 www.ccmjournal.org January 2013 • Volume 41 • Number 1
high compliance of veins, large changes in blood volume are not associated with significant changes in venous transmural pressure. These features make the venous system an ideal blood reservoir that can maintain filling of the right heart despite significant variations in circulatory volume. The veins of the splanchnic bed alone hold approximately 20% to 33% of the total blood volume (6, 7).
Hagen-Poiseuille’s law is central to the understanding of both VR and CO. This law (analogous to Ohm’s law of electri-cal current flow) states that the fluid flow (Q) through a system (such as the cardiovascular circuit) is related to the pressure drop across the system divided by the resistance of the system:
QR
P P•
= 1 2−
where P1 is upstream pressure, P
2 is downstream pressure,
and R is resistance to flow.Left heart output (i.e., CO) and flow through the sys-
temic circulation are commonly described using a variation of Hagen-Poiseuille’s law. The difference between mean arterial pressure (MAP [P
1]) and right atrial pressure (P
RA [P
2]) is the
pressure drop across the system and systemic vascular resis-tance (SVR) represents resistance to flow through the circuit:
COMAP
SVRRAP=
−
Because CO must equal VR, it is intuitive that VR to the right heart can be similarly described:
VR ms RA
v
P PR
=−
where Pms
is the mean systemic pressure of the circula-tion and R
V is the resistance to VR. The P
ms is the upstream
pressure for the venous circulation, whereas PRA
is again the downstream pressure (as it is in the equation describing sys-temic blood flow). This equation represents the application of Hagen-Poiseuille’s law to the venous circulation. Note that this conceptual framework suggests that arterial pressure is unre-lated to VR and that the flow into the systemic arterial circuit is only relevant insofar as it is required to maintain the volume
of the venous reservoir. The concept of Pms
is described more fully subsequently.
Note that resistance to flow in both equations (SVR and Rv)
is directly proportional to the length of the blood vessels (l), the viscosity of blood (η), and it is inversely proportional to the radius (r) of the vessels to the fourth power. Mathematically:
Rnl
r=
84π
In most pathophysiologic analyses, the radius and length of the conduit are emphasized in the assessment of resistance to flow; viscosity is ignored. However, in clinical settings, liters of low-viscosity (relative to whole blood) crystalloid or col-loids may be administered over short periods. Furthermore, priming a cardiopulmonary bypass or extracorporeal mem-brane oxygenation circuit also involves administration of large amounts of low viscosity fluids. In these settings, alterations in blood viscosity resulting from hemodilution may provide a significant contribution to changes in resistance (8, 9).
Although the most common theoretical construct of car-diac function used by clinicians suggests that the left heart plays a major role in the regulation of CO (three of the four determinants of left heart CO, that is, preload, heart rate, and contractility, are intrinsically cardiac-related indices), the VR equation suggests cardiac function plays only an indirect role in the governance of VR. The only way that cardiac function can affect VR is by altering P
RA and thereby changing the driv-
ing pressure gradient. As a consequence of the normal modest operating range of pressures in the venous circuit (8–12 mm Hg in venules to 1–2 mm Hg in the vena cava/right atrium) (10), small changes in P
RA can drive very large changes in VR.
Given that CO and VR must be equal in a closed system, the obvious corollary is that CO, under most physiological and pathophysiological conditions, is not primarily dependent on LV cardiac function, but on VR to the right heart.
Further to this issue, CO/VR is, in fact, determined by the interaction of the heart as a whole (inclusive of the right heart, pulmonary circuit, and left heart characteristics) with the systemic vascular circuit, not by any individual element. The elements contributing to cardiac function in this context include the loads on and compliance of the right and left ven-tricles and the compliance and resistance of the pulmonary circuit. For the sake of simplicity, our subsequent discussion often focuses on right heart function but it should be under-stood that right heart function in this context represents an amalgam of all influences on the heart as a whole.
To appreciate VR physiology, three related factors must be appreciated: the concepts of P
ms, stressed and unstressed vol-
umes, and venous resistance (Rv). The concept of Pms
dates back to the late 1800s when Bayliss and Starling surmised that if the circulation was transiently halted, arterial pressure would fall and venous pressure would rise (11). They reasoned that the pressure in the entire system during cardiac standstill would equilibrate at what they termed P
ms. After blood in the
circulatory system started flowing again, upstream (arterial) pressure would rise and downstream (venous) pressure would
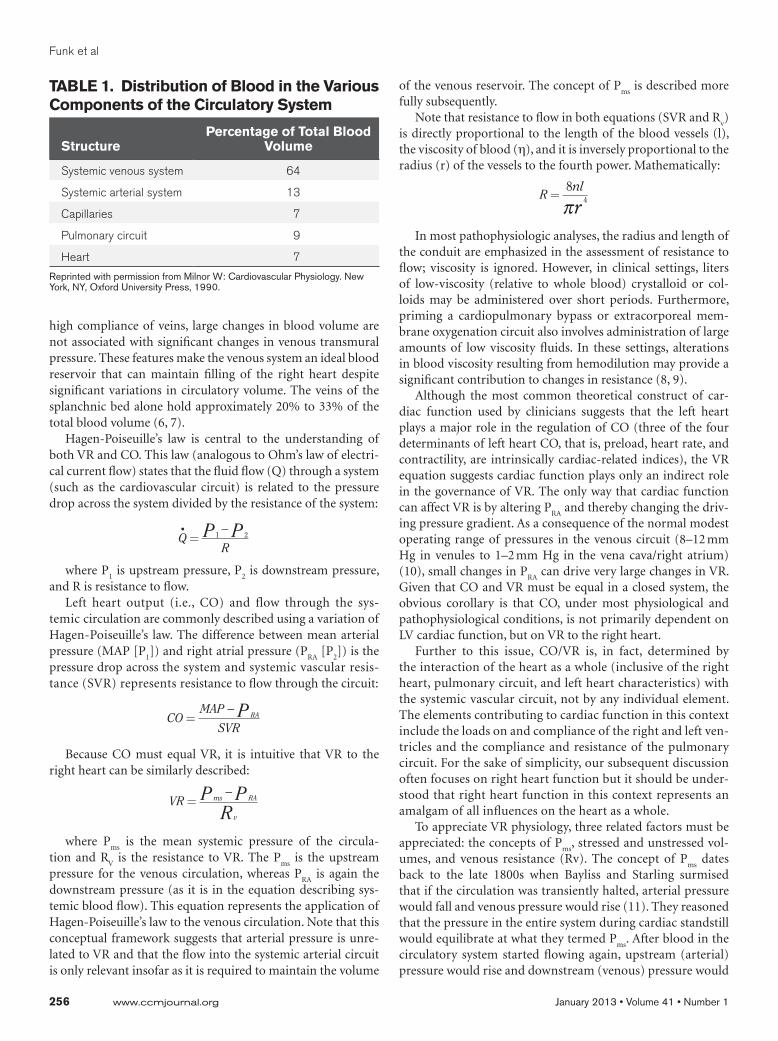
TABLE 1. Distribution of Blood in the Various Components of the Circulatory System
Structure
Percentage of Total Blood Volume
Systemic venous system 64
Systemic arterial system 13
Capillaries 7
Pulmonary circuit 9
Heart 7
Reprinted with permission from Milnor W: Cardiovascular Physiology. New York, NY, Oxford University Press, 1990.
Concise Definitive Review
Critical Care Medicine www.ccmjournal.org 257
fall as a consequence of the pumping action of the heart. How-ever, the average pressure across the system would be the same as when it was at rest (i.e., P
ms). Bayliss and Starling further
reasoned that a point in the circulation that was equal to the P
ms during active flow had to lie on the venous side of the cir-
culation because of its higher capacitance. They also deter-mined that P
ms must be independent of MAP because it could
be defined in the absence of cardiac pump function. As a con-sequence, P
ms is understood to represent the upstream pres-
sure (P1 in Poiseuille’s law) supporting VR. The PRA
, which is usually understood as a measure of right ventricular pre-load (and a key determinant of increased CO), represents the downstream resistive pressure to VR (P2 in Poiseuille’s Law) in this model.
The value of Pms
in the body is described by the equation:
Pms
= Vs/Csw
where Vs is stressed blood volume and C is systemic compli-ance (mean compliance of the cardiovascular circuit). The lat-ter approximates the compliance of the venous reservoir.
Unstressed intravascular volume can be defined as that vol-ume required to fill the circulatory system to capacity without any increase in transmural pressure (2). Stressed volume would be that amount that, when added to the unstressed volume, gen-
erates the vascular transmural pressure. To grasp the concept of stressed and unstressed volumes in the circulatory system, it is helpful to understand that only a portion of the total blood vol-ume (Vt) contributes to the residual pressure (i.e., P
ms) in the cir-
culation during cardiac standstill. Passive exsanguination of an anticoagulated experimental animal would result in a large blood loss. The external, exsanguinated volume would represent the stressed blood volume (Vs). The amount remaining in the circu-lation would be the unstressed volume (Vo).
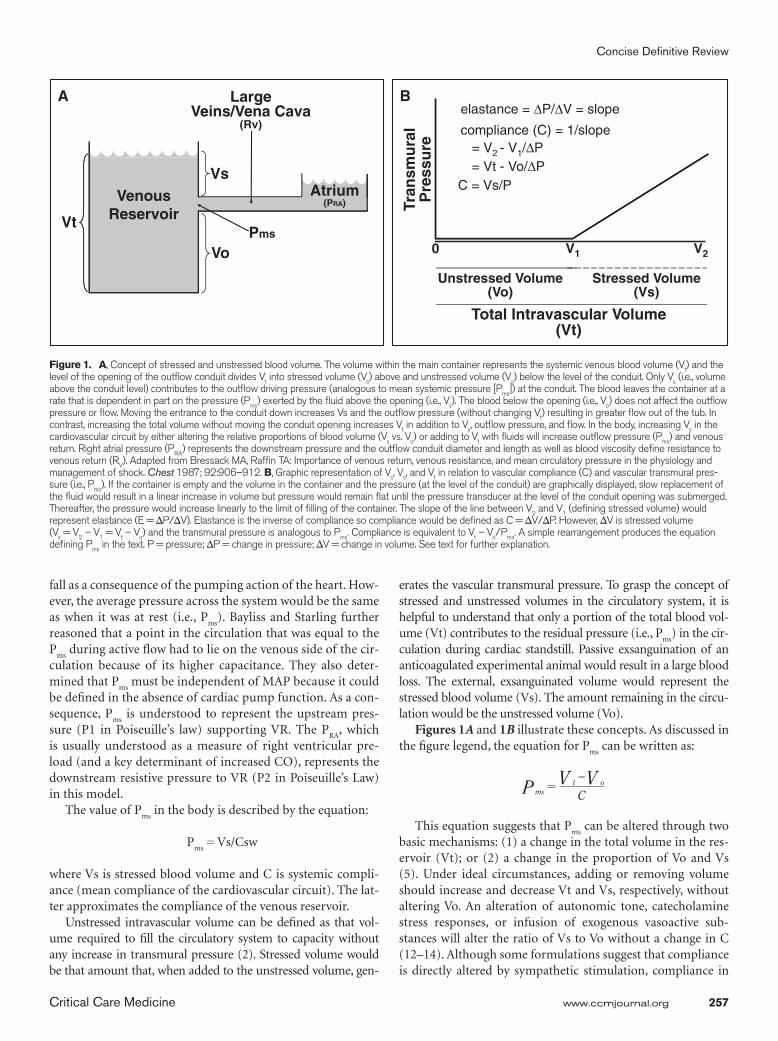
Figures 1A and 1B illustrate these concepts. As discussed in the figure legend, the equation for P
ms can be written as:
mst oP V VC
=−
This equation suggests that Pms
can be altered through two basic mechanisms: (1) a change in the total volume in the res-ervoir (Vt); or (2) a change in the proportion of Vo and Vs (5). Under ideal circumstances, adding or removing volume should increase and decrease Vt and Vs, respectively, without altering Vo. An alteration of autonomic tone, catecholamine stress responses, or infusion of exogenous vasoactive sub-stances will alter the ratio of Vs to Vo without a change in C (12–14). Although some formulations suggest that compliance is directly altered by sympathetic stimulation, compliance in
Figure 1. A, Concept of stressed and unstressed blood volume. The volume within the main container represents the systemic venous blood volume (Vt) and the level of the opening of the outflow conduit divides Vt into stressed volume (Vs) above and unstressed volume (Vo) below the level of the conduit. Only Vs (i.e., volume above the conduit level) contributes to the outflow driving pressure (analogous to mean systemic pressure [Pms]) at the conduit. The blood leaves the container at a rate that is dependent in part on the pressure (Pms) exerted by the fluid above the opening (i.e., Vs). The blood below the opening (i.e., Vo) does not affect the outflow pressure or flow. Moving the entrance to the conduit down increases Vs and the outflow pressure (without changing Vt) resulting in greater flow out of the tub. In contrast, increasing the total volume without moving the conduit opening increases Vt in addition to Vs, outflow pressure, and flow. In the body, increasing Vs in the cardiovascular circuit by either altering the relative proportions of blood volume (Vs vs. Vo) or adding to Vt with fluids will increase outflow pressure (Pms) and venous return. Right atrial pressure (PRA) represents the downstream pressure and the outflow conduit diameter and length as well as blood viscosity define resistance to venous return (RV). Adapted from Bressack MA, Raffin TA: Importance of venous return, venous resistance, and mean circulatory pressure in the physiology and management of shock. Chest 1987; 92:906–912. B, Graphic representation of Vs, Vo, and Vt in relation to vascular compliance (C) and vascular transmural pres-sure (i.e., Pms). If the container is empty and the volume in the container and the pressure (at the level of the conduit) are graphically displayed, slow replacement of the fluid would result in a linear increase in volume but pressure would remain flat until the pressure transducer at the level of the conduit opening was submerged. Thereafter, the pressure would increase linearly to the limit of filling of the container. The slope of the line between V2 and V1 (defining stressed volume) would represent elastance (E = ∆P/∆V). Elastance is the inverse of compliance so compliance would be defined as C = ∆V/∆P. However, ∆V is stressed volume (Vs = V2 – V1 = Vt – Vo) and the transmural pressure is analogous to Pms. Compliance is equivalent to Vt – Vo/Pms. A simple rearrangement produces the equation defining Pms in the text. P = pressure; ∆P = change in pressure; ∆V = change in volume. See text for further explanation.
LargeVeins/Vena Cava
(Rv)
VsAtrium
(PRA)
Vt
VoPms
VenousReservoir
Pre
ssu
re
elastance = ∆P/∆V = slope
compliance (C) = 1/slope= V2 - V1/∆P= Vt - Vo/∆P
C = Vs/P
Tran
smu
ral
Total Intravascular Volume (Vt)
Unstressed Volume(Vo)
Stressed Volume(Vs)
V1 V20
BA

Funk et al
258 www.ccmjournal.org January 2013 • Volume 41 • Number 1
the model should be considered to be an aggregate static (i.e., passive) mechanical property of the vessel walls (2, 7).
Approximately 20% to 30% (approximately 1.5 L) of a typi-cal human’s total blood volume is stressed volume (6). Under normal conditions, human P
ms has been measured at approxi-
mately 8–10 mm Hg (15–17). With that information, the com-pliance of the human vascular bed can be calculated to be ~0.187 L·mm Hg–1 (18–22). Absent autonomic influences, infu-sion of 1 L of fluid would therefore raise the P
ms by 5.3 mm Hg
(1 L/0.187 L·mm Hg–1).The denominator in the equation for VR, the resistance to
VR or RV, is the other major concept that must be explored. The
same basic determinants of resistance that apply for the SVR also apply to R
v, that is, R
v is directly proportional to the length
of the venous circuit and the blood viscosity and is inversely related to the fourth power of the mean radius (r4).
The RV depends on the resistance and capacitance of the
different portions of the peripheral circulation. The cross-sec-tional area and radius of the venous system varies tremendously between the venules and small veins as compared with the large veins and vena cava. This division effectively creates two com-partments. The small veins and venules with a very large cross-sectional area contribute little to Rv and primarily serve as the venous reservoir. The cross-sectional area of the vena cava and large veins is small; these vessels act primarily as a conduit and account for the large majority of venous resistance (R
v). They
make a relatively small contribution to the volume of the venous reservoir. Increased autonomic tone or administration of vaso-pressor compounds creates countervailing effects in increased stressed volume and P
ms in the reservoir compartment (which
increases VR) but decreased mean radius in the vena cava and large veins (which decreases VR). Decreases in autonomic tone and vasodilators have the opposite effect.
The effective length of the venous circulation through which blood passes also affects Rv. The venous system is not a sys-tem of uniform length and volume of veins and venules. Some parts of the venous system have longer, slower paths for flow, whereas others are shorter and faster. This has been described as short- and long-time constant beds (23, 24). The time con-stant, or τ, of a vascular bed is determined by the volume of the bed divided by the flow through it. Among vascular beds with varying time constants, the renal vascular bed has a low vol-ume but rapid flow, giving it a fast time constant, or τ
f. In con-
trast, the skin has a large volume and slow flow, giving it a slow time constant, or τ
s. The fraction of blood distributed between
these tissue beds with fast and slow time constants is called Ff
and Fs, respectively. Autonomic alterations/endogenous factors
and exogenous vasoactive substances, in addition to generat-ing changes in Vs of the venous reservoir and cross-sectional area of the venous circuit, can also result in redistribution of venous flow between long-time constant and short-time con-stant beds. A redistribution of blood from predominantly τ
s to
τf will have the effect of reducing R
v and increasing VR.
Blood viscosity has usually been considered to have negli-gible effects on VR and CO in most analyses. However, recent evidence suggests that the modest increases in VR/CO associ-
ated with crystalloid infusion are generated, in part, through reductions in blood viscosity (resulting in decreased Rv) in addition to any effects on P
ms (9).
Although VR is determined by Pms
, PRA
, and Rv over a wide
variety of physiologic and pathophysiologic conditions, VR is also limited by the mechanics of the respiratory system. Within the thorax, the heart and vascular structures are exposed to pleural pressure (P
PL) that varies with the respiratory cycle.
Outside of the thorax, veins are exposed to relatively constant pressures within the body compartments that approximate (under normal conditions) atmospheric pressure (P
atm). Nor-
mally, PRA
exceeds PPL
and represents the downstream oppos-ing pressure to flow in the numerator of the VR equation (P
ms
– PRA
). However, during inspiration, PPL
becomes increasingly negative. This negative pleural (intrathoracic) pressure is transmitted to the right heart circuit. As a consequence, venous pressures and P
RA may transiently fall below P
atm. Because the
major extrathoracic veins are surrounded by body compart-ment pressures that normally approximate P
atm, they collapse
at the point where they enter the thoracic cavity and then act as Starling resisters (25, 26). Effectively, P
atm becomes the down-
stream pressure opposing venous flow in the numerator of the VR equation (P
ms – P
atm). Blood flow instantaneously and tran-
siently ceases. As flow is halted, the pressure in the proximal thoracic veins and vena cava rapidly rises until it equilibrates with P
ms and the veins open again (because P
ms is greater than
Patm
) and flow is re-established. This sequence cycles rapidly limiting flow during inspiration until positive intrathoracic pressures are re-established with expiration. Then with the next inspiration, the entire cycle repeats itself. As a conse-quence of this effect, VR reaches a plateau when the transmural P
RA is 0 mm Hg (i.e., atmospheric pressure) in the spontane-
ously breathing subject.The graphical representation of the equation for VR is
depicted in Figure 2. VR is maximal when the PRA
(the down-stream pressure) is 0 mm Hg and the gradient between P
ms and
PRA
is greatest. If PRA
falls below 0 mm Hg, flow is limited by the collapse of the extrathoracic veins (as described previously), and VR remains at a plateau. VR falls as P
RA increases. Accord-
ing to the equation for VR (VR = Pms
– PRA
/Rv), VR can only
be 0 when there is no pressure gradient (Pms
– PRA
= 0). This occurs at the intersection of the VR curve with the abscissa (horizontal axis), VR = 0.
The slope of the portion of the VR curve at PRA
>0 (i.e., the diagonal portion of the VR curve) represents the difference in flow (VR) divided by the pressure differential at different points of P
RA (i.e., slope = Q/P). Because resistance is, by defi-
nition, driving pressure divided by flow (P/Q), the inverse of the slope of the VR curve represents R
V (equations shown in
Fig. 2).
Effect of Different Circulatory Manipulations on VRThere are a limited number of ways to change VR. Manipulat-ing either P
ms (and its constitutive factors Vt, Vs, and Vo) and/
or resistance to VR (Rv) will lead to changes in the shape and
position of the VR curves.

Concise Definitive Review
Critical Care Medicine www.ccmjournal.org 259
Any change in Pms
alone leads to a shift in the intercept of the VR curve at the abscissa without any change in the slope of the curve (i.e., venous resistance unchanged) and with the inflection point of the plateau remaining constant at a trans-mural P
RA of 0 mm Hg (Fig. 3). An increase in P
ms shifts the
curve to the right, increasing VR. This elevation of Pms
can be driven by an increase in Vt, whereas Vo remains fixed or an increase in the proportion of Vs relative to Vo. A decrease in P
ms
generates a shift in the opposite direction (toward a decrease in VR). Any decrease in P
ms is caused by a decrease in Vt, whereas
Vo remains fixed or a decrease in the ratio of Vs to Vo.In contrast, an isolated change in R
v affects the slope of the
VR curve without moving the intercept of the curve with the abscissa/x-axis (i.e., P
ms is constant) or the pressure at which the
curve plateaus (Fig. 3). An increase in Rv produces a shallower
slope, whereas a decrease in Rv generates a steeper slope. As seen
in Figure 3, decreasing RV causes an increase in VR for a fixed P
RA,
whereas an increase in RV for a fixed P
RA will cause a decrease in
VR (27–29).
Cardiac Function and Its Relationship to VRThe curves discussed to this point describe a range of possible VR values under different conditions of the venous system (P
ms
and Rv) and cardiac function (as reflected by PRA
). To define VR under any given condition, additional information is needed. The Starling response curve describes CO for any given level of cardiac filling (ventricular end-diastolic volume). A closely re-lated, analogous cardiac function curve can be generated using ventricular end-diastolic pressure or P
RA. Although this analytic
approach is usually applied to the left heart, the right ventricle operates on the same principle. The curve shifts upward with in-creased contractility or decreased afterload and downward with decreased contractility or increased afterload (Fig. 4). Isolated diastolic dysfunction (e.g., acute ischemia) or any decrease in effective cardiac compliance (e.g., in association with increased pericardial or intrathoracic pressure) causes a parallel rightward shift of the curve (Fig. 4). There is some ability of the right ven-tricle to increase its contractility with increases in RV afterload through homeometric autoregulation (also known as the Anrep
VenousReturn
Pms
Rv
Normal
Rv
0
Return
Right Atrial Pressure
Pms
Figure 3. Effect of changes in mean systemic pressure (Pms) and venous resistance (Rv) on venous return (VR). An increase in Pms results in a right-ward shift of the curve, whereas a decrease in Pms causes a leftward shift of the curve (dotted lines). Increasing RV results in a counterclockwise shift in the curve and a drop in VR (dashed lines). Conversely, decreases in RV results in a clockwise shift of the curve and an increase in VR. See text for explanation.
CardiacOutput
contractilityafterload
normalcardiac
Right Atrial Pressure
contractilityafterload
compliance
0
Figure 4. Starling cardiac function curves. Increased contractility or decreased afterload rotates the curve upward. Decreased contractility or increased afterload rotates the curve downward. Isolated diastolic dys-function or decreased effective cardiac compliance causes a parallel and rightward shift of the curve. Note that figures are illustrative and drawn to optimally demonstrate the key concepts of this review. In particular, they are not meant to imply an absence of a plateau with increasing filling pressures.
Figure 2. Venous return (VR) curve. The intersection of the curve with the x-axis/abscissa represents the mean systemic pressure (Pms) because it is at that point VR has a zero value. VR can only be zero if Pms – PRA is zero (i.e., Pms = PRA). The equations on the top left of the figure rearrange the VR equation to define venous resistance (Rv). The equations on the top right define slope of the VR curve. Rv and the inverse of the slope of the VR curve can be shown to be defined by the same equation ([Pms – PRA]/VR) where PRA is right atrial pressure. Therefore, slope is inversely related to Rv. VR is at its maximum with a right atrial pressure (PRA) of 0 mm Hg as a result of the collapsibility of the intrathoracic veins. See text for ad-ditional explanation.
Venous
Pms - PRA
RvVR =
Rv = 1/slope
VRPms - PRA
slope =
Pms - PRA
VRso Rv= Pms - PRA
VRslope =1
slope = 1/RvReturn
Right Atrial Pressure (PRA)
Pms
1/Rv
0
Funk et al
260 www.ccmjournal.org January 2013 • Volume 41 • Number 1
effect) (30). However, RV function will deteriorate if the rise in RV afterload is acute and severe.
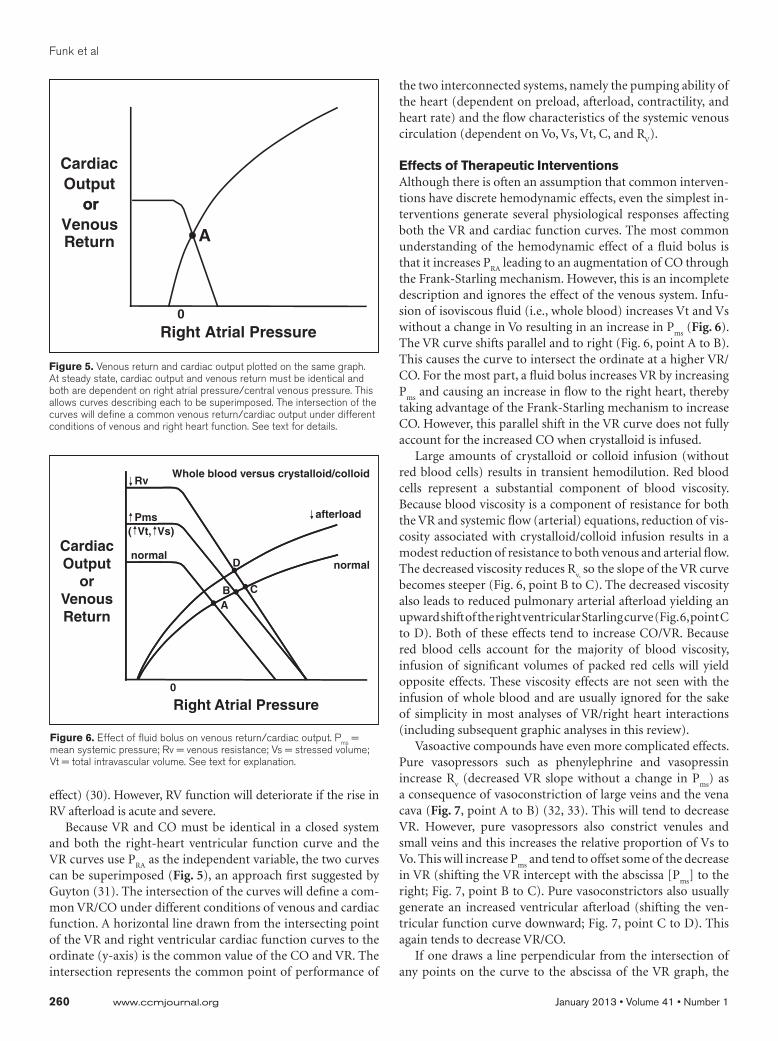
Because VR and CO must be identical in a closed system and both the right-heart ventricular function curve and the VR curves use P
RA as the independent variable, the two curves
can be superimposed (Fig. 5), an approach first suggested by Guyton (31). The intersection of the curves will define a com-mon VR/CO under different conditions of venous and cardiac function. A horizontal line drawn from the intersecting point of the VR and right ventricular cardiac function curves to the ordinate (y-axis) is the common value of the CO and VR. The intersection represents the common point of performance of
the two interconnected systems, namely the pumping ability of the heart (dependent on preload, afterload, contractility, and heart rate) and the flow characteristics of the systemic venous circulation (dependent on Vo, Vs, Vt, C, and R
V).
Effects of Therapeutic InterventionsAlthough there is often an assumption that common interven-tions have discrete hemodynamic effects, even the simplest in-terventions generate several physiological responses affecting both the VR and cardiac function curves. The most common understanding of the hemodynamic effect of a fluid bolus is that it increases P
RA leading to an augmentation of CO through
the Frank-Starling mechanism. However, this is an incomplete description and ignores the effect of the venous system. Infu-sion of isoviscous fluid (i.e., whole blood) increases Vt and Vs without a change in Vo resulting in an increase in P
ms (Fig. 6).
The VR curve shifts parallel and to right (Fig. 6, point A to B). This causes the curve to intersect the ordinate at a higher VR/CO. For the most part, a fluid bolus increases VR by increasing P
ms and causing an increase in flow to the right heart, thereby
taking advantage of the Frank-Starling mechanism to increase CO. However, this parallel shift in the VR curve does not fully account for the increased CO when crystalloid is infused.
Large amounts of crystalloid or colloid infusion (without red blood cells) results in transient hemodilution. Red blood cells represent a substantial component of blood viscosity. Because blood viscosity is a component of resistance for both the VR and systemic flow (arterial) equations, reduction of vis-cosity associated with crystalloid/colloid infusion results in a modest reduction of resistance to both venous and arterial flow. The decreased viscosity reduces R
v, so the slope of the VR curve
becomes steeper (Fig. 6, point B to C). The decreased viscosity also leads to reduced pulmonary arterial afterload yielding an upward shift of the right ventricular Starling curve (Fig. 6, point C to D). Both of these effects tend to increase CO/VR. Because red blood cells account for the majority of blood viscosity, infusion of significant volumes of packed red cells will yield opposite effects. These viscosity effects are not seen with the infusion of whole blood and are usually ignored for the sake of simplicity in most analyses of VR/right heart interactions (including subsequent graphic analyses in this review).
Vasoactive compounds have even more complicated effects. Pure vasopressors such as phenylephrine and vasopressin increase R
v (decreased VR slope without a change in P
ms) as
a consequence of vasoconstriction of large veins and the vena cava (Fig. 7, point A to B) (32, 33). This will tend to decrease VR. However, pure vasopressors also constrict venules and small veins and this increases the relative proportion of Vs to Vo. This will increase P
ms and tend to offset some of the decrease
in VR (shifting the VR intercept with the abscissa [Pms
] to the right; Fig. 7, point B to C). Pure vasoconstrictors also usually generate an increased ventricular afterload (shifting the ven-tricular function curve downward; Fig. 7, point C to D). This again tends to decrease VR/CO.
If one draws a line perpendicular from the intersection of any points on the curve to the abscissa of the VR graph, the
CardiacOutput
Whole blood versus crystalloid/colloid
normalnormal
Pms
Rv
D
afterload
( Vt, Vs)
orVenousReturn
Right Atrial Pressure0
BA
C
Figure 6. Effect of fluid bolus on venous return/cardiac output. Pms = mean systemic pressure; Rv = venous resistance; Vs = stressed volume; Vt = total intravascular volume. See text for explanation.
CardiacOutput
ororVenousReturn
Right Atrial Pressure0
A
Figure 5. Venous return and cardiac output plotted on the same graph. At steady state, cardiac output and venous return must be identical and both are dependent on right atrial pressure/central venous pressure. This allows curves describing each to be superimposed. The intersection of the curves will define a common venous return/cardiac output under different conditions of venous and right heart function. See text for details.

Concise Definitive Review
Critical Care Medicine www.ccmjournal.org 261
intersection represents PRA
. With the addition of a pure vaso-constrictor, the net effect (shift from point A to point D in Fig. 7) is a decrease in VR/CO but with an increase in the mea-sured P
RA. This variance between estimated ventricular pres-
sure and volumes is why static predictors of preload such as PRA
are inadequate in predicting CO and volume responsiveness in critically ill patients (9, 34, 35) and even in normal subjects (36). In summary, the net clinical effect of pure vasopressor administration is usually a decrease in VR/CO with an increase in P
RA and related filling pressures.
Inodilators like dobutamine and milrinone generate distinctly different hemodynamic effects (37, 38). The primary venous effect is venodilatation of both capacitance and resistive ele-ments of the venous circuit. Rv falls and the slope of the VR
relationship becomes steeper (Fig. 8, point A to B), which tends to drive up VR. However, this effect is partially offset by a decrease in the proportion of Vs to Vo, which reduces P
ms
(Fig. 8, point B to C). The combination of arteriolar vasodi-lator activity and direct myocardial inotropic effect results in a marked increase in effective contractility and a shift of the ventricular function relationship upward (Fig. 8, point C to D). The effect is a substantial increase in VR/CO with a concomi-tant decrease in P
RA and related filling pressures.
Vasopressors with inotropic activity such as dopamine and norepinephrine have effects that are intermediate between pure vasopressors and inodilators. α-1 adrenergic agonist activity generates significant vasoconstriction resulting in a shallower VR response curve (Fig. 9, point A to B), but the capacitance beds are also constricted resulting in a shift of venous volume toward Vs, which shifts P
ms to the right (Fig. 9, point B to C).
Because direct myocardial inotropic effects are partially offset by arteriolar vasoconstrictor effects (which increases ventricu-lar afterload), the right ventricular cardiac function curve is not as markedly shifted as seen with the inodilator group (Fig. 9, point C to D). The net effect of a vasopressor with inotro-pic activity is generally to increase VR/CO, although not to the extent seen with inodilators. In addition, P
RA and related filling
pressures are typically unchanged or modestly increased (at small to moderate drug doses).
CONCLUSIONSThe traditional teaching of cardiac physiology has focused almost exclusively on the left side of the heart. This is a conse-quence of the fact that much of the burden of cardiovascular diseases in advanced nations is represented by ischemic heart disease and LV failure that are well described using the most broadly accepted standard determinants of cardiovascular per-formance of heart rate, preload, afterload, and contractility. However, this focus ignores the critical role of the right heart
CardiacOutput
orVenousReturn
Inotropic vasopressors
normalnormalC
D
contractility(dop, NE)
Pms ( Vs)Rv +
Right Atrial Pressure0
ARv
C
B
Figure 9. Effect of inotropic vasopressors on venous return/cardiac output. dop = dopamine; NE = norepinephrine; Pms, = mean systemic pressure; Rv = venous resistance; Vs = stressed volume. See text for explanation.
Cardiacor
VenousReturn
Vasopressors
normalnormal
Right Atrial Pressure0
B
APms ( Vs)
C
D
afterload(PE, VP)
Rv
Rv +
Figure 7. Effect of pure vasopressors on venous return/cardiac output. PE = phenylephrine; VP = vasopressin; Pms = mean systemic pressure; Rv = venous resistance; Vs = stressed volume. See text for explanation.
CardiacOutput
orVenousReturn
Inodilators
normalnormal
Rv
afterloadcontractility(dob, mil)
Pms ( Vs)Rv +
D
Right Atrial Pressure0
A
CB
Figure 8. Effect of inodilators on venous return/cardiac output. dob = dobutamine; mil = milrinone; Pms = mean systemic pressure; Rv = venous resistance; Vs = stressed volume. See text for explanation.

Funk et al
262 www.ccmjournal.org January 2013 • Volume 41 • Number 1
and venous system in regulating VR in states of hemodynam-ic compromise and shock. An approach that integrates right heart performance and VR provides a model that will be intui-tively attractive to most intensivists.
In the second part of this article, we discuss the application of VR curves in the understanding and treatment of different shock states commonly encountered in critical care.
REFERENCES 1. Milnor WR, Nichols WW: A new method of measuring propagation
coefficients and characteristic impedance in blood vessels. Circ Res 1975; 36:631–639
2. Pang CC: Autonomic control of the venous system in health and dis-ease: Effects of drugs. Pharmacol Ther 2001; 90:179–230
3. Hainsworth R: Vascular capacitance: Its control and importance. Rev Physiol Biochem Pharmacol 1986; 105:101–173
4. Rothe CF: Reflex control of veins and vascular capacitance. Physiol Rev 1983; 63:1281–1342
5. Noble BJ, Drinkhill MJ, Myers DS, et al: Mechanisms responsible for changes in abdominal vascular volume during sympathetic nerve stim-ulation in anaesthetized dogs. Exp Physiol 1997; 82:925–934
6. Gelman S: Venous function and central venous pressure: A physi-ologic story. Anesthesiology 2008; 108:735–748
7. Greenway CV, Lister GE: Capacitance effects and blood reservoir function in the splanchnic vascular bed during non-hypotensive haem-orrhage and blood volume expansion in anaesthetized cats. J Physiol (Lond) 1974; 237:279–294
8. Hiesmayr M, Jansen JR, Versprille A: Effects of endotoxin infusion on mean systemic filling pressure and flow resistance to venous return. Pflugers Arch 1996; 431:741–747
9. Kumar A, Anel R, Bunnell E, et al: Effect of large volume infusion on left ventricular volumes, performance and contractility parameters in normal volunteers. Intensive Care Med 2004; 30:1361–1369
10. Smith J, Kampine J: Pressure and flow in the arterial and venous systems. In: Circulatory Physiology: The Essentials. Second Edition. Vardoulakis MK (Ed). Baltimore, Williams & Wilkins, 1984
11. Bayliss WM, Starling EH: Observations on venous pressures and their relationship to capillary pressures. J Physiol (Lond) 1894; 16:159–318.7
12. Shoukas AA, Sagawa K: Control of total systemic vascular capacity by the carotid sinus baroreceptor reflex. Circ Res 1973; 33:22–33
13. Trippodo NC: Total circulatory capacity in the rat. Effects of epineph-rine and vasopressin on compliance and unstressed volume. Circ Res 1981; 49:923–931
14. Caldini P, Permutt S, Waddell JA, et al: Effect of epinephrine on pres-sure, flow, and volume relationships in the systemic circulation of dogs. Circ Res 1974; 34:606–623
15. Starr I: Role of the ‘static blood pressure’ in abnormal increments of venous pressure, especially in heart failure. II. Clinical and experimen-tal studies. Am J Med Sci 1940; 199:40–55
16. Magder S, De Varennes B: Clinical death and the measurement of stressed vascular volume. Crit Care Med 1998; 26:1061–1064
17. Jansen JR, Maas JJ, Pinsky MR: Bedside assessment of mean sys-temic filling pressure. Curr Opin Crit Care 2010; 16:231–236
18. Fessler HE, Brower RG, Wise RA, et al: Effects of positive end-expi-ratory pressure on the gradient for venous return. Am Rev Respir Dis 1991; 143:19–24
19. Fessler HE, Brower RG, Wise RA, et al: Effects of positive end- expiratory pressure on the canine venous return curve. Am Rev Respir Dis 1992; 146:4–10
20. Nanas S, Magder S: Adaptations of the peripheral circulation to PEEP. Am Rev Respir Dis 1992; 146:688–693
21. Tarasiuk A, Scharf SM: Effects of periodic obstructive apneas on venous return in closed-chest dogs. Am Rev Respir Dis 1993; 148:323–329
22. Maas JJ, Geerts BF, van den Berg PC, et al: Assessment of venous return curve and mean systemic filling pressure in postoperative car-diac surgery patients. Crit Care Med 2009; 37:912–918
23. Madger S: Shock physiology. In: Pathophysiologic Foundations of Critical Care. Pinsky MR, Vincent JF (Eds). Baltimore, Williams & Wilkins, 1993, pp 140–160
24. Permutt S, Caldini P: Regulation of cardiac output by the circuit: Venous return. In: Cardiovascular System Dynamics. Boan J, Noorderfraff A, Raines J (Eds). Cambridge, MA, MIT Press, 1978, pp 465–479
25. Deschamps A, Magder S: Effects of heat stress on vascular capaci-tance. Am J Physiol 1994; 266:H2122–H2129
26. Karim F, Hainsworth R: Responses of abdominal vascular capacitance to stimulation of splachnic nerves. Am J Physiol 1976; 231:434–440
27. Bressack MA, Morton NS, Hortop J: Group B streptococcal sepsis in the piglet: Effects of fluid therapy on venous return, organ edema, and organ blood flow. Circ Res 1987; 61:659–669
28. Bressack MA, Raffin TA: Importance of venous return, venous resis-tance, and mean circulatory pressure in the physiology and manage-ment of shock. Chest 1987; 92:906–912
29. Reuter DA, Felbinger TW, Schmidt C, et al: Trendelenburg positioning after cardiac surgery: Effects on intrathoracic blood volume index and cardiac performance. Eur J Anaesthesiol 2003; 20:17–20
30. Lopes Cardozo RH, Steendijk P, Baan J, et al: Right ventricular func-tion in respiratory distress syndrome and subsequent partial liquid ventilation. Homeometric autoregulation in the right ventricle of the newborn animal. Am J Respir Crit Care Med 2000; 162:374–379
31. Guyton AC: Determination of cardiac output by equating venous return curves with cardiac response curves. Physiol Rev 1955; 35:123–129
32. Thiele RH, Nemergut EC, Lynch C 3rd: The clinical implications of isolated alpha(1) adrenergic stimulation. Anesth Analg 2011; 113: 297–304
33. Thiele RH, Nemergut EC, Lynch C 3rd: The physiologic implications of isolated alpha(1) adrenergic stimulation. Anesth Analg 2011; 113:284–296
34. Buhre W, Weyland A, Schorn B, et al: Changes in central venous pressure and pulmonary capillary wedge pressure do not indicate changes in right and left heart volume in patients undergoing coronary artery bypass surgery. Eur J Anaesthesiol 1999; 16:11–17
35. Calvin JE, Driedger AA, Sibbald WJ: Does the pulmonary capillary wedge pressure predict left ventricular preload in critically ill patients? Crit Care Med 1981; 9:437–443
36. Kumar A, Anel R, Bunnell E, et al: Pulmonary artery occlusion pres-sure and central venous pressure fail to predict ventricular filling volume, cardiac performance, or the response to volume infusion in normal subjects. Crit Care Med 2004; 32:691–699
37. Löllgen H, Drexler H: Use of inotropes in the critical care setting. Crit Care Med 1990; 18:S56–S60
38. Hollenberg SM: Inotrope and vasopressor therapy of septic shock. Crit Care Clin 2009; 25:781–802, ix

Critical Care Medicine www.ccmjournal.org 573
Many, if not most, clinicians approach the management of acute cardiovascular dysfunction and shock using an analysis that emphasizes left ventricular
physiology, probably as a consequence of medical training that emphasizes the role of left ventricular dysfunction in ischemic heart disease, the most common cause of death in the developed world. Intensivists deal with a broader array of cardiovascular perturbations including shock states in which vascular dysfunction and other extracardiac perturbations may dominate the clinical picture (e.g., septic, hypovolemic, or obstructive shock). In the first part of this two-part review, we reviewed an approach to cardiovascular physiology that incorporates both cardiac and vascular elements that may be more useful to intensivists than one that focuses exclusively on left ventricular physiology. In the second part of this review, we describe various shock states and how the knowledge of venous return (VR) and cardiac output (CO) curves help to diagnose
and treat the common hemodynamic problems encountered in critical care. The key concepts described here are covered in detail in the first part of the review. The reader is encouraged to read that earlier physiologic review before proceeding with this current pathophysiologic review.
To review, only a portion of the total blood volume (Vt)
contributes to the pressures generated in the circulation (1–6). The unstressed intravascular volume (V
o) can be defined
as that volume required to fill the circulatory system to capacity without any increase in cardiovascular transmural pressure. Stressed volume (V
s) would be that amount
which, when added to the unstressed volume, generates the cardiovascular transmural pressure. Passive exsanguination of an anticoagulated experimental animal would result in a large blood loss. The external, exsanguinated volume would represent the V
s. The amount remaining in the circulation
would be Vo.
The mean systemic pressure (Pms
) is the average pressure throughout the entire circulatory system (cardiac/arterial/cap-illary/venous). It is most easily measured when pressures are equilibrated during brief cardiac standstill (2, 7). During ac-tive circulation, the portion of the cardiovascular circuit that has a pressure equivalent to P
ms is found in the small veins/
venules in the splanchnic bed. Pms
can therefore be considered the upstream pressure driving VR (VR = P
ms − P
RA/R
V, where
PRA
is right atrial pressure and RV is venous resistance). Another
salient point is that the RV is represented by the inverse of the
slope of the VR curve in the graphics attached to this article.
Objective: To provide a conceptual and clinical review of the phys-iology of the venous system as it is related to cardiac function in health and disease.Data: An integration of venous and cardiac physiology under nor-mal conditions, critical illness, and resuscitation.Summary: The usual clinical teaching of cardiac physiology focuses on left ventricular pathophysiology and pathology. Due to the wide ar-ray of shock states dealt with by intensivists, an integrated approach that takes into account the function of the venous system and its inter-action with the right heart may be more useful. In part II of this two-part review, we describe the physiology of venous return and its interaction with the right heart function as it relates to mechanical ventilation and
various shock states including hypovolemic, cardiogenic, obstructive, and septic shock. In particular, we demonstrate how these shock states perturb venous return/right heart interactions. We also show how compensatory mechanisms and therapeutic interventions can tend to return venous return and cardiac output to appropriate values.Conclusion: An improved understanding of the role of the venous system in pathophysiologic conditions will allow intensivists to better appreciate the complex circulatory physiology of shock and related therapies. This should enable improved hemodynamic management of this disorder. (Crit Care Med 2013; 41:573–579)Key Words: cardiogenic shock; cardiovascular physiology; hemo-dynamics; hemorrhagic shock; obstructive shock; septic shock
Role of the Venous Return in Critical Illness and Shock: Part II—Shock and Mechanical Ventilation
Duane J. Funk, MD1,2; Eric Jacobsohn, MD1,2; Anand Kumar, MD1,3
1 Section of Critical Care Medicine, Department of Medicine, University of Manitoba, Manitoba, Canada.
2 Department of Anesthesiology and Perioperative Medicine, University of Manitoba, Manitoba, Canada.
3 Section of Critical Care Medicine, Cooper University Hospital, Cooper Medical School of Rowan University, Camden, NJ.
The authors have not disclosed any potential conflicts of interest
For information regarding this article, E-mail: [email protected]
CCM
CCM
Critical Care Medicine
Crit Care Med
Lippincott Williams & Wilkins
Hagerstown, MD
10.1097/CCM.0b013e31827bfc25
204243
2012
Manimegalai
Concise Definitive Review
Copyright © 2013 by the Society of Critical Care Medicine and Lippincott Williams & Wilkins
DOI: 10.1097/CCM.0b013e31827bfc25
Concise Definitive ReviewSeries Editor, Jonathan E. Sevransky, MD, MHS
Funk et al
574 www.ccmjournal.org February 2013 • Volume 41 • Number 2
VR AND CO IN PATHOPHYSIOLOGIC STATES
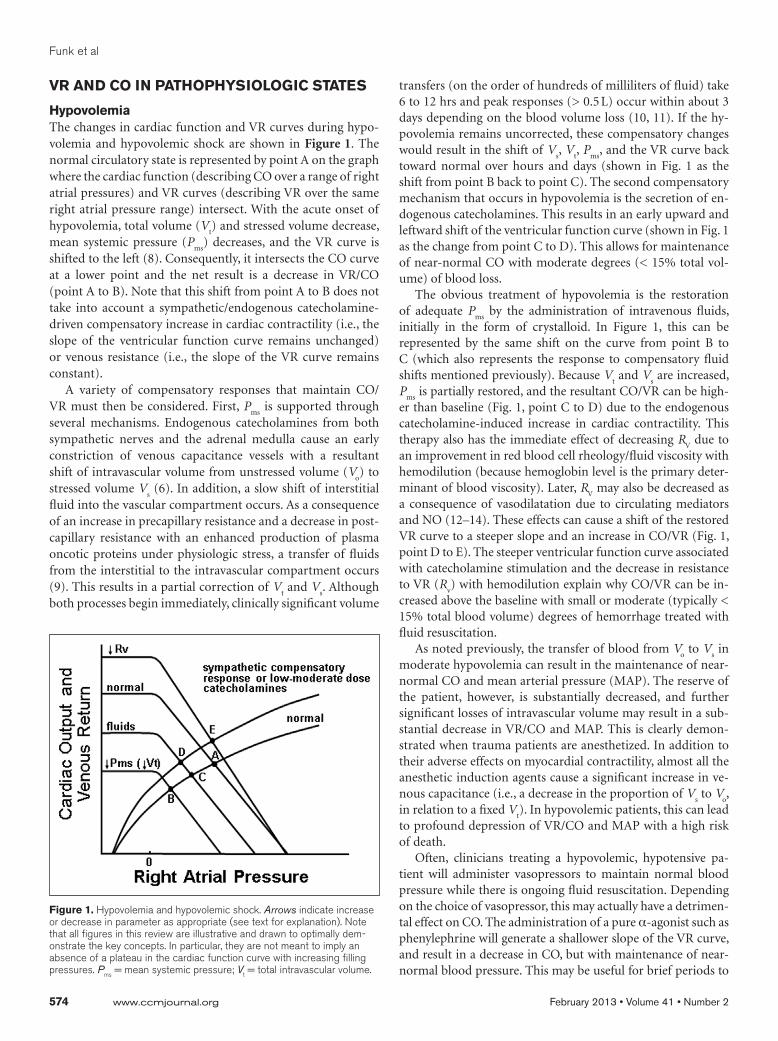
HypovolemiaThe changes in cardiac function and VR curves during hypo-volemia and hypovolemic shock are shown in Figure 1. The normal circulatory state is represented by point A on the graph where the cardiac function (describing CO over a range of right atrial pressures) and VR curves (describing VR over the same right atrial pressure range) intersect. With the acute onset of hypovolemia, total volume (V
t) and stressed volume decrease,
mean systemic pressure (Pms
) decreases, and the VR curve is shifted to the left (8). Consequently, it intersects the CO curve at a lower point and the net result is a decrease in VR/CO (point A to B). Note that this shift from point A to B does not take into account a sympathetic/endogenous catecholamine-driven compensatory increase in cardiac contractility (i.e., the slope of the ventricular function curve remains unchanged) or venous resistance (i.e., the slope of the VR curve remains constant).
A variety of compensatory responses that maintain CO/VR must then be considered. First, P
ms is supported through
several mechanisms. Endogenous catecholamines from both sympathetic nerves and the adrenal medulla cause an early constriction of venous capacitance vessels with a resultant shift of intravascular volume from unstressed volume (V
o) to
stressed volume Vs (6). In addition, a slow shift of interstitial
fluid into the vascular compartment occurs. As a consequence of an increase in precapillary resistance and a decrease in post-capillary resistance with an enhanced production of plasma oncotic proteins under physiologic stress, a transfer of fluids from the interstitial to the intravascular compartment occurs (9). This results in a partial correction of V
t and V
s. Although
both processes begin immediately, clinically significant volume
transfers (on the order of hundreds of milliliters of fluid) take 6 to 12 hrs and peak responses (> 0.5 L) occur within about 3 days depending on the blood volume loss (10, 11). If the hy-povolemia remains uncorrected, these compensatory changes would result in the shift of V
s, V
t, P
ms, and the VR curve back
toward normal over hours and days (shown in Fig. 1 as the shift from point B back to point C). The second compensatory mechanism that occurs in hypovolemia is the secretion of en-dogenous catecholamines. This results in an early upward and leftward shift of the ventricular function curve (shown in Fig. 1 as the change from point C to D). This allows for maintenance of near-normal CO with moderate degrees (< 15% total vol-ume) of blood loss.
The obvious treatment of hypovolemia is the restoration of adequate P
ms by the administration of intravenous fluids,
initially in the form of crystalloid. In Figure 1, this can be represented by the same shift on the curve from point B to C (which also represents the response to compensatory fluid shifts mentioned previously). Because V
t and V
s are increased,
Pms
is partially restored, and the resultant CO/VR can be high-er than baseline (Fig. 1, point C to D) due to the endogenous catecholamine-induced increase in cardiac contractility. This therapy also has the immediate effect of decreasing R
V due to
an improvement in red blood cell rheology/fluid viscosity with hemodilution (because hemoglobin level is the primary deter-minant of blood viscosity). Later, R
V may also be decreased as
a consequence of vasodilatation due to circulating mediators and NO (12–14). These effects can cause a shift of the restored VR curve to a steeper slope and an increase in CO/VR (Fig. 1, point D to E). The steeper ventricular function curve associated with catecholamine stimulation and the decrease in resistance to VR (R
v) with hemodilution explain why CO/VR can be in-
creased above the baseline with small or moderate (typically < 15% total blood volume) degrees of hemorrhage treated with fluid resuscitation.
As noted previously, the transfer of blood from Vo to V
s in
moderate hypovolemia can result in the maintenance of near-normal CO and mean arterial pressure (MAP). The reserve of the patient, however, is substantially decreased, and further significant losses of intravascular volume may result in a sub-stantial decrease in VR/CO and MAP. This is clearly demon-strated when trauma patients are anesthetized. In addition to their adverse effects on myocardial contractility, almost all the anesthetic induction agents cause a significant increase in ve-nous capacitance (i.e., a decrease in the proportion of V
s to V
o,
in relation to a fixed Vt). In hypovolemic patients, this can lead
to profound depression of VR/CO and MAP with a high risk of death.
Often, clinicians treating a hypovolemic, hypotensive pa-tient will administer vasopressors to maintain normal blood pressure while there is ongoing fluid resuscitation. Depending on the choice of vasopressor, this may actually have a detrimen-tal effect on CO. The administration of a pure α-agonist such as phenylephrine will generate a shallower slope of the VR curve, and result in a decrease in CO, but with maintenance of near-normal blood pressure. This may be useful for brief periods to
Figure 1. Hypovolemia and hypovolemic shock. Arrows indicate increase or decrease in parameter as appropriate (see text for explanation). Note that all figures in this review are illustrative and drawn to optimally dem-onstrate the key concepts. In particular, they are not meant to imply an absence of a plateau in the cardiac function curve with increasing filling pressures. Pms = mean systemic pressure; Vt = total intravascular volume.

Concise Definitive Review
Critical Care Medicine www.ccmjournal.org 575
maintain blood pressure in a range that allows effective auto-regulation of flow to vital organs.
Cardiogenic ShockThere are a variety of etiologies that can cause cardiac failure and cardiogenic shock. Most, including increased afterload, depression of myocardial contractility (ischemia, infarction, and others), arrhythmias, and mechanical valve failure affect VR in similar ways in that they increase P
RA. This decreases
the driving pressure gradient (Pms
−PRA
) for venous flow and reduces VR, which directly limits CO.
As seen in Figure 2, cardiac failure and cardiogenic shock shift the cardiac function curve downward and to the right (flatter curve) due to decreased contractility. The resulting in-tersection with the VR curve occurs at a lower than normal CO (Fig. 2 point A to B). Note that at point B, P
ms (the intercept of
the VR curve with the abscissa) is unchanged and although PRA
is substantially higher than normal, VR/CO is markedly lower. In Figure 2, P
RA is the line drawn perpendicular from point B
to the abscissa of the graph. This is in contrast to the effect of fluid loading which increases P
ms, VR/CO, and P
RA. As noted
earlier, the higher PRA
reduces the gradient for blood flow to the right atrium. Thus, despite a higher P
RA and measured central
venous pressure in this condition, VR/CO is reduced.The compensatory release of endogenous catecholamines
causes an increase in Vs relative to V
o with a resulting increase
in Pms
(6). Administration of fluid also increases Pms
by increas-ing V
t and V
s without a change in V
o. Both generate a similar
rightward shift of the VR curve (viscosity effects are ignored). However, because a large degree of myocardial dysfunction results in a ventricular function curve that is substantially flattened, the beneficial impact of any increase in P
ms from
fluid administration or sympathetic activation will be modest (Fig. 2, point B to C). Further fluid administration would not substantially increase CO, but would only increase pulmo-nary venous pressure and lead to the formation of pulmonary
edema. If cardiac contractility is less severely depressed (with a better maintained and steeper cardiac response curve), the initial decrease in CO/VR will be less and the effect of mod-est fluid administration may be sufficient to restore it to a normal range.
The use of inotropic agents is a standard therapy of cardiac failure and cardiogenic shock of almost any etiology. The most common agents used are dobutamine, a synthetic catechol-amine, and milrinone, a phosphodiesterase inhibitor. Both have similar effects on the cardiovascular system, generating a moderate increase in cardiac contractility with a mild-to-mod-erate degree of arteriolar and venous vasodilatation (depen-dent on a lower range dose in the case of dobutamine [15–18]). Both effects are beneficial in cardiac failure. The increase in cardiac contractility and decrease in pulmonary vascular after-load generate a steeper Starling cardiac function curve. Used alone without concomitant fluids, a partial correction of a de-pressed Starling curve will yield a significantly improved VR/CO (Fig. 2, point B to D). However, assuming that V
s and P
ms
are maintained or augmented with modest fluid support, the intersection of the curves moves CO/VR upward toward nor-mal even if contractility remains somewhat depressed (i.e., the ventricular response curve remains shifted downward com-pared with normal) (Fig. 2, point D to E). In addition, the ve-nous vasodilatory effect of both drugs will result in a decrease in R
v (i.e., a steeper VR slope, not shown in Fig. 2), which will
further augment CO/VR again, assuming that Vs and P
ms are
maintained with fluids as the natural effect of a vasodilator will be to decrease the proportion of V
s to V
o and decrease P
ms.
If cardiac injury is sufficiently severe, combined systolic and diastolic dysfunction shifts the ventricular response curve markedly downward (flatter) and to the right. This manifests as a substantial increase in P
RA that causes a narrowing of the P
ms
to PRA
gradient. Because this gradient drives VR, decreased VR/CO will manifest and, if sufficiently severe, cardiogenic shock may result. In that circumstance, dopamine or norepinephrine, inotropic agents with robust inotropic and vasoconstrictive ac-tions, are often required. These drugs, in contrast to milrinone and dobutamine, will tend to increase V
s as a portion of V
t. The
net effect is to generate a more modest inotropic effect than dobutamine or milrinone while maintaining the robust vaso-pressor effects required in hypotensive shock patients (19).
Although ischemic cardiac injury is dominantly left-sided, such injury (from a myocardial infarction for example) will often also cause right ventricular dysfunction. In addition to the fact that there is often an element of direct RV injury with LV infarcts, all causes of left ventricular dysfunction result in increases in pulmonary artery pressures and RV afterload. This represents an impediment to right ventricular systolic ejection and results in a flattening of the right heart Frank-Starling relationship. In addition, the increased P
RA associated with RV dysfunction
results in a narrowing of the VR gradient (Pms
− PRA
) and a decrease of VR/CO. As noted previously, in terms of venous physiology, this increase in P
RA is the only mechanism through
which cardiac dysfunction can reduce VR.
Figure 2. Cardiac failure and cardiogenic shock. Arrows indicate increase or decrease in parameter as appropriate (see text for explanation). Pms = mean systemic pressure.

Funk et al
576 www.ccmjournal.org February 2013 • Volume 41 • Number 2
Distributive ShockDistributive shock is a generic term for a pathophysiologic state that combines hypotension with significant arteriolar and venous dilation. Altered distribution of blood volume and blood flow is also characteristic. Septic shock is the prototypi-cal disease that causes distributive shock, although the other conditions found in critically ill patients may exhibit similar hemodynamic aberrations (systemic inflammatory response, anaphylactic/anaphylactoid responses, vasodilating drugs, liver failure, adrenal insufficiency, anaphylaxis, thiamine deficiency, carcinoid syndrome, etc.).
Activation of the inflammatory cascade as a result of severe infection leads to the release of endogenous mediators such as cytokines (tumor necrosis factor-α, interleukin-1β, etc.), eico-sanoids (prostacyclins, prostaglandins, leukotrienes), and oth-ers (20, 21). Many of these factors drive up regulation of induc-ible nitric oxide synthase (NOS) producing nitric oxide, which is thought to be the end mediator of vascular smooth muscle relaxation throughout the cardiovascular system (22–26). The result is a reduction of R
v and P
ms. In addition, cytokine-me-
diated NOS activity may have a substantial role in the variable degrees of myocardial depression that is typically seen in sepsis and septic shock (27, 28). A graphical representation of septic shock is depicted in Figure 3.
Early in the course of septic shock, Pms
decreases. One of the primary reasons is a shift of stressed volume (V
s) to unstressed
volume (Vo) as a consequence of increased venous capacitance
resulting from active dilation of small venules/veins. This in-crease in unstressed volume (V
o) and decrease in stressed vol-
ume (Vs) have been confirmed in experimental animal models
of canine and porcine endotoxemia (29–31). Furthermore, to-
tal circulating volume (Vt) and stressed volume (Vs) may both
be decreased due to loss of fluids to the interstitium, increased insensible losses, and decreased oral intake. As a consequence of the decreased P
ms in early, unresuscitated septic shock, VR,
and CO are often reduced (Fig. 3, point A to B). Septic shock is also associated with dilatation of large veins and shunting of arterial blood flow to low resistance (fast time constant) vascu-lar beds (as described in part I of this review), both of which decrease R
V and augment VR (31, 32). Hemoconcentration due
to increased fluid loss to the interstitium, increased insensible losses, and decreased fluid intake may generate increased blood viscosity, attenuate the decrease in R
v, and limit augmentation
of VR (30). Overall, despite hemoconcentration, RV decreases
and the slope of the VR curve becomes steeper (Fig. 3, point B to C). However, the decreased R
v typically does not fully com-
pensate for the decreased Pms
in unresuscitated septic shock, and hence CO usually remains depressed. At this unresusci-tated stage of septic shock, the physical examination frequently is suggestive of a hypodynamic, low CO condition. The patient will often be cold and clammy with a narrowed pulse pressure (hypodynamic shock). Central and mixed venous oxygen satu-rations are often low at this stage (33–35).
Subsequently, fluid resuscitation in septic shock generates a marked augmentation in V
t. Although 5 to 10 L of crystalloid
over 24 hrs is often provided in clinical practice (36, 37), a sig-nificantly smaller volume on the order of 0.5 to 2 L is probably sufficient to sufficiently augment V
t (35, 38). Fluid resuscita-
tion results in a correction of Vs and P
ms back to normal (or
potentially higher), allowing the decreased Rv (with steeper VR
curve) to be manifested by increased VR/CO (Fig. 3, point C to D) that can be more than double normal (31). The hyper-dynamic circulation may be further accentuated by a further decrease in R
V related to hemodilution and decreased blood
viscosity (not shown in figure). This classical hyperdynamic (high CO/low SVR) hemodynamic picture of established sep-tic shock typically does not manifest without fluid resuscita-tion (39–42). However, even a modest degree of fluid resusci-tation may be sufficient to allow the permissive effects of the decreased R
v to be expressed as increased CO.
Based on echocardiography and radionuclide ventriculog-raphy, the majority of patients with septic shock also develop a degree of biventricular myocardial depression as manifested by a decreased ejection fraction (with biventricular dilatation (43–45)). However, the decreased R
v in the context of restored V
s
due to fluid resuscitation normally overshadows the depressed contractility so that patients remain substantially hyperdynamic with increased VR/CO. These effects are illustrated in Figure 3 (point D to E). In a small subset of patients, myocardial depres-sion is sufficiently severe that VR/CO remains decreased even af-ter resuscitation (Fig. 3, point F). In this situation, an emphasis on inotropic support rather than the more typical vasopressor approach to therapy may be required.
Obstructive ShockThere are several pathophysiologic phenomena that cause obstructive shock. Conditions such as tension pneumothorax,
Figure 3. Septic shock. Arrows indicate increase or decrease in param-eter as appropriate. Circled “N” indicates “normal” (see text for explana-tion). Pms = mean systemic pressure; Rv = venous resistance.
Concise Definitive Review
Critical Care Medicine www.ccmjournal.org 577
pericardial tamponade, or compression of the inferior vena cava secondary to abdominal compartment syndrome or preg-nancy can all cause a decrease in CO due to obstructive shock. Large pulmonary emboli can also cause a form of obstructive shock that acts very similarly to cardiogenic shock. Given its interesting and complex pathophysiology, tension pneumo-thorax will be examined as an example of obstructive shock.
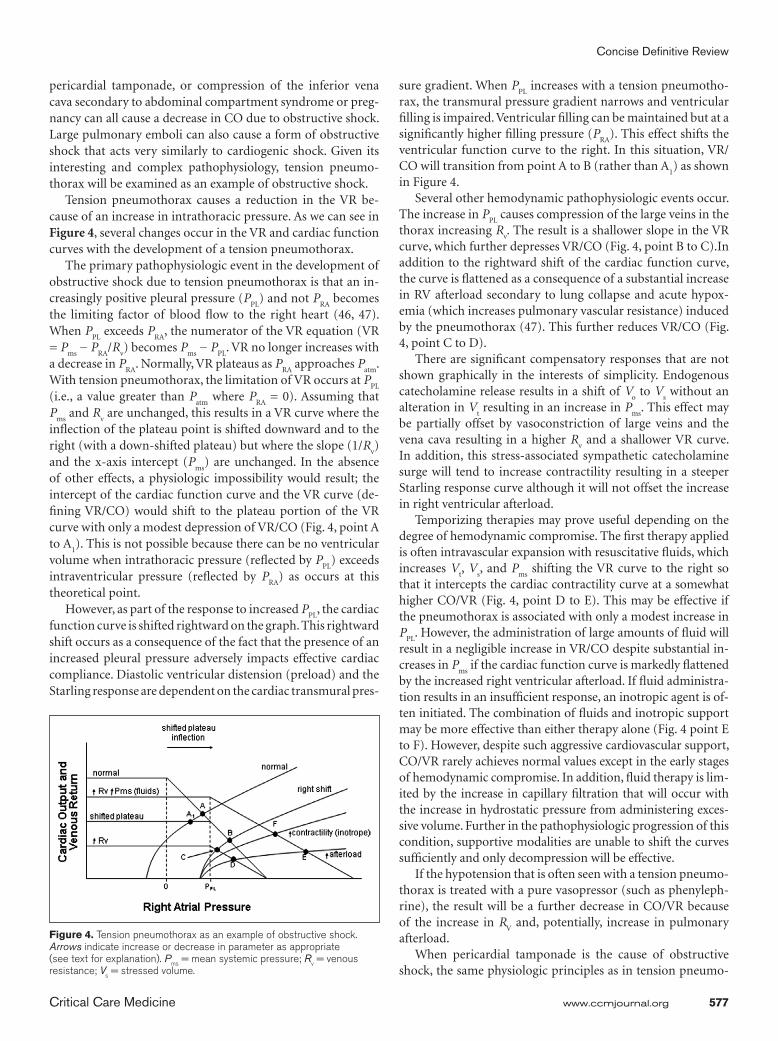
Tension pneumothorax causes a reduction in the VR be-cause of an increase in intrathoracic pressure. As we can see in Figure 4, several changes occur in the VR and cardiac function curves with the development of a tension pneumothorax.
The primary pathophysiologic event in the development of obstructive shock due to tension pneumothorax is that an in-creasingly positive pleural pressure (P
PL) and not P
RA becomes
the limiting factor of blood flow to the right heart (46, 47). When P
PL exceeds P
RA, the numerator of the VR equation (VR
= Pms
− PRA
/Rv) becomes P
ms − P
PL. VR no longer increases with
a decrease in PRA
. Normally, VR plateaus as PRA
approaches Patm
. With tension pneumothorax, the limitation of VR occurs at P
PL
(i.e., a value greater than Patm
where PRA
= 0). Assuming that P
ms and R
v are unchanged, this results in a VR curve where the
inflection of the plateau point is shifted downward and to the right (with a down-shifted plateau) but where the slope (1/R
v)
and the x-axis intercept (Pms
) are unchanged. In the absence of other effects, a physiologic impossibility would result; the intercept of the cardiac function curve and the VR curve (de-fining VR/CO) would shift to the plateau portion of the VR curve with only a modest depression of VR/CO (Fig. 4, point A to A
1). This is not possible because there can be no ventricular
volume when intrathoracic pressure (reflected by PPL
) exceeds intraventricular pressure (reflected by P
RA) as occurs at this
theoretical point.However, as part of the response to increased P
PL, the cardiac
function curve is shifted rightward on the graph. This rightward shift occurs as a consequence of the fact that the presence of an increased pleural pressure adversely impacts effective cardiac compliance. Diastolic ventricular distension (preload) and the Starling response are dependent on the cardiac transmural pres-
sure gradient. When PPL
increases with a tension pneumotho-rax, the transmural pressure gradient narrows and ventricular filling is impaired. Ventricular filling can be maintained but at a significantly higher filling pressure (P
RA). This effect shifts the
ventricular function curve to the right. In this situation, VR/CO will transition from point A to B (rather than A
1) as shown
in Figure 4.Several other hemodynamic pathophysiologic events occur.
The increase in PPL
causes compression of the large veins in the thorax increasing R
v. The result is a shallower slope in the VR
curve, which further depresses VR/CO (Fig. 4, point B to C).In addition to the rightward shift of the cardiac function curve, the curve is flattened as a consequence of a substantial increase in RV afterload secondary to lung collapse and acute hypox-emia (which increases pulmonary vascular resistance) induced by the pneumothorax (47). This further reduces VR/CO (Fig. 4, point C to D).
There are significant compensatory responses that are not shown graphically in the interests of simplicity. Endogenous catecholamine release results in a shift of V
o to V
s without an
alteration in Vt resulting in an increase in P
ms. This effect may
be partially offset by vasoconstriction of large veins and the vena cava resulting in a higher R
v and a shallower VR curve.
In addition, this stress-associated sympathetic catecholamine surge will tend to increase contractility resulting in a steeper Starling response curve although it will not offset the increase in right ventricular afterload.
Temporizing therapies may prove useful depending on the degree of hemodynamic compromise. The first therapy applied is often intravascular expansion with resuscitative fluids, which increases V
t, V
s, and P
ms shifting the VR curve to the right so
that it intercepts the cardiac contractility curve at a somewhat higher CO/VR (Fig. 4, point D to E). This may be effective if the pneumothorax is associated with only a modest increase in P
PL. However, the administration of large amounts of fluid will
result in a negligible increase in VR/CO despite substantial in-creases in P
ms if the cardiac function curve is markedly flattened
by the increased right ventricular afterload. If fluid administra-tion results in an insufficient response, an inotropic agent is of-ten initiated. The combination of fluids and inotropic support may be more effective than either therapy alone (Fig. 4 point E to F). However, despite such aggressive cardiovascular support, CO/VR rarely achieves normal values except in the early stages of hemodynamic compromise. In addition, fluid therapy is lim-ited by the increase in capillary filtration that will occur with the increase in hydrostatic pressure from administering exces-sive volume. Further in the pathophysiologic progression of this condition, supportive modalities are unable to shift the curves sufficiently and only decompression will be effective.
If the hypotension that is often seen with a tension pneumo-thorax is treated with a pure vasopressor (such as phenyleph-rine), the result will be a further decrease in CO/VR because of the increase in R
V and, potentially, increase in pulmonary
afterload.When pericardial tamponade is the cause of obstructive
shock, the same physiologic principles as in tension pneumo-
Figure 4. Tension pneumothorax as an example of obstructive shock. Arrows indicate increase or decrease in parameter as appropriate (see text for explanation). Pms = mean systemic pressure; Rv = venous resistance; Vs = stressed volume.
Funk et al
578 www.ccmjournal.org February 2013 • Volume 41 • Number 2
thorax apply. The difference being that the impedance to VR is now pericardial pressure (P
Per) as opposed to P
PL and the nu-
merator for the VR equation becomes Pms
− PPer
. As with ten-sion pneumothorax, the initial use of fluids and inotropes will have modest effects on improving CO but with pathophysi-ologic progression, only decompression of the tamponade will be effective.
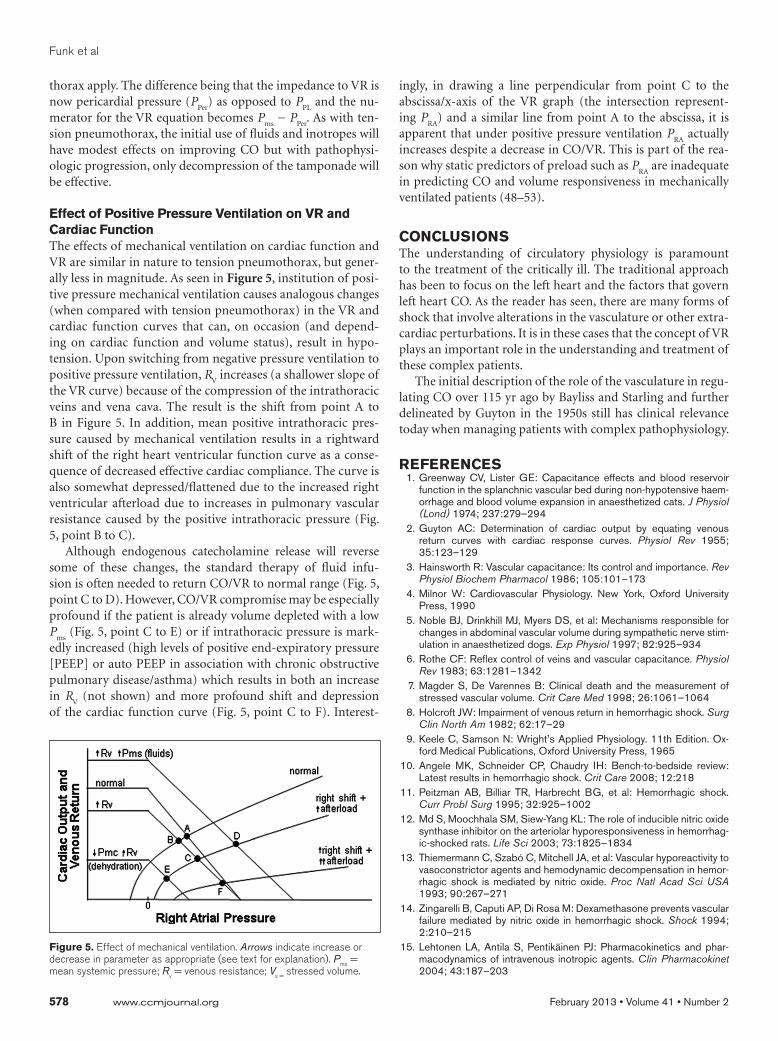
Effect of Positive Pressure Ventilation on VR and Cardiac FunctionThe effects of mechanical ventilation on cardiac function and VR are similar in nature to tension pneumothorax, but gener-ally less in magnitude. As seen in Figure 5, institution of posi-tive pressure mechanical ventilation causes analogous changes (when compared with tension pneumothorax) in the VR and cardiac function curves that can, on occasion (and depend-ing on cardiac function and volume status), result in hypo-tension. Upon switching from negative pressure ventilation to positive pressure ventilation, R
V increases (a shallower slope of
the VR curve) because of the compression of the intrathoracic veins and vena cava. The result is the shift from point A to B in Figure 5. In addition, mean positive intrathoracic pres-sure caused by mechanical ventilation results in a rightward shift of the right heart ventricular function curve as a conse-quence of decreased effective cardiac compliance. The curve is also somewhat depressed/flattened due to the increased right ventricular afterload due to increases in pulmonary vascular resistance caused by the positive intrathoracic pressure (Fig. 5, point B to C).
Although endogenous catecholamine release will reverse some of these changes, the standard therapy of fluid infu-sion is often needed to return CO/VR to normal range (Fig. 5, point C to D). However, CO/VR compromise may be especially profound if the patient is already volume depleted with a low P
ms (Fig. 5, point C to E) or if intrathoracic pressure is mark-
edly increased (high levels of positive end-expiratory pressure [PEEP] or auto PEEP in association with chronic obstructive pulmonary disease/asthma) which results in both an increase in R
V (not shown) and more profound shift and depression
of the cardiac function curve (Fig. 5, point C to F). Interest-
ingly, in drawing a line perpendicular from point C to the abscissa/x-axis of the VR graph (the intersection represent-ing P
RA) and a similar line from point A to the abscissa, it is
apparent that under positive pressure ventilation PRA
actually increases despite a decrease in CO/VR. This is part of the rea-son why static predictors of preload such as P
RA are inadequate
in predicting CO and volume responsiveness in mechanically ventilated patients (48–53).
CONCLUSIONSThe understanding of circulatory physiology is paramount to the treatment of the critically ill. The traditional approach has been to focus on the left heart and the factors that govern left heart CO. As the reader has seen, there are many forms of shock that involve alterations in the vasculature or other extra-cardiac perturbations. It is in these cases that the concept of VR plays an important role in the understanding and treatment of these complex patients.
The initial description of the role of the vasculature in regu-lating CO over 115 yr ago by Bayliss and Starling and further delineated by Guyton in the 1950s still has clinical relevance today when managing patients with complex pathophysiology.
REFERENCES 1. Greenway CV, Lister GE: Capacitance effects and blood reservoir
function in the splanchnic vascular bed during non-hypotensive haem-orrhage and blood volume expansion in anaesthetized cats. J Physiol (Lond) 1974; 237:279–294
2. Guyton AC: Determination of cardiac output by equating venous return curves with cardiac response curves. Physiol Rev 1955; 35:123–129
3. Hainsworth R: Vascular capacitance: Its control and importance. Rev Physiol Biochem Pharmacol 1986; 105:101–173
4. Milnor W: Cardiovascular Physiology. New York, Oxford University Press, 1990
5. Noble BJ, Drinkhill MJ, Myers DS, et al: Mechanisms responsible for changes in abdominal vascular volume during sympathetic nerve stim-ulation in anaesthetized dogs. Exp Physiol 1997; 82:925–934
6. Rothe CF: Reflex control of veins and vascular capacitance. Physiol Rev 1983; 63:1281–1342
7. Magder S, De Varennes B: Clinical death and the measurement of stressed vascular volume. Crit Care Med 1998; 26:1061–1064
8. Holcroft JW: Impairment of venous return in hemorrhagic shock. Surg Clin North Am 1982; 62:17–29
9. Keele C, Samson N: Wright’s Applied Physiology. 11th Edition. Ox-ford Medical Publications, Oxford University Press, 1965
10. Angele MK, Schneider CP, Chaudry IH: Bench-to-bedside review: Latest results in hemorrhagic shock. Crit Care 2008; 12:218
11. Peitzman AB, Billiar TR, Harbrecht BG, et al: Hemorrhagic shock. Curr Probl Surg 1995; 32:925–1002
12. Md S, Moochhala SM, Siew-Yang KL: The role of inducible nitric oxide synthase inhibitor on the arteriolar hyporesponsiveness in hemorrhag-ic-shocked rats. Life Sci 2003; 73:1825–1834
13. Thiemermann C, Szabó C, Mitchell JA, et al: Vascular hyporeactivity to vasoconstrictor agents and hemodynamic decompensation in hemor-rhagic shock is mediated by nitric oxide. Proc Natl Acad Sci USA 1993; 90:267–271
14. Zingarelli B, Caputi AP, Di Rosa M: Dexamethasone prevents vascular failure mediated by nitric oxide in hemorrhagic shock. Shock 1994; 2:210–215
15. Lehtonen LA, Antila S, Pentikäinen PJ: Pharmacokinetics and phar-macodynamics of intravenous inotropic agents. Clin Pharmacokinet 2004; 43:187–203
Figure 5. Effect of mechanical ventilation. Arrows indicate increase or decrease in parameter as appropriate (see text for explanation). Pms = mean systemic pressure; Rv = venous resistance; Vs = stressed volume.
Concise Definitive Review
Critical Care Medicine www.ccmjournal.org 579
16. Petersen JW, Felker GM: Inotropes in the management of acute heart failure. Crit Care Med 2008; 36(1 Suppl):S106–S111
17. Geerts BF, Maas JJ, Aarts LP, et al: Partitioning the resistances along the vascular tree: Effects of dobutamine and hypovolemia in piglets with an intact circulation. J Clin Monit Comput 2010; 24:377–384
18. Ogilvie RI: Effects of inotropic agents on arterial resistance and venous compliance in anesthetized dogs. Can J Physiol Pharmacol 1982; 60:968–976
19. DiSesa VJ, Brown E, Mudge GH Jr, et al: Hemodynamic comparison of dopamine and dobutamine in the postoperative volume-loaded, pres-sure-loaded, and normal ventricle. J Thorac Cardiovasc Surg 1982; 83: 256–263
20. Annane D, Bellissant E, Cavaillon JM: Septic shock. Lancet 2005; 365:63–78
21. Stearns-Kurosawa DJ, Osuchowski MF, Valentine C, et al: The patho-genesis of sepsis. Annu Rev Pathol 2011; 6:19–48
22. Cauwels A: Nitric oxide in shock. Kidney Int 2007; 72:557–565 23. Cobb JP, Danner RL: Nitric oxide and septic shock. JAMA 1996;
275:1192–1196 24. Kilbourn RG, Gross SS, Jubran A, et al: NG-methyl-L-arginine
inhibits tumor necrosis factor-induced hypotension: Implications for the involvement of nitric oxide. Proc Natl Acad Sci USA 1990; 87: 3629–3632
25. Szabo C, Wu CC: Role of nitric oxide in the development of vas-cular contractile dysfunction in circulatory shock. J Med Sci 2011; 31:001–016
26. Titheradge MA: Nitric oxide in septic shock. Biochim Biophys Acta 1999; 1411:437–455
27. Kumar A, Brar R, Wang P, et al: Role of nitric oxide and cGMP in hu-man septic serum-induced depression of cardiac myocyte contractil-ity. Am J Physiol 1999; 276(1 Pt 2):R265–R276
28. Kumar A, Thota V, Dee L, et al: Tumor necrosis factor alpha and in-terleukin 1beta are responsible for in vitro myocardial cell depression induced by human septic shock serum. J Exp Med 1996; 183:949–958
29. Bressack MA, Morton NS, Hortop J: Group B streptococcal sepsis in the piglet: Effects of fluid therapy on venous return, organ edema, and organ blood flow. Circ Res 1987; 61:659–669
30. Hiesmayr M, Jansen JR, Versprille A: Effects of endotoxin infusion on mean systemic filling pressure and flow resistance to venous return. Pflugers Arch 1996; 431:741–747
31. Magder S, Vanelli G: Circuit factors in the high cardiac output of sep-sis. J Crit Care 1996; 11:155–166
32. Madger S: Shock physiology. In: Pathophysiologic Foundations of Critical Care. Pinsky MR, Vincent JF (Eds). Baltimore, MD: Williams and Wilkins, 1993, pp 140–160
33. Pope JV, Jones AE, Gaieski DF, et al; Emergency Medicine Shock Research Network (EMShockNet) Investigators: Multicenter study of central venous oxygen saturation (ScvO(2)) as a predictor of mortality in patients with sepsis. Ann Emerg Med 2010; 55:40–46.e1
34. Nguyen HB, Rivers EP, Knoblich BP, et al: Early lactate clearance is associated with improved outcome in severe sepsis and septic shock. Crit Care Med 2004; 32:1637–1642
35. Donnino M, Nguyen HB, Rivers EP: A hemodynamic comparison of ear-ly and late phase severe sepsis and septic shock. Chest 2002; 122:5S
36. Finfer S, Bellomo R, Boyce N, et al; SAFE Study Investigators: A com-parison of albumin and saline for fluid resuscitation in the intensive care unit. N Engl J Med 2004; 350:2247–2256
37. Rackow EC, Kaufman BS, Falk JL, et al: Hemodynamic response to fluid repletion in patients with septic shock: Evidence for early depres-sion of cardiac performance. Circ Shock 1987; 22:11–22
38. Rivers E, Nguyen B, Havstad S, et al; Early Goal-Directed Therapy Collaborative Group: Early goal-directed therapy in the treatment of severe sepsis and septic shock. N Engl J Med 2001; 345:1368–1377
39. Blain CM, Anderson TO, Pietras RJ, et al: Immediate hemodynamic effects of gram-negative vs gram-positive bacteremia in man. Arch Intern Med 1970; 126:260–265
40. Kumar A, Haery C, Parrillo JE: Myocardial dysfunction in septic shock: Part I. Clinical manifestation of cardiovascular dysfunction. J Cardio-thorac Vasc Anesth 2001; 15:364–376
41. MacLean LD, Mulligan WG, McLean AP, et al: Patterns of sep-tic shock in man—A detailed study of 56 patients. Ann Surg 1967; 166:543–562
42. Weil MH, Nishjima H: Cardiac output in bacterial shock. Am J Med 1978; 64:920–922
43. Jardin F, Fourme T, Page B, et al: Persistent preload defect in severe sepsis despite fluid loading: A longitudinal echocardiographic study in patients with septic shock. Chest 1999; 116:1354–1359
44. Parker MM, McCarthy KE, Ognibene FP, et al: Right ventricular dys-function and dilatation, similar to left ventricular changes, character-ize the cardiac depression of septic shock in humans. Chest 1990; 97:126–131
45. Parker MM, Shelhamer JH, Bacharach SL, et al: Profound but revers-ible myocardial depression in patients with septic shock. Ann Intern Med 1984; 100:483–490
46. Jacobsohn E, Chorn R, O’Connor M: The role of the vasculature in regulating venous return and cardiac output: Historical and graphical approach. Can J Anaesth 1997; 44:849–867
47. Luecke T, Pelosi P, Quintel M: [Haemodynamic effects of mechanical ventilation]. Anaesthesist 2007; 56:1242–1251
48. Marik PE, Baram M, Vahid B: Does central venous pressure predict fluid responsiveness? A systematic review of the literature and the tale of seven mares. Chest 2008; 134:172–178
49. Kumar A, Anel R, Bunnell E, et al: Pulmonary artery occlusion pres-sure and central venous pressure fail to predict ventricular filling volume, cardiac performance, or the response to volume infusion in normal subjects. Crit Care Med 2004; 32:691–699
50. Küntscher MV, Germann G, Hartmann B: Correlations between car-diac output, stroke volume, central venous pressure, intra-abdominal pressure and total circulating blood volume in resuscitation of major burns. Resuscitation 2006; 70:37–43
51. Marik PE, Monnet X, Teboul JL: Hemodynamic parameters to guide fluid therapy. Ann Intensive Care 2011; 1:1
52. Michard F, Chemla D, Richard C, et al: Clinical use of respiratory changes in arterial pulse pressure to monitor the hemodynamic ef-fects of PEEP. Am J Respir Crit Care Med 1999; 159:935–939
53. Osman D, Ridel C, Ray P, et al: Cardiac filling pressures are not ap-propriate to predict hemodynamic response to volume challenge. Crit Care Med 2007; 35:64–68