Embed Size (px)
Citation preview
Lisboa, 26/05/2015
The role of transport in the supplychain
Agenda
I. Value chain
II. Supply chain
III. Logistics market
IV. GEFCO profile
V. Challenges in Transport Management
VI. Control Tower solution
i. Scope & components
ii. Target market
iii. Service levels
iv. Pricing models
v. Value proposition
vi. Economic value
VII. Appendix
2

Sources of differentiation in a construction value chain
3

e.g. construction supply chain network
4

Supply chain, logistics chain and transport chain
Source: adapted from Woxenius, J. and J-P Rodrigue (2011) "Detours in Supply, Logistics and Freight Transport Chains".
5

Supply chain, logistics chain and transport chain
6
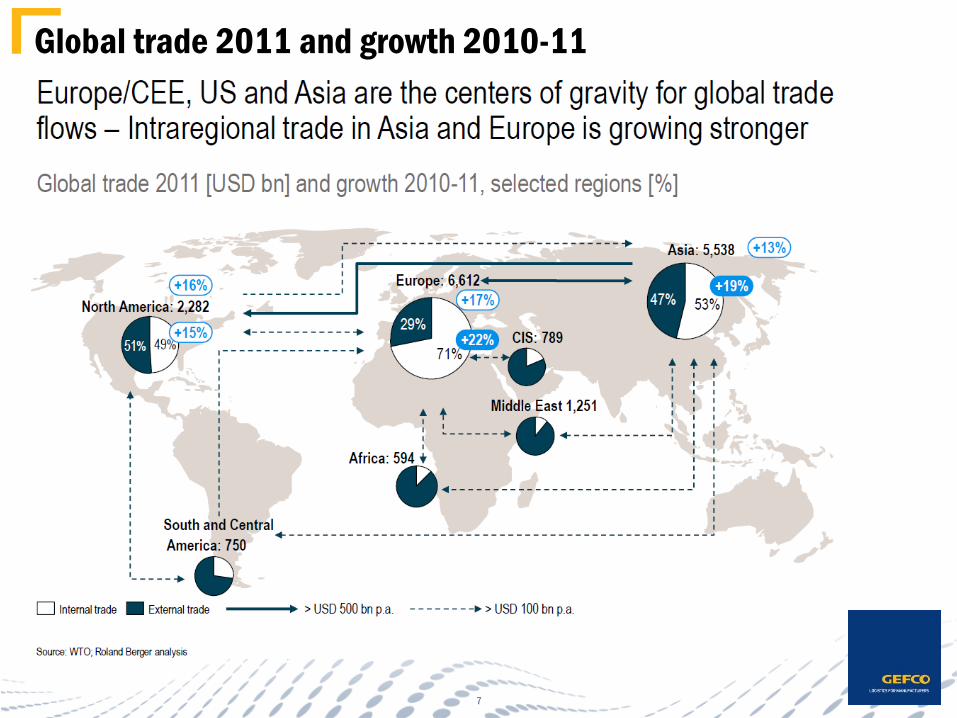
Global trade 2011 and growth 2010-11
7

Global logistics share by region and market 2011
8

Development of contract logistics players
9
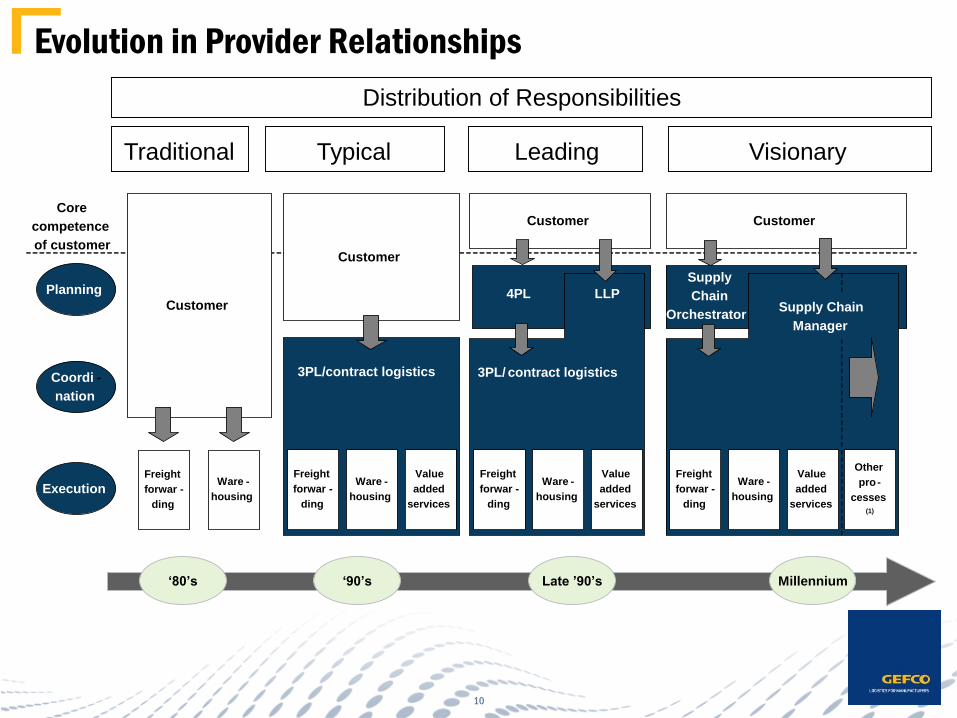
Evolution in Provider Relationships
Traditional Typical Leading Visionary
‘80’s ‘90’s Late ’90’s Millennium
Distribution of Responsibilities
Planning
Coordi -
nation
ExecutionFreight
forwar -
ding
Ware -
housing
Customer
3PL/contract logistics
Customer
Value
added
services
Freight
forwar -
ding
Ware -
housing
Value
added
services
Freight
forwar -
ding
Ware -
housing
Other
pro -
cesses(1)
Customer
Supply
Chain
OrchestratorSupply Chain
Manager
Customer
Value
added
services
Freight
forwar -
ding
Ware -
housing
4PL
3PL/ contract logistics
LLP
Core
competence
of customer
10

Largest contract logistics providers and global contract logistics market share 2013
11
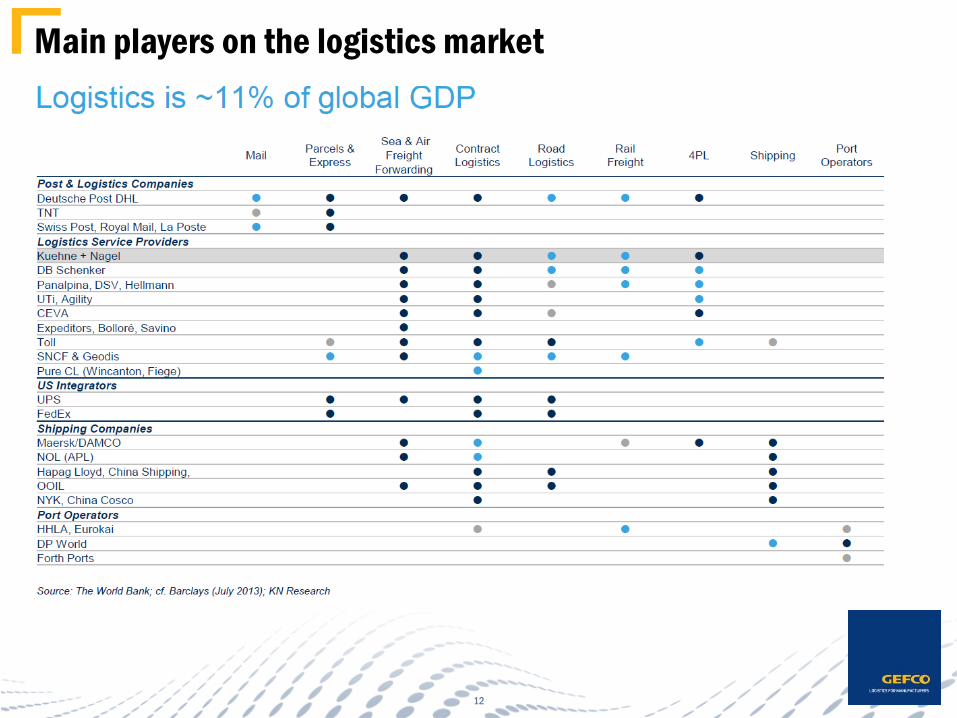
Main players on the logistics market
12
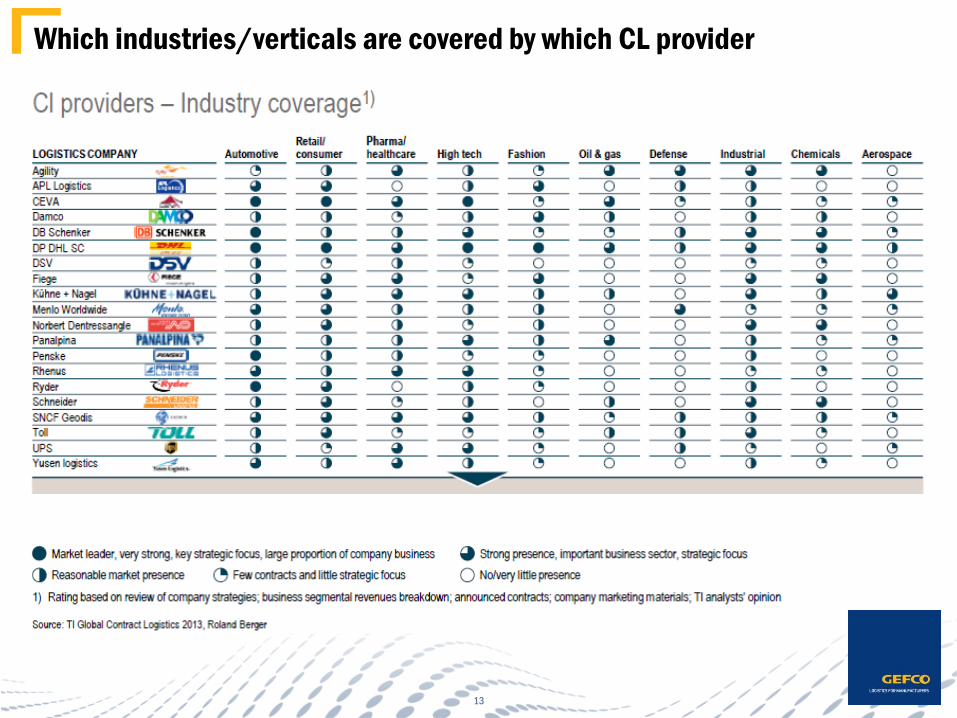
Which industries/verticals are covered by which CL provider
13

Service profile of contract logistics providers
14

GEFCO – Company Profile
As a European leader in automotive logistics and
a global player in industrial logistics, GEFCO
provides its customers with comprehensive
solutions for optimising their flows, at each stage
in the supply chain, all over the world. With its
engineering offices and the expertise of its
teams in the field, the Group is able to meet the
most complex of logistics challenges.
With the backing of the JSC Russian Railways
(RZD) and PSA groups, GEFCO operates in every
continent and runs a global network. As one of
Europe’s ten largest logistics integrators, GEFCO
also has the biggest private land-based
multimodal transport network, consisting of 80
hubs and depots in strategic development zones
and 65 logistics platforms.
Thanks to its demanding standards in terms of
quality, its 4PL expertise and the appeal of its
services which are ever more advanced and
innovative – Finished Vehicles Logistics,
Overland, Warehousing & Reusable Packaging,
Overseas – GEFCO achieved a Turnover in 2013
of 4 billion euro of which 77% was in
international flows.
15
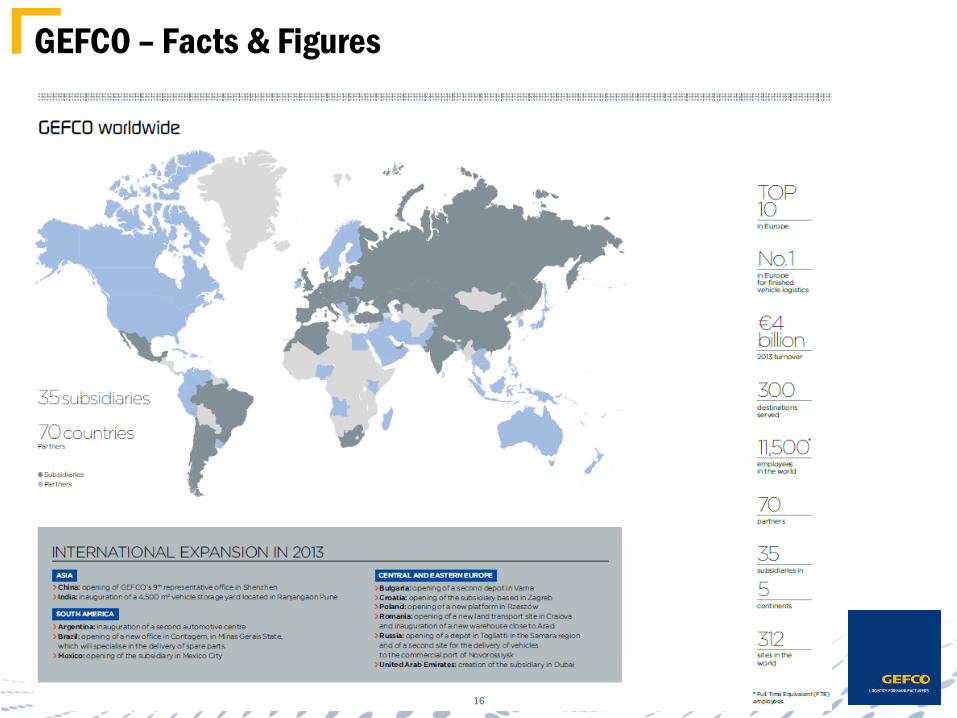
GEFCO – Facts & Figures
16

GEFCO in Portugal
Overland
Overseas
Warehousing & Reusable Packaging
Finished Vehicles Logistics
Porto
Mangualde
Pombal
Alverca
SetúbalAlgés
2013
TOP 5 in logistics
and transport
Turnover
€64,5 million
6 sites +
Headquarter in
Algés
168 employees
CertificationISO 9001
ISO 14001
AEO
17

Finished Vehicles Logistics
Multimodal approach transport by rail, sea and road.
PPO: window engraving, installation of fog lamps and alarm systems
PDI: dynamic testing, washing, quality control, mechanical tests
> Global network of centers devoted to vehicle inspections
FROM PRODUCTION LINES TO POINTS OF SALE
> Optimized distribution schemes
Distribution to dealerships in close collaboration with the dealerships and therental companies
OTHER VALUE ADDED ACTIVITIES
> Transformation of commercial vehicles
Customization of vehicle fleets: installation of tipping buckets, refrigerated
compartments, etc.
> Reconditioning of used vehicles
In addition to new vehicles, GEFCO reconditions used vehicles (mechanics, body work, painting, etc.)
18

OverseasBreaking down boundaries
19
• Global sea and air freight transport solutions
• A strong presence in Asia (Chinese International
Logistics Platform, or PLIC, in Shanghai)
> An international presence
Efficient management of the supply chain
• Customs engineering
• Tax representation
• Information systems performance (Isygo and I-Trek
portals)
> A comprehensive offer
> Special events logistics
GEFCO Events
Events logistics solutions to support exhibitors around the
world (sporting and cultural events, motor shows, etc.)
19

Warehousing and Reusable Packaging
Improving the reliability and the flow of the supply chain
> Reusable packaging
• Customized solutions for warehousing logistics
• A global specialist in inbound flow engineering
• Cross-docking, delayed differentiation, kitting customization,
etc.
> Warehousing
• Reusable packaging to sustainably increase productivity
• Range of eco-friendly solutions for the management of
industrial packaging flows
20
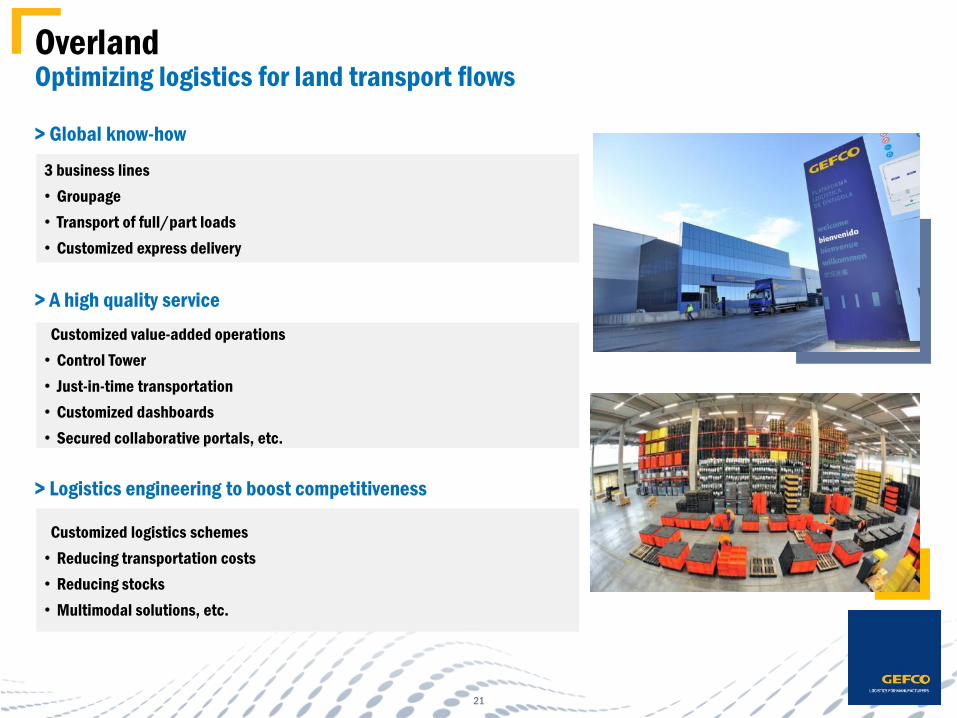
OverlandOptimizing logistics for land transport flows
3 business lines
• Groupage
• Transport of full/part loads
• Customized express delivery
> Global know-how
Customized value-added operations
• Control Tower
• Just-in-time transportation
• Customized dashboards
• Secured collaborative portals, etc.
> A high quality service
Customized logistics schemes
• Reducing transportation costs
• Reducing stocks
• Multimodal solutions, etc.
> Logistics engineering to boost competitiveness
21

Challenges in Transport Management
A need to reduce transport costs without
endangering quality and service levels
A need to reduce supply chain costs
within an already optimised supply chain
A need to outsource transport
management without losing control over
the transport costs
High complexity of managing transport
invoices because of a high number of rate
structures, carriers and transport modes
> More and more deliveries
directly to end customers
> More frequent deliveries
resulting in smaller shipment
volume
> High fluctuation and
unpredictable transport
demands over the year
> Optimize transports flows
across business units and
across sites
> Short delivery cycles with low
transport costs are requested
by shippers
> Lifetime of products get
shorter, the issues of
obsolescence in inventory
increases
Transport viewCosts view Product view
22

End-to-end Solutions & Advanced Logistics Services
Warehouse Management
Hours/Days Weeks/Months/Quarters
Network Design
Supply & Demand
Planning
Transport
Execution
Event Management
Strategic
Operational
Distribution Network
Planned Shipments
Performance
Shipment Schedule
Actual Shipments
Load Plans
Shipment Exceptions
Delivery Confirmation
Load
Confirmation
Dock
Scheduling
Transport
Planning
Source: Oracle
In Supply Chain Management Transport Management is the pivot point for Integrated Planning &
Execution, enabling integrated SCM
23

Control Tower description
The Control Tower is the one central
transport desk solution for several sites of
one customer or a group of customers
possibly with similar shipment profiles in
order to optimize transport planning over
the complete supply chain leveraging on
commonality of products, origins and end-
customers.
The supply chain optimization activities of
the CT range from strategic planning of
the network, the tactical logistics provider
management to the operational transport
planning. The CT controls the transport
execution and financial settlement
enabled by supply chain visibility.
Logistics service providers
(transport execution)
customercustomer customer
CT
as central transport
management desk
24

Logistics service providers
(transport execution)
How does it work
The CT combines centrally the transport management responsibilities, selecting the most optimal transport network, transportation mode, loads and routes for the combined customers shipments.
The CT is designing and managing the best transport solution based on the customer volumes. It can make use of own GEFCO transport execution services or third party services.
The focal point of the CT can vary per customer, from carrier selection based on price, lead-time and performance to routing and scheduling of dedicated milk-runs for the shipper
customercustomer customer
CT
as central transport
management desk
25
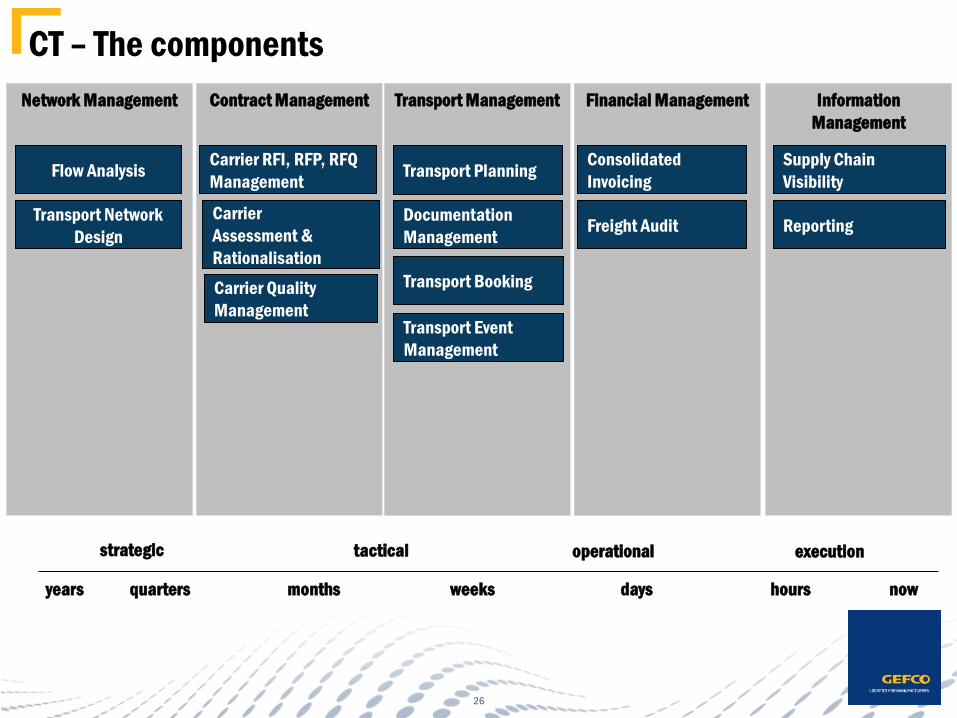
CT – The components
Network Management
Flow Analysis
Transport Network
Design
Transport Management
Transport Planning
Documentation
Management
Transport Booking
Transport Event
Management
Financial Management
Consolidated
Invoicing
Freight Audit
Information
Management
Supply Chain
Visibility
Reporting
Contract Management
Carrier RFI, RFP, RFQ
Management
Carrier
Assessment &
Rationalisation
Carrier Quality
Management
operationaltacticalstrategic execution
hoursweeksquarters nowdaysmonthsyears
26

Target Market
The CT product is intended for customers who want to centralize and outsource their transport management functions in order to optimize the total costs for transportation. For a specific customer this could cover both inbound as well as outbound transport movements, all possible transport modes and direct shipments as well as usage of LTL networks.
The customers are looking for one single point of contact for their transport management.
Typical customer characteristics
Transportation demand from several sites
Not just usage of LTL and FTL networks of one carrier
Either usage of one or more carrier networks (LTL and / or FTL) to one destination or need to use different optimisation strategies like direct injections and milk runs (or to cut out hub points based on own volumes)
Need to reduce transport costs beyond just squeezing carriers with the risk of endangering quality
Requirement to take more control over transportation costs
Willingness to go for transport optimisation
27
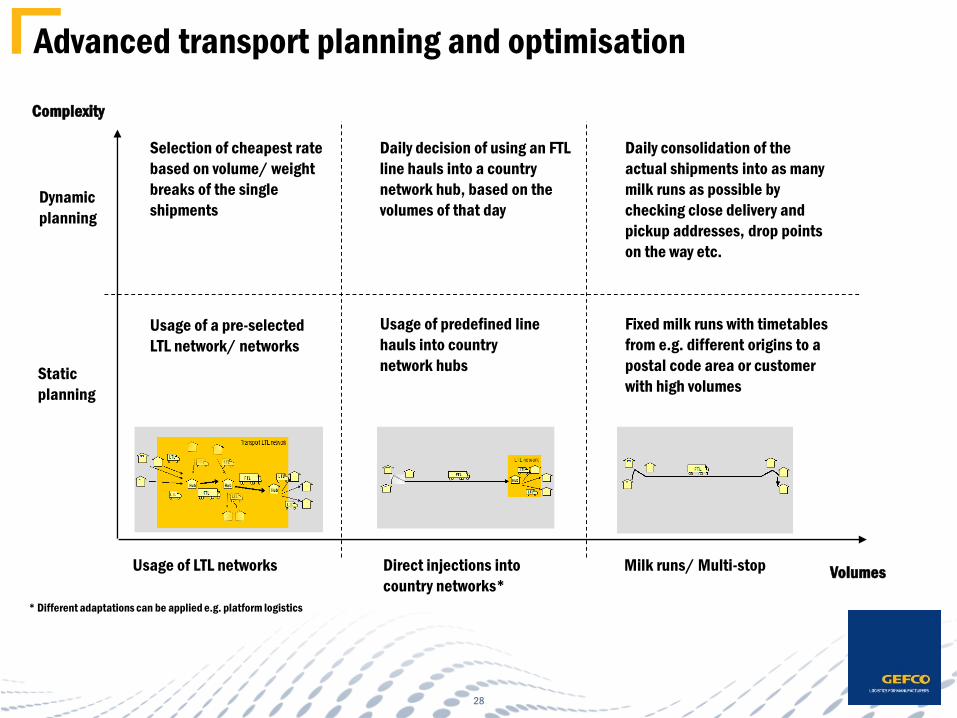
Advanced transport planning and optimisation
Complexity
Volumes
Dynamic
planning
Static
planning
Usage of LTL networks Direct injections into
country networks*
Milk runs/ Multi-stop
Fixed milk runs with timetables
from e.g. different origins to a
postal code area or customer
with high volumes
Usage of predefined line
hauls into country
network hubs
Usage of a pre-selected
LTL network/ networks
Daily consolidation of the
actual shipments into as many
milk runs as possible by
checking close delivery and
pickup addresses, drop points
on the way etc.
Daily decision of using an FTL
line hauls into a country
network hub, based on the
volumes of that day
Selection of cheapest rate
based on volume/ weight
breaks of the single
shipments
* Different adaptations can be applied e.g. platform logistics
28

Service levels of CT
Complexity
Volumes
Dynamic
planning
Static
planning
Usage of LTL networks Direct injections into
country networks
Milk runs/ Multi-stop
Advanced
Light
29

Drivers for choosing the different service levels
Complexity
Volumes
Dynamic
planning
Static
planning
Usage of LTL networks Direct injections into
country networks
Milk runs/ Multi-stop
Low
volume
Low fluctuations
Complex rate structures
High fluctuations
Multi-carrier operations
Small shipment size Large shipment size
High
volume
30

Different Service Levels
Main
functionalities
Light Medium Advanced
Network
Management
Flow Analysis
Transport
Network Design
No network
optimization
Static network
analysis (trunklines,
milkruns)
Network simulation
Contract
Management
RFQ Mgmt
(Tendering)
Pre-defined rate
template
Carrier rates Rates as used by
carriers
Transport
management
Transport
Planning
Transport
Booking
Transport
Document
Management
Transport Event
Management
Mainly LTL
transports
Only a few carriers
Static trunklines/
Milkruns
Trsp Booking
manual/ e-mail/
phone
Trsp Documents by
carrier(s)
Mainly LTL
transports
Dynamic transport
planning -
Trunklines/ Milkruns
Trsp Booking e-
mail/ automated
interfaces
Dynamic transport
planning - routing &
scheduling of all
shipments
Trsp Booking via
automated
interfaces
Trsp document
printing
Financial
Management
Consolidated
Invoicing
Freight Audit
Manual Rate engine
Automated by TMS
Automated by TMS
Information
Management
Supply Chain
Visibility
T&T systems of
carriers directly
T&T system of
carriers/ Visibility
Visibility system
31

Pricing models: Main components
Various components can be differentiated in the different pricing models handled in the market:
> Transport Costs: cost of the transport execution
> Up-front fee: one-time fee charged for implementation e.g. installing the application/licence fee.
> Subscription fee: fee that allows the customer to receive a specific service independent from the number of transactions in a certain period
> Transaction fee: fee for the execution of the transport management function(ality)
> Value related transaction fee: fee based on the value created by the transaction. Commonly known as gain sharing. The value of a transaction might exceed the cost price of the transaction enormously. Transaction example could be freight audit check or a day of transport optimisation.
> Management fee: fee to ensure margin of LLP. Can be defined as % of margin for rendering the services, as a flat fee or as surcharge for rendering specific services
32

Pricing models for CT
The pricing model of the CT is build on different components in order to create a win-win situation for the customer as well as for the logistics service provider and to create the necessary transparency and trust between both partners :
Transport Costs
Transaction
costs
Management
fee (%)
Management fee as a % of the total
cost (transport + transaction)
Transaction cost as a flat fee per
shipment/delivery order
Transport cost : cost charged by
the 2PL/3PL to the CT for the
rendered transport cost. This can
be done based on fixed charges or
based on the actual costs.
Gain Sharing to
be split between
the 2 partners
Gain share : difference
between original base-line
transport costs and the
transport cost after CT
implementation
33

Value proposition of the CT
Value How to be delivered Product component
Better rates from the
carriers
By consolidating volumes better negotiation possibilities with the carriers
Possibility to make use of strong local networks by selecting local carriers with
best rates
Contract Management
Lower transport cost Central transport planning gives more possibilities to optimize transport by
– Consolidation from LTL shipments into FTL
– Generation of Milkruns, backloads, etc.
– Direct injections into domestic networks
– Optimization the routing of the single shipments
Use best rates per shipment (based on country, weight breaks, volume
breaks, etc.)
State of the art tools allow dynamic transport planning
Transport Management
Less damages Less handling by more direct deliveries Transport Management
Improved reliability of
the transports
Selecting the most reliable carriers and controlling constantly their
performance
More direct deliveries by generating more FTL shipments by consolidating
shipment volumes
Monitoring of the transport execution and pro-active exception management
Contract Management
Transport Management
Information Management
Improved leadtimes of
the transports
Improved leadtime by consolidating more shipments into FTL transports
versus the use of LTL networks
Transport Management
Reduced administration
cost
Automation of the process and economy of scale by centralizing transport
planning. Possibilities of sharing personnel, hardware, software, development
costs, telecommunications costs, etc.
Control Tower
34

Value proposition of the CT
Value How to be delivered Product component
Increased accuracy of
payment, less
overpayment
Full financial control through efficient invoicing and freight audit process Financial Management
Lower inventory Optimization of total supply chain network infrastructure with positioning of
stock holding points, inventory strategies etc.
Network Management
Improved customer
service
Full visibility on order status in the supply chain
T&T possibilities for end-customers on one platform
Information Management
Single point of contact Centralization of transport planning activities and information platform
Simplified communication infrastructure (less interfaces)
Control Tower
35
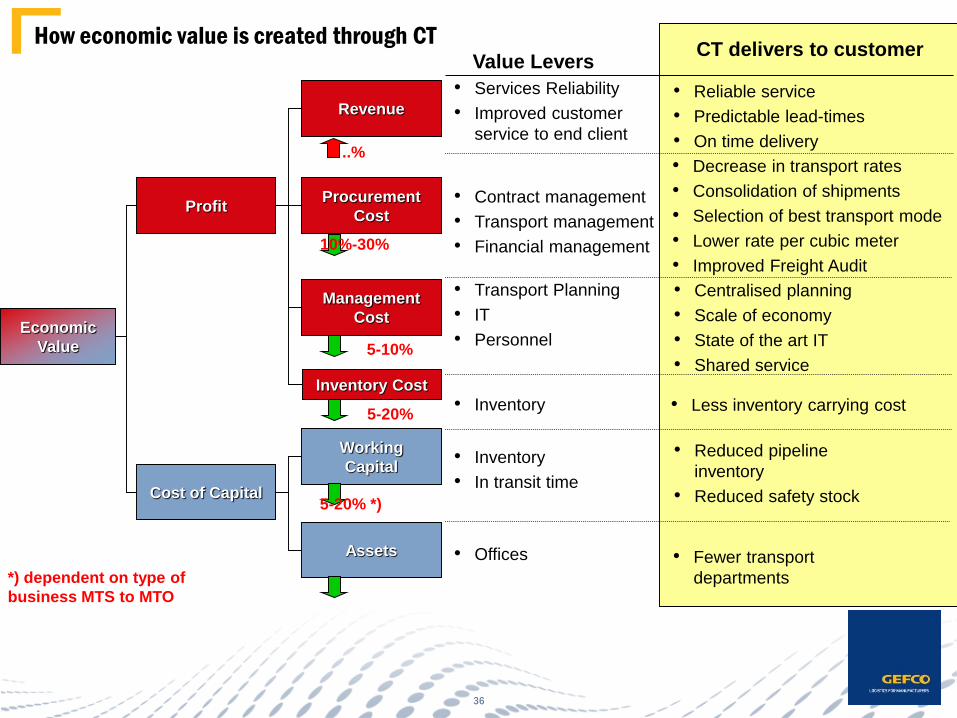
How economic value is created through CT
Economic
Value
Revenue
Procurement
Cost
Management
Cost
Working
Capital
Cost of Capital
Profit
Assets
• Services Reliability
• Improved customer
service to end client
• Contract management
• Transport management
• Financial management
• Transport Planning
• IT
• Personnel
• Inventory
• In transit time
• Offices
Value LeversCT delivers to customer
• Reliable service
• Predictable lead-times
• On time delivery..%
• Decrease in transport rates
• Consolidation of shipments
• Selection of best transport mode
• Lower rate per cubic meter
• Improved Freight Audit
10%-30%
• Centralised planning
• Scale of economy
• State of the art IT
• Shared service5-10%
• Reduced pipeline
inventory
• Reduced safety stock5-20% *)
• Fewer transport
departments*) dependent on type of
business MTS to MTO
Inventory Cost
5-20%• Less inventory carrying cost• Inventory
36

Benefit Logic
Profit
Increase
revenue
Reduce costs
Improved
customer
service
Reduced
inventory costs
Reduced
management
(administration)
costs
Reduced
procurement
(transport)
costs
Information
Management
TMC
Contract
Management
Transport
Management
Financial
Management
Network
Management
Improved
transport lead
times
Improved
transport reliability
Optimized carrier
rates
Optimized flows
Increased
accuracy of
payment/ less over
payment
Less damages
Optimized network
(stockholding
points)
Better
replenishment
descisions
RFQ management
Carrier
assessment &
rationalization
Higher truck fill
rate
Optimal rate
selection
Closed
information loop
Usage of LTL/FTL
networks
Direct injection
into country
network
Milkruns (direct
deliveries)
Central transport
planning
Less handling
Single point of
contact
Centralized &
automated
transport
management
Economic
Value
Cost of
capital
Reduced
working
capital
Reduced
Assets
Reduced fixed
assets
Reduced work
captial
(inventory)
Reduced cash
to cash cycle
Faster invoicing to
the end customerElectronic POD
Reduced safety
stock
Reduced pipeline
inventory
Reduced number
of TM
departements
Centralized
transport
management
Reduced
collection period
37

Lisboa, 26/05/2015
Appendix

CT – The components
Network Management
Flow Analysis
Transport Network
Design
Transport Management
Transport Planning
Documentation
Management
Transport Booking
Transport Event
Management
Financial Management
Consolidated
Invoicing
Freight Audit
Information
Management
Supply Chain
Visibility
Reporting
Contract Management
Carrier RFI, RFP, RFQ
Management
Carrier
Assessment &
Rationalisation
Carrier Quality
Management
operationaltacticalstrategic execution
hoursweeksquarters nowdaysmonthsyears
39
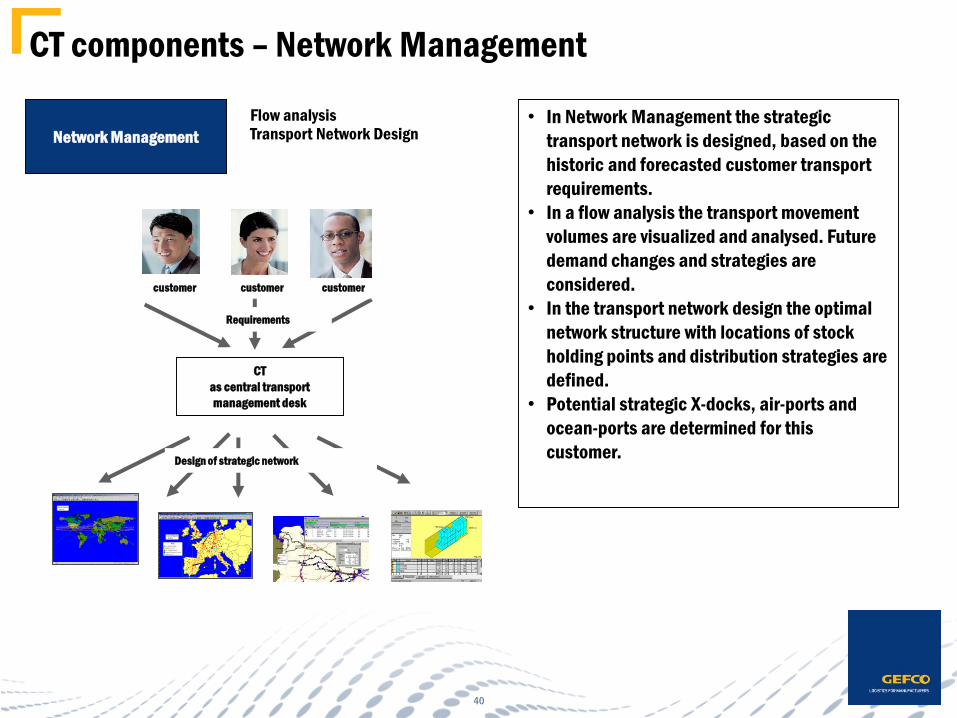
CT components – Network Management
Network Management
Flow analysisTransport Network Design
Requirements
Design of strategic network
CT
as central transport
management desk
• In Network Management the strategic
transport network is designed, based on the
historic and forecasted customer transport
requirements.
• In a flow analysis the transport movement
volumes are visualized and analysed. Future
demand changes and strategies are
considered.
• In the transport network design the optimal
network structure with locations of stock
holding points and distribution strategies are
defined.
• Potential strategic X-docks, air-ports and
ocean-ports are determined for this
customer.
customercustomer customer
40

CT components – Contract Management
Contract Management
Carrier ManagementCarrier AssessmentCarrier Quality Management
Logistics service providers (transport execution)
Requirements
Selection of Logistics Providers
RFQ
CT
as central transport
management desk
• Contract Management are all activities to manage the
contracted logistics service providers in a cost-effective
way with the objective to have an optimised carrier base
with respect to cost and quality.
• The Carrier RFI- (Request for Information), RFP-
(Request for Proposal), RFQ- (Request for Quotation)
Management targets a selection of a carrier normally an
a long-/mid-term horizon based on a transportation
volume.
• The management process from RFQ initiation to provider
selection/awarding.
• The CT can own the transport contracts with the carrier
or act as an intermediate between the carriers and the
shipper.
• Carrier Assessment and Rationalization is consulting in
the area of the existing 3PL portfolio and its assessment
based on current and future customer requirements. It
covers the analysis of required services and the
identification of a requirements gap.
customercustomer customer
41
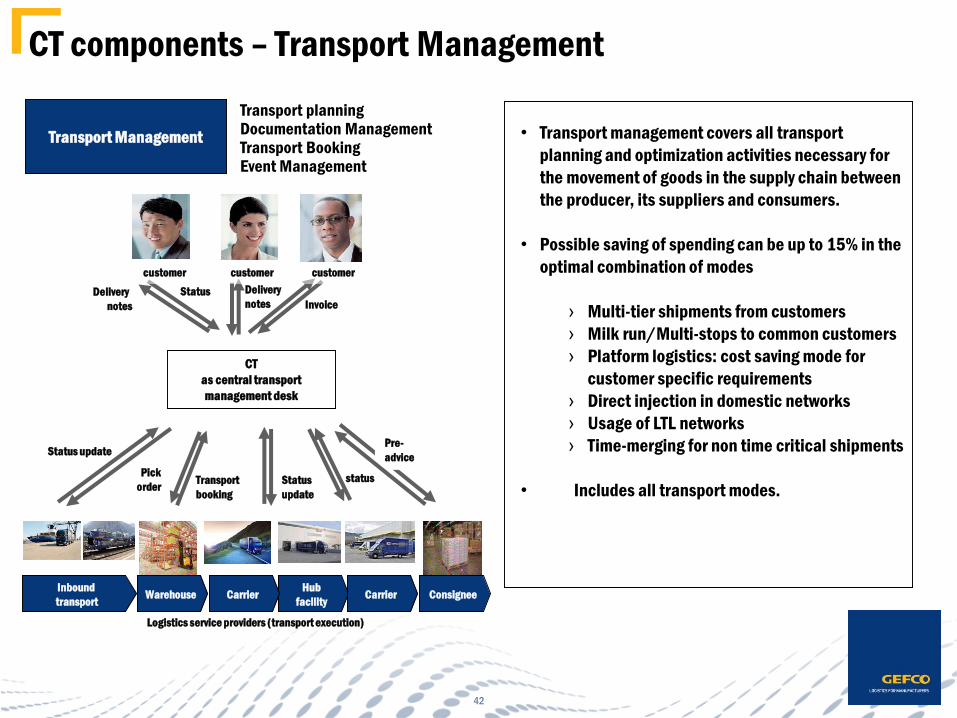
Transport Management
Transport planningDocumentation ManagementTransport BookingEvent Management
• Transport management covers all transport
planning and optimization activities necessary for
the movement of goods in the supply chain between
the producer, its suppliers and consumers.
• Possible saving of spending can be up to 15% in the
optimal combination of modes
› Multi-tier shipments from customers
› Milk run/Multi-stops to common customers
› Platform logistics: cost saving mode for
customer specific requirements
› Direct injection in domestic networks
› Usage of LTL networks
› Time-merging for non time critical shipments
• Includes all transport modes.
Status
Pick
orderTransport
booking
Pre-
advice
Inbound
transport
Hub
facilityCarrierWarehouse Carrier Consignee
status
Status update
Logistics service providers (transport execution)
Delivery
notes Invoice
Status
update
Delivery
notes
CT
as central transport
management desk
customercustomer customer
CT components – Transport Management
42

CT components – Financial Management
Financial Management
Consolidated invoicingFreight audit
Payment
Payments
Consolidated
Invoice
Claims
Claims
Financial
KPI &
allocation
Transport
invoicesFreight
Audit
CT
as central transport
management desk
• Financial Management ensures the proper
payment of the used services.
• The different logistics service provider invoices
are consolidated towards our client.
• Freight Audit makes certain that the provided
services are invoiced correctly by the carriers
according to the agreed rates and service
levels.
• The invoices of the different logistics service
providers used, are aggregated on the
customer requirements, e.g. aggregated across
all modes, with subtotals, allocated to the site
or product group that bears the transportation
costs.
customercustomer customer
Inbound
transport
Hub
facilityCarrierWarehouse Carrier Consignee
Logistics service providers (transport execution)
43
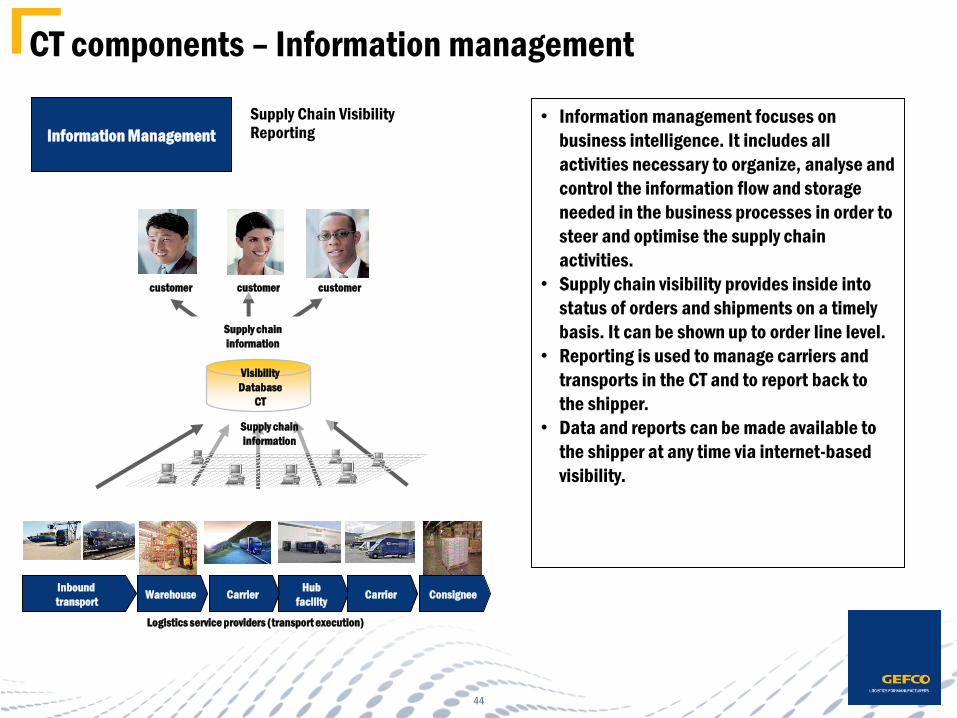
CT components – Information management
Information Management
Supply Chain VisibilityReporting
Supply chain
information
Visibility
Database
CT
Supply chain
information
• Information management focuses on
business intelligence. It includes all
activities necessary to organize, analyse and
control the information flow and storage
needed in the business processes in order to
steer and optimise the supply chain
activities.
• Supply chain visibility provides inside into
status of orders and shipments on a timely
basis. It can be shown up to order line level.
• Reporting is used to manage carriers and
transports in the CT and to report back to
the shipper.
• Data and reports can be made available to
the shipper at any time via internet-based
visibility.
customercustomer customer
Inbound
transport
Hub
facilityCarrierWarehouse Carrier Consignee
Logistics service providers (transport execution)
44

Value stream – Centralized Transport Management
Customer characteristics
> Centralized or decentralized
> Manual or automated transport planning
KPI’s
> Number of TM departments and locations
> % of orders already automated
> Reduction in planning effort per order
Overall savings
> 5-20 % in office space and equipment
Centralized
transport
management
Reduced
Management cost
Process
Centralisation
Reduced time per
transaction
Automated
Transport planning
Reduced cost per
employee by
Outsourcing
Reduced # of
Administration
personnel
Reduced overhead
Simplified IT
infrastructure
Reduced # of TM
departments
Reduced fixed Assets
(IT, building, etc.)
45
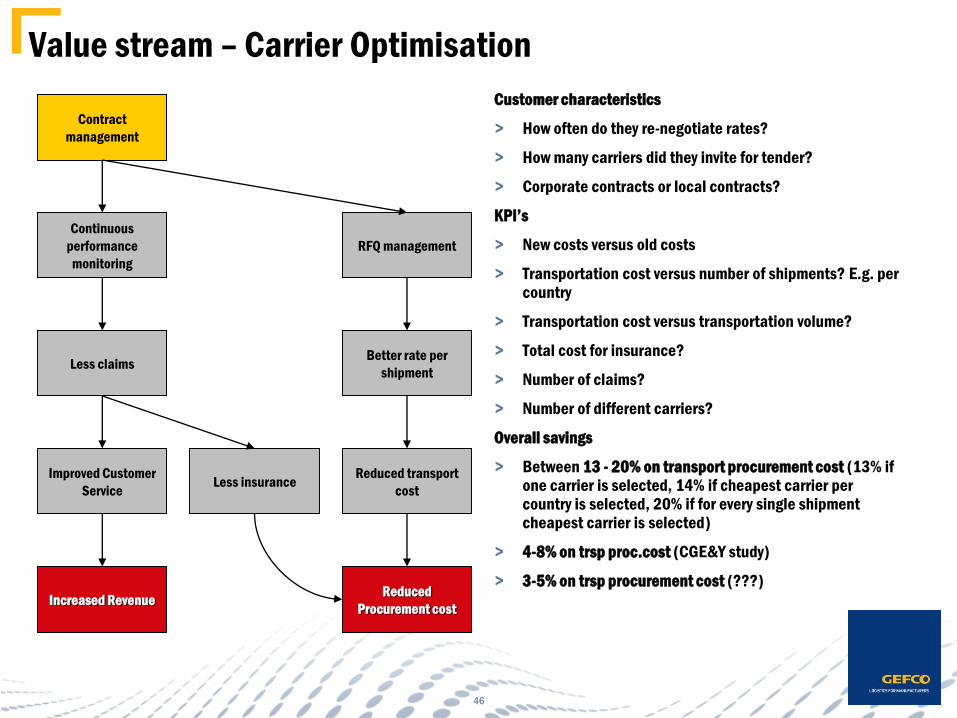
Value stream – Carrier Optimisation
Customer characteristics
> How often do they re-negotiate rates?
> How many carriers did they invite for tender?
> Corporate contracts or local contracts?
KPI’s
> New costs versus old costs
> Transportation cost versus number of shipments? E.g. per country
> Transportation cost versus transportation volume?
> Total cost for insurance?
> Number of claims?
> Number of different carriers?
Overall savings
> Between 13 - 20% on transport procurement cost (13% if one carrier is selected, 14% if cheapest carrier per country is selected, 20% if for every single shipment cheapest carrier is selected)
> 4-8% on trsp proc.cost (CGE&Y study)
> 3-5% on trsp procurement cost (???)
Contract
management
Reduced
Procurement cost
Continuous
performance
monitoring
Better rate per
shipment
RFQ management
Less claims
Less insuranceReduced transport
cost
Improved Customer
Service
Increased Revenue
46
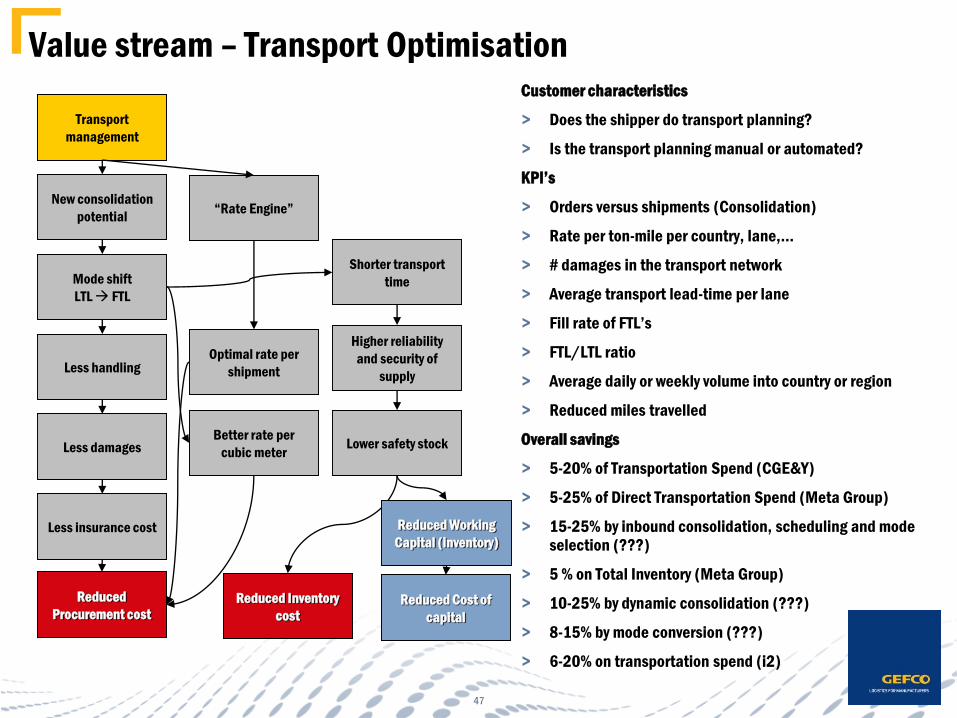
Value stream – Transport OptimisationCustomer characteristics
> Does the shipper do transport planning?
> Is the transport planning manual or automated?
KPI’s
> Orders versus shipments (Consolidation)
> Rate per ton-mile per country, lane,…
> # damages in the transport network
> Average transport lead-time per lane
> Fill rate of FTL’s
> FTL/LTL ratio
> Average daily or weekly volume into country or region
> Reduced miles travelled
Overall savings
> 5-20% of Transportation Spend (CGE&Y)
> 5-25% of Direct Transportation Spend (Meta Group)
> 15-25% by inbound consolidation, scheduling and mode selection (???)
> 5 % on Total Inventory (Meta Group)
> 10-25% by dynamic consolidation (???)
> 8-15% by mode conversion (???)
> 6-20% on transportation spend (i2)
Transport
management
Reduced
Procurement cost
“Rate Engine”
Mode shift
LTL FTL
New consolidation
potential
Shorter transport
time
Optimal rate per
shipment
Lower safety stock
Less handling
Better rate per
cubic meter
Less insurance cost
Less damages
Higher reliability
and security of
supply
Reduced Inventory
cost
Reduced Working
Capital (inventory)
Reduced Cost of
capital
47

Value stream – Financial Management
Customer characteristics
> Complex auditing process by, many carriers, many transport modes, complex rate structures, lots of surcharges, many shipments
KPI’s
> % of incorrect invoices
> Amount of overpayments without audit
> # of auditing staff
Overall savings
> 10-50 % of administrative expenses (CGE&Y)
> 1-3% on Transportation spend by data capture, normalisation, audit and analysis (???)
> Reduced Days Sales Outstanding 12% (Electronics industry, Descartes)
Financial
management
Reduced Transport
cost
Process for invoice
auditing
Automated auditing
process
Less time auditing
invoice
Reduction in
incorrect invoices
Reduced
Administration cost
Reduced resources
Increased detection
of wrong invoices
Reduced
Procurement cost
Reduced
Management cost
48

Value stream – Information management (1/2)
Information
management
Reduced
Inventory cost
Closed information
loop
Better data for
simulation
Increased
transparency
Disaster recovery
Increased customer
satisfactionLess penalties
Improved strategic
decisions
Increased data
reliability
Less safety stock Less delay
Reduced
Procurement cost
Increased
Revenue
Reduced Working
Capital
(cash to cash)
Reduced Cost of
capital
Faster invoicing to
the end customer
Electronic POD
Reduced Working
Capital
(inventory)
Reduced Cost of
capital
Reduced collection
period
49

Value stream – Information management (2/2)
Customer characteristics
> Do they have a system in place, which is providing visibility (linking purchase order and transport information, combining information of all carriers used)?
> Do they have inventory in transit information available?
> How is safety stock calculated (security factor for possible delivery delays?)
KPI’s
> Number of orders resulting in claims
> Costs of safety stock
> Inventory turns
Overall savings
> Optimize & Reduce Inventory & Carrying Cost 5-10%
> Increased Inventory Turns from 5 to >8 (Electronics industry, Descartes)
> 15% reduction in claims (Electronics industry, Descartes)
> Improved Customer Service Levels OTIF level increased to >95% from 78-84% (Electronics industry, Descartes)
Information
management
Reduced Reduced
Inventory costInventory cost
Closed
information loop
Better data for
simulation
Increased
transparency
Disaster
recovery
Increased
customer
satisfaction
Less penalties
Improved
strategic
decisions
Increased data
reliability
Less safety
stockLess delay
Reduced Reduced
Procurement Procurement
costcost
IncreasedIncreased
RevenueRevenue
Reduced Reduced
Working CapitalWorking Capital
(cash to cash)(cash to cash)
Reduced Cost of Reduced Cost of
capitalcapital
Faster invoicing
to the end
customer
Electronic POD
Reduced Reduced
Working CapitalWorking Capital
(inventory)(inventory)
Reduced Cost of Reduced Cost of
capitalcapital
Reduced
collection period
50
Luis FERREIRADirector OVL & WRPBusiness Unit Manager for Overland & Warehousing and Reusable Packaging
GEFCO Portugal
Phone +351 21 41 69 832 – Fax +351 21 41 69 857 – GSM +351 91 210 25 36e-mail : [email protected]