Embed Size (px)
Citation preview
BASIC RESEARCH www.jasn.org
The Role of the Renal Ammonia Transporter Rhcg inMetabolic Responses to Dietary Protein
Lisa Bounoure,* Davide Ruffoni,† Ralph Müller,† Gisela Anna Kuhn,† Soline Bourgeois,*Olivier Devuyst,* and Carsten A. Wagner*
*Institute of Physiology and Zurich Center for Integrative Human Physiology, University of Zurich, Zurich, Switzerland;and †Institute for Biomechanics, ETH Zurich, Zurich, Switzerland
ABSTRACTHigh dietary protein imposes a metabolic acid load requiring excretion and buffering by the kidney.Impaired acid excretion in CKD, with potential metabolic acidosis, may contribute to the progression ofCKD. Here, we investigated the renal adaptive response of acid excretory pathways in mice to high-protein diets containing normal or low amounts of acid-producing sulfur amino acids (SAA) and examinedhow this adaption requires the RhCG ammonia transporter. Diets rich in SAA stimulated expression ofenzymes and transporters involved inmediatingNH4
+ reabsorption in the thick ascending limb of the loopof Henle. The SAA-rich diet increased diuresis paralleled by downregulation of aquaporin-2 (AQP2) waterchannels. The absence of Rhcg transiently reduced NH4
+ excretion, stimulated the ammoniagenic path-waymore strongly, and further enhanceddiuresis by exacerbating thedownregulation of theNa+/K+/2Cl2
cotransporter (NKCC2) and AQP2, with less phosphorylation of AQP2 at serine 256. The high protein acidload affected bone turnover, as indicated by higher Ca2+ and deoxypyridinoline excretion, phenomenaexaggerated in the absence of Rhcg. In animals receiving a high-protein diet with low SAA content, thekidney excreted alkaline urine, with low levels of NH4
+ and no change in bone metabolism. Thus, the acidload associated with high-protein diets causes a concerted response of various nephron segments toexcrete acid, mostly in the form of NH4
+, that requires Rhcg. Furthermore, bone metabolism is alteredby a high-protein acidogenic diet, presumably to buffer the acid load.
J Am Soc Nephrol 25: 2040–2052, 2014. doi: 10.1681/ASN.2013050466
The kidney is the central organ that excretes acid andreplenishesbicarbonatebufferusedbymetabolism.1,2
The importance of the kidney in acid-base balance isdemonstratedby inherited and acquired renal diseases,reducing its ability to excrete acid and reabsorb andsynthesize bicarbonate (HCO3
2).3–5 Recent studiessuggest that the progression of CKD is delayed byalkalinizing therapies aiming to reduce the meta-bolic acidosis occurring with the disease.6–10
In aWestern diet, protein intake exceeds by up to50% the recommended average daily consumptionof 0.8 g of protein per kg per day; most protein isfrom animal sources, which are rich in sulfur-containing acidogenic amino acids.11,12 Diets highin animal protein have gained additional popularityin the context of obesity and its treatment.13,14 Ad-verse effects of high protein intake on many organshave been described. Whether high-protein dietsnegatively affect bone or kidney function has
remained an open question.15–23 In kidney disease,high animal protein may accelerate decay of renalfunction; thus, current protocols strongly suggestthat patients with CKD reduce animal protein in-take.24–26
Dietary protein intake and its metabolism canprovide a major acid load, but the metabolic acidload depends on the nature and composition ofproteins. Proteins rich in sulfur-amino acids (SAA;
Received May 7, 2013. Accepted January 20, 2014.
Published online ahead of print. Publication date available atwww.jasn.org.
Correspondence:Dr. Carsten A.Wagner andDr. Soline Bourgeois,Institute of Physiology, University of Zurich, Winterthurerstrasse 190,CH-8057 Zurich, Switzerland. Email: [email protected] [email protected]
Copyright © 2014 by the American Society of Nephrology
2040 ISSN : 1046-6673/2509-2040 J Am Soc Nephrol 25: 2040–2052, 2014

i.e., cysteine andmethionine) release protons (H+) and sulfate(SO4
22) during metabolism and cause increased renal acidand NH4
+ excretion paralleled by high urinary SO422 and urea
removal.27,28 Plant proteins, such as soy protein, contain onlysmall amounts of SAA and consequently cause a milder acid oreven alkaline load.19,29,30 The acid content of a high-protein diethas been linked to the development of tubular-interstitial injurysecondary to augmented intrinsic acid production provoked byendothelin-stimulated enhanced aldosterone activity.29,31,32
The renal ammonia (NH3) transporter RhCG is critical toeliminate NH4
+ andmaintain systemic acid-base balance.33–36
RhCG is localized in most cells along the collecting duct andmediates basolateral uptake of NH3 and final excretion intourine. Its expression is stimulated by acidosis in mice, andRhcg becomes rate-limiting for urinary NH4
+ excretion dur-ing strong acid loads (NH4Cl or HCl loading).33,36–38
Here we examined the effect of high-protein diets contain-ing acidogenic SAA(caseindiet) or those almost devoidof theseamino acids (soy protein diet) on renalmechanismsmediatingammoniagenesis and excretion of the acid load. Our datademonstrate a concerted response of various nephron seg-ments to eliminate themetabolic acid load, the requirement ofRhcg-mediated NH4
+ excretion, and effects on bone. To-gether, these data provide a molecular explanation for thestimulation and requirement of renal acid excretion.
RESULTS
Diet High in Casein Protein Induces a Transient AcidLoad That Rhcg2/2 Mice Can ExcreteMetabolicmeasures andacid-base statuswere assessed inRhcg+/+,Rhcg+/2, and Rhcg2/2 mice receiving a normal diet (basal sta-tus with 20% protein), acid-loading high casein (HC) proteindiet, or non–acid-loading high soy control protein diet (HS)containing high or low SAA, respectively. Fifty percent of HCor HS diets were provided either as casein or soy protein, butthe diets were otherwise isocaloric and identical in their com-position. The HC but not the HS diet was associated withslightly reduced food intake (Table 1, Supplemental Table 1).However, no difference was found in food and water intakesamong the three different genotypes at any time points mea-sured and under all three types of diet (normal, HC, and HS)(Table 1, Supplemental Table 1). Baseline blood and urine var-iables (Table 1, Supplemental Tables 1–4) were similar amongall three genotypes. A transient decrease in blood pH andHCO3
2 after 2 days of the HC diet (Figure 1, A and B), butnot the HS diet (Supplemental Figure 1, A and B), was identi-cally observed in Rhcg+/+, Rhcg+/2, and Rhcg2/2, confirmingthe acid-loading effect of the HC diet. The HC diet did not alterurinary pH but stimulated excretion of titratable acidity, mostlikely in the form of phosphate (Table 1, Supplemental Table 3)to a similar extent in all three genotypes (Figure 1, C and D). Incontrast, the HS diet did not alter blood pH or HCO3
2 but ledto a profound alkalinization of urine pH and a decrease in the
urinary excretion of titratable acids (Supplemental Figure 1C,Supplemental Table 1). Urinary NH4
+ excretion was markedlyincreased in the HC groups whereas it decreased in the HSgroups (Table 1, Supplemental Table 1, Figure 1E, Supplemen-tal Figure 1D). Rhcg deletion delayed the increase in urinaryNH4
+ excretion in response to the HC acid challenge (Figure1E). At days 2 and 4 of the HC diet, respectively, Rhcg2/2
exhibited a 38.5%60.1% and 41.4%60.1% decrease in ex-creted urinary NH4
+ compared with Rhcg+/+ mice (Table 1).At day 9, Rhcg2/2 adapted to the HC diet acid load and ex-creted similar amounts of NH4
+, as did Rhcg+/+mice. The HSdiet did not induce any difference in urinary NH4
+ excretionin all three genotypes (Supplemental Figure 1D). Taken to-gether, these data confirm that a diet containing high amountsof SAA causes a metabolic acid load and demonstrate that itselimination depends partially on the presence of the ammoniatransporter Rhcg.
HC Diet Stimulates Ammoniagenesis in the ProximalTubuleTo assess the proximal tubule response to theHCdiet, we studiedthe regulation of keymolecules involved inNH4
+ production andexcretion (Figure 2, A–D, Supplemental Figures 2–4). The HCdiet caused a transient increase in Rhcg mRNA, whereas RhbgmRNAwas not altered in Rhcg+/+ and Rhcg2/2 kidneys (Supple-mental Figure 2). Four days of the HC diet induced a transientincrease in system N/A transporter 3 (SNAT3) and phosphate-dependent glutaminase (PDG)mRNA levels comparedwith nor-mal diet (Figure 2, A and C). SNAT3 protein levels were alsohigher after 4 days of the HC diet, while PDG showed a higherprotein expression at day 9 of the HC diet (Figure 2, B and D).Cytosolic phosphoenolpyruvate carboxykinase (PEPCK) andsodium-hydrogen exchanger 3 (NHE3) protein abundance re-mained unchanged in Rhcg+/+ during HC treatment (Supple-mental Figure 3, A and B). To test whether the delayed adaptionto HC diet acid load observed in Rhcg2/2 mice could be partlyexplained by an adaptive enhanced NH4
+ production, we com-pared SNAT3, NHE3, PDG, and PEPCK mRNA and proteinabundances in all three groups of mice after 4 and/or 9 days ofthe HC diet. NHE3 and PEPCK mRNA and protein expressionlevels were similar among all three genotypes (Supplemental Fig-ure 3, C–H). However, at day 4 of theHC diet, bothRhcg+/2 andRhcg2/2 increased mRNA and protein expression of SNAT3compared with Rhcg+/+ (Figure 2, A, B, E, and F). PDGmRNA and protein were higher in Rhcg2/2 than Rhcg+/+ (Fig-ure 2, C, D, G, and H). After 9 days of the HC diet, SNAT3 andPDG mRNA and protein were still higher in Rhcg2/2 than inRhcg+/+, while in Rhcg+/2 mice only PDG protein levels wereelevated. Thus, Rhcg2/2 mice increased expression of someproteins critical for proximal tubular ammoniagenesis.
Rhcg+/2 and Rhcg2/2 Mice Have AbnormalAccumulation of NH4
+ in the Medullary InterstitiumNext we assessedmechanisms involved in the generation of thecortico-papillary NH4
+ gradient. We hypothesized that Rhcg2/2
J Am Soc Nephrol 25: 2040–2052, 2014 Rhcg in Diet-Induced Acidosis 2041
www.jasn.org BASIC RESEARCH
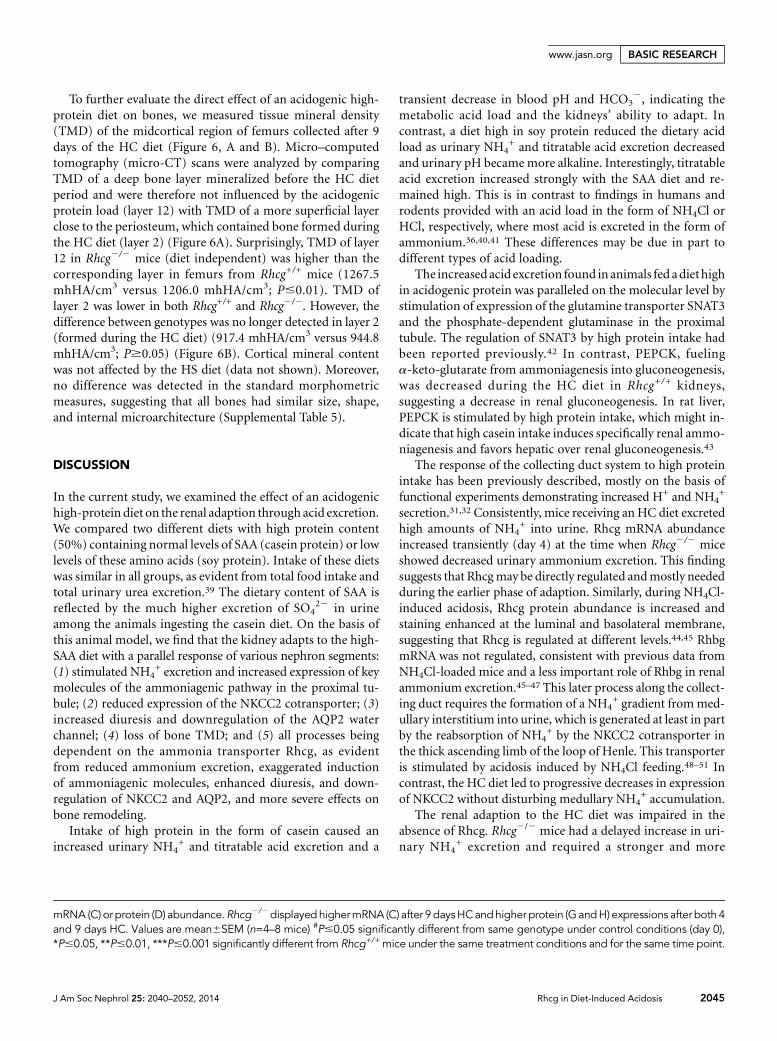
Table
1.Bod
yweight,food
intake
,an
durinaryva
lues
ofRhcg
+/+,Rhcg
+/2,an
dRhcg
2/2
miceduring9day
sof
HC
protein
load
ing
Variable
Basal
Status
2Day
sofHCDiet
4Day
sofHCDiet
9Day
sofHCDiet
Rhcg
+/+
(n=8)
Rhcg
+/2
(n=8)
Rhcg
2/2
(n=8)
Rhcg
+/+
(n=8)
Rhcg
+/2
(n=8)
Rhcg
2/2
(n=8)
Rhcg
+/+
(n=8)
Rhcg
+/2
(n=8)
Rhcg
2/2
(n=8)
Rhcg
+/+
(n=8)
Rhcg
+/2
(n=8)
Rhcg
2/2
(n=8)
Bod
yweight
(g)
28.260.6
29.760.4
27.060.8
28.060.5
29.560.7
26.060.9
27.660.6
29.060.7
25.760.9
27.860.4
27.360.9
25.960.9
Foodintake
(g/24h/bod
ywt)
0.14
60.02
0.14
60.03
0.15
60.02
0.10
60.02
a0.08
60.04
a0.10
60.04
a0.10
60.02
a0.10
60.03
a0.10
60.02
a0.12
60.02
a0.10
60.05
a0.10
60.02
a
Water
intake
(g/24h/bod
ywt)
0.16
60.01
0.14
60.01
0.15
60.01
0.24
60.03
a0.21
60.02
a0.21
60.02
a0.22
60.03
a0.23
60.02
a0.26
60.03
a0.25
60.03
a0.24
60.03
a0.26
60.03
a
Urin
evalues
Volum
e(m
l/24
h)1.89
60.32
1.91
60.18
1.74
60.19
4.51
60.44
a4.34
60.29
a5.20
60.37
a4.24
60.50
a4.38
60.38
a5.52
360.55
a4.52
60.17
a4.36
60.24
a5.65
60.30
a,b
Urin
arypH
5.94
60.08
5.97
60.04
6.03
60.06
6.06
0.04
5.94
60.03
5.87
60.04
5.97
60.04
6.03
60.05
5.89
60.04
5.91
60.04
5.85
60.04
5.86
60.07
NH4+/urin
evo
lume
(mmol/24h)
0.02
860.01
0.02
860.01
0.02
760.01
0.26
60.08
a0.24
.060.07
a0.16
60.04
a,c
0.29
60.08
a0.24
60.07
a0.17
60.05
a,d
0.28
60.08
a0.28
60.05
a0.29
60.08
a
TA/urin
evo
lume
(mmol/24h
)0.08
60.06
0.09
60.03
0.07
60.03
0.22
60.09
a0.25
60.05
a0.22
60.06
a0.20
60.08
a0.23
60.06
a0.23
60.08
a0.24
60.07
a0.28
60.06
a0.27
60.05
a
Ca2
+/urin
evo
lume
(mmol/24h)
1.56
0.1
1.66
0.1
1.26
0.1
3.36
0.1a
3.26
0.7a
6.56
0.2a
,b5.46
0.3a
5.56
0.2a
8.26
0.4a
,c4.16
0.4
6.86
0.2a
5.16
0.4a
Dpd/urin
evo
lume
(nmol/24h)
0.07
660.04
(n=6)
ND
0.07
360.02
(n=6)
ND
ND
ND
0.10
060.07
(n=6)
ND
0.21
160.01
a,c
(n=6)
0.09
360.02
(n=6)
ND
0.14
960.05
a,c
(n=6)
Bodyweight,food
intake
,and
urinaryvalues
ofRhcg
+/+,R
hcg
+/2,a
ndRhcg
2/2
miceduring9day
sHCprotein
load
ing(n=8micefore
achgroup
).ND,n
otd
etermined
.a P#0.05
significa
ntly
differen
tfrom
samegen
otyp
eun
der
controlcon
dition
s.bP#0.01
significantlydifferen
tfrom
Rhcg
+/+
miceun
der
sametrea
tmen
tco
ndition
s.c P#0.05
significa
ntly
differen
tfrom
Rhcg
+/+
miceun
der
sametrea
tmen
tcon
ditions.
dP#0.00
1significantlydifferen
tfrom
Rhcg
+/+
miceun
der
sametrea
tmen
tcond
itions.
2042 Journal of the American Society of Nephrology J Am Soc Nephrol 25: 2040–2052, 2014
BASIC RESEARCH www.jasn.org

mice could increase the NH4+ excretion by stimulating NH4
+
reabsorption by the thick ascending limbNa+/K+/2Cl2 cotrans-porter (NKCC2). NKCC2 protein expression inRhcg+/+,Rhcg+/2,andRhcg2/2mice after 4 and 9 days of theHCdiet revealed twoopposite regulations of the protein during HC treatment.NKCC2 levels were higher in Rhcg+/2 and Rhcg2/2 after 4days (Figure 3A) but were lower in Rhcg2/2 after 9 days (Figure3B). NH4
+ tissue content in the cortex, outer medulla, andinner medulla followed NKCC2 expression. At day 4 of theHC diet (Figure 3, C and D), both Rhcg+/2 and Rhcg2/2 accu-mulated more NH4
+ in the inner medulla than did Rhcg+/+
(25.2%60.1% for Rhcg+/2 and 29.9%60.1% for Rhcg2/2).In contrast, at day 9 of the HC diet (Figure 3D), Rhcg2/2 hadlower inner medullary NH4
+ content than did Rhcg+/+
(237.0%60.1%). Thus, the adaption of Rhcg-deficient miceto a high-SAA diet involves regulation of the NKCC2 cotrans-porter and affects accumulation of NH4
+ in the medullary in-terstitium.
HC Diet Stimulates Diuresis and DownregulatesNKCC2 and AQP2Besides its role in NH4
+ reabsorption, NKCC2 functions in thecountercurrent mechanism establishing the cortico-papillary
osmotic gradient required for water reab-sorption along the collecting duct. The HCdiet induced diuresis in all three genotypes(Figure 4E, Table 1), whereas diuresis waslower in animals receiving the HS diet de-spite quantitatively similar urea excretion(compareTable1withSupplementalTable1).We measured NKCC2 and collecting-duct AQP2 protein expression levels inRhcg+/+ (Figure 4, A and B) and Rhcg2/2
animals (Figure 4, C and D) at 0, 4, and 9days of the HC and HS diets. NKCC2 andAQP2 were downregulated by the HC dietin both genotypes, with reduced NKCC2expression in Rhcg wild-type after 4 and 9days of the HC die (Figure 4A) and after 9days in Rhcg2/2 mice (Figure 4C). Simi-larly, AQP2 levels were lower after 9 daysof the HC diet in Rhcg+/+ and Rhcg2/2
mice (Figure 4, B and D). Because Rhcg2/2
excreted more urine than their littermates(5.760.5 versus 4.560.3 ml/24 hours after9 days of the HC diet; P#0.01) (Figure 4E),we tested whether the active phosphorylatedform of AQP2 (pSer256-AQP2) was alteredin Rhcg2/2 mouse kidneys. The total abun-dance of mature pSer256-AQP2 (35-kDaband) was reduced, as well as the ratio ofphosphorylated AQP2 over total AQP2(Figure 4F). In animals receiving the HSdiet, NKCC2 and AQP2 were not regu-lated (Supplemental Figure 4). In
summary, a high-SAA diet stimulates diuresis by downregu-lating NKCC2 and AQP2, an effect amplified in Rhcg2/2
mice.
HC Diet Stimulates Bone Resorption Exaggerated byAbsence of RhcgTwo days of the HC diet caused a transient increase in ionizedblood Ca2+ levels in both Rhcg+/+ and Rhcg2/2 animals butsignificantly higher increases in Rhcg2/2mice. In contrast, Ca2+
levels remained higher in Rhcg2/2mice and returned to normalonly on day 9 (Figure 5A). Urinary Ca2+ excretion was alsotransiently increased in both genotypes at days 2 and 4 of theHCdiet, with significantly higher urinary Ca2+ levels inRhcg2/2
at day 4 (Figure 5B). To investigate bone remodelling, we mea-sured urinary deoxypyridinoline (Dpd) excretion, a marker ofbone resorption and plasma concentration of osteocalcin, amarker of bone formation (Figure 5, C and D). Dpd levelswere elevated after 4 days of the HC diet in Rhcg+/+ and Rhcg2/2
and remained higher in Rhcg2/2 after 9 days of the HC diet.Plasma osteocalcin levels did not significantly differ during thetreatment or between the two groups, suggesting that increasedbone formation does not compensate for bone resorption inRhcg+/+ and Rhcg2/2 mice.
Figure 1. Rhcg+/+, Rhcg+/2, and Rhcg2/2 mice can adapt to HC diet. Blood and urinedata were collected in Rhcg+/+, Rhcg+/2, and Rhcg 2/2 mice treated for 9 days on theHC diet. All animals showed a transient decrease of blood pH (A) and bicarbonate (B).(C) Titratable acids increased on the HC diet. (D) All mice rapidly increased urinaryNH4
+ excretion, but Rhcg2/2 had lower NH4+ excretion than Rhcg+/+ during days 2
and 4 of the HC diet. Values are mean6SEM (n=8 mice) *P#0.05 (Rhcg2/2 versusRhcg+/+), #P#0.05 significantly different from same genotype under control conditions(day 0), ***P#0.05 significantly different from Rhcg+/+ mice under same treatmentconditions and for the same time point.
J Am Soc Nephrol 25: 2040–2052, 2014 Rhcg in Diet-Induced Acidosis 2043
www.jasn.org BASIC RESEARCH

Figure 2. The HC diet stimulated the ammoniagenic pathway. Kidneys collected from all three groups of mice after 4 or 9 days of the HCdiet were analyzed by quantitative RT-PCR and immunoblotting. After 4 days of the HC diet, Rhcg+/+ highly increased mRNA (A) andprotein (B) expression of SNAT3. Rhcg+/2 and Rhcg 2/2 exhibited higher SNAT3 mRNA (A) and protein (E) levels than did Rhcg+/+.At day 9, only Rhcg2/2 kept an enhanced level of SNAT3 mRNA (A) and protein (F). 4 or 9 days HC diet augmented Rhcg+/+ PDG
2044 Journal of the American Society of Nephrology J Am Soc Nephrol 25: 2040–2052, 2014
BASIC RESEARCH www.jasn.org
To further evaluate the direct effect of an acidogenic high-protein diet on bones, we measured tissue mineral density(TMD) of the midcortical region of femurs collected after 9days of the HC diet (Figure 6, A and B). Micro–computedtomography (micro-CT) scans were analyzed by comparingTMD of a deep bone layer mineralized before the HC dietperiod and were therefore not influenced by the acidogenicprotein load (layer 12) with TMD of a more superficial layerclose to the periosteum, which contained bone formed duringthe HC diet (layer 2) (Figure 6A). Surprisingly, TMD of layer12 in Rhcg2/2 mice (diet independent) was higher than thecorresponding layer in femurs from Rhcg+/+ mice (1267.5mhHA/cm3 versus 1206.0 mhHA/cm3; P#0.01). TMD oflayer 2 was lower in both Rhcg+/+ and Rhcg2/2. However, thedifference between genotypes was no longer detected in layer 2(formed during the HC diet) (917.4 mhHA/cm3 versus 944.8mhHA/cm3; P$0.05) (Figure 6B). Cortical mineral contentwas not affected by the HS diet (data not shown). Moreover,no difference was detected in the standard morphometricmeasures, suggesting that all bones had similar size, shape,and internal microarchitecture (Supplemental Table 5).
DISCUSSION
In the current study, we examined the effect of an acidogenichigh-protein diet on the renal adaption through acid excretion.We compared two different diets with high protein content(50%) containing normal levels of SAA (casein protein) or lowlevels of these amino acids (soy protein). Intake of these dietswas similar in all groups, as evident from total food intake andtotal urinary urea excretion.39 The dietary content of SAA isreflected by the much higher excretion of SO4
22 in urineamong the animals ingesting the casein diet. On the basis ofthis animal model, we find that the kidney adapts to the high-SAA diet with a parallel response of various nephron segments:(1) stimulated NH4
+ excretion and increased expression of keymolecules of the ammoniagenic pathway in the proximal tu-bule; (2) reduced expression of the NKCC2 cotransporter; (3)increased diuresis and downregulation of the AQP2 waterchannel; (4) loss of bone TMD; and (5) all processes beingdependent on the ammonia transporter Rhcg, as evidentfrom reduced ammonium excretion, exaggerated inductionof ammoniagenic molecules, enhanced diuresis, and down-regulation of NKCC2 and AQP2, and more severe effects onbone remodeling.
Intake of high protein in the form of casein caused anincreased urinary NH4
+ and titratable acid excretion and a
transient decrease in blood pH and HCO32, indicating the
metabolic acid load and the kidneys’ ability to adapt. Incontrast, a diet high in soy protein reduced the dietary acidload as urinary NH4
+ and titratable acid excretion decreasedand urinary pH becamemore alkaline. Interestingly, titratableacid excretion increased strongly with the SAA diet and re-mained high. This is in contrast to findings in humans androdents provided with an acid load in the form of NH4Cl orHCl, respectively, where most acid is excreted in the form ofammonium.36,40,41 These differences may be due in part todifferent types of acid loading.
The increased acid excretion found in animals fed adiethighin acidogenic protein was paralleled on the molecular level bystimulation of expression of the glutamine transporter SNAT3and the phosphate-dependent glutaminase in the proximaltubule. The regulation of SNAT3 by high protein intake hadbeen reported previously.42 In contrast, PEPCK, fuelinga-keto-glutarate from ammoniagenesis into gluconeogenesis,was decreased during the HC diet in Rhcg+/+ kidneys,suggesting a decrease in renal gluconeogenesis. In rat liver,PEPCK is stimulated by high protein intake, which might in-dicate that high casein intake induces specifically renal ammo-niagenesis and favors hepatic over renal gluconeogenesis.43
The response of the collecting duct system to high proteinintake has been previously described, mostly on the basis offunctional experiments demonstrating increased H+ and NH4
+
secretion.31,32 Consistently, mice receiving an HC diet excretedhigh amounts of NH4
+ into urine. Rhcg mRNA abundanceincreased transiently (day 4) at the time when Rhcg2/2 miceshowed decreased urinary ammonium excretion. This findingsuggests that Rhcgmay be directly regulated andmostly neededduring the earlier phase of adaption. Similarly, during NH4Cl-induced acidosis, Rhcg protein abundance is increased andstaining enhanced at the luminal and basolateral membrane,suggesting that Rhcg is regulated at different levels.44,45 RhbgmRNA was not regulated, consistent with previous data fromNH4Cl-loaded mice and a less important role of Rhbg in renalammonium excretion.45–47 This later process along the collect-ing duct requires the formation of a NH4
+ gradient frommed-ullary interstitium into urine, which is generated at least in partby the reabsorption of NH4
+ by the NKCC2 cotransporter inthe thick ascending limb of the loop of Henle. This transporteris stimulated by acidosis induced by NH4Cl feeding.48–51 Incontrast, the HC diet led to progressive decreases in expressionof NKCC2 without disturbing medullary NH4
+ accumulation.The renal adaption to the HC diet was impaired in the
absence of Rhcg. Rhcg2/2 mice had a delayed increase in uri-nary NH4
+ excretion and required a stronger and more
mRNA (C) or protein (D) abundance.Rhcg2/2displayedhighermRNA (C) after 9 daysHCandhigher protein (G andH) expressions after both 4and 9 days HC. Values are mean6SEM (n=4–8 mice) #P#0.05 significantly different from same genotype under control conditions (day 0),*P#0.05, **P#0.01, ***P#0.001 significantly different from Rhcg+/+mice under the same treatment conditions and for the same time point.
J Am Soc Nephrol 25: 2040–2052, 2014 Rhcg in Diet-Induced Acidosis 2045
www.jasn.org BASIC RESEARCH

sustained increase in PDG and SNAT3 expression, all indicat-ing highly stimulated ammoniagenesis. Furthermore, NKCC2expressionwas evenmore decreased than inwild-type animalsand medullary NH4
+ accumulation was impaired in the innermedulla.
High protein diets, such as casein and soy, stimulateddiuresis in animals, but casein produced a stronger diuresisthan did the soy diet. Increased excretion of urea from hepaticprotein metabolism may be partly responsible for the diuresiscausing an osmotic driving force. The acid content of the HC
diet, however, probably provides an additional stimulusbecause mice receiving the acidogenic casein diet had higherdiuresis despite almost identical urea excretion. Indeed,feeding mice or rats with NH4Cl causes similar diuresis.52,53
Here we found that diuresis was accompanied by a progressivereduction in AQP2 water channel expression. Rhcg2/2 miceexcreted even higher urine volumes than did Rhcg+/+ animals.NKCC2 and AQP2were not regulated inmice receiving the HSdiet, demonstrating that high protein per se does not regulatethese proteins. Moreover, phosphorylation of AQP2 at serine
Figure 3. Altered medullary absorption and accumulation of ammonium in Rhcg-deficient mice. After 4 or 9 days of the HC diet, Rhcg+/+,Rhcg +/2, and Rhcg 2/2 mice kidneys were submitted to Western blot analysis and NH4
+ concentration was measured in dissectedcortex and inner and outer medulla. Expression of NKCC2 was higher in Rhcg+/2 and Rhcg 2/2 than Rhcg+/+ at day 4 of the HC diet (A),while at day 9, Rhcg2/2 showed a reduced level (B). (C) NH4
+ concentration was similarly increased in the inner medulla of Rhcg+/2 andRhcg 2/2 mice at day 4 of the HC diet. (D) At day 9, Rhcg2/2 had much lower inner medullary NH4
+ content. Values are mean6SEM(n=6–7 mice). #P#0.05 significantly different from same genotype under control conditions (day 0); *P#0.05, ***P#0.001 significantlydifferent from Rhcg+/+ mice under same treatment conditions and for the same time point.
2046 Journal of the American Society of Nephrology J Am Soc Nephrol 25: 2040–2052, 2014
BASIC RESEARCH www.jasn.org

Figure 4. The HC diet stimulates diuresis and regulates NKCC2 and AQP2 expression. Protein expression levels were examined usingimmunoblotting, and urine production was measured at different time points of the HC diet in Rhcg+/+ and Rhcg 2/2 mice. NKCC2protein levels were decreased after 4 and 9 days of the HC diet in Rhcg+/+ (A) and only after 9 days in Rhcg2/2 (C), while AQP2expression was reduced in Rhcg+/+ (B) and Rhcg 2/2 (D) mice at day 9 of the HC diet. Rhcg2/2 showed higher urinary excretion than Rhcg+/+
J Am Soc Nephrol 25: 2040–2052, 2014 Rhcg in Diet-Induced Acidosis 2047
www.jasn.org BASIC RESEARCH

256, critical for the regulated insertion and activity of thechannel in the membrane, was reduced in Rhcg2/2 mice.This finding suggests that increased diuresis may be part of acompensatory mechanism. Thus, the more pronounced re-duction in NKCC2 expression and reduced insertion ofAQP2 at the plasma membrane would allow Rhcg2/2 mice toexcrete theNH4
+ formed in the proximal tubule by shunting themedullary interstitium passage and diluting and excreting theNH4
+ load in the thick ascending limb and collecting duct.The time course of achieving similar rates of urinary am-monium excretion and stronger downregulation of NKCC2,reduced medullary ammonium accumulation, and lowerAQP2 expression is similar, possibly indicating a concertedcompensatory mechanism. We speculate that several hor-mones might be involved in mediating the effect of the HCdiet on NKCC2 and AQP2. Among them, aldosterone, endo-thelin 1, prostaglandin E2, and atrial natriuretic peptide areincreased by high-protein diets.32,54,55 Atrial natriuretic pep-tide and prostaglandin E2 reduce AQP2 expression andNKCC2function.56,57 In addition, endothelin 1 and aldosterone may re-duce NKCC2 expression and function via a nitric oxide, cyclicguanosinemonophosphate, and phosphodiesterase-2–dependentmechanism.
Whether high protein intake has a negative effect on bone iscontroversial, and the positive or negative impact may dependon the type of protein, the content ofminerals, and the contentof carbohydrates (e.g., whether diets are ketogenic).21–23 Aci-dosis has significant adverse effects on bone, stimulatingosteoclast activity, increasing demineralization, and finallyleading to loss of bone mineral density and stability.58,59 TheHC diet stimulated bone degradation in Rhcg2/2, as evidentfrom the increased urinary excretion of Dpd. Moreover, boneTMD was lower in a layer (layer 2) close to the bone surfacecontaining newly formed bone, and no difference among geno-types could be detected. In wild-type animals, Dpd levelsincreased only transiently, whereas in Rhcg2/2 mice, Dpd re-mained elevated, consistent with increased bone degradation;this possibly contributes to the compensation of reducedNH4
+
excretion. Surprisingly, no evidence was found for higherosteoblast activity, reflected by constant osteocalcin levels.This finding suggests that the HC diet would eventuallycause a small net loss of bone. Indeed, elevated urinary Ca2+
was paralleled with Dpd levels, indicating that this calciumloadmay at least in part originate from bone. However, effectsof acidosis on calcium binding to albumin could also contrib-ute to hypercalciuria and hypercalcemia, as well as stimulationof intestinal calcium absorption during acidosis.60 Consump-tion of an acidogenic HC diet was paralleled by a loss of
difference between higher bone TMD in Rhcg2/2 animalsand lower TMD in wild-type animals. Whether the lowerTMD in the younger layer is only an age-dependent effector may be influenced by the acidogenic HC diet remains to beclarified. The higher TMD found in the deeper bone layer ofRhcg2/2 suggests that Rhcg deletion might influence bone de-velopment toward a higher density. Expression of Rhcg hasnot been reported for bone, indicating that differences inTMD are rather the consequence of absent Rhcg function inother organs. Thus, the effects of HC diets and absence of Rhcgmay be subtle in our data set but reflect only dietary changesover a very short period (9 days); longer exposure to HC-likediets may have more pronounced effects, which must be ad-dressed in future studies.
In summary, we demonstrate that the kidney responds toacidogenic high-protein diets with increased ammoniagenesisand NH4
+ excretion, and deciphers the transport pathwayscontributing to this adaptive response. The renal ammoniumtransporter Rhcg is critical for the adaption. Its absence orreduced activity in inherited or acquired kidney disease maycontribute to metabolic acidosis and bone degradation, andeventually may be fed back on the kidney, contributing to theprogression of kidney disease.
CONCISE METHODS
AnimalsMice were genotyped by PCR directly on a 3-ml 25 mM NaOH ear
biopsy digestion product. Genomic DNAwas amplified using primer
pairs specific for exon 1: forward (AGACCCCACAATGGAAAGCTA-
TAA), Rhcg+/+ reverse (CAACCAGAACTCCCCAGTGTCAGA), and
Rhcg2/2 reverse (ATGGGCTGACCGCTTCCTCGTGCTTTAC).36
The products were separated by electrophoresis on 1% agarose gels
(mutant product: 522 bp, wild-type product: 376 bp). Heterozygous
mice were mated to generate mice of all genotypes. All animal experi-
ments were conducted according to Swiss Laws of Animal Welfare
and approved by the local Zurich Veterinary Authority (Kantonales
Veterinäramt Zürich).
Metabolic Cage StudiesAll experiments were performed using age-matched male Rhcg wild-
type (Rhcg+/+), Rhcg knockout (Rhcg2/2), and Rhcg heterozygous
(Rhcg+/2) littermate mice (3–4 months old), housed in standard or
metabolic cages (Tecniplast, Buguggiate, Italy). Mice were given de-
ionized water and were fed a standard powdered laboratory chow ad
libitum (Kliba, Kaiseraugst, Switzerland). Mice were allowed to adapt
to metabolic cages for 2 days; then, one 24-hour urine sample was
(E). Mature pSer256-AQP2 showed decreased abundance at day 9 in Rhcg2/2, and the ratio of pSer256-AQP2 over total AQP2 wasreduced in Rhcg2/2 (F). Values are mean6SEM (n=4–8 mice). #P#0.05 significantly different from same genotype under control con-ditions (day 0); *P#0.05, **P#0.01; ***P#0.001 significantly different from Rhcg+/+ mice under same treatment conditions and for thesame time point.
2048 Journal of the American Society of Nephrology J Am Soc Nephrol 25: 2040–2052, 2014
BASIC RESEARCH www.jasn.org

collected under light mineral oil in urine collectors to determine daily
urinary measures. Mice were then allowed to recover for 2 days in
standard cages andwere given a high-protein diet (50% casein or 50%
soy) (Ssniff Spezialdiaeten GmbH, Soest, Germany) for 9 days. Four
24-hour urine samples were collected during the 9 days of the high-
protein diet. Water and food intake and urine excretion were mon-
itored at baseline and during 9 days of high-protein treatment. Blood
was collected from the retroorbital plexus under isofluran anesthesia
and analyzed in a Radiometer ABL 505 blood gas analyzer (Radiom-
eter, Copenhagen, Denmark). Urinary pHwasmeasured directly after
collection using a pH microelectrode (691 pH meter; Metronohm).
Urinary electrolytes concentrations were measured by flame pho-
tometry (IL943; Instruments Laboratory), and titratable acid was
measured using a DL 50 titrator (Mettler Toledo36). Urinary NH3/
NH4+ and creatinine were assessed using the Berthelot and Jaffe
methods, respectively.61,62 Urinary SO422 was measured by ion ex-
change chromatography using an IonPac AS 11 analytical column
on a Dionex DX-600 HPLC system (Dionex, Olten, Switzerland).
Urinary deoxypyridinoline (DPD) was measured with a DPD En-
zyme Immunoassay kit (Microvue DPD EIA; Quidel Corporation,
SanDiego, CA), and plasma osteocalcinwasmeasured using aMouse
Osteocalcin Immunoradiometric Assay kit (Mouse Osteocalcin
IRMA Kit; Immunotopics, San Clemente, CA). Mice were anesthe-
tized with ketamine and xylazine and euthanized at different time
points to collect blood, kidneys, and femurs.
Kidneys were immediately flash-frozen in liq-
uid nitrogen and placed at280°C until further
processing. Femurs were collected and stored in
70% ethanol at room temperature.
RNA Extraction and ReverseTranscriptionSnap-frozen kidneys (eight or five half kidneys
for each condition, 9 days of diet or 4 days of diet,
respectively) were homogenized in RLT-Buffer
(Qiagen, Basel, Switzerland) supplemented with
b-mercaptoethanol to a final concentration of
1%. Total RNA was extracted from 200-ml ali-
quots of each homogenized sample using the
RNeasy Mini Kit (Qiagen) according to the
manufacturer’s instructions. Quality and con-
centration of the isolated RNA preparations
were analyzed on the NanoDrop ND-1000
spectrophotometer (Wilmington, DE). Total
RNA samples were stored at 280°C. Each
RNA sample was diluted to a final concentration
of 100 ng/ml, and cDNA was prepared using the
TaqMan Reverse Transcription Reagent Kit
containing 103 RT buffer, MgCl2, random
hexamers, deoxyribonucleotide triphosphates,
Rnase inhibitors, and Multiscribe reverse tran-
scription enzyme (Applied Biosystems/Roche,
Foster City, CA). Reverse transcription was per-
formedwith theBiometraTGradient thermocycler
(Goettingen, Germany), with thermocycling
conditions set at 25°C for 10 minutes, 48°C for 30 minutes, and
95°C for 5 minutes.
Real-Time Semi-Quantitative PCRRelative mRNA expression was determined using semi-quantitative
real-time RT-PCR using the Applied Biosystems 7500 Fast Real-Time
PCR system. Thermocycling conditions consisted of denaturation
(95°C; 10 minutes) followed by 40 cycles of denaturation at 95°C for
15 seconds and annealing/elongation (60°C; 60 seconds) with auto
ramp time. All reactions were run in triplicate. Forward and reverse
primers and probe concentrations were 25 mM and 5 mM, respec-
tively. TaqMan Universal PCR master mix 23 (Applied Biosys-
tems/Roche) was used as the Taq polymerase. Primers and probes
for SNAT3, PDG, NHE3, PEPCK, NKCC2, and hypoxanthine-guanine
phosphoribosyltransferase (HPRT) were generated using Primer
Express software from Applied Biosystems and synthesized at Mi-
crosynth (Balgach, Switzerland) as described previously.36,63
Probes were generated with the reporter dye FAM at the 59 end
and carboxytetramethylrhodamine at the 39 end. Reactions were
run in triplicates, including a negative control (withoutMultiscribe
reverse transcription enzyme). The cycle threshold (Ct) values ob-
tained were ultimately compared with Ct values of the endogenous
gene HPRT. Relative mRNA expression ratios were calculated as
follows:
Figure 5. Rhcg2/2 mice develop hypercalcemia and hypercalciuria, and show signs ofincreased bone resorption during HC diet. (A) After 2 and 4 days of the HC diet,ionized Ca2+ concentration was higher in Rhcg2/2 blood. (B) At day 4, urinary Ca2+
excretion was also increased in Rhcg 2/2. (C) The release of the bone degradationmarker Dpd was augmented in Rhcg2/2 compared with Rhcg+/+ following 4 and 9days the HC diet, whereas the plasma concentration of the bone formation markerosteocalcin (D) was not affected by diet and genotype. Values are mean6SEM (n=5–8mice). #P#0.05 significantly different from same genotype under control conditions(day 0); *P#0.05, **P#0.01 significantly different from Rhcg+/+ mice under sametreatment conditions and for the same time point.
J Am Soc Nephrol 25: 2040–2052, 2014 Rhcg in Diet-Induced Acidosis 2049
www.jasn.org BASIC RESEARCH

R¼ 2½CtðHPRT=Ctðgene of interestÞÞ�;
where Ct represents the cycle number at threshold 0.02.
ImmunoblottingCrude total membrane proteins or cytosolic fractions were obtained
from kidneys homogenized in 250mM sucrose, 10mMTris-HCl, pH
7.5, and in the presence of protease inhibitors (complete ULTRA
tablets; Roche, Rotkreuz, Switzerland). Forty micrograms of crude
membrane proteins or cytosolic proteins were solubilized in loading
buffer containing dithiothreitol (2 M) and separated on 5%–10%
polyacrylamide gels. For immunoblotting, proteins were transferred
electrophoretically to polyvinylidene fluoridemembranes (Immobilon-
P; EMD Millipore, Bedford, MA). After blocking with 5% milk
powder in Tris-buffered saline-0.1% Tween-20 for 60 minutes,
membranes were incubated with rabbit polyclonal anti-SNAT3
(diluted 1:1000),63 anti-PDG (diluted 1:5000; kindly provided by
Dr. N. Curthoys, University of Colorado), anti-PEPCK (diluted
1:5000; Cayman Chemicals, Ann Arbor, MI), rabbit polyclonal anti-
NKCC2 and anti-AQP2 (diluted 1:5000; kindly provided by J. Loffing,
Institute of Anatomy, University of Zurich), rabbit anti-pSer256-AQP2
1:3000 (kindly provided by Dr. S. Nielsen, University of Aarhus), rabbit
polyclonal anti-NHE3 (StressMarq Biosciences Inc., Victoria, BC, Canada)
and mouse monoclonal anti–b-actin antibody (1:20,000; Sigma-
Aldrich, St. Louis,MO) overnight at 4°C. After washing and blocking
with 5% milk powder for 60 minutes, membranes were then incu-
bated for 2 hours at room temperature with secondary goat anti-rabbit
antibodies 1:5000 or donkey anti-mouse antibodies 1:10,000 linked to
alkaline phosphatase (Promega, Madison, WI) or horseradish peroxi-
dase (Promega), respectively. The protein signal was detected with
the appropriate substrate (CDP-Star; Roche,
Rotkreuz, Switzerland for alkaline phosphatase;
EMDMillipore for horseradish peroxidase) using
the Las-4000 image analyzer system (Fujifilm; Life
Science). All images were analyzedwith Advanced
Image Data Analyzer AIDA (Raytest, Strauben-
hardt, Germany) to calculate the protein of in-
terest/b-actin ratio.
Measurement of Renal AmmoniumContentRenal tissue ammonium content was measured
by an enzymatic technique (Sigma-Aldrich;
Ammonia Assay Kit) as previously described.36
Mice were anesthetized and kidneys removed
and immediately frozen in liquid nitrogen. Kid-
neys were then sliced frozen to yield a column of
tissue, which extended from the cortex to the tip
of the papilla. Sections were cut along the cortico-
medullary axis to yield three slices: cortex,
outer medulla, and inner medulla. Two kid-
neys were pooled for each sample. Tissue slices
were then homogenized in 300ml of ice-cold 7%
trichloroacetic acid, and the solution was centri-
fuged. The supernatant was drawn off and the
pH of a 250-ml sample was adjusted to near neutral by the addition of
12 ml of 10 mMNa2HPO4 in 9 N NaOH. A 200-ml sample of buffered
supernatant was then analyzed for ammonium concentration. The
pellet was resuspended in 1 N NaOH, shaken overnight, and ana-
lyzed for total protein concentration using the Bio-Rad protein assay
(Bio-Rad, Hercules, CA).
Micro-CT Imaging and Quantitative AnalysisWhole femurs of five Rhcg+/+ and five Rhcg2/2 were scanned with a
desktop micro-CT (mCT40; Scanco Medical, Brüttisellen, Switzerland)
operated at 55 kVp and 145 mA. The samples were scanned with the
long axis perpendicular to the beam direction and using an in-
tegration time of 300 milliseconds and a frame averaging of 3,
resulting in a total scanning time of approximately 5.1 hours
per sample. Before image reconstruction, a voltage-specific
third-order polynomial correction52 provided by the manufacturer
was applied to minimize the influence of beam hardening. The re-
constructed scans had a nominal isotropic resolution of 10 mm. A
three-dimensional Gaussian filter (sigma 0.8, support 1) was ap-
plied to reduce the noise present in the images, and the gray levels of
the scans were then transformed into TMD by using the manufacturer
calibration record based on a phantom of 1200 mg HA/cm.3,64 The
micro-CT scanner was calibrated weekly for mineral equivalent value
andmonthly for determining in-plane spatial resolution. All measure-
ments and analyses were performed according to the guidelines for
assessment of bonemicrostructure in rodents usingmicro-CT.65 Stan-
dard three-dimensional morphometric measures were computed for
full, cortical, and trabecular bone as described elsewhere.66 TMD was
evaluated in the cortical bone compartment having a size of 30%of the
total femoral length by averaging the TMD values in different layers
Figure 6. HC diet reduces bone mineral density in Rhcg2/2 mice. (A) Micro-CT re-construction of a femur with the midcortical region considered for TMD evaluation.The inset shows the different gray values (top), which carry information on TMD anda cross-section (bottom) with layer 2 close to the periosteum (light gray) and layer12 (dark gray). (B) TMD of Rhcg2/2 was higher than TMD of Rhcg+/+ in the diet-independent layer 12 but not in layer 2, which was formed during the diet. Data arerepresented by boxplots (i.e., the inner box contains 50% of all data, the whisker barsdenote the full range, and the black line represents the median value [over all ani-mals]). Statistical significance was obtained with two-way ANOVA with Bonferronimultiple comparisons test; n=5 per genotype. **P#0.01 significantly different fromwild-type mice under same treatment conditions and for the same time point.
2050 Journal of the American Society of Nephrology J Am Soc Nephrol 25: 2040–2052, 2014
BASIC RESEARCH www.jasn.org

having the same distance to the bone surface, according to a recently
developed layer analysis.67 Specifically, we analyzed the TMD in layer
2 (i.e., close to the bone periosteal surface and hence affected by diet)
and in layer 12 (i.e., far from the bone surface and thus not affected
by diet).
Statistical AnalysesStatistical comparisons were tested by ANOVA (one-way, Newman–
Keuls multiple comparison test) and unpaired t test using GraphPad
Prism (GraphPad Software). P values,0.05 were considered to rep-
resent statistically significant differences.
ACKNOWLEDGMENTS
We thank Julien Weber and Sébastien Druart for their help in the
biochemical profiling of the mouse models. The use of the Zurich
Integrative Rodent Physiology Core Facility is gratefully acknowl-
edged.
This study was supported by a grant from the Swiss National
Science Foundation to C.A.W. (31003A_138143). The studies were
further supported in part by the European Community’s Seventh
Framework Programme (FP7/2007-2013) under grant agreement
number 305608 (EURenOmics) to O.D. and C.A.W., an Action de
Recherche Concertée (ARC, Communauté Française de Belgique) to
O.D., the FNRS and FRSM, the Inter-University Attraction Pole
(IUAP, Belgium Federal Government), and the NCCR Kidney.CH
program (Swiss National Science Foundation) to O.D.
DISCLOSURESNone.
REFERENCES
1. Hamm LL, Alpern RJ, Preisig PA: Cellular mechanisms of renal tubularacidification. In: Seldin and Giebisch’s The Kidney Physiology andPathophysiology, edited by Alpern RJ, 4th Ed., Burlington, MA, Aca-demic Press, 2008, pp 1539–1585
2. Curthoys NP: Renal ammonium ion production and excretion. In: Seldinand Giebisch’s The Kidney Physiology and Pathophysiology, edited byAlpern RJ, 4th Ed., Burlington, MA, Academic Press, 2008, pp 1601–1619
3. Fry AC, Karet FE: Inherited renal acidoses. Physiology (Bethesda) 22:202–211, 2007
4. Laing CM, Toye AM, Capasso G, Unwin RJ: Renal tubular acidosis:Developments in our understanding of the molecular basis. Int J Bio-
chem Cell Biol 37: 1151–1161, 20055. Kraut JA, Kurtz I: Metabolic acidosis of CKD: Diagnosis, clinical char-
acteristics, and treatment. Am J Kidney Dis 45: 978–993, 20056. de Brito-Ashurst I, VaragunamM, RafteryMJ, YaqoobMM: Bicarbonate
supplementation slows progression of CKD and improves nutritionalstatus. J Am Soc Nephrol 20: 2075–2084, 2009
7. Mahajan A, Simoni J, Sheather SJ, Broglio KR, Rajab MH, Wesson DE:Daily oral sodium bicarbonate preserves glomerular filtration rate byslowing its decline in early hypertensive nephropathy. Kidney Int 78:303–309, 2010
8. Phisitkul S, Khanna A, Simoni J, Broglio K, Sheather S, Rajab MH,Wesson DE: Amelioration of metabolic acidosis in patients with lowGFR reduced kidney endothelin production and kidney injury, andbetter preserved GFR. Kidney Int 77: 617–623, 2010
9. Wesson DE, Simoni J, Broglio K, Sheather S: Acid retention accompaniesreduced GFR in humans and increases plasma levels of endothelin andaldosterone. Am J Physiol Renal Physiol 300: F830–F837, 2011
10. Goraya N, Simoni J, Jo C,Wesson DE: Dietary acid reduction with fruitsand vegetables or bicarbonate attenuates kidney injury in patientswith a moderately reduced glomerular filtration rate due to hyperten-sive nephropathy. Kidney Int 81: 86–93, 2012
11. Smit E,NietoFJ,CrespoCJ,Mitchell P: Estimatesof animal andplantproteinintake in US adults: Results from the Third National Health and NutritionExamination Survey, 1988-1991. J Am Diet Assoc 99: 813–820, 1999
12. European Food Safety Authority: Scientific opinion on dietary refer-ence values for protein. EFSA Journal 10: 2257, 2012
13. Westerterp-Plantenga MS, Lejeune MP, Nijs I, van Ooijen M, KovacsEM:High protein intake sustainsweightmaintenance after bodyweightloss in humans. Int J Obes Relat Metab Disord 28: 57–64, 2004
14. Astrup A, Meinert Larsen T, Harper A: Atkins and other low-carbohydratediets:Hoaxor aneffective tool forweight loss? Lancet364: 897–899, 2004
15. BrändleE,SieberthHG,HautmannRE:Effectof chronicdietaryprotein intakeon the renal function in healthy subjects. Eur J Clin Nutr 50: 734–740, 1996
16. Brenner BM, Meyer TW, Hostetter TH: Dietary protein intake and theprogressive nature of kidney disease: The role of hemodynamicallymediated glomerular injury in the pathogenesis of progressive glo-merular sclerosis in aging, renal ablation, and intrinsic renal disease. NEngl J Med 307: 652–659, 1982
17. Friedman AN: High-protein diets: potential effects on the kidney inrenal health and disease. Am J Kidney Dis 44: 950–962, 2004
18. King AJ, Levey AS: Dietary protein and renal function. J Am Soc
Nephrol 3: 1723–1737, 199319. Kontessis P, Jones S, Dodds R, Trevisan R, Nosadini R, Fioretto P,
Borsato M, Sacerdoti D, Viberti G: Renal, metabolic and hormonal re-sponses to ingestion of animal and vegetable proteins. Kidney Int 38:136–144, 1990
20. Knight EL, Stampfer MJ, Hankinson SE, Spiegelman D, Curhan GC: Theimpactofprotein intakeon renal functiondecline inwomenwithnormal renalfunction or mild renal insufficiency. Ann Intern Med 138: 460–467, 2003
21. Eisenstein J, Roberts SB, Dallal G, Saltzman E: High-protein weight-lossdiets: are they safe and do they work? A review of the experimental andepidemiologic data. Nutr Rev 60: 189–200, 2002
22. Darling AL, Millward DJ, Torgerson DJ, Hewitt CE, Lanham-New SA:Dietary protein and bone health: A systematic review and meta-analysis.Am J Clin Nutr 90: 1674–1692, 2009
23. Alexy U, Remer T, Manz F, Neu CM, Schoenau E: Long-term proteinintake and dietary potential renal acid load are associated with bonemodeling and remodeling at the proximal radius in healthy children.Am J Clin Nutr 82: 1107–1114, 2005
24. Odermatt A: The Western-style diet: A major risk factor for impairedkidney function and chronic kidney disease. Am J Physiol Renal Physiol
301: F919–F931, 201125. PedriniMT, Levey AS, Lau J, Chalmers TC,Wang PH: The effect of dietary
protein restriction on the progression of diabetic and nondiabetic renaldiseases: a meta-analysis. Ann Intern Med 124: 627–632, 1996
26. National Kidney Foundation: 2012 Update. Am J Kidney Dis 60: 850–886, 2012
27. Remer T, Manz F: Estimation of the renal net acid excretion by adultsconsumingdiets containing variable amounts of protein.AmJClinNutr
59: 1356–1361, 199428. Remer T: Influence of nutrition on acid-base balance—metabolic as-
pects. Eur J Nutr 40: 214–220, 200129. Wesson DE, Nathan T, Rose T, Simoni J, Tran RM: Dietary protein in-
duces endothelin-mediated kidney injury through enhanced intrinsicacid production. Kidney Int 71: 210–217, 2007
J Am Soc Nephrol 25: 2040–2052, 2014 Rhcg in Diet-Induced Acidosis 2051
www.jasn.org BASIC RESEARCH

30. Wesson DE, Simoni J: Increased tissue acid mediates a progressivedecline in the glomerular filtration rate of animals with reduced neph-ron mass. Kidney Int 75: 929–935, 2009
31. Khanna A, Simoni J, Hacker C, Duran MJ, Wesson DE: Increased en-dothelin activity mediates augmented distal nephron acidification in-duced by dietary protein. J Am Soc Nephrol 15: 2266–2275, 2004
32. Khanna A, Simoni J, Wesson DE: Endothelin-induced increased aldo-sterone activity mediates augmented distal nephron acidification as aresult of dietary protein. J Am Soc Nephrol 16: 1929–1935, 2005
33. Biver S, Belge H, Bourgeois S, Van Vooren P, Nowik M, Scohy S,Houillier P, Szpirer J, Szpirer C, Wagner CA, Devuyst O, Marini AM: Arole for Rhesus factor Rhcg in renal ammonium excretion and malefertility. Nature 456: 339–343, 2008
34. Wagner CA, Devuyst O, Belge H, Bourgeois S, Houillier P: The rhesusprotein RhCG: A new perspective in ammonium transport and distalurinary acidification. Kidney Int 79: 154–161, 2011
35. Weiner ID, Hamm LL: Molecular mechanisms of renal ammonia trans-port. Annu Rev Physiol 69: 317–340, 2007
36. Bourgeois S, Bounoure L, Christensen EI, Ramakrishnan SK, Houillier P,Devuyst O,Wagner CA: Haploinsufficiency of the ammonia transporterRhcg predisposes to chronic acidosis: Rhcg is critical for apical andbasolateral ammonia transport in the mouse collecting duct. J BiolChem 288: 5518–5529, 2013
37. Lee HW, Verlander JW, Bishop JM, Igarashi P, HandlogtenME,WeinerID: Collecting duct-specific Rh C glycoprotein deletion alters basal andacidosis-stimulated renal ammonia excretion. Am J Physiol RenalPhysiol 296: F1364–F1375, 2009
38. Lee HW, Verlander JW, Bishop JM, Nelson RD, Handlogten ME,Weiner ID: Effect of intercalated cell-specific Rh C glycoprotein de-letion on basal and metabolic acidosis-stimulated renal ammonia ex-cretion. Am J Physiol Renal Physiol 299: F369–F379, 2010
39. Morris SM Jr: Regulation of enzymes of urea and arginine synthesis.Annu Rev Nutr 12: 81–101, 1992
40. Sicuro A, Mahlbacher K, Hulter HN, Krapf R: Effect of growth hormoneon renal and systemic acid-base homeostasis in humans. Am J Physiol274: F650–F657, 1998
41. Wrong O, Davies HE: The excretion of acid in renal disease. Q J Med28: 259–313, 1959
42. Busque SM,Wagner CA: Potassium restriction, high protein intake, andmetabolic acidosis increase expression of the glutamine transporterSNAT3 (Slc38a3) in mouse kidney. Am J Physiol Renal Physiol 297:F440–F450, 2009
43. Peret J, Chanez M: Influence of diet, cortisol and insulin on the activityof pyruvate carboxylase and phosphoenolpyruvate carboxykinase inthe rat liver. J Nutr 106: 103–110, 1976
44. Seshadri RM, Klein JD, Smith T, Sands JM, Handlogten ME, VerlanderJW, Weiner ID: Changes in subcellular distribution of the ammoniatransporter, Rhcg, in response to chronic metabolic acidosis. Am JPhysiol Renal Physiol 290: F1443–F1452, 2006
45. Seshadri RM, Klein JD, Kozlowski S, Sands JM, Kim YH, Han KH,Handlogten ME, Verlander JW, Weiner ID: Renal expression of theammonia transporters, Rhbg and Rhcg, in response to chronic meta-bolic acidosis. Am J Physiol Renal Physiol 290: F397–F408, 2006
46. Chambrey R, Goossens D, Bourgeois S, Picard N, Bloch-Faure M, Leviel F,Geoffroy V, CambillauM,Colin Y, PaillardM,Houillier P, Cartron JP, EladariD:Genetic ablation of Rhbg in themousedoes not impair renal ammoniumexcretion. Am J Physiol Renal Physiol 289: F1281–F1290, 2005
47. Bishop JM, Lee HW, Handlogten ME, Han KH, Verlander JW, WeinerID: Intercalated cell-specific Rh B glycoprotein deletion diminishesrenal ammonia excretion response to hypokalemia. Am J Physiol RenalPhysiol 304: F422–F431, 2013
48. Karim Z, Attmane-Elakeb A, Sibella V, BicharaM: Acid pH increases thestability of BSC1/NKCC2 mRNA in the medullary thick ascending limb.J Am Soc Nephrol 14: 2229–2236, 2003
49. Szutkowska M, Vernimmen C, Debaix H, Devuyst O, Friedlander G,Karim Z: Zeta-crystallin mediates the acid pH-induced increase of BSC1cotransporter mRNA stability. Kidney Int 76: 730–738, 2009
50. Attmane-Elakeb A, Mount DB, Sibella V, Vernimmen C, Hebert SC,Bichara M: Stimulation by in vivo and in vitro metabolic acidosis ofexpression of rBSC-1, the Na+-K+(NH4
+)-2Cl- cotransporter of the ratmedullary thick ascending limb. J Biol Chem 273: 33681–33691,1998
51. Laghmani K, Richer C, Borensztein P, PaillardM, FroissartM: Expressionof rat thick limb Na/H exchangers in potassium depletion and chronicmetabolic acidosis. Kidney Int 60: 1386–1396, 2001
52. NowikM, Kampik NB,MihailovaM, Eladari D,Wagner CA: Induction ofmetabolic acidosis with ammonium chloride (NH4Cl) in mice and rats—species differences and technical considerations. Cell Physiol Biochem26: 1059–1072, 2010
53. Mouri T, Inoue T, Nonoguchi H, Nakayama Y, Miyazaki H, Matsuzaki T,Saito H, Nakanishi T, Kohda Y, Tomita K: Acute and chronic metabolicacidosis interferes with aquaporin-2 translocation in the rat kidneycollecting ducts. Hypertens Res 32: 358–363, 2009
54. Rodríguez-Iturbe B, Herrera J, Gutkowska J, Parra G, Coello J: Atrialnatriuretic factor increases after a protein meal in man. Clin Sci (Lond)75: 495–498, 1988
55. Yanagisawa H, Wada O: Effects of dietary protein on eicosanoid pro-duction in rat renal tubules. Nephron 78: 179–186, 1998
56. Bailly C: Effect of luminal atrial natriuretic peptide on chloride re-absorption in mouse cortical thick ascending limb: Inhibition by en-dothelin. J Am Soc Nephrol 11: 1791–1797, 2000
57. Klokkers J, Langehanenberg P, Kemper B, Kosmeier S, von Bally G,Riethmüller C, Wunder F, Sindic A, Pavenstädt H, Schlatter E, EdemirB: Atrial natriuretic peptide and nitric oxide signaling antagonizesvasopressin-mediated water permeability in inner medullary collectingduct cells. Am J Physiol Renal Physiol 297: F693–F703, 2009
58. Bushinsky DA, Smith SB, Gavrilov KL, Gavrilov LF, Li J, Levi-Setti R:Chronic acidosis-induced alteration in bone bicarbonate and phos-phate. Am J Physiol Renal Physiol 285: F532–F539, 2003
59. Lemann J Jr, Bushinsky DA, Hamm LL: Bone buffering of acid and basein humans. Am J Physiol Renal Physiol 285: F811–F832, 2003
60. Gafter U, Kraut JA, Lee DB, Silis V, Walling MW, Kurokawa K, HausslerMR, Coburn JW: Effect of metabolic acidosis in intestinal absorption ofcalcium and phosphorus. Am J Physiol 239: G480–G484, 1980
61. Slot C: Plasma creatinine determination. A new and specific Jaffe re-action method. Scand J Clin Lab Invest 17: 381–387, 1965
62. Berthelot M: Violet d’aniline. Rep Chim App 1: 284, 185963. Moret C, Dave MH, Schulz N, Jiang JX, Verrey F, Wagner CA: Regu-
lation of renal amino acid transporters during metabolic acidosis. Am JPhysiol Renal Physiol 292: F555–F566, 2007
64. Burghardt AJ, Kazakia GJ, Laib A, Majumdar S: Quantitative assess-ment of bone tissue mineralization with polychromatic micro-computedtomography. Calcif Tissue Int 83: 129–138, 2008
65. Bouxsein ML, Boyd SK, Christiansen BA, Guldberg RE, Jepsen KJ, MüllerR: Guidelines for assessment of bone microstructure in rodents usingmicro-computed tomography. J Bone Miner Res 25: 1468–1486, 2010
66. Kohler T, StauberM,Donahue LR,Müller R: Automated compartmentalanalysis for high-throughput skeletal phenotyping in femora of geneticmouse models. Bone 41: 659–667, 2007
67. Lukas C, Ruffoni D, Lambers FM, Schulte FA, Kuhn G, KollmannsbergerP, Weinkamer R, Müller R: Mineralization kinetics in murine trabecularbone quantified by time-lapsed in vivo micro-computed tomography.Bone 56: 55–60, 2013
This article contains supplemental material online at http://jasn.asnjournals.org/lookup/suppl/doi:10.1681/ASN.2013050466/-/DCSupplemental.
2052 Journal of the American Society of Nephrology J Am Soc Nephrol 25: 2040–2052, 2014
BASIC RESEARCH www.jasn.org