Embed Size (px)
Citation preview
Eur. J . Biochem. ZOO, 359-367 (1991) 0 FEBS 1991
001429569100545C
The role of the internal hydrogen bond network in first-order protein electron transfer between Sacchuromyces cerevisiae iso-1-cytochrome c and bovine microsomal cytochrome b5 David WHITFORD', Yuan GAO', Gary J . PIELAK', Robert J . P. WILLIAMS', George L. McLENDON' and Fred SHERMAN4
Dcpartments of Biochcmistry ' and Inorganic Chemistry', University of Oxford, England Departments of Chemistry and Biochemistry3 and of Biochemistry4, University of Rochester, Rochester NY, USA
(Received February 15/May 13, 1991) - EJB 91 0236
An internal water molecule (designated WAT166) is found in iso-1-cytochrome c which is part of a redox-state- dependent hydrogen bond network. The position of this water molecule with respect to the polypeptide fold can be altered or even displaced by site-directed mutagenesis leading to structural perturbations and associated changes in redox potential. Using saturation transfer 'H-NMR methods, this study measures changes in the electron transfer reactivity for three variants of yeast iso-1-cytochromes c in which the position of this water molecule is altered. In particular, the reverse electron transfer rate is measured within a complex formed between either wild- type or variant yeast iso-1-cytochromes c and the tryptic fragment of bovine liver microsomal cytochrome b5. For three variants of yeast iso-1-cytochrome c the rate constants measured by saturation transfer are wild-type (Asn52, Eo = 270 mV, k,, = 0.3 s-l) , Am52 + Ala (Eo = 240 mV, k,, = 0.6 s- I), Asn52 + Ile (Eo = 220 mV, k,, = 1 .O s- '). The first-order rates are compared with that of a fourth variant Phe82 + Gly which has been measured previously (Eo = 220 mV, k,, = 0.7 s- I).
An analysis of the variation in the observed cross exchange rate using Marcus theory shows that these changes can be predicted quantitatively by the shift in redox potential that accompanies mutagenesis. So, although the perturbation of the internal water molecule by mutagenesis alters both the structure and redox potential of cytochrome c, surprisingly it does not significantly influence the intrinsic electron transfer reactivity of the protein. Studies of the activation parameters suggests that a variation of temperature changes both AG* and also the prefactor. These data are discussed in terms of models involving dynamic molecular recognition between proteins.
Electron transfers between proteins play an important role in biochemical systems but the factors controlling these pro- cesses remain incompletely understood. Experimental and theoretical studies have shown that the thermodynamic driv- ing force, the redox site separation distance, geometry and solvation, the protein matrix and the reactive surfaces of redox partners must be considered in a quantitative evaluation of these rates [l - 51. In order to characterise these parameters, the association and intracomplex electron transfer between eukaryotic cytochromes c and the tryptic fragment of bovine liver microsomal cytochrome bS have been studied, using the h5/c system as a paradigm of physiological redox partners [6 - 91. This system is very suitable for mechanistic investigations of complex formation and electron transfer because consider- able structural information is available from both crystal- lographic and spectroscopic methods for both proteins [lo - 181. Additionally each protein has been cloned and is the subject of site-directed mutagenesis experiments [I9 -211. One expectation is that site-directed mutagenesis might allow an analysis of the role played by individual amino acids in de- termining protein reactivity. Using this approach, recent stud-
Correspondence to D. Whitford, Dept. of Biochemistry, University of Oxford, South Parks Road, Oxford OX1 3QU, England
Ahhreviations. AC* activation energy for electron transfer; T , oxi- dation state lifetime; T , , longitudinal relaxation lime; 1, reorganisa- lion energy; k,,, first-order electron exchange rate.
ies have attempted to determine, through the use of specific variants, preferred electron paths in the charge transfer reac- tions of cytochrome c [22 - 241.
Bimolecular rates of electron transfer between cytochrome c and cytochrome b5 are very rapid (2 x lo7 M - Is-'), sensi- tive to the ionic strength of the solution and influenced by chemical modification of either redox partner [7, 8, 25, 261. However, it remains easier to interpret unimolecular electron transfer rates especially in modified proteins because there is no need to deconvolute the effect of protein association from the overall rate. There are now both experimental approaches and theoretical studies allowing adequate mechanistic in- terpretations of such rates. Using flash photolysis, the first- order rate of electron transfer between Zn-substituted cytochrome c and cytochrome b5 has been measured at room temperature to be z 4 x 10⁵s-' [27]. A more versatile ap- proach has used pulse radiolysis to reduce Zn-substituted cytochrome c, porphyrin cytochrome c and the native redox centre of cytochrome c in binary complexes with cytochrome bs [28]. These different centres, providing a wide variation in the thermodynamic driving force, influence the rate of first- order electron transfer as predicted by the theory of Marcus
Marcus theory predicts that the activation free energy (AG*) and the reorganisation energy I are related by the equation:
~ 9 1 .
360
AG* = -(AGO + /2)2/4A. (1 1 The activation free energy can be calculated if the reorgan- isation energy, A, is known; AC" is the reaction free energy. The first-order electron transfer rate is then described by the following Arrhenius equation
k,, = Aexp( - AG*/RT) (2) where A is a frequency factor including the donor - acceptor separation distance, r [AK exp ( - p r ) ] . The reorganisation energy may be viewed as reflecting the extent of changes in the atomic positions of nuclei which are linked to electron transfer. Thus a large value for 1" indicates that large motions, possibly including conformational changes, accompany elec- tron transfer. Analysis of the rate of electron transfer between cytochromes c and b5 using pulse radiolysis has suggested a comparatively large reorganisation energy, 2, of z 70 kJ mol-' (0.8 eV) [28].
For cytochrome b5 it is clear from both crystallographic and NMR studies that the transition from reduced to oxidised states is accompanied by negligible changes in conformation [13, 171. Similar studies for tuna and yeast cytochromes c indicate that the structural differences between the oxidised and reduced proteins are greater than those for cytochrome b5 but they have been suggested to be small for the main- chain and aromatic residues [lo, 11, 14, 15, 30-321. These observations have led to theoretical calculations of the reorganisation energy of cytochrome c yielding a much smaller value of approximately 30 kJ mol- (0.3 eV) for 1- [33]. Conse- quently, the underlying reasons for the differences between theoretical and experimental estimates of the reorganisation energy in the cytochrome b5/c complex remain unclear. Two explanations of the 'discrepancy' between theoretical and ex- perimentally determined values of 1 are, firstly, that the energy associated with redox-state-dependent conformations has been seriously under-estimated in the case of cytochrome c and, secondly, that redox-linked conformational changes oc- cur within the binary complex and therefore cannot be anti- cipated by examining only the isolated proteins.
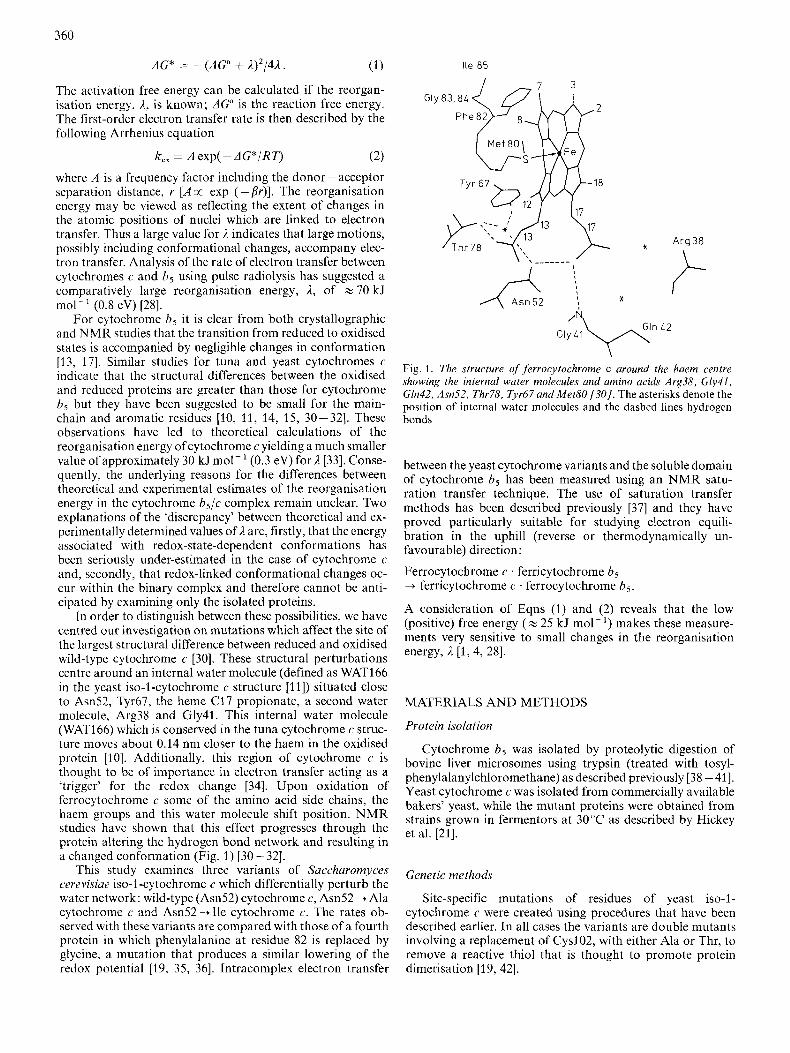
In order to distinguish between these possibilities, we have centred our investigation on mutations which affect the site of the largest structural difference between reduced and oxidised wild-type cytochrome c [30]. These structural perturbations centre around an internal water molecule (defined as WAT166 in the yeast iso-1-cytochrome c structure [ll]) situated close to Asn52, Tyr67, the heme C17 propionate, a second water molecule, Arg38 and Gly41. This internal water molecule (WAT166) which is conserved in the tuna cytochrome c struc- ture moves about 0.14 nm closer to the haem in the oxidised protein [lo]. Additionally, this region of cytochrome c is thought to be of importance in electron transfer acting as a 'trigger' for the redox change [34]. Upon oxidation of ferrocytochrome c some of the amino acid side chains, the haem groups and this water molecule shift position. NMR studies have shown that this effect progresses through the protein altering the hydrogen bond network and resulting in a changed conformation (Fig. 1) [30-321.
This study examines three variants of Saccharomyces cerevisiue iso-I -cytochrome c which differentially perturb the water network: wild-type (Asn52) cytochrome c, Am52 4 Ala cytochrome c and Asn52+Ile cytochrome c. The rates ob- served with these variants are compared with those of a fourth protein in which phenylalanine at residue 82 is replaced by glycine, a mutation that produces a similar lowering of the redox potential [19, 35, 361. Intracomplex electron transfer
Ile 8 5
I - 7 3
/ \ I u
* Arg 3 8
L Gln 1 2
Gly 11
Fig. 1. The structure of ferrorytochrome c around the haem centre showing the internal water molecules and amino acids Arg38, GIy41, Gln42, Asn52, Thr78, Tyr67 and Met80 (301. The asterisks denote the position of internal water molecules and the dashed lines hydrogen bonds
between the yeast cytochrome variants and the soluble domain of cytochrome b5 has been measured using an NMR satu- ration transfer technique. The use of saturation transfer methods has been described previously [37] and they have proved particularly suitable for studying electron equili- bration in the uphill (reverse or thermodynamically un- favourable) direction:
Ferrocytochrome c . ferricytochrome b5 + ferricytochrome c . ferrocytochrome h5
A consideration of Eqns (1) and (2) reveals that the low (positive) free energy ( z 25 kJ mol-') makes these measure- ments very sensitive to small changes in the reorganisation energy, A [ l , 4, 281.
MATERIALS AND METHODS
Protein isolation
Cytochrome b5 was isolated by proteolytic digestion of bovine liver microsomes using trypsin (treated with tosyl- phenylalanylchloromethane) as described previously [38 - 411. Yeast cytochrome c was isolated from commercially available bakers' yeast, while the mutant proteins were obtained from strains grown in fermentors at 30°C as described by Hickey et al. [21].
Genetic methods
Site-specific mutations of residues of yeast iso-l- cytochroine c were created using procedures that have been described earlier. In all cases the variants are double mutants involving a replacement of CyslO2, with either Ala or Thr, to remove a reactive thiol that is thought to promote protein dimerisation [19, 421.
361
N M R spectroscopy
All 'H-NMR spectra were recorded on a 14.1-T (600- MHz) Bruker AM series spectrometer equipped with an As- pect 3000 computer. Typically 256 - 1024 transients were stored for each experiment in 16 K memory. Sweep widths of 50 kHz were employed with the spectrum centred around the water resonance.
Saturation transfer experiments were performed on binary mixtures of cytochrome c and cytochrome b5, thereby eliminating the potential formation of ternary complexes. In a 1 : 1 mixture of ferrocytochrome c and ferricytochrome b5 saturation transfer experiments were carried out by irradiating with a saturating selective pulse at the frequency of the I-:-
methyl of Met80 in the oxidised protein (6 = - 21.5 ppm for the Asn52+Ile variant at 300 K). The frequency for ir- radiation on this resonance was selected by using a fully oxi- dised complex under identical solution conditions. Saturation transfer was observed by the decrease in intensity for the corresponding resonance of the reduced protein (6 = - 3.25 ppm). In all cases, 'off resonance spectra were recorded for each experiment. The oxidation state lifetime, z, was esti- mated for ferrocytochrome c according to the standard equa- tion
(3)
where I and I, are the intensities of the Met80 methyl reson- ance of ferrocytochrome c in spectra recorded with on and off resonance saturation respectively, T is the oxidation state lifetime of cytochrome c and T1 is the longitudinal relaxation time for the same resonance. From a determination of the oxidation state lifetime for ferrocytochrome c in the presence of ferricytochrome b5, the first-order electron transfer rate was calculated according to the equation
k,, = ljz. (4)
T, measurements were performed on the fully reduced cytochrome c/bs complex using the standard inversion recov- ery pulse sequence (D1-~-D2-x/2) where D1 was adjusted to be z 5 x T I and D2 was systematically varied between 10- 0.01 s. T I values were calculated from graphical analysis of plots of resonance intensity versus delay time. In view of the dependence of the longitudinal relaxation time on tempera- ture, studies determining the effect of temperature on the cross exchange rate between cytochrome c and b5 necessitated the separate determination of the T I at each temperature.
In preparation for NMR measurements, ferricytochromes c and ferricytochrome b5 samples were exchanged into 10 mM phosphate/NaOD pH* 7.0 (pH* is the pH from the direct meter reading and is uncorrected for the deuterium isotope effect) using Centricon micro-concentrator cells (Amicon Ltd, YMlO membrane). Reduction of ferricytochrome c by adding one or two crystals of sodium dithionite was followed by repeated washing in 10mM phosphateiNaOD pH* 7.0 to remove excess reductant. NMR samples of ferrocytochrome c/ferricytochrome b5 were prepared at equimolar ratios after determining the protein concentrations spectrophoto- metrically. The concentration of cytochrome h5 was measured at 412.5 nm assuming a molar absorption coefficient of 117 mM-' cm-' for the oxidised protein whilst the concen- tration of cytochrome c was determined at 550nm in the fully reduced state using a molar absorption coefficient of 29 mM-' cm-l [43]. The total protein concentration used in each experiment was adjusted to be between 0.25 - 4 mM. Samples, routinely purged with NZ, did not alter in the level
75
70
65
X 60 I L
- I .z 55 z
.i 50 a, C
L5
LO
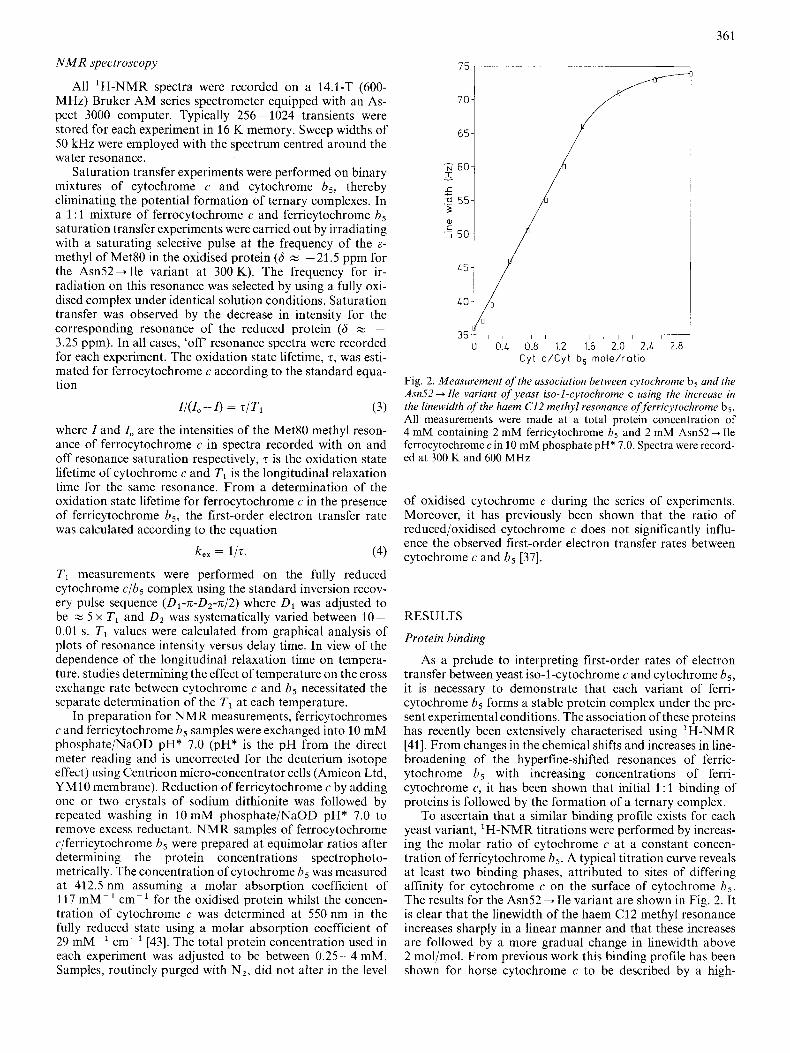
Fig. 2. Measurement of the association between cytochrome b5 and the Asn52 + Ile variant of yeast iso-1-cytochrome c using the increase in the linewidth of the haem C12 methyl resonance of ferricytochrome b5. All measurements were made at a total protein concentration of 4 mM containing 2 mM ferricytochrome b5 and 2 mM Am52 + Ile ferrocytochrome c in 10 mM phosphate pH* 7.0. Spectra were record- ed at 300 K and 600 MHz
of oxidised cytochrome c during the series of experiments. Moreover, it has previously been shown that the ratio of reducedioxidised cytochrome c does not significantly influ- ence the observed first-order electron transfer rates between cytochrome c and b5 [37].
RESULTS
Protein binding
As a prelude to interpreting first-order rates of electron transfer between yeast iso-1-cytochrome c and cytochrome b5, it is necessary to demonstrate that each variant of ferri- cytochrome bs forms a stable protein complex under the pre- sent experimental conditions. The association of these proteins has recently been extensively characterised using 'H-NMR [41]. From changes in the chemical shifts and increases in line- broadening of the hyperfine-shifted resonances of ferric- ytochrome b5 with increasing concentrations of ferri- cytochrome c, it has been shown that initial 1 : 1 binding of proteins is followed by the formation of a ternary complex.
To ascertain that a similar binding profile exists for each yeast variant, 'H-NMR titrations were performed by increas- ing the molar ratio of cytochrome c at a constant concen- tration of ferricytochrome bs. A typical titration curve reveals at least two binding phases, attributed to sites of differing affinity for cytochrome c on the surface of cytochrome b5. The results for the Asn52 + Ile variant are shown in Fig. 2. It is clear that the linewidth of the haem C12 methyl resonance increases sharply in a linear manner and that these increases are followed by a more gradual change in linewidth above 2 mol/mol. From previous work this binding profile has been shown for horse cytochrome c to be described by a high-
362
-0.08
0
-0.01
-0.02
& -0.03
= -0.01
g -0.05 E 2 -0.06
-0.07
I
C l - I
c Ln - ._
0
I , , , I , I 1 I , , , , , 1 , , I I
A
I
5 Cl - 0.16- c L ._ c Ln 0 0.12-
5 u ._
6 0.081
0 . 1 0 7 - 1
0 0.2 0.1 0.6 0.8 1.0 1.2 1.4 1.6 1.8 2.0 Cyt c/Cyt b, mole rat io
o i , , , , , , , I , I -- 0 0.2 0.4 0.6 0.8 1.0 1.2 1.1 1.6 1.8 2.0
Cyt c/Cyt b, mole ra t io
0 . 0 4 L 0 0 0.2 0.4 0.6 0.8 1.0 1.2 1.1 1.6 1.8
Cyt c/Cyt b, mole rat io 0
- 0.05- 5 ._ z 0.01- Cl - L Ln - 2 0.03- ._ 5 6 0.02-
0.01 -
- Cyt c/Cyt b, mole rat io
0
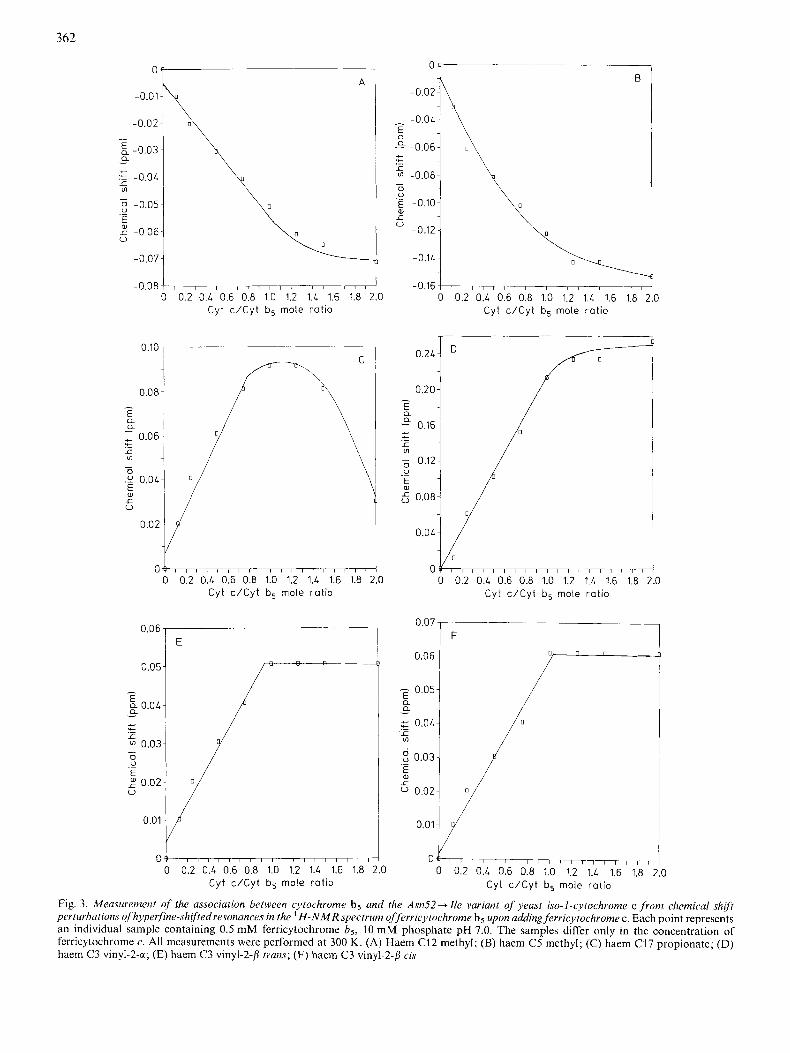
Fig. 3. Measurement of the association between cytochrome b5 and the Asn52-tIle variant of yeast iso-1-cytochrome c from chemical shift perturbations ojhyperfine-shiftedresonances in the H - N M R spectrum offerricytochrome b5 upon adding ferricytochrome c . Each point represents an individual sample containing 0.5 mM ferricytochrome bg, 10 mM phosphate pH 7.0. The samples differ only in the concentration of ferricytochrome c. All measurements were performed at 300 K. (A) Haem C12 methyl; (B) haem C5 methyl; (C) haem C17 propionate; (D) haem C3 vinyl-2-a; (E) haem C3 vinyl-2-fl trans; (F) haem C3 vinyl-2-P cis
363
A
I ' ' ' , I ~ ~ I I ( 1 1 . 1 , . . . . , . . . 1 ,
Chemical sh i f t
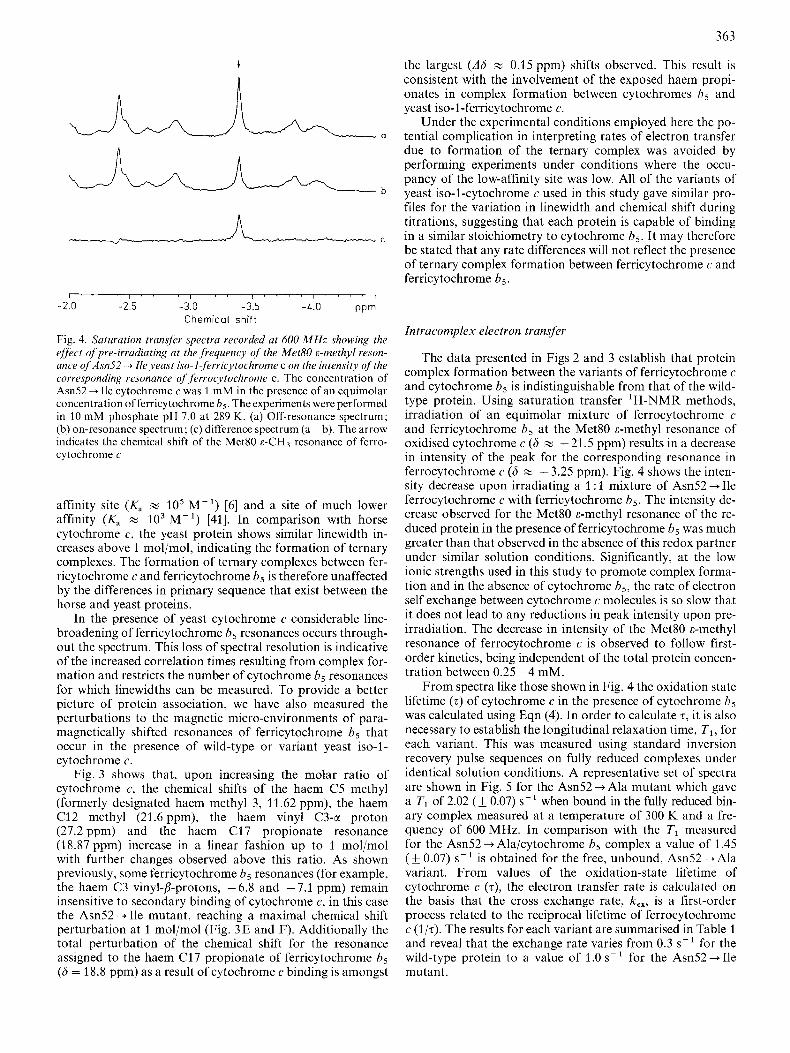
Fig. 4. Saturation transfer spectra recorded at 600 MHz showing the effect of pre-irradiating at the frequency qf the Met80 E-methyl reson- ance qf Asn52 4 Ile yeast iso-1-ferricytochrome c on the intensity of the covresponding resonance of ferrocytochrome c. The concentration of Am52 4 Ile cytochrome c was 1 mM in the presence of an equimolar concentration olferricytochrome h5. The experiments were performed in 10 mM phosphate pH 7.0 at 289 K. (a) Off-resonance spectrum; (b) on-resonance spectrum; (c) difference spectrum (a- b). The arrow indicates the chemical shift of the Met80 E-CH, resonance of ferro- cytochrome c
-2.0 -2.5 -3.0 -3.5 -1.0 PPm
affinity site (K , z lo5 M- ' ) [6] and a site of much lower affinity (K, M lo3 M-') [41]. In comparison with horse cytochrome c, the yeast protein shows similar linewidth in- creases above 1 mol/mol, indicating the formation of ternary complexes. The formation of ternary complexes between fer- ricytochrome c and ferricytochrome b5 is therefore unaffected by the differences in primary sequence that exist between the horse and yeast proteins.
In the presence of yeast cytochrome c considerable line- broadening of ferricytochrome b5 resonances occurs through- out the spectrum. This loss of spectral resolution is indicative of the increased correlation times resulting from complex for- mation and restricts the number of cytochrome b5 resonances for which linewidths can be measured. To provide a better picture of protein association, we have also measured the perturbations to the magnetic micro-environments of para- magnetically shifted resonances of ferricytochrome b5 that occur in the presence of wild-type or variant yeast iso-l- cytochrome c.
Fig. 3 shows that, upon increasing the molar ratio of cytochrome c, the chemical shifts of the haem C5 methyl (formerly designated haem methyl 3, 11.62 pprn), the haem C12 methyl (21.6 ppm), the haem vinyl C3-a proton (27.2 ppm) and the haem C17 propionate resonance (18.87 ppm) increase in a linear fashion up to 1 mol/mol with further changes observed above this ratio. As shown previously, some ferricytochrome b5 resonances (for example, the haem C3 vinyl-b-protons, -6.8 and -7.1 ppm) remain insensitive to secondary binding of cytochrome c, in this case the Asn52 -+ Ile mutant, reaching a maximal chemical shift perturbation at 1 mol/mol (Fig. 3E and F). Additionally the total perturbation of the chemical shift for the resonance assigned to the haem C17 propionate of ferricytochrome h5 (6 = 18.8 ppm) as a result of cytochrome c binding is amongst
the largest ( A 6 M 0.15 ppm) shifts observed. This result is consistent with the involvement of the exposed haem propi- onates in complex formation between cytochromes h5 and yeast iso-I-ferricytochrome c.
Under the experimental conditions employed here the po- tential complication in interpreting rates of electron transfer due to formation of the ternary complex was avoided by performing experiments under conditions where the occu- pancy of the low-affinity site was low. All of the variants of yeast iso-I-cytochrome c used in this study gave similar pro- files for the variation in linewidth and chemical shift during titrations, suggesting that each protein is capable of binding in a similar stoichiometry to cytochrome b5. It may therefore be stated that any rate differences will not reflect the presence of ternary complex formation between ferricytochrome c and ferricytochrome b5.
Intracomplex electron transfer
The data presented in Figs 2 and 3 establish that protein complex formation between the variants of ferricytochrome c and cytochrome b5 is indistinguishable from that of the wild- type protein. Using saturation transfer 'H-NMR methods, irradiation of an equimolar mixture of ferrocytochrome c and ferricytochrome 6 , at the Met80 &-methyl resonance of oxidised cytochrome c (6 w -21.5 ppm) results in a decrease in intensity of the peak for the corresponding resonance in ferrocytochrome c (6 z - 3.25 ppm). Fig. 4 shows the inten- sity decrease upon irradiating a 1 : 1 mixture of Am52 + Ile ferrocytochrome c with ferricytochrome h5. The intensity de- crease observed for the Met80 &-methyl resonance of the re- duced protein in the presence of ferricytochrome h, was much greater than that observed in the absence of this redox partner under similar solution conditions. Significantly, at the low ionic strengths used in this study to promote complex forma- tion and in the absence of cytochrome b5, the rate of electron self exchange between cytochrome c molecules is so slow that it does not lead to any reductions in peak intensity upon pre- irradiation. The decrease in intensity of the Met80 c-methyl resonance of ferrocytochrome c is observed to follow first- order kinetics, being independent of the total protein concen- tration between 0.25 - 4 mM.
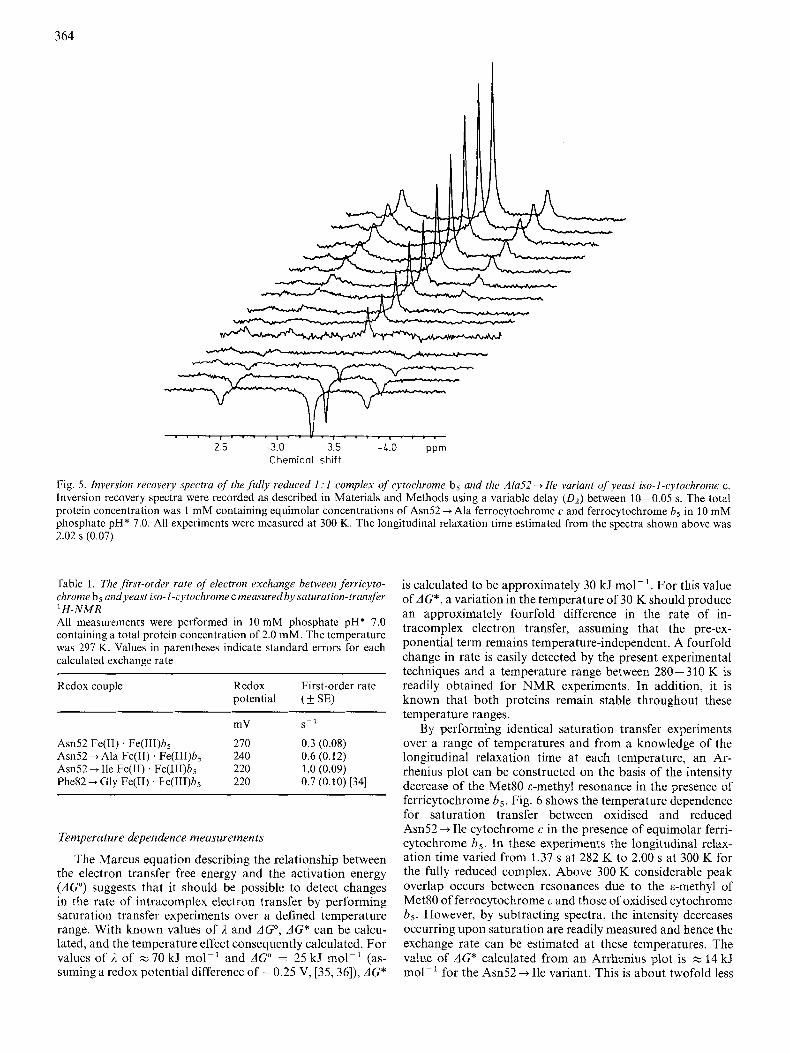
From spectra like those shown in Fig. 4 the oxidation state lifetime (t) of cytochrome c in the presence of cytochrome b5 was calculated using Eqn (4). In order to calculate z, it is also necessary to establish the longitudinal relaxation time, TI, for each variant. This was measured using standard inversion recovery pulse sequences on fully reduced complexes under identical solution conditions. A representative set of spectra are shown in Fig. 5 for the Asn52 + Ala mutant which gave a Tl of 2.02 (k 0.07) s- ' when bound in the fully reduced bin- ary complex measured at a temperature of 300 K and a fre- quency of 600 MHz. In comparison with the T I measured for the Am52 + Ala/cytochrome b5 complex a value of 1.45 (& 0.07) s- ' is obtained for the free, unbound, Asn52 --f Ala variant. From values of the oxidation-state lifetime of cytochrome c (t), the electron transfer rate is calculated on the basis that the cross exchange rate, k,,, is a first-order process related to the reciprocal lifetime of ferrocytochrome c (I/T). The results for each variant are summarised in Table 1 and reveal that the exchange rate varies from 0.3 s- ' for the wild-type protein to a value of 1.0 s - ' for the Asn52 +Ile mutant.
364
I ~ . . ~ , ~ ~ . ~ I ' . ' . l ' . . ~
-2.5 -3.0 -3.5 -4.0 ppm Chemical shift
Fig. 5. Inversion recovery spectra of the fully reduced 1 : 1 complex of cytochrome b5 and the A h 5 2 -+ Ile variant of yeast iso-I-cytochrome c. Inversion recovery spectra were recorded as described in Materials and Methods using a variable delay (D2) between 20-0.05 s. The total protein concentration was 1 mM containing equimolar concentrations of Am52 -+ Ala ferrocytochrome c and ferrocytochrome b5 in 10 mM phosphate pH* 7.0. All experiments were measured at 300 K. The longitudinal relaxation time estimated from the spectra shown above was 2.02 s (0.07)
Table 1 . The first-order rate of electron exchange between ferricyto- chrome b5 and yeast iso-1-cytochrome c measuredby saturation-transjier 'H-NMR All measurements were performed in 10 mM phosphate pH* 7.0 containing a total protein concentration of 2.0 mM. The temperature was 297 K. Values in parentheses indicate standard errors for each calculated exchange rate
Redox couple Redox First-order rate potential (f SE)
mV S - '
Asn52 Fe(I1) . Fe(III)b, 270 0.3 (0.08) Am52 + Ala Fe(I1) Fe(III)h5 240 0.6 (0.12) Am52 + Ile Fe(I1) Fe(III)b5 220 1.0 (0.09) Phe82 + Gly Fe(T1) . Fe(III)b5 220 0.7 (0.10) [34]
Temperature dependence measurements
The Marcus equation describing the relationship between the electron transfer free energy and the activation energy (AGO) suggests that it should be possible to detect changes in the rate of intracomplex electron transfer by performing saturation transfer experiments over a defined temperature range. With known values of 2 and AGO, AG* can be calcu- bated, and the temperature effect consequently calculated. For values of i, of z 70 kJ mol-' and AG" = 25 kJ rno1-I (as- suming a redox potential difference of -0.25 V, [35, 36]), AC*
is calculated to be approximately 30 kJ mol-'. For this value of AC*, a variation in the temperature of 30 K should produce an approximately fourfold difference in the rate of in- tracomplex electron transfer, assuming that the pre-ex- ponential term remains temperature-independent. A fourfold change in rate is easily detected by the present experimental techniques and a temperature range between 280-310 K is readily obtained for NMR experiments. In addition, it is known that both proteins remain stable throughout these temperature ranges.
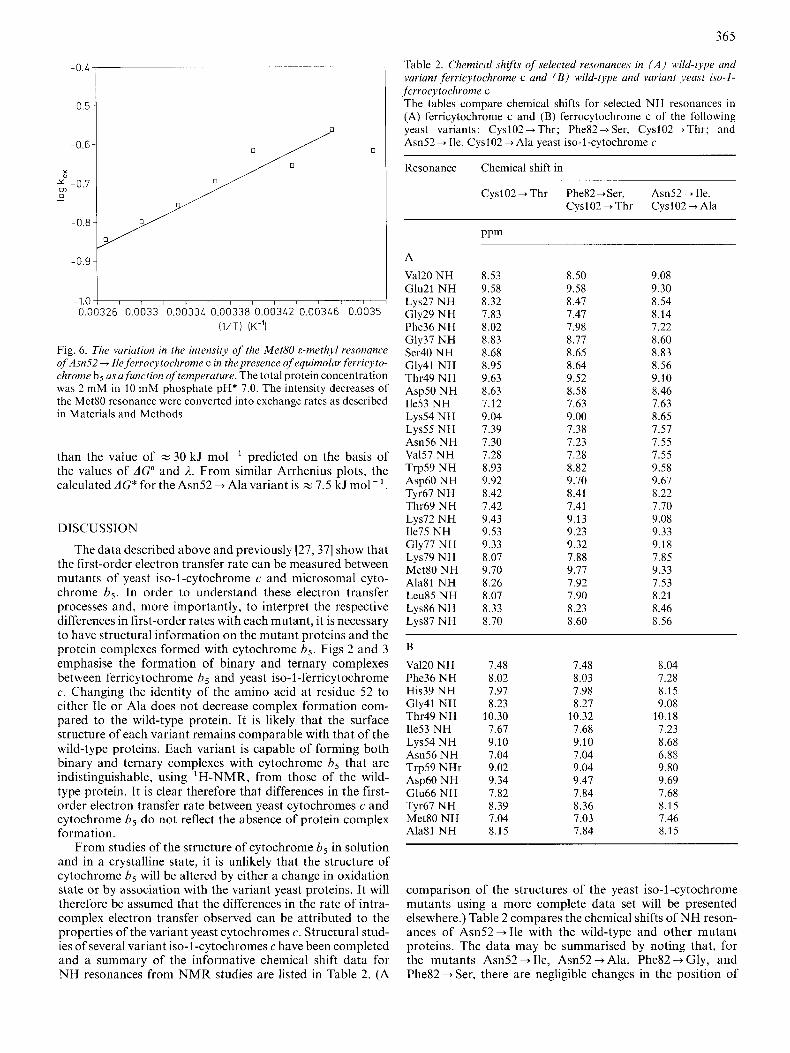
By performing identical saturation transfer experiments over a range of temperatures and from a knowledge of the longitudinal relaxation time at each temperature, an Ar- rhenius plot can be constructed on the basis of the intensity decrease of the Met80 &-methyl resonance in the presence of ferricytochrome b,. Fig. 6 shows the temperature dependence for saturation transfer between oxidised and reduced Am52 + Ile cytochrome c in the presence of equimolar ferri- cytochrome 6,. In these experiments the longitudinal relax- ation time varied from 1.37 s at 282 K to 2.00 s at 300 K for the fully reduced complex. Above 300 K considerable peak overlap occurs between resonances due to the ,+methyl of Met80 of ferrocytochrome c and those of oxidised cytochrome b,. However, by subtracting spectra, the intensity decreases occurring upon saturation are readily measured and hence the exchange rate can be estimated at these temperatures. The value of AC* calculated from an Arrhenius plot is z 14 kJ mo1-I for the Am52 + Ile variant. This is about twofold less
365
-0.4
-0.5
-0.6
x a
-0.7 Is, 0 -
-0.8
-0.9
-1.0 0.c
, / , , / , , / I I 1 ~ 326 0.0033 0.00334 0.00338 0.00342 0.00346 0.0035
( l / T ) (K-')
Fig. 6. The vuriution in the intensity of the Met80 8-methyl resonance of Asn52 + Ile ferrocytochrome c in the presence of equimolur,ferricyto- chrome b5 us u,function of temperature. The total protein concentration was 2 mM in 10 mM phosphate pH* 7.0. The intensity decreases of the Met80 resonance were converted into exchange rates as described in Materials and Methods
than the value of z 30 kJ mol-' predicted on the basis of the values of AGO and 2. From similar Arrhenius plots, the calculated AC* for the Am52 + Alavariant is z 7.5 kJ mol- '.
DISCUSSION
The data described above and previously [27,37] show that the first-order electron transfer rate can be measured between mutants of yeast iso-1-cytochrome c and microsomal cyto- chrome h5. In order to understand these electron transfer processes and, more importantly, to interpret the respective differences in first-order rates with each mutant, it is necessary to have structural information on the mutant proteins and the protein complexes formed with cytochrome b5. Figs 2 and 3 emphasise the formation of binary and ternary complexes between ferricytochrome b5 and yeast iso-1-ferricytochrome c . Changing the identity of the amino acid at residue 52 to either Ile or Ala does not decrease complex formation com- pared to the wild-type protein. It is likely that the surface structure of each variant remains comparable with that of the wild-type proteins. Each variant is capable of forming both binary and ternary complexes with cytochrome b5 that are indistinguishable, using 'H-NMR, from those of the wild- type protein. It is clear therefore that differences in the first- order electron transfer rate between yeast cytochromes c and cytochrome b5 do not reflect the absence of protein complex formation.
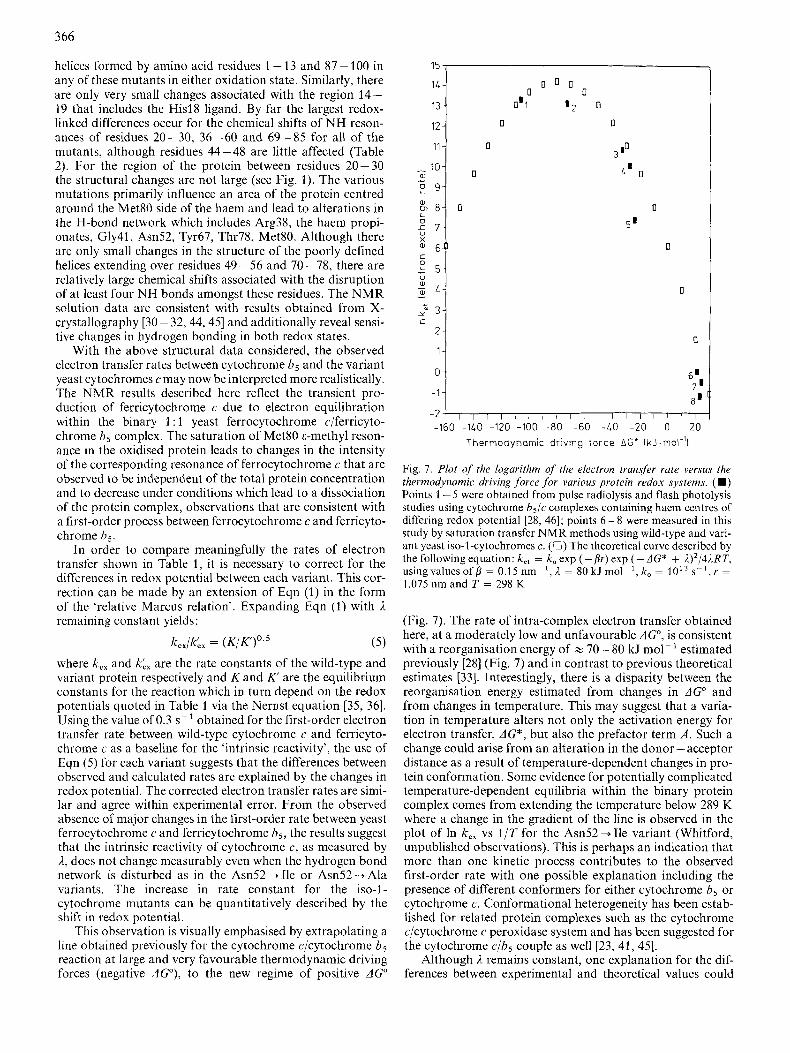
From studies of the structure of cytochrome b5 in solution and in a crystalline state, it is unlikely that the structure of cytochrome b5 will be altered by either a change in oxidation state or by association with the variant yeast proteins. It will therefore be assumed that the differences in the rate of intra- complex electron transfer observed can be attributed to the properties of the variant yeast cytochromes c. Structural stud- ies of several variant iso-1 -cytochromes c have been completed and a summary of the informative chemical shift data for NH resonances from NMR studies are listed in Table 2. (A
Table 2. Chemical shifts of selected resonances in ( A ) wild-type and variant ferricytochrome c and ( B ) wild-type and variant yeast iso-l-
,ferrocytochrome c The tables compare chemical shifts for selected NH resonances in (A) ferricytochrome c and (B) ferrocytochrome c of the following yeast variants: CyslO2 +Thr; Phe82 -+ Ser, Cys102 +Thr; and Asn52 + Ile, CyslO2 + A h yeast iso-1-cytochrome c
Resonance Chemical shift in
CyslO2 + Thr Phe82+Ser, Asn52 Ile, CyslO2 + Thr CyslO2 + Ala
A Val20 N H Glu21 NH Lys27 NH Gly29 NH Phe36 NH Gly37 NH Ser40 NH Gly41 NH Thr49 NH Asp50 NH Ile53 NH Lys54 NH Lys55 N H Am56 NH Val57 N H Trp59 NH Asp60 NH Tyr67 NH Thr69 NH Lys72 NH Ile75 NH Gly77 NH Lys79 NH Met80 NH AlaXl NH Leu85 NH Lys86 NH Lys87 NH
PPm ~
8.53 9.58 8.32 7.83 8.02 8.83 8.68 8.95 9.63 8.63 7.12 9.04 7.39 7.30 7.28 8.93 9.92 8.42 7.42 9.43 9.53 9.33 8.07 9.70 8.26 8.07 8.33 8.70
~
8.50 9.58 8.47 7.47 7.98 8.77 8.65 8.64 9.52 8.58 7.63 9.00 7.38 7.23 7.28 8.82 9.70 8.41 7.41 9.13 9.23 9.32 7.88 9.77 7.92 7.90 8.23 8.60
9.08 9.30 8.54 8.14 7.22 8.60 8.83 8.56 9.10 8.46 7.63 8.65 7.57 7.55 7.55 9.58 9.67 8.22 7.70 9.08 9.33 9.18 7.85 9.33 7.53 8.21 8.46 8.56
B
Val20 NH Phe36 NH His39 N H Gly41 NH Thr49 NH Ile53 NH Lys54 NH As1156 NH Trp59 NHr Asp60 NH Glu66 NH Tyr67 NH Met80 N H Ala81 N H
7.48 8.02 7.97 8.23
10.30 7.67 9.10 7.04 9.02 9.34 7.82 8.39 7.04 8.15
7.48 8.03 7.98 8.27
10.32 7.68 9.10 7.04 9.04 9.47 7.84 8.36 7.03 7.84
8.04 7.28 8.15 9.08
10.18 7.23 8.68 6.88 9.80 9.69 7.68 8.15 7.46 8.15
comparison of the structures of the yeast iso-1-cytochrome mutants using a more complete data set will be presented elsewhere.) Table 2 compares the chemical shifts of NH reson- ances of Asn52+Ile with the wild-type and other mutant proteins. The data may be summarised by noting that, for the mutants Am52 --f Ile, Asn52 + Ala, Phe82 -+ Gly, and Phe82 + Ser, there are negligible changes in the position of
366
V : 1- I - 1" 3 - C -
2-
1 -
0-
-1 - -2
helices formed by amino acid residues 1 - 13 and 87 - 100 in any of these mutants in either oxidation state. Similarly, there are only very small changes associated with the region 14- 19 that includes the His18 ligand. By far the largest redox- linked differences occur for the chemical shifts of NH reson- ances of residues 20-30, 36-60 and 69-85 for all of the mutants, although residues 44 -48 are little affected (Table 2). For the region of the protein between residues 20-30 the structural changes are not large (see Fig. 1). The various mutations primarily influence an area of the protein centred around the Met80 side of the haem and lead to alterations in the H-bond network which includes Arg38, the haem propi- onates, Gly41, Asn52, Tyr67, Thr78, Met8O. Although there are only small changes in the structure of the poorly defined helices extending over residues 49 - 56 and 70 - 78, there are relatively large chemical shifts associated with the disruption of at least four NH bonds amongst these residues. The NMR solution data are consistent with results obtained from X- crystallography [30 - 32,44,45] and additionally reveal sensi- tive changes in hydrogen bonding in both redox states.
With the above structural data considered, the observed electron transfer rates between cytochrome h5 and the variant yeast cytochroines c may now be interpreted more realistically. The NMR results described here reflect the transient pro- duction of ferricytochrome c due to electron equilibration within the binary 1 : 1 yeast ferrocytochrome c/ferricyto- chrome h5 complex. The saturation of Met80 &-methyl reson- ance in the oxidised protein leads to changes in the intensity of the corresponding resonance of ferrocytochrome c that are observed to be independent of the total protein concentration and to decrease under conditions which lead to a dissociation of the protein complex, observations that are consistent with a first-order process between ferrocytochrome c and ferricyto- chrome h5.
In order to compare meaningfully the rates of electron transfer shown in Table 1, it is necessary to correct for the differences in redox potential between each variant. This cor- rection can be made by an extension of Eqn (1) in the form of the 'relative Marcus relation'. Expanding Eqn (1) with 1 remaining constant yields :
k,,/kcx = (K/K')o,5 (5) where k,, and k:, are the rate constants of the wild-type and variant protein respectively and K and K' are the equilibrium constants for the reaction which in turn depend on the redox potentials quoted in Table 1 via the Nernst equation [35, 361. Using the value of 0.3 s p l obtained for the first-order electron transfer rate between wild-type cytochrome c and ferricyto- chrome c as a baseline for the 'intrinsic reactivity', the use of Eqn (5) for each variant suggests that the differences between observed and calculated rates are explained by the changes in redox potential. The corrected electron transfer rates are simi- lar and agree within experimental error. From the observed absence of major changes in the first-order rate between yeast ferrocytochrome c and ferricytochrome b5, the results suggest that the intrinsic reactivity of cytochrome c, as measured by l , does not change measurably even when the hydrogen bond network is disturbed as in the Am52 + [le or Asn52 -+ Ala variants. The increase in rate constant for the iso-l- cytochrome mutants can be quantitatively described by the shift in redox potential.
This observation is visually emphasised by extrapolating a line obtained previously for the cytochrome c/cytochrome b5 reaction at large and very favourable thermodynamic driving forces (negative AGO), to the new regime of positive AGO
0
0
6' 7'
8'
I , ] , 1 l l I I l I I 1 I I I I l
15 , l L I 13
0
I 2 l 11 0
:I a 6
k 5
0 0 0 0
0
0'1 ' 2 0
0
3 to
I' 0
0
5 1
0
Fig. 7. Plot of the logurithm of the electron transfer rate versus the thermodynamic driving force for various protein redox systems. (M) Points 1 - 5 were obtained from pulse radiolysis and flash photolysis studies using cytochrome b5/c complexes containing haem centres of differing redox potential [28, 461; points 6-8 were measured in this study by saturation transfer NMR methods using wild-type and vari- ant yeast iso-I-cytochromes c. (0) The theoretical curve described by the following equation: k,, = k , exp ( - B Y ) exp (-dG* + 1.)2/4iRT, using valucs of p = 0.1 5 nm- ', I = 80 k J mol-', k , = loi3 s - ' , Y = 1.075 nm and T = 298 K
(Fig. 7). The rate of intra-complex electron transfer obtained here, at a moderately low and unfavourable AGO, is consistent with a reorganisation energy of z 70 - 80 kJ in01 estimated previously [28] (Fig. 7) and in contrast to previous theoretical estimates [33]. Interestingly, there is a disparity between the reorganisation energy estimated from changes in AGO and from changes in temperature. This may suggest that a varia- tion in temperature alters not only the activation energy for electron transfer, AG*, but also the prefactor term A . Such a change could arise from an alteration in the donor - acceptor distance as a result of temperature-dependent changes in pro- tein conformation. Some evidence for potentially complicated temperature-dependent equilibria within the binary protein complex comes from extending the temperature below 289 K where a change in the gradient of the line is observed in the plot of In k,, vs 1 /T for the Asn52-+Ile variant (Whitford, unpublished observations). This is perhaps an indication that more than one kinetic process contributes to the observed first-order rate with one possible explanation including the presence of different conformers for either cytochrome b5 or cytochrome c. Conformational heterogeneity has been estab- lished for related protein complexes such as the cytochrome clcytochrome c peroxidase system and has been suggested for the cytochrome c/b5 couple as well [23,41, 451.
Although /1 remains constant, one explanation for the dif- ferences between experimental and theoretical values could
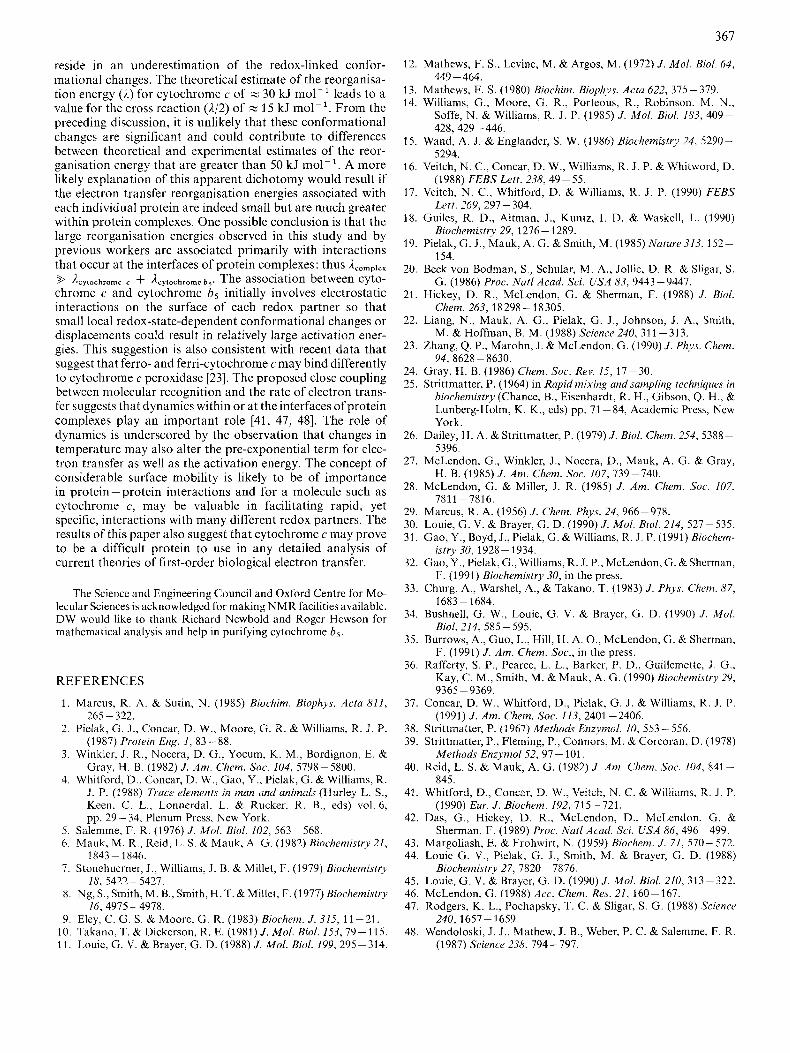
367
reside in an underestimation of the redox-linked confor- mational changes. The theoretical estimate of the reorganisa- tion energy (1) for cytochrome c of z 30 kJ mol- leads to a value for the cross reaction (42) of = 15 kJ mol- '. From the preceding discussion, it is unlikely that these conformational changes are significant and could contribute to differences between theoretical and experimental estimates of the reor- ganisation energy that are greater than 50 kJ mol-'. A more likely explanation of this apparent dichotomy would result if the electron transfer reorganisation energies associated with each individual protein are indeed small but are much greater within protein complexes. One possible conclusion is that the large reorganisation energies observed in this study and by previous workers are associated primarily with interactions that occur at the interfaces of protein complexes: thus ,?complex & kytochro",c + &ytochrome b 5 . The association between cyto- chrome c and cytochrome h5 initially involves electrostatic interactions on the surface of each redox partner so that small local redox-state-dependent conformational changes or displacements could result in relatively large activation ener- gies. This suggestion is also consistent with recent data that suggest that ferro- and ferri-cytochrome c may bind differently to cytochrome c peroxidase [23]. The proposed close coupling between molecular recognition and the rate of electron trans- fer suggests that dynamics within or at the interfaces ofprotein complexes play an important role [41, 47, 481. The role of dynamics is underscored by the observation that changes in temperature may also alter the pre-exponential term for elec- tron transfer as well as the activation energy. The concept of considerable surface mobility is likely to be of importance in protein ~ protein interactions and for a molecule such as cytochrome c, may be valuable in facilitating rapid, yet specific, interactions with many different redox partners. The results of this paper also suggest that cytochrome c may prove to be a difficult protein to use in any detailed analysis of current theories of first-order biological electron transfer.
The Science and Engineering Council and Oxford Centre for Mo- lecular Sciences is acknowledged for making NMR facilities available. DW would like to thank Richard Newbold and Roger Hewson for mathematical analysis and help in purifying cytochrome b5.
REFERENCES
1. Marcus, R. A. & Sutin, N. (1985) Biochim. Biophys. Acta 811,
2. Pielak, G . J., Concar, D. W., Moore, G. R. &Williams, R. J. P. (1987) Protein Eng. I , 83-88.
3. Winkler, J. R., Nocera, D. G., Yocum, K . M., Bordignon, E. & Gray, H. B. (1982) J . Am. Chem. Soc. 104, 5798-5800.
4. Whitford, D., Concar, D. W., Gao, Y., Pielak, G. & Williams, R. J. P. (1988) Ttacr elements in man and animals (Hurley L. S., Keen, C. L., Lonnerdal, L. & Rucker, R. B., eds) vol. 6, pp. 29 - 34, Plenum Press, New York.
265 - 322.
5. Salemme, F. R. (1976) J . Mol. Bid. 102, 563-568. 6 . Mauk, M. R., Reid, L. S. & Mauk, A . G. (1982) Biochemistry 21,
7. Stonchuerner, J., Williams, J. B. & Millet, F. (1979) Biochemistry
8. Ng, %,Smith, M. B., Smith, H.T.&Millet, F. (1977) Biochemistry
9. Eley, C. G. S. & Moore, G. R. (1983) Biochem. J . 315, 11 -21. 10. Takano, T. & Dickerson, R . E. (1981) J . Mol. Bid. 153,79-115. 11. Louie, G. V. & Brayer, G. D. (1988)J. Mol. Biol. 199, 295-314.
1843 - 1846.
18, 5422-5427.
16,4975-4978.
12. Mathews, F. S., Lcvine, M. & Argos, M. (1972) J . Mol. Biol. 64,
13. Mathews, F. S. (1980) Biochim. Biophys. Acta 622, 375-379. 14. Williams, G., Moore, G. R., Porteous, R., Robinson, M. N.,
Soffe, N. &Williams, R. J . P. (1985) J . Mol. Biol. 183, 409-
15. Wand, A. J. & Englander, S. W. (1986) Biochemistry 24, 5290-
16. Veitch, N. C., Concar, D. W., Williams, R. J. P. & Whitword, D.
17. Veitch, N. C., Whitford, D. & Williams, R . J . P. (1990) FEBS
18. Guiles, R. D., Altman, J., Kuntz, 1. D. & Waskell, L. (1990)
19. Pielak, G. J., Mauk, A. G. &Smith, M. (1985) Nuture313, 152-
20. Bcck von Bodman, S., Schular, M. A., Jollie, D. R. & Sligar, S.
21. Hickey, D. R., McLendon, G. & Sherman, F. (1988) J . Bid.
22. Liang, N., Mauk, A. G., Pielak, G. J., Johnson, J. A,, Smith,
23. Zhang, Q. P., Marohn, J. & McLendon, G. (1990) J . Phys. Chem.
24. Gray, H. B. (1986) Clzem. Soc. Rev. 15, 17-30. 25. Strittmatter, P. (1964) in Rapidmixing and sampling techniques in
hiochemistry (Chance, B., Eisenhardt, R. H., Gibson, Q. H., & Lxnberg-Holm, K. K., eds) pp. 71 -84, Academic Press, New York.
26. Dailey, H. A. & Strittmatter, P. (1979) J . Bid. Chem. 254, 5388- 5396.
27. McLendon, G., Winkler, J. , Nocera, D., Mauk, A. G. & Gray, H. B. (1985)J. Am. Chem. Soc. 107,739-740.
28. McLendon, G. & Miller, J. R. (1985) J . Am. Chem. Soc. 107,
29. Marcus, R. A. (1956) J . Chem. Phys. 24, 966-978. 30. Louie, G. V. & Brayer, G. D. (1990) J . Mol. Biol. 214, 527-535. 31. Gao, Y., Boyd, J., Pielak, G. & Williams, R. J. P. (1991) Biochem-
32. Gao, Y., Pielak, G., Williams, R. J. P., McLendon, G. &Sherman,
33. Churg, A., Warshel, A., & Takano, T. (1983) J . Phys. Chem. 87,
34. Bushnell, G. W., Louie, G. V. & Brayer, G. D. (1990) J . M d .
35. Burrows, A., Guo, L., Hill, H. A. O., McLendon, G. & Sherman, F. (1991) J . Am. Chem. Soc., in the press.
36. Rafferty, S. P., Pearce, L. L., Barker, P. D., Guillemette, J. G., Kay, C. M., Smith, M. & Mauk, A. G. (1990) Biochemistry 2Y,
37. Concar, D. W., Whitford, D., Pielak, G. J. & Williams, R. J. P.
38. Strittmatter, P. (1967) Meth0d.y Enzymol. 10, 553- 556. 39. Strittmatter, P., Fleming, P., Connors, M. & Corcoran, D. (1978)
40. Reid, L. S. & Mauk, A. G. (1982) J . Am. Chem. Soc. 104, 841 -
41. Whitford, D., Concar, D. W., Veitch, N. C . &Williams, R. J. P.
42. Das, G., Hickey, D. R., McLendon, D., McLendon, G. &
43. Margoliash, E. & Frohwirt, N. (1959) Biochem. J . 71, 570-572. 44. Louie G. V., Pielak, G. J., Smith, M. & Brayer, G. D. (1988)
45. Louie, G. V. &Brayer, G. D. (1990) J . Mol. Biol. 210, 313-322. 46. McLendon, G. (1988) Acc. Chem. Res. 21,160-167. 47. Rodgers, K. L., Pochapsky, T. C. & Sligar, S. G. (1988) Science
48. Wendoloski, J. J., Mathew, J. B., Weber, P. C. & Salemme, F. R .
449 - 464.
428,429-446.
5294.
(1988) FEBS Lett. 238, 49-55.
Lett. 269, 297 - 304.
Biochemistry 29, 1276 - 1289.
154.
G. (1986) Proc. Nut1 Acad. Sci. USA 83, 9443 -9447.
Chem. 263,18298-18305.
M. & Hoffman, B. M. (1988) Science 240, 311 -313.
94,8628 -8630.
7811 -7816.
istry 30, 1928- 1934.
F. (1991) Biochemistry 30, in the press.
1683 - 1684.
Biol. 214, 585 - 595.
9365-9369.
(1991) J . Am. Chem. Soc. 113,2401 -2406.
Methods Enzyrnol52, 97- 101.
845.
(1990) Eur. J . Biochem. 192, 725-721.
Sherman, F. (1989) Proc. Natl Acad. Sci. USA 86,496-499.
Biochemistry 27, 7820- 7876.
240,1657 - 1659.
(1987) Science 238,794-797.