Embed Size (px)
Citation preview
1
The role of the electricity industry in the recovery of Ukraine's economy after the pandemic
June 2021

2Source: Economic Recovery Center, Eurostat, IAE
Electricity losses and investments in distribution networks, 2018
Electricity sector has come across a number of challenges that have a negative impact on the economic development
Production volume and installed capacity of power plants of the total, 2000–2020, %
Energy intensity of GDP and final energy consumption in households by type of fuel, Ukraine and Europe, 2018
0.07
UkraineVenezuela
0.09
USAIndia
0.11
0.23
PolandGermany
0.21
0.060.09
United Kingdom
• Due to depreciated equipment and outdated technologies energy intensity of Ukrainian GDP is more than twice the world’s average.
• Ukrainian houses are 3 times less energy efficient than those in Germany.
2019
4%
38%
2018 2020 Post
COVID 19
6%2%
2020 Prior
COVID 19
20192020 Prior
COVID 19
8%
35%37%
2020 Post
COVID 19
36%
2018
-3 p.p.
+6 p.p.
TPP/CHPP RES
Share of generation in the total volume of energy generated
9.8%
6.0%
10.4%
4.5%
+0.6 pp
Electricity losses in distribution networks, %
Ukraine2018
Ukraine2019FrancePoland
Energy intensity of GDP, 2019, kgoe / USD
• A significant number of TPPs/CHPPs will bedecommissioned starting from 2021, reshaping thejob market.
• The cost of investments in a solar power plant isdeclining in Ukraine and it remains as an attractiveinvestment.
• Power outages (SAIDI) in Ukraine are the longest in Europe and their duration reached 696 minutes in 2018.
• Introduction of RAB tariff will stimulate investments in energy infrastructure.
GENERATION SUPPLY AND DISTRIBUTION CONSUMPTION
GDP, UAH billion (2019)380 Employees, thousand people (2018)120 Tax revenues, UAH billion3210% 1% 3%
3
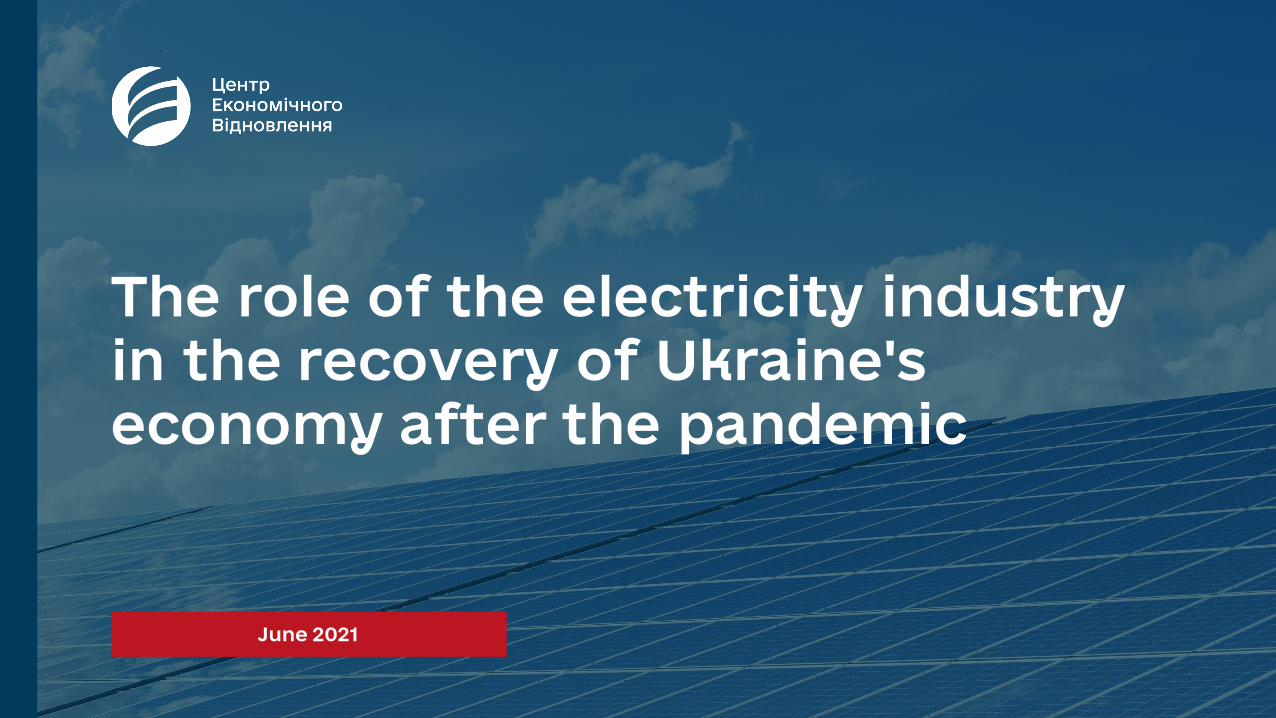
Projects in the electricity sector will ensure the recovery of Ukraine's economy
Source: Economic Recovery Center
3. CONSUMPTION AND MARKETS
POPULATION
ECONOMYUkrainian economy is one of the most energy-intensive in the world
2
The system is anticipating long-term change of generating capacities with the commitment of 25% of RES till 2035 according to the Energy Strategy 2035
1.GENERATION
The electricity distribution networks require modernization as the losses in the distribution reach on average 10% along the distribution system
2. SUPPLY AND DISTRIBUTION
DEVELOPMENT OF PRIVATE SOLAR POWER
PLANTS
MODERNIZATION OF ELECTRICITY
TRANSMISSION AND DISTRIBUTION NETWORKS
ENERGY EFFICIENCYIMPROVEMENT
Households, government organizations and industrial users face significant electricity costs due to low level of energy efficiency
Energy efficiency measures will help to reduce the consumption of the energy resources and thus reduce the costs of the industry and the population spent on the energy.
Modernization of the electricity networks will lead to reduction in electricity losses within the network and reduce the risks of the power outages.
Development of private solar power plants will help to reduce the leverage on the energy system and foster the further decarbonizationof the ukrainian energy sector.

4
Installation of 50 ths household SPP will provide 5.4 BN UAH ofadditional revenues to the state budget
Source: Economic Recovery Center
1.GENERATION 2. SUPPLY AND DISTRIBUTION 3. CONSUMPTION AND MARKETS
EFFECT FROM PROJECTS IMPLEMENTATIONSPP INSTALLED AND ENERGY GENERATED (MLN kWh)
EFFECT ON THE ECONOMYGENERATED JOBS
STATE BUDGET REVENUES1, MLN UAH
719
2030Increase
5,6344,916
Generated in 2021
497 506 514 523 532 541 551 560 570 580
2030202820272026 202920252021 20232022 2024
Total amount (2021-2030)
5,373 MLN UAH
4,163
753
Production of equipmentInstallation
4,853
878
831
366
209
66
286
2030
451
2022 20292028
539
136
2027
729
2024 20262023
632
2021 2025
REDUCTION OF CO2 EMISSIONS ( thousand-ton CO2)
Total amount (2021-2030)
4.2 Mln ton CO2
Total amount (2021-2030)
9,189 Mln kWh
PROJECT - Household power plants up to 30 kW)
Benefits for the energy system:• clean energy generation;• additional energy system balancing
capacity;• prosumers market growth.
Benefits for investors:• energy independence of households;• additional revenues for the household;
through “green tarrif”.
Total amount of SPP (30 kWh) installed:50 000Total installed capacity: 1.5 GWhTotal program investments: 865 mln USD• Required investment per project: USD 20
thousand• Electricity produced by 1 SPP: 35970 kWh
per year
Households with the income of more than USD 41 thousand per year:744 thousandRequired amount of households to be involved over 10 years: 0.54%
TYPES OF PROJECTS (ESTIMATION COSTS FOR 10 YEARS)
144295
453619
793975 4.000
1.600
5.000
0
400
8001.000
3.000
1.800
2.000
7.000
1.000
1.400
0
1.200
6.000
600
200
2030
1.167
2028
1.367
2021 2022 2023 20292024 2025 2026 2027
1.5781.798
Energy generatedSPP installed
Total amount (2021-2030)50,000 SPP
Note: 1- State budget revenues include revenues from materials used for SES and jobs generated

5
Implementation of RAB tariff will provide 72 BN UAH of additional revenues to the state budget
Source: Economic Recovery Center
1.GENERATION 2. SUPPLY AND DISTRIBUTION 3. CONSUMPTION AND MARKETS
EFFECT FROM PROJECTS IMPLEMENTATIONSAIDI (MINUTES) AND LOSSES IN DISTRIBUTION NETWORKS (%)
EFFECT ON THE ECONOMYGENERATED JOBS
DIRECT AND INDIRECT STATE BUDGET REVENUES, BN UAH
TYPES OF PROJECTS (ESTIMATION COSTS FOR 10 YEARS)RAB-tariff implementation will ensure INVESTMENTS OF 202 BN UAH for 7 general projects :PROJECT 1. Reconstruction and modernization of electrical networks ~101 BN UAH
PROJECT 2. Creating technical prerequisites for the development of distributed generation with RES ~ 21 BN UAH
PROJECT 3. Introduction of SMART GRID technologies ~20 BN UAH
PROJECT 4. Improving the efficiency and cost - effectiveness of networks by reconfiguring them (changing the topography of networks) ~20 BN UAH
PROJECT 5. Automation of electricity metering systems ~16 BN UAH
PROJECT 6. Implementation of measures for automation, scheduling and telemetry of DC operating voltage ~14 BN UAH
PROJECT 7. Implementation of measures to compensate for reactive power ~10 BN UAH
Generated in 2021
14,274
Increase 2030
17,004
31,278
1 1 2 2 2 2 2 2 2 2
2 3 45 5 6 6 7 7 8
2027 20302021 2026202520242022 2023 2028 2029
44
56
78
89
1011
Direct tax revenues Indirect tax revenues
Total amount (2021-2030)72 BN UAH
Decrease2021
312 min.
319 min.
2030
632 min.7,002
10,003
Construction and engineeringDomestic production of equipment materials
12,879
18,39911% -3%
8%
Note: 1- Estimations based on NCER approved electricity losses reduction plan through RAB measures implementations (up to 7%) until 2035
ENERGY LOSSES1 (BN kWh)
18.01
14.50
3.51
2021 Decrease 2030
Total amount of energy saved (2021-2030)
4 BN kWh

6Source: Economic Recovery Center, YASNO Efficiency, GIZ, Ukrastat
1.GENERATION 2. SUPPLY AND DISTRIBUTION 3. CONSUMPTION AND MARKETS
EFFECT FROM PROJECTS IMPLEMENTATIONPROJECTS IMPLEMENTED AND ELECTRICITY SAVED(MLN kWh)
EFFECT ON THE ECONOMYGENERATED JOBS
STATE BUDGET REVENUES, MLN UAH
3,817
62,048
58,231
Generated in 2021 Increase 2030
339 461 628 855
2,955
2,166
4,034
1,5881,165
2023 2030
5,507
20282025 20292021 2022 2024 20272026
Total amount (2021-2030)19,7 BN UAH
789
6.882
5.044
2.713
1.074
2027
1.9911.462
2028
9.393
2023 2025 2026 2030
12.824
202920242021
3.699
2022
REDUCTION OF CO2 EMISSIONS (Mt CO2)
Total amount (2021-2030)
46 Mt CO2
Total amount (2021-2030)
51,399 Mln kWh
884
5.000
2.000
15.000
0 0
10.0001.500
2.500
500
1.000
20252023
2.231
2022
14.370
2021 2024 2026
10.525
7.712
2029
5.652
1.638
2027
4.145
2030
1.2033.040
2028
Electricity savedProjects realized
Total amount (2021-2030)
8252 Projects
Implementation of 8252 energy efficient projects for іndustrу by 2030 will provide 19.7 BN UAH additional revenues to the state budgetTYPES OF PROJECTS Capital investment for ~ 8252 projects is 36 BN hrn
General types of projects:
PROJECT 1. Modernization of the lighting system ~ 1 MLN UAH
PROJECT 2. Modernization of electrical equipment with the use of frequency control ~ 1-3 MLN UAH
PROJECT 3. Modernization of heating, ventilation, air conditioning systems ~ 3 MLN UAH
PROJECT 4. Modernization of compressor equipment~ 1 MLN UAH
PROJECT 5. Modernization of gas equipment~ 2-3 MLN UAH
PROJECT 6. Monitoring and energy management system ~ 0.5 MLN UAH
Effects of projects:
~ 1 MLN of UAH =• 409 THS kWt of energy savings
• 365 t CO2 of energy savings
• 1.8 new jobs

7
Updating lightning and electrical appliances and building energy efficient buildings will generate additional 90 thousand workplaces
Source: Economic Recovery Center, ODYSSE and MURE database, Ministry for regional development, GIZ, SAE
1.GENERATION 2. SUPPLY AND DISTRIBUTION 3. CONSUMPTION AND MARKETS
EFFECT ON THE ECONOMYGENERATED JOBS
164,000
254,000
2030Increase
90,000
Generated in 2021
ELECTRICITY SAVINGS (MLN kWh) AND CO2 REDUCTION (MT CO2 )UPDATING LIGHTNING AND ELECTRICAL APLLIANCESThe transition from incandescent to more energy-efficient LED lamps and lamps with motion sensors for outdoor lighting will reduce electricity consumption by more than 50%
Project cost - ~4.7 BN UAH# of households covered: ~ 6 MLN (40%)
Due to the replacement of obsolete devices with new high-end power consumption will reduce costs by 30-70% of the existing base of devicesProject cost - ~64 BN UAH# of of households covered: ~ 13.4 MLN (90%)
BUILDING NEW ENERGY EFFICIENT RESIDENTIAL BUILDINGSConstruction of energy efficient houses, in which heat losses are minimized and the latest energy saving technologies (heat pump) are additionally installed allow to reduce heating costs to <60 kWt/m3
Project cost - ~1.4 TRL UAH# of households living in new energy effective building : ~ 740 THS
STATE BUDGET REVENUES,BN UAH
ELECTRICITY SAVINGS, (MLN kWh) AND CO2
REDUCTION (MT CO2 )
EFFECT FROM PROJECTS IMPLEMENTATION
717860
11
23
34
0
1
2
3
4
5
6
7
2.000
4.000
0
8.000
12.000
10.000
6.000
5
1.147
20282026
3.192
6
2.2372.685
2025
1.434
2.660
202920242023
1.004
3.723 4.255
20222021
4.027
5.319
2030
4
1.290
4.474
4.787
3.579
6
2027
3.132
From indoor lightning
AppliancesFrom outdoor lightning
CO2 Reduction
86 172 258 344 429 515 601 687 773 859
0.8
1.0
0.0
0.2
1,1001,000
800700
300
500
200100
1.2900
0
1.4
600
0.4
1.6
0.6400 0.5
0.8
0.2
2021 2026
1.4
2022 2030
1.21.1
0.9
202720252024 2029
0.6
2023 2028
1.5
0.3
Electricity savingCO2 Reduction
24 26 27 28 30 31 33 3436
38
20282024 203020262022

8
recovery.org.ua