Embed Size (px)
Citation preview
THE ROLE OF STRATEGIC MANAGEMENT PRACTICES
ON COMPETITIVENESS OF FLORICULTURE INDUSTRY
IN KENYA: A CASE OF KIAMBU COUNTY
BY
SCHOLASTICAH MBULA MUSAU
UNITED STATES INTERNATIONAL UNIVERSITY-
AFRICA
SPRING 2017

THE ROLE OF STRATEGIC MANAGEMENT PRACTICES
ON COMPETITIVENESS OF FLORICULTURE INDUSTRY
IN KENYA: A CASE OF KIAMBU COUNTY
BY
SCHOLASTICAH MBULA MUSAU
A Research Project Report Submitted to the Chandaria School
of Business in Partial Fulfilment of the Requirement for the
Degree of Masters in Business Administration (MBA)
UNITED STATES INTERNATIONAL UNIVERSITY-
AFRICA
SPRING 2017
ii
STUDENT’S DECLARATION
I, the undersigned, declare that this is my original work and has not been submitted to any
other college, institution, or university other than the United States International University
in Nairobi for academic credit.
Signed: ________________________ Date: ______________________
Scholasticah Mbula Musau (644601)
This project has been presented for examination with my approval as the appointed
supervisor.
Signed: ________________________ Date: ______________________
Dr. Juliana, M. Namada
Signed: ________________________ Date: ______________________
Dean, Chandaria School of Business

iii
COPYRIGHT
All the rights reserved. No part of this report may be photocopied, recorded or otherwise
reproduced, stored in a retrieval system or transmitted in any electronic or mechanical
means without prior permission of the copyright owner.
Scholasticah Mbula Musau Copyright © 2017

iv
ACKNOWLEDGEMENT
I would like to begin by giving thanks to the Lord Almighty for the strength, courage, and
guidance he has offered to me during the process of preparing my final project for my
graduate studies. I also give appreciate and acknowledge my great family for the
unconditional support they offered me, and to Dr. Juliana Namada for her patience,
direction and motivation that she accorded me in writing up this research May God bless
her abundantly.

v
DEDICATION
I would like to dedicate this proposal to my loving husband Patrick and son Gianni for the
sacrifice, motivation, and support in this MBA program, without them this research would
not have been probable.
vi
ABSTRACT
The purpose of this study was to establish the role of strategic management on
competitiveness in the floriculture industry in Kenya. The research was guided by the
following research questions: How does strategy formulation affect competitiveness of the
floriculture industry? How does strategy implementation affect competitiveness in the
floriculture industry? How does strategy evaluation affect competitiveness of the
floriculture industry?
A descriptive research was used. The target population of this study were managers in the
21-floriculture industries in Kiambu County. The data obtained was analyzed via statistical
Package for Social Sciences (SPSS) and excel. The quantitative data obtained was
examined, and the findings presented in percentages, means, standard deviations, and
frequencies. A regression analysis was utilized to investigate the relationship between the
dependent and independent variables. The researcher distributed 63 questionnaires, 60 of
them were filled and returned, making 95 percent of the response rate.
The findings from the first objective established that corporate social responsibility offered
by the firms help the community around. The study also revealed that most of the firms do
not operate in areas affected by conflicts. Majority of the firms also revealed to have a
vision statement, which defines the desired future. In addition, the findings from the study
revealed that tastes, attitudes, and perceptions played a factor in leading floricultural firms
to adopt new products. The findings from the second objective established that floricultural
firm’s implements formulated strategies and they have been able to realize their short-term
strategies as well as new programs to create new activities. It was also established that
resources are allocated after preparation of budgets and the firms restructuring is done if
there is need to. The findings from the third objective established that most company
evaluates their strategies and utilize audits help to analyses if objectives have been met.
With regard to how strategy formulation affect competitiveness, it was concluded that
corporate social responsibility is a good strategy when utilized to help the community
around. Most firms need a vision statement, which defines the desired future. Floricultural
firms to adoption of new products is determined by factors such as tastes, attitudes, and
perceptions. It was also concluded that most of the firms in the floriculture industry have
been able to implement formulated strategies as well as realize their short-term strategies.
vii
These firms have also initiated programs to create new activities and to do so they have
managed to allocate their resources effectively through preparation of budgets. With regard
to strategy evaluation in the floriculture industry it was concluded that most of the
companies have been able to evaluate their strategies. While that is the case, most of the
firms have also been able to utilize audits to establish if the objectives have been met. Such
audits have also been utilized to provide information on performance.
The study recommended that there is a need for the employees in the industry to be educated
on the importance of factors of strategy formulation in enabling competitiveness.
Regarding strategy implementation and competitiveness it was concluded that firms in the
sector need to ensure that procedures are put in place and this should be made clear to all
employees. There is also a need to involve the top management steering in the
implementation process and this would ensure continuous monitoring of the process.
Information disseminated should also be encouraged for effective cooperation to all
stakeholders. Due to the uncertainty regarding factors necessary for strategy evaluation it
is necessary for the industry to ensure that the teams are well informed about use of the
balanced score card and dash board in the business. For further studies the study
recommended that there was a need to do a similar research in other firms in the agricultural
sector so as to be able to compare the results and make conclusion. On the other hand, there
is a need to undertake a study to determine the challenges facing strategy formulation,
strategy implementation and strategy evaluation in the floriculture and this enabled the
firms in the industry to be better prepared for any of the challenges that they may encounter
during the processes.
viii
TABLE OF CONTENTS
STUDENT’S DECLARATION ........................................................................................ ii
COPYRIGHT .................................................................................................................... iii
ACKNOWLEDGEMENT ................................................................................................ iv
DEDICATION.................................................................................................................... v
ABSTRACT ....................................................................................................................... vi
LIST OF TABLES ............................................................................................................. x
ABBREVIATIONS AND ACRONYMS ......................................................................... xi
CHAPTER ONE ................................................................................................................ 1
1.0 INTRODUCTION........................................................................................................ 1
1.1 Background of the Study ............................................................................................... 1
1.2 Statement of the Problem ............................................................................................... 6
1.3 Purpose of the Study ...................................................................................................... 7
1.4 Research Questions ........................................................................................................ 7
1.5 Significance of the Study ............................................................................................... 7
1.6 Scope of the Study ......................................................................................................... 8
1.7 Definitions of Terms ...................................................................................................... 8
1.8 Chapter Summary .......................................................................................................... 9
CHAPTER TWO ............................................................................................................. 10
2.0 LITERATURE REVIEW ......................................................................................... 10
2.1 Introduction .................................................................................................................. 10
2.2 Strategy Formulation and Competitiveness ................................................................. 10
2.3 Strategy Implementation and Competitiveness ........................................................... 15
2.4 Strategy Evaluation and Competitiveness ................................................................... 20
2.5 Chapter Summary ........................................................................................................ 28
CHAPTER THREE ......................................................................................................... 29
3.0 RESEARCH METHODOLOGY ............................................................................. 29
3.1 Introduction .................................................................................................................. 29
3.2 Research Design........................................................................................................... 29
3.3 Population and Sampling Design ................................................................................. 29
3.4 Data Collection Methods ............................................................................................. 31

ix
3.5 Research Procedures .................................................................................................... 32
3.6 Data Analysis Methods ................................................................................................ 32
3.7 Chapter Summary ........................................................................................................ 33
CHAPTER FOUR ............................................................................................................ 34
4.0 DATA ANALYSIS AND INTERPRETATION ...................................................... 34
4.1 Introduction .................................................................................................................. 34
4.2 Demographic Information ............................................................................................ 34
4.3 Effects of Strategy Formulation on Competitiveness .................................................. 37
4.4 Effects of Strategy Implementation on Competitiveness ............................................. 41
4.5 Effects of Strategy Evaluation on Competitiveness..................................................... 45
4.6 Chapter Summary ........................................................................................................ 48
CHAPTER FIVE ............................................................................................................. 49
5.0 DISCUSSION, CONCLUSIONS AND RECOMMENDATIONS ........................ 49
5.1 Introduction .................................................................................................................. 49
5.2 Summary ...................................................................................................................... 49
5.3 Discussion .................................................................................................................... 51
5.4 Conclusion ................................................................................................................... 56
5.5 Recommendation ......................................................................................................... 57
REFERENCES ................................................................................................................. 58
APPENDIX I: COVER LETTER .................................................................................. 65
APPENDIX II: RESEARCH QUESTIONNAIRE ....................................................... 66
APPENDIX III: SAMPLE FRAME............................................................................... 71
x
LIST OF TABLES
Table 4.1: Response Rate ................................................................................................. 34
Table 4.2: Gender............................................................................................................. 35
Table 4.3: Years Worked ................................................................................................. 35
Table 4.4: Age .................................................................................................................. 36
Table 4.5: Education ........................................................................................................ 36
Table 4.6: Years of Employment ..................................................................................... 37
Table 4.7: Number of Employees .................................................................................... 37
Table 4. 8: Effect of Strategy Formulation on Competitiveness ..................................... 38
Table 4.9: Model Summary on Strategy Formulations on Competitiveness .................. 39
Table 4.10: ANOVA on Strategy Formulations on Competitiveness .............................. 39
Table 4.11: Coefficient of Strategy Formulations on Competitiveness ............................ 40
Table 4.12: Descriptive on Strategy Implementation ...................................................... 41
Table 4.13: Regression of Strategy Implementation on Competitiveness ....................... 42
Table 4.14: ANOVA of Strategy Implementation on Competitiveness .......................... 43
Table 4.15: Coefficient of Strategy Implementation on Competitiveness ....................... 44
Table 4.16: Descriptive on Strategy Evaluation on Competitiveness.............................. 46
Table 4.17: Model Summary on Strategy Evaluation on Competitiveness ..................... 46
Table 4.18: ANOVA of Strategy Evaluation on Competitiveness .................................. 47
Table 4.19: Coefficient of Strategy Evaluation on Competitiveness ............................... 48
xi
ABBREVIATIONS AND ACRONYMS
ANOVA -Analysis of Variances
KSHS - Kenya Shillings
KFC -Kenya Flower Council
KHC -Kenya Horticulture Council
SD - Standard Deviation
SPSS - Statistical Package for Social Sciences
USD -United States Dollars

1
CHAPTER ONE
1.0 INTRODUCTION
1.1 Background of the Study
Strategic Management is a concept that concerns making decisions and taking corrective
actions to achieve long-term targets and goals of an organization (Bakar et al, 2011). It is
a set of decisions and actions that result in the formulation and implementation of plans
designed to achieve a company’s objectives (Pearce & Robinson, 2008). The business
environment in which firms operate is dynamic and turbulent with constant and fast paced
changes that often render yester-years strategies irrelevant (Ofunya, 2013). Strategies
should therefore be put in place to cushion the businesses from the uncertainty that comes
along with an unpredictable environment.
Strategic management addresses the reason why some organizations succeed while others
fail (Melchorita 2013; Porter 2001). Strategic management involves identifying the
organization’s current mission, objectives, and strategies, analyzing the environment,
identifying the opportunities and threats, analyzing the organization’s resources,
identifying the strengths and weaknesses, formulating and implementing strategies and
evaluating the results (Robbins & Coulter, 1996). Strategic management practice consists
of three basic elements, strategy formulation, implementation, evaluation and control
(Wheelen & Hunger, 2008). It is within these three elements that strategic management
practices are manifested and is also described as the strategic management process.
Strategic competitiveness is achieved when a firm successfully formulates and implements
a value creating strategy (Hitt, Ireland & Hoskisson, 2013). A farm gains competitive
advantage when it implements a strategy that creates a superior value for its customers and
its competitors are unable to duplicate or find too costly to imitate. Organizations must also
understand that no competitive advantage is permanent and therefore must keep reinventing
themselves. Ireland et al (2013) states that the environment in which a company operates
in determine their competitiveness. External environment which includes the industry in
which the farm competes as well as those against whom it competes affects the competition
actions and the strategic responses the firm take to outperform competitors and earn above
average results. The general condition of the farm, the industry and the competitors
influence the farm’s competitive actions and responses.
2
Competitive advantage denotes a firm’s ability to achieve market superiority (Evans &
Lindsay, 2011). This concept is the core of strategic management, as every organization
searches for a vantage point that could deliver the competitive edge against its rivals. While
one way of gaining competitive advantage over rivals has been identified as achieving a
better cost advantage, another way to competitive advantage is product differentiation
(Porter, 1985). Product differentiation by itself was of little value unless the difference so
achieved attracts and captures the imagination of customers. The needs and wants of the
customer must be entrenched in the business process if the customer is to be truly satisfied.
These needs and wants were through customer surveys, and then become entrenched in
design to production to delivery and use (Evans & Lindsay, 2011).
Strategy formulation is the development of long-range plans for the effective management
of environmental opportunities and threats, considering corporate strengths and weaknesses
(Wheelen & Hunger, 2008). It includes defining the corporate mission, specifying
achievable objectives, developing strategies and setting policy guidelines. The process of
strategy formulation is mainly carried out at three levels, which include the corporate level,
business level and the functional level. The lower level managers drive the functional
strategies, which have short-term horizons and relate to a functional area (Macmillan &
Tampoe, 2000). Pursuing ways to capture valuable business strategic fits and turn them into
competitive advantages especially transferring and sharing related technology, operating
facilities, distribution channels, and/or customers. It is useful to organize the corporate level
strategy considerations and initiatives into a framework with the following three main
strategy components: growth, portfolio, and parenting.
Strategy implementation is the process through which strategies are put into action
throughout the organization by deriving short-term objectives from the long-term
objectives and further deriving the functional tactics from the business strategy. This
process assists management in identifying the specific immediate actions that must be taken
in the key functional areas to implement the business strategy (Pearce & Robinson, 2008).
And lastly strategic evaluation and control is concerned with tracking the strategy as it is
being implemented, detecting problems or changes when deemed necessary and making
the necessary adjustments (Pearce & Robinson, 2008). The review of monthly, quarterly
and annual reports is one of the means management exercise their evaluation and control
of a strategy. The reviews require a look at for instance the profit margins, sales; earnings

3
per share and return on investment to assist management determine the effectiveness of the
strategy being implemented. Pappas et al (2007) examined the joint influence of control
strategies and market turbulence on strategic performance in sales-driven organizations.
Results from the survey of sales-driven organizations indicated that self, professional,
activity, and output control systems had varying effects on participation in strategic
activity.
With increasing awareness on environmental issues and the magnitude of costs associated,
it has become imperative for companies to integrate environmental efforts into their
business strategy (Sindhi & Kumar, 2012). Many African countries face enormous
challenges while striving to achieve sustainable development (Moosbrugger, 2007). Unlike
in the developed world where corporate governance system plays a vital role, corporate
social responsibility (CSR) is still in its early stages in most of the developing countries
(Bedada & Eshetu, 2011).
Maintaining a sustainable natural environment is crucial to the long-term future of the
flower industry but producing and consuming ethically represents potentially complex and
difficult choices for the flower industry (Holt & Watson, 2007). Even though the
floriculture industry is facing quite a few challenges especially concerning employment
conditions and environmental sustainability, today many of the companies in this industry
are working towards attaining corporate social and environmental responsibility. Several
initiatives undertaken by the Kenya Flower Council companies to incorporate social,
economic and environmental practices into their business strategy indicate their desire to
be involved in socially and environmentally responsible production. Some of these
initiatives include: changing employment practices, increased adoption of codes/standards,
emergence of a multi-stakeholder process, participatory auditing among others (Opondo,
2005).
The horticulture industry consists of the production of fruits, vegetables, and flowers. In
2013 global vegetable production was estimated at 879.2 million tonnes in 2013 while the
global export was USD 97.02 billion and the consumption of consumption of flowers was
estimated in the range of USD 40 - 60 billion in 2011. Horticulture in Kenya is the largest
foreign exchange earner generating approximately 95 billion shillings per annum (Research
and Markets, 2014). Horticulture farmers in Kenya earned Kshs 3 billion more from exports
in the first half of 2013. The Horticultural sub sector is the fastest growing industry within

4
the agricultural sector, recording an average growth of 15% to 20% per annum. It
contributes positively to wealth creation, poverty alleviation, and gender equity especially
in the rural areas. The industry continues to contribute to the Kenyan economy through
generation of income, creation of employment opportunities for rural people and foreign
exchange earnings, in addition to providing raw materials to the agro processing industry.
The sub sector employs approximately 4.5 million people countrywide directly in
production, processing, and marketing, while another 3.5 million people benefit indirectly
through trade and other activities (KHC, 2015).
In the developed countries, flowers are luxurious products with high social value, and in
the recent years the demands for these products have increased in the global market (Getu,
2009). Most developing nations which have geographic advantage for example high
altitude and natural sunlight, are adopting floriculture as a solution to achieving rapid
economic growth (Frank & Cruz, 2001). Today Kenya is ranked as one of the worlds’
largest and most successful exporters of cut flowers and ornamentals (Hale and Opondo,
2005). This is mainly attributed to favorable climate, a solid infrastructure, liberalized
economy, global positioning of the country, availability of airfreight, a productive
workforce, maintenance of high standards through compliance to codes of practice,
traceability, due diligence and ethical trading, massive investment on technical skills,
among others (KFC, 2013).
Netherlands supplies an impressive 67% of total EU imports. Other leading cut flower
suppliers are Kenya (11% of EU imports), Ecuador (4%), Colombia (3%) and Ethiopia
(3%). Certification is used as a form of strategy to stay competitive by the European
Growers. Growers obtain certification to profile their company as professional and
sustainable. Certificates open up market segments they otherwise would not be able to
supply (Rikken, 2010). Social and environmental standards are important governance tools
through which they seek to ensure themselves of the quality of their suppliers’ products
and services. According to Rikken (2010), producers and traders try to sell the added value
that the flowers come from guaranteed social and environmental friendly production. The
driving force for the success of the industry is related to the crucial role of the auctions, the
well-developed infrastructure, a drive for innovation and a strong sense of cooperation
(Kargbo 2010; World Bank 2009). To offset the high costs, Dutch growers need high yields
and thus an area smaller than that of Colombia, the Dutch produce more flowers (Rikken
5
2011). Growers are supported by well-developed services in terms of research and
development, and an efficient distribution system that is well connected by air and by
ground transportations with the most important producing and consuming countries.
Colombian growers are open to innovations and have developed for instance strong
expertise in biological soil decontamination. They have experience in sea transportation
and good infrastructure (Rikken, 2011). The floriculture industry in Egypt is modest. In
summer, it is too hot so year-round production is not possible. Advantages of Egypt are
cheap labour and electricity, and there is enough water along the Nile delta (Middelburg,
2009). In Uganda, the rose consists of 80% of exported flowers. Floriculture is now one of
Ethiopia’s main export sectors. Wages are low, considerably lower than in Kenya and the
support of the government is quite insignificant for the development of the industry (Tilman
& Altenburg, 2010). Major bottlenecks however include strict regulations concerning
repatriation of foreign exchange earned on exports, lack of adequate pesticide regulation,
weak phytosanitary inspection and no protection of breeders’ rights (Gebreeyesus, 2009).
In Africa, Kenya is the largest producer, followed at a distance by Ethiopia. The estimated
value of flower exports in 2014 was 54.6 billion shillings with export volumes of around
136,601 tons (KFC, 2014). The Kenyan flower industry is estimated to employ over 90,000
people directly, and approximately 1.2 million people indirectly (Hale & Opondo, 2005).
The main area where flower farming is done is around Lake Naivasha, Mt. Kenya region,
Nairobi, central province, Athi River, rift valley and Eastern Kenya. The main export
markets for the flower industry in Kenya are in Europe, including Holland, United
Kingdom, Germany, France, and Switzerland; with new growing destinations for flower
demands including Japan, Russia and USA.
Challenges facing the Kenyan flower industry include; inadequate infrastructure which
limits accessibility between farms and collecting centers, inadequate refrigeration facilities
may result in reduction of quality since most products are highly perishable, the marketing
system also lacks proper organization. Freight charges are high leading to less marginal
profit, production cost is high due to hiked input prices, stiff competition on the
international market and pests and diseases can lead to interceptions negatively impacting
competitiveness of the Kenyan floriculture industry. Rikken (2011) noted that without
appropriate certification, social and environmental friendly production several sales
channels are not accessible.
6
1.2 Statement of the Problem
Hypercompetitive business environment has pushed organizations to limits dictating the
need to adopt strategic management practices that support plans, choices and decisions that
lead to competitive advantage and to archive sustainability, profitability, success and
wealth creation (Kourdi, 2009). There is need to operate with set goals and objectives and
therefore having strategies in place is paramount to the industry to ensure sustainability and
efficiency in order to remain relevant in the market. According to Porter (2011) strategic
management addresses the question of why some organizations succeed, others fail and it
covers the causes for company’s success or failure. Hrebiniak (2006) noted that although
formulating a consistent strategy is a difficult task for any management team, making that
strategy work by implementing it throughout the organization is even more difficult.
Several studies have been carried globally and locally on how strategic management affects
competitiveness. Melchorita (2013) conducted a study on strategic management practices,
competitive advantage and organizational performance. The findings were competitive
advantage as part of strategic management showed a remarkable positive influence on
organizational performance. Lamberg et al (2009) investigated competitive dynamics,
strategic consistency and organizational survival and according to the results, strategic
consistency led to both organizational survival and the most efficient change over time.
Awino (2013) looked into how strategic planning affected the competitive advantage of
ICT small and medium enterprises in Kenya and found that entrepreneurs cannot ignore
strategic planning as significant changes in competitive advantage results from change or
effective application of strategic planning. Raudan (2013) reviewed the strategic
management theory and its linkage with the resource-based view of the firm’s competitive
advantage and the study revealed that strategy is a critical factor for attaining competitive
advantage. Muogbo (2013) investigated the impact of strategic management on
organizational growth and development. The outcome from the analysis indicated that
strategic management was not common among the manufacturing firms but its adoption
had significant effect on competitiveness and influences on manufacturing firms.
However, despite the lucrtative nature and the great value contributed by the floriculture
industry to the economy, there is minimal or no research on how strategic management
impacts the competitiveness of this industry. Therefore this study seeks to establish the
7
relationship between strategic mangement practises and competitiveness in the floriculture
industry in Kenya.
1.3 Purpose of the Study
The purpose of this study is to examine how strategic management affects the
competitiveness of the floriculture industry in Kenya.
1.4 Research Questions
The research was guided by the following research questions:
1.4.1 How does strategy formulation affect competitiveness of the floriculture industry?
1.4.2 How does strategy implementation affect competitiveness in the floriculture industry?
1.4.3 How does strategy evaluation affect competitiveness of the floriculture industry?
1.5 Significance of the Study
1.5.1 Academicians and Researchers
The research findings makes a great contribution to the world of academia as researchers
or academicians who might be reseaching on the same topic may use this research findings
as a point of reference considering that this topic has not been widely researched.
1.5.2 Government and Policy Makers
The floriculture creates employment opportunities for the people of Kenya. The findings
helped in identify gaps and areas that require assistance. The government and other key
stake holders in policy making can use this study to be able to come up with ways of
working together in this industry. The study also shed light on ways in which to increase
the competitive advantage which increases both domestic and foreign income.
1.5.3 The Floriculture Industry
The study provided data for floricultural firms in Kenya and mainly in Kiambu County in
relation to strategic management practises. It was put forth recommendations that assists
the floriculture industry in knowing the importance of strategic management if it is to be
competitive in the global marketand how to it positively impacts the business. It provides
8
insights on how to go about putting strategies in place, who is to be involved in
implementation and how to sustain these visions to achieve the desired results.
1.6 Scope of the Study
This study focused on the responses fromflower farms in Kiambu County in Kenya on
strategic management practises in their farms. It also covers the ways in which strategic
management practises relate to competitiveness in the flower industry. Demographically,
the study was limited to Kiambu County Kenya, with the assumption that the responses
represent the views of other farms in the country.
1.7 Definitions of Terms
1.7.1 Floriculture Or Flower Farming
This is a discipline of horticulture concerned with the cultivation of flowering and
ornamental plants for gardens and for floristry, comprising the floral industry (Kenya
Flower Council Data, 2014).
1.7.2 Strategy
Strategy be defined as the art and science of formulating, implementing, and evaluating
cross functional decisions that enable an organization to achieve its objectives (David,
1997).
1.7.2 Strategy Control
This is the act of taking measures that orchestrate outcomes as closely as possible with
plans (Pearce & Robinson, 2007).
1.7.3 Strategy Evaluation
This is the process of continuously reviewing and comparing the actual performance
against the desired performance to determine if the desired results are being accomplished
such that corrective measures may be taken if warranted (Pearce & Robinson, 2007).
9
1.7.4 Strategy Formulation
Strategy formulation refers to the way of selecting the most appropriate course of action
for the comprehension of organizational goals and objectives and thereby achieving the
organizational vision (Wheelen & Hunger, 2008).
1.7.5 Strategy Implementation
Strategy implementation is the process through which strategies are put into action
throughout the organization by deriving short-term objectives from the long-term
objectives and further deriving the functional tactics from the business strategy (Pearce &
Robinson, 2008).
1.8 Chapter Summary
This chapter looked at the background information on strategic management on
competitiveness of firms. This chapter also looks at the problem statement and the research
questions. Chapter two looks into literature related to strategy management practises. It
also presents empirical literature relating to strategy management practises and
competitiveness through summary of the information from other researchers who have
previously carried out research on strategy management and competiveness. Chapter three
analyses the methodology that were applied in this research and the population and target
size was also be defined. Chapter four looks at the data analysis methods applied while
chapter five discusses the findings in line with the findings from previous studies.
10
CHAPTER TWO
2.0 LITERATURE REVIEW
2.1 Introduction
This chapter reviews literature related to strategy management practises. It presents
competitiveness through summary of the information from other researchers who have
previously carried out research on strategy management and completeness. It lays focus on
the theoretical foundation of strategy management practises among the flower farms in
Kenya.
2.2 Strategy Formulation and Competitiveness
Strategy formulation includes defining the corporate mission, specifying achievable
objectives, developing strategies and setting policy guidelines. It is achieved by reviewing
key objectives and strategies of the organization, identifying available alternatives,
evaluating the alternatives and deciding on the most appropriate alternative (Wheelen &
Hunger, 2008). The process of strategy formulation is mainly carried out at three levels,
which include the corporate level, business level and the functional level. The lower level
managers drive the functional strategies, which have short-term horizons and relate to a
functional area (Macmillan & Tampoe, 2000).
Taiwo and Idunnu (2010) examined the impact of strategic planning on organizational
performance and survival. The study evaluated the planning-performance relationship in
organization and the extent to which strategic planning affected performance of First Bank
of Nigeria. The findings indicated that planning enhances better organizational
performance, which in the long term impacts its survival. Bakar et al, (2011) studied the
practice of strategic management in construction companies in Malaysia. The findings of
the research showed that most of the firms practicing strategic management had a clear
objective, a winning strategy to achieve the objective and a sound mission statement to
guide the organization towards success.
Strategy formulation is long range planning and is concerned with developing a
corporation’s mission, vision and policies. A re-examination of an organization’s mission
and objectives must be done before alternative strategies can be generated and evaluated
(Wheelen & Hunger, 2006). Taiwo and Idunnu (2010) examined the impact of strategic
11
planning on organizational performance and survival. The study evaluated the planning-
performance relationship in organization and the extent to which strategic planning affected
performance of First Bank of Nigeria. The findings indicated that planning enhances better
organizational performance which makes it more competitive, which in the long term
impacts its survival. Bakar et al, (2011) studied the practice of strategic management in
construction companies in Malaysia. The findings of the research showed that most of the
firms practicing strategic management had a clear objective, a winning strategy to achieve
the objective and a sound mission statement to guide the organization towards success.
2.2.1 Vision and Mission Statement
A company mission is the unique purpose that sets a company apart from others of its type
and identifies the scope of its operations in product, market and technology terms (Pearce
& Robinson, 2013). It embodies the business philosophy of the firm’s strategic decision
makers, implies the image the firm seeks to project, reflects the firm’s concept and indicates
the firm’s principal product or service that it attempts to satisfy. A mission is a statement
and not a measurable target but of attitude, outlook and orientation. According to Pearce &
Robinson (2013) formulating a business mission is best understood by thinking about the
business at its inception. Typically, it begins with beliefs, desires and aspirations. These
fundamentals are based on the product or service being provided, how production is done
and if it satisfies the consumer’s needs, how the business is managed and grow and the
profitability.
Components of the mission statement are specifications of the basic products and service,
specification of the primary market, and specification of the principal technology for
production or delivery (Pearce & Robinson, 2013). There are three economic goals that
guide the strategic direction of almost every business organization. These are survival,
growth and profitability. A firm is able to survive when it is capable of satisfying the aims
of its stake holders. Profitability is the mainstay goal of any organization and it’s the
clearest indication of a firm’s ability to satisfy the principal claims and desires of employees
and stakeholders. A firm’s growth is tied inextricably to its survival and profitability.
Growth means change and proactive change is essential in a dynamic business environment
(Pearce & Robinson, 2013)
Research according to Pearce & Robinson (2013) shows that there is a new trend when it
comes to mission components; these are sensitivity to customer wants, concern for quality

12
and statements of company vision. “The customer is our top priority” means that the
overriding concern for the company is customer satisfaction. “Quality is job one” indicates
that quality should be the norm. A vision statement presents the firms strategic intend that
focuses the energies and resources of the company on achieving a desirable future.
2.2.2 Environmental Analysis
The existence of political uncertainty is a worldwide phenomenon that affects most national
bond and stock markets (Beaulieu, Cosset & Essadam, 2005). Jorian and Goetzmann (1999)
as mentioned in (Beaulieu et al, 2005) report that activities of political origin have caused
market interruptions in 25 countries including; Chile, France, Germany, Japan and
Portugal. A major consideration for most managers when formulating strategy is the
direction and stability of a nation (Pearce & Robinson, 2009). Pearce and Robinson
maintain that political issues define the legal and regulatory parameters within which firms
must operate. Constraints can be placed on firms through tax programs, anti-trust laws,
minimum wage legislation, pollution and pricing policies. Ireland et al (2013) argue that
regulations formed in response to new laws often influence a firm’s actions.
According to Pearce and Robinson (2008) laws and regulations are commonly restrictive
and they tend to reduce potential profits, despite the fact that some political laws are
designed to benefit and protect firms – such as patent laws, product research grants and
government subsidies. Therefore, in order to deal with the political issues; firms need to
develop a political strategy to influence government policies that affect them (Ireland, et
al, 2013). Furthermore, studies by Ozer, Alakent and Ahsan (2010) indicate that as a result
of a firm’s propensity for political engagement, organizations get involved in corporate
political strategies. In addition; Holburn and Vanden Bergh (2008) say that the need for
firms to have an effective political strategy is heightened by the effects of global
governmental policies on a firm’s competitive position. In 2008, Kenya was confronted
with political unrest which had an effect on the sector for a few weeks. Flowers could only
be exported with difficulty and some farms did not get the flowers out for some days
(Rikken 2011)
In a bid to evade obsolescence and promote innovation, a company must be aware of
technological changes that might influence its industry (Pearce & Robinson, 2008;
Euchner, 2011; Sinha and Noble, 2008). Ireland et al (2013) says that the importance of

13
awareness efforts is supported by the findings that early adopters of technology often
achieve higher market share and earn high returns. It is therefore of paramount importance
to firms to continuously scan their external environment, to identify new emerging
technologies that could give them a competitive edge.
According to Pearce and Robinson (2008) companies operating in turbulent environments
must scan their environments for an understanding both of the existing technological
advances and probable future advances that can affect their products and services. The
importance of technological forecasting cannot be overstated since it can help protect and
improve the profitability of firms in growing markets. The internet is a significant
technological development – with a remarkable capability to provide quick access to
information. Many companies continue to study the opportunities availed by the internet to
be able to create more value for customers and anticipate future trends (Ireland, et al, 2013).
Technological developments have given a competitive advantage. For example, eBay’s
iPhone application is arguably the largest mobile commerce in the world; registering $600
million in volume in 2009 to between $1.5 billion and $2 million in 2010 (Ignatius, 2011).
Societal factors that affect firm operations involve beliefs, attitudes, opinions and lifestyles
of persons in the firm’s external environment (Ireland, et al, 2013; Pearce & Robinson,
2009). The scholars contend that these elements are as a result of cultural, ecological,
demographic, religious and ethnic conditioning. As social attitudes change, the demand for
various products and services also change. Profound social changes in the recent years that
continue to affect firms include: shift in age distribution; accelerating interest of consumers
and employees in quality-of-life issues; and entry of a large number of women to the labor
market (Pearce & Robinson, 2009). The flower industry boasts of employing more women
than men as according to statistics 90% of the employees are women. Pearce and Robinson
(2009) agree that forecasting social changes effects on business can be a daunting task;
however, informed estimates of alterations such as ethical standards, religious orientations,
changing work values- can help a strategizing firm in its attempts to flourish. The
floriculture sectors suffer a lot of societal pressure to employ from the same environment
it’s operating in for the sake of the farms being environmental serving organization.
Economic environment refers to the nature and direction of the economy in which a firm
(Chua & Tsiaplias, 2011; Pearce & Robinson, 2009). Ireland et al (2013) states that firms
generally seek to compete in a relatively stable economy with potential for growth. Because
14
of the changing consumption patterns in the industry, firms must continually consider
economic trends that would affect them (Ireland et al, 2013; Pearce & Robinson, 2009).
Managers should consider the following factors both at national and international level: the
availability of credit, the level of disposable income, the propensity of the people to spend,
inflation rates, trends in the growth of the gross national product.
2.2.3 Strategic Objectives
In order to know how best to compete, one needs to know the way competitors measure
themselves, their strategy to date, their major strengths and weaknesses and likely future
strategy (Wheelen & Hunger, 2006). Other ways are to have competitive personnel, take
part in trade fairs, purchase the competitor's product and take it apart, or indulge in
"espionage". In identifying the competitor's strategy to date, it is not enough to believe what
they say but to reconstruct their strategy. Evaluating resources is difficult. It is essential to
look at their production, marketing, financial and management resources. On the basis of
these first three, it is possible to guess the future. (Porter, 1985)
Ireland et al (2013) says that an industry’s profit potential is determined by the five forces
of competition: the threat posed by new entrants, the bargaining power of suppliers and
customers, product substitutes and the industry of rivalry. The collective strength of these
forces determines the ultimate profit potential in an industry (Porter, 1979).New entrants
to a market pose a threat because they bring new production capacity, the desire to gain
market share and resources (Pearce & Robinson, 2009; Ireland et al, 2013). Porter (2008)
writes that the threat of entry puts a cap on the profit potential of an industry. He maintains
that when the threat is high, the existing companies must hold down their prices or boost
investment to deter new competitors. According to Karake (1997) an industry with above
average rate of entrance in the market is likely to be associated with higher environmental
turbulence. Karake (1997) defines supplier power as the capability of suppliers to bargain
on prices. Karake maintains that an input supplier can raise prices, thereby, leading to
increase in environmental turbulence. Suppliers can exert bargaining power by increasing
prices or reducing quality of goods and services (Porter, 2008; Pearce & Robinson, 2009;
Ireland et al, 2013; Dess, Lumpkin & Eisner, 2008).
Bhattacharyya & Nain (2011) argue that customers bargain for higher quality, greater levels
of service in order to reduce their costs. Pearce & Robinson (2009) argue that consumers
can play competitors against each other by demanding low prices, high quality or more

15
services. According to Ireland et al, (2013) customers are powerful when: they purchase a
large portion of an industry’s output; they could switch to another product at little. Karake
(1997) adds that the more bargaining power customers have the more environmental
turbulence firms’ face.
Porter (2008) defines a substitute as a product or service that performs the same or similar
function as an industry’s product by different means; videoconferencing is a substitute for
travel. Porter maintains that when the threat of substitutes is high industry profitability
suffers and it offers and attractive price-performance trade-off to the industry’s product.
According to Karake (1997) the level of environmental turbulence and uncertainty is also
affected by product substitutes. Karake argues that the arrival of new substitutes into the
market presents new technologies whose prices are likely to decline over the years or
months due to the learning curve thus threatening the survival of existing products Ireland
et al (2013) postulate that actions taken by one firm in an industry invites competitive
responses. Sirmon et al, (2010) argue that companies within an industry are rarely
homogenous since they differ in capabilities and resources as they seek to differentiate
themselves. Porter (2008) in “the five competitive forces that shape strategy” states that
rivalry among existing firms takes forms such as: price discounts, new product
introduction, advertising campaigns and service improvements.
Designing viable strategies for a firm requires a thorough understanding of the firms
industry and competition. Four key areas must be addressed which are boundaries of the
industry, structure of the industry, competitors and the major determinants of the
competitors. Defining industry borders enables the firm to identify its competitors and
producers of substitute products and knowing where the boundaries of the industry begin
and end (Pearce & Robinson, 2013). In order to identify a firm current and potential
competitors firms look at how other firms define the scope of their market, how similar are
the benefits customers derive from their products and services and how committed they are
to the industry. Identifying the competitors is milestone in development of strategies that
help the firm stay on course and on top of their game (Pearce & Robinson, 2013)
2.3 Strategy Implementation and Competitiveness
Short term objective if well-developed provide clarity a powerful motivator and facilitator
of effective strategy implementation. Functional tactics translate business strategy into
daily activities that people need to execute. Outsourcing nonessential functions normally

16
performed in-house frees up resources and time of key people to concentrate on leveraging
the functions and activities critical to the core competitive advantages around which the
firm’s long-range strategy is built. Policies are powerful tools that simplify decision making
by empowering operating managers and their subordinates. Policies can empower the
‘doers’ in an organization by reducing the time required to decide and act. Rewards that
align manager and employee’s priorities with organizational objectives and shareholder
value provide very effective direction in strategy implementation (Pearce & Robinson,
2013)
Short-term objectives are more consistent when they clearly state what is to accomplished,
when is accomplished and how its accomplishment is measured (Pearce & Robinson,
2013). This can be used to monitor both the effectiveness of each activity and the collective
progress across several intended activities. Measurable objectives make misunderstandings
less likely among interdependent mangers who must implement action plans. Although all
objectives are important some deserve more priority because of a timing consideration or
their particular impact on a strategy’s success. If priorities are not established conflicting
assumptions about the relative importance of objectives may inhibit progress toward
strategic effectiveness. The link between short-term and long term objectives should
resemble cascades through the firm from basic long term objectives to specific long term
objectives in key operation areas (David, 2009).
According to Mintzberg and Quins (2004), 90% of well-formulated strategies fail at
implementation stage and only 10% of formulated strategies are successfully implemented.
The successful implementation of strategy is fully dependent on involvement of all the
stakeholders in an organization. Communicating progress of implementing the strategy to
the stakeholders assist them in determining whether corrective action is required (Pearce &
Robinson, 2008). Njagi and Kombo (2014) examined the effect of strategy implementation
on performance of commercial banks in Kenya. Results revealed that there was a strong
relationship between strategy implementation and competitiveness.
2.3.1 Action Planning
Strategies are implemented by everyone in the organization. Implementation involves
establishing programs to create new activities, budgets to allocate funds and procedures to
allocate the day-to-day details (Wheelen & Hunger, 2006). A matrix of change is proposed
17
to help managers decide how quickly change should proceed, in what order changes should
take place and whether the proposed systems are stable and coherent.
According to Pearce and Robinson (2008), a generic strategy is a core idea about how a
firm can best compete in the market place. Lynch (2008) defines generic strategies as the
three fundamental strategies of cost leadership, differentiation and focus. Porter (1980) as
mentioned in Lynch (2008) claimed that there were only three strategies that a business
could undertake. According to Porter (1980) low cost leadership it is a set of actions taken
to produce goods or services that are acceptable to customers due to the uniqueness of low
price charged relative to competitors. Lynch (2008) says that the low cost leader in an
industry has built its structures and operations in a way that deliver the lowest costs in that
market. Lynch maintains that having low costs can create competitive advantage.
Gehlhar et al, (2009) postulate that appropriate process innovations are necessary for
successful use of cost leadership strategy. Ireland et al (2013) argue that firms associated
with low cost strategy normally sell standardized goods or services. Low-cost leaders take
advantage of the economies of scale; they implement cost-cutting techniques, press for
reductions in overhead cost and consequently use volume sales technologies to push them
up in the learning curve (Pearce & Robinson, 2008). Customers with a special sensitivity
for a particular product attribute are commonly targeted with differentiation dependent
strategies (Pearce & Robinson, 2008). Pearce and Robinson maintain that by stressing the
product attribute customer loyalty is built which primarily translates in a firm’s ability to
charge premium prices for its products. Lynch (2008) says that success in this strategy can
be achieved through injection of extra cash to cater for advertising. Firms opt for focus
strategy to utilize their core competencies to serve the needs of a specific niche market
(Ireland et al, 2013).
2.3.2 Coordination of Activities
Wheelen and Hunger, (2006) state that before plans can be lead to actual performance, a
corporation should be appropriately organized, programs should be adequately staffed and
activities should be directed towards achieving the desired objectives. According to Ireland,
Hoskisson and Hitt, (2009) a competitive response is a strategic or tactical action that a
firm takes to counter effects of competitor’s action. Dess et al, (2008) argue that before
initiating a response a firm need to evaluate what the competitor’s action is likely to be.
18
According to Ireland et al, (2009) responses are part of the competitive strategies that an
organization develops in an effort to beat competition.
After formulation, cascading the strategic plan and associated measures can be essential to
everyday implementation. Cascading is often where the implementation breaks down and
it’s a serious problem in implementing strategic measurement systems. A firm should ask
each functional area to identify how they contribute to achieving the overall strategic plan.
Armed with the strategic map, operational definitions and the overall organizational
strategic performance measures, each functional area should create their own map of
success and defines their own specific performance measures. Functional area leaders
would be more successful using a cascade team to add input and take the message forward
to others in the area. Developing ambassadors or process champions throughout the
organization to support and promote the plan and its implementation can also enhance the
chances of success. These champions may be candidates for participation on the design or
cascade teams, and should be involved in the stakeholder review process.
Top management is essential to the effective implementation of strategic change. It
provides a role model for other managers to use in assessing the salient environmental
variables, their relationship to the organization, and the appropriateness of the
organization's response to these variables. Top management shapes the perceived
relationships among organization components and they are largely responsible for the
determination of organization structure (e.g., information flow, decision-making processes,
and job assignments). Management must also recognize the existing organization culture
and learn to work within or change its parameters. The corporate level is responsible for
the design and control of the organization's reward and incentive systems and are involved
in the design of information systems for the organization.
In this role, managers influence the environmental variables most likely to receive attention
in the organization. They must also make certain that information concerning these key
variables is available to affected managers. Top-level managers must also provide accurate
and timely feedback concerning the organization's performance and the performance of
individual business units within the organization. Organization members need information
to maintain a realistic view of their performance, the performance of the organization, and
the organization's relationship to the environment.
19
In value chain analysis, managers divide the activities of their firm into separate activities
that add value. Their firm is viewed as a chain of value-creating activities starting with
procuring raw materials or input and continuing through design, component production,
manufacturing and assembly, distribution, sales, delivery, and support of the ultimate user
of its products or services (Porter, 1985). Each of these activities can add value and each
can be a source of competitive advantage. By identifying and examining these activities,
managers often require an in- depth understanding of their firm’s capabilities, its cost
structure, and how these create competitive advantage or disadvantages, thereby creating
an effective organization. Within each category of primary and support activities, three
activity types play different roles. Direct - activities directly involved in creating value for
the buyer, such as assembly, parts machining, sales force operations, advertising, product
design, recruiting. Indirect: - activities that make it possible to perform direct activities on
a continuing basis, such as maintenance, scheduling operation of facilities, sales force
administration, research administration, and vendor record keeping.
2.3.3 Institutional Alignment
Kaplan and Norton (2006) showed that, to achieve alignment at a strategic level, it is
relevant to “close the loop” and to formulate functional requirements at an operational level
as well. Nourse and Roulac, (1993) incorporated operating decisions in their alignment
framework, e.g. the choice of the location, building size, building character, mechanical
systems and risk management. Many other authors confirmed the need of alignment
between strategies and operating decisions and based their frameworks on that of Nourse
et al. (1993) Strategy implementation involves both operationalization and
institutionalization of strategy. Operationalization is concerned with turning strategic intent
into operational reality. They assert that for strategies to be truly successful, leaders need
to create the conditions that enable the organization to pull itself into an improved future,
a future that not only reflects the strategic intent, but also becomes operational reality. For
this to happen, institutionalization must occur.
Restructuring is a strategy that would enable a firm change its businesses or its financial
structure (Lee & Madhaven, 2010; Bergh & Lim, 2008). Pearce and Robinson (2008)
define restructuring as changing an organizational structure with an intention of
emphasizing and enabling activities most critical to the firm’s strategy to function at
maximum effectiveness. Pearce and Robinson maintain that it is based on the notion that
some activities in a business value chain are more critical to the success of its strategy than
20
others. Managers need to make the strategically critical activities the central building blocks
for designing the organization structure. The types of restructuring that firm’s use include;
downsizing, Business process reengineering, down scoping and leveraged buyouts (Ireland
et al., (2013); Pearce & Robinson, 2008).
Jones & Hill (2013) give the following reasons as to why firms opt for restructuring; a
change in the industry environment that could not have been predetermined; changing
technology that could have rendered the firm’s products obsolete; a firm having excess
capacity because the company’s products or services no longer appeal to customers; some
firms have grown to be tall and less dynamic making bureaucratic costs too high; some
firms restructure even when in a stable condition just to build and improve their
competitiveness and consequently stay ahead of competitors. Business process
reengineering is the fundamental re-thinking and radical redesigning of the business
processes to achieve significant improvement in critical contemporary measures of
performances such as costs, quality, and speed (Hammer & Champy, 1993).
According to Pearce and Robinson (2008) downsizing is doing away with a certain number
of labor force in an organization, particularly middle level management. They further
maintain that globalization of the marketplace, information technology and rivalry in
competition has caused many firms to re-evaluate middle management to ensure that there
was value addition to an organization’s products and services. Research indicates that
downsizing does not necessarily lead to good performance as exemplified by U.S and
Japanese firms (Ireland et al., 2013). Ireland et al., (2013) define down scoping as a means
of eliminating businesses that are unrelated to a firm’s core business. According to Bergh
and Lim (2008) down scoping has a positive impact on the performance of a firm compared
to downsizing; this is because down scoping enables a firm to concentrate on its core
business.
2.4 Strategy Evaluation and Competitiveness
Strategy evaluation done continuously enables a company to bench mark its progress more
effectively. Successful strategies combine patience with willingness to promptly take
corrective actions when necessary. Strategy evaluation should provide a true picture of
what is happening and it should not dominate decisions instead it should foster mutual
understanding, trust and common sense (David, 2009)
21
The strategic management process results in decision that can have significant, long lasting
consequences. Erroneous strategic decisions can inflict severe penalties and can be
exceedingly difficult, if not impossible to reverse. Most strategists agree, therefore that
strategy evaluation is vital to an organization’s wellbeing; timely evaluations can alert
management to problems before a situation becomes critical (David, 2009). Adequate and
timely feedback is the cornerstone of effective strategy evaluation. Strategy evaluating can
be no better than the information on which it is based. According to David (2009) strategy
evaluation can be a complex and sensitive undertaking and thus too much emphasis can be
expensive and counterproductive. Too much evaluation can lead to less control where as
too little can create worse problems and therefore a balance must be maintained Pearce &
Robinson 2013) Strategy evaluation simply put is an appraisal of how well the organization
has performed. Evaluation checks if the productivity has increased, profit margins, earnings
per share and return on investment have gone up and if the firm’s assets have increased
(David, 2009).
David (2009) postulates that a strategy must neither overtax available resources not create
unsolvable problems. The resources of the company are the easiest to quantify and are
normally the first limitation against which strategy is evaluated. Innovative approaches to
financing are possible and devices such as captive subsidiaries sale lease back
arrangements, tying plant mortgages to long term contracts have all been effectively used
to help win key positions in expanding industries. A less quantifiable but more rigid
limitation to strategic choice is that which is imposed by individual and organizational
capabilities. It’s important to examine whether an organization has demonstrated in the past
that it possesses the abilities competences, skills and talents needed to carry out a given
strategy when doing strategy evaluation.
A strategy should not present inconsistent goals and policies. Organizational conflict and
interdepartmental bickering are often symptoms of managerial disorder, but these problems
may also be a sign of strategy inconsistency. According to David (2009) if problems
continue despite changes in personnel and if they tend to be issue-based rather than people
based, if the success for one organizational department means failure for another
department and if policy and issues continue to be brought to the top for resolution then the
strategies may be inconsistent.
22
Consonance is the need for strategists to examine set of trends as well as individual trends
in evaluating strategy. David (2009) notes that a strategy must represent an adaptive
response to the external environment and to the critical changes occurring within it.one
difficult in matching a firms key internal and external factors in the formulation of strategy
is that most trends are the result of interactions among other trends. Although single
economic or demographic trends might appear steady for many years, there are waves of
change going on at the interaction level.
2.4.1 The Balanced Score Card
The balanced scorecard can measure how well an organization is continuously improving
and creating value by motivating employees. The scorecard is persistent on procedures
related to innovation and organizational learning to gauge performance on this dimension
technological leadership, product development cycle times. These measures can be used;
employee capabilities, information system capabilities, motivation, empowerment and
alignment (Pearce & Robinson, 2008). Its management control system that enables
companies to clarify their strategies, translate them into action and provide quantitative
feedback as to whether the strategy is creating or adding value, leveraging core
competences satisfying the company’s customers and generating a financial reward to its
shareholder (Pearce & Robinson, 2008).
In order to achieve optimum success, the balanced scorecard requires comprehension,
support and commitment from the very top of the business down. As the organizational
culture evolves and develops to appreciate the novel approach of employees of the
organization mature within the new culture, the organization will find new things to
measure and monitor progress. Latshaw and Choi (2002) as mentioned in Chavan (2009)
state that organizations have traditionally measured their performance on short-term
financial measures; the balanced scorecard however, extends this to include measures of
performance relating to customer, internal processes and learning and growth needs of their
people.
Chavan (2009) argues that over reliance on financial indicators encourages short-term
behaviour that sacrifices long-term value addition for short-term performance. Brown
(2000) adds that the balanced scorecard has enhanced the traditional financial measures
with lead indicators of future financial performance. According to Hagood and Friedman
23
(2002) a firm can assess its performance in building key competencies needed in terms of
strategy and future survival by focusing on the nonfinancial dimensions. Waal (2003) says
that the purpose of the balanced scorecard is to direct and manage an entire company
towards achieving a shared vision of the future. In accordance with the balanced scorecard
an organization ought to view itself from four perspectives and to develop metrics, collect
data, and analyse it relative to each of these perspectives (Pearce & Robinson, 2008):
The balanced scorecard can measure how well an organization is continuously improving
and creating value by motivating employees. The scorecard is persistent on procedures
related to innovation and organizational learning to gauge performance on this dimension
– technological leadership, product development cycle times. These measures can be used;
employee capabilities, information system capabilities, motivation, empowerment and
alignment (Pearce & Robinson, 2008).
Effective execution and internal business processes are monitored and measured by
productivity, cycle time, quality measures, downtime and various cost measures, among
others (Capon, 2008). The customer perspective; this will measure and determine the
satisfaction of the customers. A perspective of customer satisfaction typically adds
measures related to defect levels, on time deliver, warranty support and product
development. A company can use the following metrics; image/reputation, product/service
attributes and customer relationships (Capon, 2008).
According to Pearce & Robinson (2008) a financial perspective typically uses measures
like cash flow, return on equity, sales and income growth. The following measures can be
used; return on capital, improved shareholder value and asset utilization. Pearce &
Robinson (2008) maintain that an integration of goals through the above mentioned
perspectives, the balanced score card approach enables the strategy of the business to be
linked with shareholder value creation while providing several measurable short term
outcomes that guide and monitor strategy implementation.
2.4.2 Auditing
Auditing is a systematic process of objectively obtaining and evaluating evidence regarding
assertions about actions and events to ascertain the degree of correspondence between those
assertions and established criteria, and communications and results to interested users
(David, 2009). Performance indicators are critical as they if a strategy is working or not

24
working and what kind of effects it has. High-priority items in the strategic plan are not
being accomplished. Audits help to fine-tune a successful strategy and to ensure that a
strategy that has worked in the past continues to be in tune with subtle internal or external
changes that may have occurred.
Audits can be undertaken by internal or external staff. Where audits are undertaken
internally, it is customary for auditors to not have a direct interest in the process being
audited, in order to demonstrate the credibility of the audit. Internal auditors can be valuable
because they can be expected to know the intricacies of an organisation's operations.
However, internal auditors usually do not have the benefit of the credibility that totally
independent external auditors can bring. External auditors have the advantage of having no
interest in the outcome of an audit beyond their own credibility and the fees earned (Pearce
& Robinson, 2009). Consequently, external auditors tend to have greater veracity than
internal ones. Another point in external auditors' favour is that auditing is a skill, and the
best auditors are highly trained and very experienced. This kind of expertise may not be
held by internal staff unless those staff members are specially recruited for their auditing
skills.
Audit making plans is a hard undertaking as it has two conflicting problems: maximizing
audit advantages, and minimizing audit costs. Maximizing audit advantages is described
by the ways that auditors come across fraud or blunders. Minimizing audit fee refers to
topics decided on a manner that resources needed to be utilised (Bonchi et al. 1999). The
audit planning is designed to permit the auditors to carry out an enterprise hazard evaluation
and broaden a particular audit program and scope to test in the audit tactics. The four
additives of strategic audit making plans are internal system evaluation, commercial
enterprise risk evaluation, fraud hazard analysis, and technology depth.
Auditor judgment changes over the years and it is not a comparable uniformly amongst
companies (Robert & Randal, 2005). Consequently, auditor must give attention to audit
making plans judgment. Particularly, client's internal control may influence audit
judgments greater in dynamic environments and while inner control tests are elicited
explicitly (Kaplan, 1985). Further, the auditors should take advantage of a deep information
of the customer's accounting with a view to use professional judgment to plot and to
enhance an audit technique, especially, to save or discover any miss-statements within the
monetary statements (Ritchie & Khorwatt, 2007). Moreover, auditor’s recognition on
25
business danger assessment, lessen degrees of risks, especially when it comes to great
judgments and estimates (Curtis & Turley, 2007) however, the scope of the planning and
danger evaluation tactics are modified by means of the innovation. Business chance
evaluation is viable to enhance the audit effectiveness (Curtis & Turley, 2007). Specially,
firms that have riskier (fraud chance) need to lease auditors that have better judgments (Lee
et al., 2003). Therefore, auditors have to use audit technologies, to enable efficient and
powerful audits (Dowling & Leech, 2007).
Moreover, Doyle et al., (2007) indicated that firms with weak inner controls are much more
likely smaller, more youthful, financially weaker, or presently undergoing restructuring.
Therefore, the auditor ought to give attention to internal problem to set audit plans to
advantage the audit quality. Consequently, auditors have carried out a threat-primarily
based audit approach which assesses the threat of the fabric mis-statements inside the
economic declaration (Ritchie & Khorwatt, 2007). However, auditor should put more
attention to fraudulent financial reporting and internal control system; Therefore, auditor
should completely evaluate the internal control system and fraud risk activities to better
gain quality audit (Knechel, 2007).
Steady with Lee et al. (2003) recommended that the distinction of audit nice will rely on
the audited fraud financial information. To benefit high-quality audit, auditor must recall
the use of the right technology that provides automate choice guide which no longer only
enhances the quality via compliance with auditing standards and audit technique, but
additionally will increase audit performance, controls junior staff, improve risk control, and
decrease choice time in every audit engagement. (Dowling & Leech, 2007) therefore,
auditors have to hire appropriate layout of the audit support machine due to the fact it can
have an effect on auditor choice satisfactory (O'Donnell & Schultz's, 2003) together with
Strategic-systems Auditing (SSA) that auditors try to employ to enhance audit first-rate
(Peecher et al, 2007)
2.4.3 Measuring Organizational Performance
Corporation’s overall performance is the procedure to determine both the effectiveness of
a corporation and the proper-being of its member through planned interventions.
Organizational improvement result in organizational performance (Jon & Randy, 2009).
Organizational performance become relating to the real output or outcomes of an
26
organization as measured towards its meant outputs, goals and objective. There are various
sorts of organizational performance measures, first human resource capability, second
organizational outcomes, third financial accounting outcome, and ultimately capital market
consequences (Jon & Randy, 2009). Human resource consequences related to exchange in
worker behaviour which blanketed worker pride, turn over and absenteeism. Organizational
consequences comprise labour productiveness, patron pride, and excellent of product
services. Economic accounting outcomes blanketed three measures consisting of returns on
property, equity and profitability (Khandekar & Sharma, 2006).
Capital market effects mirror how market evaluates a business enterprise which consists of
the inventory fee, increase rate of inventory rate and market returns (Dyer & Reeves, 1995).
Organizational performance basically may be defined as the final results that imply or
mirror the enterprise efficiencies or inefficiencies in time period of corporate photograph,
abilities and monetary performance (Khandekar & Sharma, 2006). Paintings overall
performance is the manner employee perform their work. An employee’s performance is
decided at some stage in process overall performance assessment, with an organisation
taking into consideration element together with leadership talents and productivity to
investigate every worker on a person foundation. Job overall performance critiques are
often achieved yearly and might decide improve eligibility, whether an worker is right for
the opportunity or even if a worker must be fired (Rowold, 2011).
There were such a lot of methods to assess worker overall work performance. In Khandekar
and Sharma (2006) step with Rowold (2011) high performance work culture and practices
have need diagnosed as having a key role inside the achievement of business mission and
improved organizational effectiveness. Even as there is no agreement on a great
configuration or bundle of such structures and practises. The logic is that high performance
structures influence and align employee’s attitude and behaviours with strategic aim of the
corporation and they increase worker commitment and sooner or later organizational
overall performance. Campbell (1990) as cited in Xinyan, Jianqiao, and Degen (2010)
proposes that work overall performance comprises not only challenge but additionally
contextual factors together with interpersonal and motivational additives that make a
contribution to a dimensional performance construct.
Schermerhom et al, (2005) says that overall performance appraisal is a method of
systematically evaluating overall performance and presenting comments on which
27
performance adjustments can be made. From an assessment angle, performance appraisal
could recognise people relative to objectives and fashionable. As such, overall performance
appraisal is an enter to choices that allocated rewards and otherwise administer the
company’s personnel factions. From a counselling angle, overall performance appraisal
helps imposing decisions relating to making plans for and gaining dedication to the
continued training and personal improvement of subordinates. Enterprise performance is
historically associated with increasing shareholder value. Overall performance can,
however, also be measured in phrases of reduction environmental footprint, improved
occupational health and safety performance, boom consumer delight.
In keeping with Sriwan (2004) company overall performance ought to be judged in
opposition to a specific objective to peer whether the goal is carried out. Without an
objective, the agency has no criterion for deciding on amongst alternative investment
techniques and projects. As an instance, if the objective of the business enterprise is to
maximise its return on investment, the employer might try and achieve via adopting
investments with return on funding ratios acquire than the employer’s cutting-edge
common return on investment ratio. However, if the objective of the business enterprise
has been to maximise its accounting income, the company might undertake any investment,
which could offer a tremendous accounting income, even though the organisation might
decrease its current common go back on funding ratio. Performance dimension is
importance for preserving a business enterprise on the right track in achieving its goals.
The process of organisation performance includes comparing expected results to actual
results, investigating deviations from plans, evaluating individual performance and
examining progress being observed towards meeting stated objectives. David (2009) notes
that both long term and annual objectives are used in this process. Criteria for evaluating
strategies should be measurable and easily quantifiable. Criteria that predicts results may
be more important than those that reveal what already has happened. Evaluation is based
on both quantitative and qualitative methods and selecting the exact set of criteria used
depends on a particular organizations size, industry, management and management
philosophy.
Quantitative evaluation is commonly used to evaluate strategies on financial ratios which
strategists use to make three critical comparisons that is the firm’s performance over
different periods, performance compared to competitors and comparing performance to
28
industry averages (David, 2009). Qualitative criteria is used to evaluate human factors such
as absenteeism, turnover rates, poor production quality and quantity rates etc.
2.5 Chapter Summary
This chapter reviewed the literature related to strategy management practices. It presents
empirical literature relating to strategy management practices and competitiveness from
other researchers who have previously carried out research on strategy management and
competitiveness. The next chapter, chapter three, focuses on the research methodology.
29
CHAPTER THREE
3.0 RESEARCH METHODOLOGY
3.1 Introduction
The ensuing chapter focuses on the research methodology employed. It outlines the various
stages and phases that were adopted for successful completion of the study. It describes the
research design used and justifies why it was used, the type of data collected, how the data
was obtained, the choice of interviewees and the data analysis method utilized in the study.
This chapter comprises of the following subsections; research design, data collection and
data analysis.
3.2 Research Design
Research design is the determination and statement of the general research approach or
strategy adopted of the particular project (Cooper & Schindler, 2008). It is the heart of
planning. If the design adheres to the research objective, it ensures that the client’s needs
is served. Research design typically include how data is to be collected, what instruments
employed, how the instruments are used and the intended means for analyzing data
collected (Bryman, 2006).
A cross sectional type of descriptive survey design was utilized in conducting this study. A
cross section study takes a snapshot of a population at a certain time, allowing conclusions
about phenomena across a wide population to be drawn (Bryan & Bell, 2001). This allowed
the researcher to focus on the population groups therefore understanding the wider picture.
The descriptive research design addresses the questions posed by exploratory research
offering solutions to different business issues (Shajahan, 2008). The design was preferred
because it involves answering questions such as who, how, what, which, when and how
much (Cooper & Schindler, 2008).
3.3 Population and Sampling Design
3.3.1 Population
A population is the total of all the individuals who have certain characteristics and are of
interest to a researcher, according to (Schindler, 2000). Schindler further states that the
basic idea behind sampling is that by doing so, a researcher is able to draw a conclusion
about the entire population. A large set of observation can be termed as a population while
30
a subset of the same can be termed as a sample. Population is the total collection of
elements with common observable characteristics about which some inferences can be
made (Mugenda & Mugenda, 1999). KFC (2014) lists 21 registered flower farms in
Kiambu County. This formed the study population from which a convenient sample was
taken based on the sampling design in order to represent the rest of the floricultural farms
in Kenya. The study proposed to survey the Farm Management Level of the sampled
organizations, as they were key decision makers in order to get the general behaviour
factors that influence strategic management in the floriculture sector.
3.3.2 Sampling Design
3.3.2.1 Sampling Frame
A sample is a group of respondents, cases or records comprising of part of the entire study
population that is empirically selected to represent the study population, a good sample
must be accurate, precise, and representative of the total population (Schindler, 2000). A
sample frame is a list of elements from which the sample is actually drawn and is closely
related to the population (Cooper & Schindler, 2008). The list could be of geographical
areas, institutions, individuals, or other units (Gill & Johnson, 2002). In this study, the
sampling frame was obtained from Kiambu County which is the home to many of the
floricultural industries and its proximity to the capital city.
3.3.2.2 Sampling Technique
A sampling technique is the name or other identification of the specific process by which
the entities of the sample have been selected (Wolcott, 1997). Non-probability sampling,
specifically Judgment and Convenience was applicable in the sample selection. Judgment
sampling refers to selection of a sample based on the fact that it conforms to some criteria.
On the other hand, convenience sampling is unrestricted, meaning the survey is conducted
to whoever is available or where samples are selected because they are accessible to the
researcher (Cooper & Schindler, 2008). The two sampling techniques ensured the selection
of representative respondents with the requisite information to address the specific research
questions thereby enhancing the credibility and reliability of the findings of this study.
This study was carried out with the use of a census survey. A census is a count of all the
elements of a population (Cooper & Schindler, 2008). They further explain that the
advantages of sampling over a census study were less compelling when the population is
31
small and the elements being studied are quite different from each other. There are 21
flower firms in Kiambu County and with this small population then a census was more
appropriate to conduct the study.
3.3.2.3 Sampling Size
A sample is a finite part of a statistical population whose properties are to be studied to gain
information about the whole population (Jankowcz, 2002). Cooper and Schindler (2008)
argue that a sample size is the set of elements from which data is collected. A good sample
size should provide information that is detailed and comprehensive. Researchers rarely
survey the entire population for two reasons (Jackson, Thorpe & Smith, 2009); the cost was
too high and the population was dynamic in that the individuals making up the population
may change over time. A census survey of three managers in each of the 21 firms was done
owing to the small number of elements in the population.
3.4 Data Collection Methods
Data collection is the process of gathering and measuring information on targeted variables
in an established systematic fashion, which then enables one to answer relevant questions
and evaluate outcomes (Cooper & Schindler, 2008). The methods of data collection are
primary data and secondary data collection. Primary data refers to the collection of data
that is unique to the specific research and that has never been used by others before. There
are different ways to collect primary data and some of the more common ones are through
interviews, questionnaires, and case-studies (Saunders, Lewis & Thornhill, 2006).
Secondary data is the term used for data that has already been collected for a specific
purpose and then is used again during other circumstances for other reasons (Saunders et
al., 2006).
The main primary data collection instrument was the survey questionnaire (Bowling, 2005).
Modes of data collection by questionnaire differ in several ways, including the method of
contacting respondents, how to deliver the questionnaire to respondents, and the
administration of the questions. These are likely to have different effects on the quality of
the data collected (Bowling, 2005). A questionnaire is a document designed with the
purpose of seeking specific information from the respondents (Sansoni, 2011). Cooper and
Schindler (2008) stated that a questionnaire is an instrument delivered by to the participant
via personal or non-personal means that is completed by the participant.

32
The questionnaires contained both open ended as well as closed ended questions. Cooper
and Schindler (2008) explain that questions may be structured in questionnaires therefore
presenting participants with a fixed set of choices; often called closed questions. On the
other hand questions can also be unstructured therefore not limiting the responses but still
providing a frame of reference for participants" answers; often called open ended questions
(Cooper & Schindler, 2008). Primary data collection was used for this study and data was
collected with the help of a questionnaire, which were administered using drop, and pick
and email to the populations.
3.5 Research Procedures
Research procedure are the steps that this research was set to follow. It is recommended in
the research discipline Collins and Hussey (2003) that a pilot study be conducted as a trial
run through to provide feedback on the phraseology, focus, clarity and intelligibility of the
questions to the respondents. A draft research questionnaire based on the research
objectives and the pilot study was conducted on randomly selected subsets of the original
population. Mugenda and Mugenda (2003) suggest that pre-testing allows errors to be
discovered and acts as a tool for training a research team before the actual collection of data
begins. The pilot study included information from the draft questionnaire on how easy the
questions were understood and how long it took to complete the questionnaire. This was
done to ensure data effectiveness and hence validity of the instrument used before being
administered. A refined questionnaire was then sent out after completion of the pre-test. A
cover letter was attached to the questionnaire to state the purpose of the study and to ensure
the various guidelines were met. Questionnaires were administered by hand delivery and
respondents were given a week period for completion of the questionnaire.
3.6 Data Analysis Methods
Data analysis is a research technique for the objective, systematic and qualitative
description of the manifest content of a communication (Cooper & Schindler, 2008).
According to Collins and Hussey (2006), descriptive statistics involves a process of
transforming a mass of raw data into tables, charts, with frequency distribution and
percentages, which are a vital part of making sense of data. Data was coded with regard to
the variables of the study for ease of data entry and interpretation. The descriptive statistical
tool such as Statistical Package for Social Sciences (SPSS), and excel were utilized to
analyze the data.
33
The quantitative data collected and analyzed were presented through percentages, means,
standard deviations, and frequencies. Inferential statistics was employed through the use of
ANOVA and regression analysis where; a regression analysis was carried out between the
dependent variables against all the independent variables. The information was displayed
in the form of tables for ease of comprehension and analysis.
3.7 Chapter Summary
This chapter gives insight into how the study was conducted. The research design used was
a descriptive design. The researcher discussed in detail; the research design, the population
and sampling design, research procedures, data collection methods and data analysis.
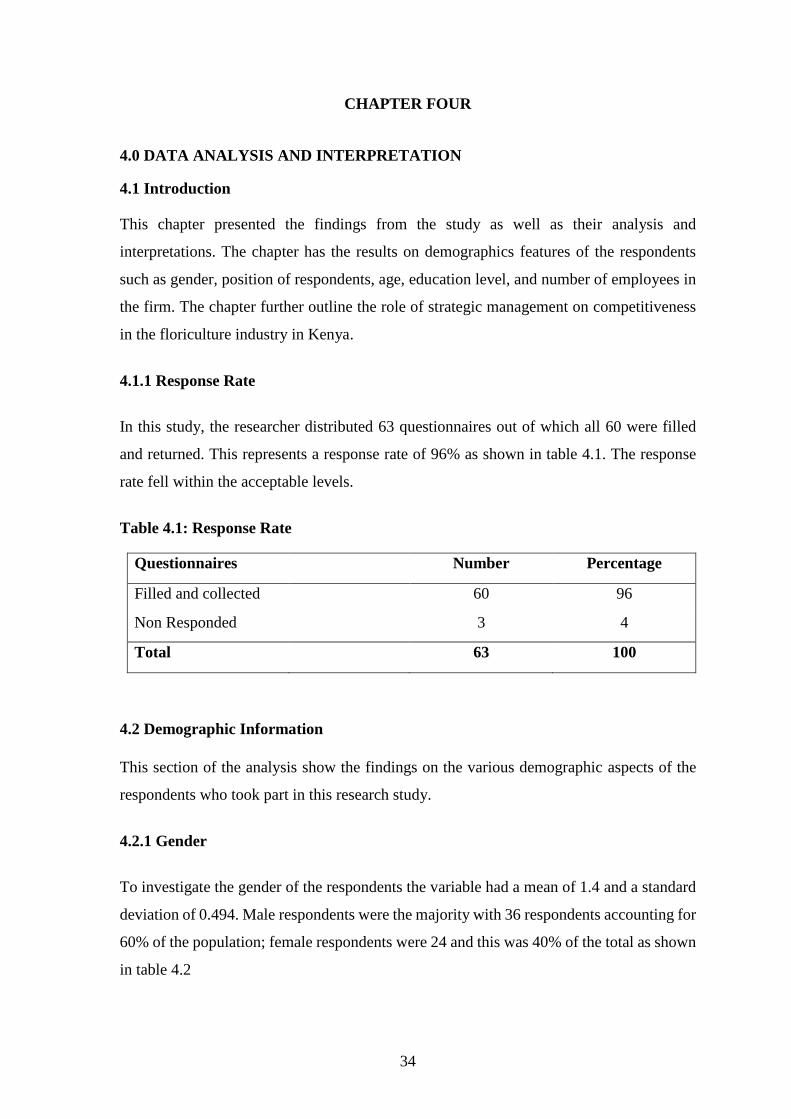
34
CHAPTER FOUR
4.0 DATA ANALYSIS AND INTERPRETATION
4.1 Introduction
This chapter presented the findings from the study as well as their analysis and
interpretations. The chapter has the results on demographics features of the respondents
such as gender, position of respondents, age, education level, and number of employees in
the firm. The chapter further outline the role of strategic management on competitiveness
in the floriculture industry in Kenya.
4.1.1 Response Rate
In this study, the researcher distributed 63 questionnaires out of which all 60 were filled
and returned. This represents a response rate of 96% as shown in table 4.1. The response
rate fell within the acceptable levels.
Table 4.1: Response Rate
Questionnaires Number Percentage
Filled and collected 60 96
Non Responded 3 4
Total 63 100
4.2 Demographic Information
This section of the analysis show the findings on the various demographic aspects of the
respondents who took part in this research study.
4.2.1 Gender
To investigate the gender of the respondents the variable had a mean of 1.4 and a standard
deviation of 0.494. Male respondents were the majority with 36 respondents accounting for
60% of the population; female respondents were 24 and this was 40% of the total as shown
in table 4.2
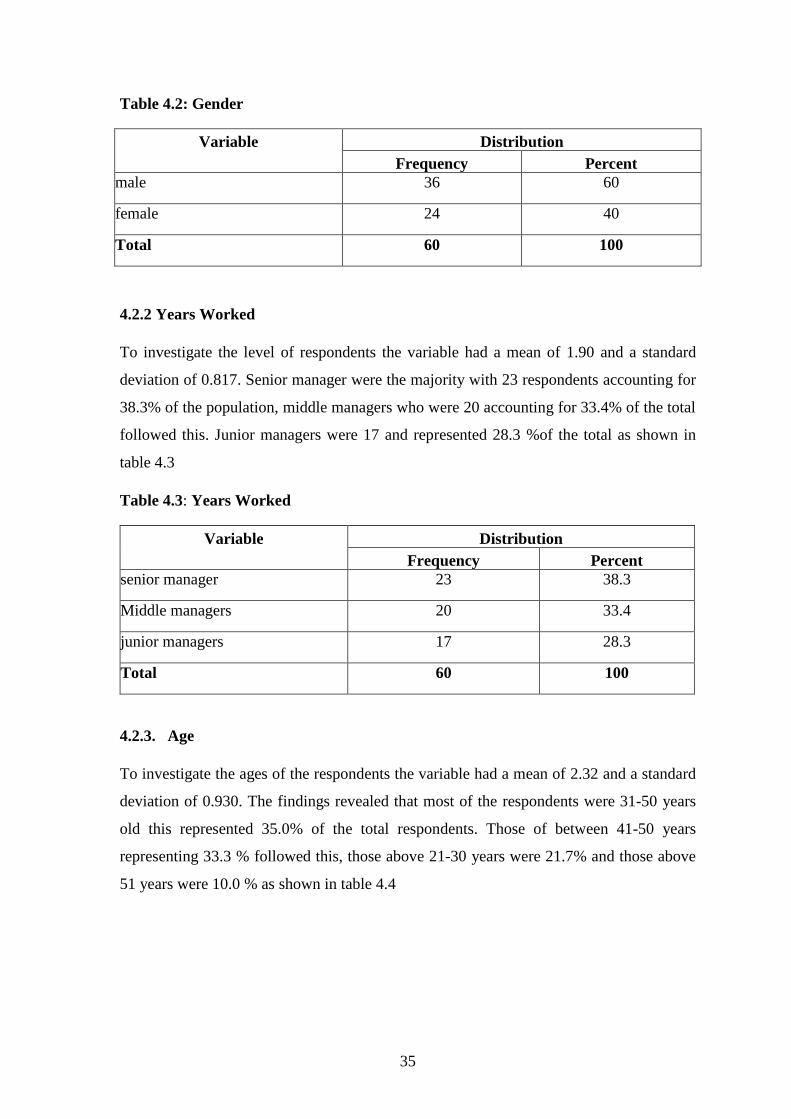
35
Table 4.2: Gender
Variable Distribution
Frequency Percent
male 36 60
female 24 40
Total 60 100
4.2.2 Years Worked
To investigate the level of respondents the variable had a mean of 1.90 and a standard
deviation of 0.817. Senior manager were the majority with 23 respondents accounting for
38.3% of the population, middle managers who were 20 accounting for 33.4% of the total
followed this. Junior managers were 17 and represented 28.3 %of the total as shown in
table 4.3
Table 4.3: Years Worked
Variable Distribution
Frequency Percent
senior manager 23 38.3
Middle managers 20 33.4
junior managers 17 28.3
Total 60 100
4.2.3. Age
To investigate the ages of the respondents the variable had a mean of 2.32 and a standard
deviation of 0.930. The findings revealed that most of the respondents were 31-50 years
old this represented 35.0% of the total respondents. Those of between 41-50 years
representing 33.3 % followed this, those above 21-30 years were 21.7% and those above
51 years were 10.0 % as shown in table 4.4
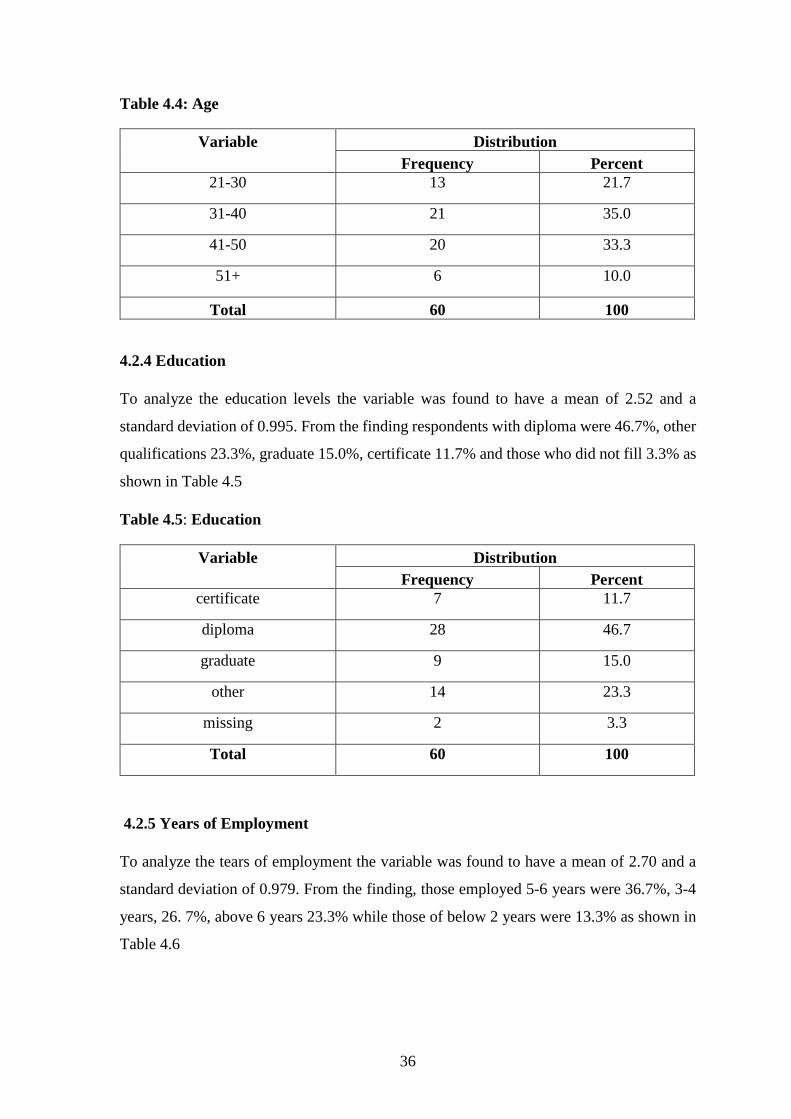
36
Table 4.4: Age
Variable
Distribution
Frequency Percent
21-30 13 21.7
31-40 21 35.0
41-50 20 33.3
51+ 6 10.0
Total 60 100
4.2.4 Education
To analyze the education levels the variable was found to have a mean of 2.52 and a
standard deviation of 0.995. From the finding respondents with diploma were 46.7%, other
qualifications 23.3%, graduate 15.0%, certificate 11.7% and those who did not fill 3.3% as
shown in Table 4.5
Table 4.5: Education
Variable Distribution
Frequency Percent
certificate 7 11.7
diploma 28 46.7
graduate 9 15.0
other 14 23.3
missing 2 3.3
Total 60 100
4.2.5 Years of Employment
To analyze the tears of employment the variable was found to have a mean of 2.70 and a
standard deviation of 0.979. From the finding, those employed 5-6 years were 36.7%, 3-4
years, 26. 7%, above 6 years 23.3% while those of below 2 years were 13.3% as shown in
Table 4.6
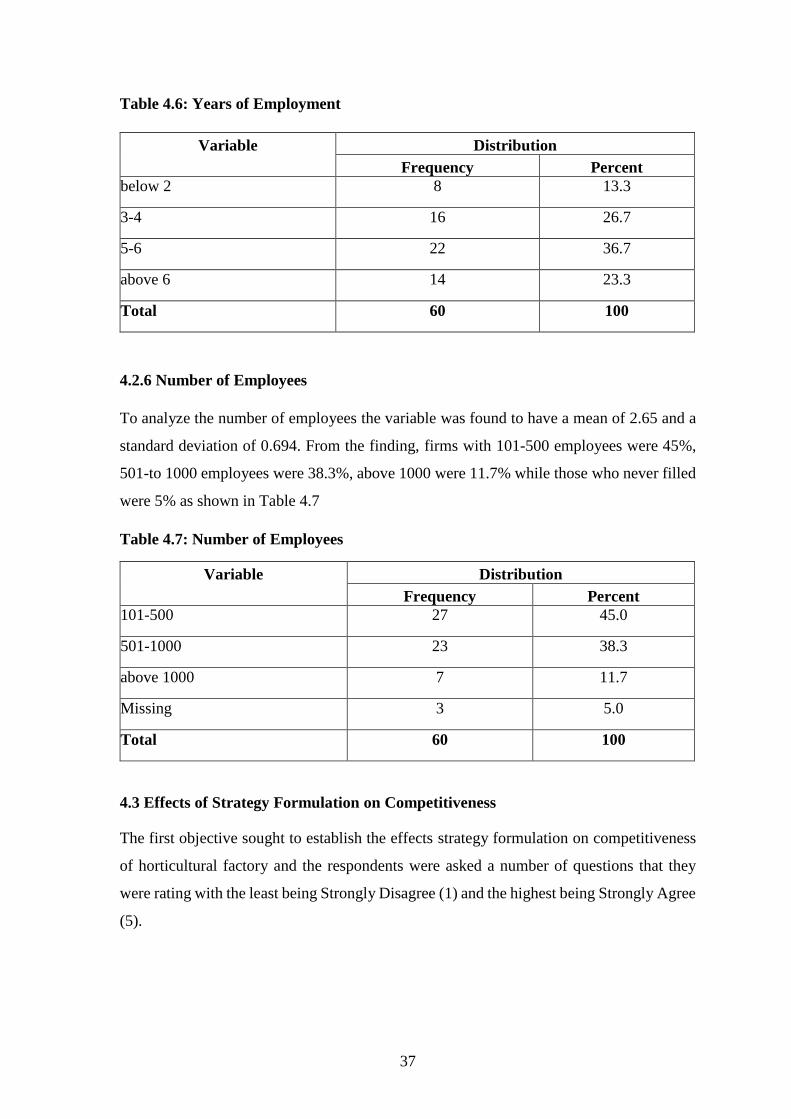
37
Table 4.6: Years of Employment
Variable Distribution
Frequency Percent
below 2 8 13.3
3-4 16 26.7
5-6 22 36.7
above 6 14 23.3
Total 60 100
4.2.6 Number of Employees
To analyze the number of employees the variable was found to have a mean of 2.65 and a
standard deviation of 0.694. From the finding, firms with 101-500 employees were 45%,
501-to 1000 employees were 38.3%, above 1000 were 11.7% while those who never filled
were 5% as shown in Table 4.7
Table 4.7: Number of Employees
Variable Distribution
Frequency Percent
101-500 27 45.0
501-1000 23 38.3
above 1000 7 11.7
Missing 3 5.0
Total 60 100
4.3 Effects of Strategy Formulation on Competitiveness
The first objective sought to establish the effects strategy formulation on competitiveness
of horticultural factory and the respondents were asked a number of questions that they
were rating with the least being Strongly Disagree (1) and the highest being Strongly Agree
(5).
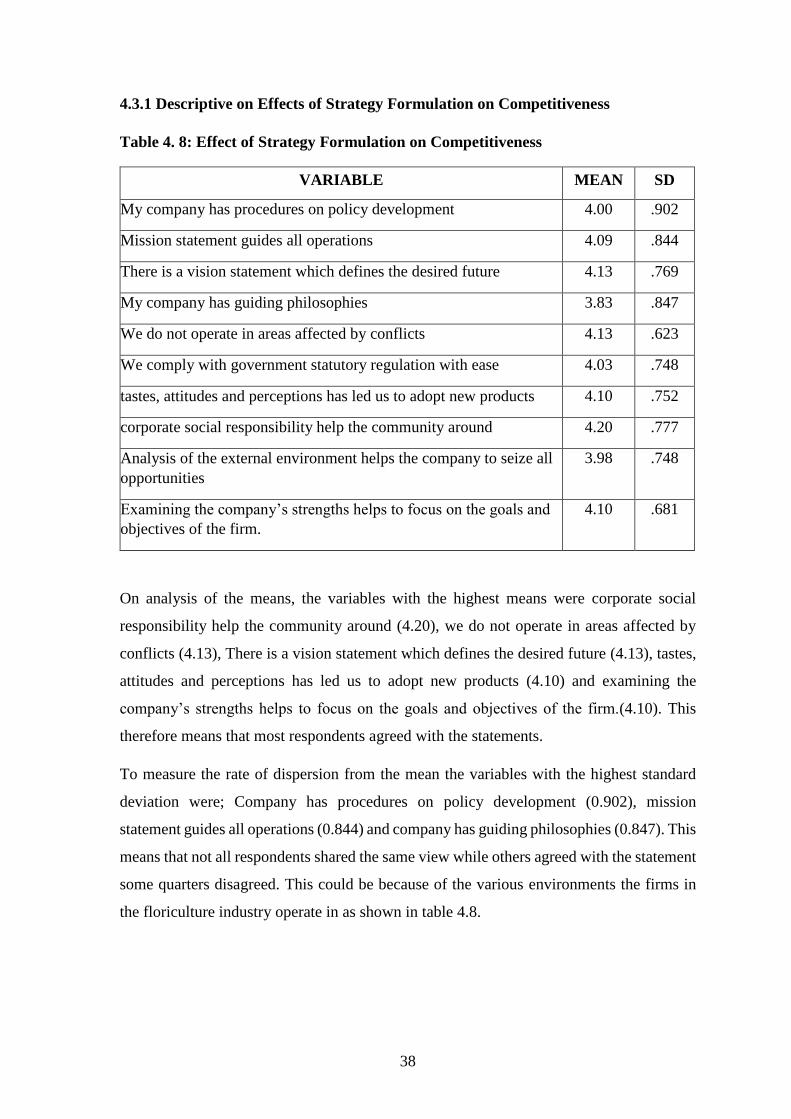
38
4.3.1 Descriptive on Effects of Strategy Formulation on Competitiveness
Table 4. 8: Effect of Strategy Formulation on Competitiveness
VARIABLE MEAN SD
My company has procedures on policy development 4.00 .902
Mission statement guides all operations 4.09 .844
There is a vision statement which defines the desired future 4.13 .769
My company has guiding philosophies 3.83 .847
We do not operate in areas affected by conflicts 4.13 .623
We comply with government statutory regulation with ease 4.03 .748
tastes, attitudes and perceptions has led us to adopt new products 4.10 .752
corporate social responsibility help the community around 4.20 .777
Analysis of the external environment helps the company to seize all
opportunities
3.98 .748
Examining the company’s strengths helps to focus on the goals and
objectives of the firm.
4.10 .681
On analysis of the means, the variables with the highest means were corporate social
responsibility help the community around (4.20), we do not operate in areas affected by
conflicts (4.13), There is a vision statement which defines the desired future (4.13), tastes,
attitudes and perceptions has led us to adopt new products (4.10) and examining the
company’s strengths helps to focus on the goals and objectives of the firm.(4.10). This
therefore means that most respondents agreed with the statements.
To measure the rate of dispersion from the mean the variables with the highest standard
deviation were; Company has procedures on policy development (0.902), mission
statement guides all operations (0.844) and company has guiding philosophies (0.847). This
means that not all respondents shared the same view while others agreed with the statement
some quarters disagreed. This could be because of the various environments the firms in
the floriculture industry operate in as shown in table 4.8.
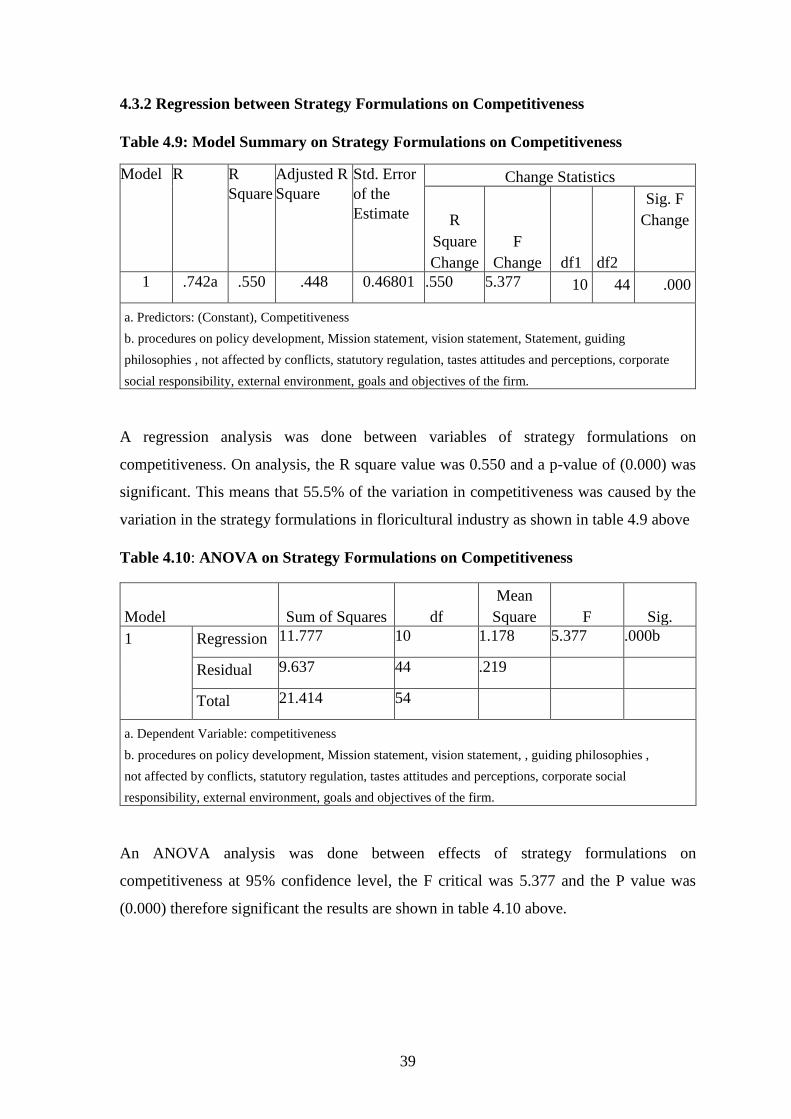
39
4.3.2 Regression between Strategy Formulations on Competitiveness
Table 4.9: Model Summary on Strategy Formulations on Competitiveness
Model
R
R
Square
Adjusted R
Square
Std. Error
of the
Estimate
Change Statistics
R
Square
Change
F
Change df1
df2
Sig. F
Change
1 .742a .550 .448 0.46801 .550 5.377 10 44 .000
a. Predictors: (Constant), Competitiveness
b. procedures on policy development, Mission statement, vision statement, Statement, guiding
philosophies , not affected by conflicts, statutory regulation, tastes attitudes and perceptions, corporate
social responsibility, external environment, goals and objectives of the firm.
A regression analysis was done between variables of strategy formulations on
competitiveness. On analysis, the R square value was 0.550 and a p-value of (0.000) was
significant. This means that 55.5% of the variation in competitiveness was caused by the
variation in the strategy formulations in floricultural industry as shown in table 4.9 above
Table 4.10: ANOVA on Strategy Formulations on Competitiveness
Model Sum of Squares df
Mean
Square F Sig.
1 Regression 11.777 10 1.178 5.377 .000b
Residual 9.637 44 .219
Total 21.414 54
a. Dependent Variable: competitiveness
b. procedures on policy development, Mission statement, vision statement, , guiding philosophies ,
not affected by conflicts, statutory regulation, tastes attitudes and perceptions, corporate social
responsibility, external environment, goals and objectives of the firm.
An ANOVA analysis was done between effects of strategy formulations on
competitiveness at 95% confidence level, the F critical was 5.377 and the P value was
(0.000) therefore significant the results are shown in table 4.10 above.
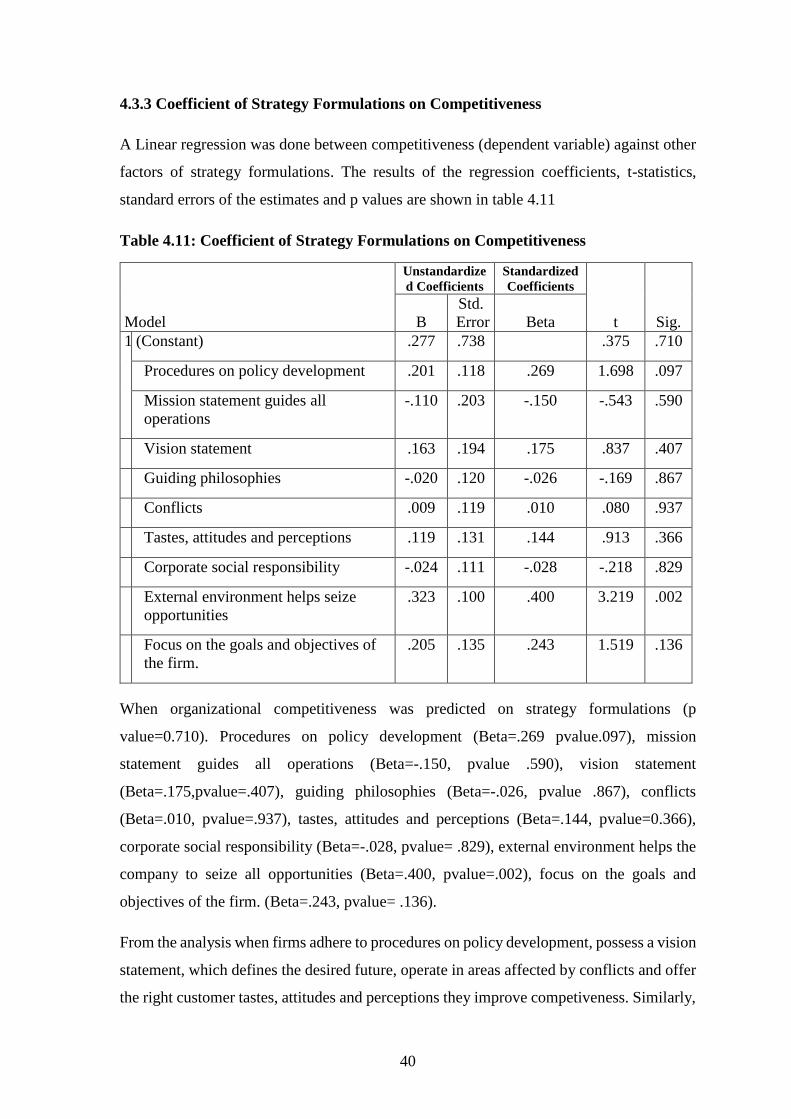
40
4.3.3 Coefficient of Strategy Formulations on Competitiveness
A Linear regression was done between competitiveness (dependent variable) against other
factors of strategy formulations. The results of the regression coefficients, t-statistics,
standard errors of the estimates and p values are shown in table 4.11
Table 4.11: Coefficient of Strategy Formulations on Competitiveness
Model
Unstandardize
d Coefficients
Standardized
Coefficients
t Sig. B
Std.
Error Beta
1 (Constant) .277 .738 .375 .710
Procedures on policy development .201 .118 .269 1.698 .097
Mission statement guides all
operations
-.110 .203 -.150 -.543 .590
Vision statement .163 .194 .175 .837 .407
Guiding philosophies -.020 .120 -.026 -.169 .867
Conflicts .009 .119 .010 .080 .937
Tastes, attitudes and perceptions .119 .131 .144 .913 .366
Corporate social responsibility -.024 .111 -.028 -.218 .829
External environment helps seize
opportunities
.323 .100 .400 3.219 .002
Focus on the goals and objectives of
the firm.
.205 .135 .243 1.519 .136
When organizational competitiveness was predicted on strategy formulations (p
value=0.710). Procedures on policy development (Beta=.269 pvalue.097), mission
statement guides all operations (Beta=-.150, pvalue .590), vision statement
(Beta=.175,pvalue=.407), guiding philosophies (Beta=-.026, pvalue .867), conflicts
(Beta=.010, pvalue=.937), tastes, attitudes and perceptions (Beta=.144, pvalue=0.366),
corporate social responsibility (Beta=-.028, pvalue= .829), external environment helps the
company to seize all opportunities (Beta=.400, pvalue=.002), focus on the goals and
objectives of the firm. (Beta=.243, pvalue= .136).
From the analysis when firms adhere to procedures on policy development, possess a vision
statement, which defines the desired future, operate in areas affected by conflicts and offer
the right customer tastes, attitudes and perceptions they improve competiveness. Similarly,
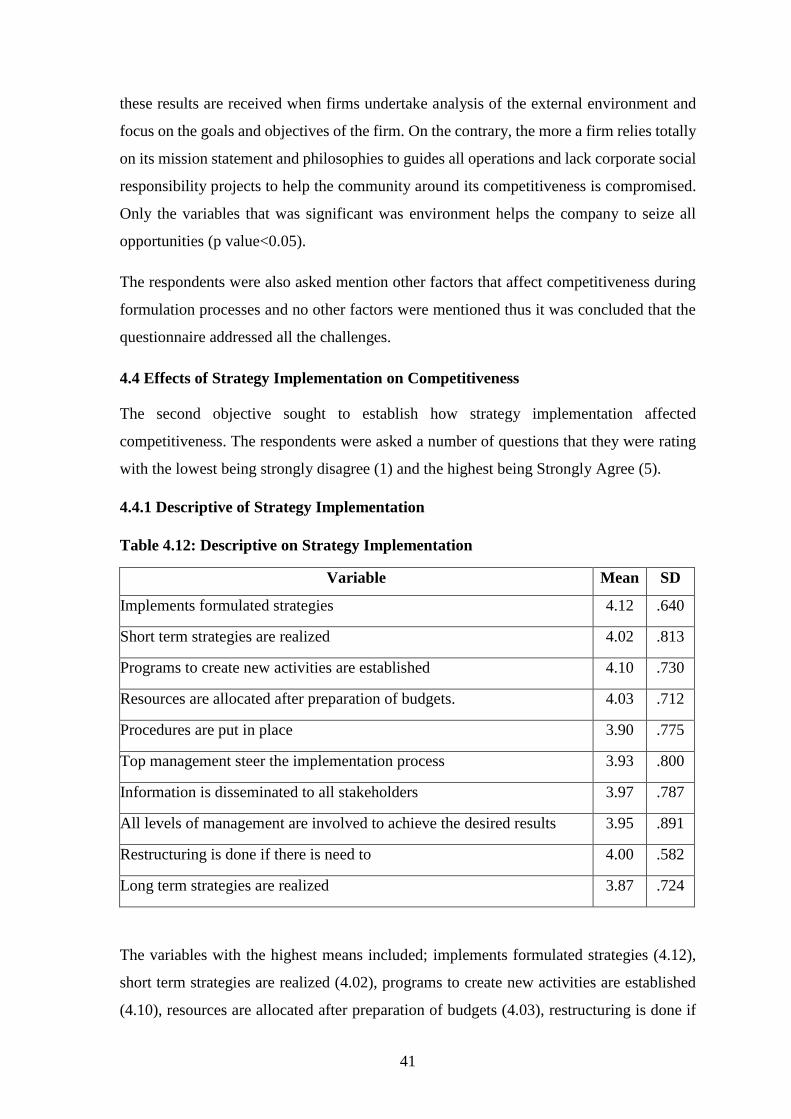
41
these results are received when firms undertake analysis of the external environment and
focus on the goals and objectives of the firm. On the contrary, the more a firm relies totally
on its mission statement and philosophies to guides all operations and lack corporate social
responsibility projects to help the community around its competitiveness is compromised.
Only the variables that was significant was environment helps the company to seize all
opportunities (p value<0.05).
The respondents were also asked mention other factors that affect competitiveness during
formulation processes and no other factors were mentioned thus it was concluded that the
questionnaire addressed all the challenges.
4.4 Effects of Strategy Implementation on Competitiveness
The second objective sought to establish how strategy implementation affected
competitiveness. The respondents were asked a number of questions that they were rating
with the lowest being strongly disagree (1) and the highest being Strongly Agree (5).
4.4.1 Descriptive of Strategy Implementation
Table 4.12: Descriptive on Strategy Implementation
Variable Mean SD
Implements formulated strategies 4.12 .640
Short term strategies are realized 4.02 .813
Programs to create new activities are established 4.10 .730
Resources are allocated after preparation of budgets. 4.03 .712
Procedures are put in place 3.90 .775
Top management steer the implementation process 3.93 .800
Information is disseminated to all stakeholders 3.97 .787
All levels of management are involved to achieve the desired results 3.95 .891
Restructuring is done if there is need to 4.00 .582
Long term strategies are realized 3.87 .724
The variables with the highest means included; implements formulated strategies (4.12),
short term strategies are realized (4.02), programs to create new activities are established
(4.10), resources are allocated after preparation of budgets (4.03), restructuring is done if

42
there is need to (4.00). This implied that the respondents agreed with the statements. The
least means were recorded on the variables like; procedures are put in place (3.90), top
management steer the implementation process (3.93), information is disseminated to all
stakeholders (3.97), all levels of management are involved to achieve the desired results
(3.95), long term strategies are realized (3.87). This means implied that majority neither
agreed nor disagreed with the statements and the results are shown in table 4.12 above.
To measure the rate of dispersion from the mean the variables with the highest standard
deviation were; Short term strategies are realized (0.813), top management steer the
implementation process (0.800), and all levels of management are involved to achieve the
desired results (0.891). This was translated that not all respondents shared the same view
while others agreed did not. This could be because of the variations in strategy
implementation across the firms.
4.4.2 Regression between Strategy Implementation on Competitiveness
Table 4.13: Regression of Strategy Implementation on Competitiveness
Model R
R
Square
Adjusted
R Square
Std. Error
of the
Estimate
Change Statistics
R Square
Change
F
Change df1
df2
Sig. F
Change
1 .859a .738 .683 .34812 .738 13.270 10 47a .000
a. Predictors: (Constant), Competitiveness
b. Implements formulated strategies, Short term strategies are realized, Programs to create new activities are
established, Resources are allocated after preparation of budgets., Procedures are put in place, Top management steer
the implementation process,Information is disseminated to all stakeholders,All levels of management are involved to
achieve the desired results,Restructuring is done if there is need to,Long term strategies are realized
A regression analysis done between strategy implementation on competitiveness as shown
in table 4.13. On analysis, the R square value was 0.738 and a p-value of (0.000) was
significant. This means that 73.8% of the variation in competitiveness was caused by the
variation in strategy implementation.

43
Table 4.14: ANOVA of Strategy Implementation on Competitiveness
Model Sum of
Squares
df Mean
Square
F Sig.
1 Regression 16.081 10 1.608 13.270 .000b
Residual 5.696 47 .121
Total 21.777 57
a. Dependent variable: competitiveness
b. predictors: implements formulated strategies, short term strategies are realized , programs to create new
activities are established, resources are allocated after preparation of budgets, procedures are put in place,
top management steer the implementation process, information is disseminated to all stakeholders, all
levels of management are involved to achieve the desired results, restructuring is done if there is need to,
long term strategies are realized
An ANOVA analysis was done between effects strategy implementation on
competitiveness at 95% confidence level, the F critical was 13.270 and the P value was
(0.000) therefore significant the implicated in table 4.14 above.
4.4.3 Coefficient of Strategy Implementation on Competitiveness
A Linear regression was done between competitiveness (dependent variable) against other
factors of differentiating products. The results of the regression coefficients, t-statistics,
standard errors of the estimates and p values are shown in table 4.15.
When organizational competitiveness was predicted on strategy implementation(Constant
p value=0.474), implements formulated strategies (Beta=.306, p-value=.018), short term
strategies are realized (Beta= .563, p-value= .000), programs to create new activities are
established (Beta= -.152, p-value=.233), resources are allocated after preparation of
budgets.(Beta=-.036, p-value=.733), procedures are put in place (Beta=.058, p-
value=.669), top management steer the implementation process (Beta=-.162, p-value=
0.212), information is disseminated to all stakeholders (Beta=.159, p-value=.250), all levels
of management are involved to achieve the desired results (Beta=.021, p-value=.841),
restructuring is done if there is need to (Beta=.181, p-value =.044), long term strategies are
realized (Beta=.125, p-value .168).
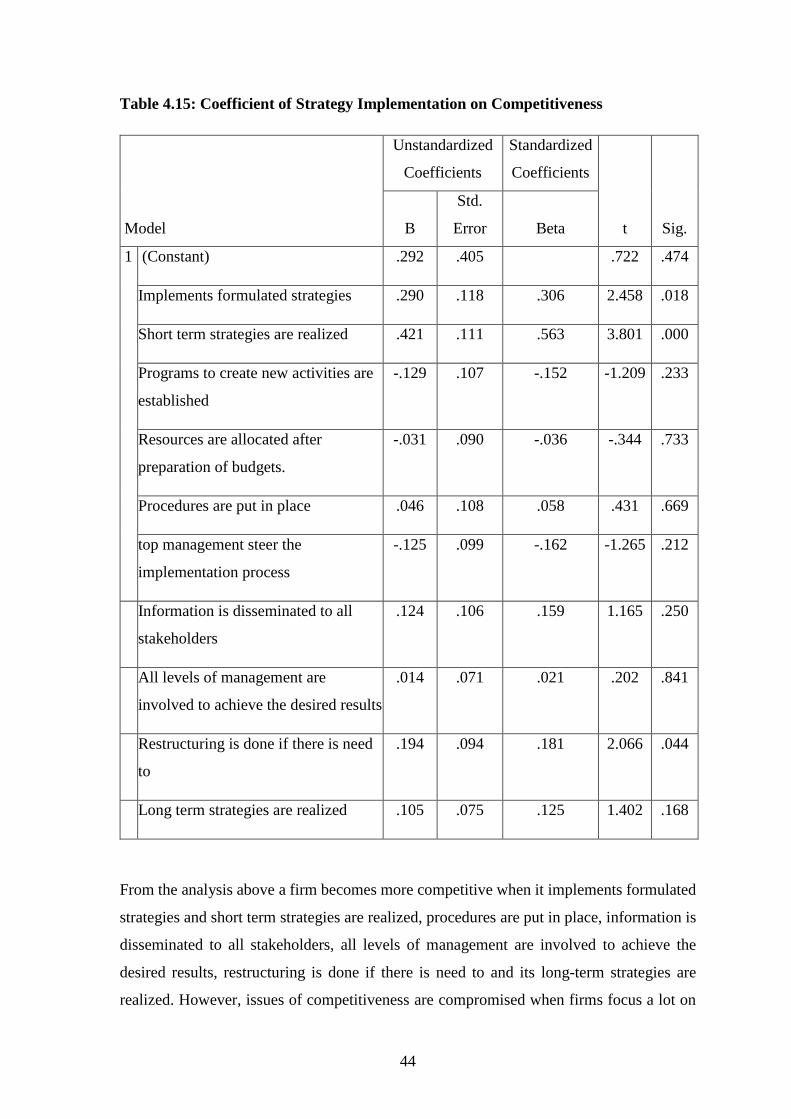
44
Table 4.15: Coefficient of Strategy Implementation on Competitiveness
Model
Unstandardized
Coefficients
Standardized
Coefficients
t Sig. B
Std.
Error Beta
1 (Constant) .292 .405 .722 .474
Implements formulated strategies .290 .118 .306 2.458 .018
Short term strategies are realized .421 .111 .563 3.801 .000
Programs to create new activities are
established
-.129 .107 -.152 -1.209 .233
Resources are allocated after
preparation of budgets.
-.031 .090 -.036 -.344 .733
Procedures are put in place .046 .108 .058 .431 .669
top management steer the
implementation process
-.125 .099 -.162 -1.265 .212
Information is disseminated to all
stakeholders
.124 .106 .159 1.165 .250
All levels of management are
involved to achieve the desired results
.014 .071 .021 .202 .841
Restructuring is done if there is need
to
.194 .094 .181 2.066 .044
Long term strategies are realized .105 .075 .125 1.402 .168
From the analysis above a firm becomes more competitive when it implements formulated
strategies and short term strategies are realized, procedures are put in place, information is
disseminated to all stakeholders, all levels of management are involved to achieve the
desired results, restructuring is done if there is need to and its long-term strategies are
realized. However, issues of competitiveness are compromised when firms focus a lot on

45
programs to create new activities are established, resources are allocated after preparation
of budgets and top management are too focused in steering the implementation process.
The respondents were also asked mention other factors that affect competitiveness during
implementation processes and no other factors were mentioned thus it was concluded that
the questionnaire addressed all the challenges.
4.5 Effects of Strategy Evaluation on Competitiveness
The third objective sought to establish how strategy evaluation affect competitiveness of
the floriculture industry and the respondents were asked a number of questions that they
were rating with the highest being strongly agree (5) and the least being strongly disagree
(1).
4.5.1 Descriptive on Strategy Evaluation on Competitiveness
To analyze the descriptive statistic the variables with the highest mean were: company
evaluates its strategies (4.00), audits help to analyses if objectives have been met (4.10),
internal audits provide information on performance (4.10), company periodically checks
its performance against the competitors (4.15), corrective measures are taken continuously
(4.13). This means that the respondents agreed that the firm evaluates its strategies and
regular audits help to analyses if objectives have been met, it was also established that
internal audits provide information on performance and the company periodically checks
its performance against the competitors. The firm also takes corrective measures
continuously.
The variables with the least means were the balanced score card is used to have a clear
picture of how the business is doing (3.23), the firm stablishes a system for measuring
performance (3.93), the dashboard gives an overall picture of performance (3.88), Key
performance Indicators are in place for all processes (3.98). This low mean show that
respondents neither agreed nor disagreed with the statements as shown in table 4.16

46
Table 4.16: Descriptive on Strategy Evaluation on Competitiveness
Variable Mean SD
My company evaluates its strategies 4.00 .803
The balanced score card gives clear picture of the business 3.23 1.370
Establishes a system for measuring performance 3.93 .756
Audits initiate ways to improve 3.87 .947
Audits help to analyse if objectives have been met 4.10 .730
Internal audits provide information on performance 4.10 .573
The dashboard gives an overall picture of performance 3.88 .783
Performance against the competitors is periodically checked. 4.15 .606
Key performance Indicators are in place for all processes 3.98 .725
Corrective measures are taken continuously 4.13 .623
4.5.2 Regression analysis between Strategy Evaluation on Competitiveness
Table 4.17: Model Summary on Strategy Evaluation on Competitiveness
Model R
R
Square
Adjusted
R Square
Std. Error
of the
Estimate
Change Statistics
R
Square
Change
F
Change df1
df2
Sig F
change
1 .881a .776 .730 .31858 .776 16.660 10 48a .000
a) Dependent Variable (Competitiveness)
b) company evaluates its strategies, The balanced score card, system for measuring performance, Audits
initiate ways to improve, Audits help to analyse objectives, Internal audits provide information on
performance, The dashboard gives an overall picture of performance, company periodically checks
its performance against the competitors, Key performance Indicators are in place, Corrective
measures are taken continuously
A regression analysis was done between variables of strategy evaluation and
competitiveness as shown in table 4.17. On analysis, the R square value was 0.776 and a
p-value of (0.000) was significant. This means that 77.6% of the variation in
competitiveness was caused by the variation in the strategy evaluation.
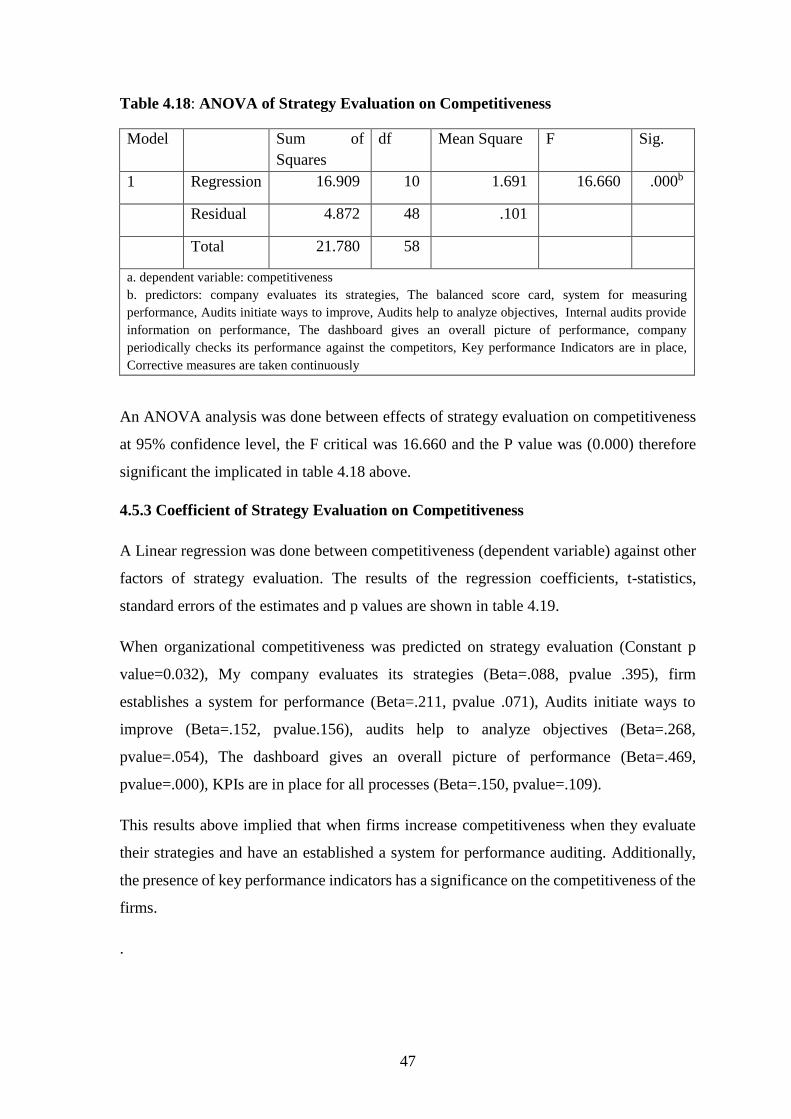
47
Table 4.18: ANOVA of Strategy Evaluation on Competitiveness
Model Sum of
Squares
df Mean Square F Sig.
1 Regression 16.909 10 1.691 16.660 .000b
Residual 4.872 48 .101
Total 21.780 58
a. dependent variable: competitiveness
b. predictors: company evaluates its strategies, The balanced score card, system for measuring
performance, Audits initiate ways to improve, Audits help to analyze objectives, Internal audits provide
information on performance, The dashboard gives an overall picture of performance, company
periodically checks its performance against the competitors, Key performance Indicators are in place,
Corrective measures are taken continuously
An ANOVA analysis was done between effects of strategy evaluation on competitiveness
at 95% confidence level, the F critical was 16.660 and the P value was (0.000) therefore
significant the implicated in table 4.18 above.
4.5.3 Coefficient of Strategy Evaluation on Competitiveness
A Linear regression was done between competitiveness (dependent variable) against other
factors of strategy evaluation. The results of the regression coefficients, t-statistics,
standard errors of the estimates and p values are shown in table 4.19.
When organizational competitiveness was predicted on strategy evaluation (Constant p
value=0.032), My company evaluates its strategies (Beta=.088, pvalue .395), firm
establishes a system for performance (Beta=.211, pvalue .071), Audits initiate ways to
improve (Beta=.152, pvalue.156), audits help to analyze objectives (Beta=.268,
pvalue=.054), The dashboard gives an overall picture of performance (Beta=.469,
pvalue=.000), KPIs are in place for all processes (Beta=.150, pvalue=.109).
This results above implied that when firms increase competitiveness when they evaluate
their strategies and have an established a system for performance auditing. Additionally,
the presence of key performance indicators has a significance on the competitiveness of the
firms.
.
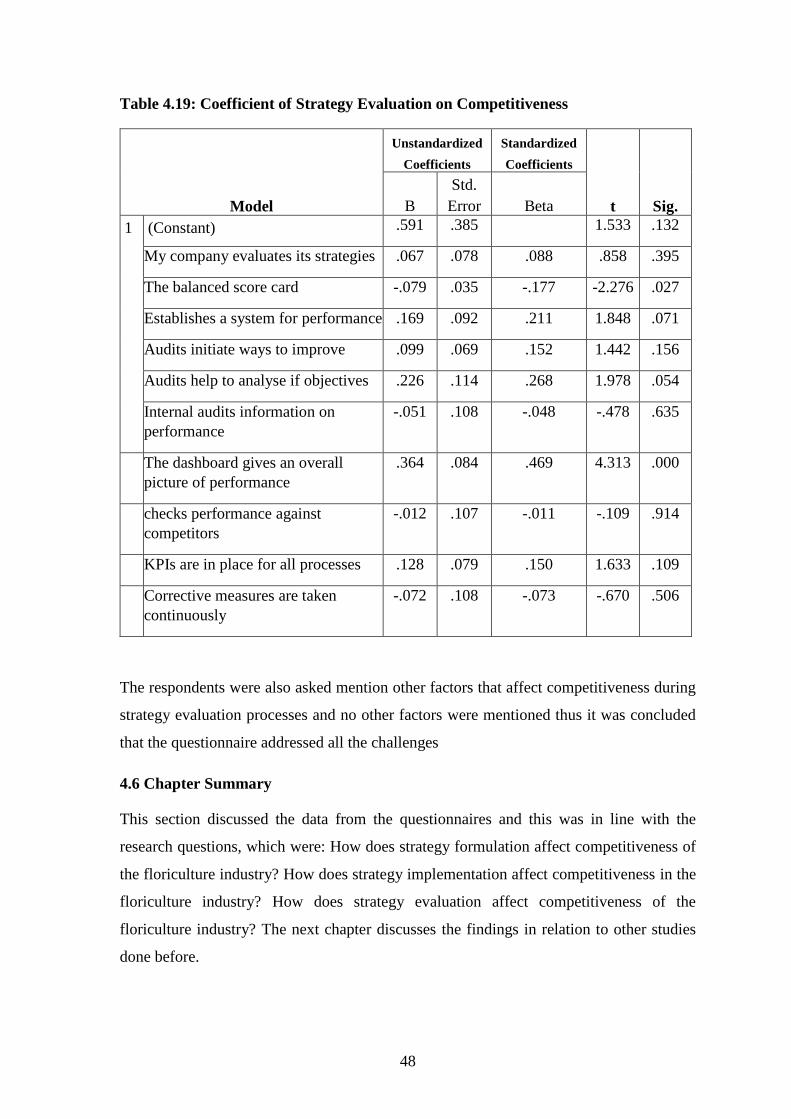
48
Table 4.19: Coefficient of Strategy Evaluation on Competitiveness
Model
Unstandardized
Coefficients
Standardized
Coefficients
t Sig. B
Std.
Error Beta
1 (Constant) .591 .385 1.533 .132
My company evaluates its strategies .067 .078 .088 .858 .395
The balanced score card -.079 .035 -.177 -2.276 .027
Establishes a system for performance .169 .092 .211 1.848 .071
Audits initiate ways to improve .099 .069 .152 1.442 .156
Audits help to analyse if objectives .226 .114 .268 1.978 .054
Internal audits information on
performance
-.051 .108 -.048 -.478 .635
The dashboard gives an overall
picture of performance
.364 .084 .469 4.313 .000
checks performance against
competitors
-.012 .107 -.011 -.109 .914
KPIs are in place for all processes .128 .079 .150 1.633 .109
Corrective measures are taken
continuously
-.072 .108 -.073 -.670 .506
The respondents were also asked mention other factors that affect competitiveness during
strategy evaluation processes and no other factors were mentioned thus it was concluded
that the questionnaire addressed all the challenges
4.6 Chapter Summary
This section discussed the data from the questionnaires and this was in line with the
research questions, which were: How does strategy formulation affect competitiveness of
the floriculture industry? How does strategy implementation affect competitiveness in the
floriculture industry? How does strategy evaluation affect competitiveness of the
floriculture industry? The next chapter discusses the findings in relation to other studies
done before.

49
CHAPTER FIVE
5.0 DISCUSSION, CONCLUSIONS AND RECOMMENDATIONS
5.1 Introduction
This chapter set the discussion, conclusions, and recommendations from the findings of
this study. This was guided by the objectives of the study, which were: How does strategy
formulation affect competitiveness of the floriculture industry? How does strategy
implementation affect competitiveness in the floriculture industry? How does strategy
evaluation affect competitiveness of the floriculture industry?
5.2 Summary
The purpose of this study was to establish the role of strategic management on
competitiveness in the floriculture industry in Kenya. The research was guided by the
following research questions: How does strategy formulation affect competitiveness of the
floriculture industry? How does strategy implementation affect competitiveness in the
floriculture industry? How does strategy evaluation affect competitiveness of the
floriculture industry? A descriptive research was used. The target population of this study
was managers in the 21-floriculture industries in Kiambu County. The data obtained was
analyzed via statistical Package for Social Sciences (SPSS) and excel. The quantitative data
obtained was examined, and the findings presented in percentages, means, standard
deviations, and frequencies. A regression analysis was utilized to investigate the
relationship between the dependent and independent variables. The researcher distributed
63 questionnaires, 60 of them were filled and returned, and this number was sufficient.
The findings from the first objective established that most of the respondents agreed that
corporate social responsibility help the community around, and they were not operating in
areas affected by conflicts. Additionally, it was also established that there was a vision
statement which defines the desired future, tastes, attitudes and perceptions has led us to
adopt new products and examining the company’s strengths helps to focus on the goals and
objectives of the firm. From the analysis when firms adhere to procedures on policy
development, possess a vision statement, which defines the desired future, operate in areas
affected by conflicts, and offer the right customer tastes, attitudes, and perceptions they
improve competiveness.

50
Similarly, these results are received when firms undertake analysis of the external
environment and focus on the goals and objectives of the firm. On the contrary, the more a
firm relies totally on its mission statement and philosophies to guides all operations and
lack corporate social responsibility projects to help the community around its
competitiveness is compromised. A regression analysis was done between variables of
strategy formulations on competitiveness. On analysis, the R square value was 0.550 and a
p-value of (0.000) was significant. This means that 55.5% of the variation in
competitiveness was caused by the variation in the strategy formulations in floricultural
industry
The findings from the second objective established that most of the firms implement
formulated strategies, and their short-term strategies are realized. In addition, programs to
create new activities have been established, and resources are allocated after preparation of
budgets. The findings also revealed that restructuring is done if there is need to. From the
regression analysis, the results revealed that a firm becomes more competitive when it
implements formulated strategies and is able to realize short-term strategies. All firms also
have to have procedures put in place, and information is disseminated to all stakeholders.
All levels of management also need to get involved to achieve the desired results, and
restructuring should be done if there is need to and its long-term strategies are realized.
However, issues of competitiveness are compromised when firms focus a lot on programs
to create new activities, and top management are too focused in steering the implementation
process. A regression analysis done between strategy implementation on competitiveness
and the R square value was 0.738 and a p-value of (0.000) was significant. This means that
73.8% of the variation in competitiveness was caused by the variation in strategy
implementation.
The findings from the third objective established companies evaluates strategies, audits
help to analyses if objectives have been met, and the internal audits provide information on
performance. Additionally, company periodically checks its performance against the
competitors and corrective measures are taken continuously. Regression results between
the factors of strategy evaluation and performance revealed that that when firms increase
competitiveness when they evaluate their strategies and have an established a system for
performance auditing. Additionally, the presence of key performance indicators have a
significance on the competitiveness of the firms. A regression analysis was done between
variables of strategy evaluation and competitiveness. On analysis, the R square value was

51
0.776 and a p-value of (0.000) was significant. This means that 77.6% of the variation in
competitiveness was caused by the variation in the strategy evaluation.
5.3 Discussion
5.3.1 Strategy Formulation and Competitiveness
The findings from the study established that there was a vision and mission statement,
which defines the desired future, tastes, attitudes, and perceptions, has led us to adopt new
products. According to previous research by Pearce & Robinson (2013), they established
that formulating a business mission is best understood by thinking about the business at its
inception. Typically, it begins with beliefs, desires and aspirations. These fundamentals are
based on the product or service being provided, how production is done and if it satisfies
the consumer’s needs, how the business are managed and grow and the profitability.
Additionally, Pearce & Robinson (2013) shows that there is a new trend when it comes to
mission components; these are sensitivity to customer wants, concern for quality and
statements of company vision. “The customer is our top priority,” means that the overriding
concern for the company is customer satisfaction. “Quality is job one” indicates that quality
should be the norm. A vision statement presents the firms strategic intend that focuses the
energies and resources of the company on achieving a desirable future. Bakar et al, (2011)
on the other hand studied the practice of strategic management in construction companies
in Malaysia. The findings of the research showed that most of the firms practicing strategic
management had a clear objective, a winning strategy to achieve the objective and a sound
mission statement to guide the organization towards success.
A regression analysis done between variables of strategy formulations on competitiveness
revealed that variation in competitiveness was caused by the variation in the strategy
formulations in floricultural industry. Previous studies done on the relationship have also
identifies the same trend. For example, Taiwo & Idunnu (2010) examined the impact of
strategic planning on organizational performance and survival. The study evaluated the
planning-performance relationship in organization and the extent to which strategic
planning affected performance of First Bank of Nigeria. The findings indicated that
planning enhances better organizational performance, which in the long term affects its
survival.

52
The study established that most of the firms have been able to easily comply with
government statutory regulation with ease as well as avoid areas of conflict. This has
positively affected performance as reported by Pearce & Robinson (2008) laws and
regulations are commonly restrictive and they tend to reduce potential profits, despite the
fact that some political laws are designed to benefit and protect firms – such as patent laws,
product research grants and government subsidies. Therefore, in order to deal with the
political issues; firms need to develop a political strategy to influence government policies
that affect them (Ireland, et al, 2013). Furthermore, studies by Ozer, Alakent & Ahsan
(2010) indicate that because of a firm’s propensity for political engagement, organizations
get involved in corporate political strategies.
It was also established that examining the company’s strengths helps to focus on the goals
and objectives of the firm. Holburn & Vanden Bergh (2008) say that the effects of global
governmental policies on a firm’s competitive position heighten the need for firms to have
an effective political strategy. In 2008, Kenya was confronted with political unrest, which
had an effect on the sector for few weeks. Flowers could only be exported with difficulty
and some farms did not get the flowers out for some days (Rikken, 2011). Jorian &
Goetzmann (1999) as mentioned in (Beaulieu, et al, 2005) report that activities of political
origin have caused market interruptions in 25 countries including; Chile, France, Germany,
Japan and Portugal. A major consideration for most managers when formulating strategy
is the direction and stability of a nation (Pearce & Robinson, 2009). In a bid to evade
obsolescence and promote innovation, a company must be aware of technological changes
that might influence its industry (Pearce & Robinson, 2008; Euchner, 2011; Sinha and
Noble, 2008). Ireland et al (2013) says that the importance of awareness efforts is supported
by the findings that early adopters of technology often achieve higher market share and
earn high returns. It is therefore of paramount importance to firms to continuously scan
their external environment, to identify new emerging technologies that could give them a
competitive edge.
The findings revealed that tastes, attitudes and perceptions has led the firms to adopt new
products. This are in line with findings by Ireland et al, 2013, and Pearce & Robinson,
(2009) who established that societal factors that affect firm operations involve beliefs,
attitudes, opinions and lifestyles of persons in the firm’s external environment . The
scholars contend that these elements are because of cultural, ecological, demographic,
53
religious and ethnic conditioning. As social attitudes change, the demand for various
products and services also change.
5.3.2 Strategy Implementation and Competitiveness
The findings of the study revealed that firms in the floriculture are able to implements
formulated strategies. In addition, the firms have also been able to generate programs to
create new activities. Wheelen & Hunger (2006) also established the same and they
proposed that a matrix of change was necessary to help managers decide how quickly
change should proceed, in what order, changes should take place and whether the proposed
systems are stable and coherent.
The findings of the study established that firms in sector do restructuring if there is need
to. In this regard, Wheelen & Hunger (2006) state that before plans can be lead to actual
performance, a corporation should be appropriately organized, with programs adequately
staffed and activities should be directed towards achieving the desired objectives.
According to Ireland, Hoskisson & Hitt (2009) a competitive response is a strategic or
tactical action that a firm takes to counter effects of competitor’s action. Dess et al (2008)
argue that before initiating a response a firm need to evaluate what the competitor’s action
is likely to be. According to Ireland, et al, (2009) responses are part of the competitive
strategies that an organization develops in an effort to beat competition.
The findings also revealed that most firms have been able to realize their short-term
strategies this can be attributed to the fact as highlighted by Pearce & Robinson (2013) that
short-term objectives are more consistent when they clearly state what is to be
accomplished, when it is accomplished and how its accomplishment is measured. This they
say can be used to monitor both the effectiveness of each activity and the collective progress
across several intended activities. Measurable objectives make misunderstandings less
likely among interdependent managers who must implement action plans. David (2009)
notes that although all objectives are important, some deserve more priority because of a
timing consideration or their particular impact on a strategy’s success. If priorities are not
established conflicting assumptions about the relative, importance of objectives may inhibit
progress toward strategic effectiveness.
The findings also revealed that there was uncertainty on whether the long-term strategies
have realized by the firms. This reveals how firms have failed to implement their strategies.
Mintzberg & Quins (2004) noted that 90% of well-formulated strategies fail at
54
implementation stage and only 10% of formulated strategies are successfully implemented.
There was also uncertainty on Information being disseminated to all stakeholders. This was
contrary to recommendations made by Pearce & Robinson (2008) where they concluded
that successful implementation of strategy is fully dependent on involvement of all the
stakeholders in an organization. Communicating progress of implementing the strategy to
the stakeholders assists them in determining whether corrective action is required
A regression analysis done between strategy implementation on competitiveness revealed
that there was a relationship. Similar findings have been reported in past research for
instance, Njagi & Kombo (2014) examined the effect of strategy implementation on
performance of commercial banks in Kenya. Results revealed that there was a strong
relationship between strategy implementation and competitiveness. While it is necessary to
ensure everyone in the organization implements that strategies. In this study, the
respondents were neutral about the issue and therefore need to raise the need for creating
awareness about the importance of the matter.
5.3.3 Strategy Evaluation and Competitiveness
The findings from the study established that most of the companies evaluates their
strategies. According to David (2009), strategy evaluation needs to be done continuously
to enables a company to bench mark its progress more effectively. Successful strategies
combine patience with willingness to promptly take corrective actions when necessary.
Strategy evaluation should provide a true picture of what is happening and it should not
dominate decisions instead, it should foster mutual understanding, trust and common sense.
David adds that the strategic management process results in decision that can have
significant, long lasting consequences. Erroneous strategic decisions can inflict severe
penalties and can be exceedingly difficult, if not impossible to reverse. Most strategists
agree, therefore that strategy evaluation is vital to an organization’s wellbeing; timely
evaluations can alert management to problems before a situation becomes critical (David,
2009).
An analysis of whether the balanced score card gives clear picture of the business revealed
that there was uncertainty in the results. These finders however, differ from those of Pearce
& Robinson (2008) who established that indeed the balanced scorecard could measure how
well an organization is continuously improving and creating value by motivating
employees. In addition, the scorecard measures could be used to measure employee
55
capabilities, information system capabilities, motivation, empowerment and alignment. In
order to achieve optimum success, the balanced scorecard requires comprehension, support
and commitment from the very top of the business down. As the organizational culture
evolves and develops to appreciate the novel approach of employees of the organization
mature within the new culture, the organization will find new things to measure and monitor
progress. Latshaw & Choi (2002) as mentioned in Chavan (2009) state that organizations
have traditionally measured their performance on short-term financial measures; the
balanced scorecard however, extends this to include measures of performance relating to
customer, internal processes and learning and growth needs of their people
From the findings, it was revealed that most of the companies periodically checks
performance against their competitors. This David (2009) notes that a strategy must
represent an adaptive response to the external environment and to the critical changes
occurring within it.one difficult in matching a firms key internal and external factors in the
formulation of strategy is that most trends are the result of interactions among other trends.
Although single economic or demographic trends might appear steady for many years, there
are waves of change going on at the interaction level.
The study also established that audits help to analyse if objectives have been met and the
internal audits provide information on performance. Chavan (2009) argues that over
reliance on financial indicators encourages short-term behaviour that sacrifices long-term
value addition for short-term performance. Brown (2000) adds that the balanced scorecard
has enhanced the traditional financial measures with lead indicators of future financial
performance. According to Hagood & Friedman (2002), a firm can assess its performance
in building key competencies needed in terms of strategy and future survival by focusing
on the nonfinancial dimensions. Waal (2003) says that the purpose of the balanced
scorecard is to direct and manage an entire company towards achieving a shared vision of
the future. In accordance with the balanced scorecard, an organization ought to view itself
from four perspectives and to develop metrics, collect data, and analyse it relative to each
of these perspectives (Pearce & Robinson, 2008).
It was also revealed that the firms have put in place corrective measures done continuously
and this should be the way the activities are done as indicated by Capon (2008). He further
added that effective execution and internal business processes are monitored and measured
by productivity, cycle time, quality measures, downtime and various cost measures, among
56
others. Additionally, the company periodically checks its performance against the
competitors. Pearce & Robinson (2009) indicated that internal or external staff could
undertake such audits. Where audits are undertaken internally, it is customary for auditors
to not have a direct interest in the process being audited, in order to demonstrate the
credibility of the audit. Internal auditors can be valuable because they can be expected to
know the intricacies of an organisation's operations.
5.4 Conclusion
5.4.1 Strategy Formulation and Competitiveness
With regard to how strategy formulation affect competitiveness, it was established that
corporate social responsibility is a good strategy when utilized to help the community
around. Most firms need a vision statement, which defines the desired future. Floricultural
firms to adoption of new products is determined by factors such as tastes, attitudes, and
perceptions.
5.4.2 Strategy Implementation and Competitiveness
Most of the firms in the floriculture industry have been able to implement formulated
strategies as well as realize their short-term strategies. These firms have also initiated
programs to create new activities and to do so they have managed to allocate their resources
effectively through preparation of budgets. The firms also undertake restructuring if there
is need to. However issues of competitiveness are compromised when firms focus a lot on
programs to create new activities are established, resources are allocated after preparation
of budgets and top management are too focused in steering the implementation process.
5.4.3 Strategy Evaluation and Competitiveness
With regard to strategy evaluation in the floriculture industry most of the companies have
been able to evaluate their strategies. While that is the case, most of the firms have also
been able to utilize audits to establish if the objectives have been met. Such audits have
also been utilized to provide information on performance. Due to the competitive nature of
the industry, the companies undertake periodically checks its compare with competitors
while corrective measures are taken continuously.
57
5.5 Recommendation
5.5.1 Recommendation for Improvement
5.5.1.1 Strategy Formulation and Competitiveness
The findings revealed that there was uncertainty among respondents with regard to the
effects of the firms having guiding philosophies and whether analysis of the external
environment helps the company to seize all opportunities. There is therefore a need for the
employees in the industry to be educated on the importance of these factors in enabling
competitiveness.
5.5.1.2 Strategy Implementation and Competitiveness
Firms in the sector need to ensure that procedures are put in place and this should be made
clear to all employees. There is also a need to involve the top management steering in the
implementation process and this would ensure continuous monitoring of the process.
Information disseminated should also be encouraged for effective cooperation to all
stakeholders. Apart from that all levels of management need to be involved to achieve the
desired results. The firms also need to set up long term strategies that are achievable.
5.5.1.3 Strategy Evaluation and Competitiveness
Due to the uncertainty regarding factors necessary for strategy evaluation it is necessary
for the industry to ensure that the teams are well informed about use of the balanced score
card and dash board in the business. All firms also need to establish an effective system for
measuring performance. Regular audits also need to be done to initiate ways to improve
operations. The firms also need to have key performance indicators for all processes.
5.5.2 Recommendation for Further Studies
This research focused on strategy formulation, strategy implementation and strategy
evaluation and how they affect competitiveness of the floriculture industry. There is
therefore a need to do a similar research in other cash crop firms like tea and coffee be able
to compare the results and make conclusion. On the other hand, there is a need to undertake
a study to determine the challenges facing strategy formulation, strategy implementation
and strategy evaluation in the agricultural sector as a whole, this enables the firms in the
industry to be better prepared for any of the challenges that they may encounter during the
processes.

58
REFERENCES
Aosa, E. (2011). Strategic Management Within Kenya Firms. DBA Africa Management
Review, 1 (1), Pp. 25-36
Awour, E. (2012). Environmental Tensions and Compatibilities in Agribusiness Supply
Networks: A Case of The Floriculture Industry in Kenya. Journal of Biology,
Agriculture and Healthcare, 2 (4), Pp. 17-26.
Bakar, A., Tufail M. A., Yusof, M. N., & Virgiyanti, W. (2011). Implementation of
Strategic Management Practices in The Malaysian Construction Industry. Pak.
Journal of Commerce and Social Sciences, 5 (1), Pp.140-154
Bhattacharyya, S. & Nain, A. (2011). Horizontal acquisitions and buying power: A product
market analysis. Journal of Financial Economics, 99(1), pp. 97-115.
Beaulieu, M., Cosset, J. & Essaddam, N., (2005). The Impact of Political risk on the
Volatility of stock Returns: The Case of Canada. Journal of Intenational Business
Studies 36(6); 701-718
Bedada, S. M., & Eshetu, M. S. (2011). Ethiopian Floriculture Industry from Corporate
Social Responsibility (CSR) & Governance Perspective. “How is CSR Practiced in
the Ethiopian Floriculture Industry, and does it has a linkage with the governance
system?” (Master’s thesis). Karlstad Business School, Karlstad University
Bonchi, F., Giannotti, F., Mainetto, G., and Pedreschi, D. (1999). A Classification-Based
Methodology for Planning Audit Strategies in Fraud Detection. New York, NY: In
Working Notes, (KDD-99).
Capon, C. (2008). Understanding Strategic Management. New York, NY: Prentice Hall
Campbell, J.P. (1990). Modelling the performance prediction problem in industrial and
organizational psychology. New York, NY: Consulting Psychologists Press.
Chavan, M. (2009). The balanced scorecard: a new challenge. Journal of Management
Development, 28(5), pp. 396-406
Chua, C., & Tsiaplias, S. (2011). Predicting economic contractions and expansions with
the aid of professional forecasts. International Journal of Forecasting, 27(2),
pp.438-451
59
Curtis, E. & Turley, S. (2007). The business risk audit--A longitudinal case study of an
audit engagement. Accounting, Organizations and Society, 32(2)4, pp. 39-461.
David, A. K. (2009). The strategic management intellectual capital. Resources for the
knowledge based economy.
David, F. R. (1997). Concepts of Strategic Management, 6TH Ed, Upper Saddle, NJ:
Prentice Hall.
Dess, G.G., Lumpkin, G.T, & Eisner, A.B., (2008). Strategic Management: Creating
Competitive Advantages, 4th Ed. New York, NY: McGraw - Hill.
Dowling, C. & Leech, S. (2007). Audit support systems and decision aids: Current practice
and opportunities for future research. International Journal of Accounting
information systems, 8(1), pp. 92-16.
Dyler, L., & Reeves, T.(1995). Human resource strategies and organization performance:
what do we know and where do we need to go?. International Journal of HRM,
6(3), 656-671
Euchner, J. (2011). Managing disruption: An interview with Clayton Christensen. Research
Technology Management, 54(1), pp. 1-17
Evans, J. R. & Lindsay, W. M. (2011). The Management and Control of Quality, 8TH Ed.
South-Western, UK: Cengage Learning.
Frank, B., & Cruz, E. (2001). Flower for Justice, Implementing the International Code of
Conduct. Friedrch Ebert Stiftung, Washington, DC:Global Environmental Outlook
3.
Gebreeyesus, (2009). Development in Africa: Refocusing the Lens after the Millennium
Development Goals.
Gehlhar, M.J., Regmi, A., Stefanou, S.E., Zoumas, B.L. (2009). Brand Leadership and
producy innovation as firm strategies in global food markets, Journal of Product &
Brand Management, 18(2); 115-126
Getu, M. (2009).Ethiopian Floriculture And Its Impact On The Environment. Mizan Law
Review, 3 (2), Pp.1-19
Gyan Research And Analytics Pvt. Ltd (2014) Critical Design Characteristics For Online
Retail Stores In India. Emerald Emerging Markets Case Studies, 5(7), Pp.1-12.

60
Hagood, W.O. & Friedman, L. (2002). Using the balanced scorecard to measure the
performance of your HR information system, Public Personnel Management, 31(4);
543-57
Hale, A., & Opondo, M. (2005). Humanizing The Cut Flower Chain: Confronting The
Realities Of Flower Production For Workers In Kenya. Antipode 37(2), Pp.5-19.
Hill C. & Jones G. (2004). Strategic Management; An Integrated Approach, 6TH Ed New
York, NY: Houghton Mifflin Company
Hitt, M. A., Ireland, R. D., & Hoskisson, R. (2013). Strategic Management: Concepts And
Cases, Competitiveness & Globalization Southwestern, Mason, OH: Cengage
Learning.
Holburn, G. & Vanden Bergh, R.G. (2008). Making Friends in Hostile Environments:
Political Strategies in Regulated Industries. Academy of Management Review 33(2),
pp.521-540
Holt, D., & Watson, A. (2007). The dilemma of ‘flower’ miles. Journal of Sustainable
Social and Ecosystem Stewardship. International conference of the greening of
industry network, Wilfrid Laurier University, Waterloo, Ontario, Canada.
Hrebiniak, L.G. (2006). Obstacles to Effective Strategy Implementation‟. Organizational
Dynamics, 35 (2), pp. 12-31.
Ignatius, A. (2011). How eBay developed a culture of experimentations. Harvard Business
Review, 89(3), pp. 92-97
Ireland, R.D., Hoskisson, R.E., & Hitt, M.A. (2009). The Management of Strategy: Concepts
and Cases. 8th Ed. Mason, OH: South-Western Cengage Learning
Jon, M., & Randy, L.D. (2009). Human Resource Development. 5th Ed. South Western,
CA: USA
Jorian, P. & Goetzmann, W.N. (1999). Global Stock Markets in the Twentieth Century.
Journal of finance 54(3), pp.953-980
Kaplan, S. E. (1985). An examination of the effects of environment and explicit internal
control evaluation on planned audit hours. Auditing-A Journal of Practice &
Theory, 5(1), pp. 12-25.
61
Karake, Z.A. (1997). Managing Information resources and environmental turbulence.
Information Management & Computer Security, Vol. 5 No.3, pp. 93-99.
Kargbo A., Jing Mao & Cai-Yun, Wang. (2010).The Progress and Issues in the Dutch,
Chinese and Kenyan Floriculture Industries. African Journal Of Biotechnology Vol.
9(44), Pp. 7401-7408.
Kenya Flower Council (2013). Growing Responsibly. Nairobi, KE: Kenya Flower Council
Khanderkar, A., & Sharna, A. (2006). Organizational Learning And Performance:
Understanding Indian Scenario In Present Global Context, International Journal Of
Strategy Management 48(8/9), 682-692
Knechel, W. R. (2007). The business risk audit: Origins, obstacles and opportunities.
Accounting Organizations and Society, 32 (3), pp. 383-408.
Kourdi, J. (2009) Business Strategy: A Guide To Taking Your Business Forward. London,
UK: Profile Books Limited.
Lamberg, J.A., Tikkanen,H.,& Nokelainen, T.,& Suur-Inkeroinen, H. (2009). Competitive
Dynamics, Strategic Consistency and Organizational Survival. Strategic
Management Journal, 30(1), Pp.45-60
Latshaw, C.A & Choi, Y. (2002). The Balanced Scorecard and the Accountant as a valued
Strategic Partner, Review of Business Studies 4(2), pp. 27-29
Lee, P., Stokes D., Taylor, S. & Walter, T. (2003). The Association Between Audit Quality,
Accounting Disclosures And Firm Specific Risk: Evidence From Initial Public
Offerings. Journal of Accounting and Public Policy, 22(5), 377-400.
Lynch, R. (2008). Corporate Strategy. Harlow, Essex, UK: Pearson Education
Macmillan, H., & Tampoe, M. (2000). Strategic management: Process, content, and
implementation. Oxford, UK: Oxford University Press.
Melchorita S. S. (2013). The Influence of Strategic Management Practices And
Competitive Advantage On The Organizational Performance Of Higher Education
Institutions. Academy Of Management Journal, 44(5), pp.996-1004.
62
Middelburg, A., F. (2009). Sierteelt Is Niet In Ieder Afrikaans Land Booming: Historical
Records Of Coastal Eutrophication-Induced Hypoxia. Biogeosciences, 6(8),
pp.1707-1745.
Mintzberg, H., Ahlstrand, B., & Lampel, J. (2009). Strategy Safari: The Complete guide
through the wilds of strategic management, 2nd Ed. New York, NY: Prentice Hall.
Muogbo , U. S. (2013). The Impact of Strategic Management on Organizational Growth
and Development (A Study of Selected Manufacturing Firms in Anambra State).
IOSR Journal of Business and Management, 7 (1), pp. 24-32
Moosbrugger, R. (2007). Kenyan Flowers, Ethical Trade and the Question of Sustainable
Development. School of Oriental and African Studies, University of London,
Unpublished Masters Dissertation.
Murimbika, M. (2011). Influence Of Strategic Management Practices On The
Entrepreneurial Orientation Of South African Firms In The Financial And Business
Services Sector. Unpublished Dissertation, Johannesburg, SA: University of the
Witwatersrand.
Njagi, L. & Kombo, H. (2014). Effect of Strategy Implementation on Performance of
Commercial Banks in Kenya. European Journal of Business and Management,
6(13), pp. 62-67
O'Donnell E. & Schultz, J. (2003). The influence of business-process-focused audit support
software on analytical procedures judgment. Audit Journal Practice & Theory,
22(1),pp.265-279.
Ofunya, F.A. (2013) Strategic Management Practices On Performance Of Post Banks In
Kenya, International Journal Of Business Management And Administration, 2(6),
pp.122-141.
Ozer, M., Alakent, E., & Ahsan, M. (2010). Institutional Ownership and Corporate Political
Strategies: Does Heterogeneity of Institutional Owners Matter? Strategic
Management Review 4(1), pp. 18-29
Pappas J. M., Flaherty, K. E. & Hunt, C. S. (2007).The Joint Influence Of Control Strategies
And Market Turbulence On Strategic Performance In Sales-Driven Organizations.
Institute Of Behavioural And Applied Management, 4 (3), pp.141-167
63
Pearce, J.A. & Robinson Jr, R.B. (2008). Strategic Management; Formulation:
Formulation, Implementation and Control. New York, NY: Mcgraw-Hill.
Peecher E. M., Schwartz R., & Solomon I. (2007). It's all about audit quality: Perspective
On Strategic-System Auditing, 32(2): 463-485
Porter, E.M. (2001) Competitive Advantage. London, UK: The Free Press.
Porter, M. E (1985). Competitive Advantage: Creating and Sustaining Superior
Performance, New York, NY: Free Press.
Porter, M.E (1979). How Competitive Forces Shape Strategy. Boston, MA: Harvard
Business Review Book.
Porter, M.E. (2008). The Five Competitive Forces That Shape Strategy. Boston, MA:
Harvard Business Review.
Raduan, C. R., Jegak, U., Haslinda, A & Alimin, I. I. (2009). Management, Strategic
Management Theories and the Linkage with Organizational Competitive
Advantage from the Resource-Based View. European Journal of Social Sciences,
11(3), pp.402-412.
Research and Markets (2014). Global Horticulture (2014 -2018) - Pink and Healthy.
Retrieved September 2016 from
http://www.researchandmarkets.com/reports/2893766/global-horticulture-2014-
2018-pink-and.
Rikken, M. (2010). The European Market for Fair and Sustainable Flowers and Plants.
Bruxelles, BE: BTC Belgian Development Agency.
Rikken, M. (2011). The Global Competitiveness of the Kenyan Flower Industry. 5th Video
Conference on the Global Competitiveness of the Flower Industry in East Africa.,
Nairobi, KE: World Bank Group and Kenya Flower Council.
Ritchie, B. & Khorwatt E. (2007). The attitude of Libyan auditors to inherent control risk
assessment. The British Accounting Review, 39(5), pp.39-59.
Robbins, S.P., & Coulter, M. (1996) Management. 5th Ed. Englewood Cliffs, NJ: Prentice-
Hall.
Robert, A. & Randal, E. (2005). A longitudinal investigation of auditor error projection
decisions. Auditing: A Journal of Practice & Theory, 24(2), pp.69-84.
64
Rowold, J. (2011). Relationship Between Leadership Behaviors And Performance: The
Moderating Role of a Work Team’s Level Of Age, Gender And Culture
Heterogeneity. Leadership and Organization Development Journal. 32(6), 628-
647
Schermerhorn, J.R., Hunt, J.G., & Osborn, R.N. (2005). Organizational Behaviour. 9th Ed.
New York, NY: John Wiley & Sons.
Sindhi, S., & Kumar, N. (2012). Corporate Environmental Responsibility Transitional and
evolving. Management of Environmental Quality: An International Journal, Vol. 23,
issue 6, pp. 640-657.
Sinha, R.K. & Noble, C.H. (2008). The adoption of radical manufacturing technologies and
firm survival. Strategic Management Journal, 29, pp.943-962
Sirmon, D.G., Hitt, M.A, Arregle, J. & Campbell, J. (2010). The dynamic interplay of capability
strengths and weaknesses: Investigating the bases of temporary competitive advantage.
Strategic Management Journal Vol 31, issue 13, pp.1386-1409
Sriwan, T. (2004). Examining the factor which influence performance measurement and
management in the Thai Banking Industry: An implication of the balance Scorecard
Framework. Doctor of Philosophy thesis Murcdoch University.
Taiwo, A. S. & Idunnu, F. O. (2010). Impact of Strategic Planning On Organizational
Performance and Survival. Research Journal of Business Management, Vol 4, issue
1, pp. 73-82.
Wheelen, T. L., & Hunger, J. D. (2008). Strategic Management and Business Policy. 11th
Upper Saddle River, NJ: Pearson Prentice Hall.
Xinyan, W., Jianqiao, L., Degen, X. (2010). The impact of organizational justice on work
performance mediating effects of organizational commitment and leader member
exchange. International Journal of Manapower, Vol 31, issue 6, pp. 660-677.
Zachary B. Awino (2013) Strategic Planning and Competitive Advantage of ICT Small and
Medium Enterprises in Kenya. Nairobi, KE: Un Published Thesis, University Of
Nairobi.
65
APPENDIX I: COVER LETTER
Scholasticah M. Musau
P.O. BOX 8900-00300
Nairobi, Kenya
Email: [email protected]
September 28th, 2016
Dear Respondent,
RE: REQUEST FOR PARTICIPATION IN RESEARCH WORK
I am a graduate student at United States International University pursuing a Master’s degree
in Business Administration (MBA) with a concentration in Strategic Management. In
partial fulfilment of the requirement for the degree, I am carrying out a research project on
“The Role of strategy on competitiveness in the floriculture industry in Kenya. A case of
Kiambu County” I shall appreciate if you kindly complete the enclosed questionnaire,
which will be used to collect the data relevant to my study. Of importance to note is that
you have been randomly selected to participate in this study. It is estimated that it will take
less than twenty (20) minutes of your time to complete the questionnaire. Kindly respond
as honestly and objectively as possible. Contribution from your end is very crucial for the
achievement of this study and it will be extremely treasured.
I assure you that the information that you will present will be treated with the extreme
confidentiality and will be used only for academic purposes only. In case of any queries or
concerns about completing the enclosed questionnaire, please do not hesitate to contact me
at any time through my contact provided at the top of this letter. I look forward to receiving
completed questionnaires and I would like to express my sincere gratitude for your kind
cooperation in advance.
Thank you in advance,
Yours Sincerely,
Scholasticah Musau.
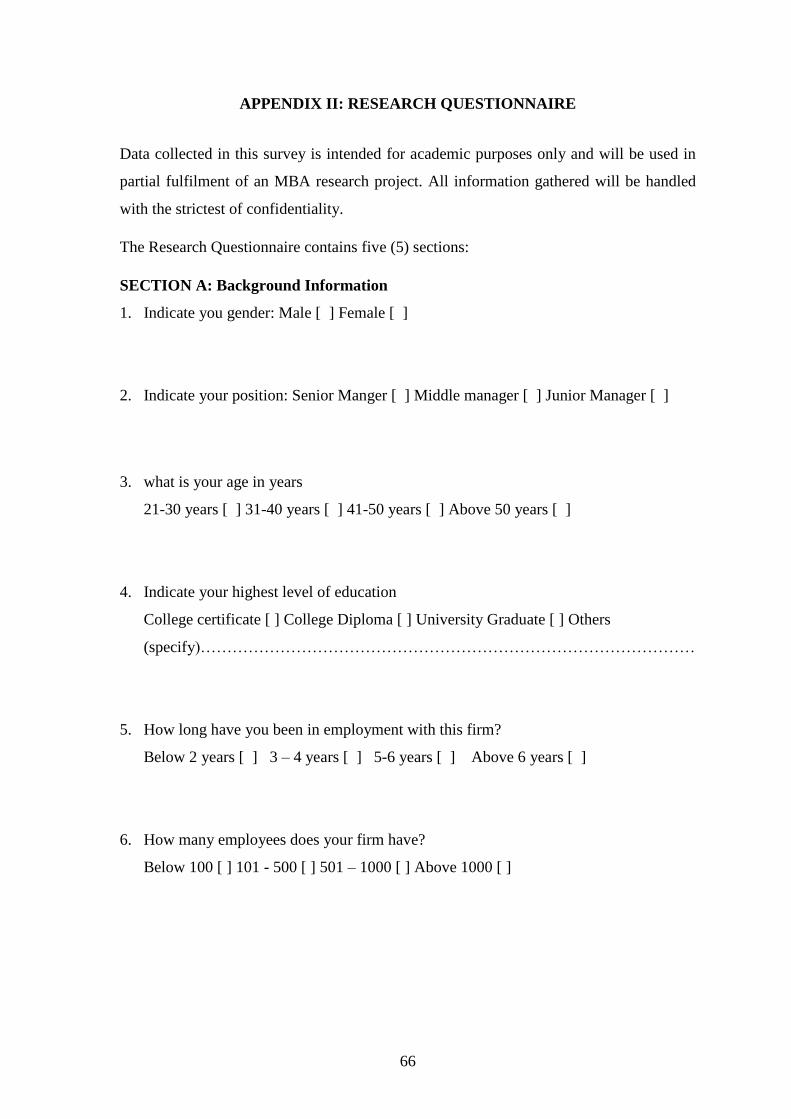
66
APPENDIX II: RESEARCH QUESTIONNAIRE
Data collected in this survey is intended for academic purposes only and will be used in
partial fulfilment of an MBA research project. All information gathered will be handled
with the strictest of confidentiality.
The Research Questionnaire contains five (5) sections:
SECTION A: Background Information
1. Indicate you gender: Male [ ] Female [ ]
2. Indicate your position: Senior Manger [ ] Middle manager [ ] Junior Manager [ ]
3. what is your age in years
21-30 years [ ] 31-40 years [ ] 41-50 years [ ] Above 50 years [ ]
4. Indicate your highest level of education
College certificate [ ] College Diploma [ ] University Graduate [ ] Others
(specify)…………………………………………………………………………………
5. How long have you been in employment with this firm?
Below 2 years [ ] 3 – 4 years [ ] 5-6 years [ ] Above 6 years [ ]
6. How many employees does your firm have?
Below 100 [ ] 101 - 500 [ ] 501 – 1000 [ ] Above 1000 [ ]
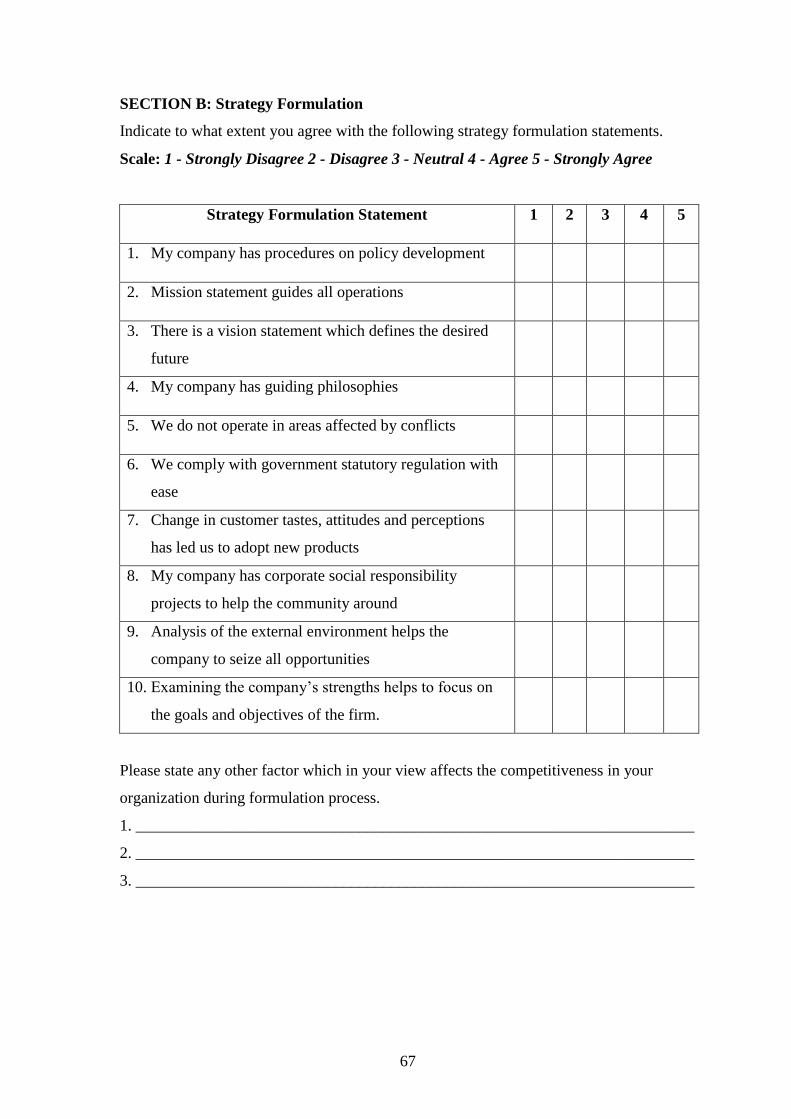
67
SECTION B: Strategy Formulation
Indicate to what extent you agree with the following strategy formulation statements.
Scale: 1 - Strongly Disagree 2 - Disagree 3 - Neutral 4 - Agree 5 - Strongly Agree
Strategy Formulation Statement 1 2 3 4 5
1. My company has procedures on policy development
2. Mission statement guides all operations
3. There is a vision statement which defines the desired
future
4. My company has guiding philosophies
5. We do not operate in areas affected by conflicts
6. We comply with government statutory regulation with
ease
7. Change in customer tastes, attitudes and perceptions
has led us to adopt new products
8. My company has corporate social responsibility
projects to help the community around
9. Analysis of the external environment helps the
company to seize all opportunities
10. Examining the company’s strengths helps to focus on
the goals and objectives of the firm.
Please state any other factor which in your view affects the competitiveness in your
organization during formulation process.
1. ______________________________________________________________________
2. ______________________________________________________________________
3. ______________________________________________________________________
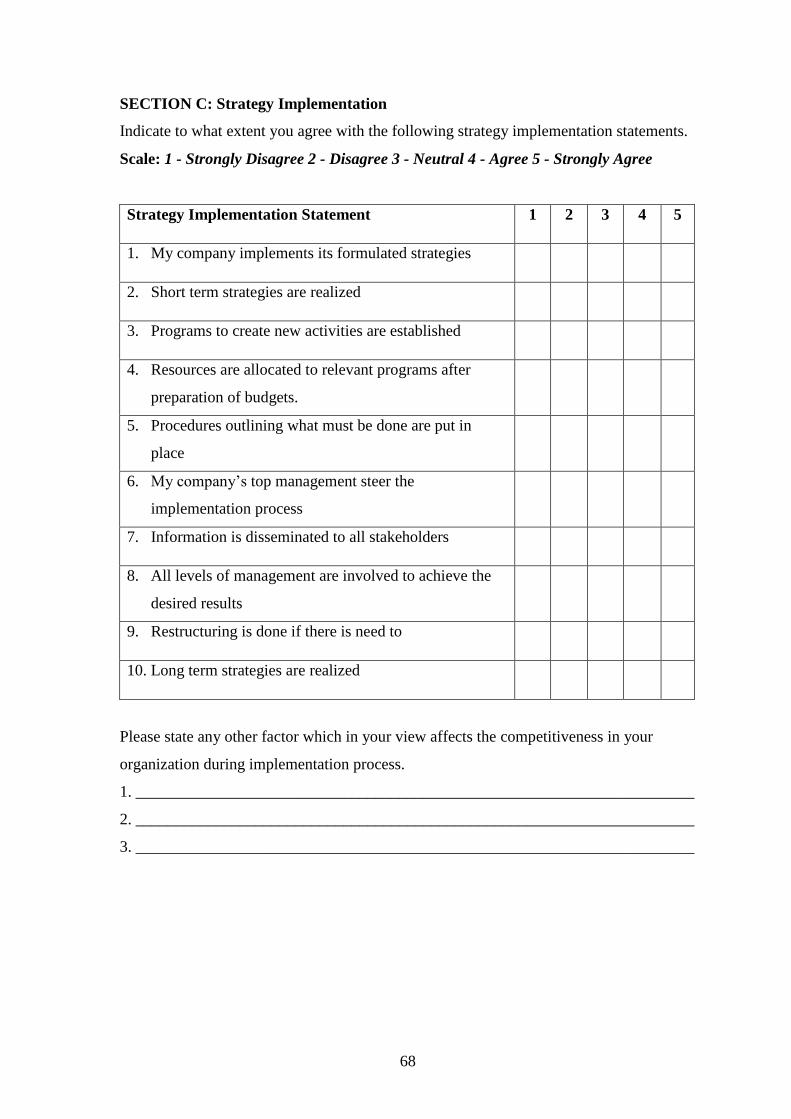
68
SECTION C: Strategy Implementation
Indicate to what extent you agree with the following strategy implementation statements.
Scale: 1 - Strongly Disagree 2 - Disagree 3 - Neutral 4 - Agree 5 - Strongly Agree
Strategy Implementation Statement 1 2 3 4 5
1. My company implements its formulated strategies
2. Short term strategies are realized
3. Programs to create new activities are established
4. Resources are allocated to relevant programs after
preparation of budgets.
5. Procedures outlining what must be done are put in
place
6. My company’s top management steer the
implementation process
7. Information is disseminated to all stakeholders
8. All levels of management are involved to achieve the
desired results
9. Restructuring is done if there is need to
10. Long term strategies are realized
Please state any other factor which in your view affects the competitiveness in your
organization during implementation process.
1. ______________________________________________________________________
2. ______________________________________________________________________
3. ______________________________________________________________________
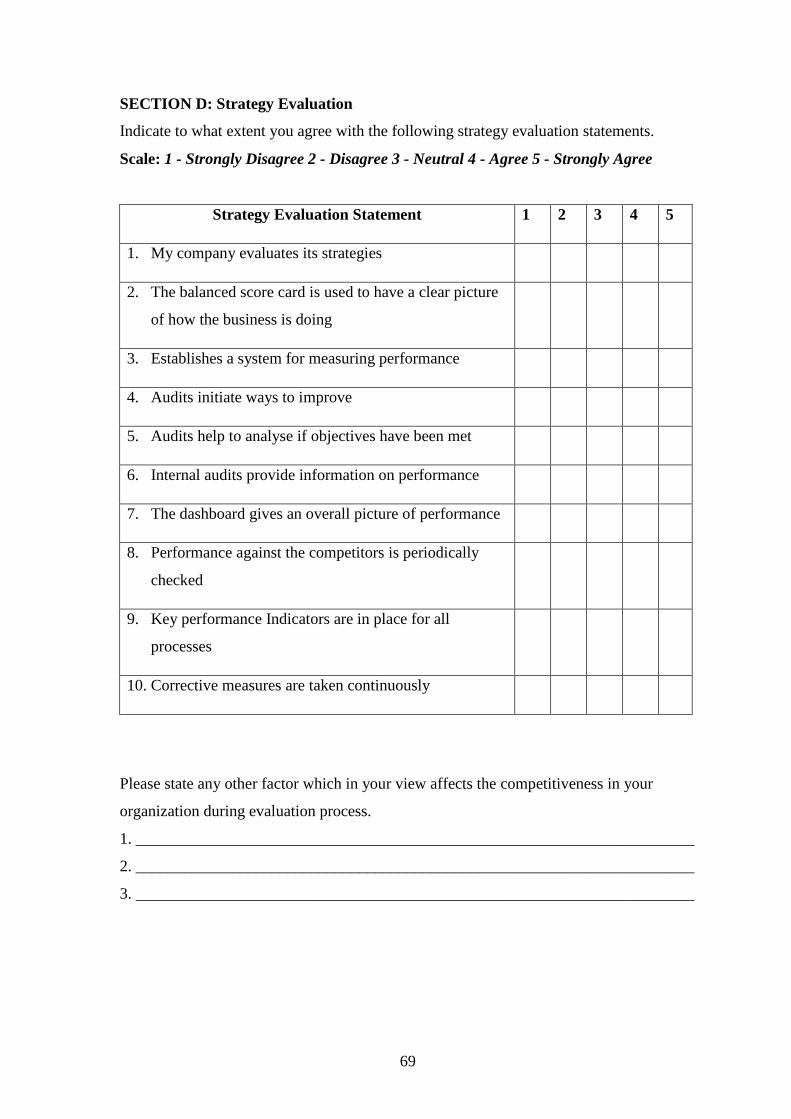
69
SECTION D: Strategy Evaluation
Indicate to what extent you agree with the following strategy evaluation statements.
Scale: 1 - Strongly Disagree 2 - Disagree 3 - Neutral 4 - Agree 5 - Strongly Agree
Strategy Evaluation Statement 1 2 3 4 5
1. My company evaluates its strategies
2. The balanced score card is used to have a clear picture
of how the business is doing
3. Establishes a system for measuring performance
4. Audits initiate ways to improve
5. Audits help to analyse if objectives have been met
6. Internal audits provide information on performance
7. The dashboard gives an overall picture of performance
8. Performance against the competitors is periodically
checked
9. Key performance Indicators are in place for all
processes
10. Corrective measures are taken continuously
Please state any other factor which in your view affects the competitiveness in your
organization during evaluation process.
1. ______________________________________________________________________
2. ______________________________________________________________________
3. ______________________________________________________________________
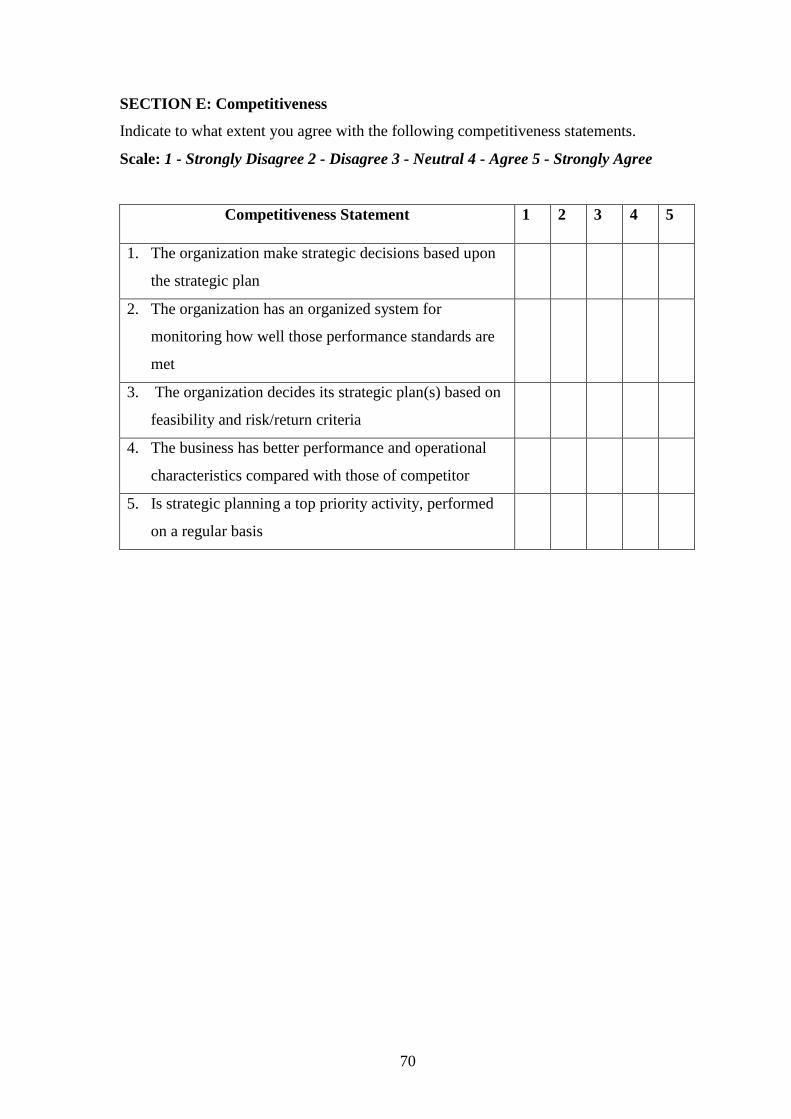
70
SECTION E: Competitiveness
Indicate to what extent you agree with the following competitiveness statements.
Scale: 1 - Strongly Disagree 2 - Disagree 3 - Neutral 4 - Agree 5 - Strongly Agree
Competitiveness Statement 1 2 3 4 5
1. The organization make strategic decisions based upon
the strategic plan
2. The organization has an organized system for
monitoring how well those performance standards are
met
3. The organization decides its strategic plan(s) based on
feasibility and risk/return criteria
4. The business has better performance and operational
characteristics compared with those of competitor
5. Is strategic planning a top priority activity, performed
on a regular basis
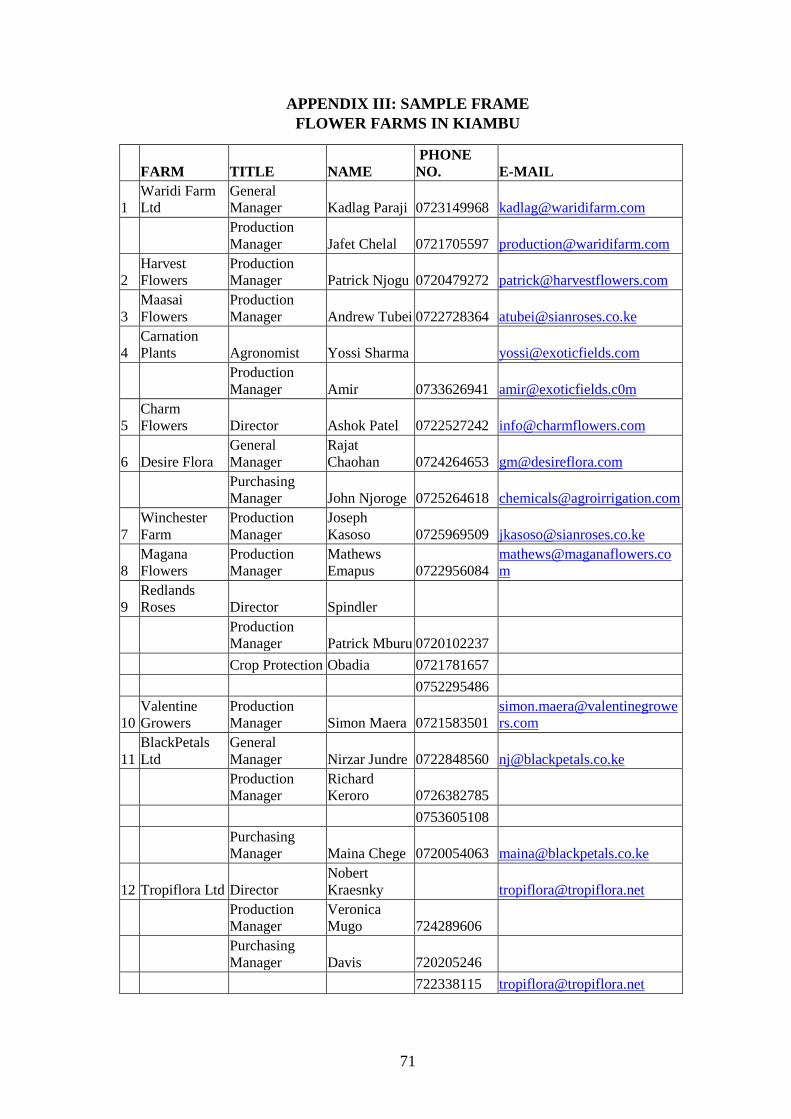
71
APPENDIX III: SAMPLE FRAME
FLOWER FARMS IN KIAMBU
FARM TITLE NAME
PHONE
NO. E-MAIL
1
Waridi Farm
Ltd
General
Manager Kadlag Paraji 0723149968 [email protected]
Production
Manager Jafet Chelal 0721705597 [email protected]
2
Harvest
Flowers
Production
Manager Patrick Njogu 0720479272 [email protected]
3
Maasai
Flowers
Production
Manager Andrew Tubei 0722728364 [email protected]
4
Carnation
Plants Agronomist Yossi Sharma [email protected]
Production
Manager Amir 0733626941 [email protected]
5
Charm
Flowers Director Ashok Patel 0722527242 [email protected]
6 Desire Flora
General
Manager
Rajat
Chaohan 0724264653 [email protected]
Purchasing
Manager John Njoroge 0725264618 [email protected]
7
Winchester
Farm
Production
Manager
Joseph
Kasoso 0725969509 [email protected]
8
Magana
Flowers
Production
Manager
Mathews
Emapus 0722956084
m
9
Redlands
Roses Director Spindler
Production
Manager Patrick Mburu 0720102237
Crop Protection Obadia 0721781657
0752295486
10
Valentine
Growers
Production
Manager Simon Maera 0721583501
simon.maera@valentinegrowe
rs.com
11
BlackPetals
Ltd
General
Manager Nirzar Jundre 0722848560 [email protected]
Production
Manager
Richard
Keroro 0726382785
0753605108
Purchasing
Manager Maina Chege 0720054063 [email protected]
12 Tropiflora Ltd Director
Nobert
Kraesnky [email protected]
Production
Manager
Veronica
Mugo 724289606
Purchasing
Manager Davis 720205246
722338115 [email protected]

72
13 Fairy Flowers
General
Manager
James
Kelmanson
Production
Manager John Mbauni 0753888126
Production
Manager
Sylvester
Muchiri 0753444237
14 Kariki Ltd Farm Manager
Samuel
Kamau 0722337579 [email protected]
15
Windsor
Flowers
General
Manager Vikash Singh 0733968757
Crop Protection
James
Gacheru 0726786968
16 Zena Roses
Production
Manager Peter Ochami 0712006323
.ke
Purchasing
Manager
Bedah
Wafubwa 0727955926 [email protected]
17 Enkasiti Roses Farm Manager Tambe 0734256798
18 Simbi Roses
General
Manager
Jefferson
Karue [email protected]
Production
Manager
Philip
Musonye 0726056493 [email protected]
Crop Protection Mark Kiplagat 0722959087 [email protected]
19
Branan
Flowers Farm Manager
David
Muchiri 0724646810 [email protected]
20 AAA-Thika Farm Manager Steve Chege [email protected]
21
P.J Dave
Flowers
General
Manager Stuart 0733333230 [email protected]
Production
Manager
Promina
Ngasu 0714153556 [email protected]
Purchasing
Manager Bhavesh 0722131666 [email protected]
Source (Kenya Flower Council, 2013)