Embed Size (px)
Citation preview
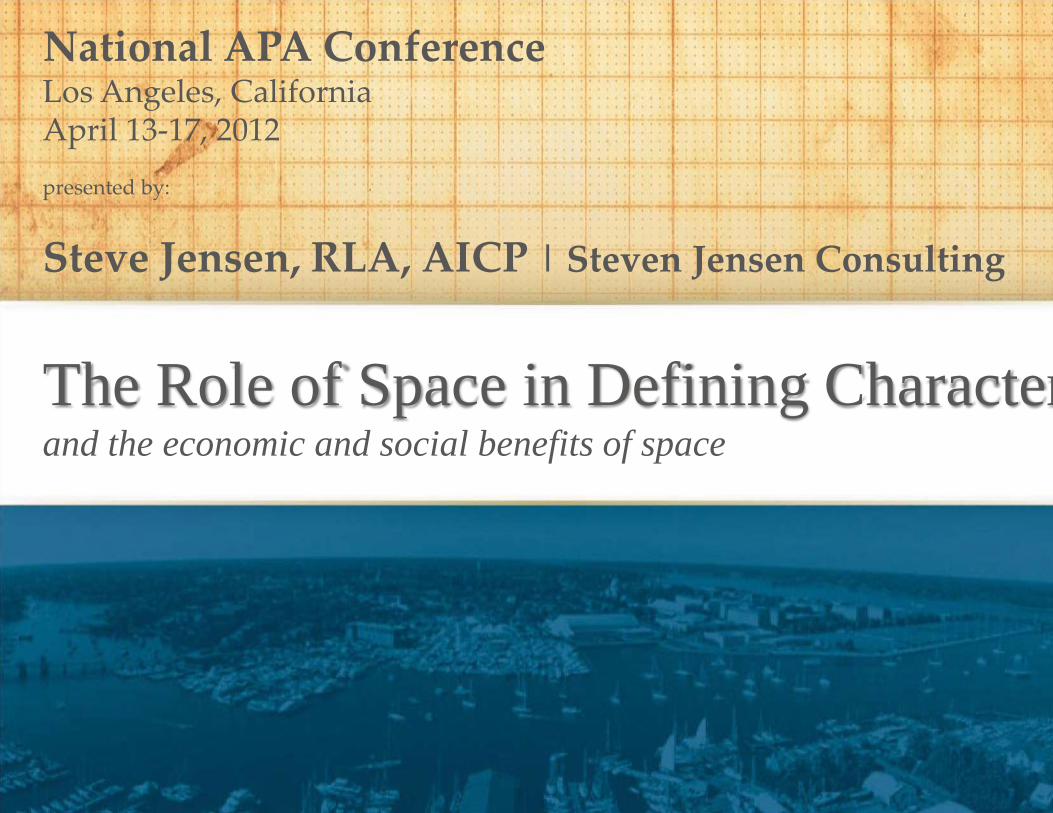
The Role of Space in Defining Character and the economic and social benefits of space
National APA Conference Los Angeles, California April 13-17, 2012 presented by:
Bret C. Keast, AICP | Kendig Keast Collaborative Greg Flisram, AICP, CEcD | City of Green Bay
Steve Jensen, AICP | Steve Jensen Consulting
1.25 CM credit - APA
1.25 PDH credit - ASLA
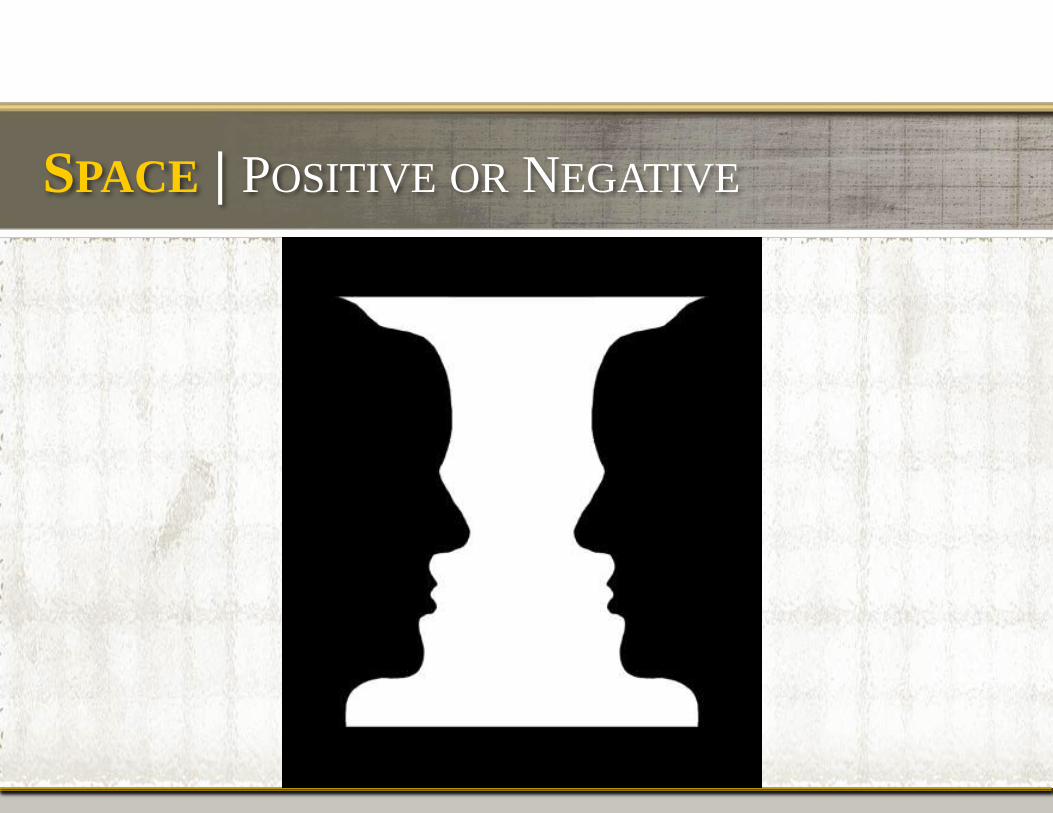
SPACE | POSITIVE OR NEGATIVE
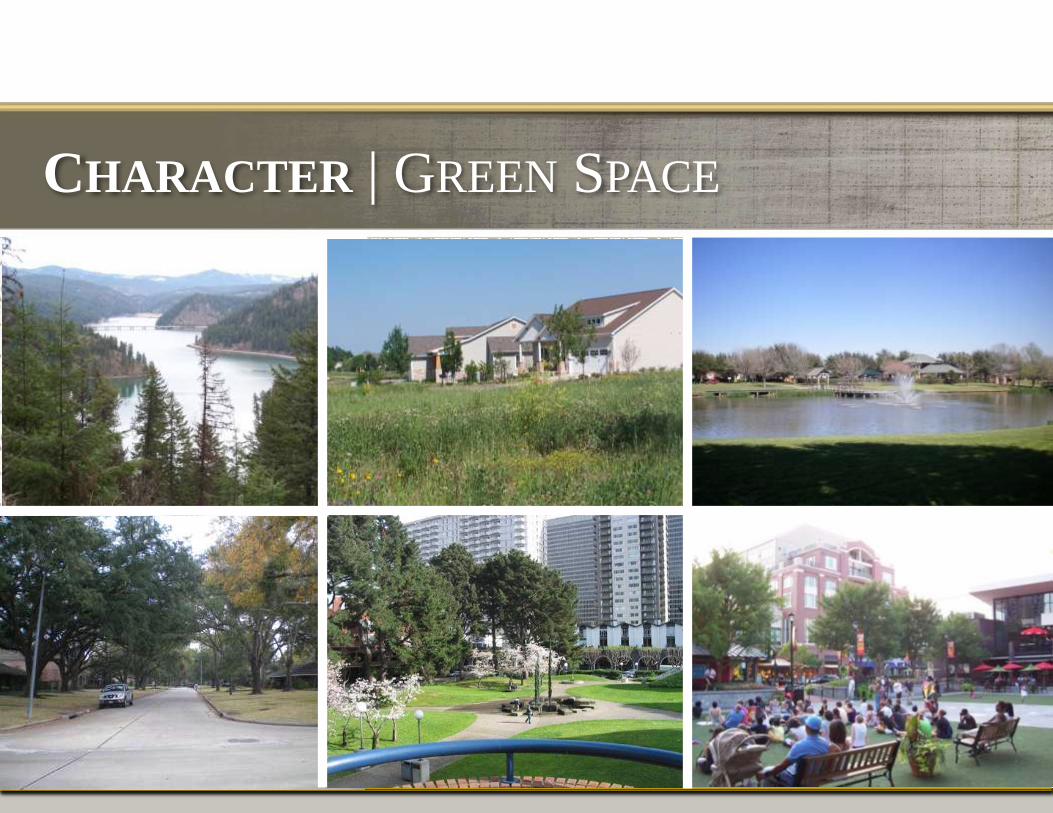
CHARACTER | GREEN SPACE
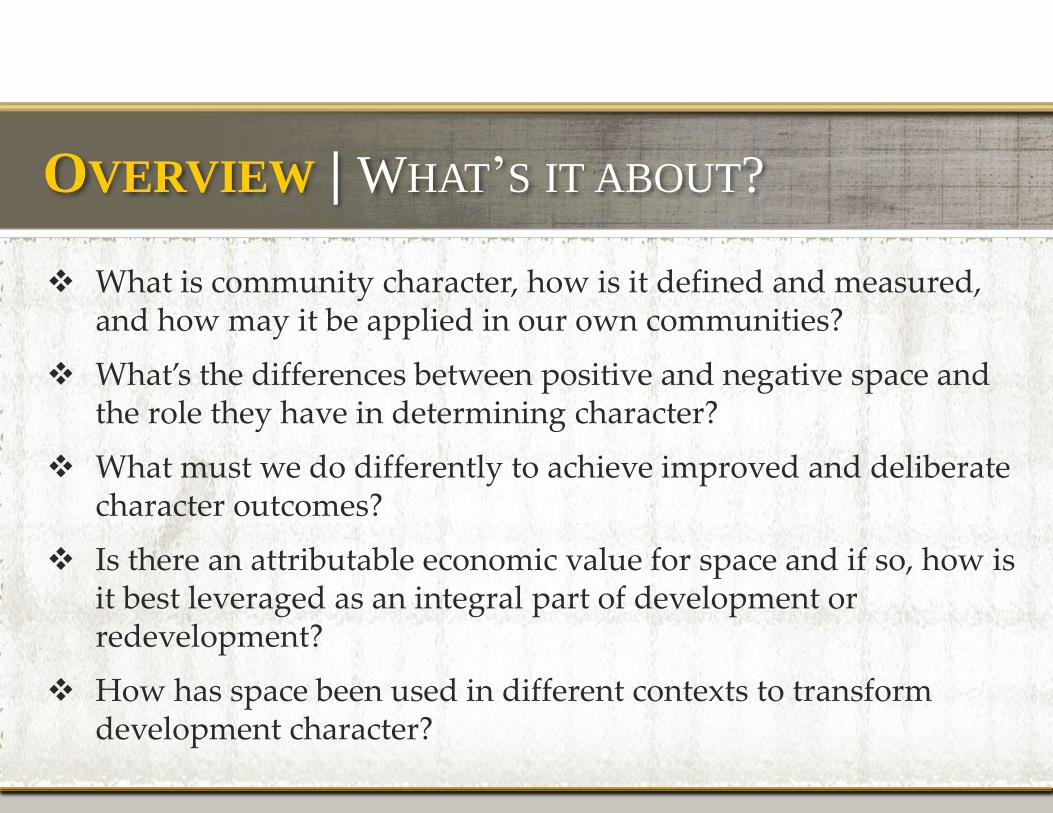
What is community character, how is it defined and measured, and how may it be applied in our own communities?
What’s the differences between positive and negative space and the role they have in determining character?
What must we do differently to achieve improved and deliberate character outcomes?
Is there an attributable economic value for space and if so, how is it best leveraged as an integral part of development or redevelopment?
How has space been used in different contexts to transform development character?
OVERVIEW | WHAT’S IT ABOUT?
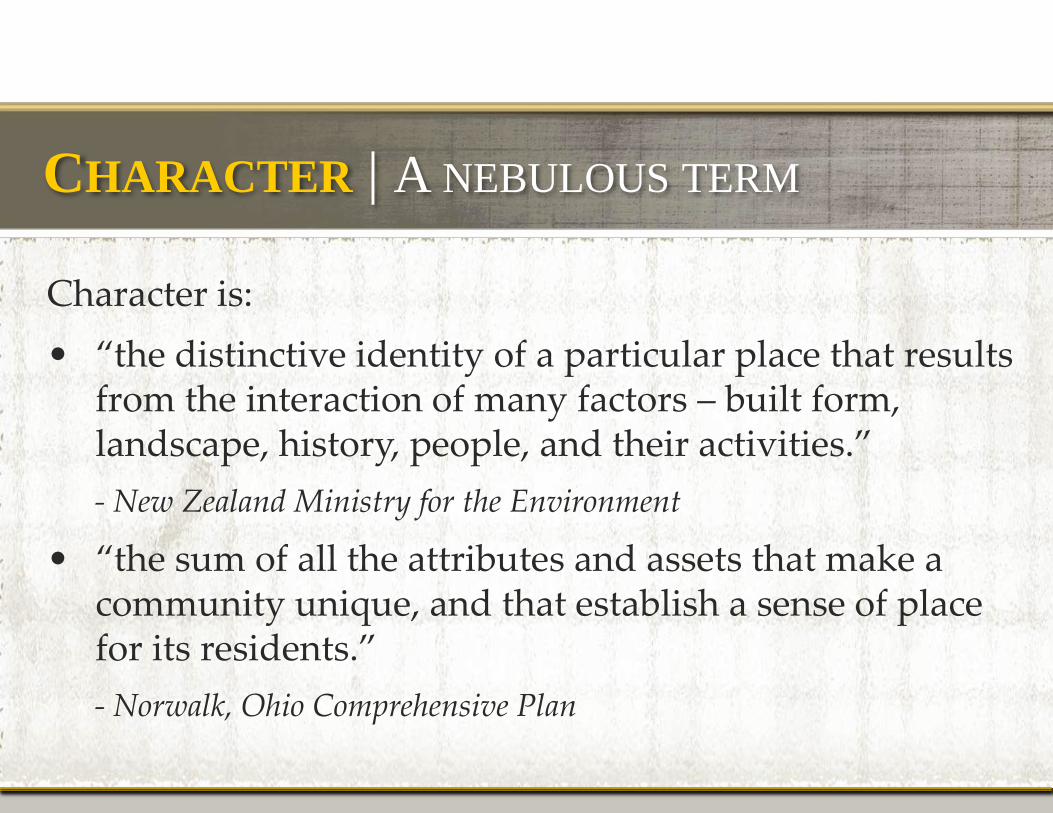
Character is:
• “the distinctive identity of a particular place that results from the interaction of many factors – built form, landscape, history, people, and their activities.”
- New Zealand Ministry for the Environment
• “the sum of all the attributes and assets that make a community unique, and that establish a sense of place for its residents.”
- Norwalk, Ohio Comprehensive Plan
CHARACTER | A NEBULOUS TERM
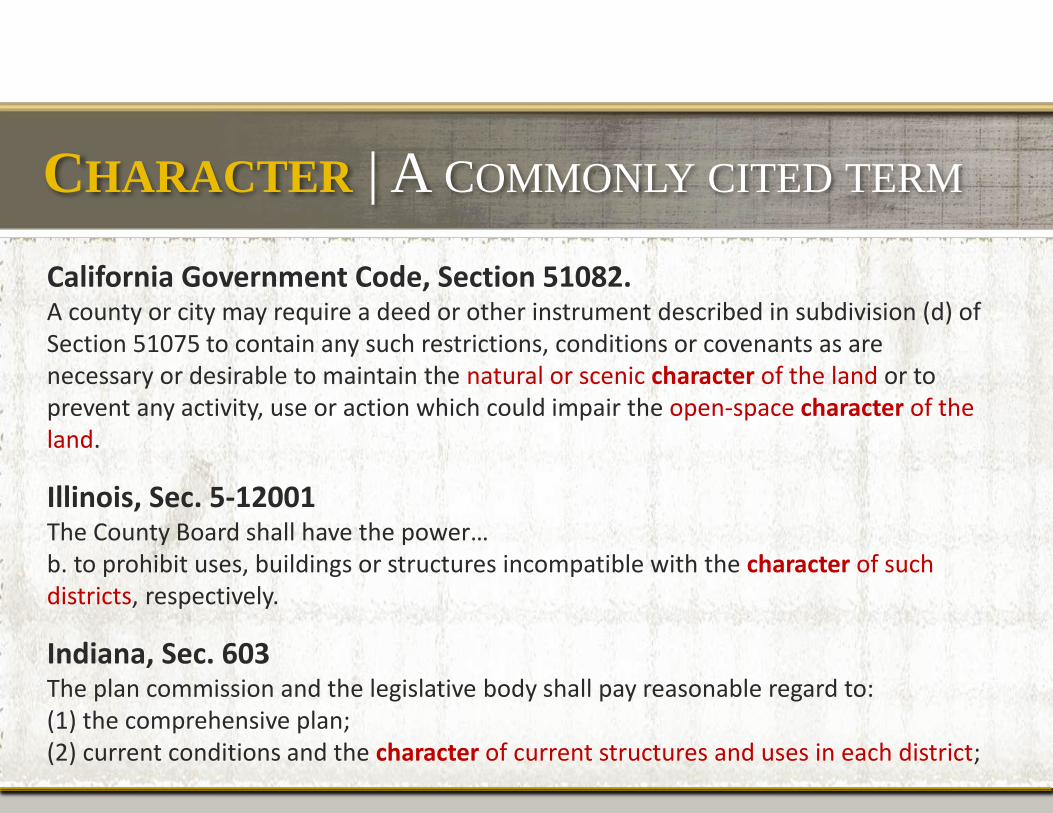
California Government Code, Section 51082. A county or city may require a deed or other instrument described in subdivision (d) of Section 51075 to contain any such restrictions, conditions or covenants as are necessary or desirable to maintain the natural or scenic character of the land or to prevent any activity, use or action which could impair the open-space character of the land.
Illinois, Sec. 5-12001 The County Board shall have the power… b. to prohibit uses, buildings or structures incompatible with the character of such districts, respectively.
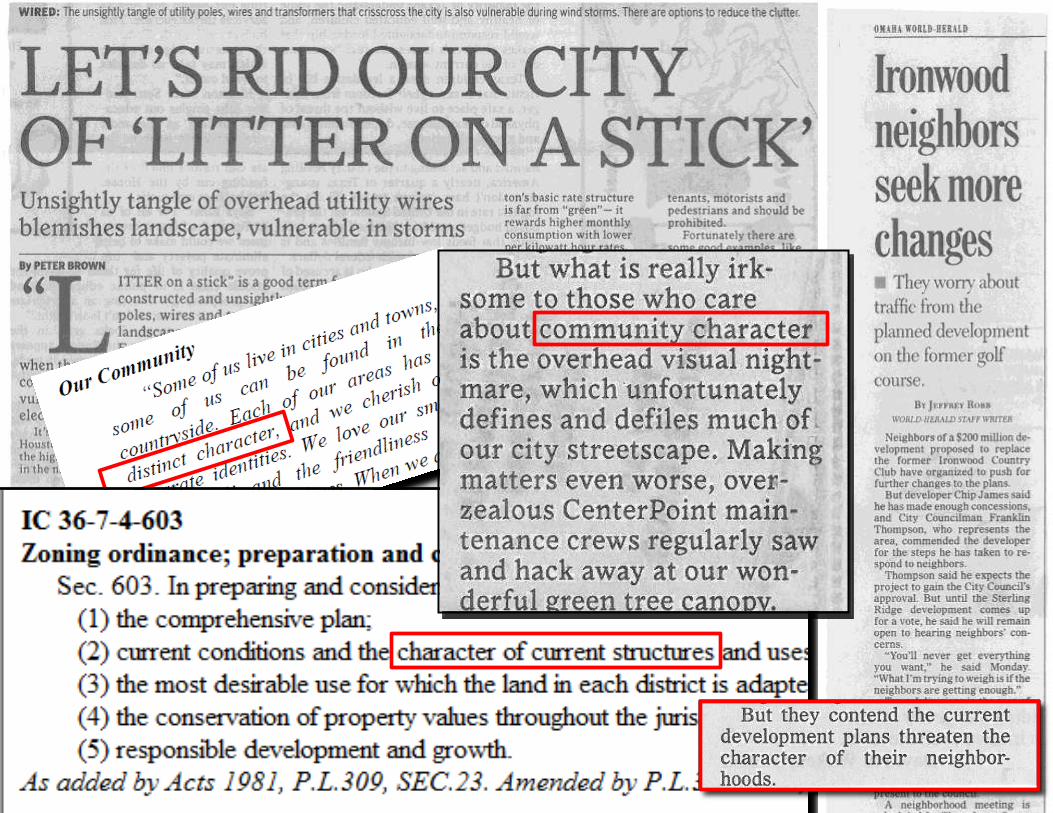
Indiana, Sec. 603 The plan commission and the legislative body shall pay reasonable regard to: (1) the comprehensive plan; (2) current conditions and the character of current structures and uses in each district;
CHARACTER | A COMMONLY CITED TERM
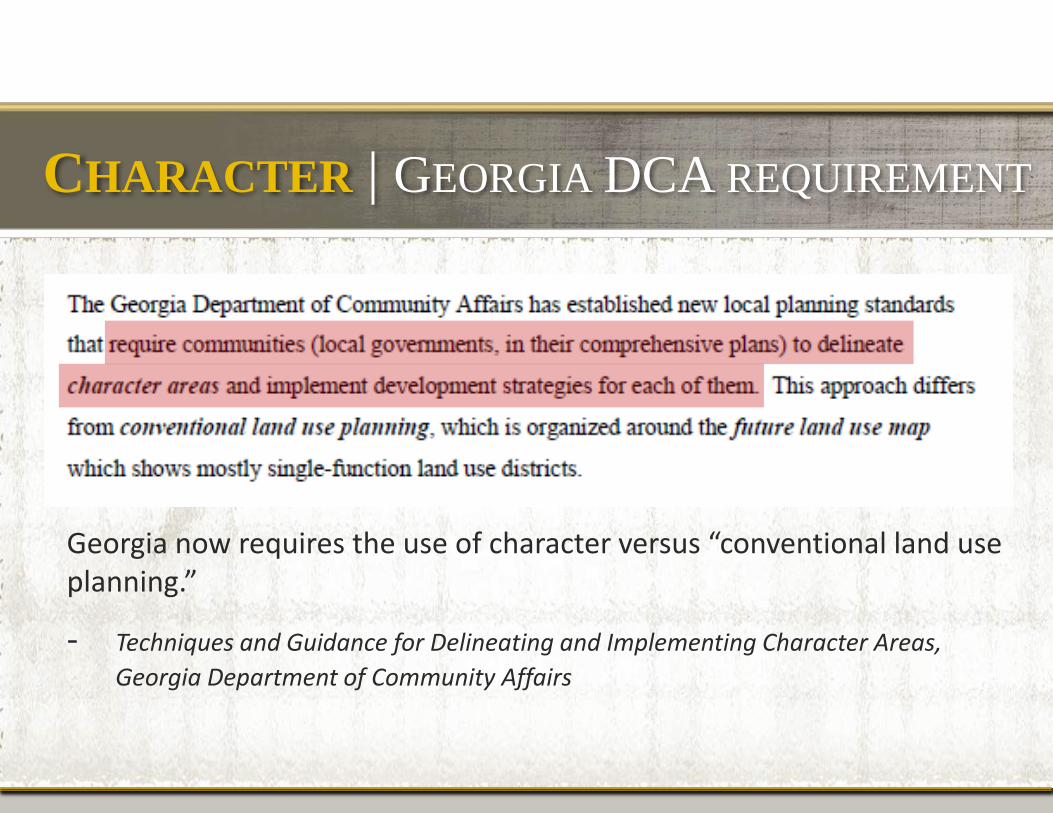
CHARACTER | GEORGIA DCA REQUIREMENT
Georgia now requires the use of character versus “conventional land use planning.”
- Techniques and Guidance for Delineating and Implementing Character Areas,
Georgia Department of Community Affairs
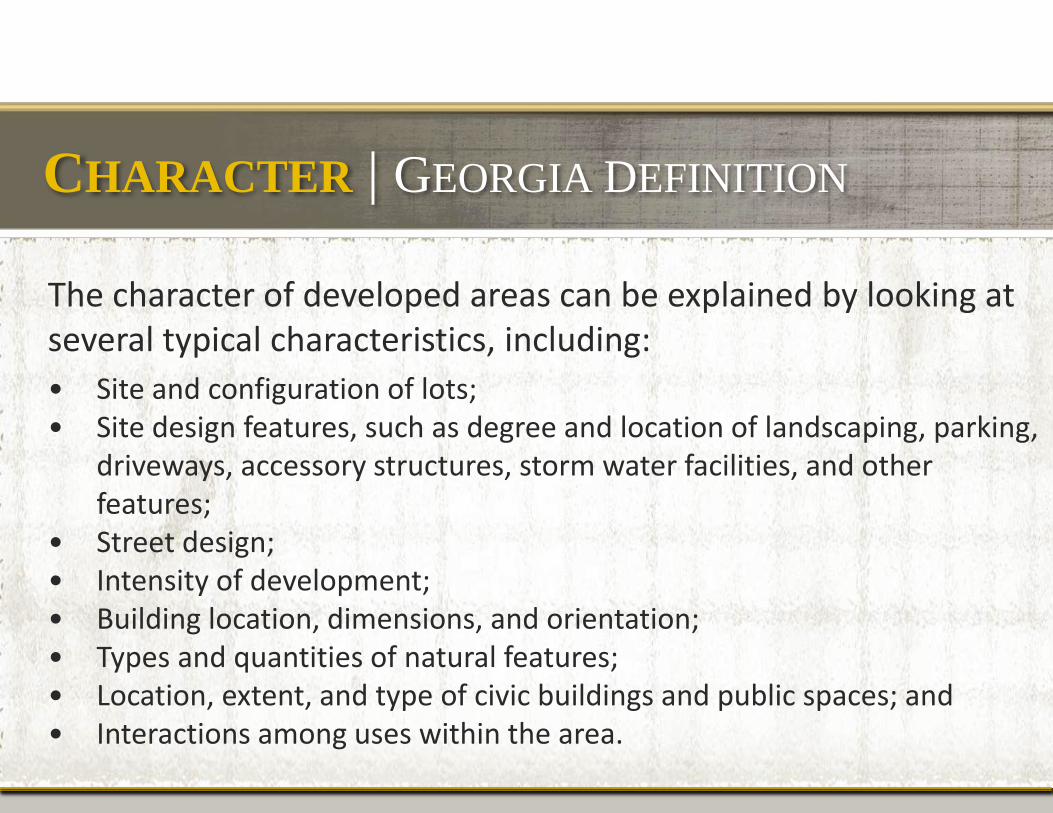
CHARACTER | GEORGIA DEFINITION
The character of developed areas can be explained by looking at several typical characteristics, including:
• Site and configuration of lots; • Site design features, such as degree and location of landscaping, parking,
driveways, accessory structures, storm water facilities, and other features;
• Street design; • Intensity of development; • Building location, dimensions, and orientation; • Types and quantities of natural features; • Location, extent, and type of civic buildings and public spaces; and • Interactions among uses within the area.
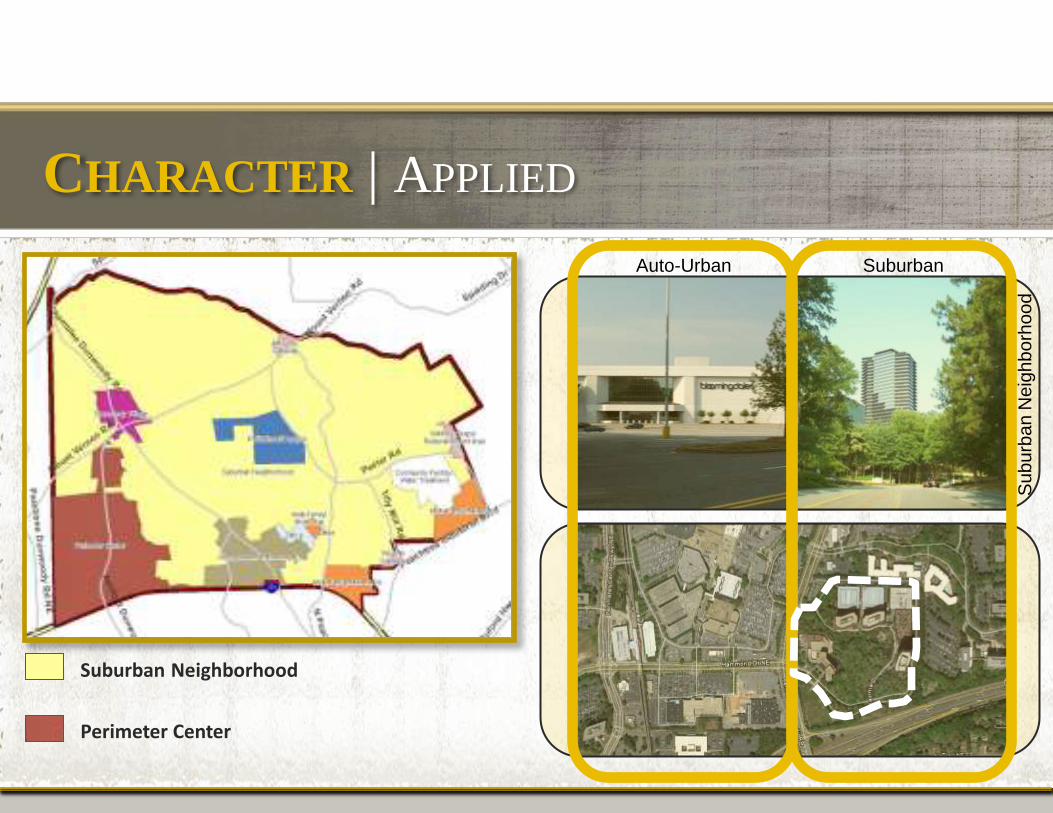
Suburban Neighborhood
Perimeter Center
Auto-Urban Suburban
Suburb
an N
eig
hborh
ood
CHARACTER | APPLIED
POSITIVE SPACE | VS. NEGATIVE SPACE
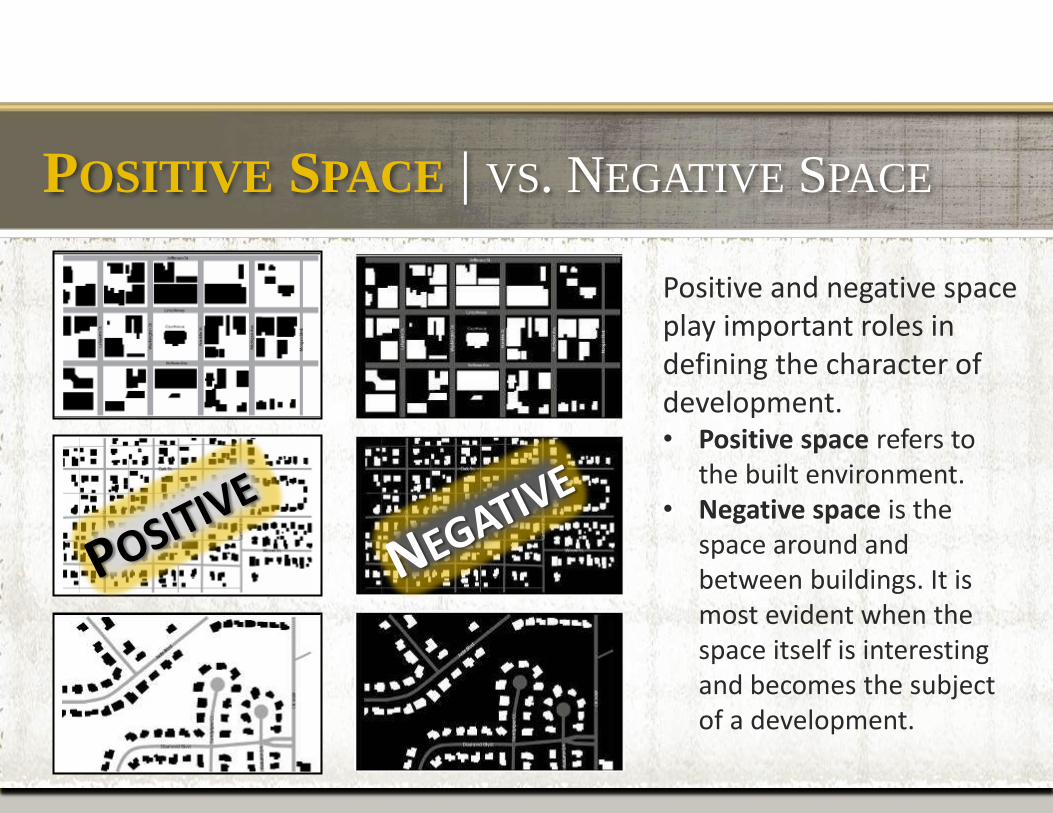
Positive and negative space play important roles in defining the character of development. • Positive space refers to
the built environment. • Negative space is the
space around and between buildings. It is most evident when the space itself is interesting and becomes the subject of a development.
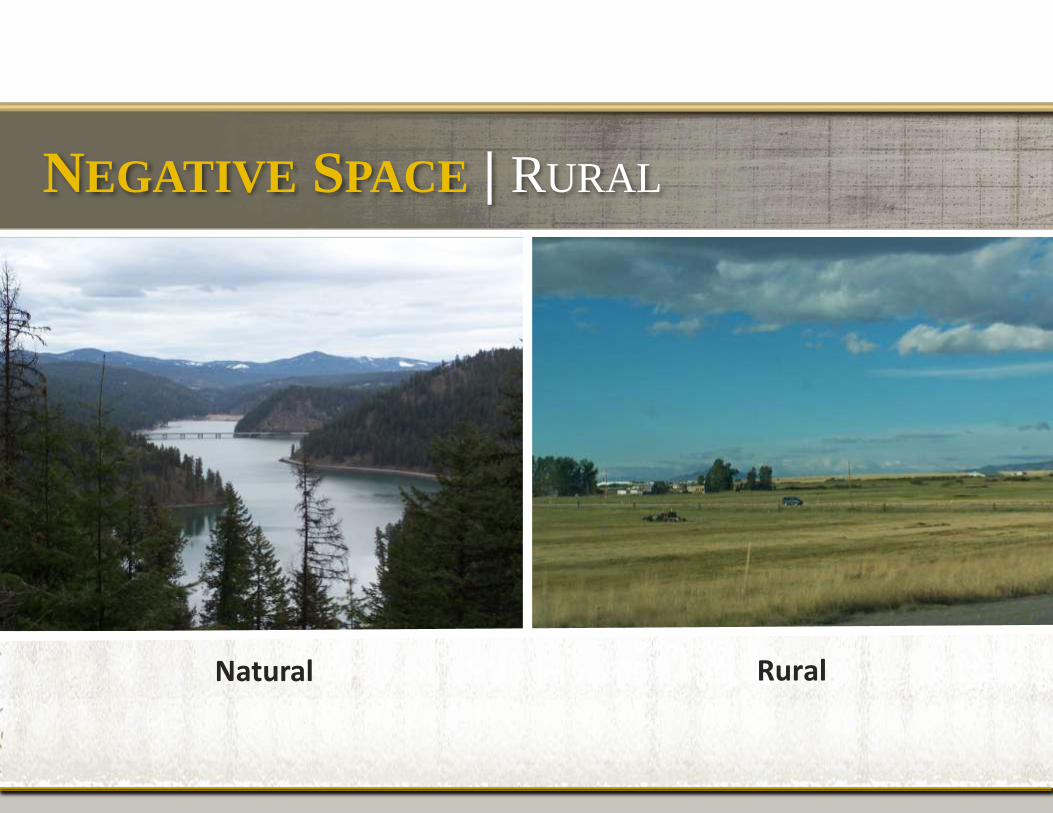
NEGATIVE SPACE | RURAL
Natural Rural

NEGATIVE SPACE | SUBURBAN
Vegetated Street Environs Neighborhood Park
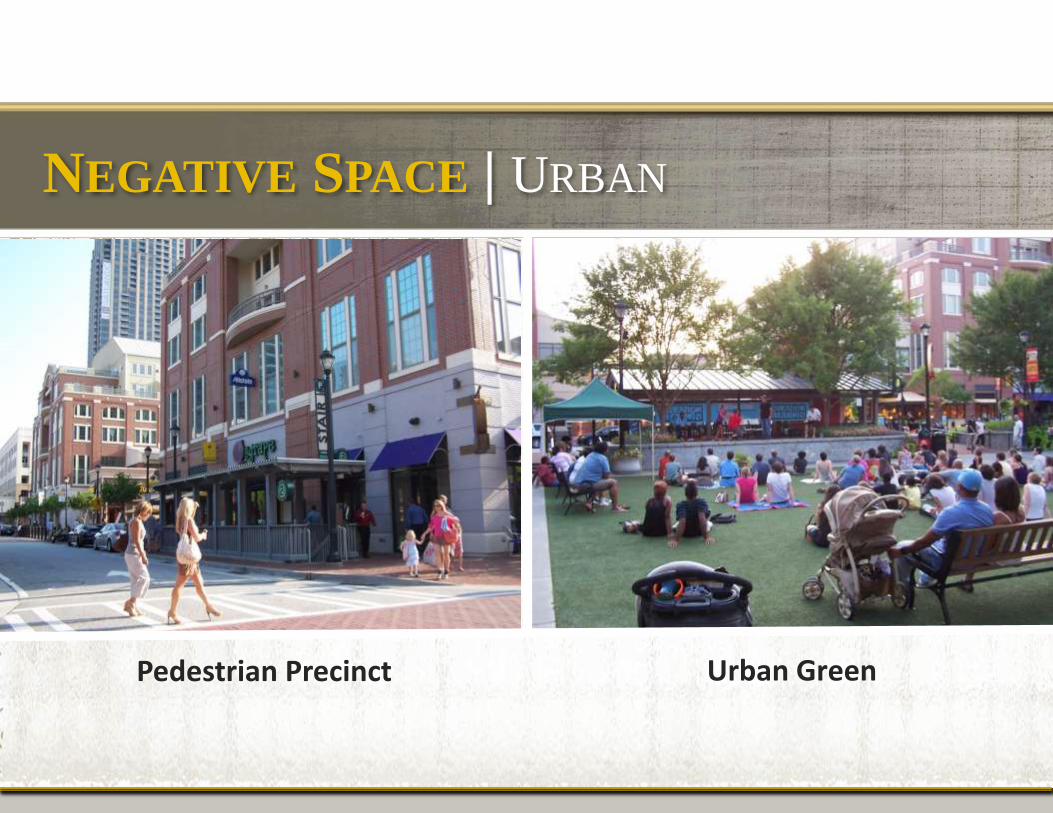
NEGATIVE SPACE | URBAN
Pedestrian Precinct Urban Green
Community character:
describes a continuum from rural to urban, in which the relative balance of various elements (e.g., buildings, vehicular use areas, and “green” open spaces) changes along the continuum.
This continuum relates to a relative scale of development intensities, stretching across a spectrum from undisturbed natural settings to the most intensely developed urban centers.
CHARACTER | DEFINED
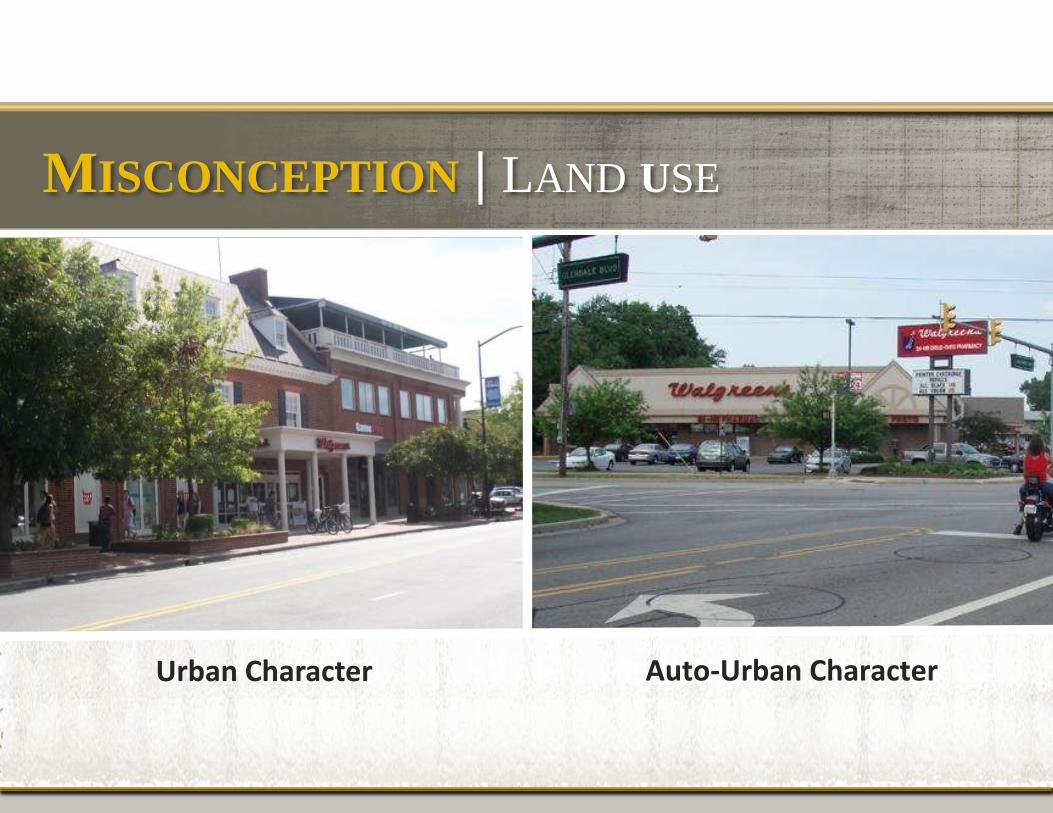
MISCONCEPTION | LAND USE
Urban Character Auto-Urban Character
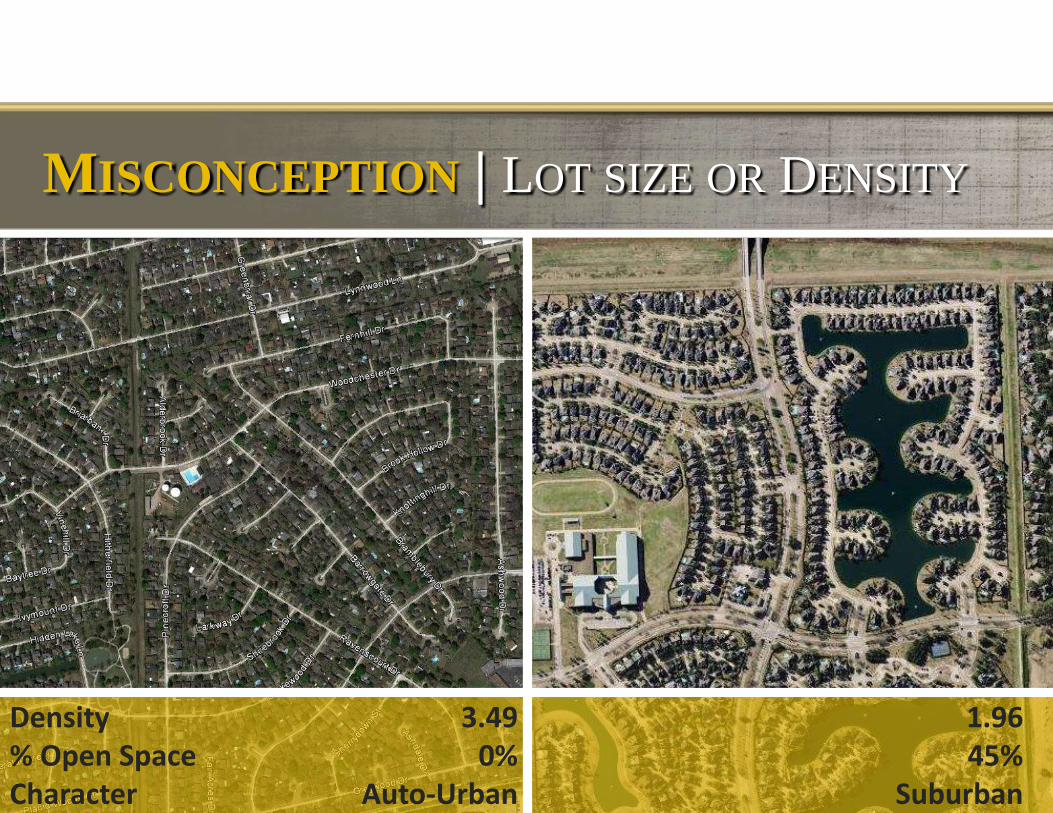
MISCONCEPTION | LOT SIZE OR DENSITY
Density % Open Space Character
3.49 0%
Auto-Urban
1.96 45%
Suburban
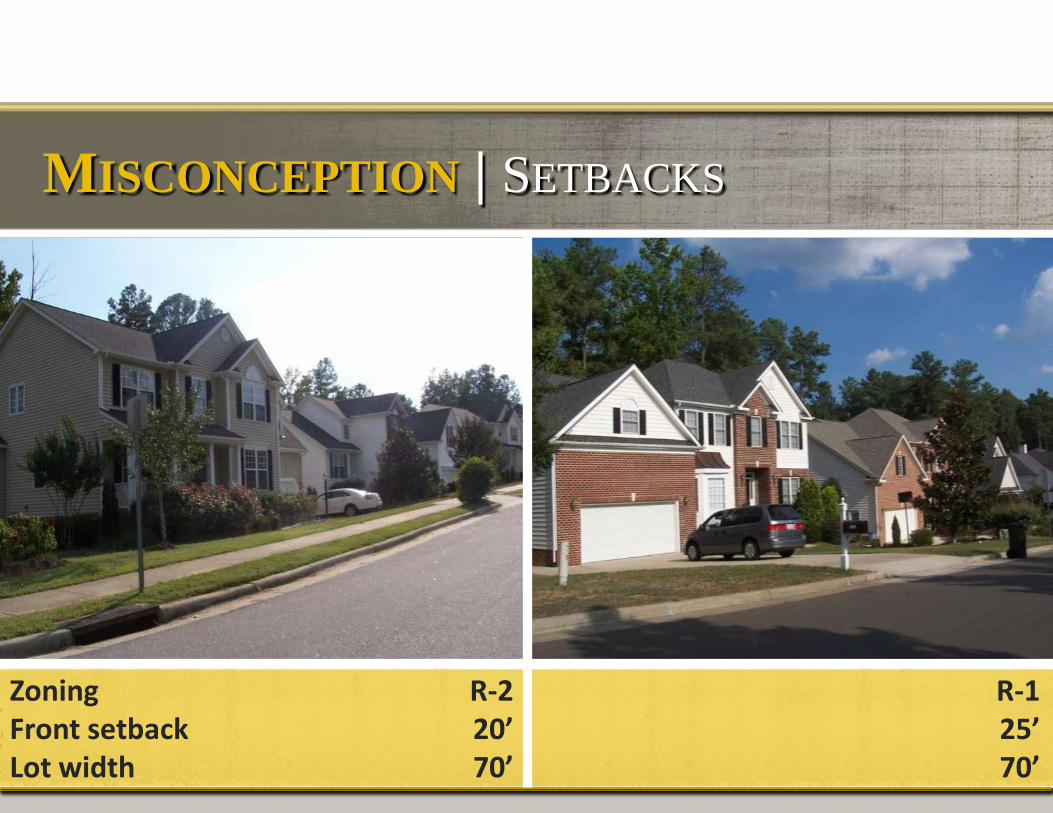
MISCONCEPTION | SETBACKS
Zoning Front setback Lot width
R-2 20’ 70’
R-1 25’ 70’
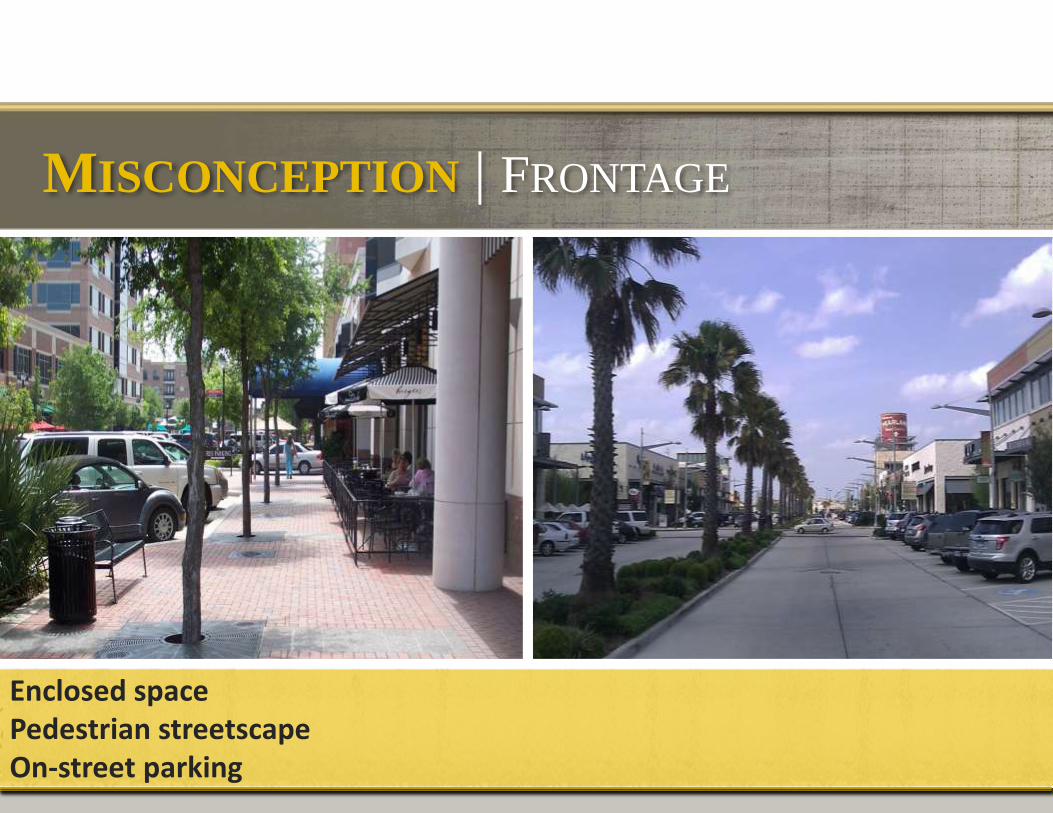
MISCONCEPTION | FRONTAGE
Enclosed space Pedestrian streetscape On-street parking
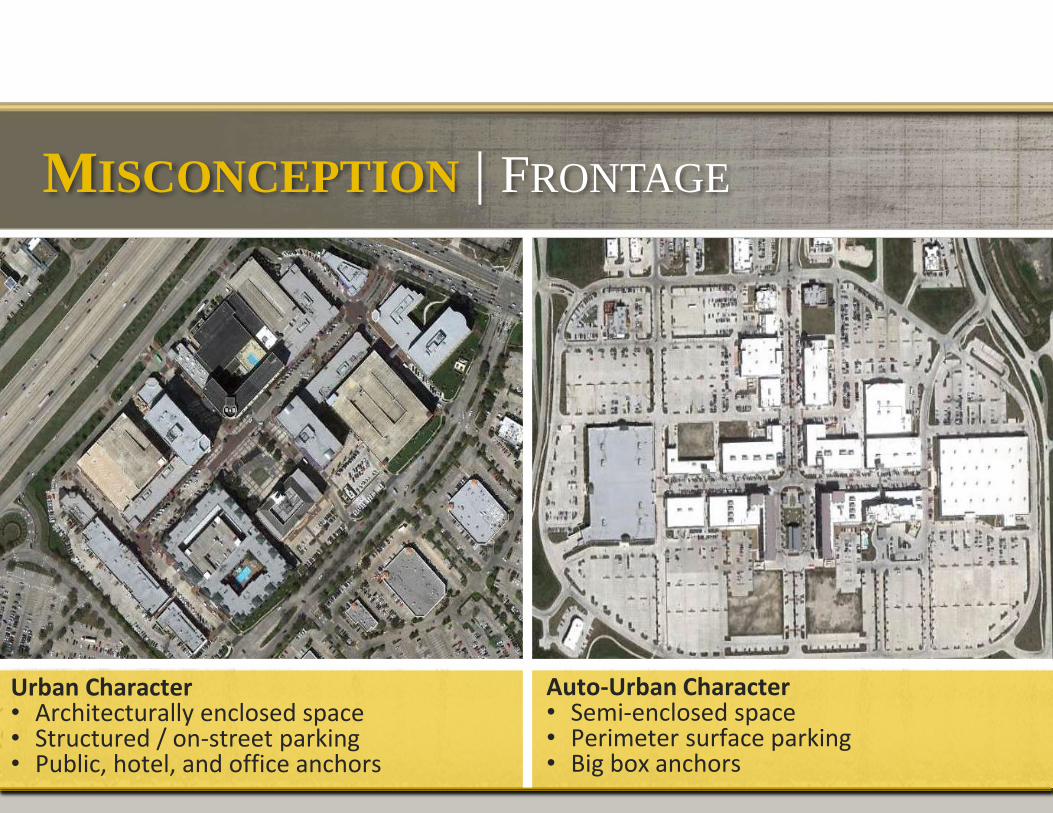
Urban Character • Architecturally enclosed space • Structured / on-street parking • Public, hotel, and office anchors
Auto-Urban Character • Semi-enclosed space • Perimeter surface parking • Big box anchors
MISCONCEPTION | FRONTAGE
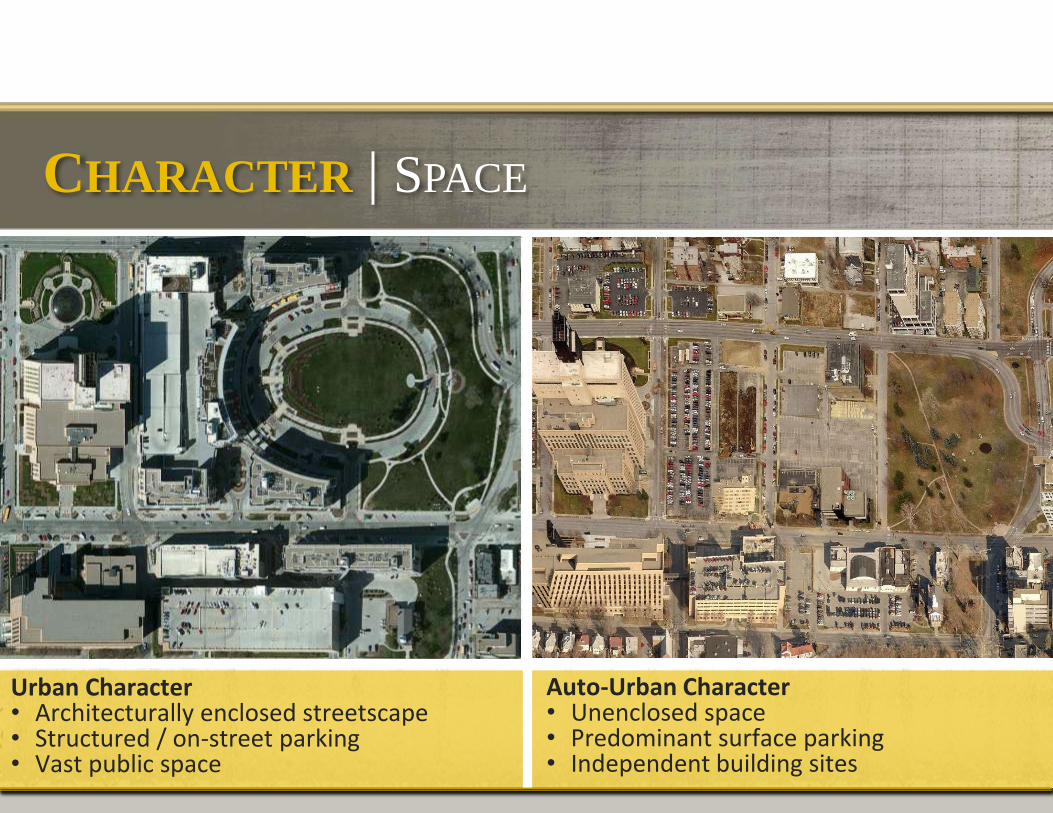
Urban Character • Architecturally enclosed streetscape • Structured / on-street parking • Vast public space
Auto-Urban Character • Unenclosed space • Predominant surface parking • Independent building sites
CHARACTER | SPACE
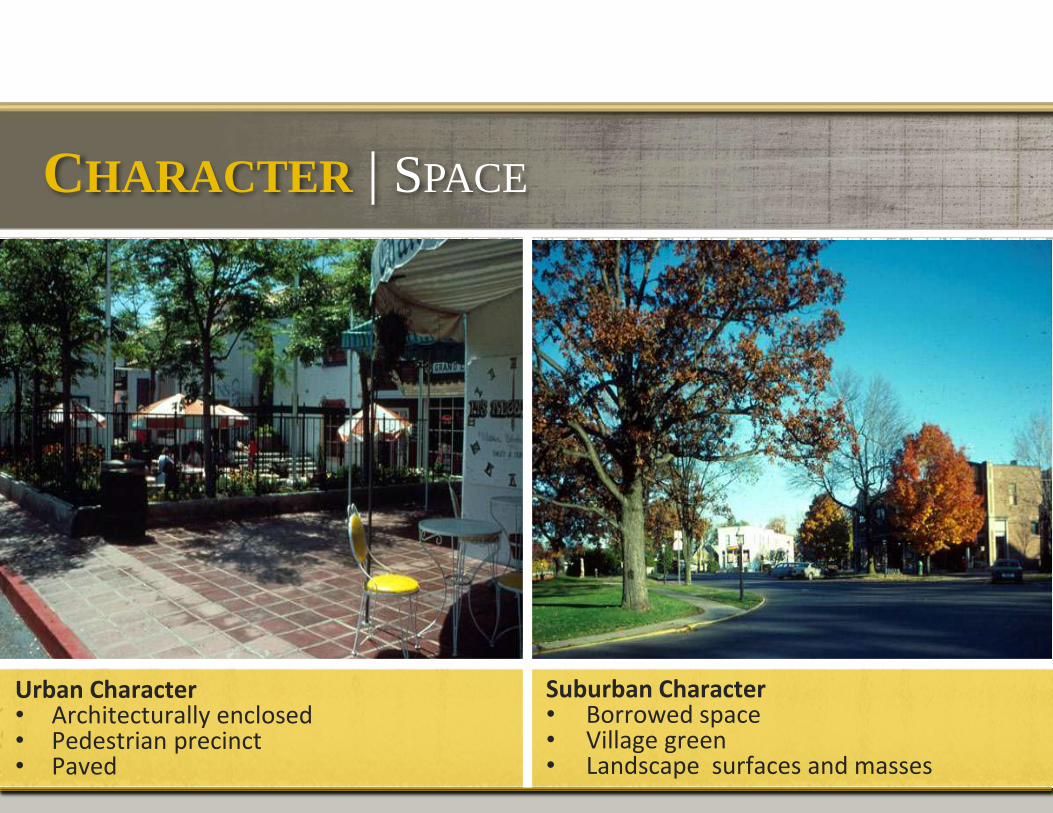
CHARACTER | SPACE
Urban Character • Architecturally enclosed • Pedestrian precinct • Paved
Suburban Character • Borrowed space • Village green • Landscape surfaces and masses
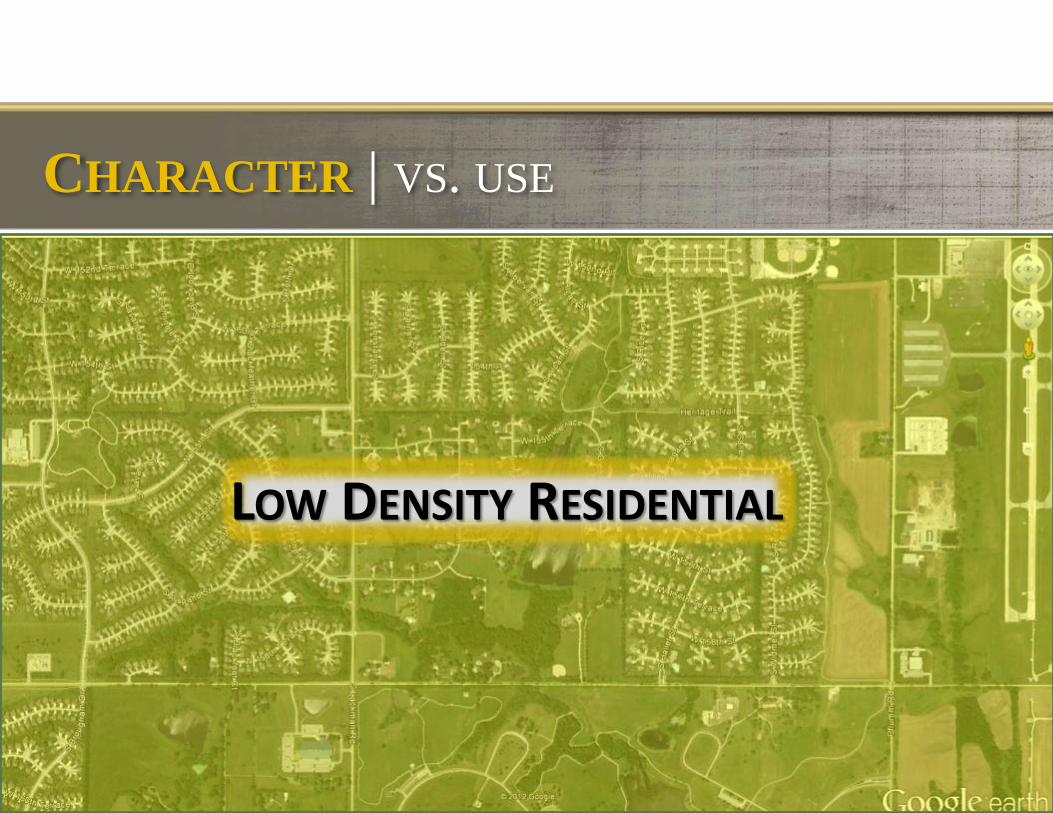
LOW DENSITY RESIDENTIAL
CHARACTER | VS. USE
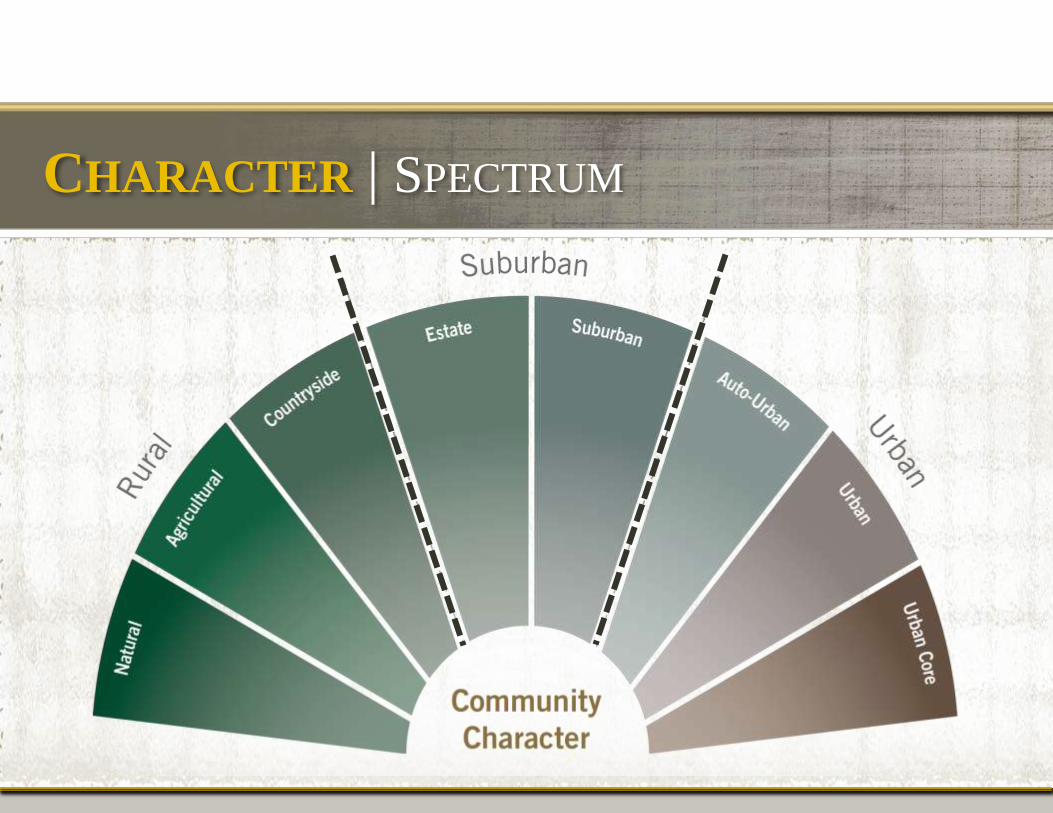
CHARACTER | SPECTRUM
CHARACTER | SPACE
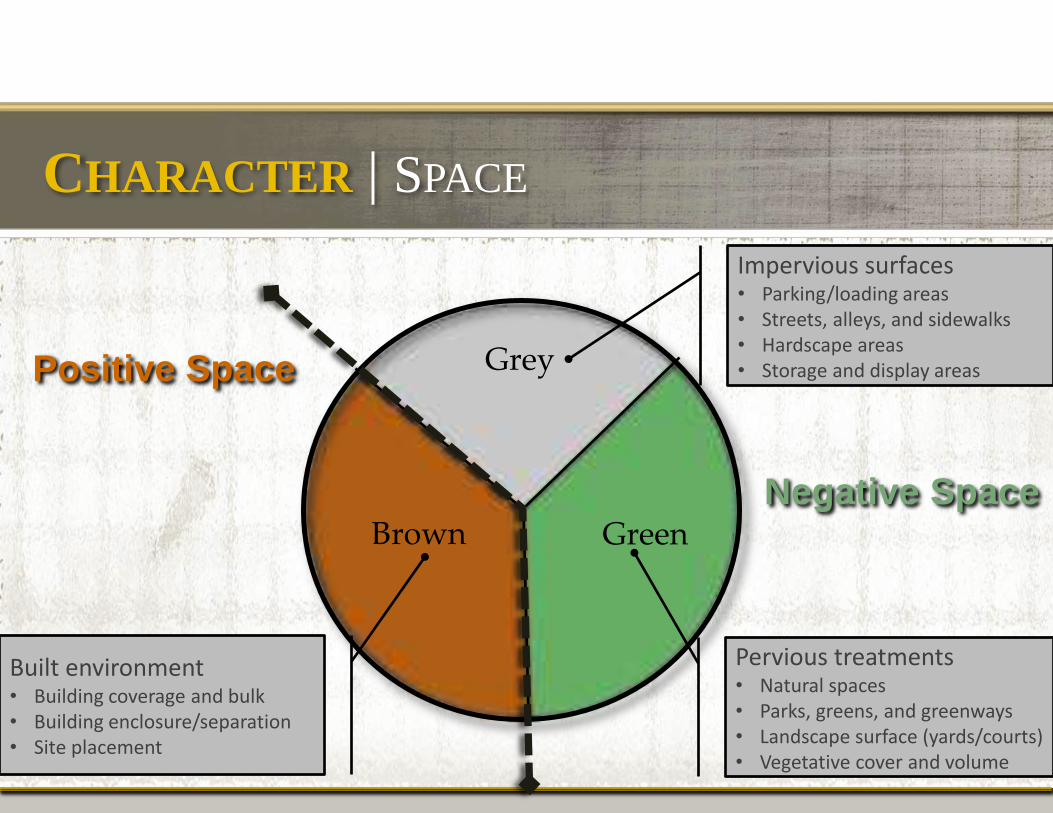
Green Brown
Grey
Impervious surfaces • Parking/loading areas • Streets, alleys, and sidewalks • Hardscape areas • Storage and display areas
Pervious treatments • Natural spaces • Parks, greens, and greenways • Landscape surface (yards/courts) • Vegetative cover and volume
Built environment • Building coverage and bulk • Building enclosure/separation • Site placement
Positive Space
Negative Space
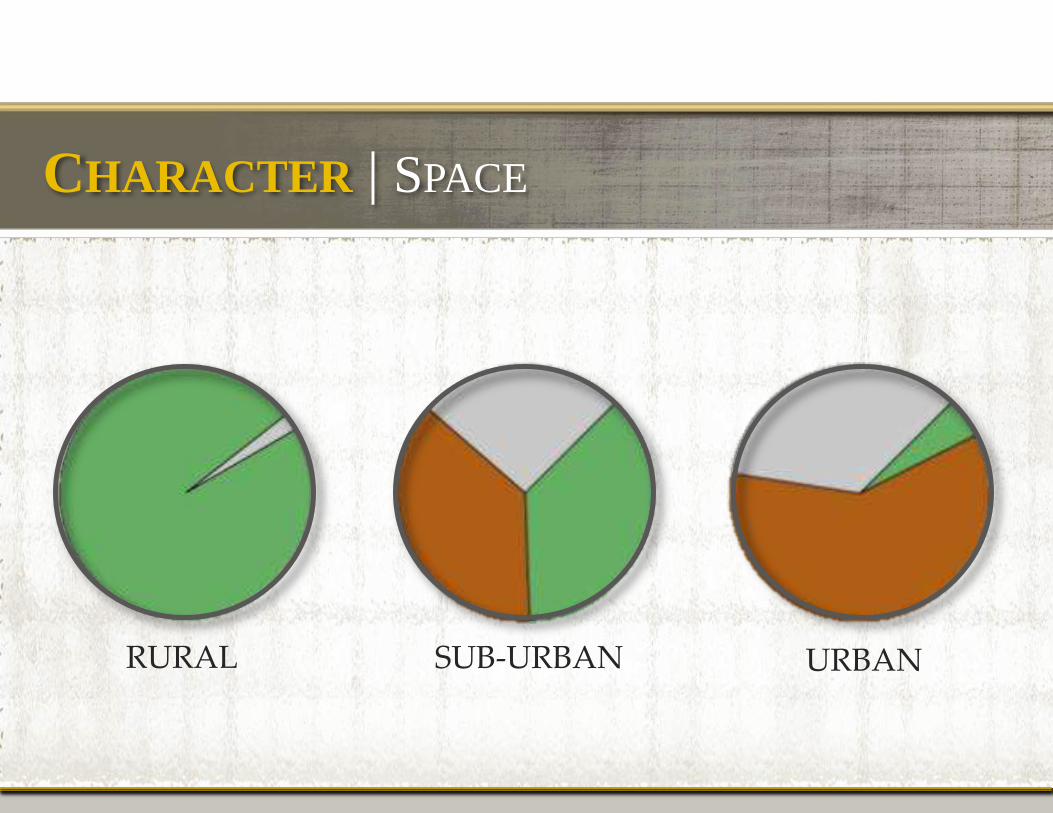
CHARACTER | SPACE
RURAL SUB-URBAN URBAN
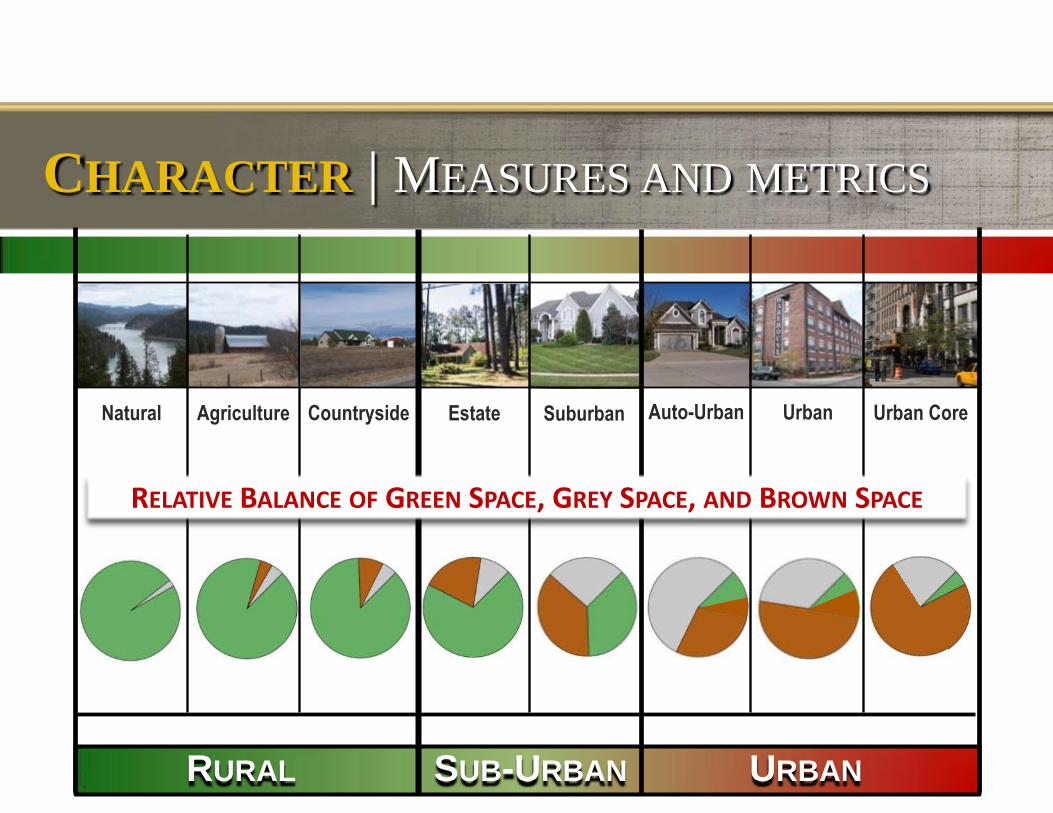
CHARACTER | MEASURES AND METRICS
RURAL SUB-URBAN URBAN
Natural Agriculture Countryside Estate Suburban Auto-Urban Urban Urban Core
RELATIVE BALANCE OF GREEN SPACE, GREY SPACE, AND BROWN SPACE
RURAL SUB-URBAN URBAN
Natural Agriculture Countryside Estate Suburban Auto-Urban Urban Urban Core
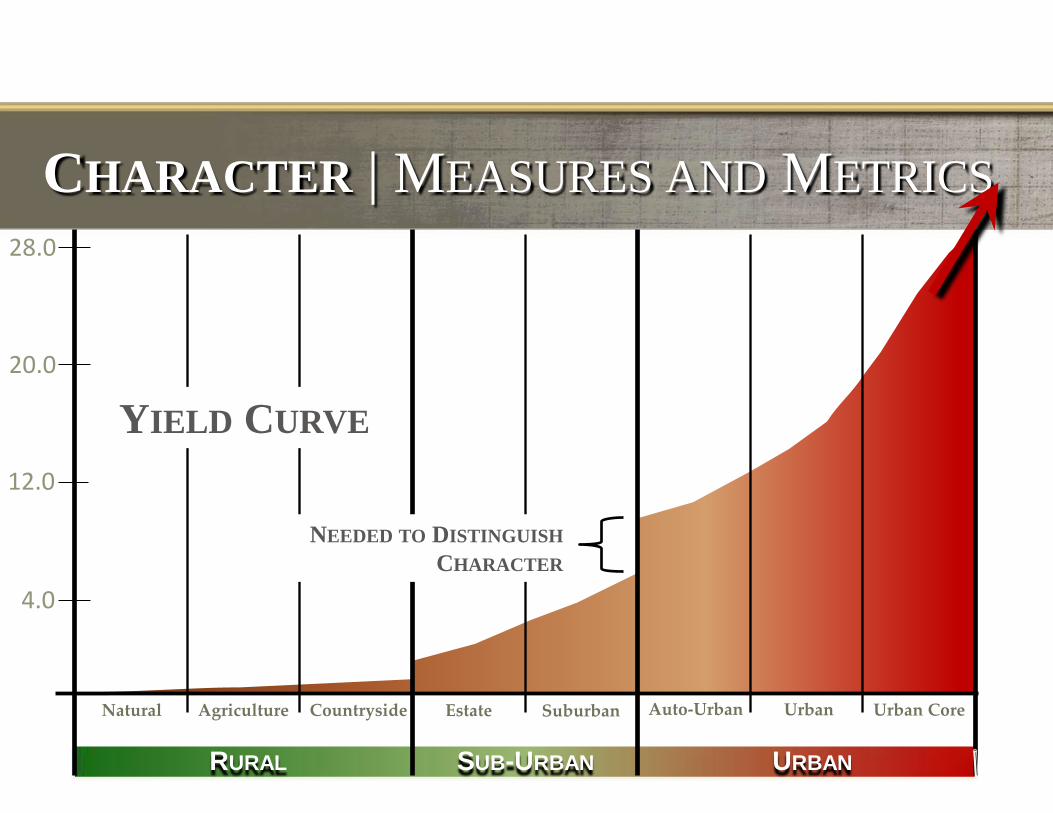
CHARACTER | MEASURES AND METRICS
4.0
12.0
20.0
28.0
YIELD CURVE
NEEDED TO DISTINGUISH
CHARACTER
RURAL SUB-URBAN URBAN
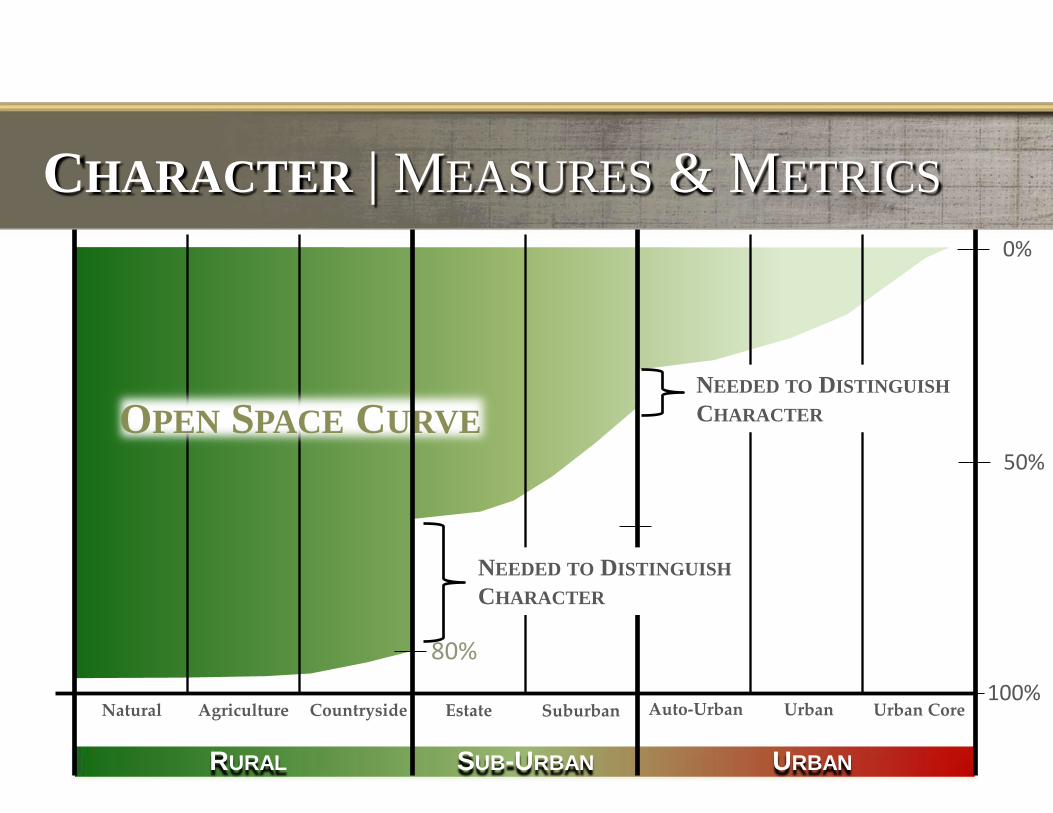
Natural Agriculture Countryside Estate Suburban Auto-Urban Urban Urban Core
0%
OPEN SPACE CURVE
80%
CHARACTER | MEASURES & METRICS
50%
100%
NEEDED TO DISTINGUISH
CHARACTER
NEEDED TO DISTINGUISH
CHARACTER
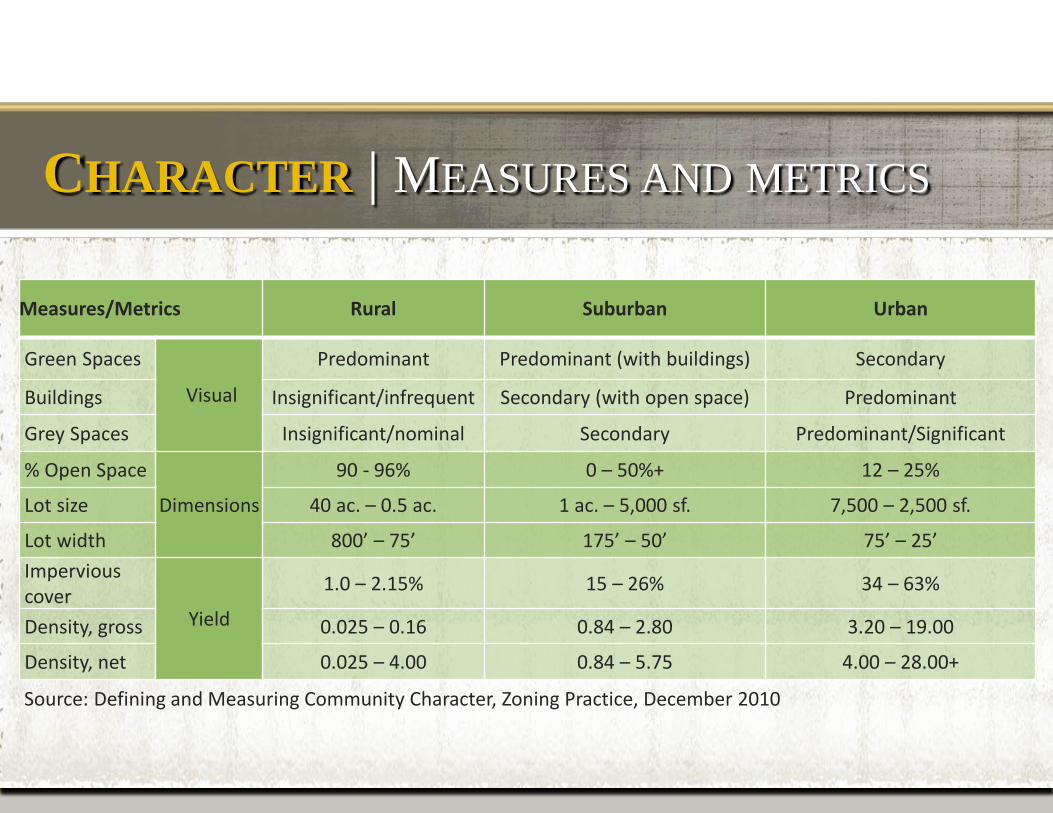
Measures/Metrics Rural Suburban Urban
Green Spaces
Visual
Predominant Predominant (with buildings) Secondary
Buildings Insignificant/infrequent Secondary (with open space) Predominant
Grey Spaces Insignificant/nominal Secondary Predominant/Significant
% Open Space
Dimensions
90 - 96% 0 – 50%+ 12 – 25%
Lot size 40 ac. – 0.5 ac. 1 ac. – 5,000 sf. 7,500 – 2,500 sf.
Lot width 800’ – 75’ 175’ – 50’ 75’ – 25’
Impervious cover
Yield
1.0 – 2.15% 15 – 26% 34 – 63%
Density, gross 0.025 – 0.16 0.84 – 2.80 3.20 – 19.00
Density, net 0.025 – 4.00 0.84 – 5.75 4.00 – 28.00+
CHARACTER | MEASURES AND METRICS
Source: Defining and Measuring Community Character, Zoning Practice, December 2010
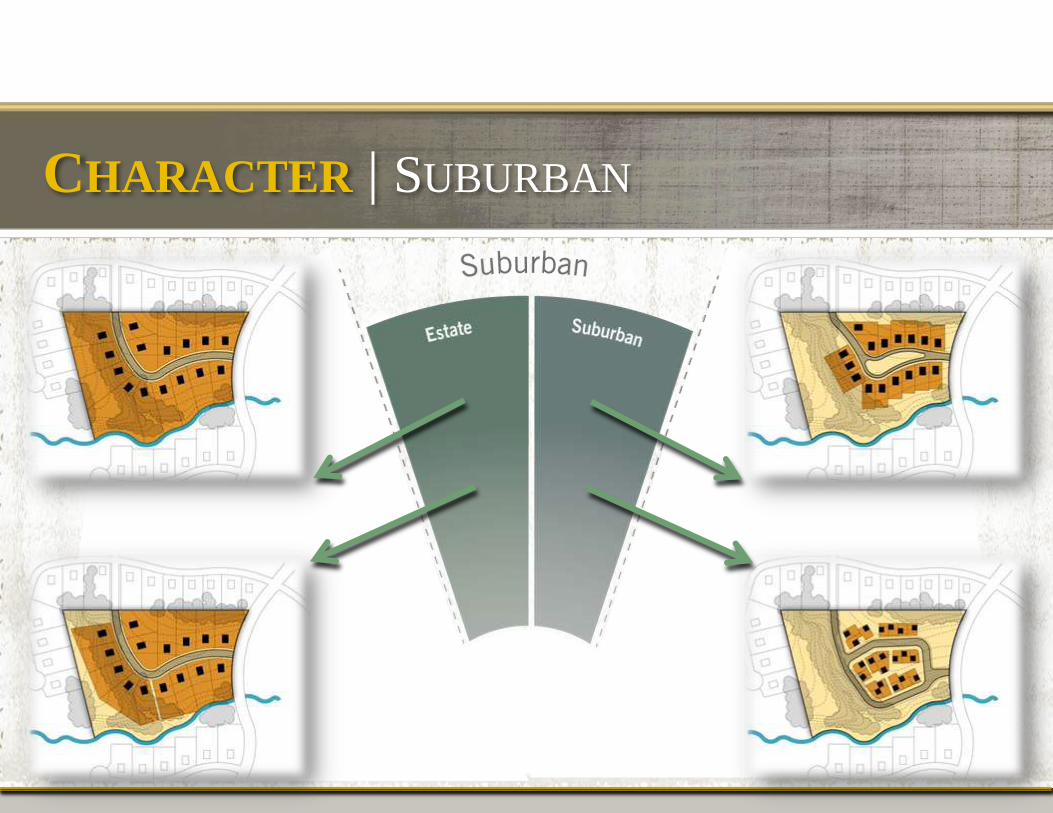
CHARACTER | SUBURBAN
RURAL SUB-URBAN URBAN
Natural Agriculture Countryside Estate Suburban Auto-Urban Urban Urban Core
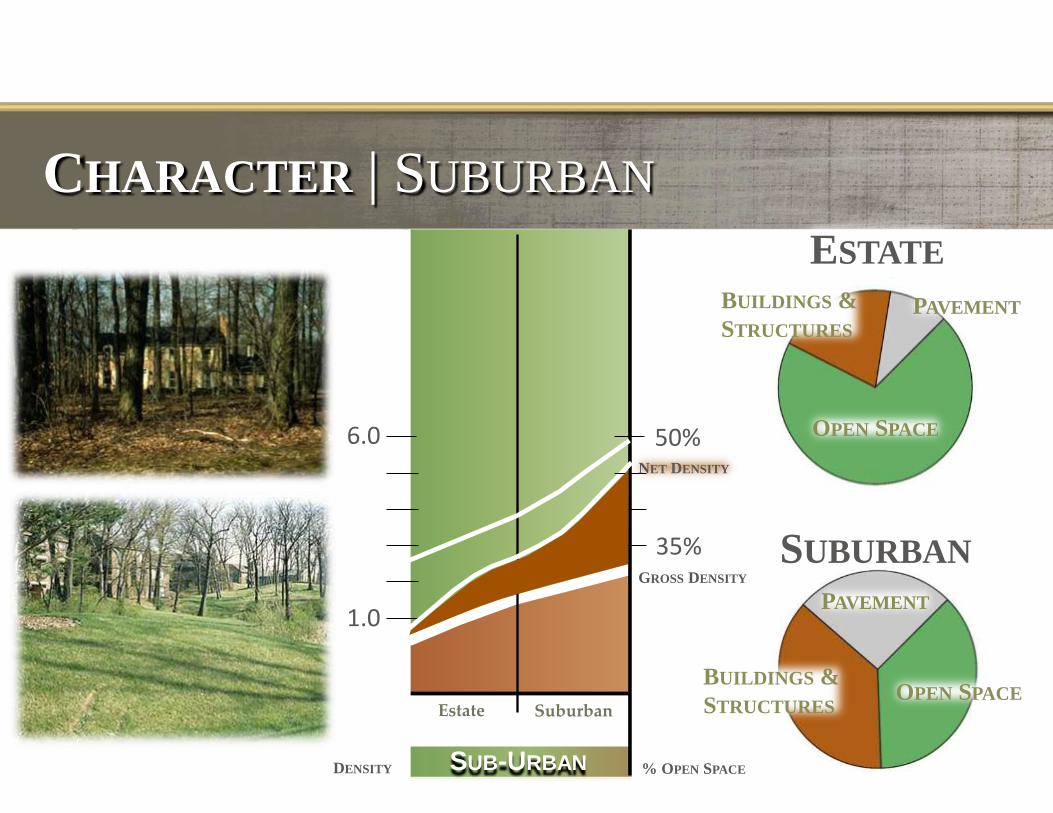
CHARACTER | SUBURBAN
1.0
6.0
OPEN SPACE
PAVEMENT
BUILDINGS &
STRUCTURES
OPEN SPACE
PAVEMENT BUILDINGS &
STRUCTURES
ESTATE
SUBURBAN
50%
35% GROSS DENSITY
NET DENSITY
% OPEN SPACE DENSITY
RURAL SUB-URBAN URBAN
Natural Agriculture Countryside Estate Suburban Auto-Urban Urban Urban Core
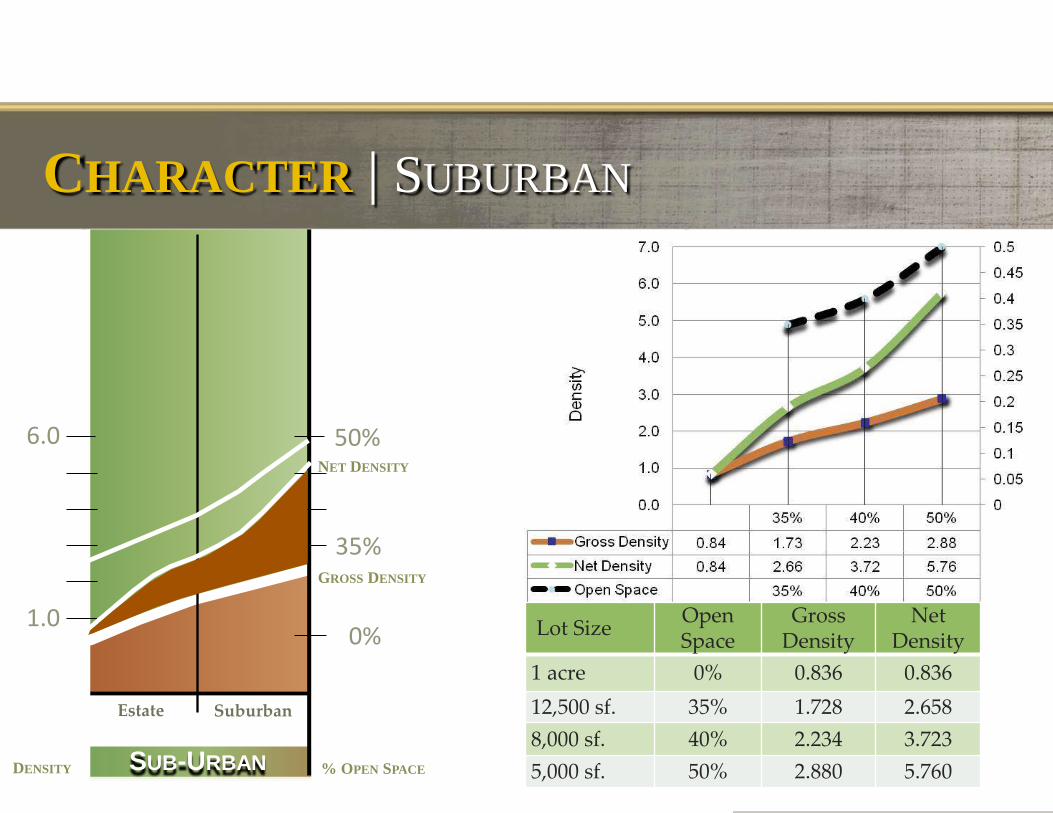
1.0
6.0 50%
35% GROSS DENSITY
NET DENSITY
% OPEN SPACE DENSITY
CHARACTER | SUBURBAN
Lot Size Open Space
Gross Density
Net Density
1 acre 0% 0.836 0.836
12,500 sf. 35% 1.728 2.658
8,000 sf. 40% 2.234 3.723
5,000 sf. 50% 2.880 5.760
0%
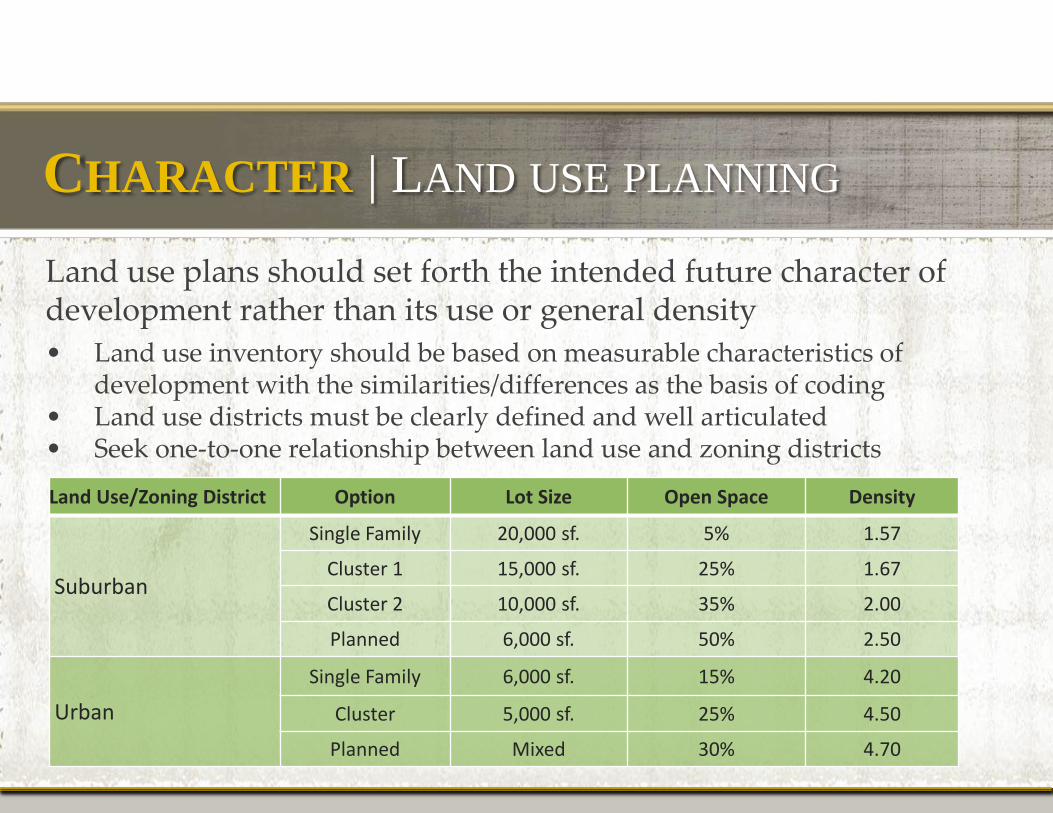
Land use plans should set forth the intended future character of development rather than its use or general density
• Land use inventory should be based on measurable characteristics of development with the similarities/differences as the basis of coding
• Land use districts must be clearly defined and well articulated • Seek one-to-one relationship between land use and zoning districts
CHARACTER | LAND USE PLANNING
Land Use/Zoning District Option Lot Size Open Space Density
Suburban
Single Family 20,000 sf. 5% 1.57
Cluster 1 15,000 sf. 25% 1.67
Cluster 2 10,000 sf. 35% 2.00
Planned 6,000 sf. 50% 2.50
Urban
Single Family 6,000 sf. 15% 4.20
Cluster 5,000 sf. 25% 4.50
Planned Mixed 30% 4.70
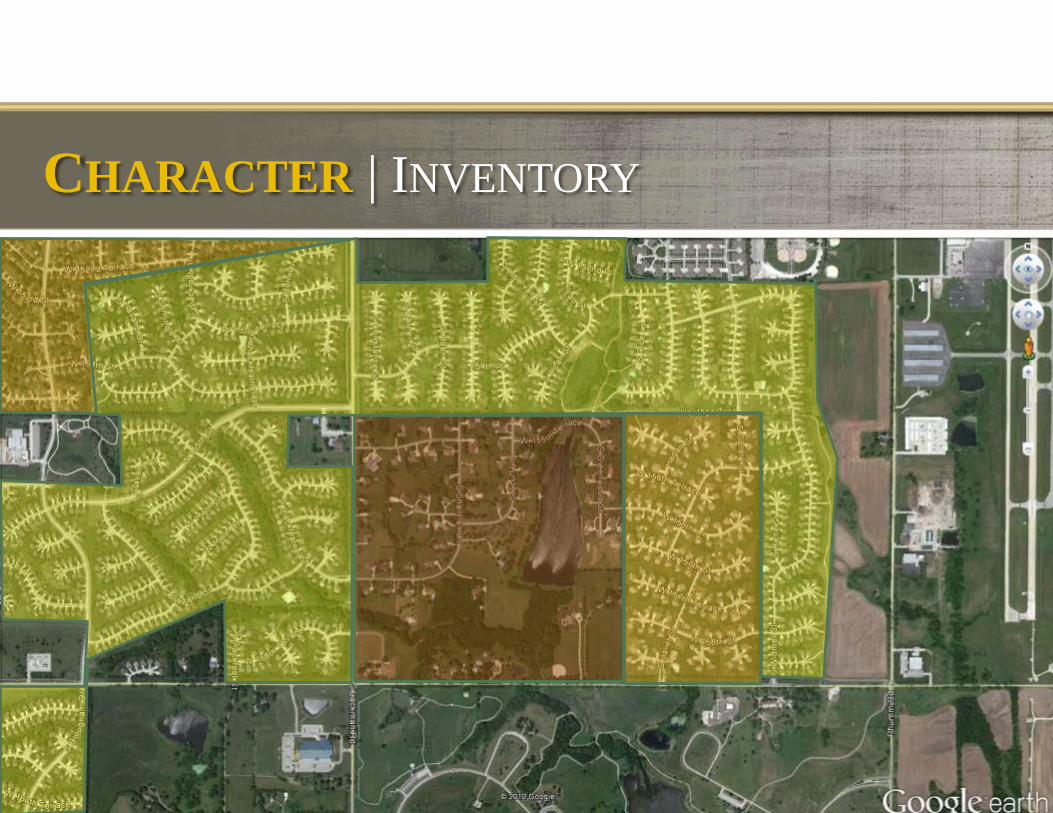
CHARACTER | INVENTORY
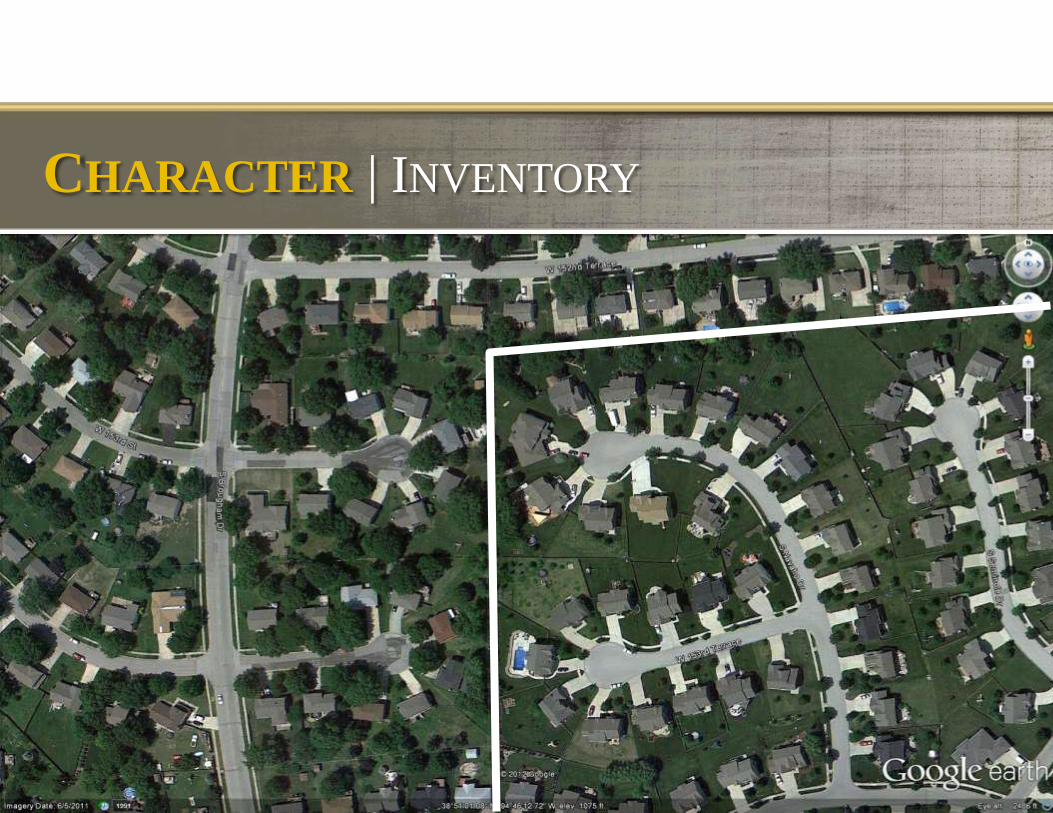
CHARACTER | INVENTORY
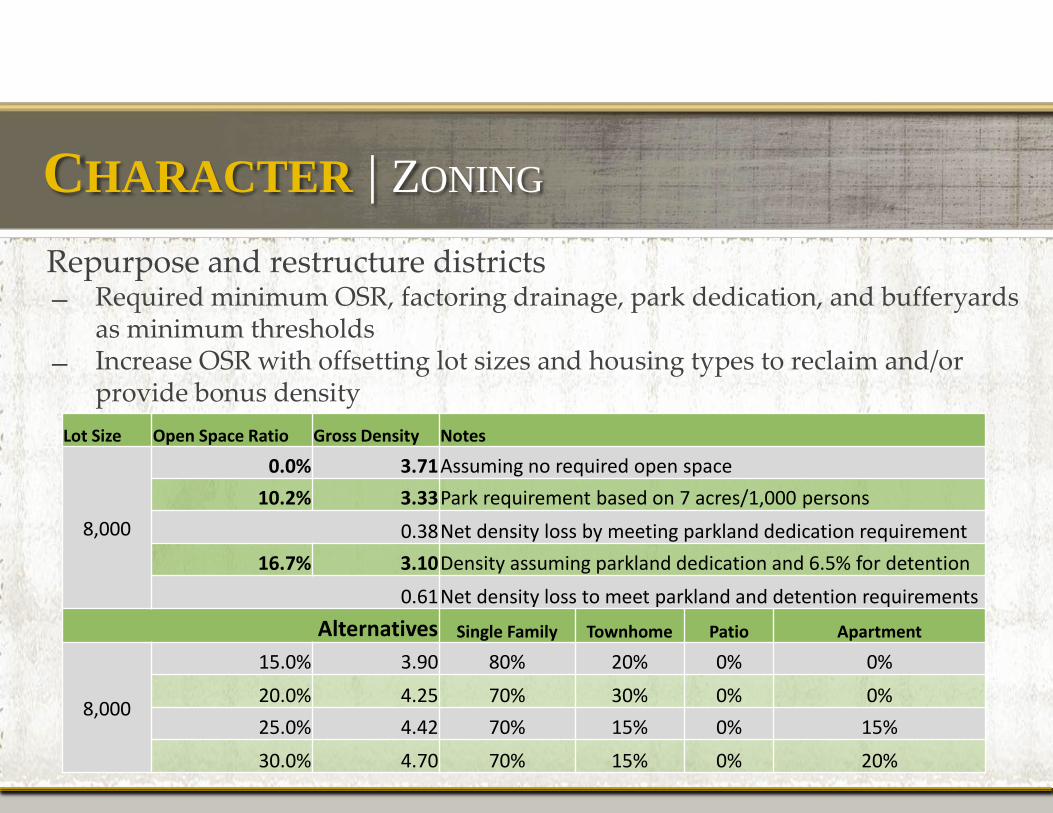
Repurpose and restructure districts Required minimum OSR, factoring drainage, park dedication, and bufferyards
as minimum thresholds Increase OSR with offsetting lot sizes and housing types to reclaim and/or
provide bonus density
CHARACTER | ZONING
Lot Size Open Space Ratio Gross Density Notes
8,000
0.0% 3.71 Assuming no required open space
10.2% 3.33 Park requirement based on 7 acres/1,000 persons
0.38 Net density loss by meeting parkland dedication requirement
16.7% 3.10 Density assuming parkland dedication and 6.5% for detention
0.61 Net density loss to meet parkland and detention requirements
Alternatives Single Family Townhome Patio Apartment
8,000
15.0% 3.90 80% 20% 0% 0%
20.0% 4.25 70% 30% 0% 0%
25.0% 4.42 70% 15% 0% 15%
30.0% 4.70 70% 15% 0% 20%
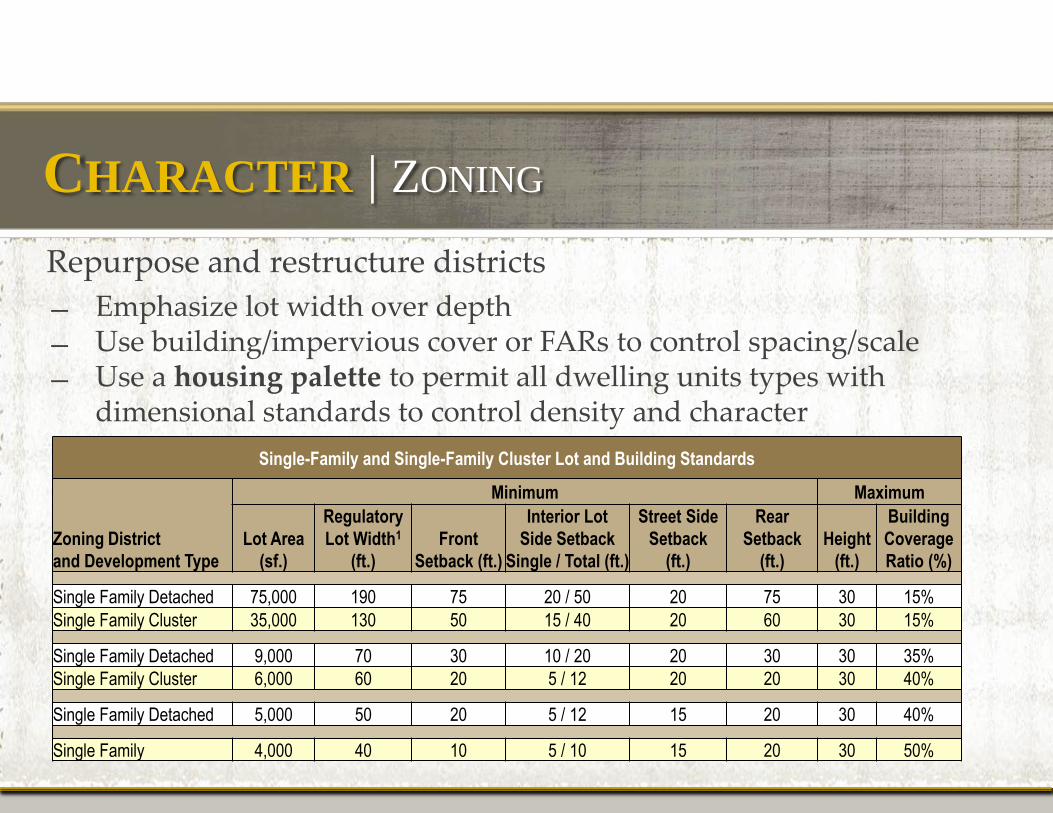
Repurpose and restructure districts
Emphasize lot width over depth Use building/impervious cover or FARs to control spacing/scale Use a housing palette to permit all dwelling units types with
dimensional standards to control density and character
CHARACTER | ZONING
Single-Family and Single-Family Cluster Lot and Building Standards
Zoning District
and Development Type
Minimum Maximum
Lot Area
(sf.)
Regulatory
Lot Width1
(ft.)
Front
Setback (ft.)
Interior Lot
Side Setback
Single / Total (ft.)
Street Side
Setback
(ft.)
Rear
Setback
(ft.)
Height
(ft.)
Building
Coverage
Ratio (%)
Single Family Detached 75,000 190 75 20 / 50 20 75 30 15%
Single Family Cluster 35,000 130 50 15 / 40 20 60 30 15%
Single Family Detached 9,000 70 30 10 / 20 20 30 30 35%
Single Family Cluster 6,000 60 20 5 / 12 20 20 30 40%
Single Family Detached 5,000 50 20 5 / 12 15 20 30 40%
Single Family 4,000 40 10 5 / 10 15 20 30 50%
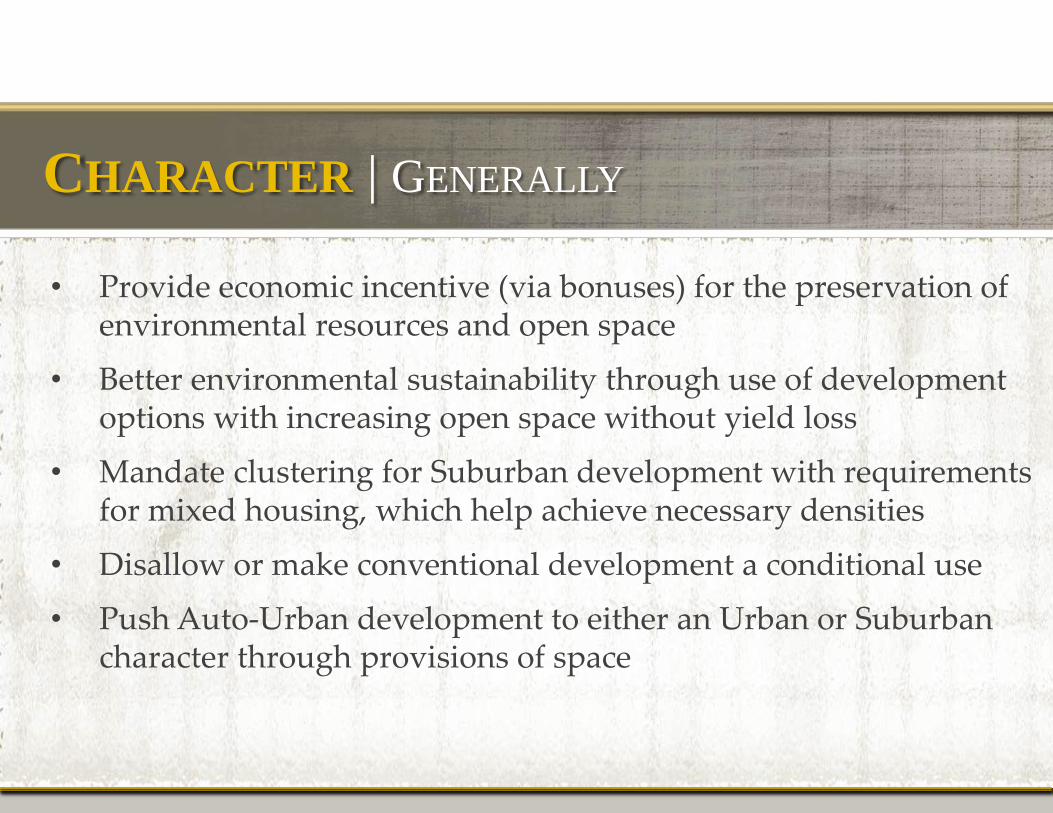
• Provide economic incentive (via bonuses) for the preservation of environmental resources and open space
• Better environmental sustainability through use of development options with increasing open space without yield loss
• Mandate clustering for Suburban development with requirements for mixed housing, which help achieve necessary densities
• Disallow or make conventional development a conditional use
• Push Auto-Urban development to either an Urban or Suburban character through provisions of space
CHARACTER | GENERALLY
The Role of Space in Defining Character and the economic and social benefits of space
National APA Conference Los Angeles, California April 13-17, 2012 presented by:
Greg Flisram, AICP, CEcD | City of Green Bay
• Does it stimulate redevelopment?
• Does it command a price premium?
• Does it pay for itself?
• Does it “sell”?
• Does it hold its value?
VALUE | DETERMINATIONS
• Public vs. Quasi-Public
• Urban vs. Suburban
• Designed vs. Natural
• Passive vs. Active
SPACE | DIFFERENT TYPES
• Distance
• Size
• Maintenance
• Activity levels (safety & “defensibility”)
• Urban density
• “Quality of surrounding neighborhood”
VALUE | PREMIUM DEPENDS ON:
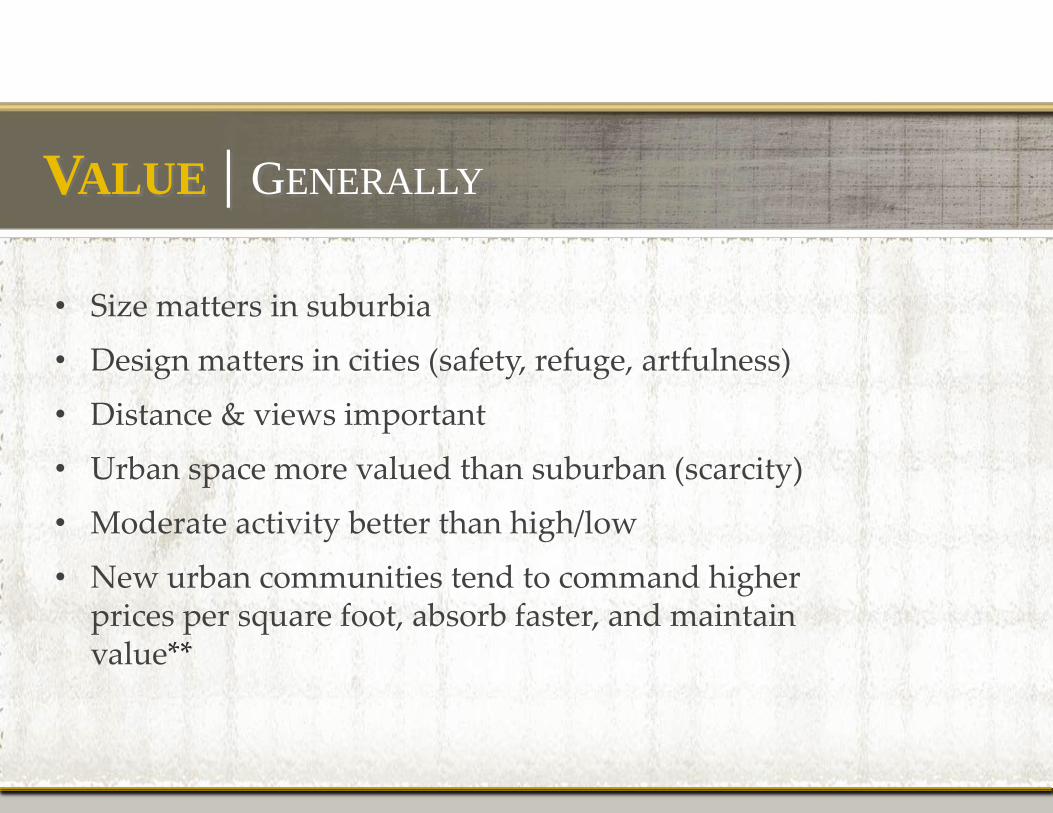
• Size matters in suburbia
• Design matters in cities (safety, refuge, artfulness)
• Distance & views important
• Urban space more valued than suburban (scarcity)
• Moderate activity better than high/low
• New urban communities tend to command higher prices per square foot, absorb faster, and maintain value**
VALUE | GENERALLY
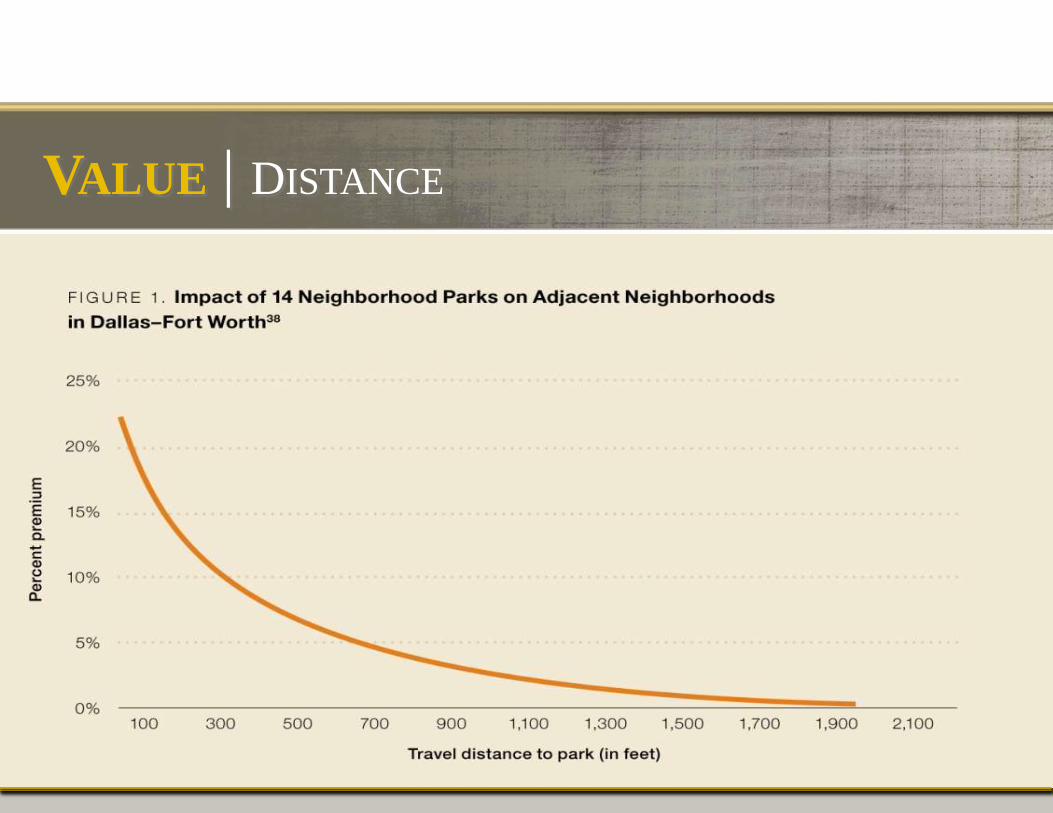
VALUE | DISTANCE
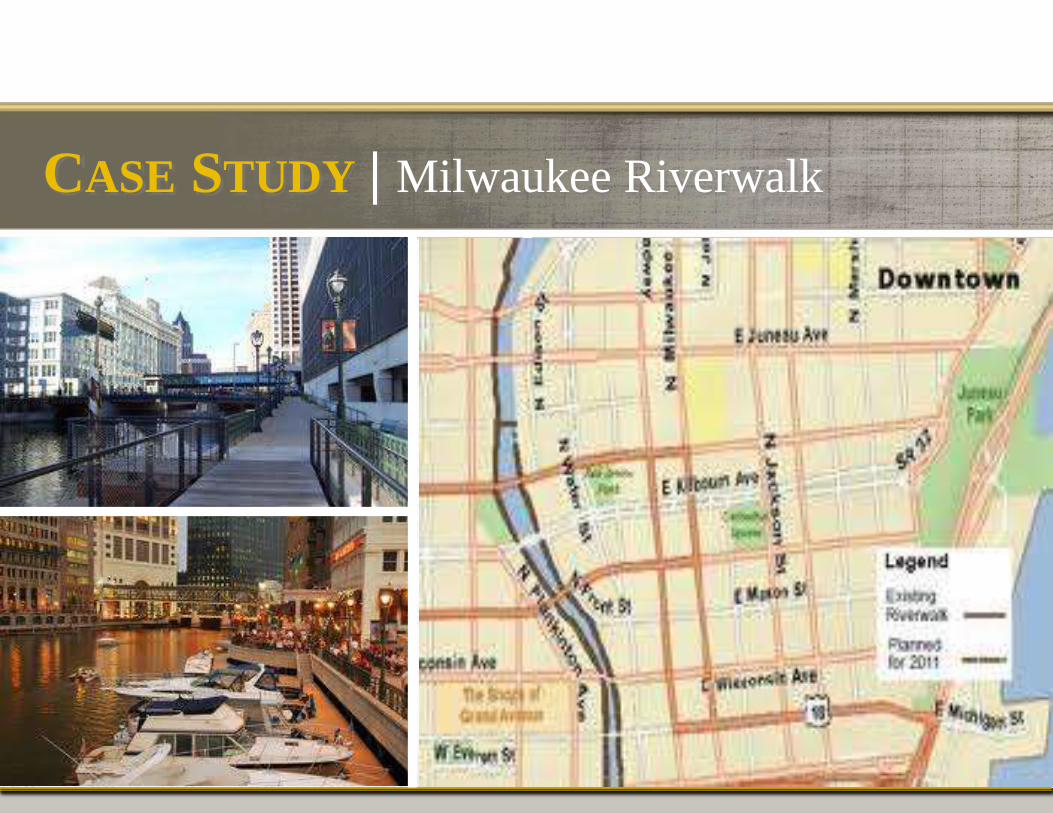
CASE STUDY | Milwaukee Riverwalk
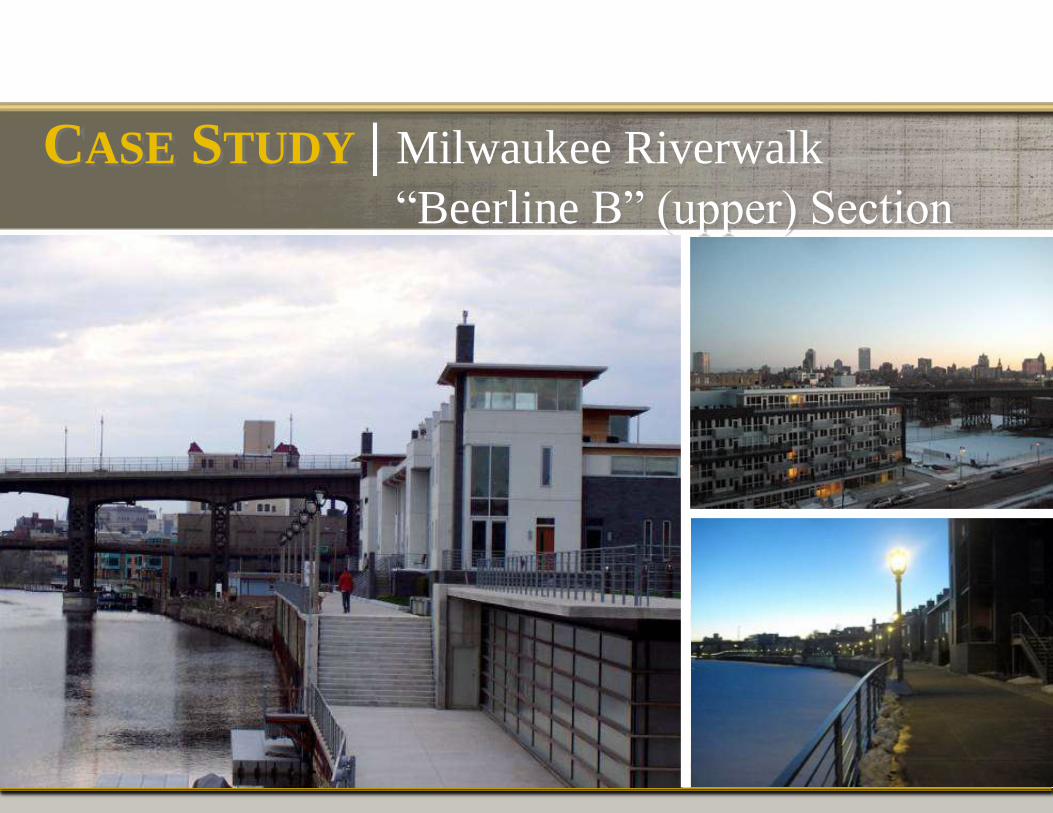
CASE STUDY | Milwaukee Riverwalk
“Beerline B” (upper) Section
CASE STUDY | Milwaukee Riverwalk
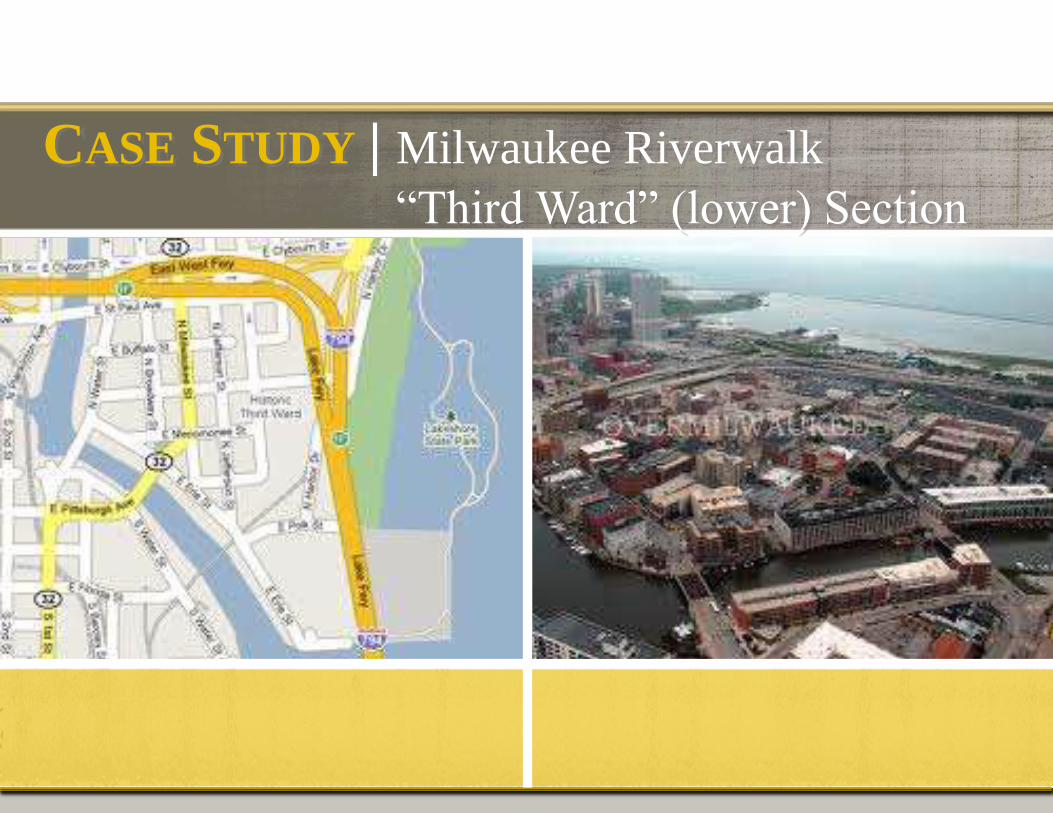
“Third Ward” (lower) Section
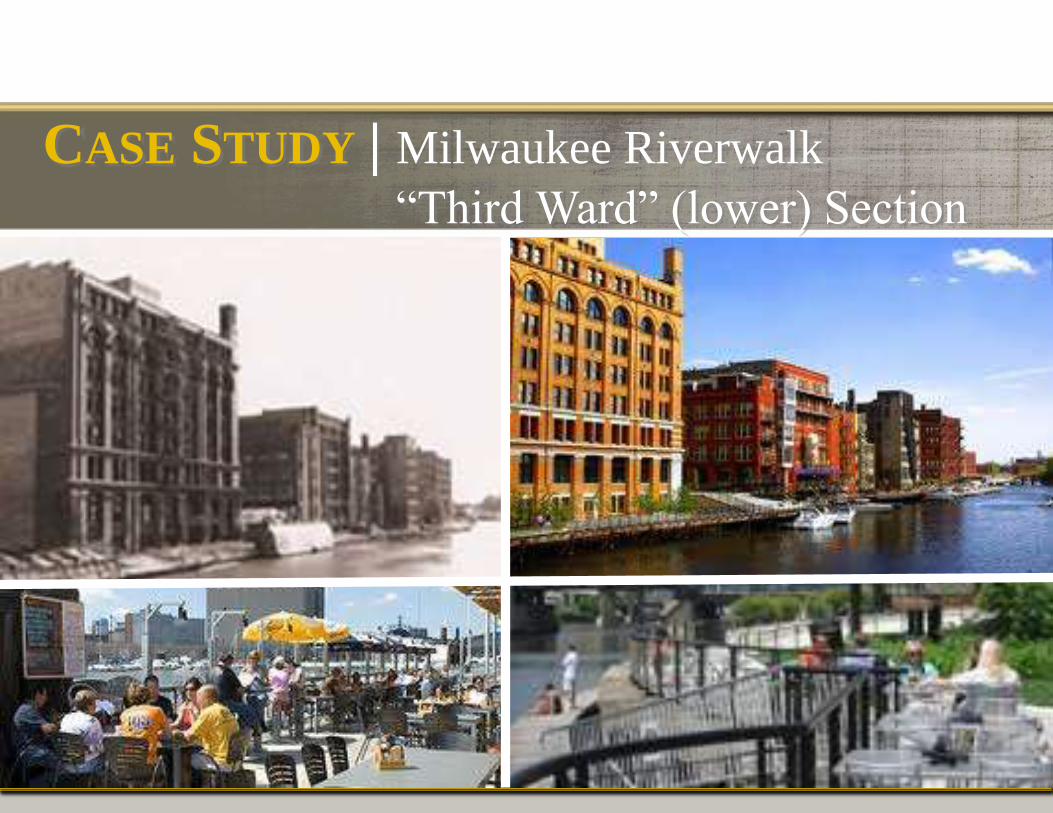
CASE STUDY | Milwaukee Riverwalk
“Third Ward” (lower) Section
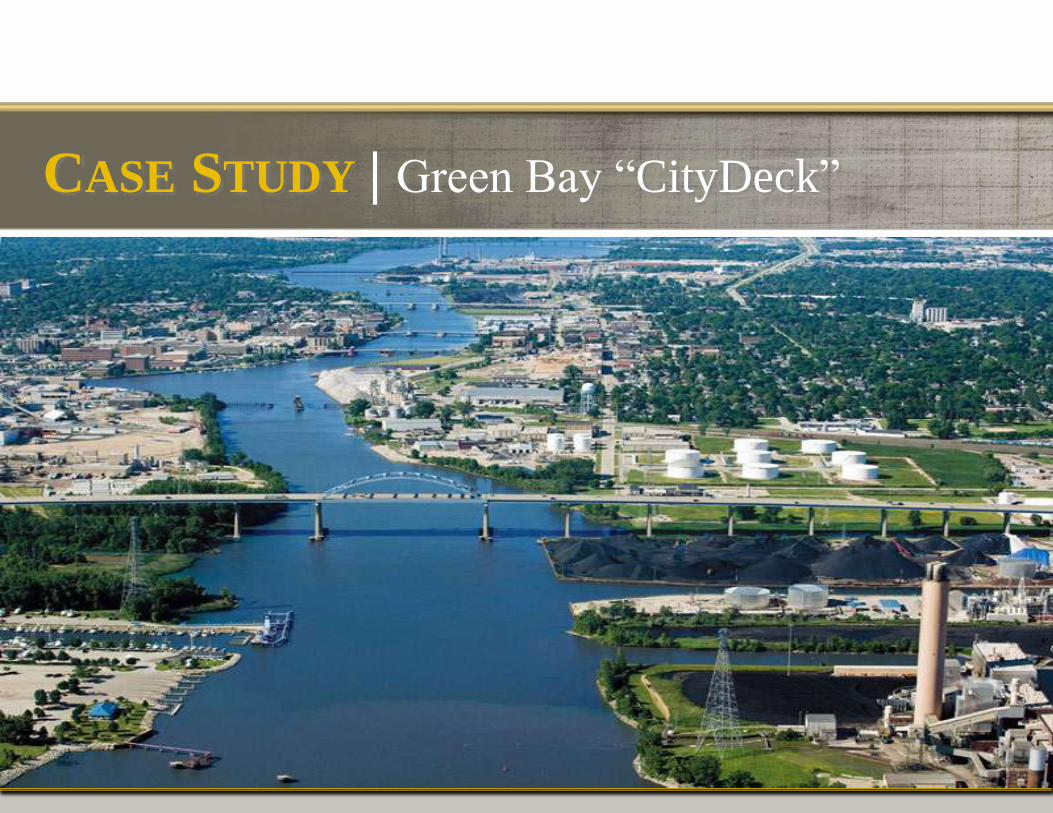
CASE STUDY | Green Bay “CityDeck”
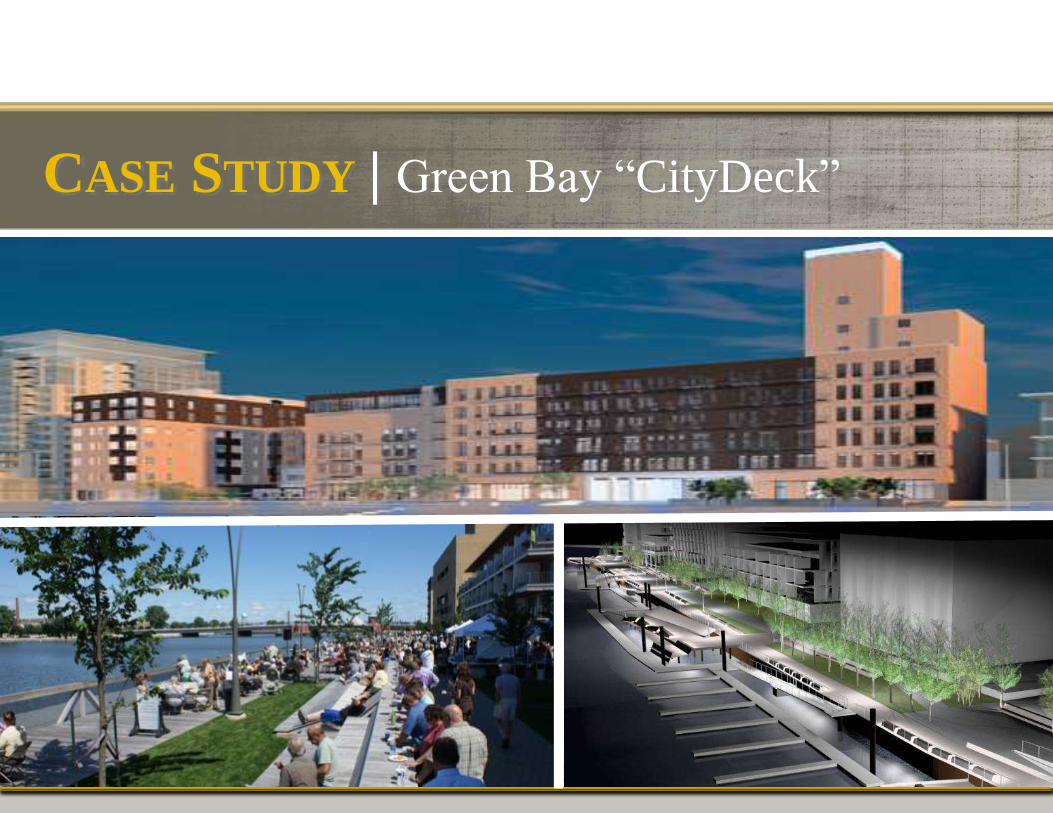
CASE STUDY | Green Bay “CityDeck”
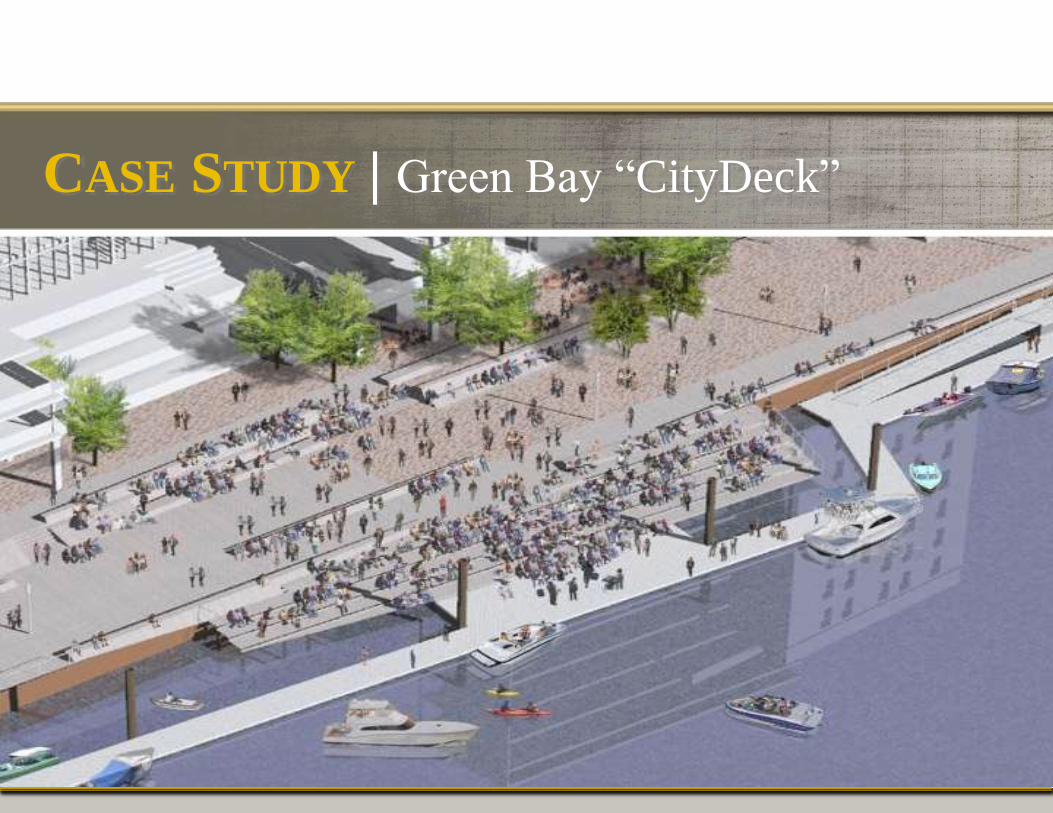
CASE STUDY | Green Bay “CityDeck”
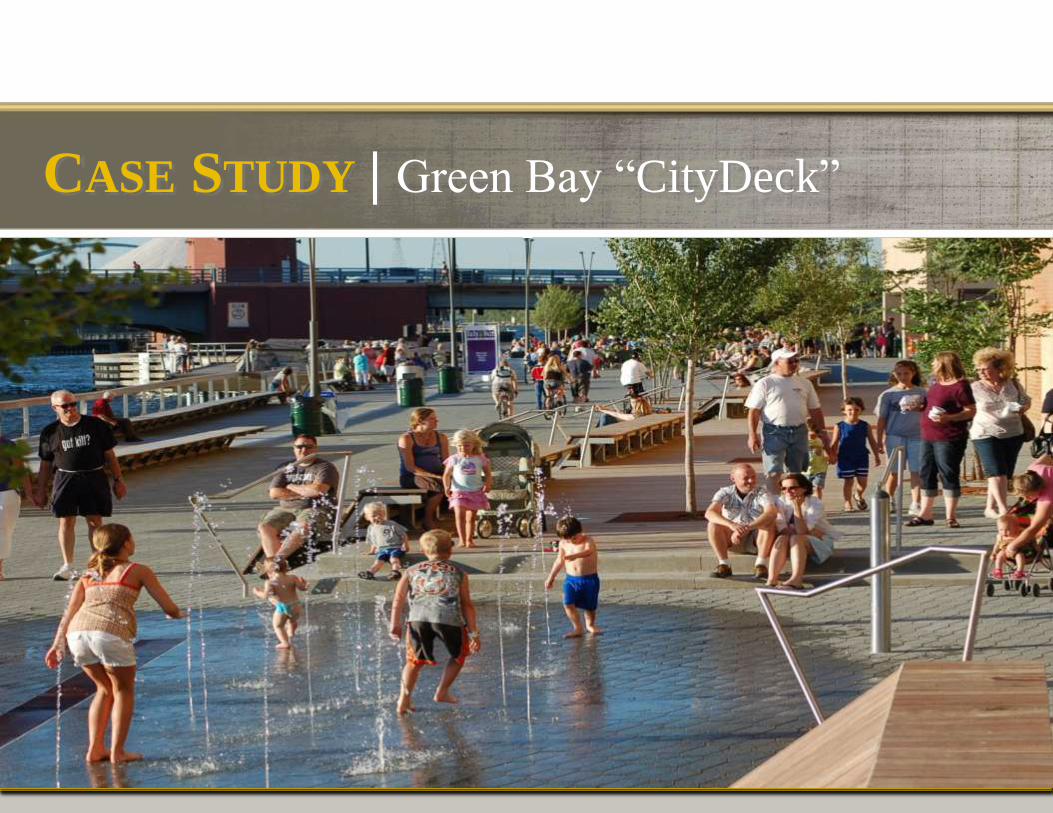
CASE STUDY | Green Bay “CityDeck”
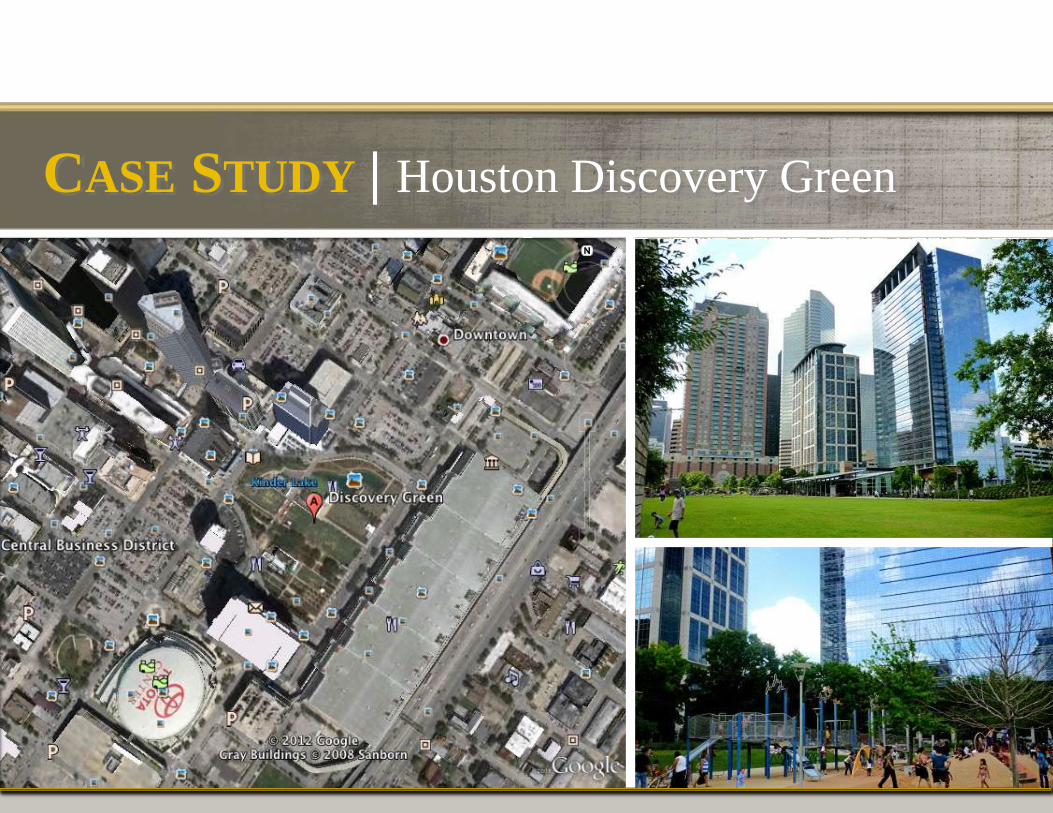
CASE STUDY | Houston Discovery Green
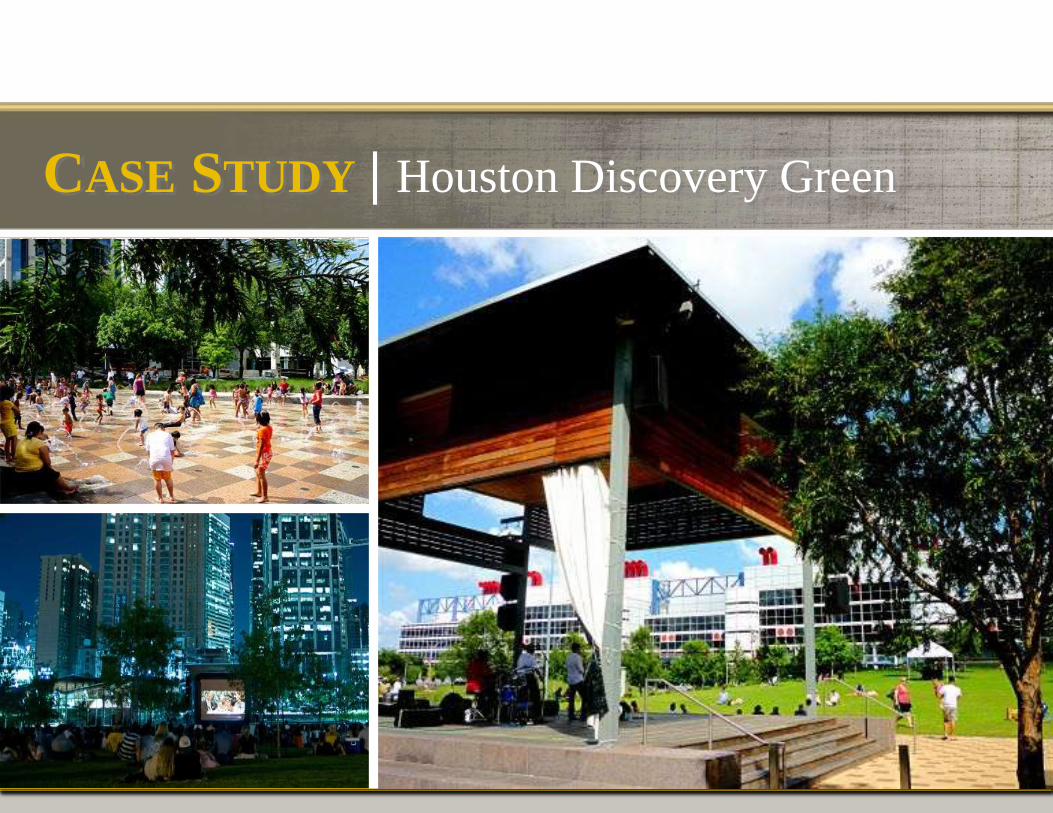
CASE STUDY | Houston Discovery Green
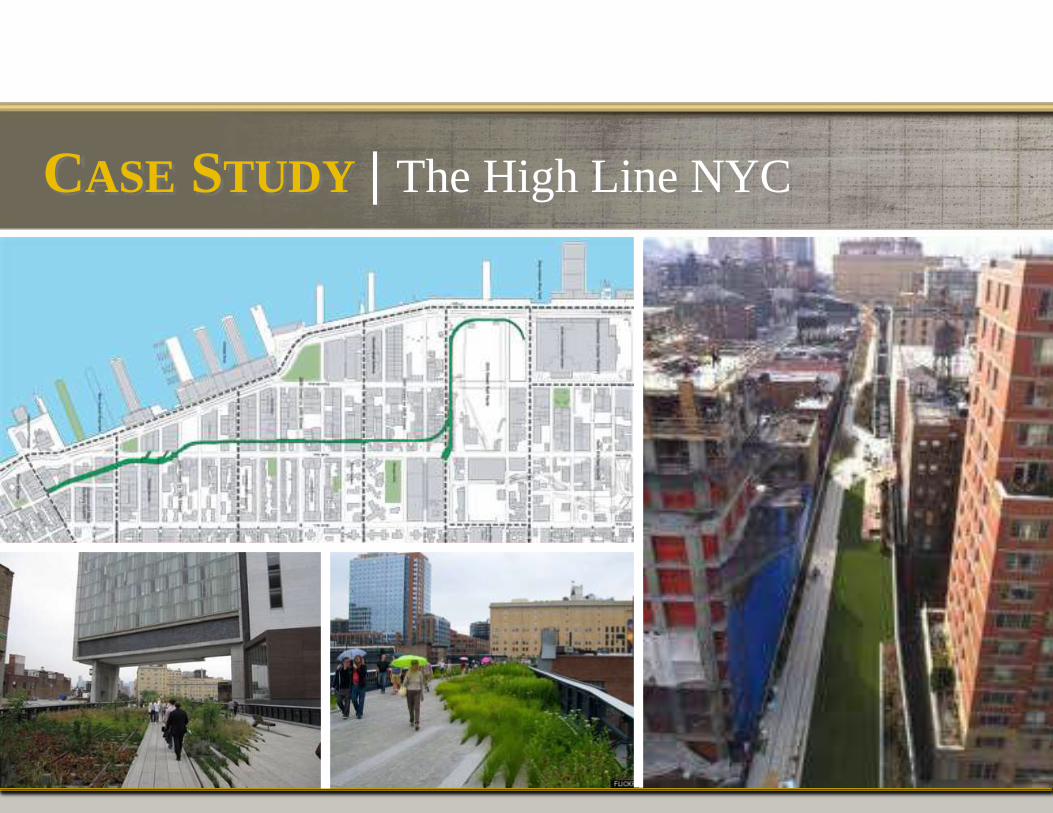
CASE STUDY | The High Line NYC
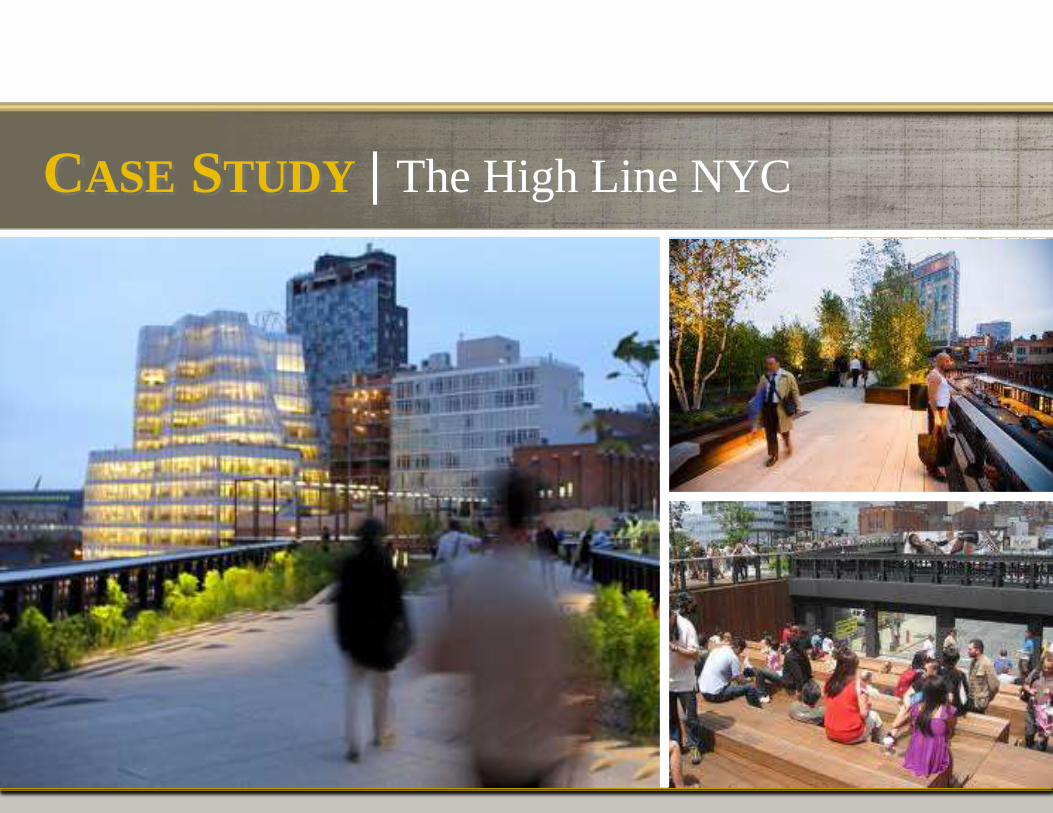
CASE STUDY | The High Line NYC
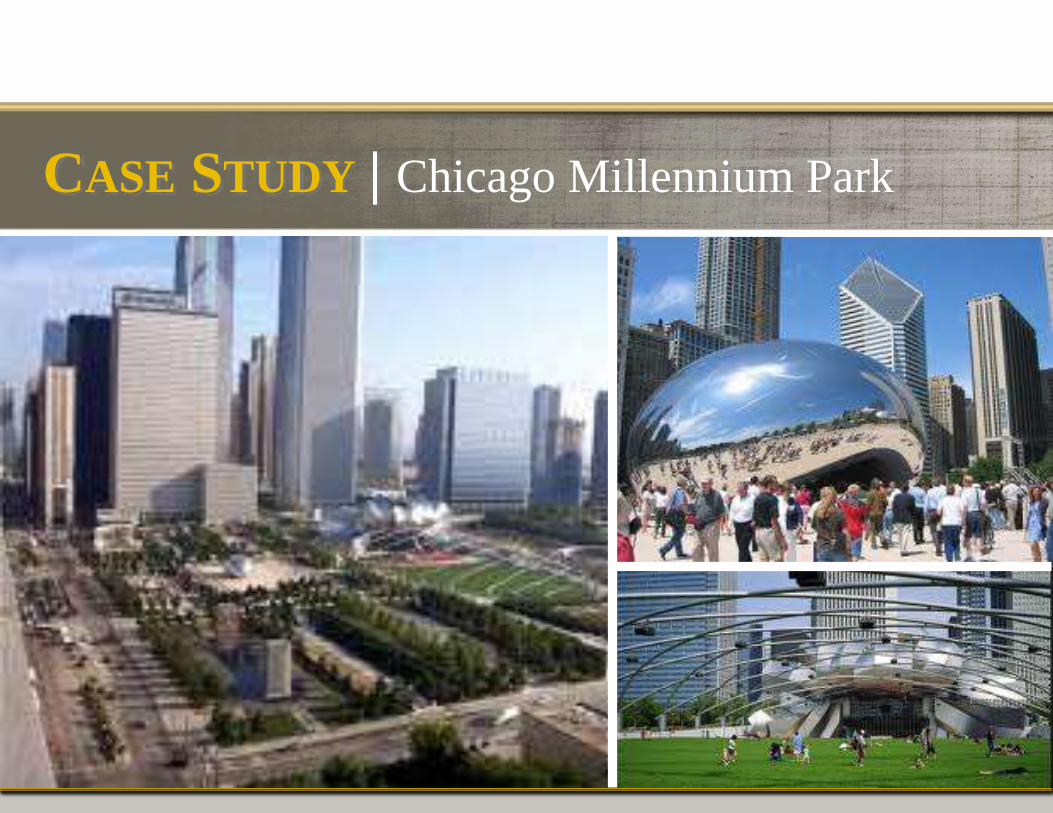
CASE STUDY | Chicago Millennium Park
The Role of Space in Defining Character and the economic and social benefits of space
National APA Conference Los Angeles, California April 13-17, 2012 presented by:
Steve Jensen, RLA, AICP | Steven Jensen Consulting
• Public open space as a transformative tool
• Omaha’s experience
- Downtown
- Riverfront
- Midtown Crossing
OMAHA | Public open space
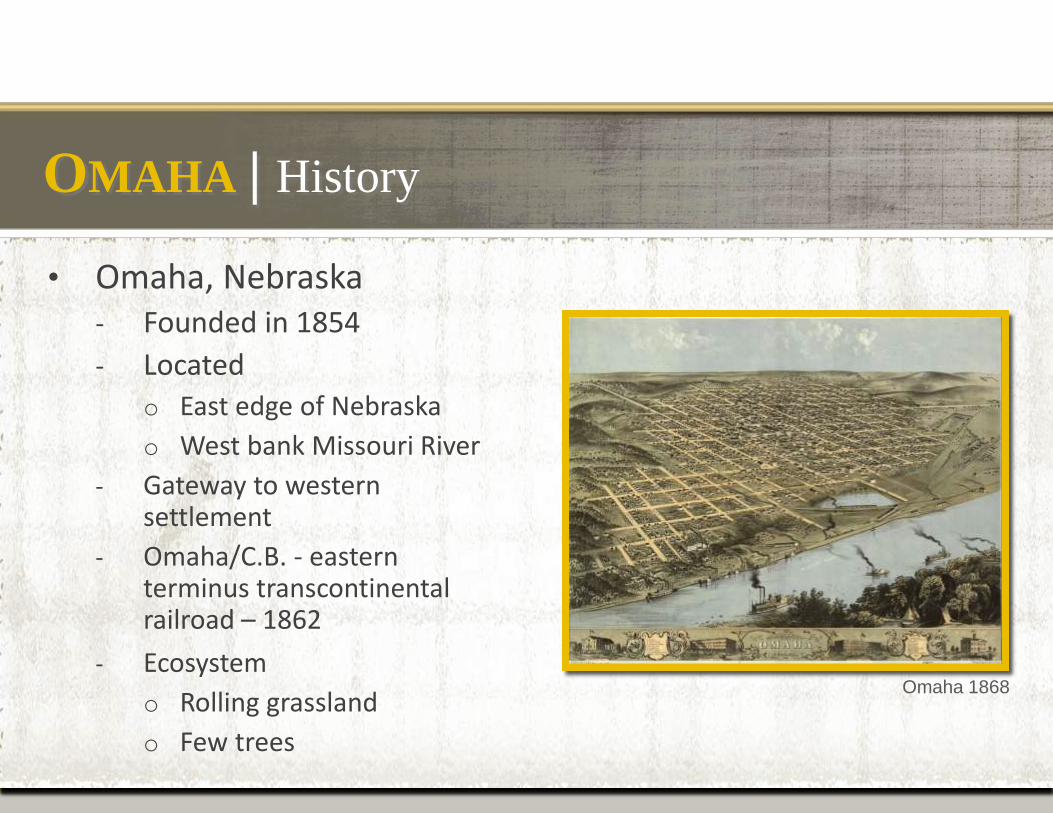
• Omaha, Nebraska - Founded in 1854
- Located
o East edge of Nebraska
o West bank Missouri River
- Gateway to western settlement
- Omaha/C.B. - eastern terminus transcontinental railroad – 1862
- Ecosystem
o Rolling grassland
o Few trees
Omaha 1868
OMAHA | History
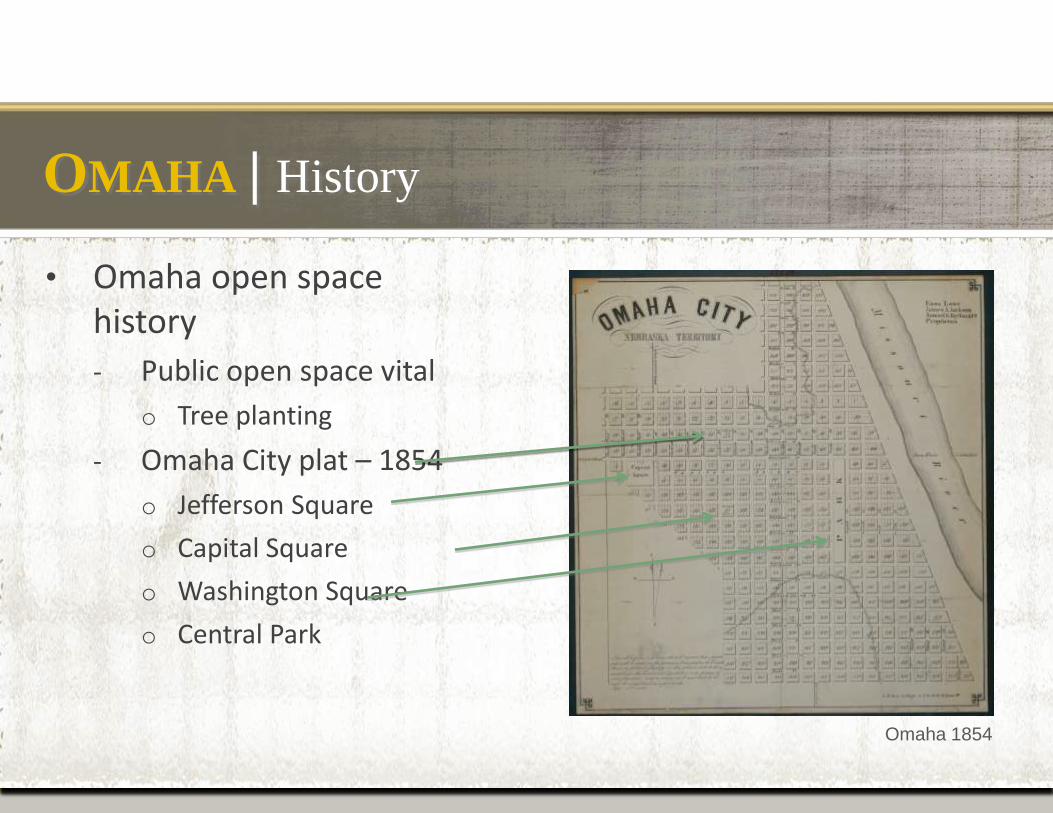
• Omaha open space history
- Public open space vital
o Tree planting
- Omaha City plat – 1854
o Jefferson Square
o Capital Square
o Washington Square
o Central Park
Omaha 1854
OMAHA | History
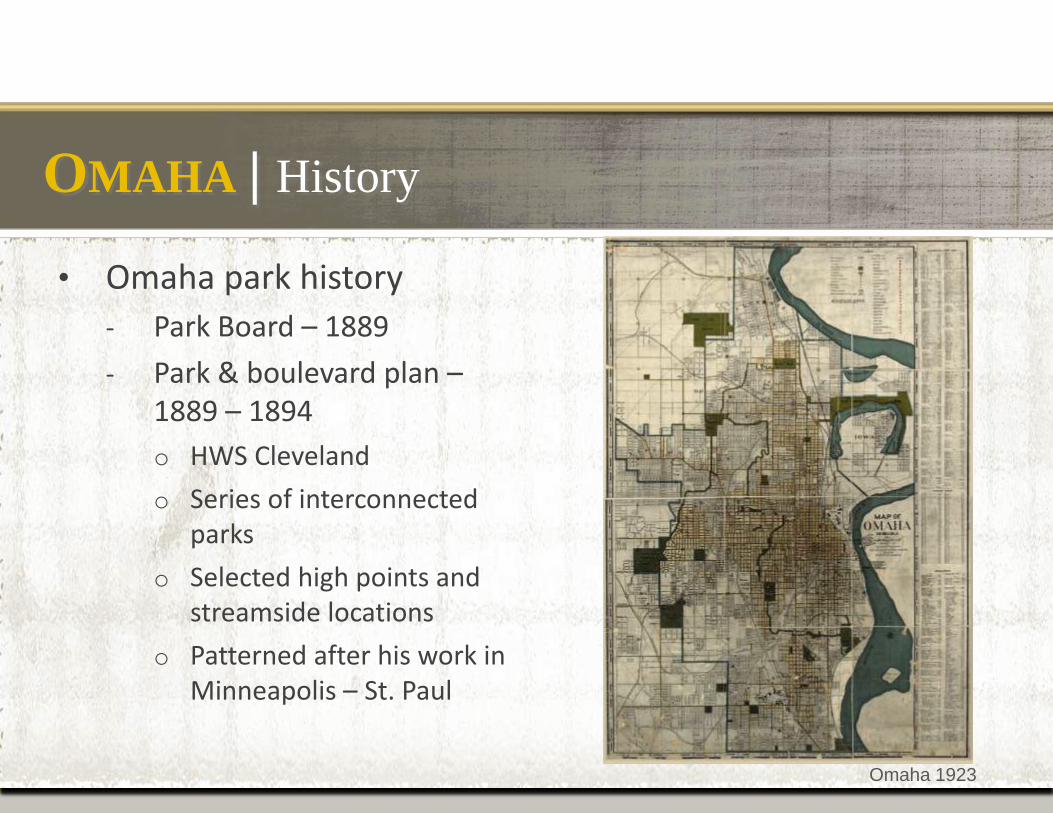
• Omaha park history
- Park Board – 1889
- Park & boulevard plan – 1889 – 1894
o HWS Cleveland
o Series of interconnected parks
o Selected high points and streamside locations
o Patterned after his work in Minneapolis – St. Paul
Omaha 1923
OMAHA | History
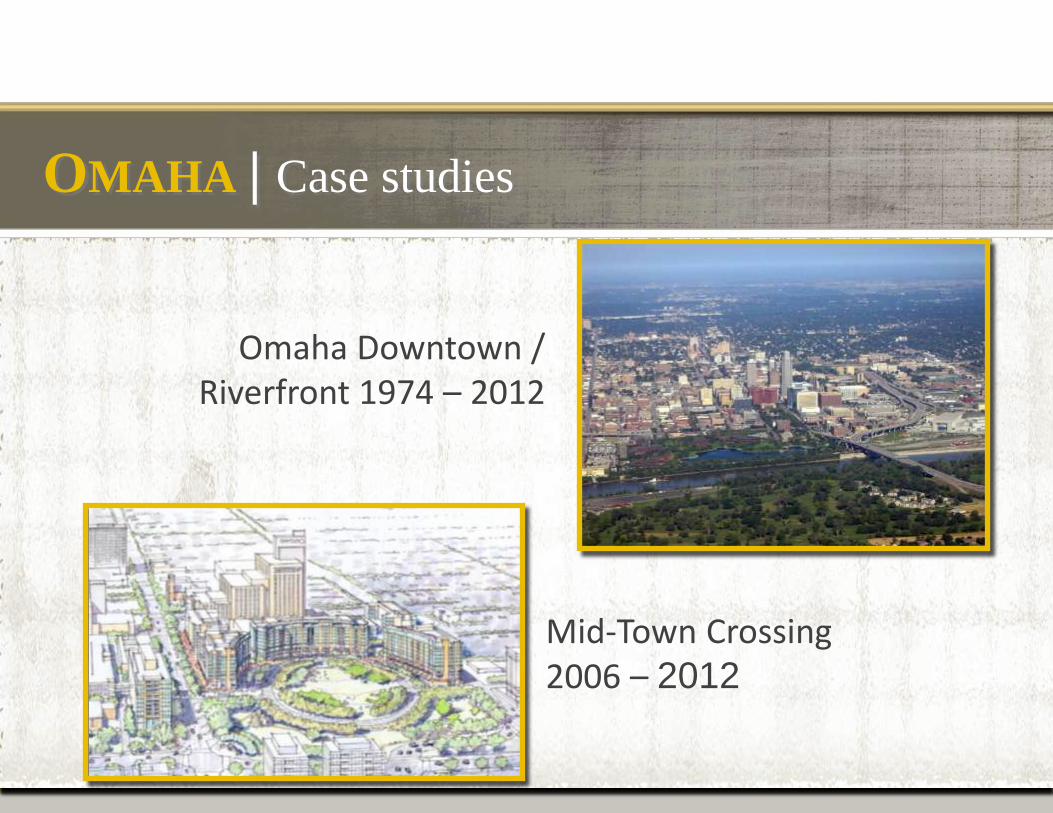
Omaha Downtown / Riverfront 1974 – 2012
Mid-Town Crossing 2006 – 2012
OMAHA | Case studies
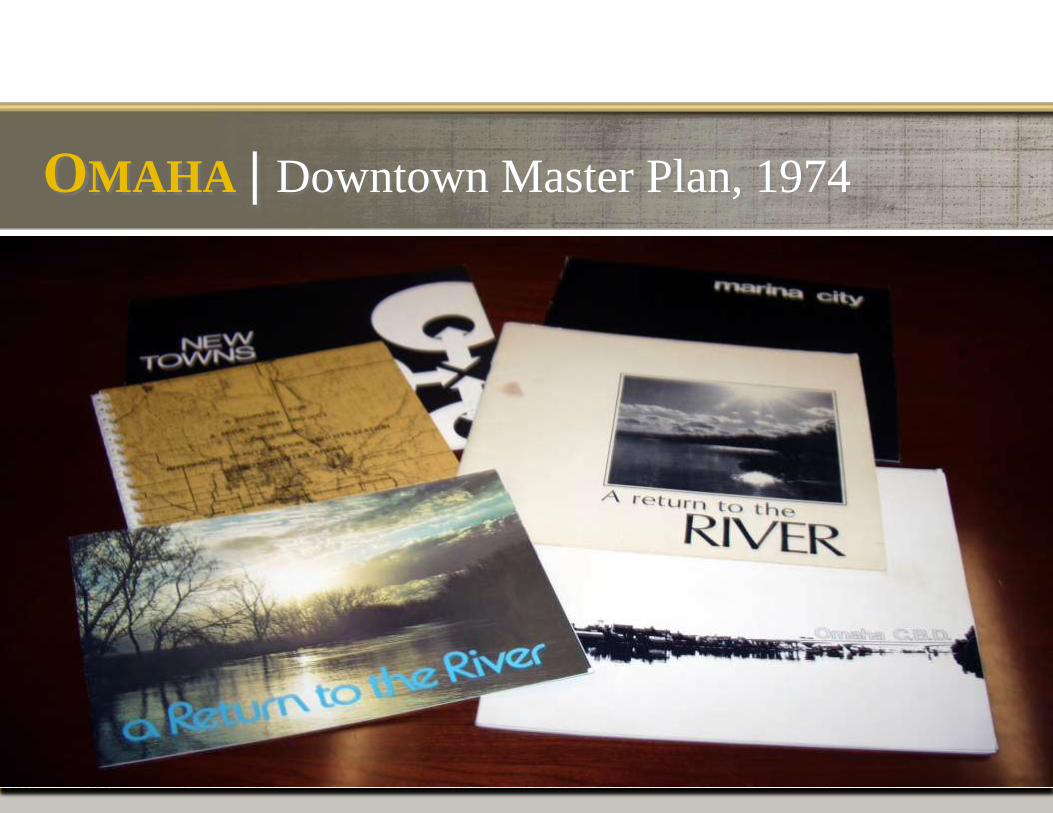
OMAHA | Downtown Master Plan, 1974
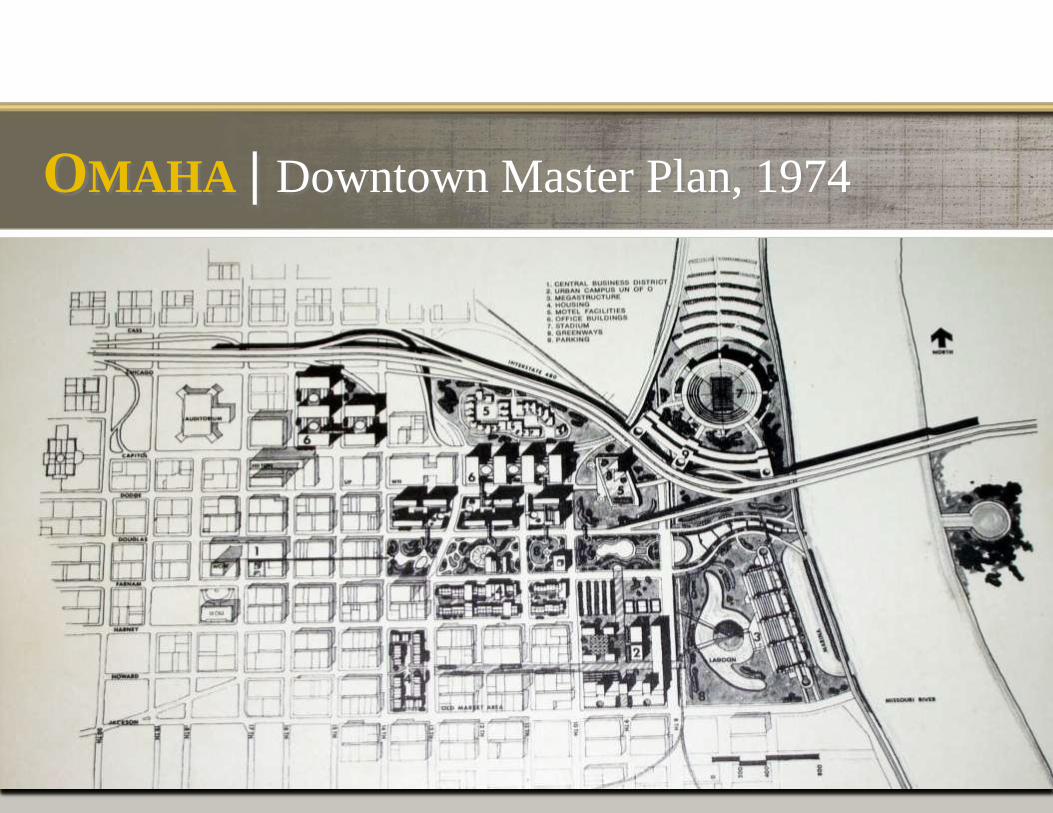
OMAHA | Downtown Master Plan, 1974
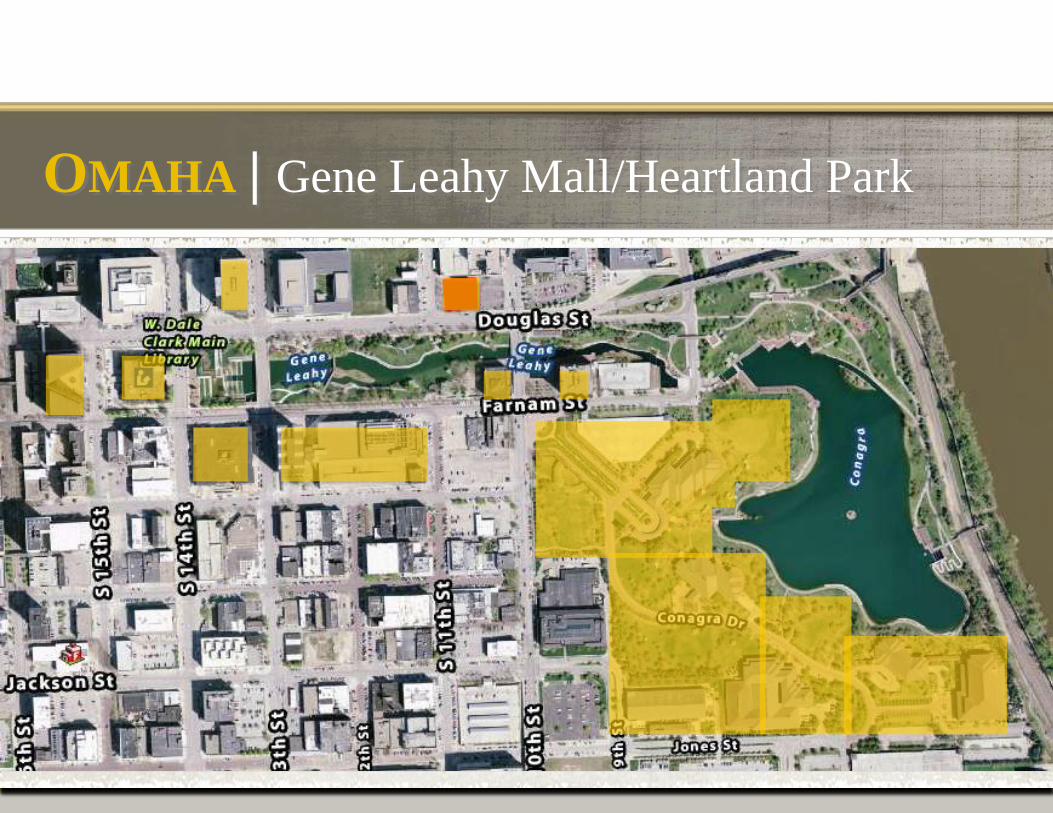
OMAHA | Gene Leahy Mall/Heartland Park
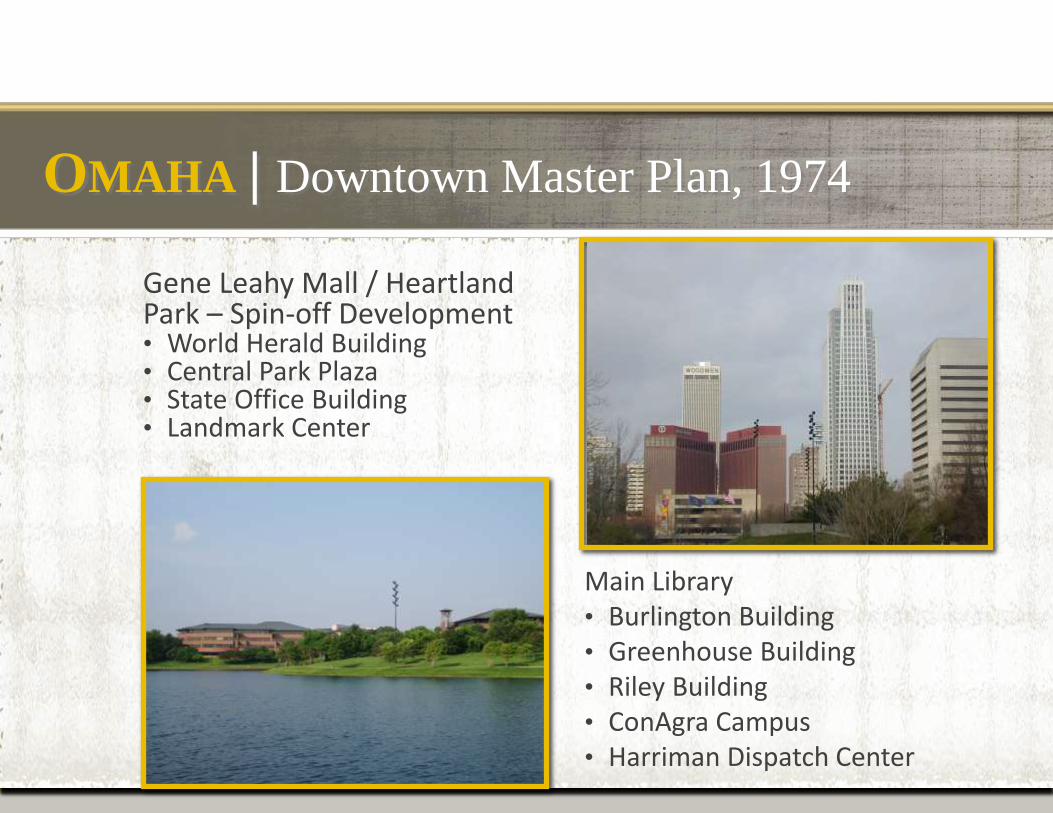
Gene Leahy Mall / Heartland Park – Spin-off Development • World Herald Building • Central Park Plaza • State Office Building • Landmark Center
Main Library • Burlington Building • Greenhouse Building • Riley Building • ConAgra Campus • Harriman Dispatch Center
OMAHA | Downtown Master Plan, 1974
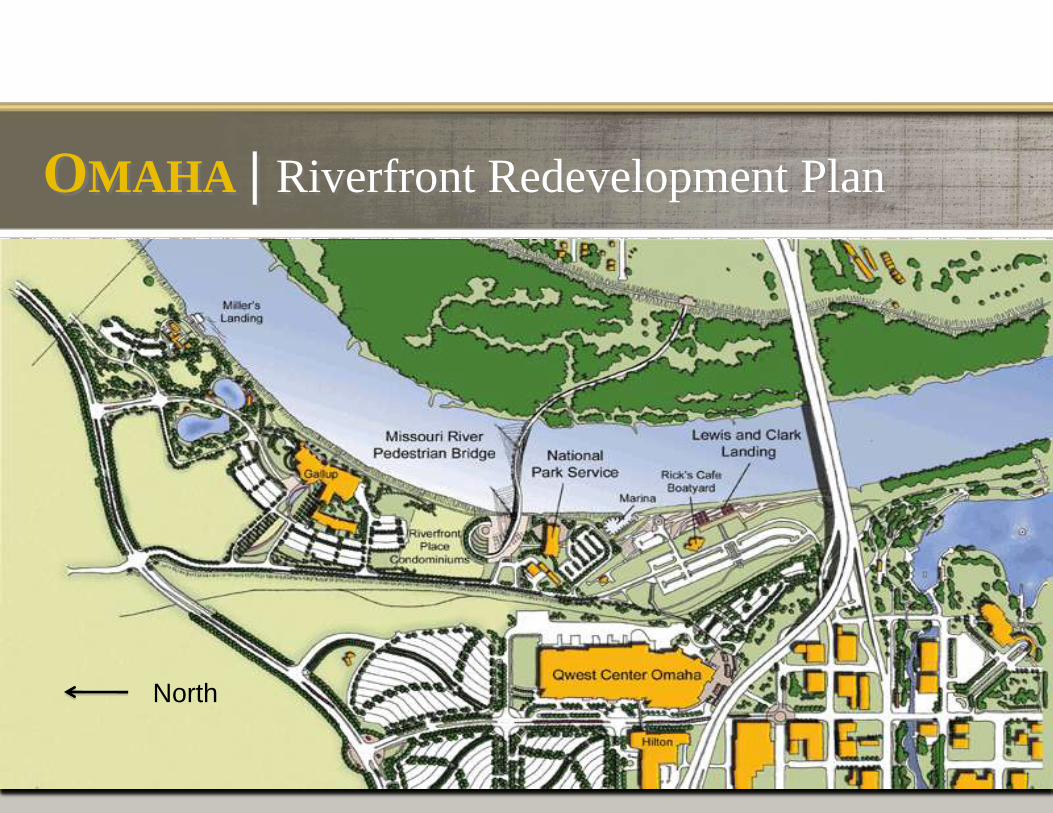
North
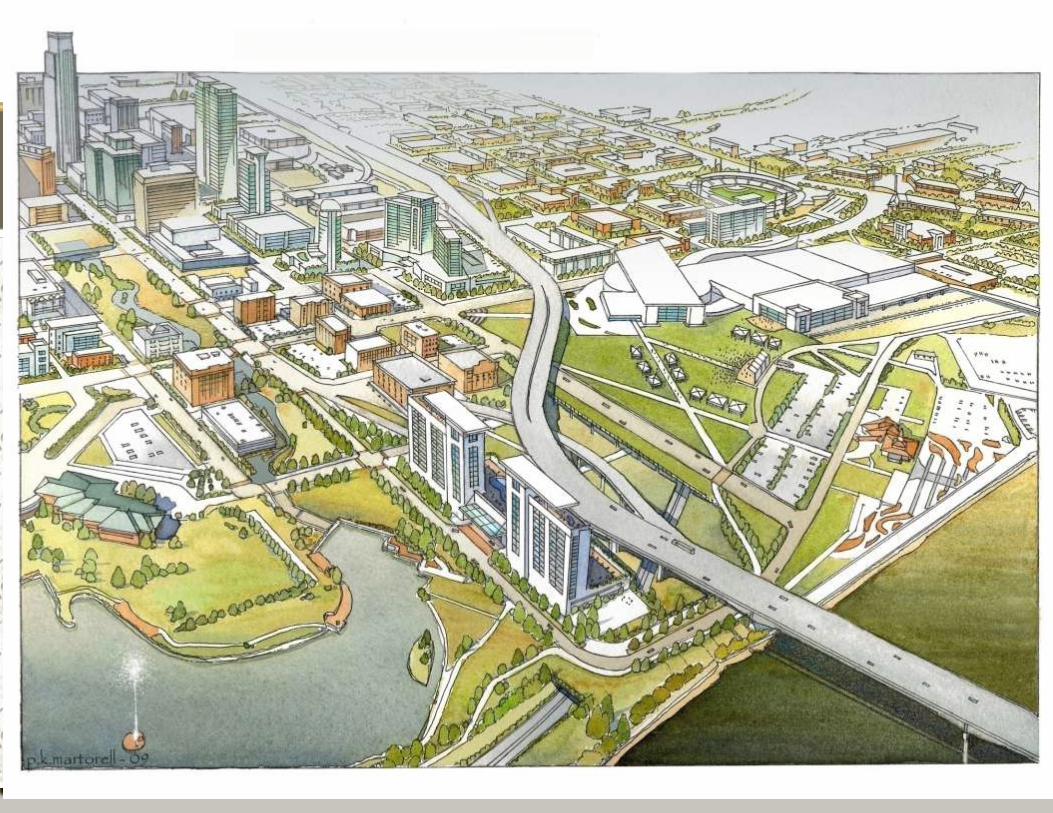
OMAHA | Riverfront Redevelopment Plan
Project Financing
• $84 Million – Riverfront Bonds
• Revenue Sources
- State Cigarette tax
- Sewer Use fees
- PMNRD / Douglas County - Miller Park contribution
- Tax Increment Financing (TIF)
- Land sales & Lease revenue
- Property & Sales taxes
OMAHA | Riverfront redevelopment
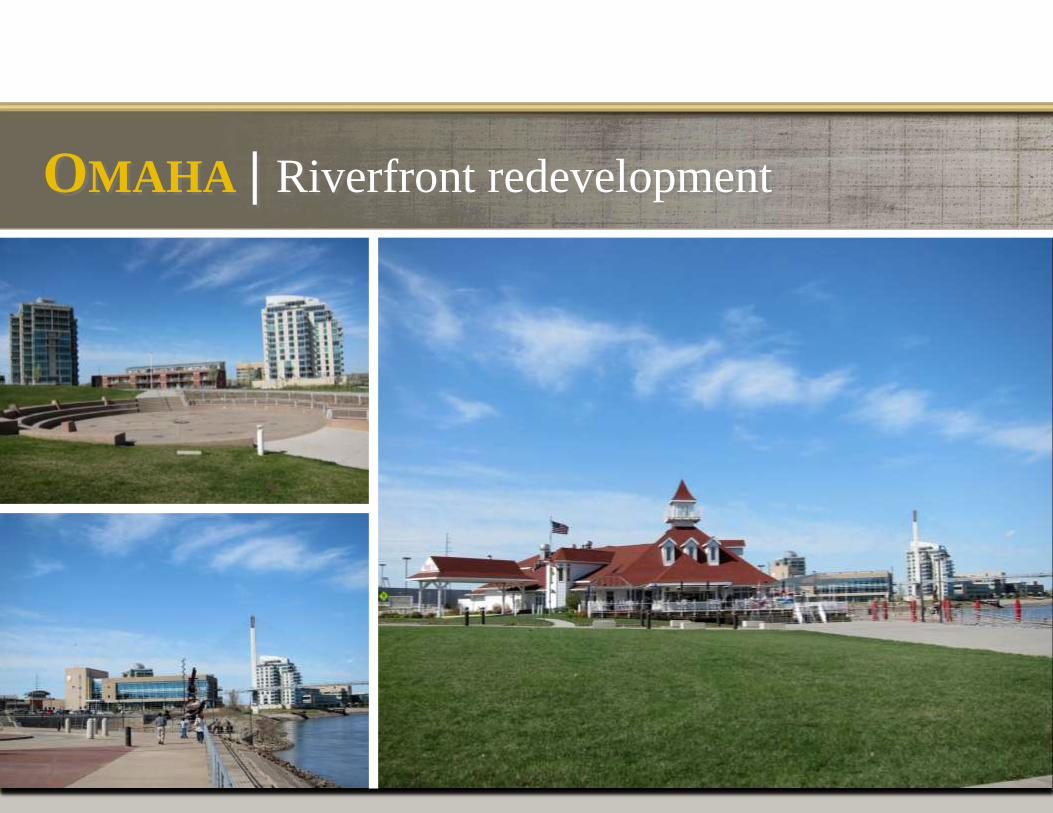
OMAHA | Riverfront redevelopment
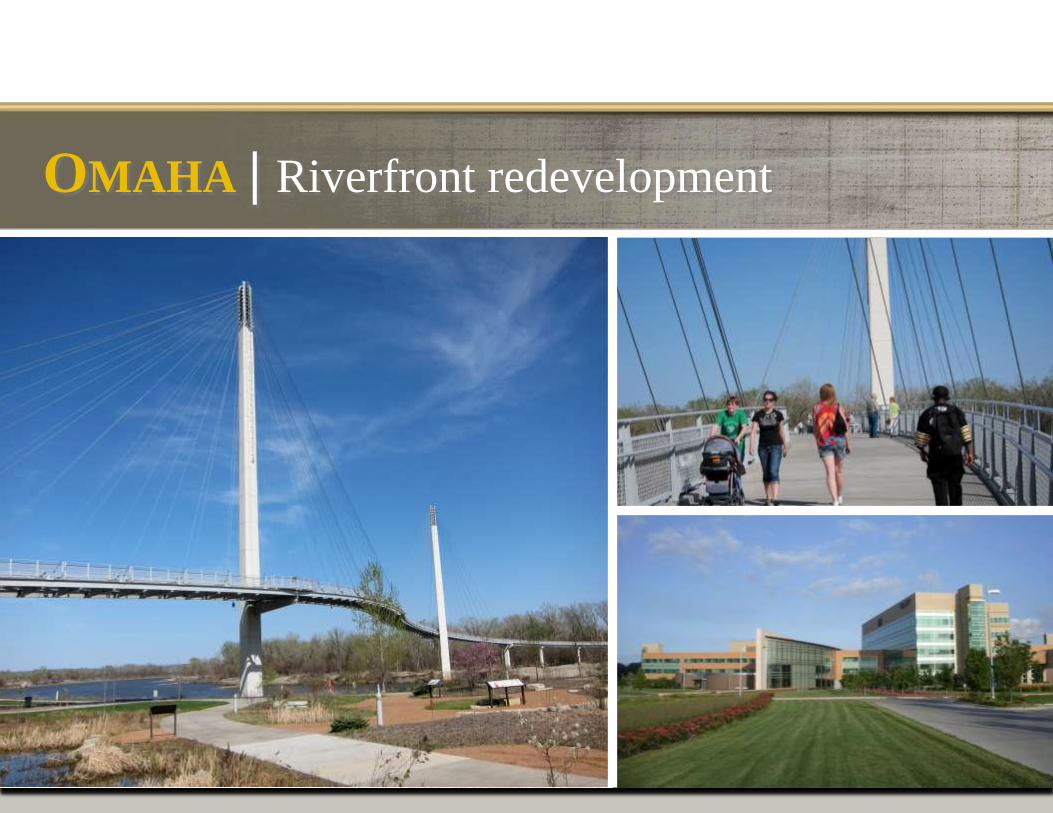
OMAHA | Riverfront redevelopment
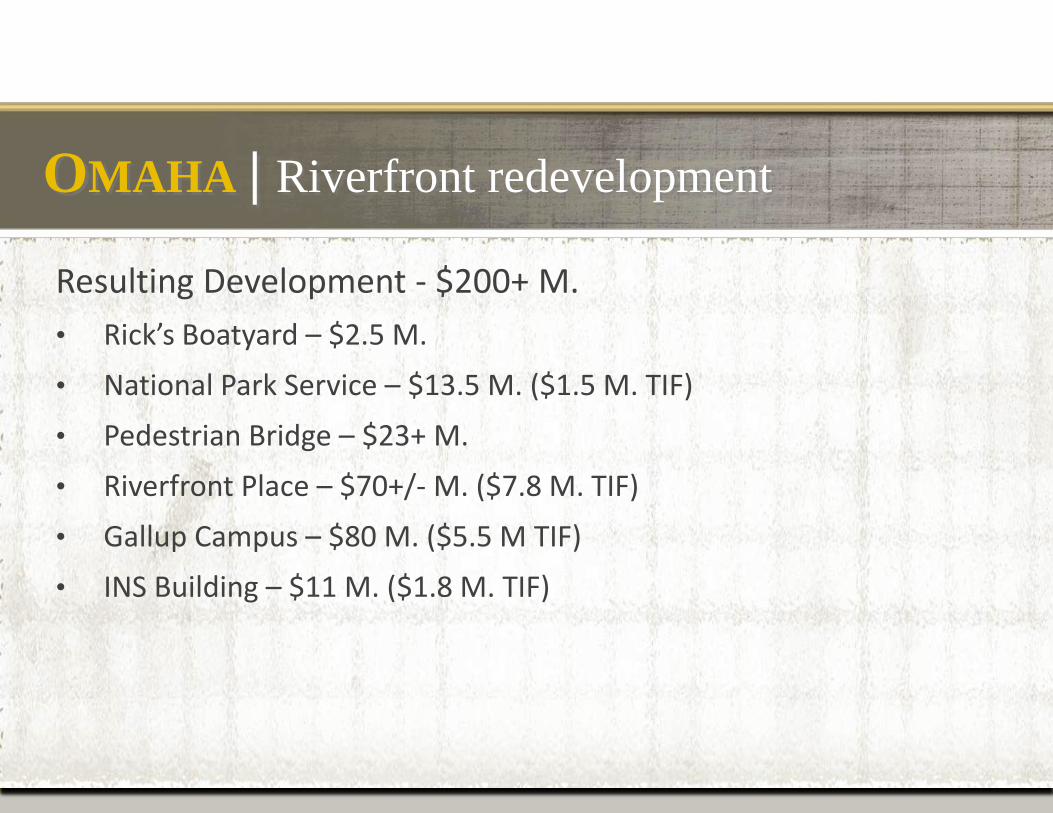
Resulting Development - $200+ M.
• Rick’s Boatyard – $2.5 M.
• National Park Service – $13.5 M. ($1.5 M. TIF)
• Pedestrian Bridge – $23+ M.
• Riverfront Place – $70+/- M. ($7.8 M. TIF)
• Gallup Campus – $80 M. ($5.5 M TIF)
• INS Building – $11 M. ($1.8 M. TIF)
OMAHA | Riverfront redevelopment
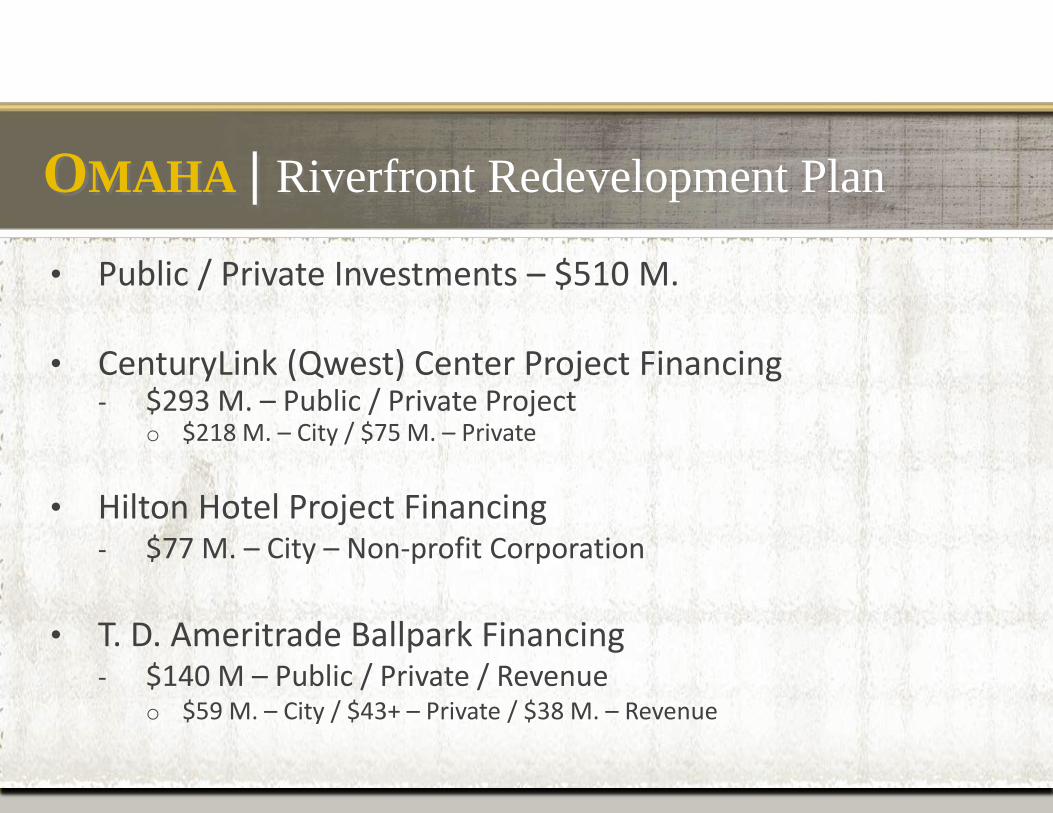
• Public / Private Investments – $510 M.
• CenturyLink (Qwest) Center Project Financing - $293 M. – Public / Private Project
o $218 M. – City / $75 M. – Private
• Hilton Hotel Project Financing
- $77 M. – City – Non-profit Corporation
• T. D. Ameritrade Ballpark Financing
- $140 M – Public / Private / Revenue o $59 M. – City / $43+ – Private / $38 M. – Revenue
OMAHA | Riverfront Redevelopment Plan
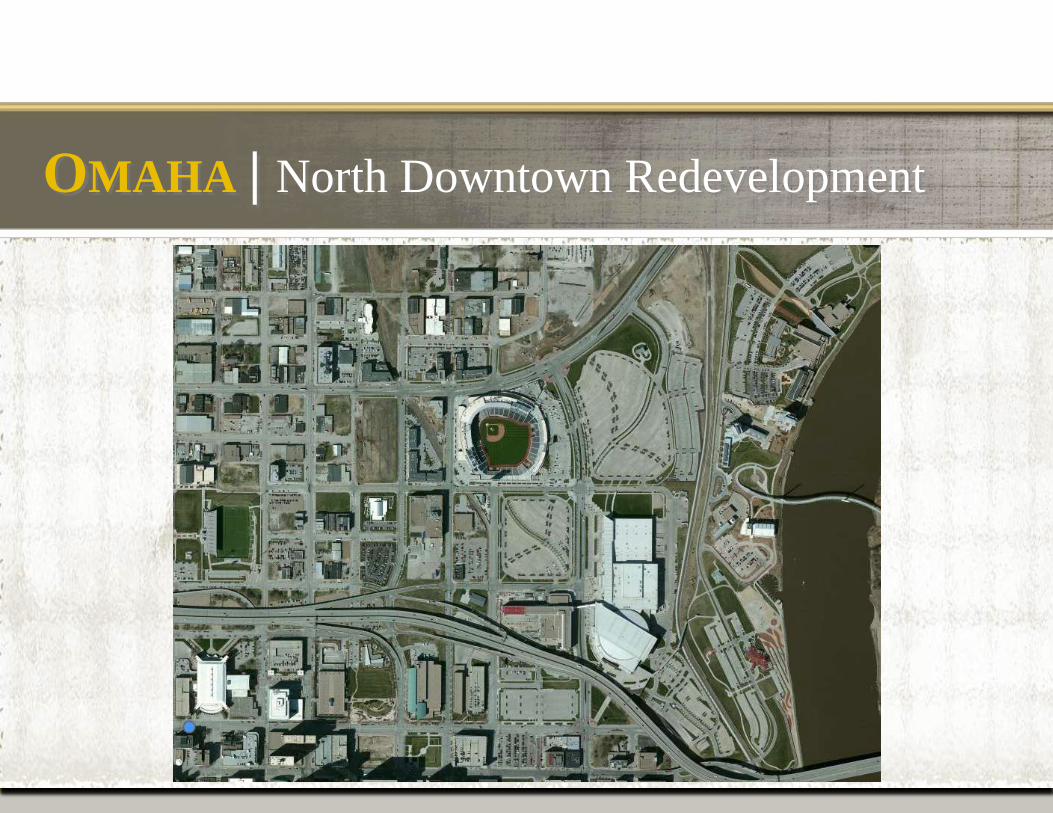
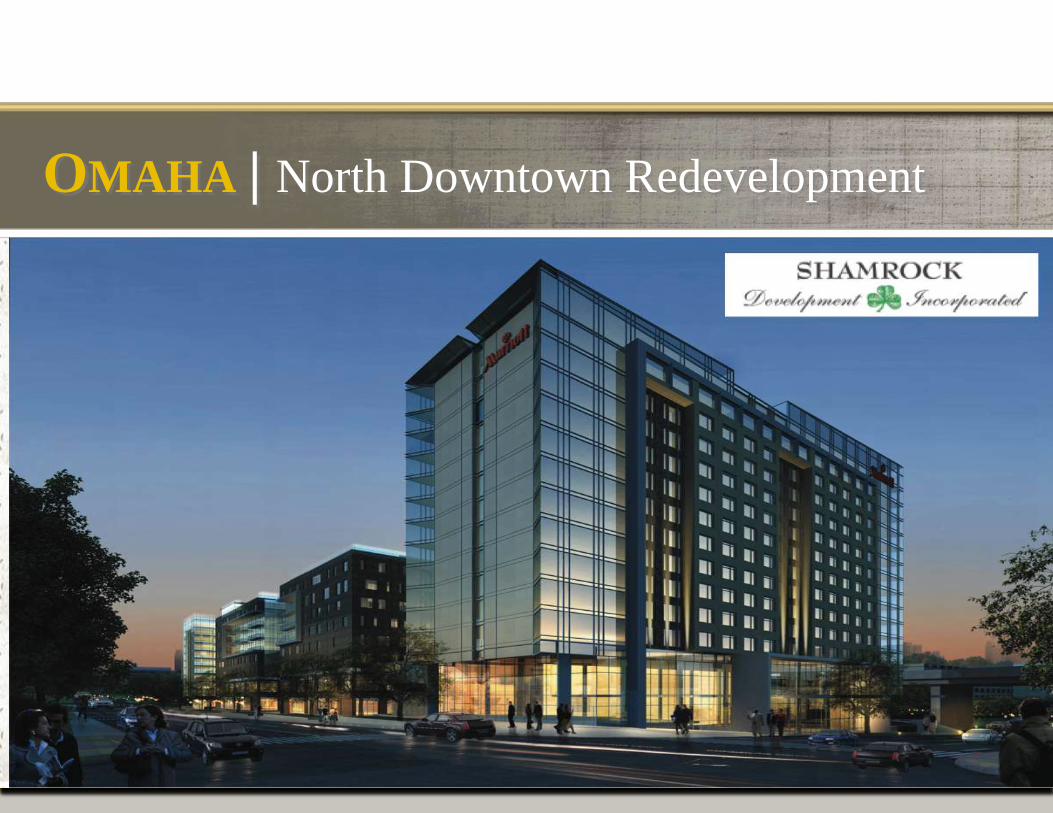
OMAHA | North Downtown Redevelopment
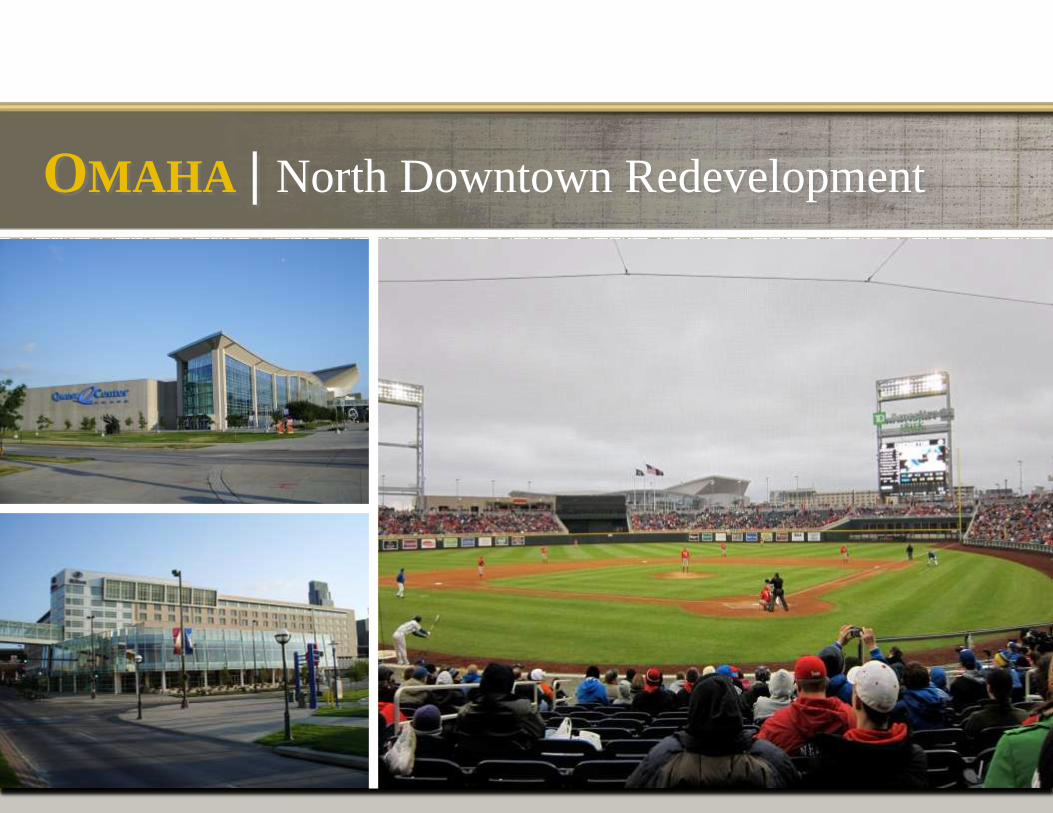
OMAHA | North Downtown Redevelopment
OMAHA | North Downtown Redevelopment
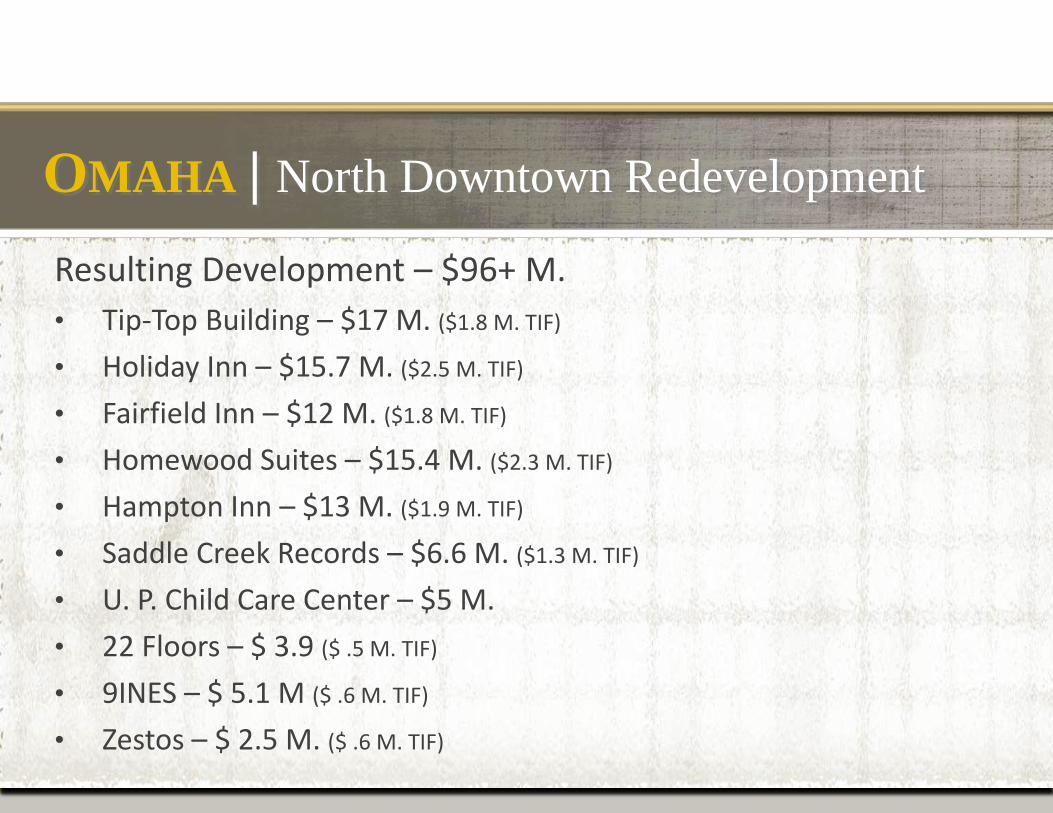
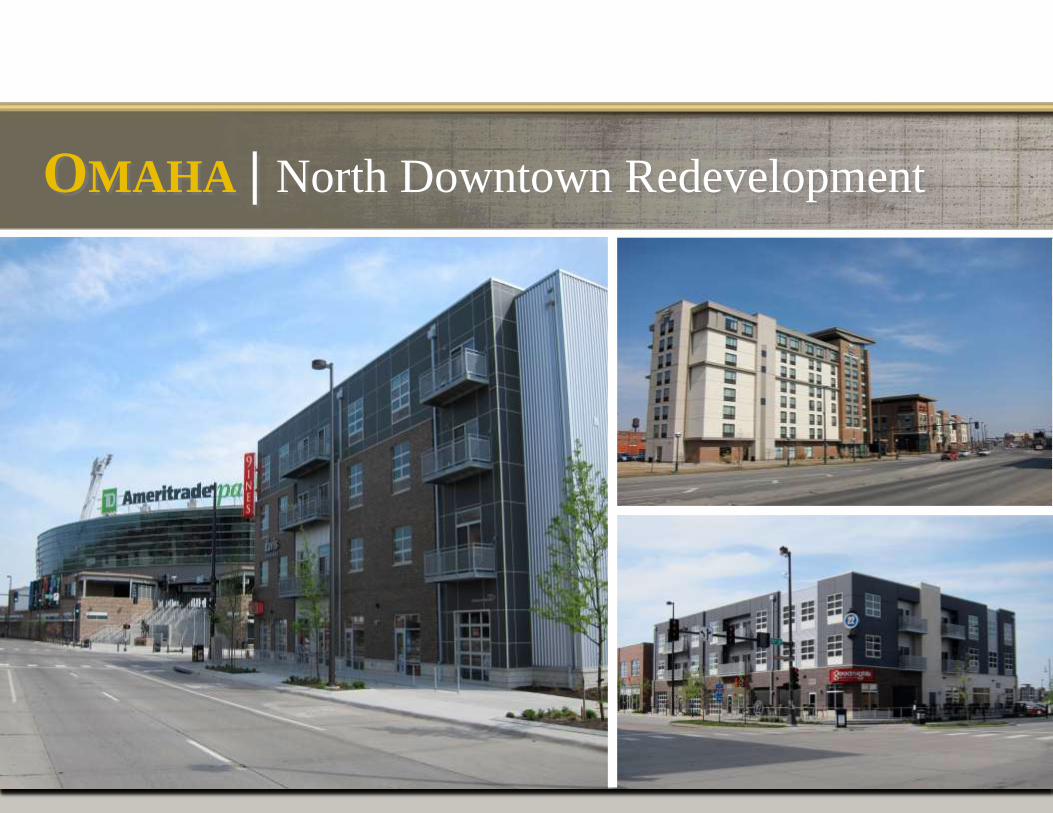
Resulting Development – $96+ M.
• Tip-Top Building – $17 M. ($1.8 M. TIF)
• Holiday Inn – $15.7 M. ($2.5 M. TIF)
• Fairfield Inn – $12 M. ($1.8 M. TIF)
• Homewood Suites – $15.4 M. ($2.3 M. TIF)
• Hampton Inn – $13 M. ($1.9 M. TIF)
• Saddle Creek Records – $6.6 M. ($1.3 M. TIF)
• U. P. Child Care Center – $5 M.
• 22 Floors – $ 3.9 ($ .5 M. TIF)
• 9INES – $ 5.1 M ($ .6 M. TIF)
• Zestos – $ 2.5 M. ($ .6 M. TIF)
OMAHA | North Downtown Redevelopment
OMAHA | North Downtown Redevelopment
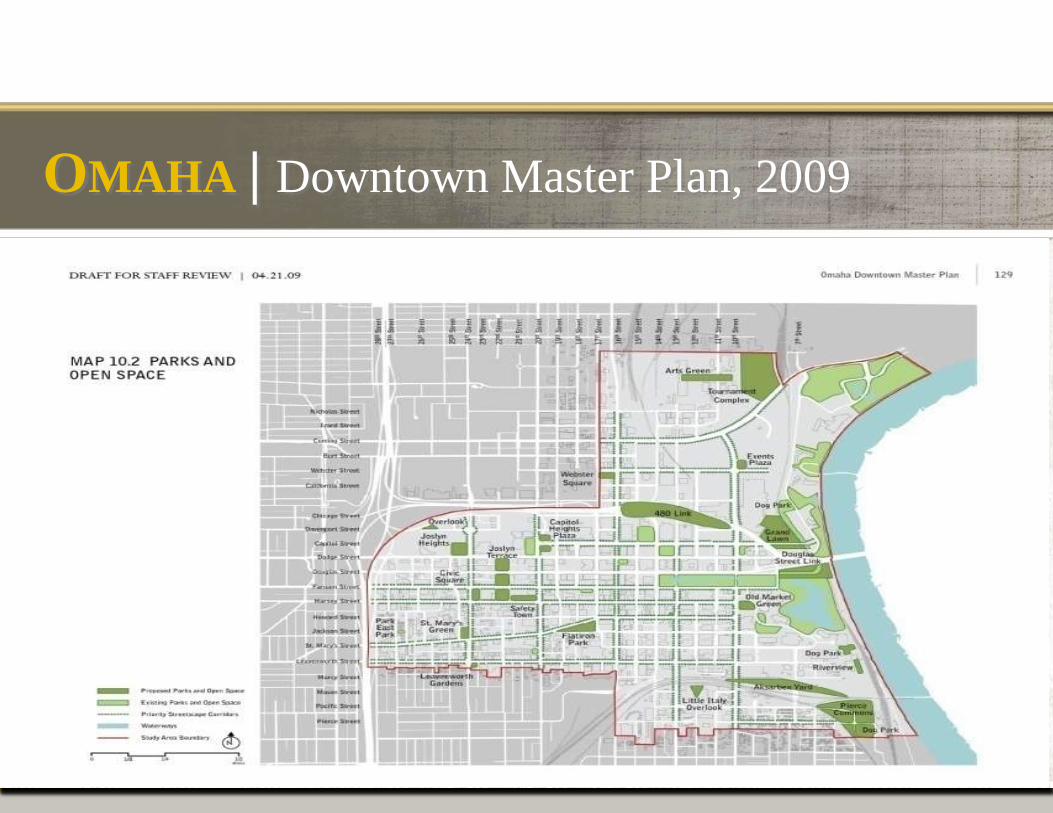
OMAHA | Downtown Master Plan, 2009
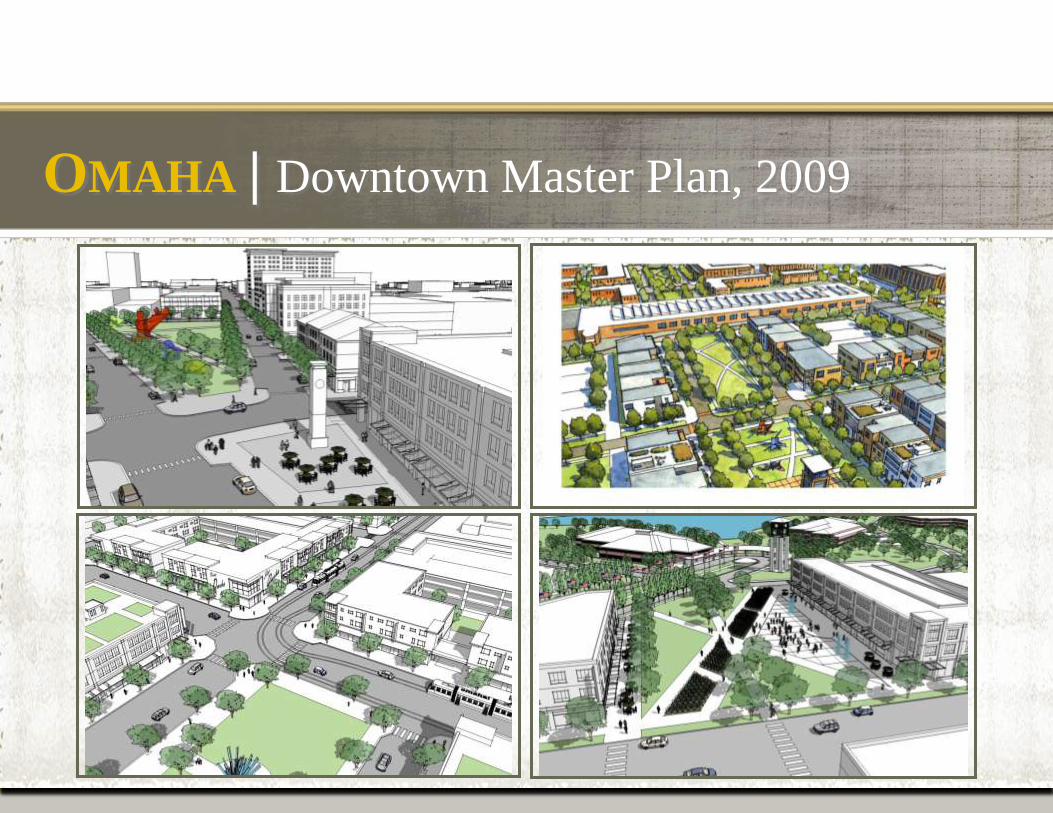
OMAHA | Downtown Master Plan, 2009
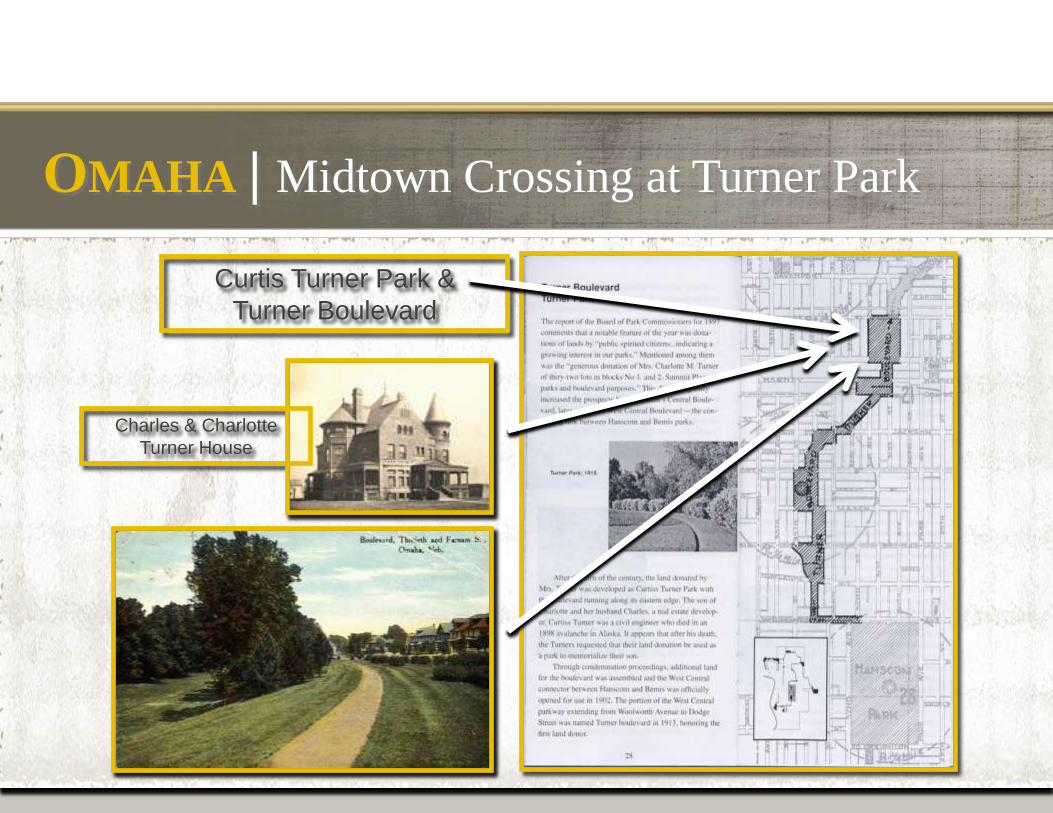
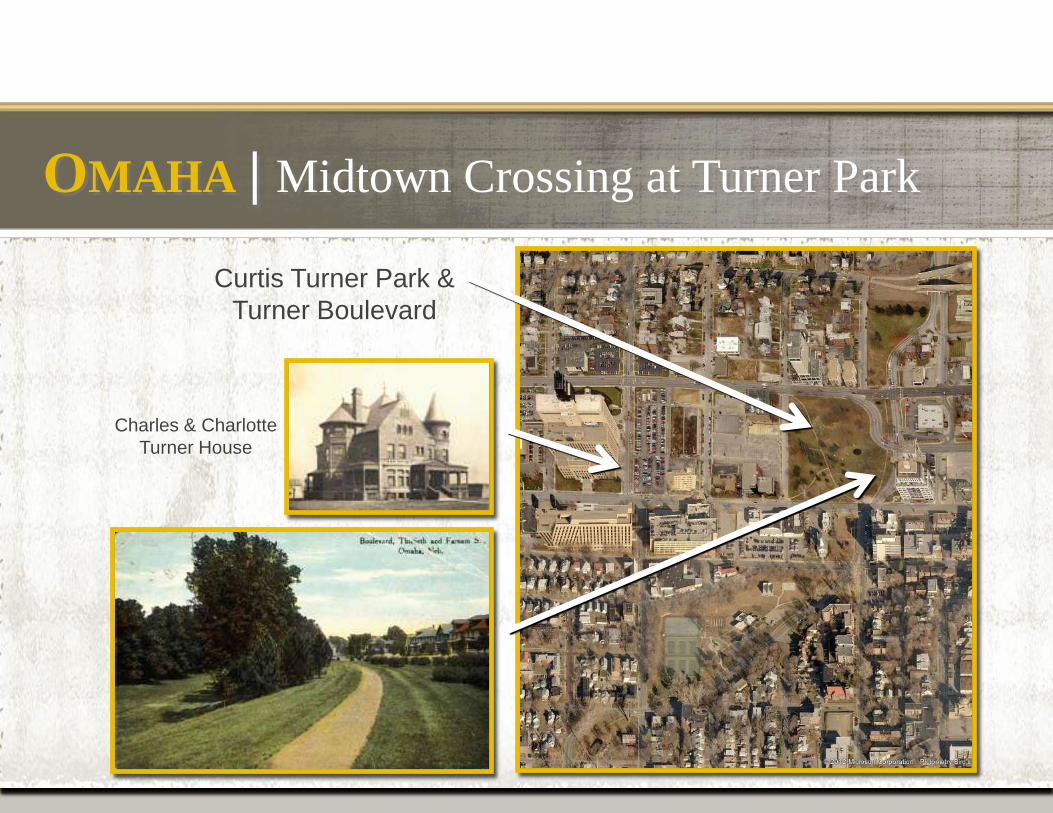
Charles & Charlotte
Turner House
Curtis Turner Park &
Turner Boulevard
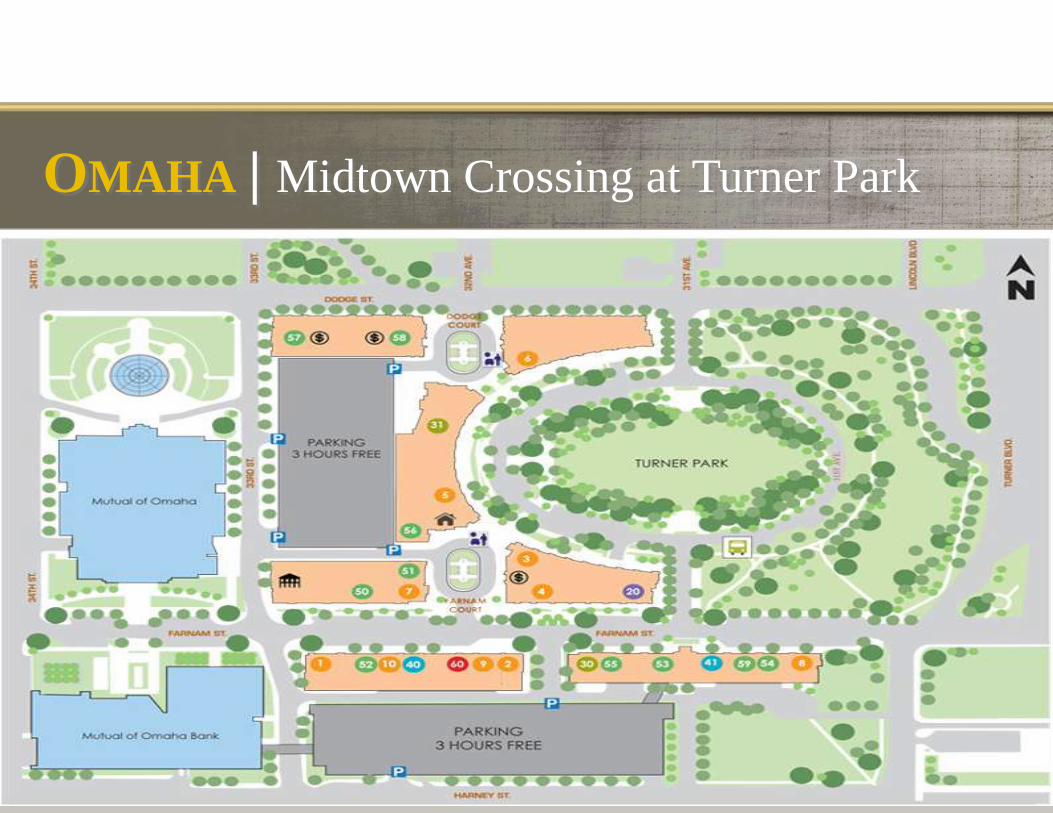
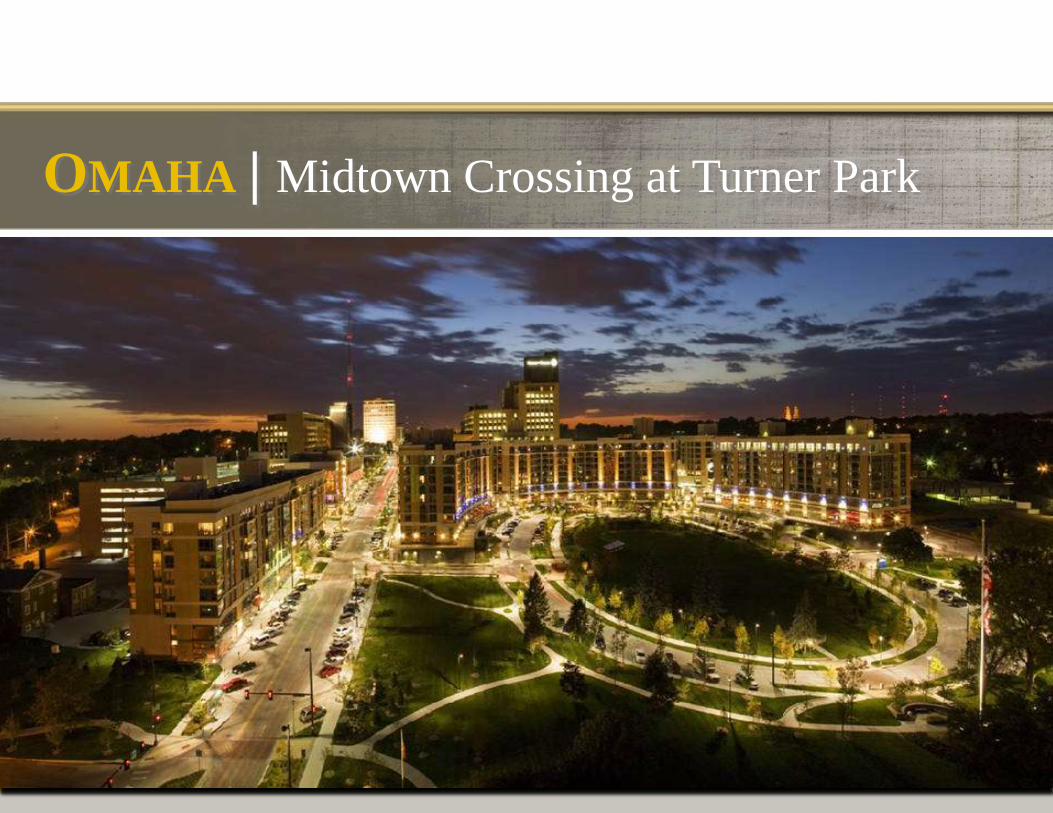
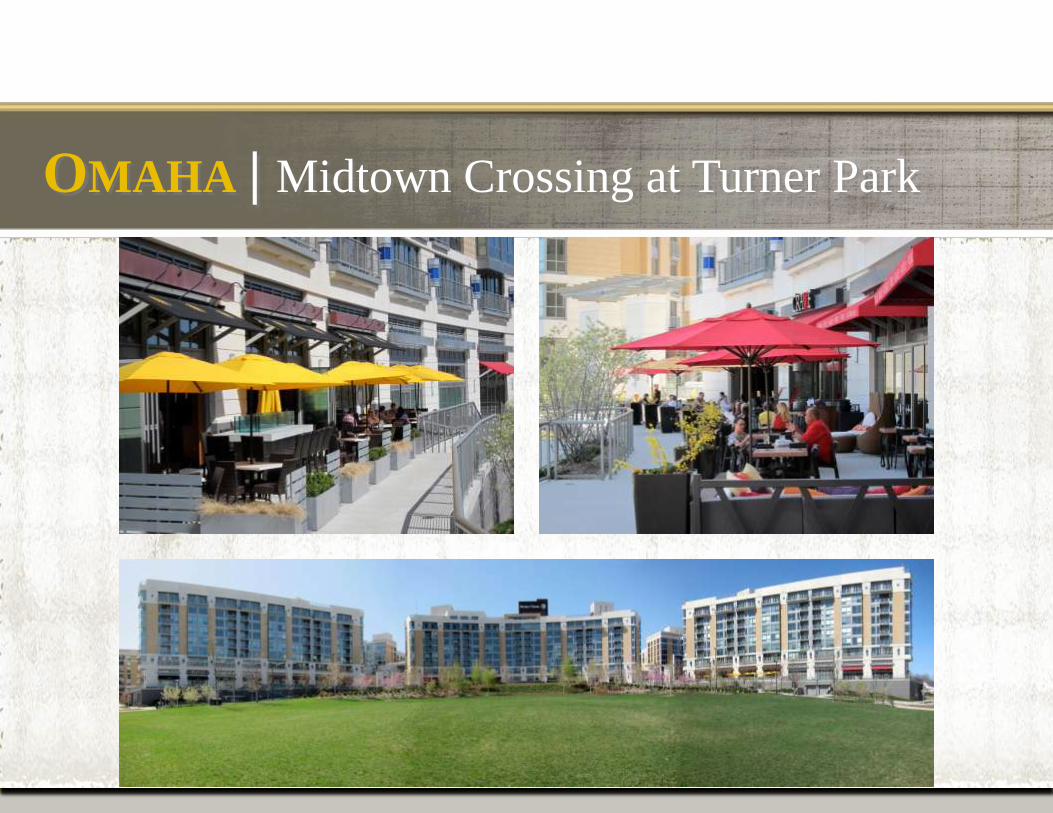
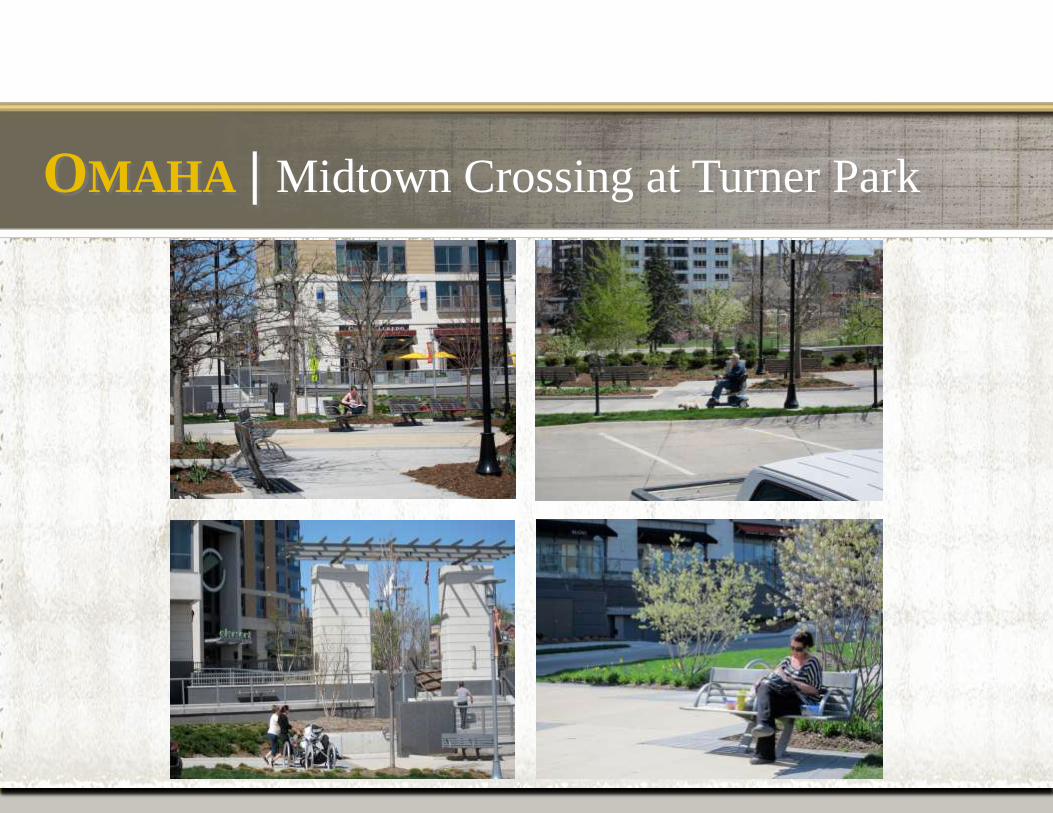
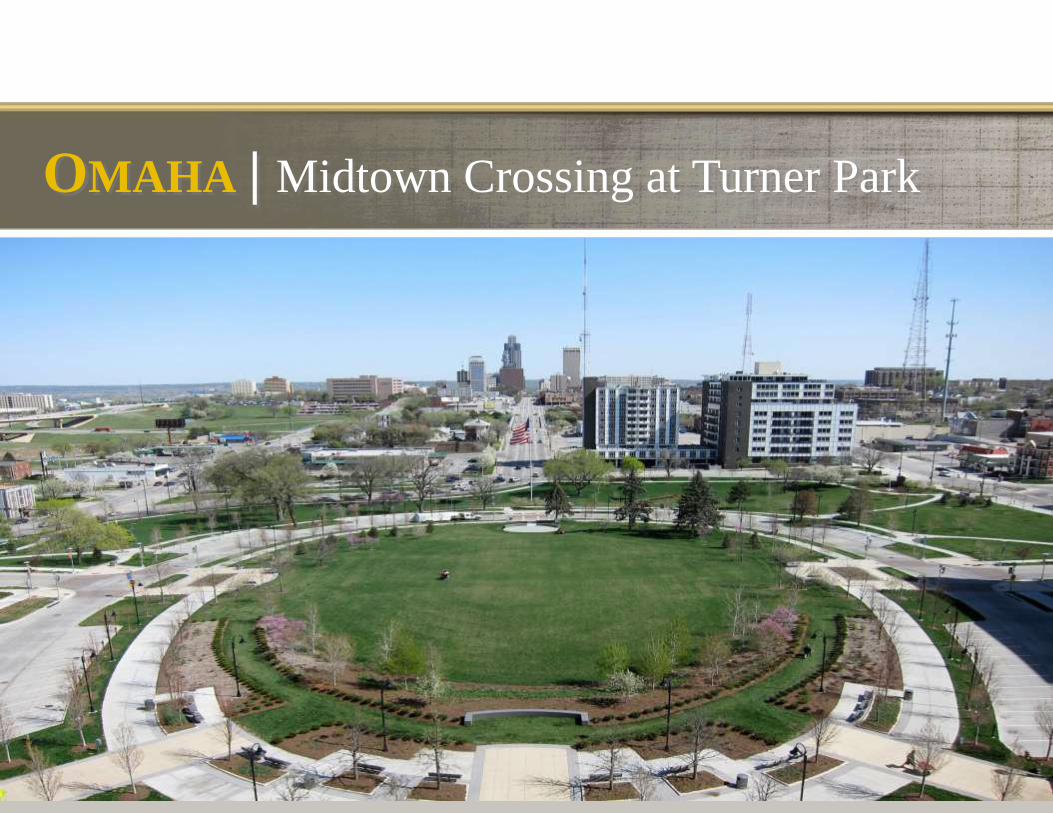
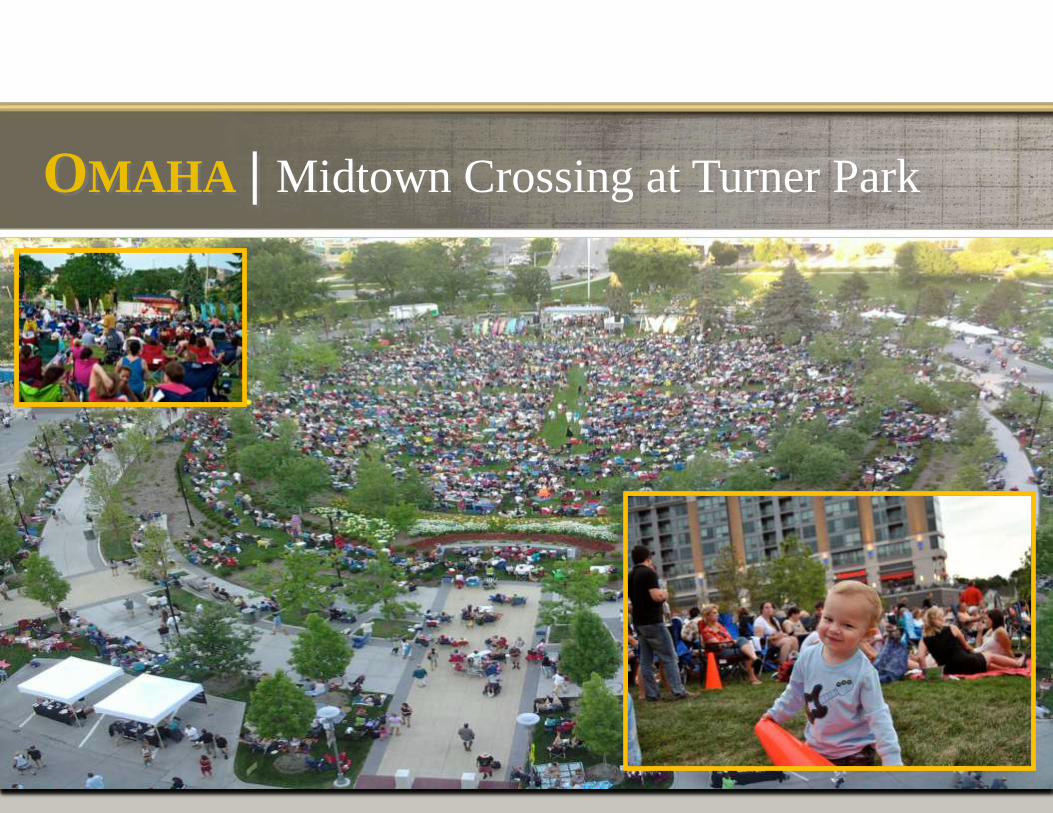
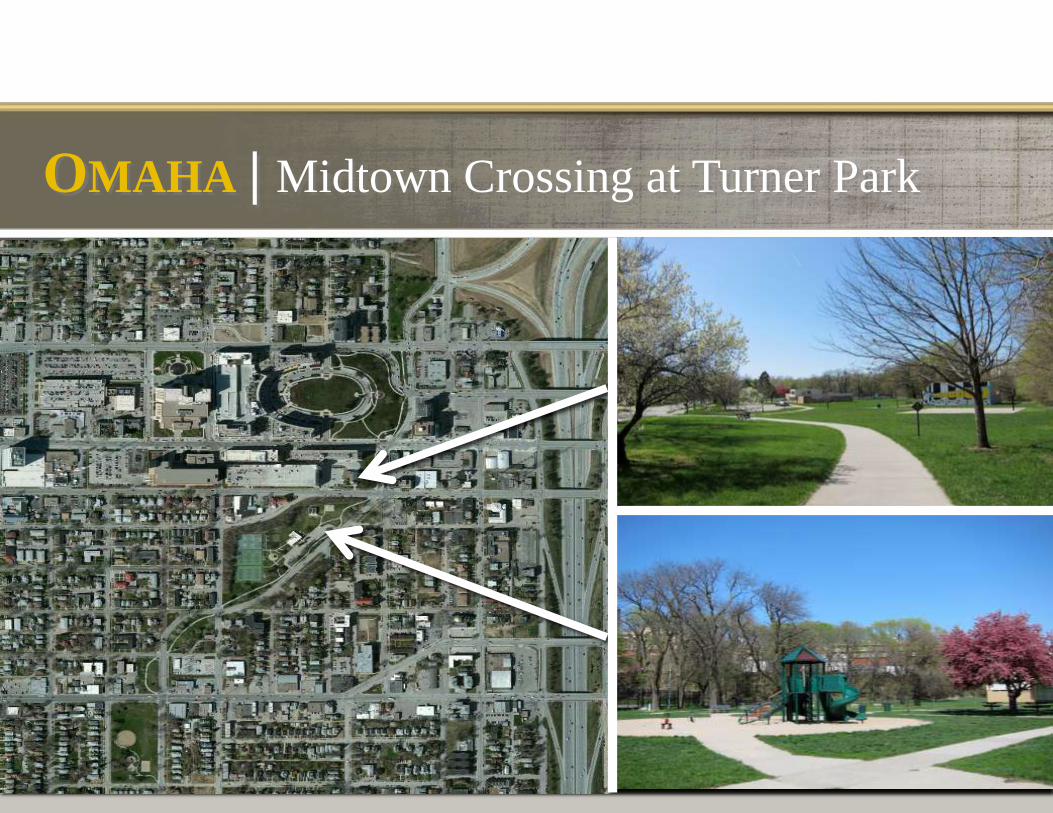
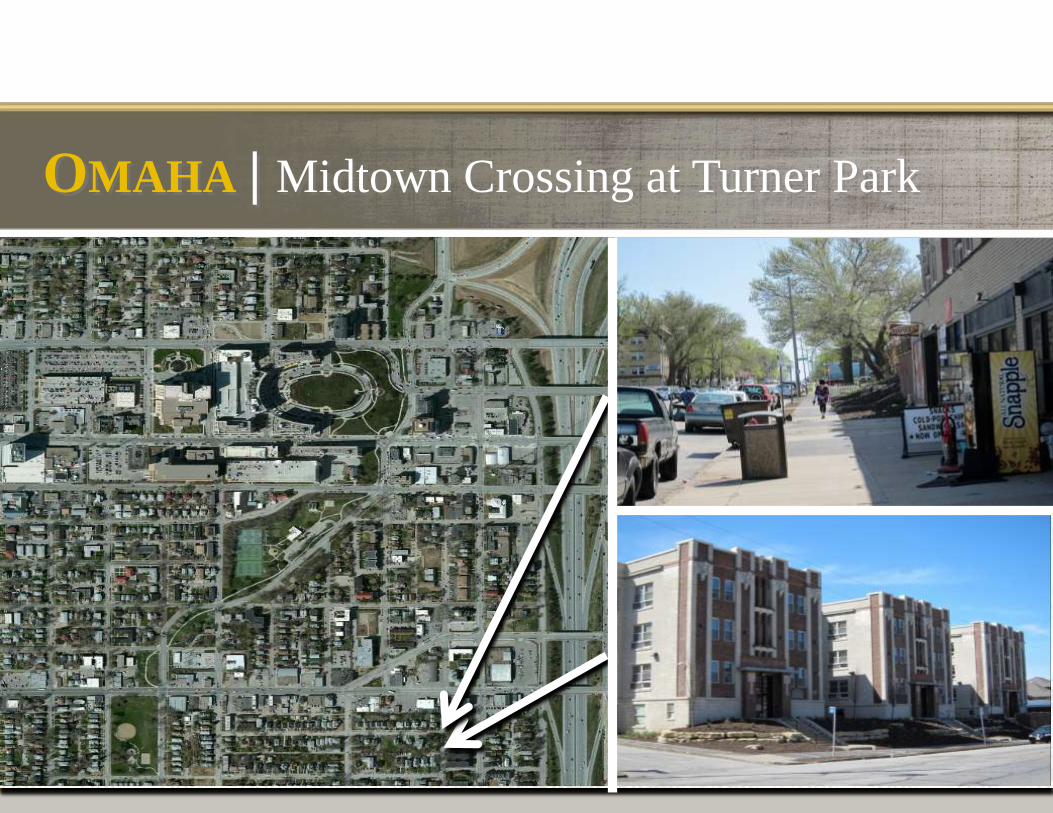
OMAHA | Midtown Crossing at Turner Park
Charles & Charlotte
Turner House
Curtis Turner Park &
Turner Boulevard
OMAHA | Midtown Crossing at Turner Park
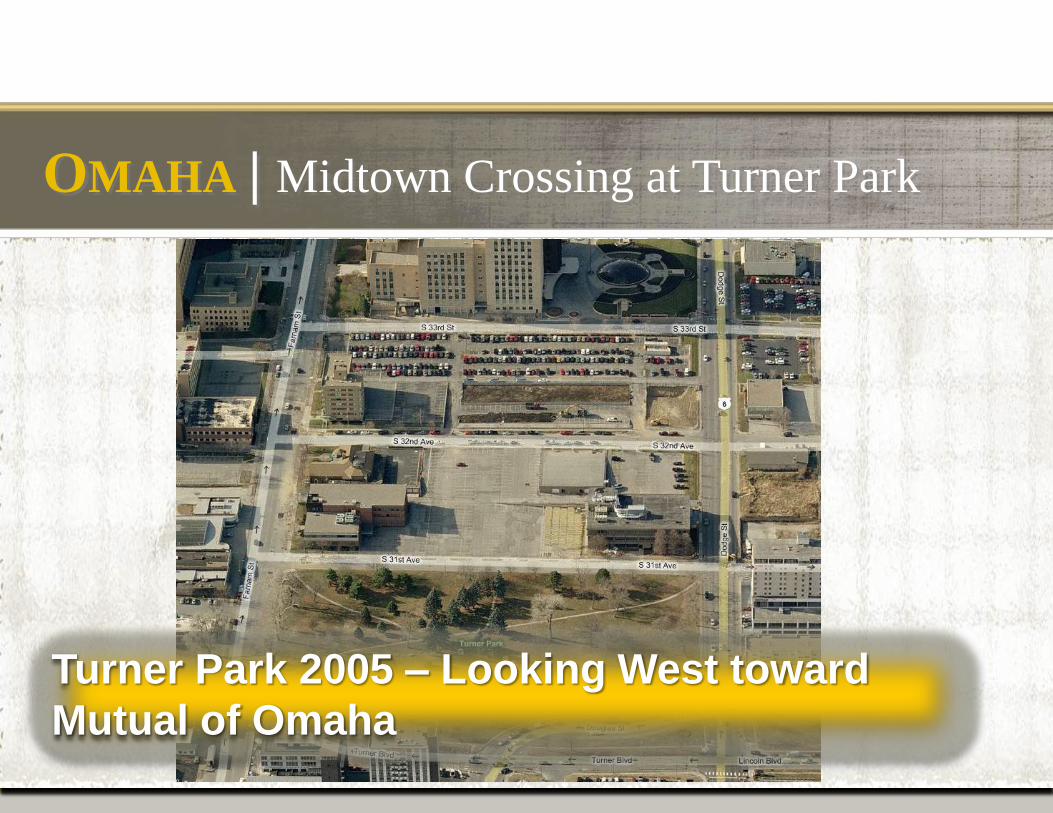
OMAHA | Midtown Crossing at Turner Park
Turner Park 2005 – Looking West toward
Mutual of Omaha
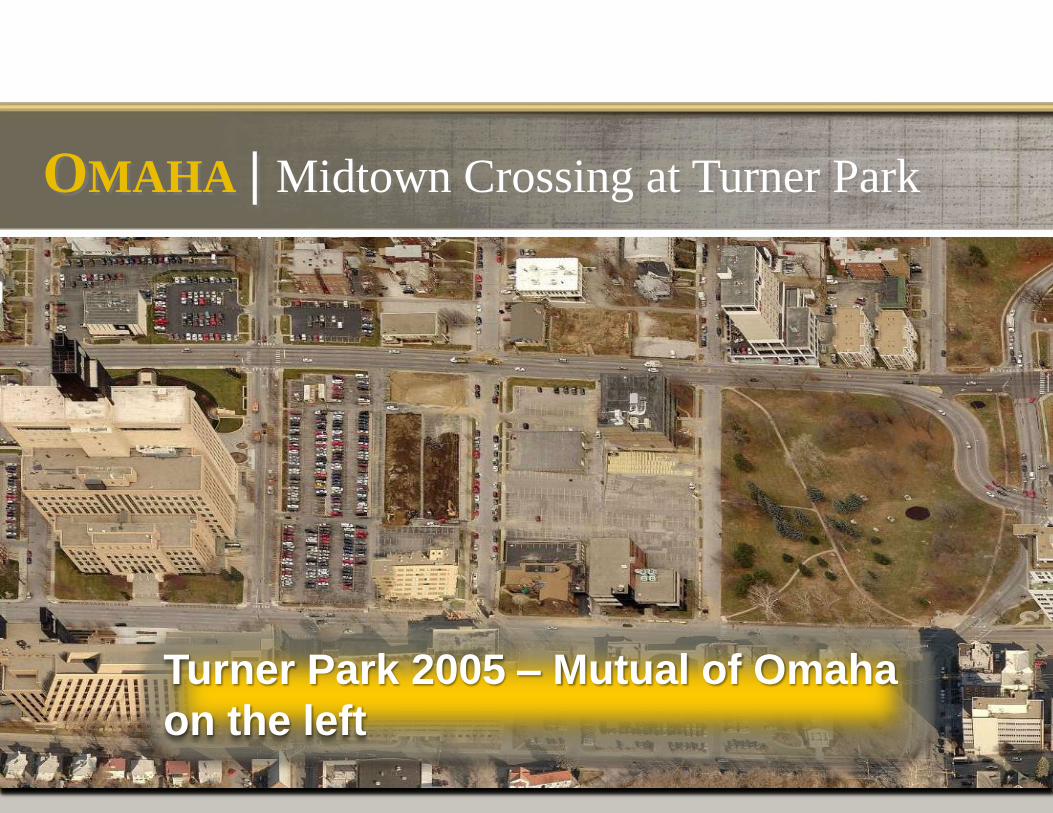
Turner Park 2005 – Mutual of Omaha
on the left
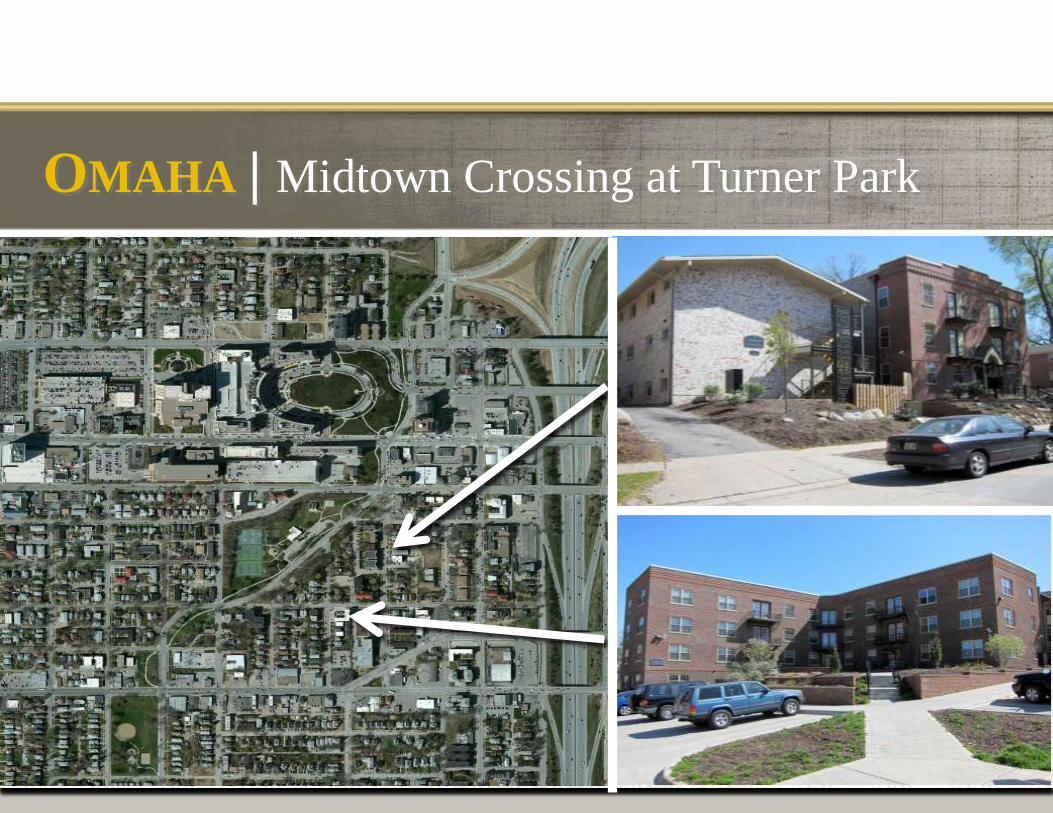
OMAHA | Midtown Crossing at Turner Park
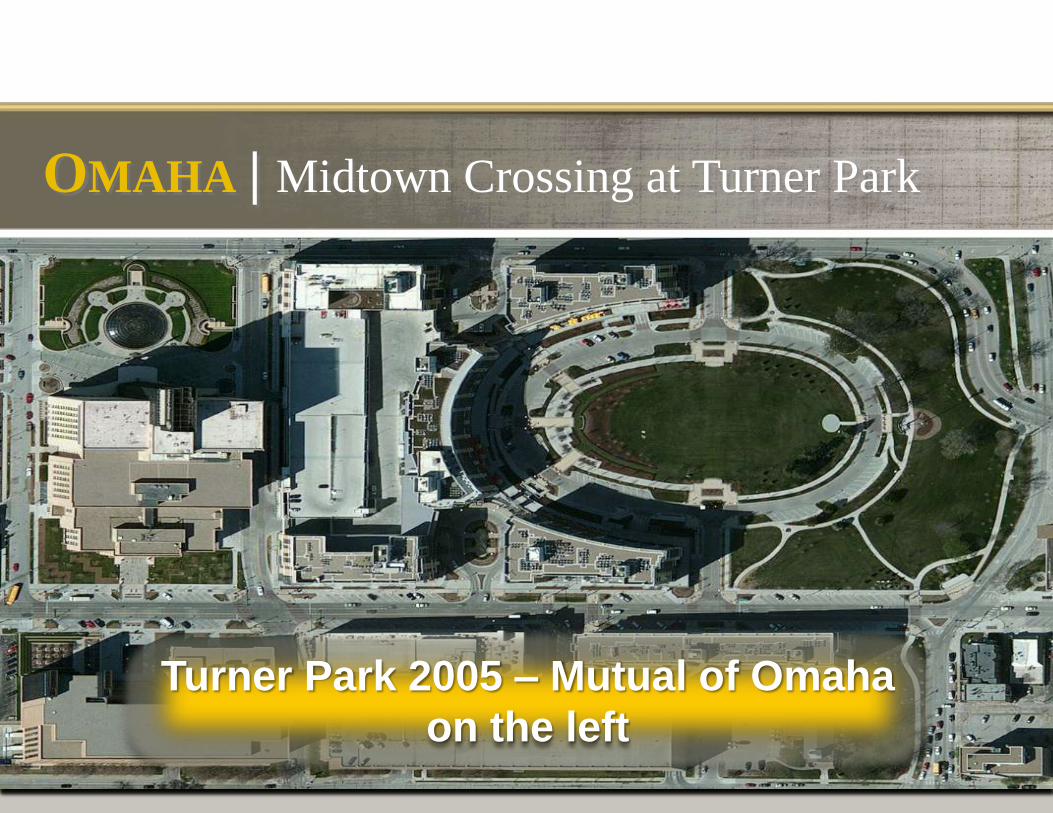
OMAHA | Midtown Crossing at Turner Park
Turner Park 2005 – Mutual of Omaha
on the left
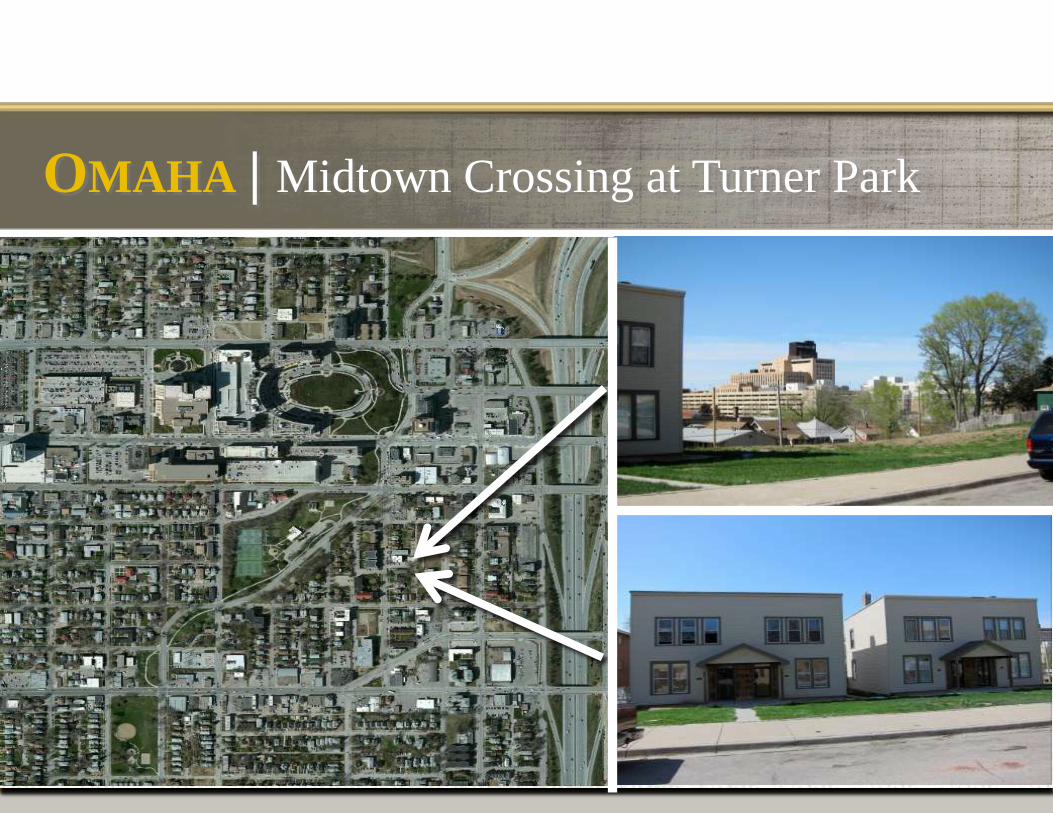
OMAHA | Midtown Crossing at Turner Park
Turner Park 2005 – Mutual of Omaha on the left
OMAHA | Midtown Crossing at Turner Park
Turner Park 2005 – Mutual of Omaha on the left
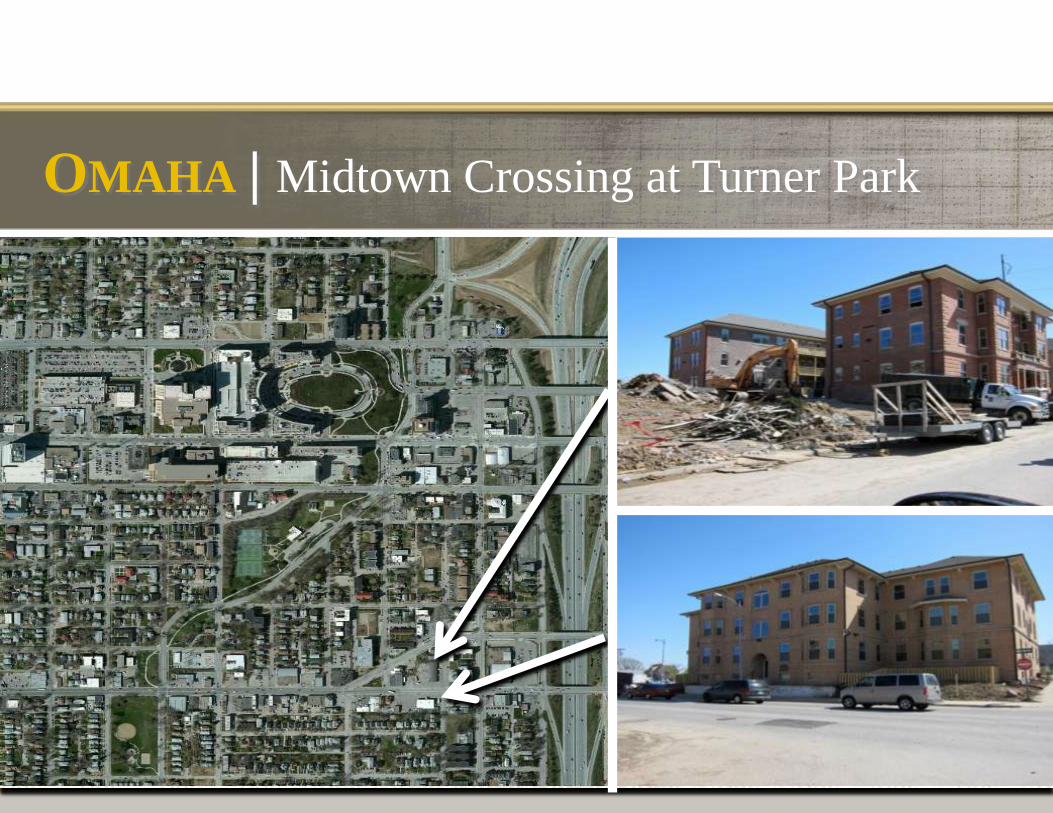
OMAHA | Midtown Crossing at Turner Park
OMAHA | Midtown Crossing at Turner Park
OMAHA | Midtown Crossing at Turner Park
Turner Park 2005 – Mutual of Omaha on the left
OMAHA | Midtown Crossing at Turner Park
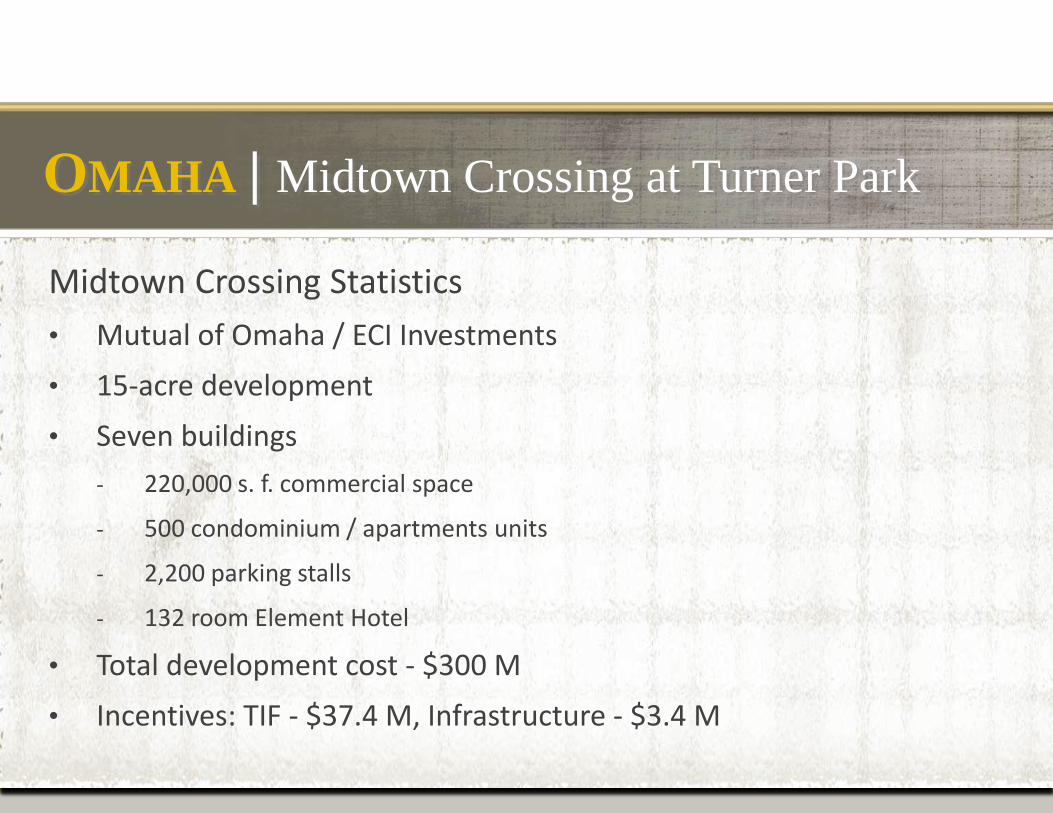
Midtown Crossing Statistics
• Mutual of Omaha / ECI Investments
• 15-acre development
• Seven buildings
- 220,000 s. f. commercial space
- 500 condominium / apartments units
- 2,200 parking stalls
- 132 room Element Hotel
• Total development cost - $300 M
• Incentives: TIF ‐ $37.4 M, Infrastructure ‐ $3.4 M
OMAHA | Midtown Crossing at Turner Park
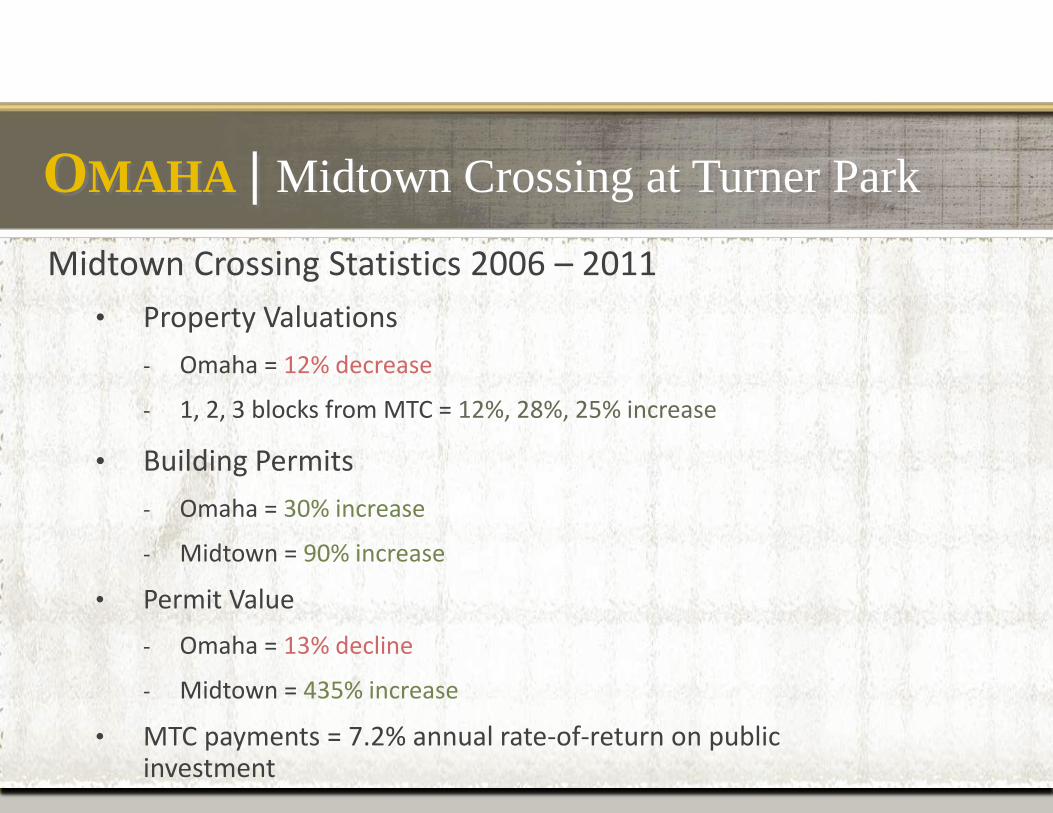
Midtown Crossing Statistics 2006 – 2011
• Property Valuations
- Omaha = 12% decrease
- 1, 2, 3 blocks from MTC = 12%, 28%, 25% increase
• Building Permits
- Omaha = 30% increase
- Midtown = 90% increase
• Permit Value
- Omaha = 13% decline
- Midtown = 435% increase
• MTC payments = 7.2% annual rate-of-return on public investment
OMAHA | Midtown Crossing at Turner Park
OMAHA | Midtown Crossing at Turner Park
OMAHA | Midtown Crossing at Turner Park
OMAHA | Midtown Crossing at Turner Park
OMAHA | Midtown Crossing at Turner Park
OMAHA | Midtown Crossing at Turner Park
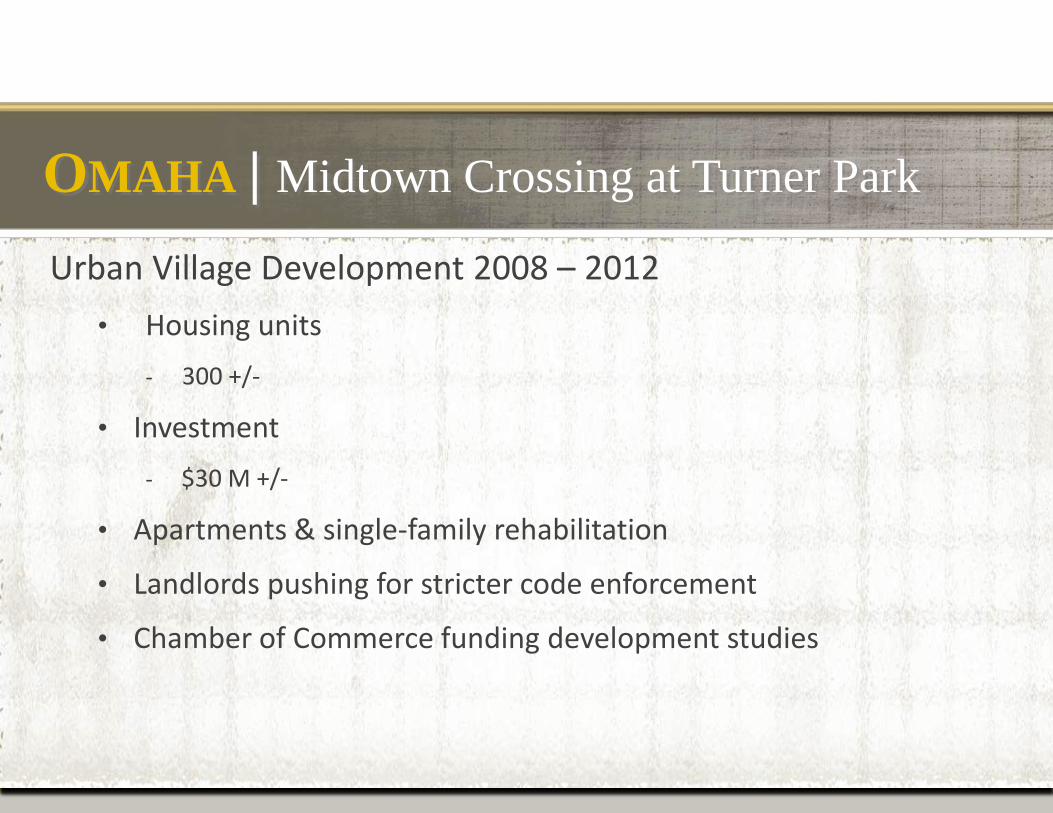
Urban Village Development 2008 – 2012
• Housing units
- 300 +/-
• Investment
- $30 M +/-
• Apartments & single-family rehabilitation
• Landlords pushing for stricter code enforcement
• Chamber of Commerce funding development studies
OMAHA | Midtown Crossing at Turner Park
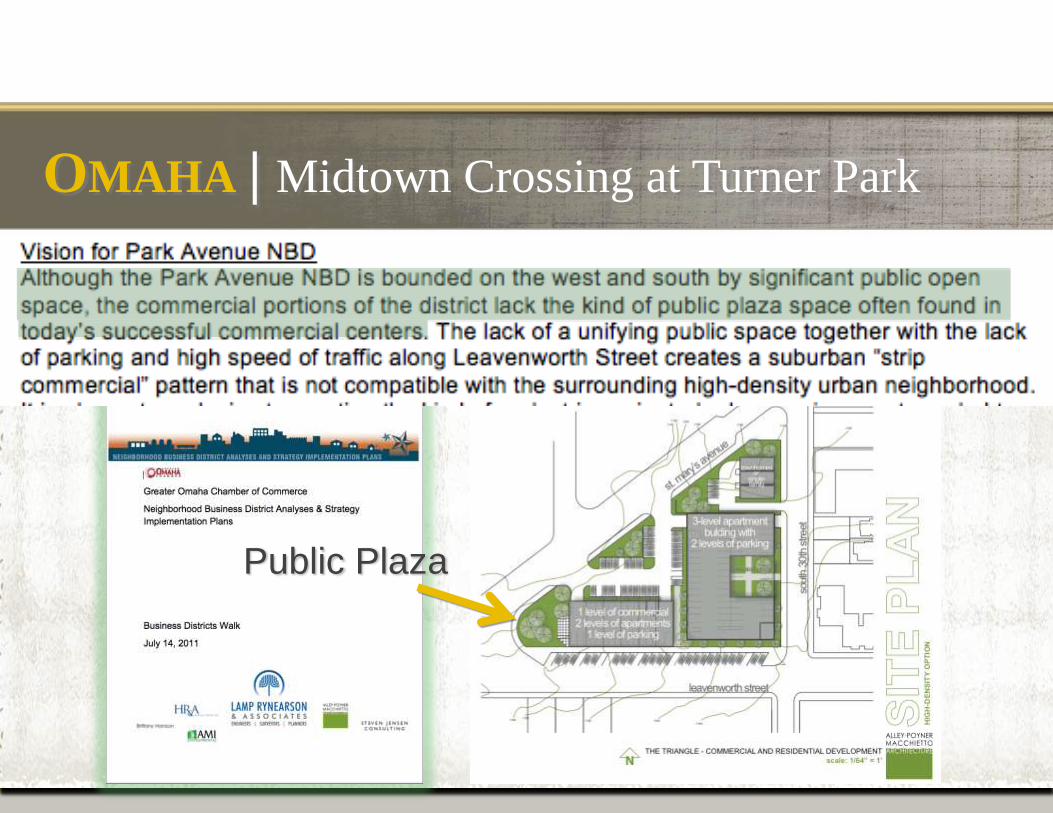
Public Plaza
OMAHA | Midtown Crossing at Turner Park
OMAHA | Midtown Crossing at Turner Park
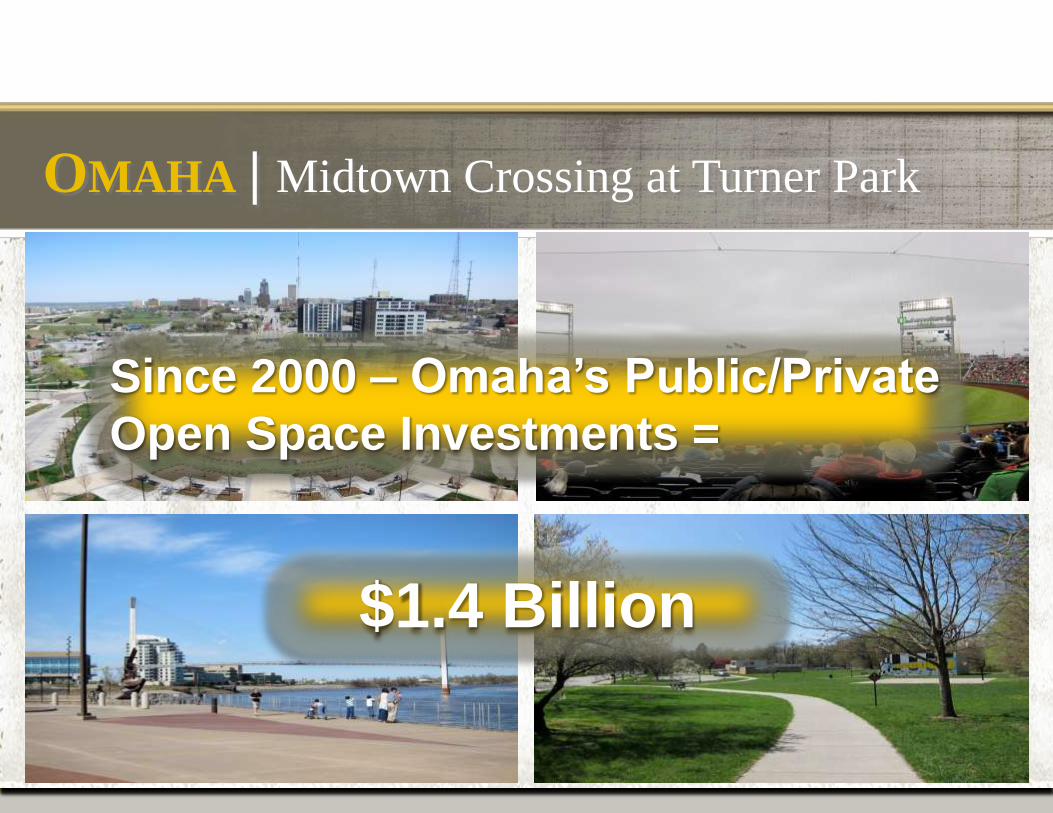
OMAHA | Midtown Crossing at Turner Park
Since 2000 – Omaha’s Public/Private
Open Space Investments =
$1.4 Billion
Thank you
National APA Conference Los Angeles, California April 13-17, 2012 presented by:
Bret C. Keast, AICP | Kendig Keast Collaborative
Greg Flisram, AICP, CEcD | City of Green Bay EDC
Steve Jensen, AICP | Steve Jensen Consulting
Thank you
National APA Conference Los Angeles, California April 13-17, 2012 presented by:
Bret C. Keast, AICP | Kendig Keast Collaborative
Greg Flisram, AICP, CEcD | City of Green Bay EDC
Steve Jensen, AICP | Steve Jensen Consulting