Embed Size (px)
Citation preview
The role of services for competitiveness in manufacturing
Hildegunn Kyvik Nordås and Yunhee Kim, OECD1
AbstractThis study analyses the relationships between competitiveness in manufacturing and the quality of key supporting services. Two indicators of competitiveness are considered: the degree of product differentiation and the duration of trade. The density of telecoms networks and the reliability of electricity supply stand out as the most crucial for competitive manufacturing. In addition the ease at which contracts can be enforced and the time it takes to export and import goods are strongly related to competitiveness. Our methodology allows us to go beyond a one size fits all policy analysis. Interestingly, we find that in low-income countries, the impact of services quality and policy on competitiveness is highest in low-technology industries; in middle-income countries it is highest in medium-technology sectors and in high-income countries the impact is highest in medium-high and high-technology industries. This suggests that better services contribute to moving up the value chain in industries where a country already has technological capacity and comparative advantage, but better services alone may not stimulate product differentiation in sectors where a country is far from the competitive edge – at least not in the short run. Policy reforms needed are to simplify procedures for contract enforcement, liberalisation of FDI, strengthen pro-competitive regulation of network services, and eliminate tariffs. It is concluded that new ways of doing business where manufacturers build relationships with customers and compete on the basis of products they are willing to pay a premium for has the potential to become an important driving force for growth after the great recession, provided that adequate support from competitive services markets is in place.
JEL: F12, F14
Keywords: Services, product differentiation, competitiveness, resilience.
Introduction
Since the establishment of the Bretton Woods institutions and the GATT, tariffs and transport costs have come down substantially. As a result production became more geographically dispersed and a spurt in trade relative to GDP ensued, rising from 25.9% of world GDP in 1960 to 60.5% in 2012. At first specialisation according to comparative advantage was the major driving force. As trade costs came further down and consumers became richer and more sophisticated, intra-industry trade among countries with similar resource endowments and income levels pushed the ratio of trade to GDP higher still.
Intra-industry trade can be either horizontal or vertical. Horizontal intra-industry trade features the exchange of different brands of the same good, to the benefit of consumers who have more varieties to choose from. Furthermore, consumers are willing to pay more for brands that correspond to their preferences and their desire to distinguish themselves from the crowd. Branding is associated with marketing, design, and a host of other services. Thus, branding and product differentiation are expected to go together with a rising services content of manufacturing.
Vertical intra-industry trade represents the slicing up of the value chain with production of parts, components, services and tasks dispersed geographically and shipped to assembly lines either in large factories in low-cost countries or in smaller workshops close to the market. Proponents of the idea of a new industrial revolution argue that the workshops close to the market are gaining prominence
1 E-mail: [email protected] [email protected]
1
(Marsh, 2012; Anderson, 2012), with new business opportunities for firms able to read and shape consumer tastes and create the products that consumers want even before they know it.
Not only have trade costs come down. Production costs have changed too. Flexible machine tools and automation of production processes mean that the cost of switching from one task to another is low and unit costs do not vary much with batch size. Economies of scale have in many instances shifted from fabrication to marketing, including monitoring consumer behaviour. New production and communication technologies enable manufacturers to target niche markets where design and marketing constitute an integrated feed-back loop. These activities, and sometimes also production in small batches, tend to cluster in major markets. Some analysts argue that this is the beginning of a revival of manufacturing in high-income countries (Marsh, 2012; Anderson, 2012), although most observers recon that mass production of standardised parts and components as well as standardised and digitised services are likely to locate where production costs are the lowest.
What we are witnessing is both unbundling and re-bundling of activities along the value chain. Examples of new ways of bundling goods and services are manufacturers without factories in industries such as clothing and sportswear (e.g. Nike) and electronics (e.g. Dell Computers and IBM). In heavier industries where fabrication remains a main source of competitiveness, services are added as a customisation tool. Manufacturers of machinery and equipment, for instance, reinvent themselves as system providers offering performance monitoring, maintenance and replacement of the machines that they sell or rent out (e.g. engines for aircraft, copy machines, coffee machines etc.). The services part of the system is typically the strategically most important, distinguishing the firm from its competitors, and the vehicle through which it engages with customers in contractual relationships.
There are also examples of services providers venturing into (or contracting out) manufacturing. Google and Microsoft have both entered the market for tablets; Amazon and Barnes & Noble have contracted out the development and production of their own e-readers and general retailers have developed and contracted out production of their own brands (so-called private labels or store-brands).
These developments have radically changed the way production is organised. Value chains sprawl across international borders as never before, unbundling and re-bundling activities in new ways. A host of services play an increasingly important role both in adding value to manufactured products and in coordinating global value chains. For this reason services trade restrictions as well as behind the border services sector regulation have caught the attention of manufacturers (Rentzog, 2010) and a revival of business interest in services trade negotiations.2 In addition, the bundling of goods and services changes the relation between suppliers and customers from arms-length market transactions to longer-term contracts, raising new issues concerning the relation between trade and competition policy.
This study contributes to shedding light on the role of services in international merchandise trade taking into account new ways of organising production. It analyses the relationships between the quality of the services which are likely to affect trade performance in sectors in which product differentiation is important. Two indicators of trade performance in manufactured products are considered: the degree of product differentiation as measured by the Grubel-Lloyd index of intra-industry trade and the duration of trade.
The rest of the study is organised as follows. Section two takes stock of recent literature and distils applied policy messages from it. The role of services in product differentiation takes centre stage in section three which presents analysis of the determinants of intra-industry trade. Branded products and specialised intermediate inputs tend to be provided on the basis of long-term contracts, which are likely to be more resilient to changes in market conditions and economic crises than standard plain vanilla products. Section four relates the resilience of bilateral trade flows to competitive and open 2 .See for instance BIAC’s statement to the 2012 OECD Ministerial.
http://www.biac.org/statements/high_level/BIAC_Statement_to_MCM_2012.pdf
2
services market. Section five draws the policy implications gleaned from the literature review and from our empirical findings and concludes.
Relations to previous research
There are two ways through which better services may improve the competitiveness of manufacturing in international trade. The first is through reduced costs, the second through making great products for which customers are willing to pay a premium. Efficient, reliable and reasonable transport, distribution, finance, utilities, telecommunications and business services are essential for cost effective production and marketing of goods. The competitiveness of transport and distribution also strongly affects to what extent reduced import prices following trade liberalisation in goods sectors pass through to the consumer. Indeed trade liberalisation may fatten the margins for transporters and distributors rather than resulting in lower consumer prices in the absence of sufficient competition in the transport and distribution sectors (Hummels et al., 2009; Francois and Wooton, 2010). In addition high transport costs inhibit entry into new markets and contribute to a higher rate of exit from new markets (Besedeš and Prusa, 2006a).
Supply chain management typically involves developing a set of pricing, delivery and payment processes – often contained in electronic supply chain management platforms. Such platforms reduce transaction costs and often also entry barriers for suppliers. Firms may for instance provide a single input to the value chain without the need to rely on a local resource base (Baldwin, 2011). Joining a value chain may be easier than building one, but a chain is only as strong as its weakest link and the firms joining must often satisfy stringent quality and reliability standards. Therefore, a host of business services have entered global value chains, among other things to help suppliers comply with such standards. In addition services help absorb shocks to the supply chain, for instance through tracking and shifting flows of inputs in the event of natural disasters, strikes or other disruptions. Finally services inputs contribute to higher market prices of the end product due to better design and better matching of supply and demand.
Another ICT-based source of improving cost effectiveness is the remote monitoring of industrial facilities, utilities and capital equipment. The cost of sensors and digital instruments has plummeted and they are increasingly installed in machinery and equipment allowing better capacity utilization and improved energy efficiency. According to a recent study by Evans and Annunziata (2012) of General Electric, linking sensors and instruments through what they call an industrial internet could reduce costs substantially in sectors currently producing about half of global GDP.
Studies from Sweden provide further evidence of the growing importance of services for manufacturing firms. Not only do services contribute to a higher share of intermediate inputs in manufacturing, they also account for a rising share of manufacturing firms’ revenue and are positively associated with exports (Lodefalk, 2012a and b). For instance a Swedish machine tool manufacturer uses 40 different services in order to uphold its delivery chain and it sells 15 different types of services to its customers (Rentzhog, 2010). Firm level analysis from the UK and Germany also find that services account for a significant share of manufacturers’ revenue, including export revenue (Breinlich and Criscuolo, 2011; Kelle and Kleinert, 2010).
The basic theory of intra-industry trade driven by product differentiation dates back to Krugman (1979). Intra-industry trade takes place when countries specialise in different brands or varieties of a particular good while importing brands and varieties from other countries. A country would for instance both export and import cars because consumers want to have a choice between several models and makes, while a country would usually either export or import sugar – not both, since consumers cannot tell the difference between sugar from different sources.3
3 .Recently commodities such as sugar have been branded not for the intrinsic quality or other features of the product, but for the way it is produced, e.g. in an environmentally friendly way, a socially responsible way or being fairly traded (www.fairtrade.net/sugar.html) or all of these www.wholesomesweeteners.com/brands/Wholesome_Sweeteners/Fair_Trade_Certified_Organic_Sugar.h
3
Early literature focussed on horizontal intra-industry trade, but with the proliferation of international production networks, vertical intra-industry trade has also expanded among countries at different levels of income, which trade parts and components rather than different varieties of final goods or services. Whether intra-industry trade is horizontal or vertical, a range of business services is needed to make such trade economical. For instance combining international supply chains with just-in-time organisation of production obviously requires effective and reliable transport and logistics services, but also technical testing, legal advice, ICT support and many other business services (Nordås et al., 2006).
Entering a differentiated product market and obtaining prices that cover both fixed and varibale cost, is, however, not the end of the story. In fact, most firms that enter new product lines or markets fail after the first three to five years.4 On the other hand, trade relationships that survive the first critical period tend to be more resilient and the probability of market exit decreases with the number of years of uninterrupted trade (Nitsch, 2009).
Various explanations have been put forward for the high hazard rate in international trade. Some are related to the nature of the products being traded, others to the size of and the cost of entering and operating in foreign markets. It is found that trade relationships in differentiated products tend to last longer (Besedeš and Prusa, 2006a; 2006b). Interestingly, initial purchases of such goods tend to be lower than for homogenous goods, suggesting that importers search for suitable suppliers, try them out and then invest in the relationship. Trade in parts and components have many of these characteristics and tend to be more resilient than trade in final goods (Arndt 2004; Obashi, 2010).5
Firms entering foreign markets typically incur entry costs that are duplicated in each market. Examples of such costs are compliance with country-specific standards and regulations; developing or joining distribution channels; and searching and processing information about new markets. The higher the entry barriers, the fewer exporters enter, as one would expect. But it also appears that the harder a market is to get into, the longer the trade relationship lasts after having survived the first hurdles of market entry. By the same token, lower entry barriers are associated with more entry and exit and shorter duration of trade (Eaton, Eslava et al. 2008). Exports to large markets tend to last longer, probably because fixed entry costs can be spread on larger sales volumes. Variable trade costs, notably transport costs, tend to increase the hazard rate (Besedeš and Prusa 2006a; 2006b). 6 An important insight from the analysis of hazard rates is the role that search costs play in establishing lasting trade relationships. One would expect that the proliferation of the internet reduces search costs and contributes to longer trade relationships, a hypothesis that is explored in this study.
Having established that services are important for manufacturing export performance, what are the features of the services markets that would contribute to more competitive manufacturing exports of e.g. branded products? There is scant analysis of this in the literature, but there is some evidence that countries that have open services markets tend to be more competitive in manufacturing (Francois and Wörz, 2008; Nordås, 2010); and services sector reform is associated with productivity gains in downstream manufacturing firms (Arnold et al. 2011).
Important policy messages emerging from recent literature are that goods and services complement each other and services often enhances the value of manufactured products. Services are provided as links in global value chains and trade barriers as well as behind the border regulatory burdens may
tml.4 .See Esteve-Pérez et al. (2007) and Fugazza and Molina (2009).5 .Obashi (2010) studied bilateral machinery trade at 6-digit HS level among nine East Asian countries
during the period 1993-2006.6 .Besedeš and Prusa (2006a; 2006b) found that differentiated and high-valued products have a longer
median duration, based on a search cost model applied to US imports. Besedeš (2008) showed the persistency of short and small valued relationships by applying Rauch and Watson (2003) search model.
4
spill over to other activities affecting the competitiveness of the entire supply chain. Therefore, impact assessment of new regulations, trade agreements or regulatory reform need to take into account regulatory spillovers along the value chain. Indeed, Egger et al. (2012) find that trade liberalisation in goods and services reinforce each other. Their estimations suggest that in the European Union simultaneous and coordinated internal liberalisation of goods and services markets raised welfare by 11% more than the sum of welfare effects from independent inception of goods and services internal market opening. Finally, the prominent role of telecommunications is highlighted. The bundling of goods and services involves an enormous amount of information processing – increasingly in real time – which requires access to reliable, fast, secure and cost-effective telecommunications networks.
Services and intra-industry trade in manufacturing
This section analyses the linkages between export competitiveness of manufacturing on the one hand, and services quality and services policy on the other. Ability to differentiate products from foreign competitors is used as measures of competitiveness in manufacturing. The objective of the analysis is to identify which services are critical to product differentiation in which sectors, at what income level; and how services trade policy and services market (de)regulation can help manufacturers move up the value chain into more differentiated products and products that fetch higher prices in the market.
Intra-industry trade is an indicator of product differentiation in international trade and is measured by the Grubel-Lloyd index (hereafter the GL-index). It takes values between 0 and 1 and is calculated as follows:
GList=1−|x ist−mist|x ist+mist (1)
The variables mist and x ist represent imports and exports to country i of good s at time t respectively.
In the case of one-way trade in good s the GL-index is zero, while if trade in good s is balanced the GL-index is unity. The GL-index is calculated at a Harmonized System (HS) 6-digit level. One may ask why not focus on exports rather than intra-industry trade? The reason is that exports by itself do not necessarily reflect competitiveness in the sense that a country hosts manufacturers that are able to support growing income levels, which may imply exporting higher margin, branded products. These features of trade are captured reasonably well by the GL-index of intra-industry trade. A couple of examples illustrate the point. India is a substantial net exporter of clothing, but does not engage much in branding and product differentiation – which is reflected in a GL-index of only 0.07 on average for the sector. France in contrast is a net importer of clothing, but exports mainly up-market branded products. Its GL-index in the sector is about 0.60. By the same token, the US and France are net importers of motor vehicles, while Romania and India are net exporters. Nevertheless, the US and France host the headquarters of major car manufacturers designing and developing their branded models. This is reflected in the GL-index which is on average 0.62 for France, 0.59 for the US, 0.38 for India and 0.37 for Romania.
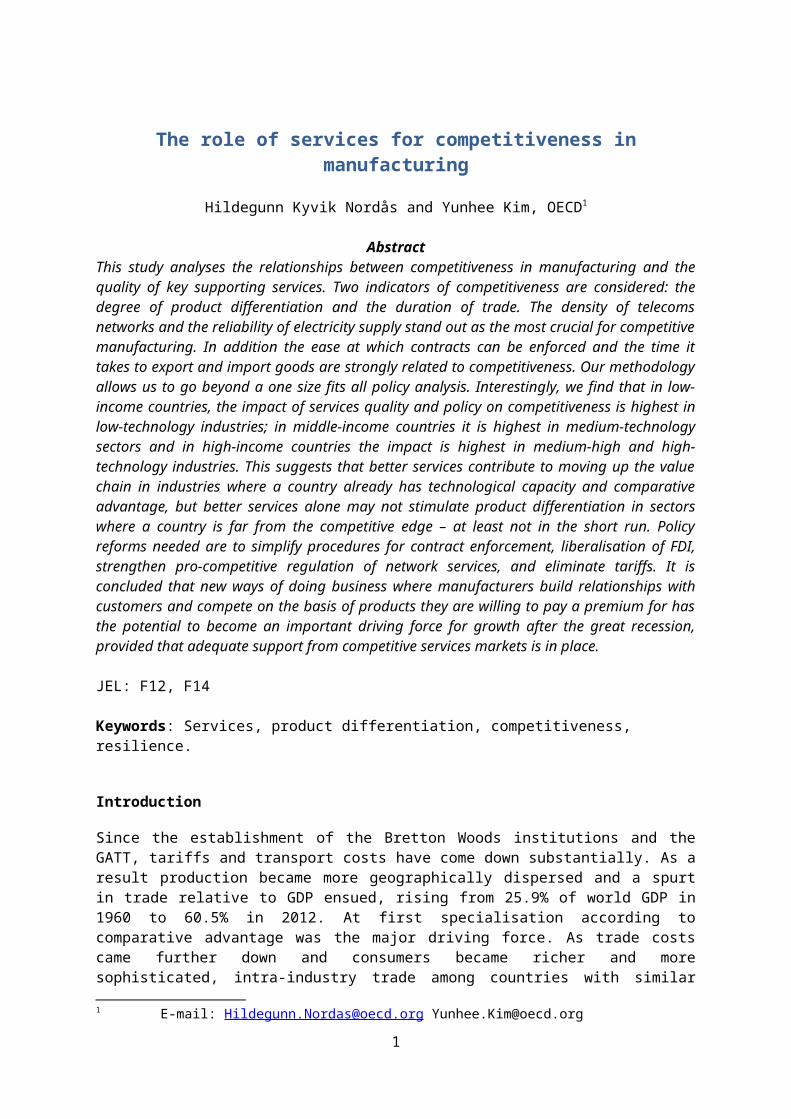
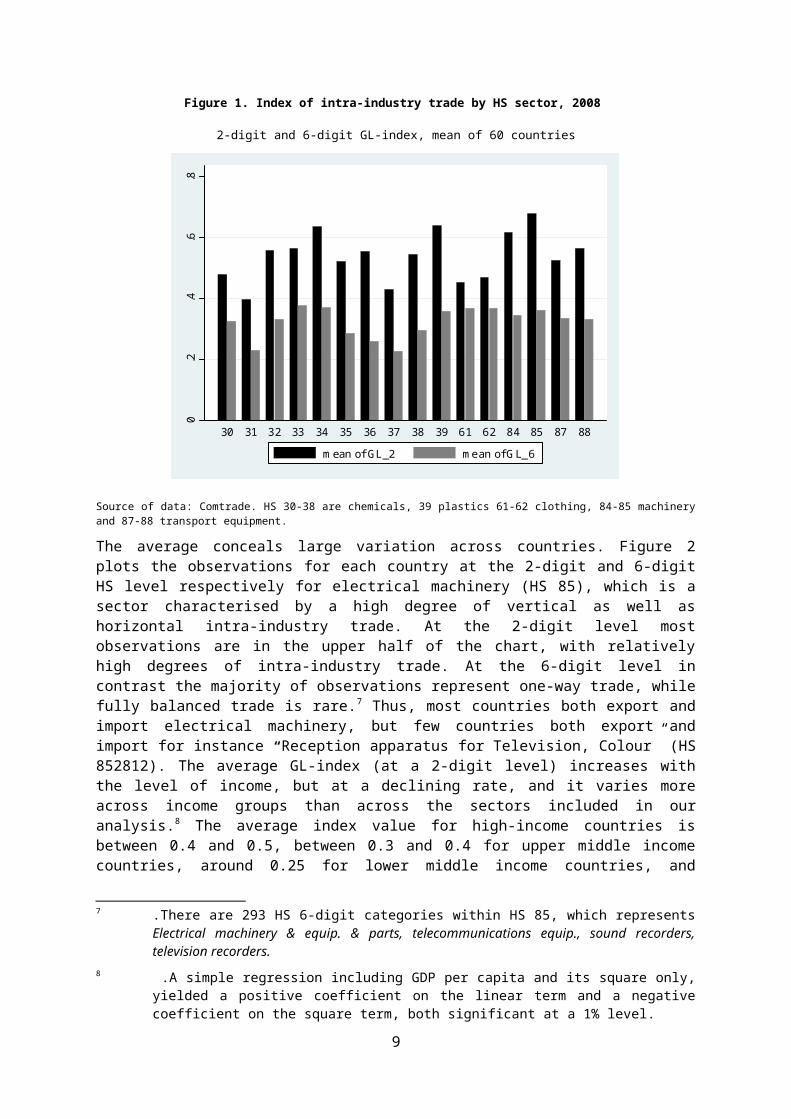
In the absence of information on trade in individual products, how should varieties of the same product be defined? We propose to use the six-digit Harmonised System level of aggregation, hereafter HS6. This is the most detailed level at which all countries classify goods in the same way. The GL-index strongly depends on the level of aggregation on which it is calculated as illustrated by Figure 1 which contrasts the GL-index at a HS 2-digit and HS 6-digit level. Interestingly, the difference between the two levels of aggregation is smallest for clothing which boasts one of the highest average rates of intra-industry trade at a 6-digit level.
5
Figure 1. Index of intra-industry trade by HS sector, 2008
2-digit and 6-digit GL-index, mean of 60 countries
0.2
.4.6
.8
30 31 32 33 34 35 36 37 38 39 61 62 84 85 87 88
mean of GL_2 mean of GL_6
Source of data: Comtrade. HS 30-38 are chemicals, 39 plastics 61-62 clothing, 84-85 machinery and 87-88 transport equipment.
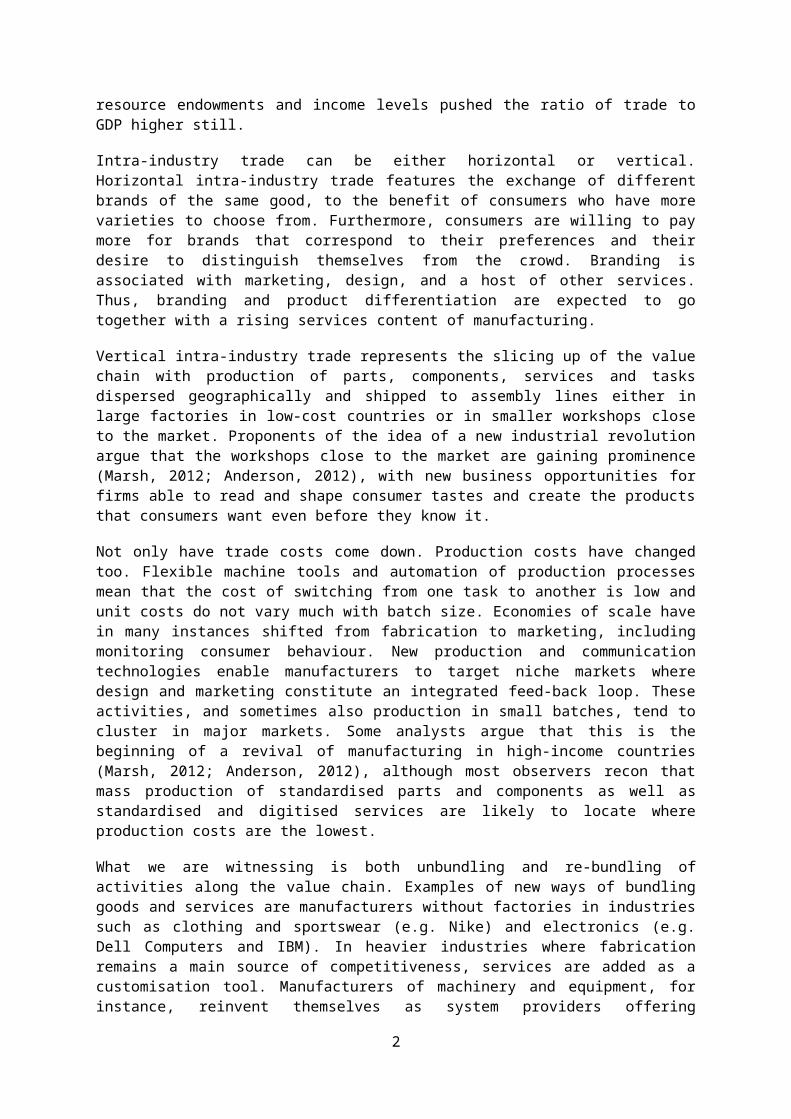
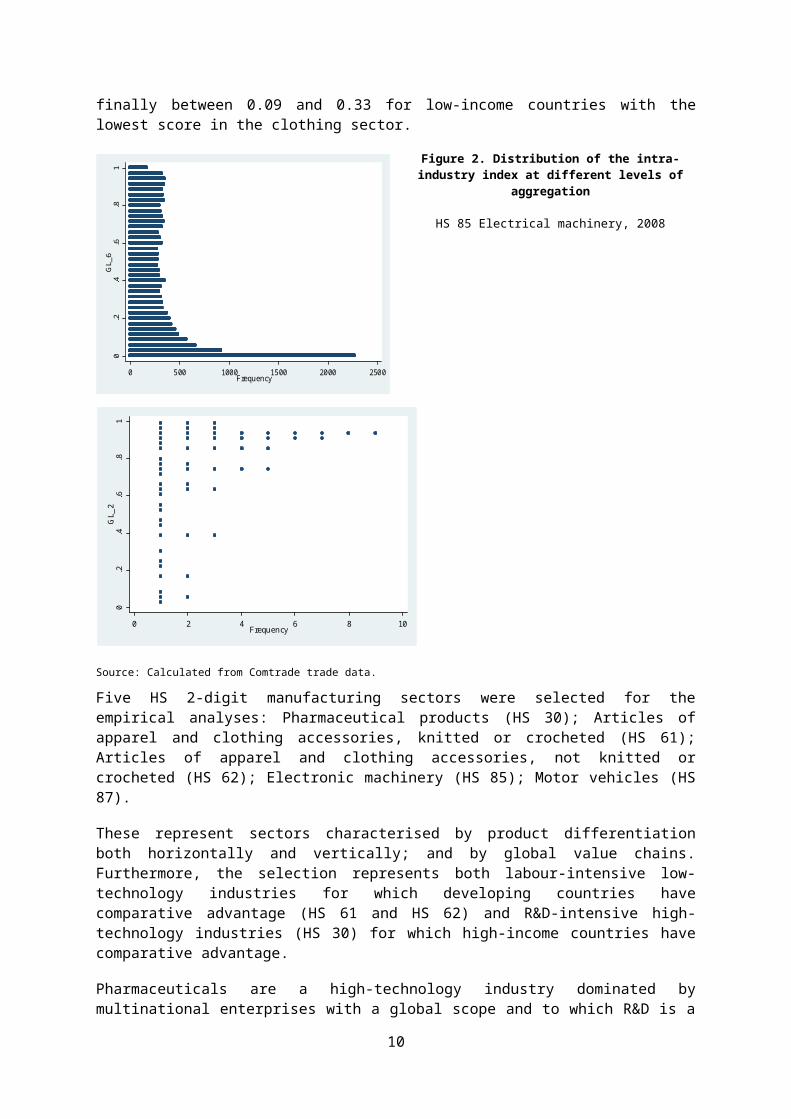
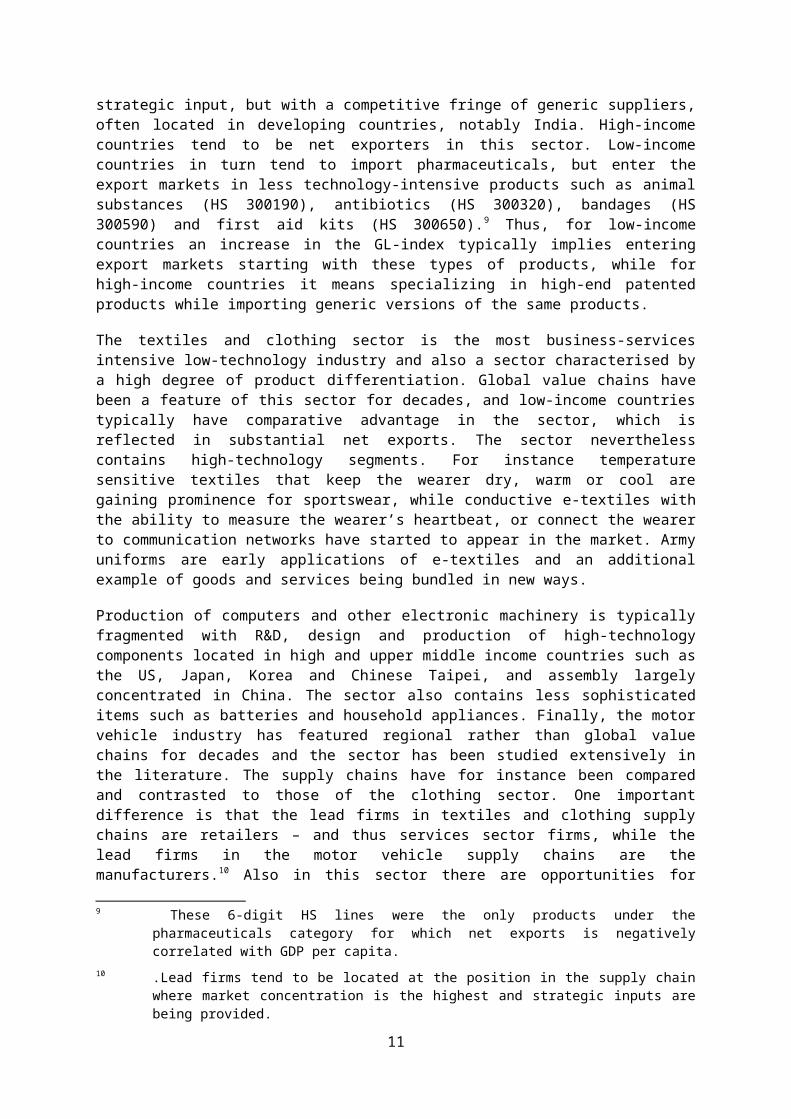
The average conceals large variation across countries. Figure 2 plots the observations for each country at the 2-digit and 6-digit HS level respectively for electrical machinery (HS 85), which is a sector characterised by a high degree of vertical as well as horizontal intra-industry trade. At the 2-digit level most observations are in the upper half of the chart, with relatively high degrees of intra-industry trade. At the 6-digit level in contrast the majority of observations represent one-way trade, while fully balanced trade is rare.7 Thus, most countries both export and import electrical machinery, but few countries both export and import for instance “Reception apparatus for Television, Colour” (HS 852812). The average GL-index (at a 2-digit level) increases with the level of income, but at a declining rate, and it varies more across income groups than across the sectors included in our analysis.8 The average index value for high-income countries is between 0.4 and 0.5, between 0.3 and 0.4 for upper middle income countries, around 0.25 for lower middle income countries, and finally between 0.09 and 0.33 for low-income countries with the lowest score in the clothing sector.
7 .There are 293 HS 6-digit categories within HS 85, which represents Electrical machinery & equip. & parts, telecommunications equip., sound recorders, television recorders.
8 .A simple regression including GDP per capita and its square only, yielded a positive coefficient on the linear term and a negative coefficient on the square term, both significant at a 1% level.
6
Figure 2. Distribution of the intra-industry index at different levels of aggregation
HS 85 Electrical machinery, 20080
.2.4
.6.8
1G
L_2
0 2 4 6 8 10Frequency
Source: Calculated from Comtrade trade data.
Five HS 2-digit manufacturing sectors were selected for the empirical analyses: Pharmaceutical products (HS 30); Articles of apparel and clothing accessories, knitted or crocheted (HS 61); Articles of apparel and clothing accessories, not knitted or crocheted (HS 62); Electronic machinery (HS 85); Motor vehicles (HS 87).
These represent sectors characterised by product differentiation both horizontally and vertically; and by global value chains. Furthermore, the selection represents both labour-intensive low-technology industries for which developing countries have comparative advantage (HS 61 and HS 62) and R&D-intensive high-technology industries (HS 30) for which high-income countries have comparative advantage.
Pharmaceuticals are a high-technology industry dominated by multinational enterprises with a global scope and to which R&D is a strategic input, but with a competitive fringe of generic suppliers, often located in developing countries, notably India. High-income countries tend to be net exporters in this sector. Low-income countries in turn tend to import pharmaceuticals, but enter the export markets in less technology-intensive products such as animal substances (HS 300190), antibiotics (HS 300320), bandages (HS 300590) and first aid kits (HS 300650).9 Thus, for low-income countries an increase in
9 These 6-digit HS lines were the only products under the pharmaceuticals category for which net exports is negatively correlated with GDP per capita.
7
0.2
.4.6
.81
GL_
6
0 500 1000 1500 2000 2500Frequency
the GL-index typically implies entering export markets starting with these types of products, while for high-income countries it means specializing in high-end patented products while importing generic versions of the same products.
The textiles and clothing sector is the most business-services intensive low-technology industry and also a sector characterised by a high degree of product differentiation. Global value chains have been a feature of this sector for decades, and low-income countries typically have comparative advantage in the sector, which is reflected in substantial net exports. The sector nevertheless contains high-technology segments. For instance temperature sensitive textiles that keep the wearer dry, warm or cool are gaining prominence for sportswear, while conductive e-textiles with the ability to measure the wearer’s heartbeat, or connect the wearer to communication networks have started to appear in the market. Army uniforms are early applications of e-textiles and an additional example of goods and services being bundled in new ways.
Production of computers and other electronic machinery is typically fragmented with R&D, design and production of high-technology components located in high and upper middle income countries such as the US, Japan, Korea and Chinese Taipei, and assembly largely concentrated in China. The sector also contains less sophisticated items such as batteries and household appliances. Finally, the motor vehicle industry has featured regional rather than global value chains for decades and the sector has been studied extensively in the literature. The supply chains have for instance been compared and contrasted to those of the clothing sector. One important difference is that the lead firms in textiles and clothing supply chains are retailers – and thus services sector firms, while the lead firms in the motor vehicle supply chains are the manufacturers.10 Also in this sector there are opportunities for firms in low-income countries to enter global value chains for instance through processing trade.
The services quality and policy indices included in the empirical analysis are presented in Annex Table A1, which lists the variables, the source of information, the sample mean, standard deviation, minimum and maximum values. They relate to the quality or performance of key services sectors such as transport, finance, telecommunications and electricity, which are recorded as intermediate inputs. It would be desirable to include business services in the analysis as well, but unfortunately quality indicators are not readily available for this sector. Since product differentiation depends on services inputs, we expect services quality to be positively associated with the GL-index. Our sample contains 60 countries (see list in Annex Table A2).
Trade is driven by product differentiation as well as comparative advantage. Comparative advantage in turn is determined by resource/asset endowments, technology and size and composition of domestic demand. The impact of improved services quality and services policy reforms on the GL-index may therefore depend on which driving force is the most important in the country and sector in question. To explore this possibility we investigate to what extent the elasticity of the services indicator in question vary with the level of development as measured by GDP per capita. Among the six sectors included in the analysis, net exports tend to rise with GDP per capita in pharmaceuticals, decline with GDP per capita in the two clothing sectors and net exports are unrelated to GDP per capita in the electronics and motor vehicle sectors, which encompass low-technology, labour-intensive segments as well as high-technology, skills-intensive segments.11 A rise in the intra-industry index for pharmaceuticals in rich countries and clothing in poor countries therefore implies faster growth in imports than in exports. The dynamics behind this is that specialising in a narrower range of branded goods for the global market leaves space for imports in the market segments vacated by local firms. Furthermore OECD work on global value chains shows that competitiveness at one link in the value chain often rests on the ability to add value to imported parts and components, not least through high-
10 .Lead firms tend to be located at the position in the supply chain where market concentration is the highest and strategic inputs are being provided.
11 A pair-wise correlation between net exports and GDP per capita produced statistically significant coefficients at 1% level for clothing and pharmaceuticals, but statistically insignificant coefficients for electronics and motor vehicles.
8
quality services inputs that eventually become embodied in exports.12 We supplement the GL regressions with analysis of the relationship between the services indicators and exports to shed light on whether comparative advantage or product differentiation is the main driving force.13
Some of the services quality measures are correlated with GDP per capita, which could make it difficult to distinguish the effects of higher income from those of better services. Furthermore, some of the policy and quality indicators are correlated with each other. For instance countries with high tariffs also tend to restrict foreign direct investment, and, as one would expect, policy variables are correlated with performance in the sector to which they apply (a correlation matrix is provided in Annex Table A3).
The relation between intra-industry trade in manufacturing and the quality of key services is explored using the following regression equation:
GList=α o+α1 lngdp¿+α 2lngdpcap¿+α 3 S¿+α 4 lngdpcap¿∗S¿+εist (2)
The left-hand side variable is an indicator that can take values between 0 and 1 and the appropriate regression to make sure that predicted values also fall within this range is the generalised linear model (glm) using the probit link and binomial distribution. The control variables are the log of GDP and the log of GDP per capita, and the explanatory variable of interest is the services indicator and the interaction term between services and GDP per capita. The regressions are run using robust standard errors. We perform the analysis for each 2-digit HS category separately, using observations at the HS6 level.
The data covers the period 1998-20011. The GL-index is somewhat volatile over short intervals. We therefore use the average values of all variables over three periods (1998-2003, 2003-2008 and 2008-2011). Dummy variables (denoted p2 and p3) indicate period fixed effects.
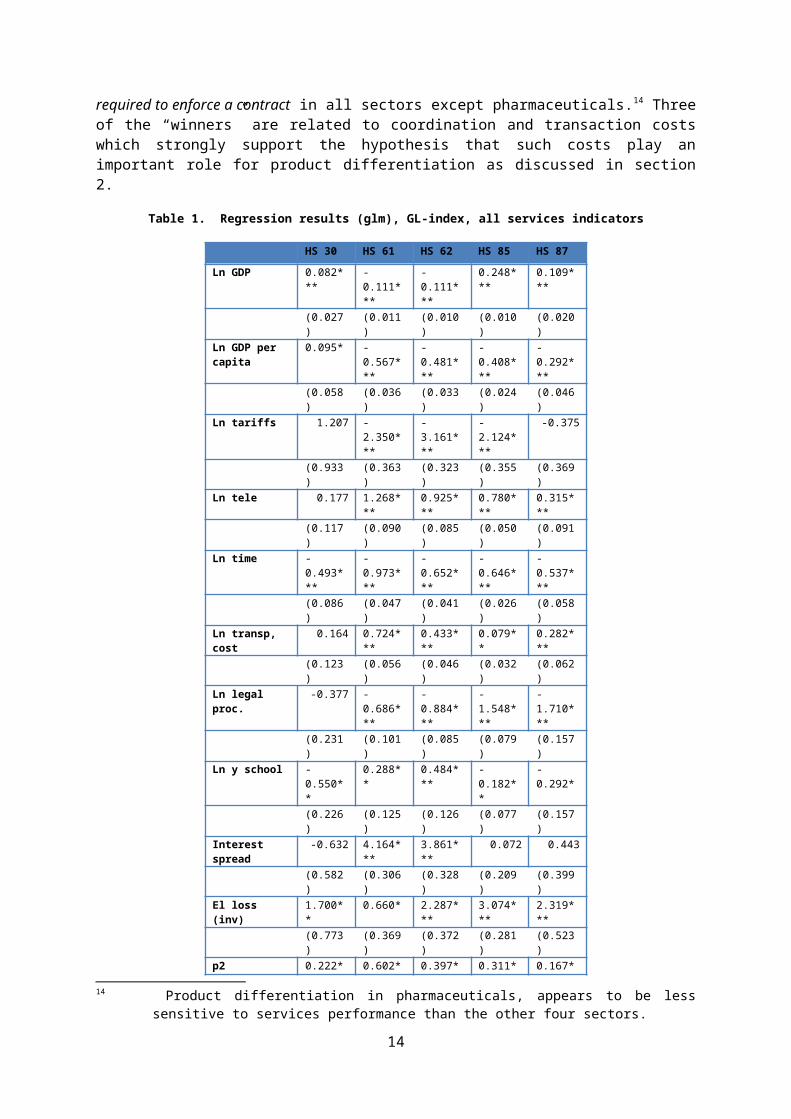
Our first exercise is to include all services quality variables listed in Annex Table A1 in one regression and explore which variables give the most precise estimates and have the strongest explanatory power. This “race” among the services indicators is won by time for exports and imports and reliable electricity supply which are strongly associated with product differentiation in all sectors. Equally robust are telephone and internet density and the number of legal procedures required to enforce a contract in all sectors except pharmaceuticals.14 Three of the “winners” are related to coordination and transaction costs which strongly support the hypothesis that such costs play an important role for product differentiation as discussed in section 2.
Table 1. Regression results (glm), GL-index, all services indicators
HS 30 HS 61 HS 62 HS 85 HS 87Ln GDP 0.082*** -0.111*** -0.111*** 0.248*** 0.109***
(0.027) (0.011) (0.010) (0.010) (0.020)
Ln GDP per capita
0.095* -0.567*** -0.481*** -0.408*** -0.292***
(0.058) (0.036) (0.033) (0.024) (0.046)Ln tariffs 1.207 -2.350*** -3.161*** -2.124*** -0.375
(0.933) (0.363) (0.323) (0.355) (0.369)Ln tele 0.177 1.268*** 0.925*** 0.780*** 0.315***
(0.117) (0.090) (0.085) (0.050) (0.091)
12 See for instance http://www.oecd.org/sti/ind/tiva-policy-implications.pdf13 In the interest of space these regressions are not reported. They are available from the authors upon
request.14 Product differentiation in pharmaceuticals, appears to be less sensitive to services performance than
the other four sectors.
9
Ln time -0.493*** -0.973*** -0.652*** -0.646*** -0.537***(0.086) (0.047) (0.041) (0.026) (0.058)
Ln transp, cost 0.164 0.724*** 0.433*** 0.079** 0.282***(0.123) (0.056) (0.046) (0.032) (0.062)
Ln legal proc. -0.377 -0.686*** -0.884*** -1.548*** -1.710***(0.231) (0.101) (0.085) (0.079) (0.157)
Ln y school -0.550** 0.288** 0.484*** -0.182** -0.292*(0.226) (0.125) (0.126) (0.077) (0.157)
Interest spread -0.632 4.164*** 3.861*** 0.072 0.443(0.582) (0.306) (0.328) (0.209) (0.399)
El loss (inv) 1.700** 0.660* 2.287*** 3.074*** 2.319***(0.773) (0.369) (0.372) (0.281) (0.523)
p2 0.222*** 0.602*** 0.397*** 0.311*** 0.167***(0.057) (0.037) (0.032) (0.021) (0.039)
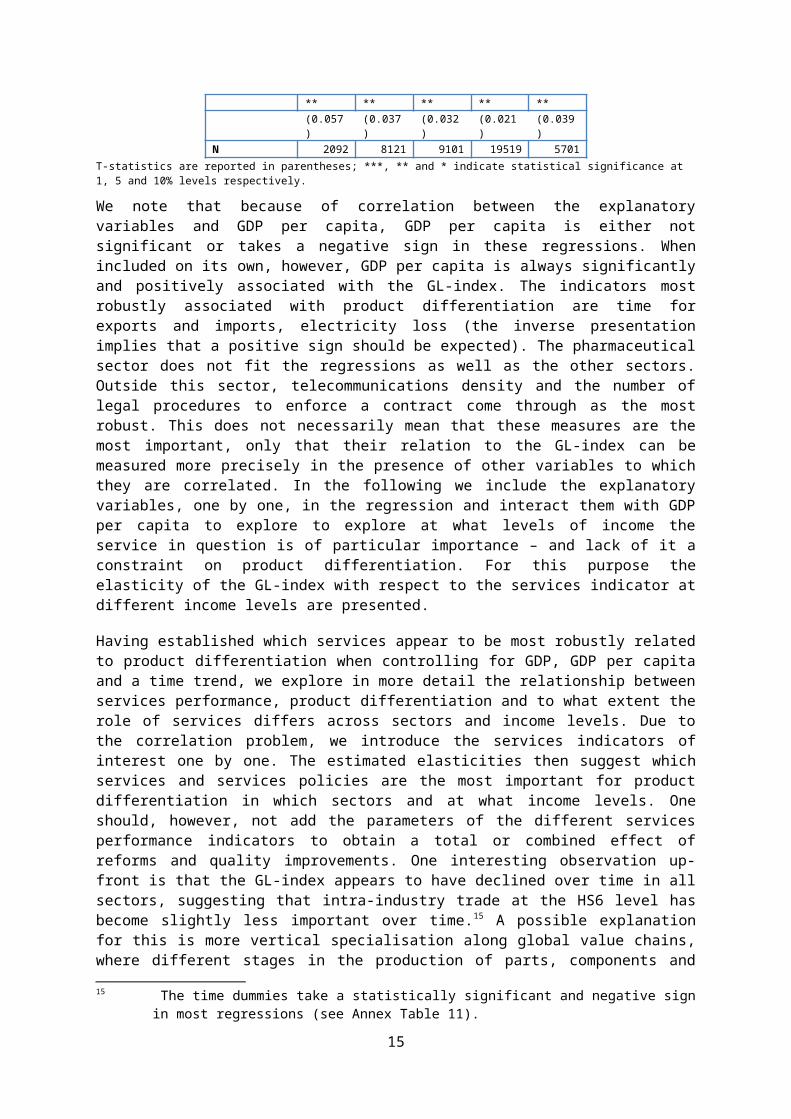
N 2092 8121 9101 19519 5701T-statistics are reported in parentheses; ***, ** and * indicate statistical significance at 1, 5 and 10% levels respectively.
We note that because of correlation between the explanatory variables and GDP per capita, GDP per capita is either not significant or takes a negative sign in these regressions. When included on its own, however, GDP per capita is always significantly and positively associated with the GL-index. The indicators most robustly associated with product differentiation are time for exports and imports, electricity loss (the inverse presentation implies that a positive sign should be expected). The pharmaceutical sector does not fit the regressions as well as the other sectors. Outside this sector, telecommunications density and the number of legal procedures to enforce a contract come through as the most robust. This does not necessarily mean that these measures are the most important, only that their relation to the GL-index can be measured more precisely in the presence of other variables to which they are correlated. In the following we include the explanatory variables, one by one, in the regression and interact them with GDP per capita to explore to explore at what levels of income the service in question is of particular importance – and lack of it a constraint on product differentiation. For this purpose the elasticity of the GL-index with respect to the services indicator at different income levels are presented.
Having established which services appear to be most robustly related to product differentiation when controlling for GDP, GDP per capita and a time trend, we explore in more detail the relationship between services performance, product differentiation and to what extent the role of services differs across sectors and income levels. Due to the correlation problem, we introduce the services indicators of interest one by one. The estimated elasticities then suggest which services and services policies are the most important for product differentiation in which sectors and at what income levels. One should, however, not add the parameters of the different services performance indicators to obtain a total or combined effect of reforms and quality improvements. One interesting observation up-front is that the GL-index appears to have declined over time in all sectors, suggesting that intra-industry trade at the HS6 level has become slightly less important over time.15 A possible explanation for this is more vertical specialisation along global value chains, where different stages in the production of parts, components and tasks fall under different HS6 categories. Another general observation is that the estimated elasticities are highest in low-income countries in low-technology sectors, middle-income countries in medium technology sectors and in high-income countries in medium-high and high-technology sectors. This finding suggests that improved services quality is particularly important for moving up the value chain in sectors for which the country already has established industrial capacity and possibly comparative advantage. We now turn to a discussion of the main findings related to each services indicator.
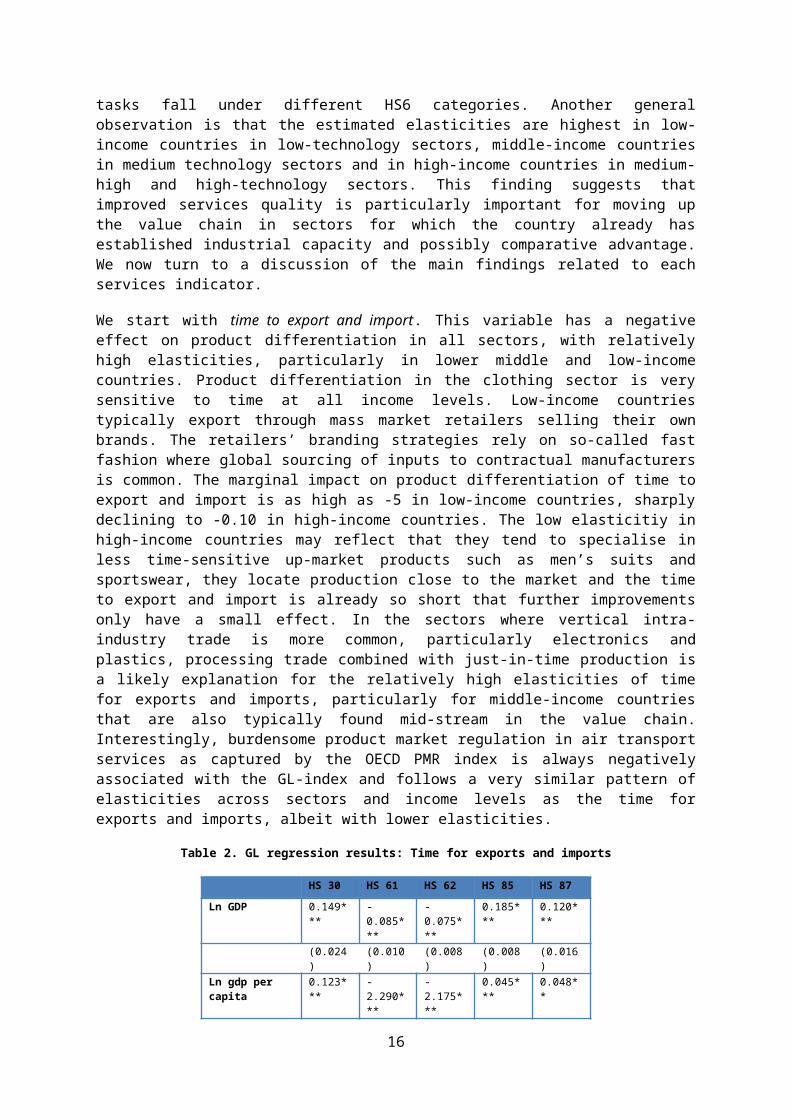
We start with time to export and import. This variable has a negative effect on product differentiation in all sectors, with relatively high elasticities, particularly in lower middle and low-income countries.
15 The time dummies take a statistically significant and negative sign in most regressions (see Annex Table 11).
10
Product differentiation in the clothing sector is very sensitive to time at all income levels. Low-income countries typically export through mass market retailers selling their own brands. The retailers’ branding strategies rely on so-called fast fashion where global sourcing of inputs to contractual manufacturers is common. The marginal impact on product differentiation of time to export and import is as high as -5 in low-income countries, sharply declining to -0.10 in high-income countries. The low elasticitiy in high-income countries may reflect that they tend to specialise in less time-sensitive up-market products such as men’s suits and sportswear, they locate production close to the market and the time to export and import is already so short that further improvements only have a small effect. In the sectors where vertical intra-industry trade is more common, particularly electronics and plastics, processing trade combined with just-in-time production is a likely explanation for the relatively high elasticities of time for exports and imports, particularly for middle-income countries that are also typically found mid-stream in the value chain. Interestingly, burdensome product market regulation in air transport services as captured by the OECD PMR index is always negatively associated with the GL-index and follows a very similar pattern of elasticities across sectors and income levels as the time for exports and imports, albeit with lower elasticities.
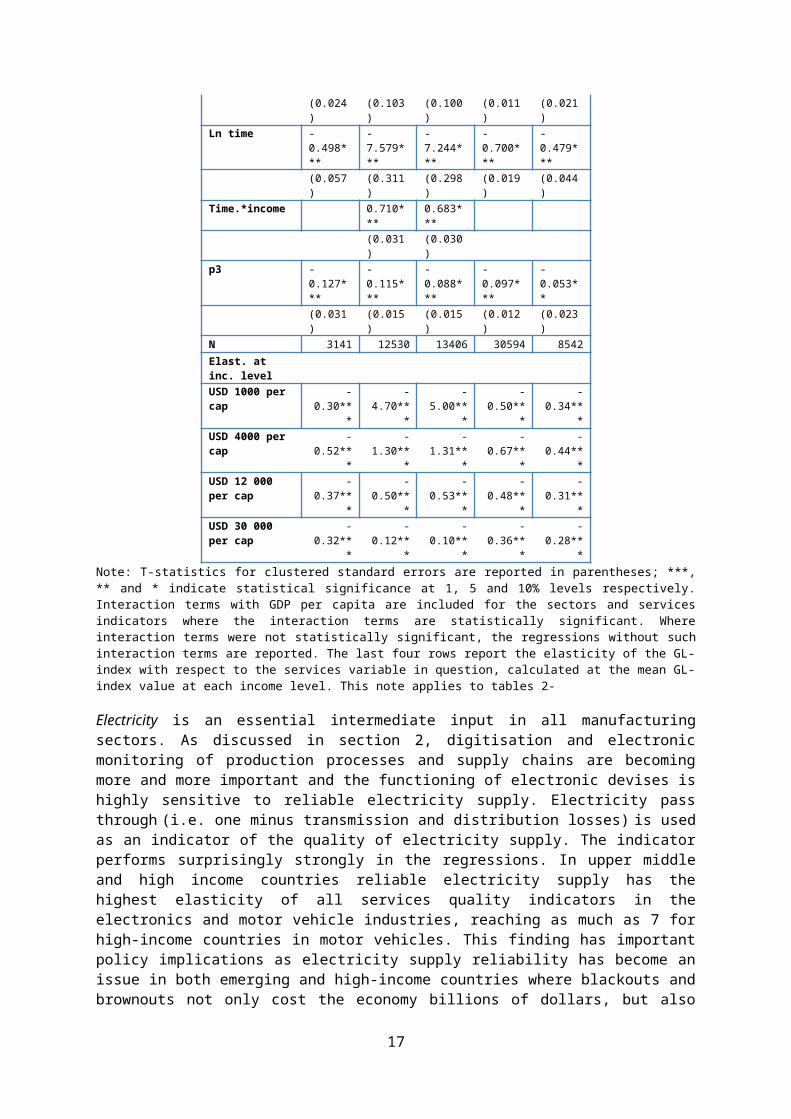
Table 2. GL regression results: Time for exports and imports
HS 30 HS 61 HS 62 HS 85 HS 87Ln GDP 0.149*** -0.085*** -0.075*** 0.185*** 0.120***
(0.024) (0.010) (0.008) (0.008) (0.016)Ln gdp per capita 0.123*** -2.290*** -2.175*** 0.045*** 0.048**
(0.024) (0.103) (0.100) (0.011) (0.021)Ln time -0.498*** -7.579*** -7.244*** -0.700*** -0.479***
(0.057) (0.311) (0.298) (0.019) (0.044)Time.*income 0.710*** 0.683***
(0.031) (0.030)p3 -0.127*** -0.115*** -0.088*** -0.097*** -0.053**
(0.031) (0.015) (0.015) (0.012) (0.023)N 3141 12530 13406 30594 8542
Elast. at inc. levelUSD 1000 per cap -0.30*** -4.70*** -5.00*** -0.50*** -0.34***
USD 4000 per cap -0.52*** -1.30*** -1.31*** -0.67*** -0.44***USD 12 000 per cap
-0.37*** -0.50*** -0.53*** -0.48*** -0.31***
USD 30 000 per cap
-0.32*** -0.12*** -0.10*** -0.36*** -0.28***
Note: T-statistics for clustered standard errors are reported in parentheses; ***, ** and * indicate statistical significance at 1, 5 and 10% levels respectively. Interaction terms with GDP per capita are included for the sectors and services indicators where the interaction terms are statistically significant. Where interaction terms were not statistically significant, the regressions without such interaction terms are reported. The last four rows report the elasticity of the GL-index with respect to the services variable in question, calculated at the mean GL-index value at each income level. This note applies to tables 2-
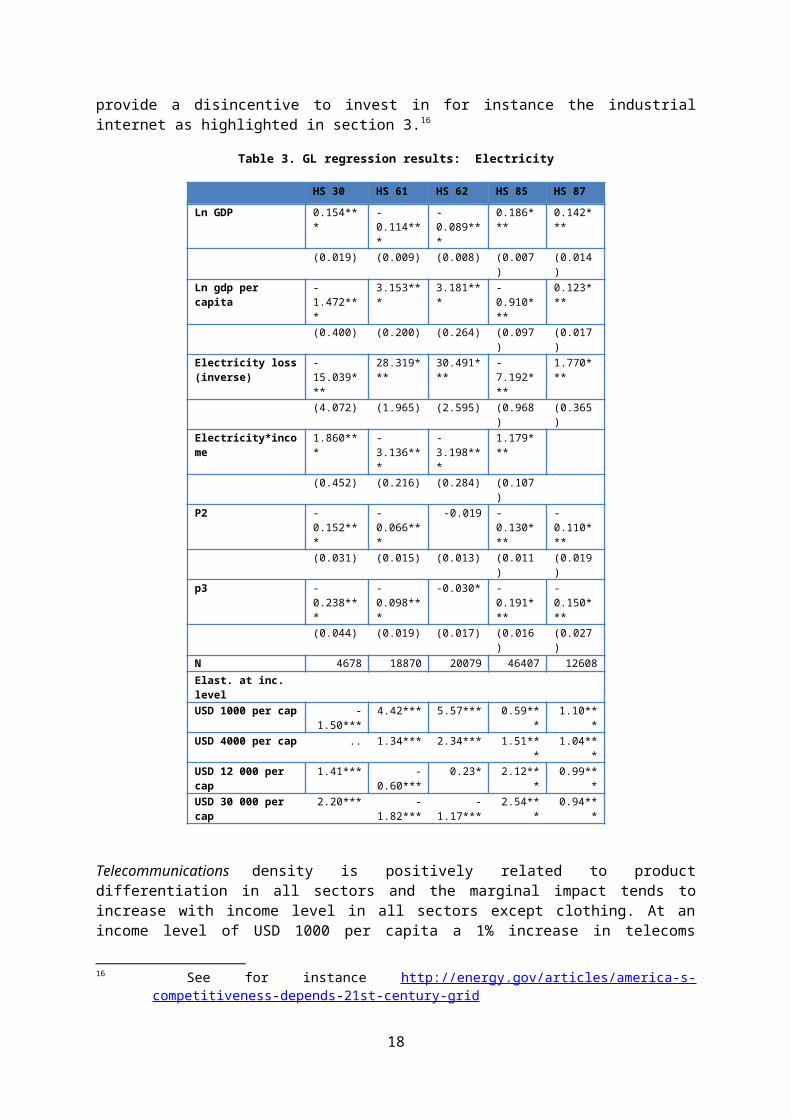
Electricity is an essential intermediate input in all manufacturing sectors. As discussed in section 2, digitisation and electronic monitoring of production processes and supply chains are becoming more and more important and the functioning of electronic devises is highly sensitive to reliable electricity supply. Electricity pass through (i.e. one minus transmission and distribution losses) is used as an indicator of the quality of electricity supply. The indicator performs surprisingly strongly in the regressions. In upper middle and high income countries reliable electricity supply has the highest elasticity of all services quality indicators in the electronics and motor vehicle industries, reaching as much as 7 for high-income countries in motor vehicles. This finding has important policy implications as electricity supply reliability has become an issue in both emerging and high-income countries where blackouts and brownouts not only cost the economy billions of dollars, but also provide a disincentive to invest in for instance the industrial internet as highlighted in section 3.16
16 See for instance http://energy.gov/articles/america-s-competitiveness-depends-21st-century-grid
11
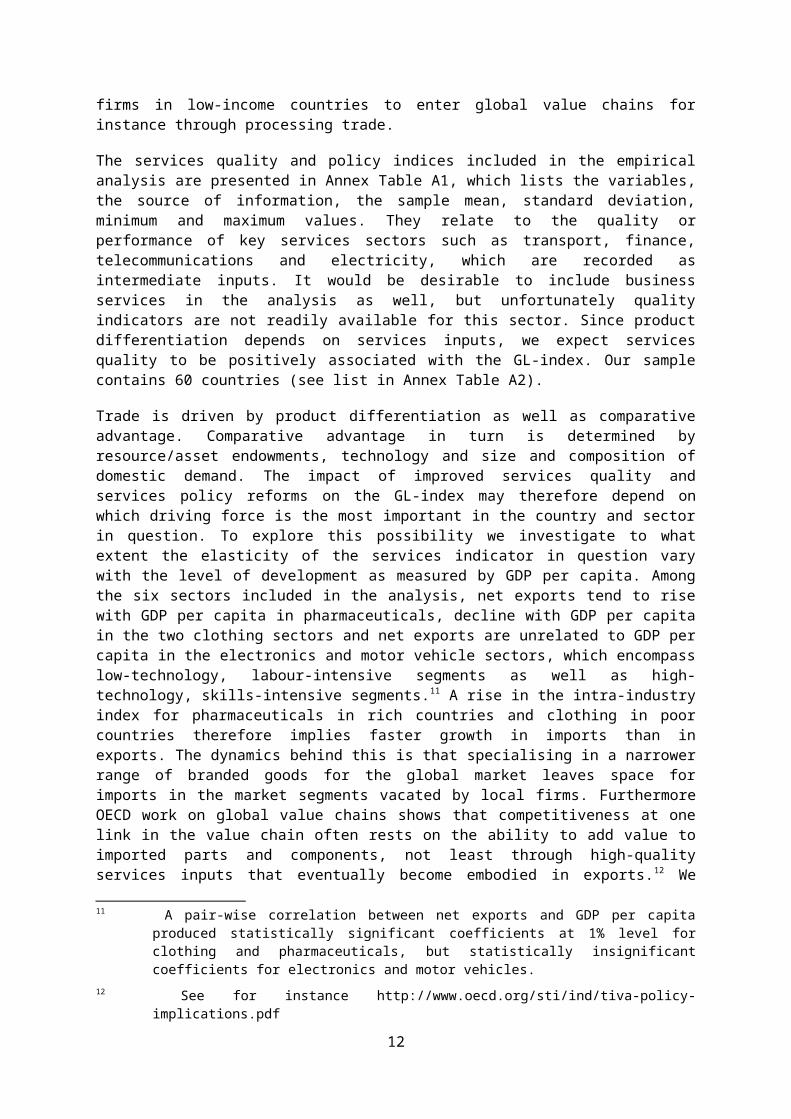
Table 3. GL regression results: Electricity
HS 30 HS 61 HS 62 HS 85 HS 87Ln GDP 0.154*** -0.114*** -0.089*** 0.186*** 0.142***
(0.019) (0.009) (0.008) (0.007) (0.014)
Ln gdp per capita -1.472*** 3.153*** 3.181*** -0.910*** 0.123***(0.400) (0.200) (0.264) (0.097) (0.017)
Electricity loss (inverse) -15.039***
28.319***
30.491***
-7.192*** 1.770***
(4.072) (1.965) (2.595) (0.968) (0.365)Electricity*income 1.860*** -3.136*** -3.198*** 1.179***
(0.452) (0.216) (0.284) (0.107)P2 -0.152*** -0.066*** -0.019 -0.130*** -0.110***
(0.031) (0.015) (0.013) (0.011) (0.019)p3 -0.238*** -0.098*** -0.030* -0.191*** -0.150***
(0.044) (0.019) (0.017) (0.016) (0.027)N 4678 18870 20079 46407 12608
Elast. at inc. levelUSD 1000 per cap -1.50*** 4.42*** 5.57*** 0.59*** 1.10***
USD 4000 per cap .. 1.34*** 2.34*** 1.51*** 1.04***USD 12 000 per cap 1.41*** -0.60*** 0.23* 2.12*** 0.99***
USD 30 000 per cap 2.20*** -1.82*** -1.17*** 2.54*** 0.94***
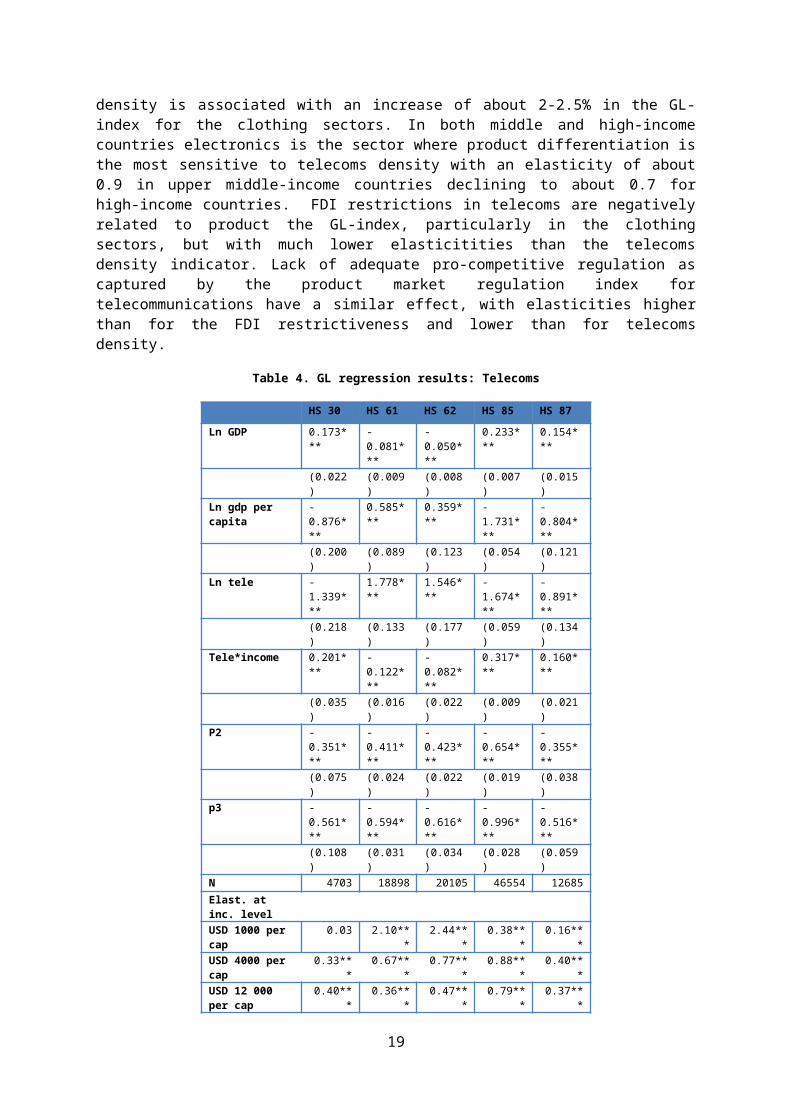
Telecommunications density is positively related to product differentiation in all sectors and the marginal impact tends to increase with income level in all sectors except clothing. At an income level of USD 1000 per capita a 1% increase in telecoms density is associated with an increase of about 2-2.5% in the GL-index for the clothing sectors. In both middle and high-income countries electronics is the sector where product differentiation is the most sensitive to telecoms density with an elasticity of about 0.9 in upper middle-income countries declining to about 0.7 for high-income countries. FDI restrictions in telecoms are negatively related to product the GL-index, particularly in the clothing sectors, but with much lower elasticitities than the telecoms density indicator. Lack of adequate pro-competitive regulation as captured by the product market regulation index for telecommunications have a similar effect, with elasticities higher than for the FDI restrictiveness and lower than for telecoms density.
Table 4. GL regression results: Telecoms
HS 30 HS 61 HS 62 HS 85 HS 87Ln GDP 0.173*** -0.081*** -0.050*** 0.233*** 0.154***
(0.022) (0.009) (0.008) (0.007) (0.015)Ln gdp per capita -0.876*** 0.585*** 0.359*** -1.731*** -0.804***
(0.200) (0.089) (0.123) (0.054) (0.121)Ln tele -1.339*** 1.778*** 1.546*** -1.674*** -0.891***
(0.218) (0.133) (0.177) (0.059) (0.134)Tele*income 0.201*** -0.122*** -0.082*** 0.317*** 0.160***
(0.035) (0.016) (0.022) (0.009) (0.021)P2 -0.351*** -0.411*** -0.423*** -0.654*** -0.355***
(0.075) (0.024) (0.022) (0.019) (0.038)p3 -0.561*** -0.594*** -0.616*** -0.996*** -0.516***
(0.108) (0.031) (0.034) (0.028) (0.059)N 4703 18898 20105 46554 12685
Elast. at inc. levelUSD 1000 per cap 0.03 2.10*** 2.44*** 0.38*** 0.16***
12
USD 4000 per cap 0.33*** 0.67*** 0.77*** 0.88*** 0.40***USD 12 000 per cap
0.40*** 0.36*** 0.47*** 0.79*** 0.37***
USD 30 000 per cap
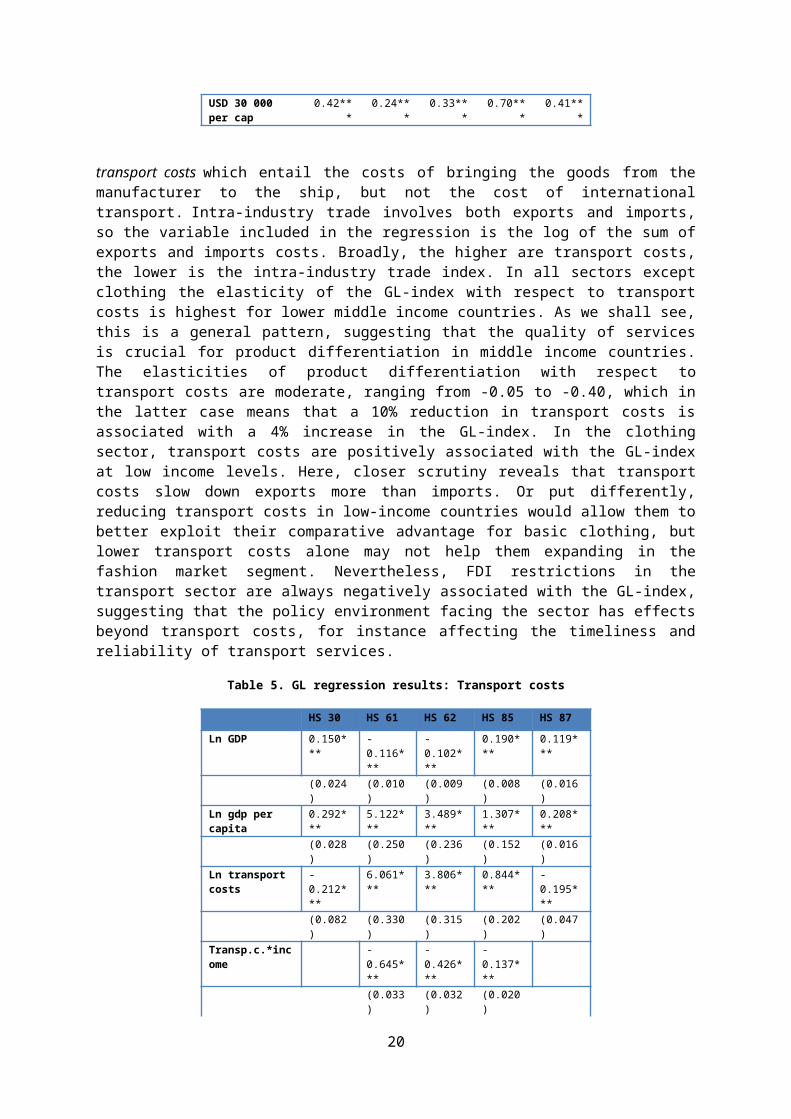
0.42*** 0.24*** 0.33*** 0.70*** 0.41***
transport costs which entail the costs of bringing the goods from the manufacturer to the ship, but not the cost of international transport. Intra-industry trade involves both exports and imports, so the variable included in the regression is the log of the sum of exports and imports costs. Broadly, the higher are transport costs, the lower is the intra-industry trade index. In all sectors except clothing the elasticity of the GL-index with respect to transport costs is highest for lower middle income countries. As we shall see, this is a general pattern, suggesting that the quality of services is crucial for product differentiation in middle income countries. The elasticities of product differentiation with respect to transport costs are moderate, ranging from -0.05 to -0.40, which in the latter case means that a 10% reduction in transport costs is associated with a 4% increase in the GL-index. In the clothing sector, transport costs are positively associated with the GL-index at low income levels. Here, closer scrutiny reveals that transport costs slow down exports more than imports. Or put differently, reducing transport costs in low-income countries would allow them to better exploit their comparative advantage for basic clothing, but lower transport costs alone may not help them expanding in the fashion market segment. Nevertheless, FDI restrictions in the transport sector are always negatively associated with the GL-index, suggesting that the policy environment facing the sector has effects beyond transport costs, for instance affecting the timeliness and reliability of transport services.
Table 5. GL regression results: Transport costs
HS 30 HS 61 HS 62 HS 85 HS 87Ln GDP 0.150*** -0.116*** -0.102*** 0.190*** 0.119***
(0.024) (0.010) (0.009) (0.008) (0.016)
Ln gdp per capita 0.292*** 5.122*** 3.489*** 1.307*** 0.208***(0.028) (0.250) (0.236) (0.152) (0.016)
Ln transport costs -0.212*** 6.061*** 3.806*** 0.844*** -0.195***(0.082) (0.330) (0.315) (0.202) (0.047)
Transp.c.*income -0.645*** -0.426*** -0.137***(0.033) (0.032) (0.020)
p3 -0.096*** 0.001 0.028* -0.039*** -0.027(0.034) (0.014) (0.015) (0.012) (0.021)
N 3141 12530 13406 30594 8542Elast. at inc. levelUSD 1000 per cap -0.12*** 3.4*** 2.00*** -0.09** -0.09***USD 4000 per cap -0.19*** 0.74*** 0.35*** -0.25*** -0.012***
USD 12 000 per cap
-0.16*** 0.12*** -0.05*** -0.27*** -0.09***
USD 30 000 per cap
-0.13*** -0.20*** -0.22*** -0.27*** -0.08***
The competitiveness of the banking sector is measured by the interest spread between deposits and loans. Interest spread is given in percentage points and is not logged. Form this measure it appears, surprisingly, that finance is not a binding constraint for product differentiation in any of the sectors included in the analysis. However, we notice that the elasticity of the GL-index with respect to FDI restrictions in financial services is much higher than the elasticity on interest rate spreads, suggesting that the policy environment surrounding the financial sector is important.
Table 6. GL Regression results: Interest rate spread
HS 30 HS 61 HS 62 HS 85 HS 87
13
Ln GDP 0.119*** -0.219*** -0.170***
0.153*** 0.089***
(0.020) (0.011) (0.010) (0.007) (0.016)Ln gdp per capita 0.184*** 0.335*** 0.340*** 0.218*** 0.100***
(0.043) (0.014) (0.014) (0.010) (0.020)Interest rate spread -
13.159***-10.378*** -
6.438***-1.988*** -9.037***
(5.060) (1.928) (1.650) (0.164) (2.735)
Int. rate spr.* income
1.366** 1.451*** 0.883*** 0.986***
(0.607) (0.231) (0.195) (0.325)P2 -0.178*** -0.100*** -
0.099***-0.159*** -0.144***
(0.041) (0.017) (0.015) (0.011) (0.022)
p3 -0.354*** -0.231*** -0.201***
-0.243*** -0.209***
(0.049) (0.022) (0.021) (0.018) (0.035)N 3625 14762 15623 36275 9772
Elast. at inc. levelUSD 1000 per cap -0.17*** .. .. -0.06*** -0.09***
USD 4000 per cap -0.07*** 0.06*** 0.03*** -0.08*** -0.03***USD 12 000 per cap .. 0.10*** 0.06*** -0.09*** ..
USD 30 000 per cap .. 0.11*** 0.07*** -0.09*** 0.04*
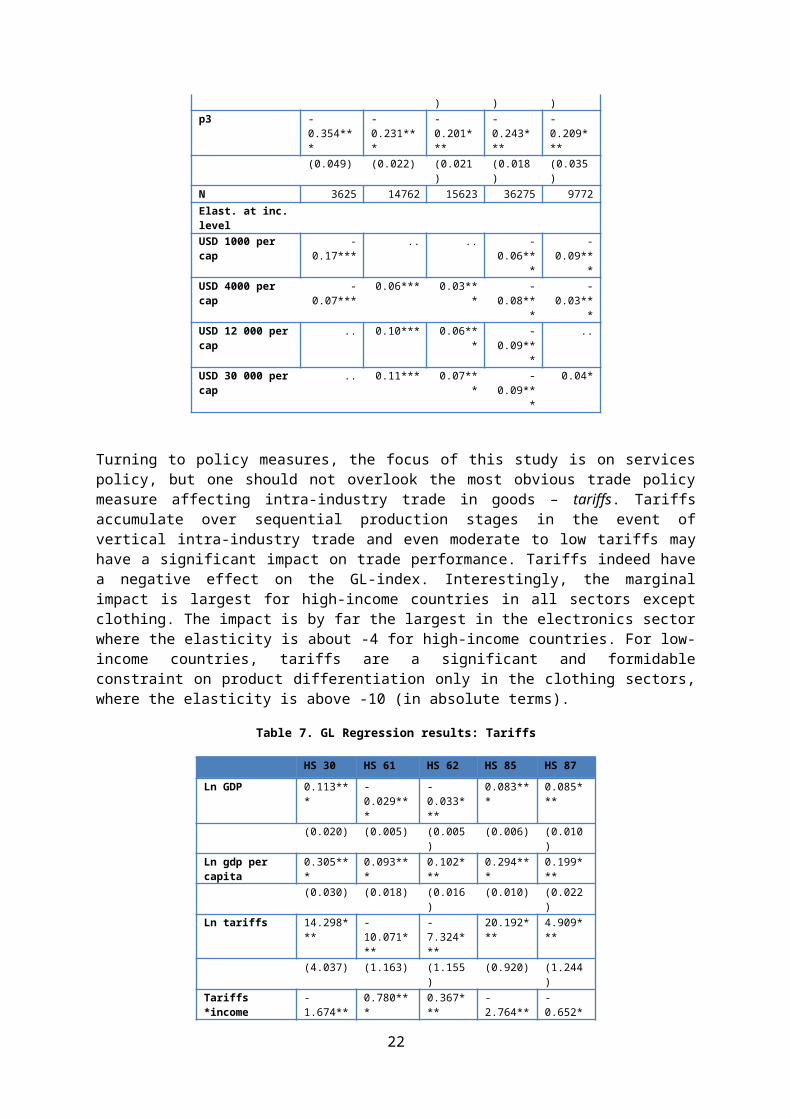
Turning to policy measures, the focus of this study is on services policy, but one should not overlook the most obvious trade policy measure affecting intra-industry trade in goods – tariffs. Tariffs accumulate over sequential production stages in the event of vertical intra-industry trade and even moderate to low tariffs may have a significant impact on trade performance. Tariffs indeed have a negative effect on the GL-index. Interestingly, the marginal impact is largest for high-income countries in all sectors except clothing. The impact is by far the largest in the electronics sector where the elasticity is about -4 for high-income countries. For low-income countries, tariffs are a significant and formidable constraint on product differentiation only in the clothing sectors, where the elasticity is above -10 (in absolute terms).
Table 7. GL Regression results: Tariffs
HS 30 HS 61 HS 62 HS 85 HS 87Ln GDP 0.113*** -0.029*** -0.033*** 0.083*** 0.085***
(0.020) (0.005) (0.005) (0.006) (0.010)Ln gdp per capita 0.305*** 0.093*** 0.102*** 0.294*** 0.199***
(0.030) (0.018) (0.016) (0.010) (0.022)Ln tariffs 14.298**
*-10.071*** -7.324*** 20.192**
*4.909***
(4.037) (1.163) (1.155) (0.920) (1.244)
Tariffs *income -1.674*** 0.780*** 0.367*** -2.764*** -0.652***(0.521) (0.130) (0.133) (0.121) (0.158)
P2 -0.123*** -0.098*** -0.076*** -0.143*** -0.100***(0.034) (0.016) (0.014) (0.011) (0.020)
p3 -0.213*** -0.189*** -0.136*** -0.186*** -0.141***(0.039) (0.019) (0.019) (0.018) (0.029)
N 4447 17174 18963 42229 11967Elast. at inc. levelUSD 1000 per cap 1.45*** -9.80*** -11.11*** 0.72*** ..USD 4000 per cap .. -3.04*** -3.65*** -2.54*** -0.44*
USD 12 000 per cap .. -1.55*** -2.37*** -4.06*** -0.80***USD 30 000 per cap -1.87*** -1.02*** -1.71*** -4.39*** -1.10***
14
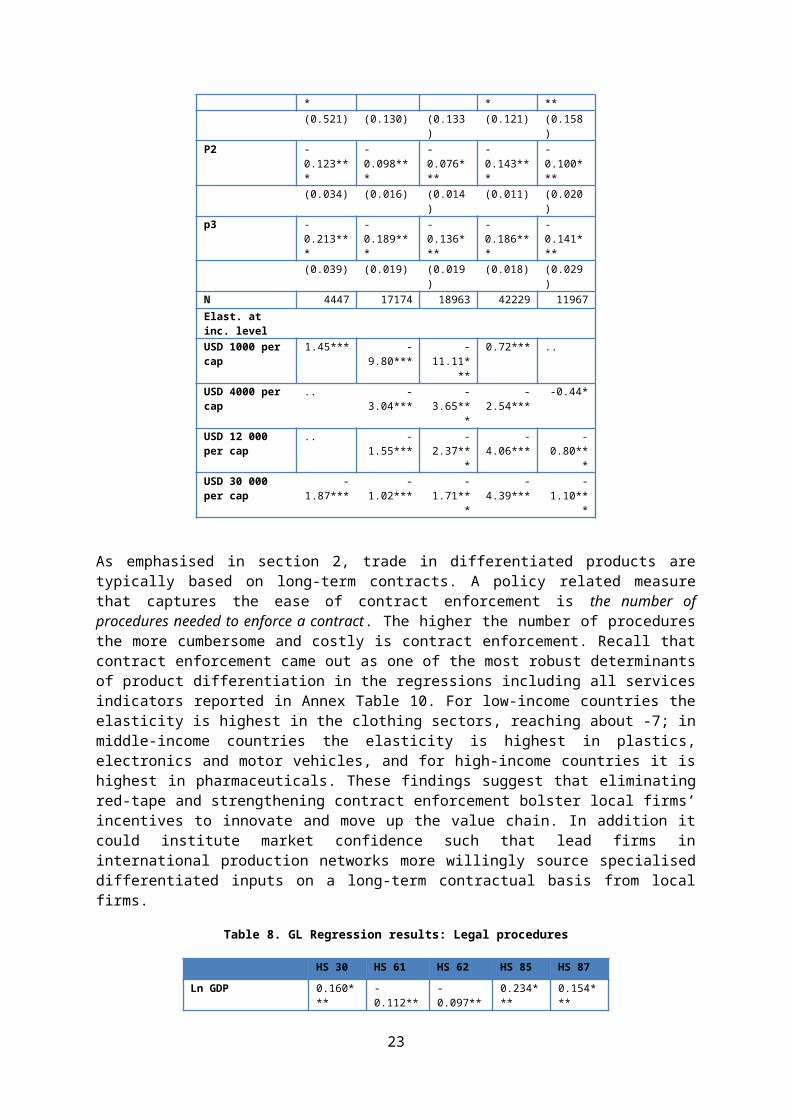
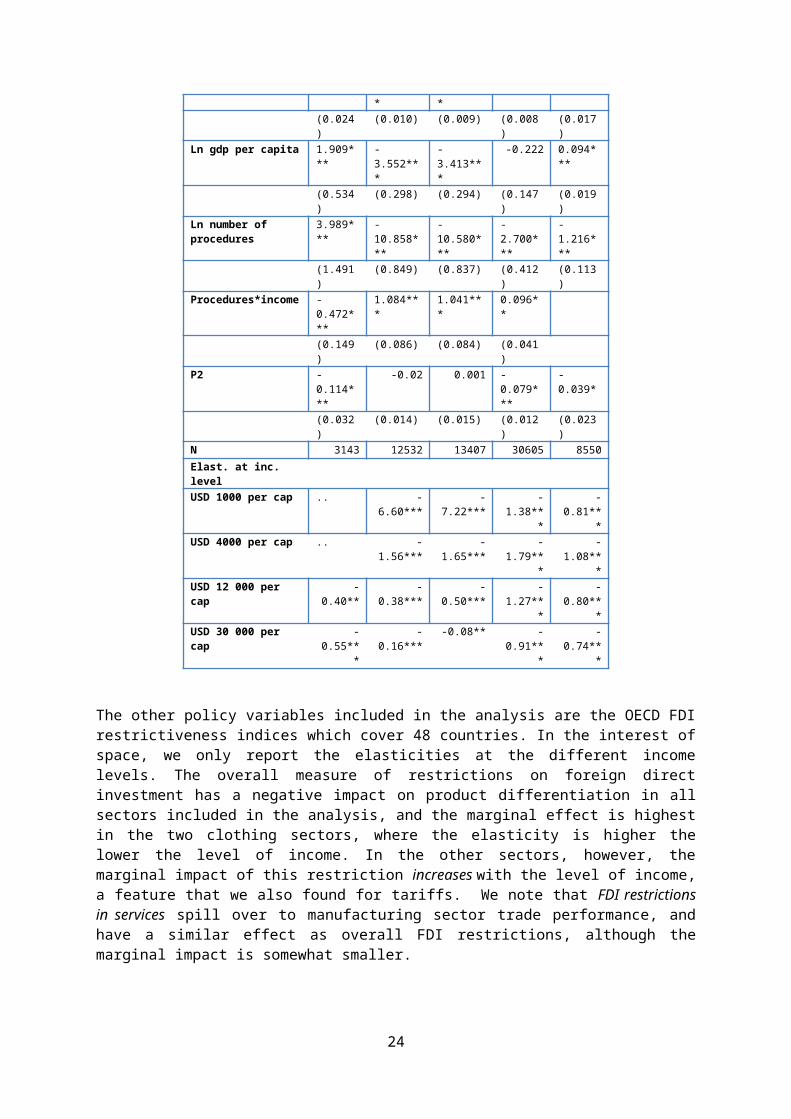
As emphasised in section 2, trade in differentiated products are typically based on long-term contracts. A policy related measure that captures the ease of contract enforcement is the number of procedures needed to enforce a contract. The higher the number of procedures the more cumbersome and costly is contract enforcement. Recall that contract enforcement came out as one of the most robust determinants of product differentiation in the regressions including all services indicators reported in Annex Table 10. For low-income countries the elasticity is highest in the clothing sectors, reaching about -7; in middle-income countries the elasticity is highest in plastics, electronics and motor vehicles, and for high-income countries it is highest in pharmaceuticals. These findings suggest that eliminating red-tape and strengthening contract enforcement bolster local firms’ incentives to innovate and move up the value chain. In addition it could institute market confidence such that lead firms in international production networks more willingly source specialised differentiated inputs on a long-term contractual basis from local firms.
Table 8. GL Regression results: Legal procedures
HS 30 HS 61 HS 62 HS 85 HS 87Ln GDP 0.160*** -0.112*** -0.097*** 0.234*** 0.154***
(0.024) (0.010) (0.009) (0.008) (0.017)
Ln gdp per capita 1.909*** -3.552*** -3.413*** -0.222 0.094***(0.534) (0.298) (0.294) (0.147) (0.019)
Ln number of procedures 3.989*** -10.858***
-10.580***
-2.700*** -1.216***
(1.491) (0.849) (0.837) (0.412) (0.113)Procedures*income -0.472*** 1.084*** 1.041*** 0.096**
(0.149) (0.086) (0.084) (0.041)P2 -0.114*** -0.02 0.001 -0.079*** -0.039*
(0.032) (0.014) (0.015) (0.012) (0.023)N 3143 12532 13407 30605 8550
Elast. at inc. levelUSD 1000 per cap .. -6.60*** -7.22*** -1.38*** -0.81***
USD 4000 per cap .. -1.56*** -1.65*** -1.79*** -1.08***USD 12 000 per cap -0.40** -0.38*** -0.50*** -1.27*** -0.80***
USD 30 000 per cap -0.55*** -0.16*** -0.08** -0.91*** -0.74***
The other policy variables included in the analysis are the OECD FDI restrictiveness indices which cover 48 countries. In the interest of space, we only report the elasticities at the different income levels. The overall measure of restrictions on foreign direct investment has a negative impact on product differentiation in all sectors included in the analysis, and the marginal effect is highest in the two clothing sectors, where the elasticity is higher the lower the level of income. In the other sectors, however, the marginal impact of this restriction increases with the level of income, a feature that we also found for tariffs. We note that FDI restrictions in services spill over to manufacturing sector trade performance, and have a similar effect as overall FDI restrictions, although the marginal impact is somewhat smaller.
Table 9. Elasticities of the GL-index with respect to policy variables
Panel A FDI restrictions
Income level(GDP per capita, USD)
HS 30 HS 61 HS 62 HS 85 HS 87
FDI restrictiveness index, total economy 1000 .. -0.64*** -0.53*** .. ..
15
4000 .. -0.58*** -0.51*** .. -0.07***12 000 -0.14*** -0.53*** -0.49*** -0.12*** -0.21***
30 000 -0.22*** -0.48*** -0.47*** -0.23*** -0.33***FDI restrictiveness index, total services 1000 .. -0.57*** -0.56*** .. .. 4000 .. -0.42*** -0.43*** .. ..
12 000 .. -0.28*** -0.31*** .. -0.11*** 30 000 -0.12* -0.17*** -0.20*** -0.06*** -0.20***
FDI restrictiveness index, telecoms 1000 .. -0.42*** -0.36*** .. ..
4000 .. -0.31*** -0.28*** .. -0.02***12 000 -0.04*** -0.23*** -0.22*** -0.02*** -0.07***
30 000 -0.06*** -0.16*** -0.18*** -0.06*** -0.10***FDI restrictiveness index, transport 1000 -0.21*** -1.26*** -0.86*** .. -0.24*** 4000 -0.19*** -0.88*** -0.67*** .. -0.23***
12 000 -0.18*** -0.58*** -0.51*** -0.06*** -0.23*** 30 000 -0.17*** -0.34*** -0.38*** -0.11*** -0.22***
FDI restrictiveness index, finance 1000 .. -0.47*** -0.36*** .. ..
4000 -0.03** -0.36*** -0.29*** .. -0.03***12 000 -0.07*** -0.28*** -0.24*** -0.07*** -0.10***
30 000 -0.11*** -0.21*** -0.19*** -0.15*** -0.16***
Panel B PMR indicators
Income level(GDP per capita, USD)
HS 30 HS 61 HS 62 HS 85 HS 87
PMR telecoms 1000 -0.09* -1.60*** -1.67*** -0.41*** -0.13***
4000 -0.14* -0.52*** -0.46*** -0.38*** -0.16***12 000 -0.10** -0.29*** -0.24*** -0.15*** -0.11***
30 000 -0.08** -0.20*** -0.12*** -0.05*** -0.10***PMR air transport 1000 -0.24*** -1.60*** -2.00*** -0.13*** -0.03*** 4000 -0.29*** -0.37*** -0.46*** -0.13*** -0.04***
12 000 -0.13*** -0.12*** -0.16*** -0.06*** -0.03*** 30 000 -0.03*** -0.02*** -0.04*** -0.07*** -0.03***
T-statistics are reported in parentheses; ***, ** and * indicate statistical significance at 1, 5 and 10% levels respectively. The PMR index is available for the OECD countries and for Brazil, China, India, Indonesia, Russia and South Africa in the latest vintage for 2008.
Table 9 presents the elasticities of the GL-index with respect to the FDI restrictiveness indices and the Product market regulation (PMR) indices, where statistically significant. The regression was first run with the aggregate FDI restrictiveness index, and next broken down on manufacturing and services, and finally broken down on services sectors. It turned out that for FDI restrictions in manufacturing, the coefficients were highly significant from a statistical point of view, but hardly from an economic point of view, with the highest elasticity being -0.13 at a GDP per capita level of USD 30 000 in the clothing sector (HS 62). A likely reason is that FDI restrictions in manufacturing is relatively muted and does not vary much in the sample. In the interest of space, we do not report these regressions. We finally break down the FDI restrictiveness on individual services sectors.
To summarise this section, the services indicators most strongly associated with product differentiation are time for exports and imports, reliable electricity supply, telecommunications infrastructure and the number of procedures related to contract enforcement. We recall that access to
16
real time information is important for keeping abreast with market development in differentiated products. The strong performance of telecommunications intensity and reliable electricity supply in the regressions supports this anecdotal evidence. We also noted in section 2 that product differentiation is more often associated with contractual relations between manufacturers, suppliers and distributors. The strong performance of the indicator associated with the ease of enforcing contracts underscores this feature of product differentiation.
The sectors most sensitive to services quality and policy are clothing followed by electronics and motor vehicles. Interestingly, the impact of improvement in services performance seems to be strongest in countries that have a comparative advantage in the sector in question, and appears to be particularly important for middle-income countries. These are countries that have typically exhausted their comparative advantage in basic labour-intensive goods and tasks and seek to diversify and upgrade their manufacturing to branded goods or to move up the value chain in other ways. Good quality services inputs and open, competitive services markets are crucial for making that move.
Finally policy distortions in the form of tariffs, restrictions on FDI and regulatory burdens behind the border impede product differentiation the most in high-income countries, again with the exception of the clothing sector. To our knowledge this result has not been reported in the trade and investment literature before, but it is in line with recent theory developments which find that trade barriers and other distortions have a larger impact the deeper the division of labour in a country (Jones, 2011). The intuition behind this is that distortions affect transaction costs, and more sophisticated economies have more transactions.
A tentative conclusion is that services sector performance is crucial for moving up-market into differentiated products in sectors where countries already have industrial capacity, but better services alone are unlikely to trigger market entry in differentiated products in sectors for which the country in question does not have the basic skills, infrastructure or technology, at least not in the short run.
Services and the dynamics of manufacturing trade
Firms enter and exit new markets at a rapid rate, and this section explores to what extent survival of trade flows is related to the quality and regulation of services. Ideally the analysis should be conducted at a firm level, but we do observe a surprisingly high rate of entry and exit also at the 6-digit HS level. Services are likely to affect the survival rate of exports since staying in a market requires the establishment of a distribution networks, after sales services and not least market monitoring. The time period analysed is from 1998 to 2010 for the 34 OECD countries and Brazil, China, India, Indonesia, Russia and South Africa.17
A methodological issue when analysing the determinants of the duration of trade is how to deal with the end points of the period analysed. The data set does not contain information about for how long the trade flows observed in the first year have lasted. By the same token we cannot know how long the trade flows observed in the last year will last. A common way of dealing with this censoring problem is to disregard the first and the last year for observations that are terminated the first year or commence the last year (see Annex 3). Only one-spell trade flows will be considered. Thus, if a country pair HS 6-digit trade flow is discontinued and next re-established, these will be considered two single spells.
Two estimators are employed to investigate the dynamics of trade relationships: the Kaplan-Meier (K-M) estimator, which is a measure of the length of time that a trade relation lasts, and Cox regression, which simply put explains the risk that a trade flow is terminated. Table 2 presents the summary statistics: number of observations of each sectors, mean, standard deviation and min-max values. There are three sets of variables: country-specific characteristics such as GDP per capita, aggregate trade value, and services indicators; bilateral time-invariant gravity variables such as contiguity, 17 .Bilateral trade flows at 6-digit level for a 13-year period add up to a huge amount of observations
and for practical computer capacity reasons the sample is limited to 40 countries in this section.
17
language and distance, and finally time-variant bilateral trade values. The explanatory variables included in the analysis are as far as possible the same as in the previous section. However, the services policy indices are not available for the entire period of the survival analysis and could therefore not be included. The dependent variable, duration of trade, is one spell of the trade relationship from the start to the end.
Table 10. Summarize data statistics
Variables
Definitions Sector
Obs. Mean Std. Dev.
Min Max
Duration one spell from beginning to the end of the trade relationship (years)
HS 30 195 853 9.554 4.118 1 13HS 61 844 408 9.070 4.278 1 13HS 62 1 031
6719.472 4.169 1 13
HS 85 2 697 200
9.677 3.998 1 13
HS 87 568 475 9.610 4.092 1 13Ln trade vale
log value of Trade value (US$)
HS 30 195 853 12.055
3.391 -1.781
23.609
HS 60 844 408 9.606 2.963 -2.469
21.976
HS 61 1 031 671
9.805 2.938 -4.351
21.583
HS 85 2 697 200
10.864
3.195 -4.377
24.153
HS 87 568 475 11.823
3.351 -3.219
24.173
Ln GDP log value of GDP 26.710
1.488 22.445
30.298
Royalty 1
Royalty and license fees, payments (BoP, US$) 20.877
1.837 13.192
24.356
Royalty 2
Royalty and license fees, receipts (BoP, US$) 19.917
2.457 9.496 25.387
Electric Electric power transmission and distribution (% loss, inverse)
92.111
4.324 75 98.85
interest_rate
Interest rate spread (lending rate minus deposit rate, %)
4.933 6.599 -6.910
58.400
Telephone
Telephone lines (per 100 people) 43.528
16.545
2.120 74.700
Sources: UN Comtrade for trade of goods, CEPII gravity database for gravity variables and the World Development Indicator for service indicators.
The event here is the failure of a trading relationship which means exit from a bilateral trade relationship. We estimated the Cox proportional hazards model to control for country-specific and pair-specific characteristics that may influence the duration of trade. The survival period T is regarded as a random variable with a probability distribution F(t) and its probability density function f(t). With an interest in the probability of surviving to time t or beyond, the function of survival or survive curve s(t) is given by:
S ( t )=P (T ≥t )=1−F( t) (3)
Let us consider the following question: If the spell has lasted until time t, then what is the probability that trade breaks down in the next time interval ∆t? This is defined as the hazard rate:
h (t )= f (t)/ S(t ) (4)
The instantaneous probability of failure at time t divided by the probability of surviving up to time t
so that:
18
S ( t )=exp (−H (t )) (5)
where H(t) is the integrated hazard function, also known as the cumulative hazard function (See Greene W. 2007, 6th edition p 931-942).
Two estimators are used to investigate the dynamic of trade relationship: the Kaplan-Meier (K-M) estimator and Cox regression. Through the comparison of the survival in different subgroups by plotting the K-M estimators of the group-specific survival functions, we investigated the failure times, or times at which the event occur between 1998 and 2010. When some of these are continuous, it is very useful to use a Cox regression. For the individual i, the hazard function is given by
hi(t )=h0( t)exp (x i β') (6)
Where h0( t) is the baseline hazard function, β’ are coefficients of regressions and x i covariates. With some assumption about models and proportional hazards, we can maximize the log likelihood with the regression parameters.18
The survival rate differs systematically across income groups as depicted in Table 3, which shows hazard rate, number of events and the 25th, 50th, and 75th percentiles of survival time. The upper part of the table shows the general summary statistics. The percentiles of survival time are derived from a Kaplan-Meier survival function. The function estimates about a 25% chance of failure within 6 years after market entry, and 50% within 12 years. This means that the probability that a trade relationship will continue at any point in time increases with the duration of the relationship up to that point in time. The lower part of the table breaks down the information by income groups. For instance, about 50% of low-income countries’ trade survives for 10 years while it takes 12 years for half the trade flows to be extinguished in high-income countries.
Table 11. Summary of the K-M survival time
Sectors
Categorical variables
Dummy
Total observations
Hazard rate
No. of events
Survival time
(25%, 50%, 75%)
HS30 general survival rate
1 871 231 10.5% 195 853 6 12 13
HS61 7 658 442 11.0% 844 408 5 11 13
HS62 9 771 555 10.6% 1 031 671 6 12 13
HS85 26100357 10.3% 2 697 200 7 12 13
HS87 5463227 10.4% 568 475 6 12 13
HS 30
Income group (1-4)
1 44 340 11.6% 5 122 4 10 13
2 124 219 11.0% 13 628 5 11 13
3 401 709 10.4% 41 821 6 11 13
4 1 300 963 10.4% 135 282 6 12 13
HS 61
1 42 030 14.9% 6 247 3 6 11
2 309 502 13.5% 41 934 3 7 11
3 1 258 067 12.3% 154 185 4 8 13
4 6 048 843 10.6% 642 042 6 12 1
18 See Allison, 1984; Clayton and Hills (1993); Collett, (2003); Klein and Moeschberger, (2003); Cleves et al., (2004)
19
3HS 62
1 61 911 14.2% 8 766 3 7 11
2 419 909 12.8% 53 680 4 8 12
3 1 624 930 11.8% 191 362 5 9 13
4 7 664 805 10.1% 777 863 6 13 13
HS 85
1 717 727 10.4% 74 417 6 12 13
2 1 954 252 10.6% 207 939 6 11 13
3 5 468 242 10.7% 583 931 6 11 13
4 17 960 136 10.2% 1 830 913 7 13 13
HS 87
1 82 352 11.9% 9 760 4 9 13
2 309 743 11.3% 35 143 5 10 13
3 1 103 958 10.8% 118 822 6 11 13
4 3 967 174 10.2% 404 750 7 13 13
Note: See annex Table A4 for the definition of income groups.
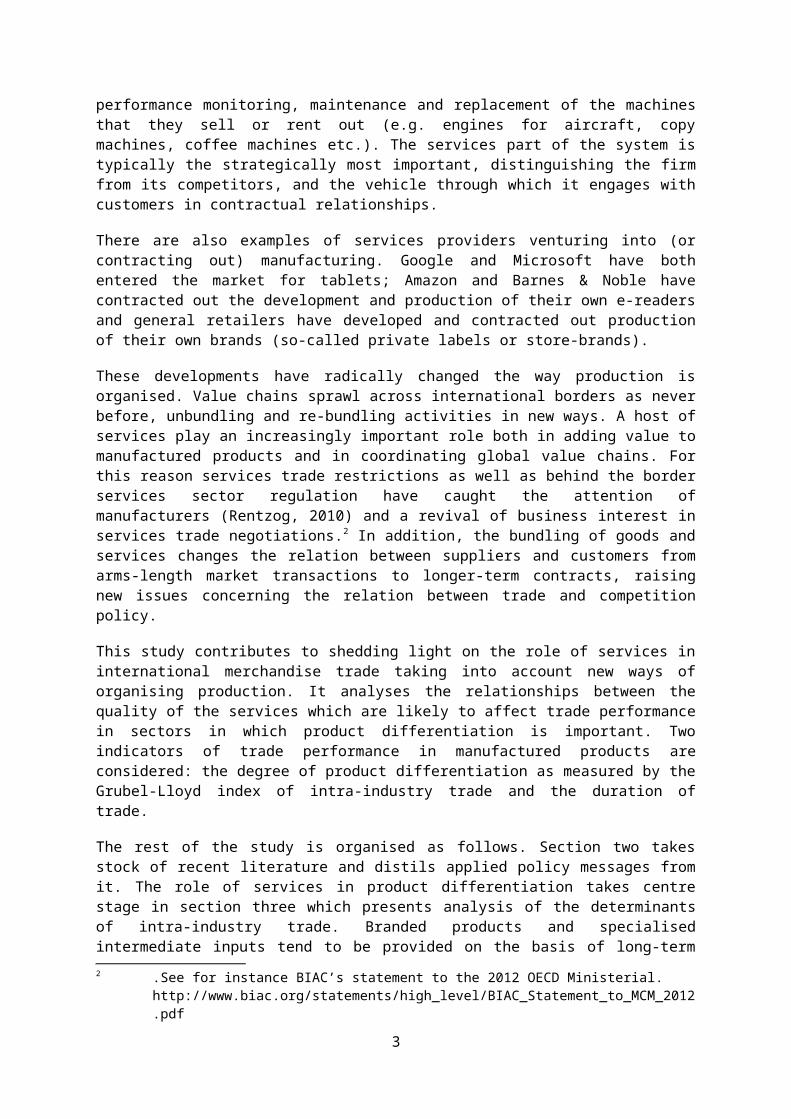
The two clothing sectors (HS 61 and HS 62) have a relatively high hazard rate. This may be because the trade policy regime for this sector changed drastically following the abolishment of quotas in the early 2000s. Compared to other studies, the survival rate at 50% and 75% is relatively high. This is probably because we controlled for censoring bias and considered one-spell trade relationships only. In addition while our sample contains bilateral trade among 34 OECD countries plus the BRIICS most other studies analyse imports to one country from all other countries. Our sample may have more stable trade relationships. Differences across income groups and sectors are illustrated by Figures 4 and 5, which depict Kaplan-Meier estimators of the survival functions.
Figure 3. K-M survival estimates for HS62 by income group
20
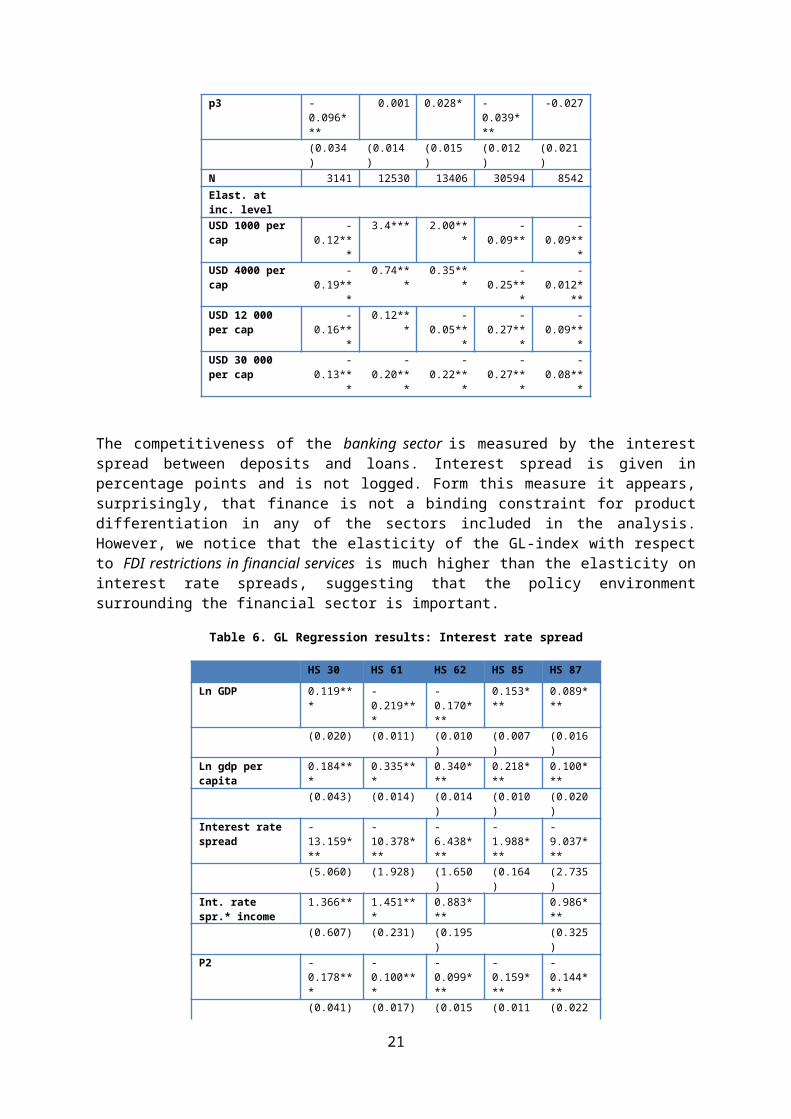
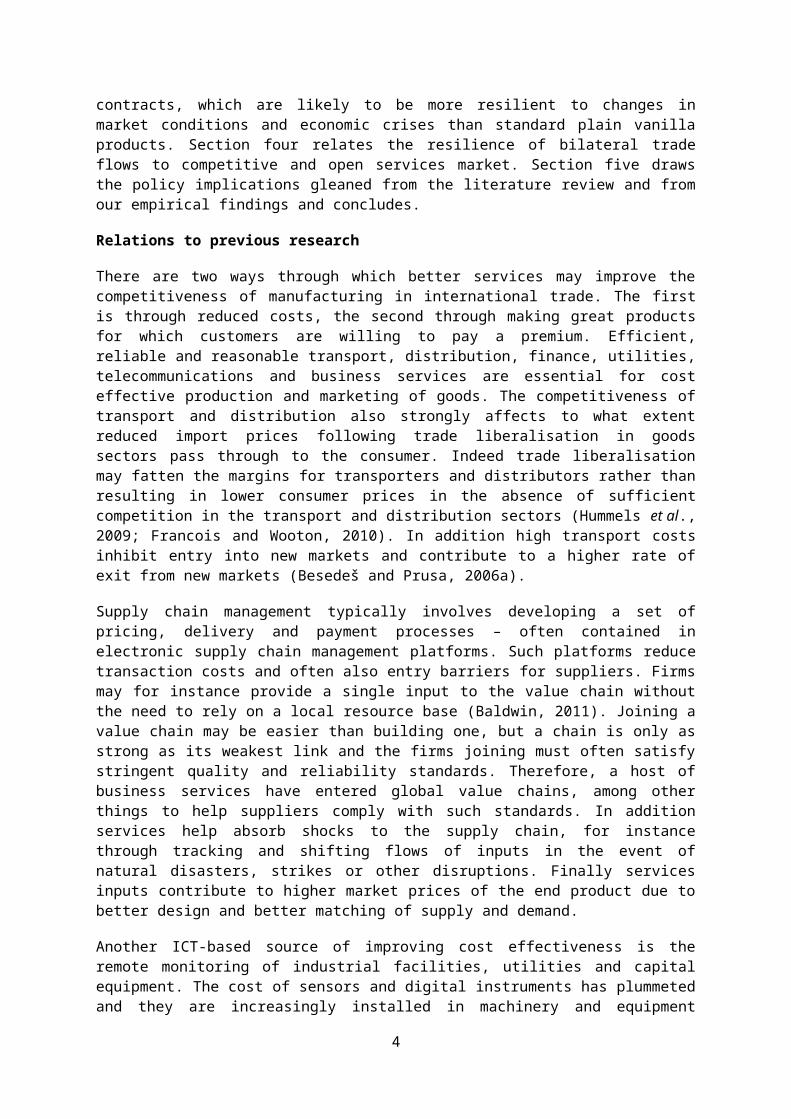
Figure 4. K-M survival estimates for HS87 with income level
Interestingly, apparel (HS 62) which is a highly differentiated consumer good, has a larger spread across income groups than any other sector. Even though the general hazard rate of HS 62 is high (10.6%), the trade of high income countries (income level 4) has similar survival rate as other sectors. But the trade relationships of low income countries in this sector have a much higher failure rate than the other sectors. For instance, 25% of HS 62 trade fails after 3 years, while in the motor vehicle sector it takes 4 years for 25% to fail.
The contribution of this study to the literature is to relate the duration of trade in goods to performance indices of services sectors that are assumed to reduce entry barriers, trade costs and enhance competitiveness in manufacturing. To find the specific contribution of each of these indicators we ran the Cox proportional hazard estimates for bilateral trade relationships at the product level, controlling for the usual gravity variables (country pair log difference of GDP, distance (in log), common border, common language and total trade value (in log)). The results are presented in Table 4.
Table 12. The Cox hazards estimates for bilateral trade relationship
y=Duration Hypothesis
HS30 HS61 HS62 HS85 HS87Haz.
Ratio p>|z|
Haz. Ratio p>|z|
Haz. Ratio p>|z|
Haz. Ratio p>|z|
Haz. Ratio p>|z|
Royalty 1 (-) 1.062*** 1.073*** 1.065*** 1.075*** 1.098***(payment) (0.000) (0.000) (0.000) (0.000) (0.000)Royalty 2 (+) 0.999 0.986*** 0.981*** 0.979*** 0.972***(recipient) (0.920) (0.000) (0.000) (0.000) (0.000)Electric (+) 0.995*** 0.989*** 0.991*** 0.998*** 0.996***(electricity) (0.000) (0.000) (0.000) (0.000) (0.000)Interest rate (+) 0.999*** 0.999*** 0.998*** 0.995*** 0.998***(Banking) (0.000) (0.007) (0.000) (0.000) (0.000)Telephone (+) 0.993*** 0.992*** 0.992*** 0.995*** 0.993***(Telecom) (0.000) (0.000) (0.000) (0.000) (0.000)
21
Ln trade value
(+) 0.857*** 0.830*** 0.825*** 0.862*** 0.876***
(0.000) (0.000) (0.000) (0.000) (0.000)Contiguous (+) 0.961*** 0.967*** 0.985*** 0.967*** 0.906***
(0.000) (0.000) (0.000) (0.000) (0.000)Common language
(+) 0.978*** 0.884*** 0.872*** 0.973*** 0.967***
(0.007) (0.000) (0.000) (0.000) (0.000)Ln distance (-) 1.009*** 1.031*** 1.034*** 1.002*** 0.976***
(0.001) (0.000) (0.000) (0.002) (0.000)Market size (+) 0.999*** 0.999*** 0.999*** 1.000*** 0.999***
(0.000) (0.000) (0.000) (0.000) (0.000)N 106 452 447 813 555 132 555 132 310 815
The duration of trade relationships is indeed strongly and significantly associated with the standard gravity variables. Large transaction values increase the probability of survival and the country pair-specific features that increase bilateral trade in gravity models are also beneficial for the duration of trade. Furthermore, distance is negatively associated with the duration of trade, suggesting that transport and other transaction costs that are associated with distance restrain both the volume of trade and the duration of bilateral trade flows. The two clothing sectors’ hazard rates are the most sensitive to the standard gravity variables.
Royalty payments and receipts are included to explore to what extent licensing of technology affects the duration of trade. Unfortunately data is available only at a country level, so we do not know in which sectors they accrue or are paid. The data therefore indicates to what extent the country in question is an exporter or importer of proprietary – or both. Interestingly, licensing technology from abroad (payment) reduces the duration of trade significantly in all sectors, while exporters of technology tend to have longer trade spells. Royalty payments have the highest impact on duration of trade in the motor vehicle sector. Unsurprisingly, telecommunications density is positively related to the duration of trade in all sectors, as it is likely to reduce search costs as well as transaction costs. The impact is similar across sectors. The interest rate spread has a significant positive impact on the duration of bilateral trade.
This section has shown the dynamics of international trade at the product level. A short spell of exports may occur because of chance or failure to reach a critical export volume in a new market. However, services may affect the hazard rate through lowering entry barriers, which could raise the hazard rate; and reducing search costs, which would lower the hazard rate.
Policy implications
This study has explored the linkages between goods and services in international trade along several dimensions. We have focussed on manufacturing sectors which are characterised by product differentiation and horizontal or vertical intra-industry trade. The main findings are that i) high-technology industries are more business services intensive than other sectors, and variation in business services content across countries is highly correlated with variation in export prices obtained in major markets; ii) countries in which manufacturers have access to high quality transport, telecommunications, electricity and financial services tend to do better in terms of product differentiation and export prices and their exports tend to be more resilient over time; iii) the marginal effect of the services indicators vary substantially across sectors and level of development; iv) policy distortions in services markets spill over to manufacturing export markets and have a larger negative marginal impact on manufacturing export performance the higher the level of development; v) better services alone does not have a discernible impact on product differentiation in sectors where a country
22
is far from the technical frontier or does not have a comparative advantage. But better services are important for moving up the value chain in sectors for which countries already have an advantage.
Our empirical analysis allows us to go beyond a one size fits all policy recommendation and make some tentative suggestions on which reforms would be most important in which countries. Starting with low-income countries and assuming that their industrial capacity rests in low-technology industries, the most important policy measures would be to reduce tariffs, improve the level of education, improve contract enforcement and reduce time for exports and imports. These reforms could help them moving into branded clothing. In addition improving the reliability of electricity supply would help entering into global value chains in the electronics sector. Finally, opening up the services sectors, particularly finance, to foreign direct investment would help obtain higher export prices in the sectors of comparative advantage. Tariff reductions, FDI liberalisation, better contract enforcement and reduced time for exports and imports are the low-hanging fruits for low and lower-middle income countries. Such reforms do not require investments or taxing government capacity and scarce resources very much, and would make a relatively large impact as a first step up the value chain.
Tariffs have among the largest marginal impacts on both product differentiation and export prices in middle and high-income countries. Most OECD countries have relatively low tariffs on manufactured products but nevertheless we find that tariffs penalise exporters particularly hard in high-income countries. This is mainly because rich countries tend to be part of complex value chains, but our finding could also reflect that tariffs are sometimes accompanied with administrative burdens that may be more costly than the tariff itself. Therefore, removing tariffs altogether would contribute to product differentiation and higher export prices for rich countries’ exports.
Even if telecoms density does not produce the highest marginal effects in any sector or at any income level, it is the measure that is most unambiguously associated with moving up the value chain of the services indicators included in this study. More telephone lines and internet connections are associated with more extensive product differentiation, higher export prices, more resilient exports and also higher export volumes concentrated on fewer HS6 product lines. Furthermore, product market regulation in telecoms, which reflect the extent to which competitive markets prevail, has a relatively strong impact on export prices. Telecoms are a sector subject to rapid technological changes and changing market structure. Best practice telecoms regulation evolves with changing market conditions and our findings suggest regulation that stays abreast with market developments is of utmost importance not least for high-income countries.
The strong impact of reliable electricity on competitiveness in manufacturing is somewhat surprising. However, in the light of recent analysis of the role of reliable electricity in the emerging industrial internet where sensors monitor and control manufacturing processes and supply chain management systems, the results are plausible. Investing in electricity distribution, for instance smart grids, would be a substantial contribution to manufacturing competitiveness, not least in high-income countries. Even if electricity supply is already more reliable in rich countries, manufacturing may incur higher costs following blackouts or brownouts when they happen.19 Another somewhat surprising result is the small effect of the measures included related to financial services. These are the policy implications drawn directly from our empirical analysis. We now turn to policy implications that can be drawn from the literature reviewed in this study.
Both goods and services are delivered cross-border, through commercial presence and movement of natural persons. Furthermore, new ways of bundling goods and services and new technology sometimes make it difficult to distinguish between goods and services, particularly when products can be delivered both electronically and as a physical good or when a physical product mainly serves as a platform for delivering services. An example of the latter is manufacturers of durable goods who see
19 See for instance http://energy.gov/articles/america-s-competitiveness-depends-21st-century-grid
23
themselves as system providers adding life-cycle services to the package offered to the customer. A more cohesive international trade regime for goods and services when it comes to commercial presence and movement of people would better cater to the business realities that emerge with the second unbundling.
We have seen that discouraging the establishment of services activities through restrictions on services FDI as well as burdensome behind the border regulation of services industries negatively affects competitiveness in manufacturing. It is therefore useful to assess the impact of services trade policy and regulation not only on the sector directly targeted, but also on manufacturing. Where possible regulatory spillovers along the value chain, both the activities located at home and abroad, should be taken into account to get a sense of the direct impact as well as possible unintended indirect effects of regulation and trade restrictions.
Behind the border regulation such as technical standards, trade-related intellectual property rights and other non-tariff measures facing goods and services exporters are conceptually similar. Furthermore, international agreements tend to focus on disciplines rather than the specifics of regulation. It thus appears that there are possibilities for harmonising rules such that companies face a similar policy environment whether they trade goods, services or both.
Continuous market monitoring has become an increasingly important strategic function for suppliers of consumer goods and services. The information that comes out of this activity is used for creating consumer profiles for personalised, targeted marketing and for use in product design. Monitoring activities can be costly and producers may wish to segment markets in order to extract as much consumer surplus as they can from each market to recoupe their monitoring costs. There are several ways of segmenting markets. Routing consumers to a specific national market on a company’s e-commerce website is a common example. Bundling goods and services and selling the good at a discount conditioned on a long-term contract for the services part is also common in some markets. Finally loyalty programs may contribute to market segmentation. Moving away from one-off market based transactions may raise the switching costs for consumers and thereby raise barriers to entry for new goods and services suppliers. For these reasons there may be a need for a closer assessment of competition policy implication of new ways of bundling goods and services, some of which could take international dimensions.
Market monitoring takes place electronically and an enormous amount of information is collected and processed. Specialised computer services firms offer such data mining services which can easily be traded across borders. Restrictions on transfer and storage of consumer information may impede trade in computer services as well as cross-border personalised marketing and feed-back loops of market monitoring and design, an important feature of what some observers coin the new industrial revolution. There is therefore a need for striking a balance between legitimate concerns about privacy and the proprietary information on the one hand and open markets on the other.
To conclude, new technology is about to change the way production is being organised. Machine tools are becoming less scale intensive and a host of activities are being performed over the internet, unbundling and re-bundling tasks in new ways. One feature of this process is the prominent role of services both as direct inputs into manufacturing and as part of a goods and services bundle provided on a contractual basis. Access to sophisticated services, particularly in network industries such as telecoms and electricity, could be a source of comparative advantage and a competitive edge in markets and technologies with a potential to revitalise the economy.
24
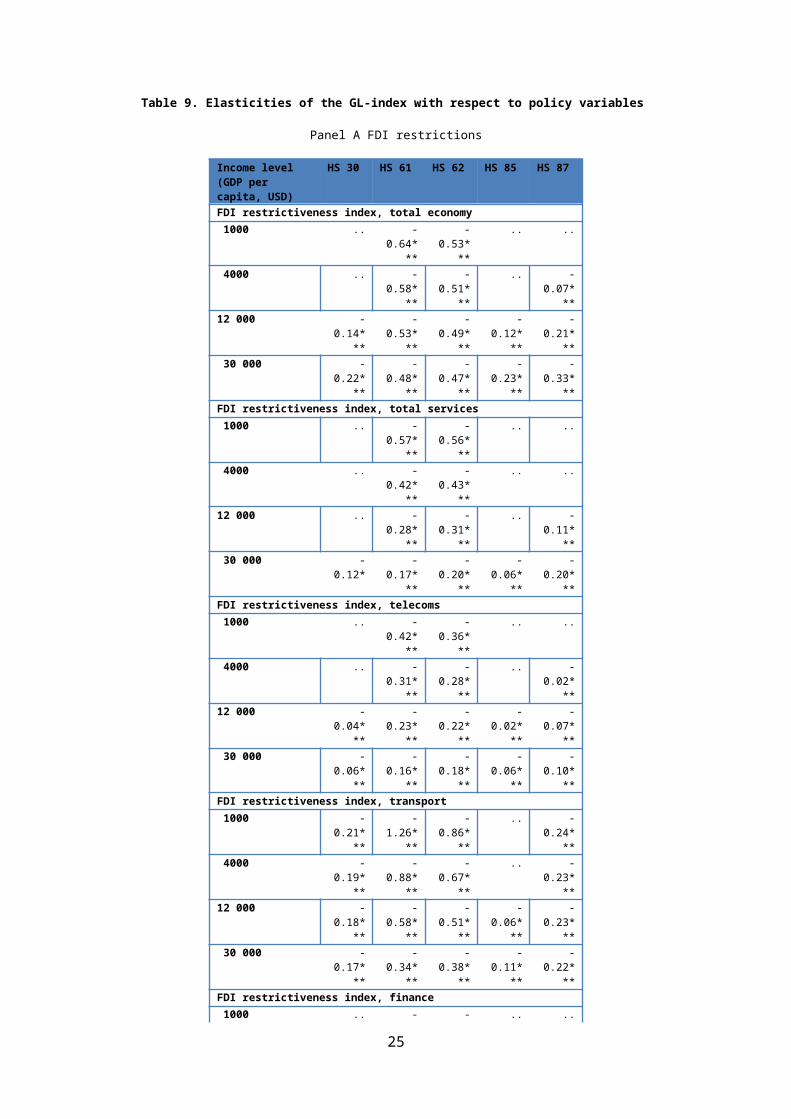
REFERENCES
Allison, P. D. (1984), Event History Analysis: Regression for Longitudinal Event Data, Newbury Park, CA: Sage: Sage University.
Anderson, C. (2012), Makers. The New Industrial Revolution. New York: Crown Business.
Arndt, S. W. (2004), Global production networks and regional integration. Empirical Methods in International Trade. M. Plummer. Northampton, MA, Edward Elgar: 129-144.
Arnold, J., B. S. Javorcik and A. Mattoo (2011), “Does services liberalization benefit manufacturing firms? Evidence from the Czech Republic”, Journal of International Economics, 85, 136-146.
Besedeš, T. (2008), "A Search Cost Perspective on Formation and Duration of Trade." Review of International Economics 16(5): 835-849.
Besedeš, T. and T. J. Prusa (2006a), "Ins, outs, and the duration of trade." Canadian Journal of Economics/Revue canadienne d'économique 39(1): 266-295.
Besedeš, T. and T. J. Prusa (2006b), "Product differentiation and duration of US import trade." Journal of International Economics 70(2): 339-358.
Brezis, E., P.M. Krugman and D. Tsiddon (1993),”Leapfrogging in International Competition: A Theory of Cycles in National Technological Lead”, The American Economic Review, 83, 1211-1219.
Breinlich H. and C. Criscoulo (2011), “International trade in services: A portrait of importers and exporters”, Journal of International Economics, 84, 188-206.
Clayton, D., M. Hills and A. Pickles. (1993), Statistical Models in Epidemiology. Oxford: Oxford University Press.
Cleves, M., W. Gould, R. Gutierrez and Y. Marchenko. (2008), An Introduction to Survival Analysis Using Stata. College Station, TX: Stata Press.
Collett, D. (2003), Modelling Survival Data in Medical Research, Boca Raton, FL: Chapman & Hall/CRC.
Das, S., Roberts, M. J., and Tybout, J. R. (2007), Market Entry Costs, Producer Heterogeneity, and Export Dynamics, Econometrica 75, 837–873.
Debaere, P., Görg, H. And Raff, H. (2010), “Greasing the wheels of international commerce: how services facilitate firms’ international sourcing”, CEPR Discussion Paper no 7575.
Delgado, M., M.E. Porter and S. Stern, (2012), “Clusters, convergence and economic performance”, NBER Working Paper no 18250, July.
Dixit, A. (1989). "Hysteresis, import penetration, and exchange rate pass-through." The Quarterly Journal of Economics 104(2): 205-228.
25
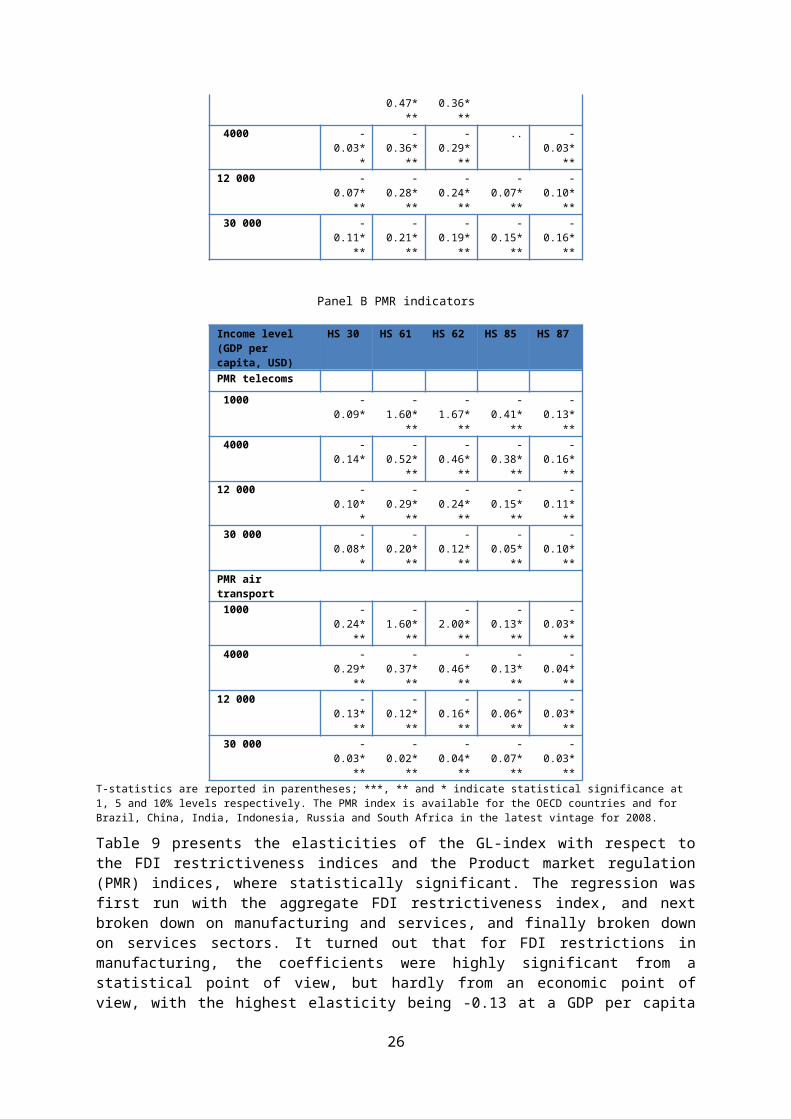
Eaton, J., M. Eslava, M. Kugler and J. Tybout. (2008), "The Margins of Entry into Export Markets: Evidence from Colombia," The Organization of Firms in a Global Economy, Cambridge, MA: Harvard University Press.
Egger, P., M. Larch and K.E. Staub (2012), “Trade preferences and bilateral trade in goods and services: A structural approach”, CEPR Working Paper No 9051.
Esteve-Pérez, S., J.A. Mánez-Castillejo, M.E. Rochina-Barrachina and J.A. Sanchis-Llopis. (2007), "A Survival Analysis of Manufacturing Firms in Export Markets." Entrepreneurship, Industrial Location and Economic Growth, Edward Elgar, Cheltenham.
Evans, Munster (1999), Blown to Bits. How the New Economics of Information Transforms Strategy. Cambridge, Mass.: Harvard University Press.
Evans, P.C. and M. Annunziata (2012), “Industrial internet: Pushing the boundaries of minds and machines”, General Electric, http://www.ge.com/docs/chapters/Industrial_Internet.pdf
Francois, J. F. and Woerz, J. (2008), “Producer Services, Manufacturing Linkages, and Trade”, Journal of Industry Competition and Trade, 8, 199-229.
Francois, J. F. and I. Wooton (2010), “Market structure and market access”, World Economy, 873-893.
Fugazza, M. and A. C. Molina (2009), "The determinants of trade survival." IHEID Working Papers.
Greene, W. H. (2007), Econometric Analysis, Upper Saddle River, NJ: Prentice hall.
Haldane, A.G. (2012), “The dog and the Frisbee”, Paper presented at the Federal Reserve Bank of Kansas City’s annual economic policy symposium at Jackson Hole, 31 August.
Hummels, D. and P. J. Klenow (2005), "The variety and quality of a nation’s exports", The American Economic Review 95(3), 704-723.
Hummels, D., V. Lugovskyy and S.Skiba (2009), “The trade reducing effects of market power in international shipping, Journal of Development Economics 89, 84-97.
Jones, C. (2011), “Misallocation, Economic Growth, and Input-Output Economics”, NBER Working Paper No. 16742, January.
Kelle, M. and J. Kleinert (2010), “German Firms in Service Trade”, Applied Economics Quarterly, 51-72.
Klein, J. and Moeschberger, M. (2003), "Survival Analysis: Statistical Methods for Censored and Truncated Data", Springer, New York.
Krugman, P. (1979), Increasing Returns, Monopolistic Competition and International Trade, Journal of International Economics, 9, 469-79.
Lodefalk, M. (2012a), “Servicification of manufacturing – evidence from Sweden”, International Journal of Economics and Business Research, forthcoming.
Lodefalk, M. (2012b), “The Role of Services for Manufacturing Firm Exports”, Örebro University, manuscript.
Marsh, P. T. (2012), The New Industrial Revolution Consumers, Globalization and the End of Mass Production, Yale University Press.
26

Marshall, A. (1890), Principles of Economics, London: Macmillan.
McKinsey Global Institute (2012), “Manufacturing the future: the next area of global growth and innovation”, McKinsey and Company, November.
Melitz, M. J. (2003), “The Impact of Trade on Intra-industry Reallocations and Aggregate Industry Productivity,” Econometrica, 71, 1695–1725.
Mudambi, Ram (2008), Location, control and innovation in knowledge-intensive industries. Journal of Economic Geography, 8, 699-725.
Nitsch, V. (2009), "Die another day: duration in German import trade." Review of World Economics 145(1): 133-154.
Nordås, H. K., Geloso-Grosso, M. Pinali, E. (2006), Logistics and Time as a Trade Barrier, OECD Trade Policy Working Paper 35.
Nordås, H. K. (2008), “The impact of services trade liberalisation on trade in non-agricultural goods”, OECD Trade Policy Working Paper no 81.
Nordås, H.K. (2010), “Trade in goods and services: two sides of the same coin?” Economic Modelling, 27, 496-506.
Nordås, H.K. (2011), “Open markets for business services and product differentiation in downstream industries”, Journal of Economic Integration Vol. 26, pp. 306-328.
Obashi, A. (2010), “Stability of production networks in East Asia: Duration and survival of trade”, Japan and the World Economy, Vol. 22, pp. 21-30.
Pilat, D. and Wölfl, A. (2005), “Measuring the interaction between goods and services” , OECD/STI Working Paper 2005/5.
Porter, M.E. (1990), The Competitive Advantage of Nations, New York: Free Press.
Rauch, J. E. and J. Watson (2003), "Starting small in an unfamiliar environment." International Journal of Industrial Organization 21(7): 1021-1042.
Rentzhog, M. (2010), “At your service. The importance of services for manufacturing companies and possible trade policy implications”, Swedish Board of Trade, 2010:2.
Roberts, M. J. and J. R. Tybout (1997), "The decision to export in Colombia: an empirical model of entry with sunk costs." The American Economic Review: 545-564.
27
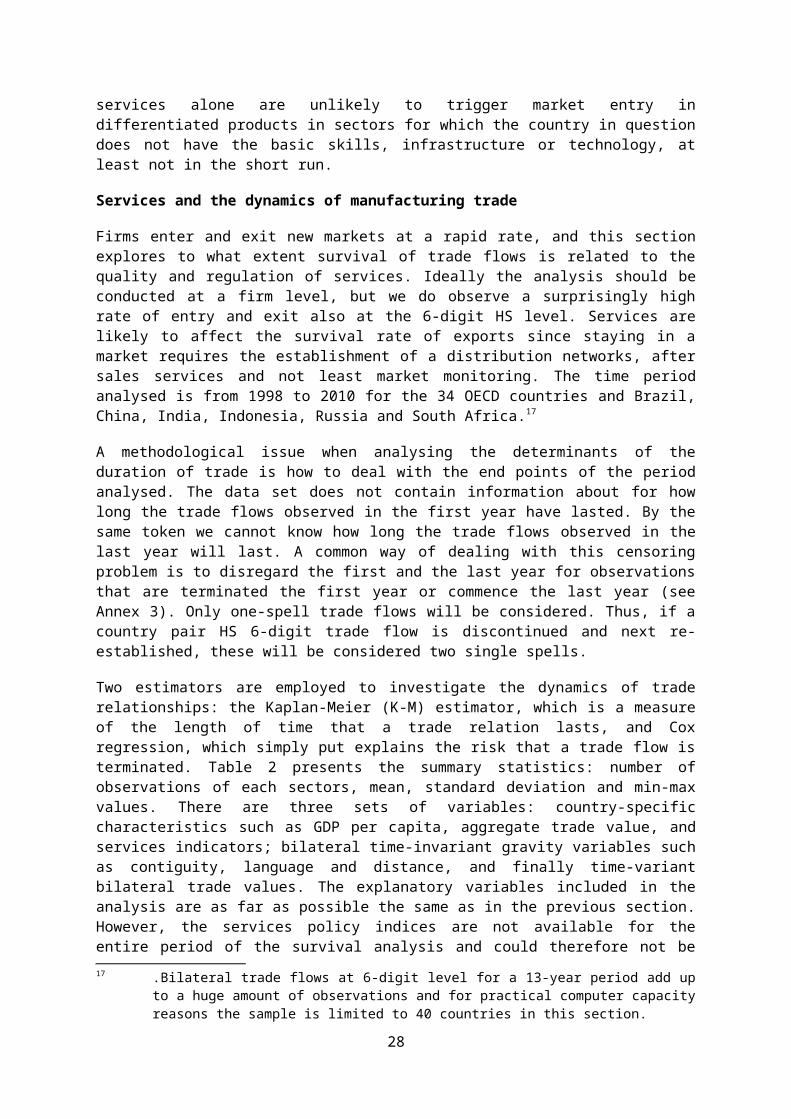
Annex
Table A1. Explanatory variables Summary statistics
Variable Mean
Std. Dev.
Min Max Source
Interest rate spread 5.4 5.7 -1.4 45.1 WDIMobile telephone lines per 100 inhabitants
80.4 29.0 3.2 188.3
WDI
Fixed telephone lines per 100 inhabitants
34.3 18.0 2.6 71.8 WDI
Broadband lines per 100 inhabitants 9.9 8.6 0 36.5 WDI1- Electricity loss, share of transmitted 0.90 0.05 0.73 0.98 WDITime for exports (days) 15.1 7.7 5 49 WDITime for imports (days) 16.8 10.0 4 71 WDICost to export (USD per container) 895.
5321.4 362.
52590
WDI
Cost to import (USD per container) 992.1
363.1 317.0
2868
WDI
Number of legal procedures, contract enforcement
33 5.6 21 46 WDI
Tariffs 6.36 8.35 0 125 Comtrade; WTO
FDI restrictiveness index, total all sectors
0.1 0.1 0 0.4 OECD
Total services 0.1 0.1 0 0.5 OECD Financial services 0.1 0.1 0 0.6 OECD Telecommunications 0.1 0.2 0 0.8 OECD Transport 0.3 0.2 0.04 0.7 OECDProduct market regulation index OECD Telecommunications 1.6 0.8 0.2 4.3 OECD Air transport 1.8 1.4 0 4.8 OECDNote: The statistics represent average values for the period 2003-2008 for 60 countries or the countries covered by the index. WDI represents World Development Indicators from the World Bank. Tariffs are simple average applied MFN rate for the 6-digit HS category.
Table A2. Countries included in the econometric analysis
Argentina Costa Rica Hungary
Lithuania Philippines
Spain
Australia Czech Republic
Iceland Luxembourg
Poland Sweden
Austria Denmark India Malaysia Portugal SwitzerlandBelgium Egypt Indone
siaMexico Romania Thailand
Brazil Estonia Ireland Morocco Russia TurkeyBulgaria Finland Israel20 Netherlan
dsSaudi Arabia
Ukraine
Canada France Italy New Zealand
Singapore United Kingdom
Chile Germany Japan Norway Slovakia USAChina Greece Korea Pakistan Slovenia Venezuela
20 .The statistical data for Israel are supplied by and under the responsibility of the relevant Israeli authorities. The use of such data by the OECD is without prejudice to the status of the Golan Heights, East Jerusalem and Israeli settlements in the West Bank under the terms of international law.
28
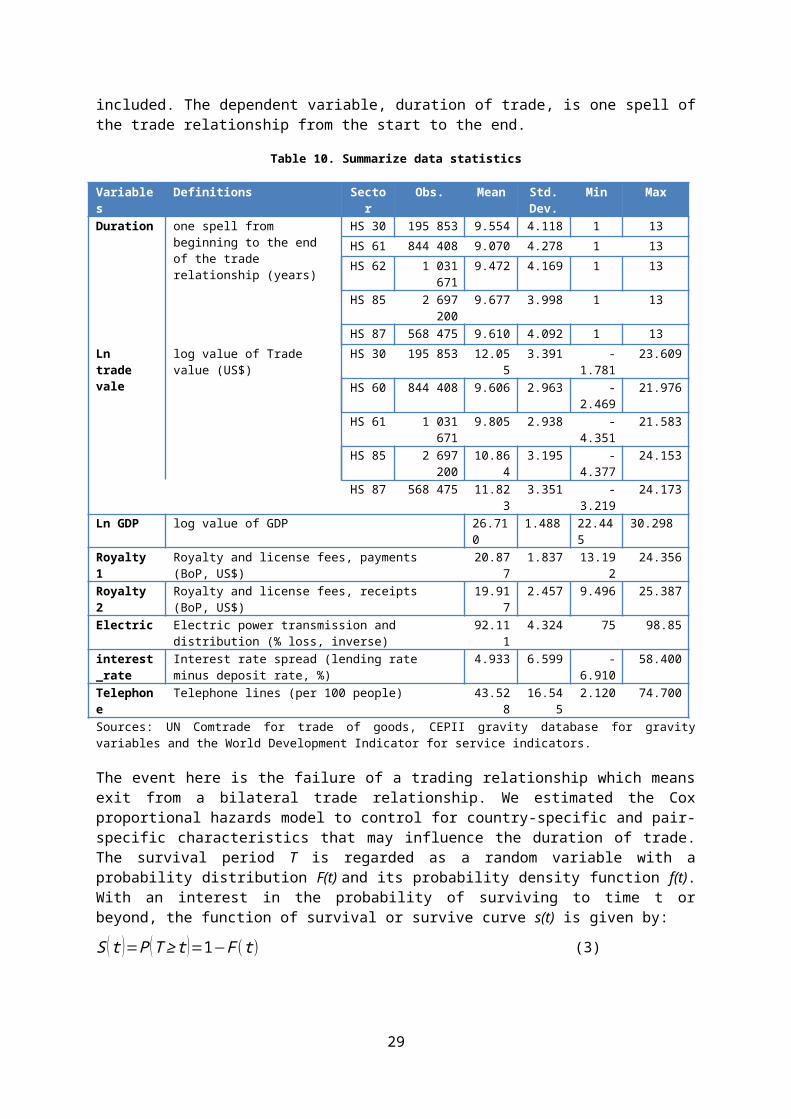
Chinese Taipei
Hong Kong Latvia Peru South Africa
Vietnam
Table A3: Correlation matrix explanatory variables
GDP per cap
Transp. cost
Time Contract enf.
Tele-dens Interest spread
Electricity loss (inv)
Years schooling
Tariffs
Transp. Cost 0.09 1Time -0.71 0.07 1
Contract enf. -0.47 -0.07 0.40 1Tele-dens 0.78 0.00 -0.74 -0.48 1
Interest spr. -0.29 0.06 0.25 0.51 -0.37 1El. Loss (inv) 0.40 -0.18 -0.28 -0.55 0.58 -0.58 1
School 0.48 0.00 -0.58 -0.55 0.77 -0.45 0.49 1Tariffs -0.38 0.08 0.30 0.27 -0.50 0.38 -0.38 -0.40 1
FDI ri (total) -0.22 -0.17 0.08 0.18 -0.48 -0.06 -0.09 -0.33 0.32FDI ri services -0.32 -0.17 0.19 0.26 -0.56 -0.02 -0.20 -0.41 0.34
FDI ri transp. -0.10 -0.21 -0.12 0.22 -0.25 -0.10 -0.04 -0.08 0.20FDI ri finance -0.13 -0.03 0.05 0.15 -0.42 -0.05 -0.12 -0.29 0.32
FDI ri Tele -0.09 -0.08 -0.15 0.05 -0.16 -0.14 0.18 0.04 0.25PMR tele -0.18 0.06 0.38 -0.02 -0.40 -0.06 -0.06 -0.27 0.20
PMR air -0.62 0.00 0.63 0.21 -0.65 0.09 -0.43 -0.38 0.36
FDI ri (total)
FDI ri services
FDI ri transp.
FDI ri finance
FDI ri tele PMR tele PMRair
FDI ri services 0.94 1FDI ri transp. 0.74 0.66 1
FDI ri finance 0.90 0.91 0.60 1FDI ri Tele 0.82 0.69 0.79 0.74 1
PMR tele 0.41 0.42 0.13 0.52 0.24 1PMR air 0.34 0.36 0.16 0.29 0.15 0.277 1
Table A4, Income groups
Income group GDP per capita (USD) upper limit Low 1 025Lower Middle 4 035Upper Middle 12 475High
29