Embed Size (px)
Citation preview
1
The role of sensorimotor cortical
plasticity in the pathophysiology
of Parkinson's disease and
dystonia
Thesis submitted for the degree of PhD
Maja Kojovic
Institute of Neurology
University College London

2
2014
I, MAJA KOJOVIC CONFIRM THAT THE WORK PRESENTED IN THIS
THESIS IS MY OWN. WHERE INFORMATION HAS BEEN DERIVED FROM
OTHER SOURCES, I CONFIRM THAT THIS HAS BEEN INDICATED IN THE
THESIS.
SIGNED:
DATE:
3
ABSTRACT
This PhD thesis is a study of cortical electrophysiology in two basal ganglia
disorders: Parkinson’s disease (PD) and dystonia. Two diseases were chosen
as being representative of hypokinetic and hyperkinetic movement disorders,
respectively. In addition, current treatments seem to be imperfect to control
many aspects of both diseases, hence the interest in exploring potential new
therapeutic targets. PD and dystonia are basal ganglia diseases, but there is
growing body of evidence of impaired cortical function and particularly of
abnormal sensorimotor cortical plasticity in both disorders. We however still lack
knowledge about functional significance of these cortical changes. Are they
maladaptive or compensatory or of little functional significance?
Techniques of Transcranial Magnetic (TMS) were used to determine 1) if clinical
asymmetry of early PD is reflected in hemispheric asymmetry of sensorimotor
cortical plasticity and intracortical inhibition, and 2) how these
electrophysiological measures change with disease progression.
We found that the hemisphere contralateral to the less affected side had
preserved intracortical inhibition and a larger response to the plasticity protocol,
whereas on the more affected hemisphere these were reduced. We further
demonstrated that the decline in asymmetry of these measures correlated with
the reduction in asymmetry of clinical symptoms, suggesting these were
compensatory changes.
4
In dystonia patients, we investigated using TMS 1) if change of afferent input
induced by botulinum toxin injections may change response to plasticity
protocol in primary dystonia, and if 2) secondary and primary dystonia patients
share the same pattern of electrophysiological abnormalities.
We demonstrated that sensorimotor cortical plasticity in primary dystonia is not
permanent abnormality but may be transitory reduced with botulinum injections
treatment. Secondary dystonia patients, as opposed to primary dystonia
patients did not have enhanced sensorimotor plasticity or impaired cerebellar
function. We provide evidence that different types of dystonia do not necessarily
have the same neuroanatomical substrates, which might have therapeutic
implications.
5
TABLE OF CONTENT
ABSTRACT ..................................................................................................... 3
LIST OF TABLES .......................................................................................... 11
LIST OF FIGURES ........................................................................................ 11
THESIS OVERVIEW ..................................................................................... 15
LIST OF ABBREVIATIONS ........................................................................... 18
CHAPTER 1 INTRODUCTION ......................................................................... 21
1.1. BRAIN PLASTICITY ................................................................................. 21
1.1.1 ADAPTIVE PLASTICITY VS. MALADAPTIVE PLASTICITY IN BRAIN DISORDERS .. 21
1.1.2 PROPOSED MECHANISM OF SYNAPTIC PLASTICITY ...................................... 24
1.1.2 CELLULAR MECHANISMS OF SYNAPTIC PLASTICITY .................................... 25
1.2 PROBING AND MEASURING PLASTICITY “IN VIVO” .......................................... 26
1.2.1 TRANSCRANIAL MAGNETIC STIMULATION: MAGNETIC INDUCTION AS A NON-
INVASIVE WAY TO ELECTRICALLY STIMULATE THE BRAIN ....................................... 27
1.2.2 TMS MEASURES OF CORTICOSPINAL EXCITABILITY: MOTOR THRESHOLDS AND
INPUT-OUTPUT CURVE ...................................................................................... 29
1.2.3 TMS MEASURES OF INTRACORTICAL INHIBITION AND FACILITATION ............ 30
1.2.4 TMS AS EXPERIMENTAL PLASTIC FORCE.................................................. 31
1.2.5 PAIRED ASSOCIATIVE STIMULATION ......................................................... 32
1.2.6 BETWEEN-SUBJECT AND WITHIN-SUBJECT VARIABILITY OF TMS MEASURES 34
1.2.7 INTERHEMISPHERIC BALANCE OF TMS MEASURES ................................... 35
1.3 THE CONTRIBUTION OF TMS IN REVEALING PATHOPHYSIOLOGY OF
PARKINSON’S DISEASE AND DYSTONIA ............................................................... 35
6
1.3.1 THE SIGNIFICANCE OF ELECTROPHYSIOLOGICAL ABNORMALITIES IN BG
DISEASE: CAUSE OR CONSEQUENCE? HELP OR HINDRANCE? ............................... 36
1.3.2 CORTICAL ABNORMALITIES IN PD AS REVEALED BY TMS AND THEIR
INTERPRETATION.............................................................................................. 38
MOTOR THRESHOLDS AND IO CURVE IN PD ........................................................ 39
INTRACORTICAL INHIBITION IN PD ...................................................................... 40
PLASTICITY IN PARKINSON’S DISEASE ................................................................ 41
1.3.3 CORTICAL ABNORMALITIES IN DYSTONIA AS REVEALED BY TMS AND THEIR
INTERPRETATION.............................................................................................. 43
LOSS OF INHIBITION IN DYSTONIA ....................................................................... 44
PLASTICITY IN DYSTONIA ................................................................................... 44
NEUROANATOMICAL NETWORK OF DYSTONIA ...................................................... 47
1.4. AIM OF THE PHD STUDY ............................................................................. 49
CHAPTER 2 GENERAL METHODS ................................................................ 50
2.1. PARTICIPANTS .......................................................................................... 50
2.2. ELECTROMYOGRAPHIC RECORDINGS .......................................................... 51
2.3. TRANSCRANIAL MAGNETIC STIMULATION ..................................................... 52
2.3.1. CORTICOSPINAL EXCITABILITY ................................................................. 52
2.3.2. INTRACORTICAL INHIBITION ...................................................................... 53
2.4. PAIRED ASSOCIATIVE STIMULATION ............................................................ 53
2.5 STATISTICAL ANALYSIS ............................................................................... 54
CHAPTER 3 INTERHEMISPHERIC ASYMMETRY IN SENSORIMOTOR
CORTICAL PLASTICITY AND INTRACORTICAL INHIBITION IN EARLY
PARKINSON’S DISEASE ................................................................................ 55
7
3.1 SUMMARY ................................................................................................. 56
3.2. INTRODUCTION .......................................................................................... 56
3.3 METHODS .................................................................................................. 58
3.3.1 PARTICIPANTS ........................................................................................ 58
3.2 EMG RECORDINGS AND TMS ..................................................................... 60
3.3.3 EXPERIMENTAL DESIGN ........................................................................... 60
3.3.4 STATISTICAL ANALYSIS ............................................................................ 62
3.4. RESULTS .................................................................................................. 63
3.4.1 CLINICAL AND DEMOGRAPHICAL DATA........................................................ 63
3.4.2 CORTICOSPINAL EXCITABILITY AND EMG ROOT MEAN SQUARE AMPLITUDE ... 63
3.4.3 SICI....................................................................................................... 64
3.4.4 ICF ........................................................................................................ 67
3.4.5 CSP ...................................................................................................... 68
3.4.7 EFFECT OF PAS ON CSP ........................................................................ 76
3.5 DISCUSSION .............................................................................................. 78
CHAPTER 4 CHANGES IN SENSORIMOTOR CORTICAL PLASTICITY AND
INTRACORTICAL INHIBITION WITH PROGRESSION OF PARKINSON’S
DISEASE: REVEALING COMPENSATORY MECHANISMS .......................... 82
4.1. SUMMARY................................................................................................. 83
4.2. INTRODUCTION .......................................................................................... 83
4.3. METHODS ................................................................................................. 85
4.3.1. PATIENTS .............................................................................................. 85
4.3.2. CLINICAL MEASURES ............................................................................... 89
4.3.3. EMG RECORDINGS AND TMS ................................................................. 89
4.3.4. EXPERIMENTAL DESIGN........................................................................... 89
8
4.3.5 STATISTICAL ANALYSIS ............................................................................ 91
4.4. RESULTS .................................................................................................. 93
4.4.1. CLINICAL MEASURES ............................................................................... 93
4.4.2. BASELINE CORTICOSPINAL EXCITABILITY ................................................... 95
4.4.3. SICI...................................................................................................... 97
4.4.4. ICF ....................................................................................................... 99
4.4.5. CSP ................................................................................................... 100
4.4.6 PAS .................................................................................................... 103
4.4.7 TREATED VS. UNTREATED PATIENTS AND EARLY VS. LATE TREATED PATIENTS
.................................................................................................................... 106
4.5. DISCUSSION ........................................................................................... 106
CHAPTER 5 MODULATION OF SENSORIMOTOR CORTICAL PLASTICITY
WITH BOTULINUM TOXIN INJECTIONS IN PRIMARY DYSTONIA ............ 113
5.1 SUMMARY ............................................................................................... 113
5.2 INTRODUCTION ......................................................................................... 114
5.3 METHODS ................................................................................................ 116
5.3.1 PARTICIPANTS ...................................................................................... 116
5.3.2 EMG RECORDINGS AND TMS ................................................................ 118
5.3.3 EXPERIMENTAL DESIGN ......................................................................... 119
5.4 RESULTS ................................................................................................. 122
5.4.1 CLINICAL EFFECT OF BT INJECTIONS ....................................................... 122
5.4.2 BT INJECTIONS INTO NECK MUSCLES DO NOT MODIFY BASELINE CORTICAL-
SPINAL EXCITABILITY ...................................................................................... 122
5.4.3 BT INJECTIONS REDUCE RPAS RESPONSE IN APB AND FDI MUSCLES ....... 124
9
5.4.4 RPAS AND BT DO NOT MODIFY INTRACORTICAL EXCITABILITY AND SENSORY
AFFERENT INHIBITION FROM HAND MUSCLES ..................................................... 127
5.4.5 RPAS INDUCED PLASTICITY CORRELATES WITH DYSTONIA SEVERITY AND TIME
AFTER PREVIOUS BT TREATMENT .................................................................... 128
5 5 DISCUSSION............................................................................................. 130
CHAPTER 6 PATHOPHYSIOLOGICAL DIFFERENCES BETWEEN
SECONDARY AND PRIMARY DYSTONIAS: THE ROLES OF CORTICAL
PLASTICITY AND INTRACORTICAL INHIBITION ........................................ 134
6.1 SUMMARY ............................................................................................... 135
6.2 INTRODUCTION ......................................................................................... 136
6.3 METHODS ................................................................................................ 138
6.3.1 PARTICIPANTS ...................................................................................... 138
6.3.2 EMG RECORDINGS AND TMS ................................................................ 142
6.3.3 EYE BLINK CLASSICAL CONDITIONING (EBCC) ......................................... 142
6.3.4 EXPERIMENTAL DESIGN ......................................................................... 143
6.3.5 STATISTICAL ANALYSIS .......................................................................... 146
6.4 RESULTS ................................................................................................. 147
6.4.1 CLINICAL AND DEMOGRAPHICAL DATA...................................................... 147
6.4.2 CORTICOSPINAL EXCITABILITY AND EMG ROOT MEAN SQUARE AMPLITUDE . 148
6.4.3 SICI..................................................................................................... 151
6.4.4 CSP .................................................................................................... 153
6.4.5 PAS .................................................................................................... 154
6.4.6 EBCC .................................................................................................. 160
6.5 DISCUSSION ............................................................................................ 162
10
CHAPTER 7 GENERAL DISCUSSION AND CONCLUSION ........................ 170
7.1. FURTHER STUDIES .................................................................................. 173
7.1.1 DELINEATING THE MECHANISM OF INCREASED CORTICAL PLASTICITY IN PD 173
7.1.2 THERAPEUTIC USE OF TMS IN PD .......................................................... 175
7.1.3 FURTHER DEFINING THE ROLE OF CORTICAL PLASTICITY IN DYSTONIAS ....... 176
7.2 METHODOLOGICAL “LESSON”: RESOLVING CONTROVERSIES ......................... 177
7.3. GENERAL LIMITATIONS OF THE STUDIES ..................................................... 179
7.4 CONCLUSIONS ......................................................................................... 180
APPENDIX 1: PUBLICATIONS DURING PHD PERIOD RELATED TO THIS THESIS .... 182
APPENDIX 2: OTHER PUBLICATIONS DURING PHD PERIOD .............................. 183
REFERENCES ............................................................................................... 186
11
LIST OF TABLES
TABLE 3.1 CLINICAL AND DEMOGRAPHIC CHARACTERISTICS OF PARKINSON'S DISEASE
PATIENTS ..................................................................................................... 59
TABLE 3.2 GROUP COMPARISONS OF PAS EFFECT IN APB AND ADM MUSCLE ......... 71
TABLE 4.1 DEMOGRAPHIC AND CLINICAL CHARACTERISTICS OF THE PATIENTS AND
TREATMENT DATA ......................................................................................... 87
TABLE 5.1 CLINICAL FEATURES OF PATIENTS WITH PRIMARY DYSTONIA .................. 117
TABLE 6.1 CLINICAL AND DEMOGRAPHIC CHARACTERISTIC OF SECONDARY DYSTONIA
PATIENTS ................................................................................................... 140
TABLE 6.2 CLINICAL AND DEMOGRAPHIC CHARACTERISTIC OF PRIMARY DYSTONIA
PATIENTS ................................................................................................... 141
TABLE 6.3 STATISTICS OF EYE-BLINK CLASSICAL CONDITIONING (MANN-WHITNEY U
TESTS) ...................................................................................................... 159
LIST OF FIGURES
FIGURE 3.1 EXPERIMENTAL DESIGN ...................................................................... 61
FIGURE 3.2 SHORT INTERVAL INTRACORTICAL INHIBITION ........................................ 65
FIGURE 3.3 CORRELATION ANALYSIS BETWEEN SICI AND CLINICAL SEVERITY OF PD . 66
FIGURE 3.4 INTRACORTICAL FACILITATION AT ISI 15 MS .......................................... 67
FIGURE 3.5 CORTICAL SILENT PERIOD DURATION AT BASELINE ................................ 68
FIGURE 3.6 PAS EFFECT ON CORTICOSPINAL EXCITABILITY, AS MEASURED BY CHANGE
IN 1MV MEP AMPLITUDE IN APB MUSCLE ....................................................... 72
12
FIGURE 3.7 PAS EFFECT ON CORTICOSPINAL EXCITABILITY, AS MEASURED BY CHANGE
IN 1MV MEP AMPLITUDE IN ADM MUSCLE. ..................................................... 73
FIGURE 3.8 CORRELATION BETWEEN PAS INDUCED PLASTICITY IN APB MUSCLE AND
THE CLINICAL SEVERITY OF PD ...................................................................... 75
FIGURE 3.9 THE EFFECT OF PAS ON CSP DURATION ............................................. 77
FIGURE 4.1 FOLLOW UP STUDY DESIGN ............................................................. 90
FIGURE 4.2 CHANGE IN CLINICAL MEASURES .......................................................... 94
FIGURE 4.3 IO CURVE- CHANGE OVER 12 MONTHS ................................................ 96
FIGURE 4.4 SHORT INTERVAL INTRACORTICAL INHIBITION—CHANGE OVER 12 MONTHS
................................................................................................................... 98
FIGURE 4.5 INTRACORTICAL FACILITATION— CHANGE OVER 12 MONTHS .................. 99
FIGURE 4.6 CORTICAL SILENT PERIOD— CHANGE OVER 12 MONTHS ...................... 101
FIGURE 4.7 WITHIN-SUBJECTS CORRELATION BETWEEN CHANGE IN UPDRS
ASYMMETRY INDEX AND CHANGE IN CSP INTERHEMISPHERIC RATIO ................ 102
FIGURE 4.8 CHANGE OF PAS RESPONSE ............................................................ 104
FIGURE 4.9 WITHIN-SUBJECTS CORRELATION BETWEEN CHANGE IN UPDRS
ASYMMETRY INDEX AND CHANGE IN PAS INTERHEMISPHERIC RATIO. ............... 105
FIGURE 5.1 EXPERIMENTAL DESIGN .................................................................... 120
FIGURE 5.2 EFFECT OF BT INJECTIONS ON THE IO CURVE .................................... 123
FIGURE 5.3 EFFECT OF BT INJECTIONS ON THE RPAS RESPONSE ......................... 126
FIGURE 5.4 EFFECT OF RPAS AND BT INJECTIONS ON SAI AND LAI ...................... 127
FIGURE 5.5 CORRELATION BETWEEN RPAS INDUCED PLASTICITY OF THE PRIMARY
MOTOR CORTEX AND TIMING OF PREVIOUS BT INJECTION OR CLINICAL SYMPTOMS
OF DYSTONIA. ............................................................................................ 129
FIGURE 6.1 EXPERIMENTAL DESIGN .................................................................... 145
13
FIGURE 6.2 IO CURVES ...................................................................................... 149
FIGURE 6.3 IO CURVES IN AFFECTED AND NON-AFFECTED SIDE IN SECONDARY
DYSTONIA PATIENTS .................................................................................... 150
FIGURE 6.4 SHORT-INTERVAL INTRACORTICAL INHIBITION ..................................... 152
FIGURE 6.5 CORTICAL SILENT PERIOD ................................................................ 153
FIGURE 6.6 PAS EFFECT ON CORTICOSPINAL EXCITABILITY, AS MEASURED BY CHANGE
IN 1MV MEP AMPLITUDE IN APB ................................................................. 155
FIGURE 6.7 PAS EFFECT ON CORTICOSPINAL EXCITABILITY, AS MEASURED BY CHANGE
IN 1MV MEP AMPLITUDE IN ADM ................................................................ 156
FIGURE 6.8 PAS RESPONSE ON AFFECTED AND NON-AFFECTED SIDE IN SECONDARY
DYSTONIA PATIENTS .................................................................................... 157
FIGURE 6.9 AVERAGED PAS RESPONSE IN INDIVIDUAL PARTICIPANTS. ................... 158
FIGURE 6.10 EYE BLINK CLASSICAL CONDITIONING (EBCC) ................................ 161

14
ACKNOWLEDGEMENTS
I am sincerely grateful to my supervisors Professor Kailash Bhatia and
Professor John Rothwell for their inspiration, constant advice and great support.
For his guidance and enormous patience, I am thankful to Mark Edwards. I also
acknowledge Professor Zvezdan Pirtosek from Ljubljana, for being encouraging
and for providing me conditions to leave for London and undertake my PhD
degree.
I would also like to thank all the study participants for their time, and to thank my
various co-workers and research collaborators for their help with data gathering
and for their input into papers we had written together: Panagiotis Kassavetis,
Isabel Parees, Matteo Bologna, Tabish Saifee, Anna Sadnicka, Ignacio Rubio
Agusti and Professor Alfredo Berardelli.
Finally, I want to thank my husband Matej and my son Aljosa for their unselfish
support and for being full of understanding when they had to do without me
while I worked through my PhD. Finally, I thank my parents for a lifetime of
encouragement and support and my sister Tijana who has been an example for
enduring learning and education to me.
15
THESIS OVERVIEW
Through the series of TMS experiments detailed in Chapters 3-6, this PhD
thesis explores the pathophysiological aspects of sensorimotor cortical plasticity
and other electrophysiologic measures in PD and dystonia.
Chapter 1 introduces the concept of brain plasticity and discuss how changes in
plasticity may be relevant not only as mechanisms for compensation of
neurological symptoms, but also as mechanism that cause or contribute to
disease. This chapter introduces the techniques of TMS which are used to
investigate PD and dystonia and then critically reviews current knowledge on
electrophysiological abnormalities in both diseases.
Chapter 2 presents general methods used in the experiments described in
Chapters 3-6.
Chapter 3 presents the study in which the inherent model of the clinically
asymmetry of PD was used to compare electrophysiological measures between
the two hemispheres. Sensorimotor cortical plasticity and intracortical inhibition
were compared between the more and less affected sides in drug-naïve
clinically asymmetric PD patients. It was found that the less affected
hemisphere had increased cortical plasticity and preserved intracortical
inhibition, while these were decreased on the more affected side.
16
In chapter 4 the follow-up study of the same PD patients described in Chapter 3
is presented, which aimed to define pathophysiological significance of functional
cortical reorganisation in early PD. We investigated the relationship between the
changes in electrophysiological measures and the progression of motor signs.
Based on the results, we put forward the hypothesis that there is a
compensatory role for increased sensorimotor cortical plasticity in the early
stages of PD.
Chapter 5 describes set of experiments in patients with primary dystonia,
intended to explore whether or not the response to TMS plasticity protocol is
affected by the manipulation of the afferent input with botulinum toxin (BT)
injections. The study found that the plasticity response decreased with
successful BT injections and then recovered as the injections wore off. We
propose that modulation of sensory afferent input by BT injections triggered
subsequent reorganization of the motor cortex representation of the hand
muscles, resulting in reduced sensorimotor cortical plasticity.
Chapter 6 presents the study in which we explored whether or not the primary
dystonia and secondary dystonia (caused by basal ganglia lesions) share the
same pattern of electrophysiological abnormalities. This study reveals that
secondary dystonia patients have a normal response to experimental plasticity
protocols as opposed to an enhanced response in primary dystonia patients. It
also reveals differences in cerebellar functional involvement between primary
and secondary dystonias.

17
Each of the experimental chapters 3-6 leads on to its own discussion regarding
their relevance to previous work, study limitations and new insights into
sensorimotor cortical plasticity which they provide.
In the final chapter, the overall conclusions are drawn from the whole work.
Ideas are made about the possible clinical applications of the presented findings
and also regarding directions for further work in the field.
18
LIST OF ABBREVIATIONS
AMT Active Motor Threshold
APB Abductor Pollicis Brevis
BFM Burke-Fahn-Marsden
BG Basal ganglia
BT Botulinum toxin
CD cervical dystonia
CR conditioned response
CS conditioning stimulus
CSP Cortical silent period
DAT dopamine transporter
DBS Deep brain stimulation
FDG-PET [18F]-fluorodeoxyglucose PET
FDI First Dorsal Interosseous
FP Field Potential
GABA γ-aminobutyric acid
19
GPi internal Globus Pallidus
HFS High-frequency stimulation
ICF Intracortical facilitation
IO curve Input-Output curve
ISI Interstimulus interval
LA less affected side
LICI Long interval intracortical inhibition
LFS Low-frequency stimulation
LTD Long Term Depression
LTP Long Term Potentiation
M1 Primary motor cortex
MA more affected side
MEP Motor Evoked Potential
MT Motor Threshold
NMDA N-methyl-d-aspartate
PAS Paired Associative Stimulation
20
PAS25 excitatory PAS
PD Parkinson’s disease
SI Stimulus intensity
SICI Short interval intracortical inhibition
STDP Spike-timing dependent plasticity
iTBS intermittent Theta Burst Stimulation
TMS Transcranial Magnetic Stimulation
rTMS repetitive Transcranial Magnetic Stimulation
UPDRS Unified Parkinson’s disease Rating Scale
US unconditioining stimulus
21
Introduction Chapter 1
1.1. Brain plasticity
Plasticity is a fundamental brain property retained throughout the lifespan,
enabling the brain to modify its structure and function in response to learning
and experience, aging, injury or chronic disease. It can be defined as an ability
of a system to change in response to different external and internal stimuli and
to remain in such a new state until the next event occurs. The concept of brain
plasticity is essential to understand not only psychological brain functions such
as memory, learning or acquisition of a new motor skill but also to understand
the pathophysiology of common neuropsychiatric diseases (Pascual-Leone et
al., 2005).
1.1.1 Adaptive plasticity vs. maladaptive plasticity in brain disorders
Brain plasticity is perhaps best described as the double edge sword with its
potential beneficial and detrimental behavioural consequences.
In the context of neurological diseases, plasticity may be regarded as adaptive if
it helps recovery of impaired brain function. Adaptive brain plasticity mainly
comes into play after acute brain events such as stroke, traumatic or perinatal
brain injury or following sensory deprivation, when functional (and structural)
brain reorganisation help in improving the neurological deficit. In the stroke
22
literature, “brain plasticity” usually encompasses all possible mechanisms of
neuronal reorganisation following ischaemic injury. From anatomical to cellular
level it includes: recruitment of pathways that are functionally homologous to,
but anatomically distinct from the damaged ones (for example, non-pyramidal
corticospinal pathways), reinforcement of existing but functionally silent synaptic
connections (at the periphery of the damaged core), dendritic arborisation,
formation of new synapses and increase of synaptic strength (Rossini et al.,
2003). One of the best known examples of adaptive plasticity after sensory
deprivation is recovery of vision in children with acquired amblyopia caused by
strabismus. Selection of visual input from one eye causes a loss of cortical
synaptic connections assigned to the other eye. However, patching the opposite
“healthy” eye leads to improved vision in the impaired eye if this is attempted
within the period of maximal visual plasticity in the first decade of life (Johnston,
2004). The recovery in vision is possible due to reorganization of connections
within previously deprived visual cortex.
Although the concept of adaptive plasticity has mainly been related to acute
brain events, similar processes may have a role in chronic neurological
diseases, where plasticity may be considered as adaptive if it compensates for
symptoms or symptom progression. For example, in the preclinical stages of PD
or Alzheimer dementia, compensatory processes may help postpone the
emergence of motor signs or cognitive symptoms, respectively (Zigmond, 1997,
Bezard et al., 2003). The assumption is that disease symptoms will first appear
when the adaptive changes become insufficient to keep up with ongoing cell
loss. Even in the symptomatic stage, when the disease continues to progress,
23
worsening of symptoms may be viewed as a “trade off” between the
compensatory changes and the functional/structural consequences of
neurodegeneration.
In contrast, brain plasticity is regarded as maladaptive when it causes or
contributes to disease symptoms and/or their progression. Maladaptive
plasticity has been implicated in various neurodevelopmental disorders,
psychiatric diseases and adult onset neurological diseases. For example, in
children with autistic spectrum disorders, several lines of evidence including
findings of TMS studies, point to altered plasticity as the mechanism by which
motor and cognitive behaviours are affected in these patients (Enticott and
Oberman, 2013). In schizophrenia, impairment of synaptic plasticity has been
shown to be associated with impaired motor skill teaching (Daskalakis et al.,
2008). The opinions about the role of plasticity in Alzheimer dementia have
been divided with some authors suggesting that alteration of synaptic plasticity
antedate cognitive impairment and contribute to the maladaptive molecular
cascade culminating in the manifestation of dementia (Pascual-Leone et al.,
2011). Finally, it is believed that abnormally enhanced motor cortex plasticity
contributes to the pathophysiology of dystonia in such a way that a subtle
abnormality of plasticity may make some individuals susceptible to dystonia if
plastic changes are pushed to their extreme by frequent repetition of particular
movements (Quartarone et al., 2003).
24
1.1.2 Proposed mechanism of synaptic plasticity
Modulation of synaptic strength is believed to be a common mechanism of brain
plasticity, shared between physiological forms of plasticity such as memory and
learning and pathological forms of plasticity underlying neurological diseases.
In 1949, Donald Hebb introduced a theory of modification of synaptic strength.
In his postulate on the cellular basis for learning, Hebb stated that “when an
axon of cell A is near enough to excite a cell B and repeatedly or persistently
takes part in firing it, some growth process or metabolic change takes place in
one or both cells such that A’s efficiency, as one of the cells firing B, is
increased” (Hebb, 1949). According to Hebbian’s rule, repeated simultaneous
activity in pre- and postsynaptic neuron results in an increase of synaptic
efficacy, a process known as long term potentiation or LTP. Stent (1973)
proposed an addition to Hebbian’s rule, considering that connections would
weaken when a presynaptic neuron is active at the same time as the post
synaptic neuron is inactive. The processes that decrease synaptic efficacy are
referred to as long term depression or LTD. Nowadays, these two postulates
are epitomised in the rule of Spike Timing Dependent Plasticity (STDP) that
appears to mediate some forms of experience-dependent plasticity in vivo. In
STDP, both the temporal order and the interval between pre- and postsynaptic
spikes are important, so that LTP and LTD are induced when there are tight
temporal correlations between the spikes of pre- and postsynaptic neurons This
form of synaptic plasticity has been studied extensively in a range of models,
including cultured neurons (Bi and Poo, 1998), cortical slice preparations
25
(Magee and Johnston, 1997) and intact animals (Jacob et al., 2007). In a typical
STDP protocol, a synapse is activated by stimulating a presynaptic neuron (or
presynaptic pathway) shortly before or shortly after making the postsynaptic
neuron fire by injection of a short current pulse. This pairing is repeated 50-100
times at a fixed frequency. A number of studies have confirmed the importance
of the temporal order of pre- and postsynaptic spiking in synaptic modification
(Magee and Johnston, 1997, Bi and Poo, 1998, Caporale and Dan, 2008).
LTP can also be produced using high-frequency stimulation (HFS) of
presynaptic afferents (Bliss and Lomo, 1973), whereas LTD may be produced
by low- frequency stimulation (LFS) of presynaptic afferents. In brain slice
preparations synaptic plasticity may be quantified as a change of field potential
(FP) following experimental stimulation. For example, in a motor cortex slice,
stimulating microelectrodes are placed in cortical layer II/II and FP ( which is
analogue to excitatory post-synaptic potential) is recorded before and after the
conditioning “plasticity” protocol. The change in the FP size is a measure of
synaptic plasticity.
1.1.2 Cellular mechanisms of synaptic plasticity
At excitatory glutamatergic synapses, the induction of LTP by HFS and LTD by
LFS both require the activation of N-methyl-d-aspartate (NMDA) receptors and
a rise in the postsynaptic Ca2+ level (Malenka and Bear, 2004). The
presynaptic activation causes glutamate release while postsynaptic
depolarization causes removal of the Mg2+ block on NMDA receptors, these
26
two processes together allowing Ca2+ influx. The amount and time course of
postsynaptic Ca2+ rise depend on the induction protocol: HFS leads to fast,
large Ca2+ influx, whereas LFS leads to prolonged, modest Ca2+ rise (Luscher
and Malenka, 2012). In the Ca2+ hypothesis these two types of Ca2+ signals
cause the activation of separate molecular pathways. Activation of
Ca2+/calmodulin-dependent protein kinase II by a large Ca2+ rise is required
for LTP, whereas recruitment of phosphatases such as protein phosphatase 1
and calcineurin by a modest Ca2+ increase is the basis for LTD (Luscher and
Malenka, 2012).
Spike timing–dependent LTP and LTD also depend on NMDA receptor
activation and the rise in postsynaptic Ca2+ level. However, LTP and LTD are
not universal phenomena as the rules may differ in their details from one cell to
another. Even at a single synapse, LTP produced by different patterns of
stimulation may not be the same. In addition plasticity may also occur at striatal
metabotropic receptors (Gubellini et al., 2004), AMPA receptors and there may
also be plasticity at GABA synapses (Maffei, 2011).
1.2 Probing and measuring plasticity “in vivo”
Plasticity changes in humans are best demonstrated through behavioural
changes (for example using learning and memory tasks), but may also be
captured using neuroimaging and electrophysiological techniques. For instance,
changes in functional activity and anatomical connectivity may be demonstrated
with neuroimaging techniques, but it should be noted that imaging will reveal
27
presumable anatomical or functional consequences of brain plasticity, rather
than directly probing the mechanisms of plasticity. More direct measures of
synaptic plasticity in humans in vivo are obtained using TMS, when TMS is
applied as a plastic force and the brain tendency to undergo plastic changes is
then quantified.
1.2.1 Transcranial magnetic stimulation: magnetic induction as a non-
invasive way to electrically stimulate the brain
The first attempts to electrically stimulate the human brain through intact scalp
were made by Gualtierotti and Paterson (1954). They applied trains of stimuli
over the scalp to induce motor responses in the contralateral limb. With their
technique most of the current was lost by spreading through the scalp and only
a small fraction reached the brain, resulting in painful and non-efficacious
stimulation. Merton and Morton (1980) later introduced clinically more feasible
method of transcranial electrical stimulation. They used a single high-voltage
electrical pulses rather than a train of smaller pulses, which resulted in better
penetration of the electrical current into the brain and relatively smaller current
flow through the scalp, thus giving a more efficacious cortical stimulus. With this
technique, stimulation over the motor cortex produced a twitch of contralateral
body muscles and stimulation of visual cortex produced phosphenes. However,
the pain was still strong enough to prevent wider clinical use. Finally, Barker et
al. (1985) developed TMS, a technique for non-invasive and relatively painless
stimulation of human motor cortex. Since then, TMS has been used extensively
to study motor control in health and disease.
28
TMS relies on the principle of electromagnetic induction. A brief electrical
current is passed through an insulated coil of wires placed over the scalp. This
current generates a brief transient magnetic field running perpendicularly to the
coil. Due to the low impedance of the scalp, skull and meninges, the magnetic
field passes readily and without causing pain into the brain where it induces
electric currents within the cortex. This induced electric current then activates
cortical elements, resulting in an action potential or excitatory postsynaptic
potential. In the motor cortex, a TMS pulse may activate corticospinal neurons
directly, producing a “direct” volley of impulses in corticospinal axons ( “D”
‘wave ) or more commonly indirectly through transynaptic connections with
cortical interneurons , producing an “indirect “volley of impulses( “I”‘ waves )(Di
Lazzaro et al., 2004). The descending volley of action potentials in the
corticopinal tract triggered by TMS ultimately activates target muscles. This can
be seen as a muscle twitch and is detected by electromyography (EMG) as a
motor evoked potential (MEP). Thus, when TMS is given over the motor cortex,
the amplitude of the MEP is an indirect measure of motor cortex excitability.
Similarly, the change in the MEP after applying a TMS plasticity inducing
protocol is used as a measure of synaptic plasticity in the motor cortex.
When a figure-of-eight coil is held in such a direction that the TMS pulse causes
electrical current to flow in a posterior-anterior direction perpendicular to the
central sulcus, then corticospinal neurons are activated transynaptically and
with a lower threshold. This propensity of TMS to activate corticospinal neurons
transynaptically means that the response to TMS will depend on the level of
excitability of cortical neurons at the time of stimulation. Indeed, it is this
29
tendency for transynaptic activation of corticospinal neurons that makes TMS a
suitable technique for testing the excitability of intracortical synapses before and
after experimental plasticity protocols.
1.2.2 TMS measures of corticospinal excitability: Motor thresholds and
Input-output curve
The intensity of stimulation is expressed as a percentage of maximum
stimulator output which may be adjusted in 1% gradations up to 100%. This
allows for quantitative definition of corticospinal excitability in terms of the motor
threshold (MT), which is defined as the lowest stimulus intensity (SI) at which
MEP can be recorded in the target muscle. Thus, MT is expressed as a
percentage of the maximal stimulator output and can be measured from relaxed
muscle (resting motor threshold-RMT) or voluntary preactivated muscles (active
motor threshold-AMT).
With increasing SI, MEP amplitude increases, allowing for the assessment of
“Input-Output” (IO) curve. IO curve thus describes a relationship between
intensity of stimulation and amplitude of MEPs. While MT gives information
about the most excitable neurons in the representation of the target muscle, the
IO curve assesses less excitable neurons, which will be activated with higher SI
( neurones with a higher threshold for firing) and those more distant from the
centre of the TMS coil (Hallett et al., 1999) . In healthy subjects, the shape of
IO curve is approximately sigmoidal and its main features are steepness and
plateau level.
30
1.2.3 TMS measures of intracortical inhibition and facilitation
The excitability of different intracortical interneurons within the primary motor
cortex (M1) may be probed using TMS paired pulse techniques. Paired pulse
experiments involve applying two stimuli, the test stimulus and the conditioning
stimulus, separated in time by a varying interstimulus interval (ISI). If a
suprathreshold test stimulus over M1 is preceded by a conditioning stimulus
over the same cortical area, intracortical inhibition or facilitation may be tested,
depending on ISI. The explanation is that the conditioning stimulus activates
inhibitory or excitatory interneurons synapsing with corticospinal neurons and,
depending on the ISI and on the intensity of the conditioning stimulus, the test
response is either inhibited or facilitated. Several measurements of intracortical
inhibition and facilitation can be probed using paired-pulses techniques,
including short interval intracortical inhibition (SICI), intracortical facilitation
(ICF), and long interval intracortical facilitation (LICI). TMS paired-pulse
techniques thus allow the testing of the functional state of different types of
intracortical interneurons. Cortical inhibitory and excitatory phenomena are
subserved by different pools of interneurons: SICI is likely mediated by GABAa
(Ziemann et al., 1996), ICF by NMDA (Ziemann et al., 1998c) and LICI by
GABAb receptors (Werhahn et al., 1999).
Cortical silent period (CSP) is another measure of intracortical inhibition. When
a TMS stimulus is delivered during voluntary contraction of a target muscle, a
period of EMG silence follows the MEP (Calancie et al., 1987). Although spinal
inhibitory mechanism may contribute to the early part of the cortical silent period
31
(up to its first 50 ms of duration), the later part is generated within the inhibitory
circuits of the motor cortex. CSP is presumably mediated through GABAb
receptors (Ziemann, 2004).
1.2.4 TMS as experimental plastic force
If the train of repeated TMS pulses is given over the target cortical area for a
period of time (repetitive or rTMS), it is possible to induce changes in cortical
excitability that outlast the period of stimulation and these are considered to
reflect brain plasticity. If rTMS is used over the M1, the measure of plasticity is
the change in MEP size that occurs after stimulation and that outlast the period
of stimulation for minutes to hours. As a general rule, high frequency stimulation
protocols (5 Hz and above) are excitatory, producing an increase in
corticospinal excitability, while low frequency protocols (1-5 Hz) are inhibitory,
resulting in a decrease of corticospinal excitability (Ziemann et al., 2008).
The major limitation of high frequency excitatory TMS protocols is in their
potential for triggering epileptic seizures, especially if frequencies of 20 Hz and
above are used (Wassermann et al., 1996). This issue is relevant, given that
much higher frequencies (in the range 50-100 Hz) are used in brain slices for
LTP induction. A number of other experimental TMS plasticity protocols have
been invented to by-pass the problem of high frequency stimulation. The one
that has been extensively used previously in both PD and dystonia and that I
have used consistently through my work is paired associative stimulation (PAS).
32
1.2.5 Paired associative stimulation
The PAS comprise of repeated pairing of sensory afferent stimulus with TMS
stimulus and relies on the principle of sensorimotor integration within the M1.
Stimulation of M1 with TMS activates corticospinal neurons trans-synaptically
via interneurons (Di Lazzaro et al., 2004) .The same corticospinal neurons or
the interneurons within the same microcolumn projecting onto corticospinal
neurons receive somatosensory input (at short latency and with high
topographical specificity ) via afferents from the somatosensory cortex (Rosen
and Asanuma, 1972). Repeated pairing of a TMS stimulus over the cortical
representation of the target muscle and an afferent stimulus evoked by
electrical stimulation of the mixed peripheral nerve supplying the same target
muscle may induce plastic changes, if the pairing of pulses converges on the
corticospinal neurons in a precisely timed fashion (Muller-Dahlhaus et al.,
2010). In the original experiment , PAS consisted of electrical stimulation of the
median nerve at the wrist and a TMS stimulus over the hot spot for the APB
muscle in the contralateral M1, with median nerve stimulation preceding TMS
at an ISI of 25 ms (PAS25) (Stefan et al., 2000). This interval was chosen on
the basis that the first component (N20) of the median nerve somatosensory-
evoked potential arrives in the primary somatosensory cortex typically at around
20 ms (Allison et al., 1991) with a few extra milliseconds added on to allow for
the afferent signal to be relayed from S1 to M1. Thus, the afferent signal evoked
by median nerve electrical stimulation arrives in M1 synchronously, or shortly
before transanssynaptic excitation of corticospinal neurons by the TMS pulse.
The intensity of median nerve electrical stimulation was three times the
33
perceptual sensory threshold, while TMS intensity was adjusted to evoke MEPs
of approximately 1 mV peak-to-peak amplitude. 90 pairs of median nerve
electrical stimulation and TMS were given at a frequency of 0.05 Hz, the
protocol lasting 30 minutes. Several modifications to this original protocol have
been introduced, consisting of increased frequency of stimulation, with an aim
to reduce the duration of stimulation. A rapid-rate paired associative stimulation
introduced by Quartarone (2006a) is a variant of PAS with pairing of pulses at a
rate of 5 Hz. Due to the higher frequency of stimulation, this protocol is shorten
to only 2 min.
In a typical PAS experiment, the excitability of the hand motor area is first
probed by single TMS pulses over the “hot spot” for a chosen muscle and 1-mV
MEPs are recorded. PAS is then delivered. The measure of plasticity is the
change in 1mV-MEP size when probed using the same TMS intensity as given
before PAS. The PAS induced plasticity lasts for at least 30–60 min and shows
a characteristic topographical specificity to the muscles innervated by the
stimulated peripheral nerve (Stefan et al., 2000). The exact timing of the
afferent pulses and TMS pulses is important in determining the direction of
changes of cortical excitability. MEP amplitudes increase when TMS activation
of corticospinal neurons follows activation of same neural elements by afferent
stimulus after a few milliseconds. If however, the afferent stimulus arrives later
than TMS stimulus, a reversal of the effect occurs. If an ISI of 10 ms (PAS10) is
used, this results in depression of MEPs (Wolters et al., 2003). Thus, PAS is
considered to be a non-invasive brain stimulation paradigm that probes STDP.
34
1.2.6 Between-subject and within-subject variability of TMS measures
It should be noted that even in neurologically normal subjects, there is variability
in the neurophysiological and behavioural response to brain stimulation
protocols (between-subject variability). As opposed to SICI which shows
significant variability in the same subjects on repeated testing (within-subject
variability) (Wassermann, 2002), the within-subject variability of the CSP is low,
typically less than 10 % (Kukowski and Haug, 1992, Orth and Rothwell, 2004).
This implies that longitudinal measurements of the CSP may be a sensitive
electrophysiological marker of disease progression.
Regarding PAS, the number of non-responder among healthy subjects is
considered to be between 25 and 40% (Stefan et al., 2004, Stinear and Hornby,
2005, Fratello et al., 2006, Muller-Dahlhaus et al., 2008).The cause of this
variability, although not completely understood, is thought to be genetically
determined (Missitzi et al., 2011) but also depends on other factors, including
attention, the subjects age and hormonal levels.(Stefan et al., 2002, Inghilleri et
al., 2004, Muller-Dahlhaus et al., 2008, Sale et al., 2008). However, there is
much less quantitative data on the reproducibility of the PAS effect in the same
subjects on repeated testing (Fratello et al., 2006, Sale et al., 2007). Although
observations from these few studies have not been conclusive, the within-
subject variability seems to be lower than between-subject variability. This is
also suggested by the fact that the same “responders” are typically repeatedly
selected for different studies as noted in several papers (Stefan et al., 2004,
Sale et al., 2007).
35
1.2.7 Interhemispheric balance of TMS measures
It is important to note for the purpose of the studies presented here, that
healthy subjects show no significant interhemispheric differences in TMS
parameters of baseline corticospinal excitability such as MTs, IO curves;
measures of intracortical inhibition and response to PAS protocol (Cicinelli et
al., 1997, Priori et al., 1999, Ridding and Flavel, 2006). Therefore, these TMS
measures may serve as sensitive markers of lateralised cortical pathology.
1.3 The contribution of TMS in revealing pathophysiology of
Parkinson’s disease and dystonia
PD and dystonia are BG diseases, with opposed clinical manifestation of
hypokinetic and hyperkinetic movement disorder, respectively. Both diseases
arise as a consequence of abnormal (disease specific) BG output, which
through the thalamus reaches the motor cortex, thus affecting the motor
commands for muscle activation in simple and complex movements. The BG
are deep structures and as such are inaccessible for non-invasive recordings.
Considerable knowledge of the pathophysiology of both diseases has been
gained by recording from circuits that are under direct or indirect control of the
BG, but are reachable for conventional recording techniques. In particular, TMS
has gained momentum in studying cortical pathophysiology related to BG
diseases. This is conceivable because the motor cortex gives a final output for
all voluntary and most involuntary movements, being under the influence of
convergent inputs from the BG, cerebellum and peripheral afferents.
36
Electrophysiological changes at cortical, brainstem and spinal cord level and
within cerebellar circuits have been described in PD and dystonia. Although
these have contributed to our understanding of the pathophysiology of both
diseases, it is somewhat surprising that these two disorders commonly share
the same pattern of electrophysiological abnormalities, even though they are at
opposite ends of the spectrum of movement disorders, with PD having “too
little” and dystonia “too much “movement. For example, decreased intracortical
inhibition (Ridding et al., 1995a, Ridding et al., 1995b) is present in both PD and
dystonia. This unexpected pathophysiological likeness between the two quite
distinct diseases raises a few important issues regarding the pathophysiological
significance of the abnormal electrophysiological findings in circuits under the
control of the BG.
1.3.1 The significance of electrophysiological abnormalities in BG
disease: Cause or consequence? Help or hindrance?
Firstly, there is an issue regarding the causal relationship between presence of
electrophysiological abnormalities and clinical symptoms. This problem may be
summarised in the following question: Is a certain electrophysiological finding
the cause of a specific symptom or it is a consequence, or is there no relevant
association between the two? For example, in dystonia, decreased intracortical
inhibition (and reduced inhibition at brainstem and spinal cord level) may be
responsible for some dystonic symptoms such as co-contraction of antagonistic
muscles, loss of selectivity in performing independent movements and overflow
of dystonia. Alternately, decreased intracortical inhibition might be a
37
consequence of maintaining a dystonic posture that could, through abnormal
afferent input, have resulted in cortical reorganisation. Finally, neither of two
interpretations may be true. Reduced inhibition is also present in parts of the
body that are not affected by dystonia, and in other neurological diseases that
do not feature dystonia. This suggests that changes in intracortical inhibition
may represent a non-specific functional change triggered by an abnormal BG
output irrespective of the underlying disease. In other words, reduced inhibition
seems to be a common pattern of cortical and subcortical reorganisation that
occurs when these structures are under the influence of a distorted output from
the BG.
Assuming that clinical symptoms and changes in particular electrophysiological
measures are related, the next important question is whether a particular
electrophysiological abnormality represents a maladaptive change that
contributes to the disease process, or a compensatory change that helps
prevent emergence of the motor sign? Defining the pathophysiological
significance of different cortical abnormalities in different types of movement
disorder may be relevant for potential treatments, so as to determine in which
direction to intervene, to alleviate symptoms or even to slow down disease
progression. If changes are compensatory and help prevent motor symptoms
emerging, then one might attempt to intervene to further enhance these
changes. On the contrary, if changes are maladaptive, thus contributing to
clinical symptoms and/or heralding disease progression, then it would be useful
to intervene in an attempt to diminish such processes. This goal might be
achieved by using non-invasive brain stimulation techniques.
38
With the rapidly increasing number of electrophysiological studies in PD and
dystonia, it is becoming apparent that changes in the electrophysiological
measures, such as corticospinal excitability and intracortical inhibition, are not
specific to the disease, but rather reflect a limited repertoire of cortical “reaction”
in the face of an abnormal BG output. In the hope of finding an
electrophysiological marker that would be more predictive of the underlying
disease, a focus of TMS research in BG diseases has switched to studies of
brain plasticity.
1.3.2 Cortical abnormalities in PD as revealed by TMS and their
interpretation
PD is characterised by cardinal motor symptoms of bradykinesia, rigidity and
tremor. The main pathological substrate is dopamine cells death in the
substantia nigra pars compacta with consequent striatal denervation. Although
the main pathological burden is within the nigrostriatal system, functional
changes arise also in the structures downstream from the striatum, including the
motor cortex, as a consequence of an abnormal BG output (Obeso et al., 2008).
A second source of cortical dysfunction is reduced dopaminergic projections
from the midbrain directly to the motor cortex (Gaspar et al., 1991). Treatments
with L-DOPA or dopamine receptor agonists successfully relieve the motor
symptoms of PD, but this can become complicated by motor fluctuations and
dyskinesias during the course of disease. Deep brain stimulation (DBS) of the
subthalamic nucleus or the internal globus pallidus (GPi) improve motor
symptoms even in patients with advanced disease including motor
39
complications, but the surgical approach is limited by many contraindications to
surgery and the risk of surgical complications. Studying the motor cortex
involvement in PD and its relationship to the motor symptoms may reveal
functional reorganisation that occurs in the face of dopamine loss and thus may
have treatment implications, given the accessibility of the motor cortex to non-
invasive brain stimulation techniques. Defining the mechanisms of sensorimotor
cortex reorganisation may thus be helpful for building the most appropriate non-
invasive brain stimulation protocols with view to treating motor symptoms of PD.
In trying to understand how the abnormal BG output in PD causes the cardinal
motor symptoms, the motor cortex has been increasingly investigated. Indeed,
different aspects of motor cortex function as revealed by TMS are found to be
abnormal in PD and are discussed below:
Motor thresholds and IO curve in PD
While there is no difference between PD patients and healthy controls in simple
measures of corticospinal excitability, such as RMT or AMT (Ueki et al., 2006),
IO curves are steeper in patients comparing to controls (Valls-Sole et al., 1994,
Chen et al., 2001). This is thought to be an expression of increased
corticospinal excitability in PD. However, a difficulty with this interpretation is
that background muscle activity itself influences the size of MEP for a given
stimulus intensity. Therefore, it may be that the steeper IO curve represents a
confounding effect of rigidity rather than increased cortical excitability.
40
Intracortical inhibition in PD
Several measured of intracortical inhibition are also impaired in PD. For
example, shortening of CSP comparing to controls has been repeatedly
reported (Priori et al., 1994, Nakashima et al., 1995, Berardelli et al., 1996,
Manfredi et al., 1998). CSP is shorten in the hemisphere contralateral to the
clinically more affected side compared to the less affected side in early
asymmetric PD patients (Cantello et al., 2007) and dopaminergic medications
prolong/ normalize the CSP, providing the evidence that the deficit in the CSP is
dopamine related.
SICI is also reduced in PD patients when they are tested “off” dopaminergic
medications (Ridding et al., 1995a), with this abnormality being present from the
early stages of the disease (Buhmann et al., 2004). There is still ongoing debate
about the exact cortical origin of the reduced SICI in PD. Some authors suggest
that a decreased SICI reflects decreased threshold of excitatory neurons
mediating intracortical facilitation (MacKinnon et al., 2005, Ni et al., 2013), while
the classic view is that SICI reflect dysfunction of inhibitory GABAa
interneurons.
The interpretation of the functional significance of reduced intracortical inhibition
in PD is not straightforward. A classical view is that deficient inhibition is an
indirect expression of the dopaminergic deficit which, by distorting BG output,
affects the motor cortex (Ridding et al., 1995a). An alternative hypothesis is that
reduced cortical inhibition serves as a compensation for bradykinesia (Cunic et
41
al., 2002). For example, in healthy subjects SICI is reduced during voluntary
muscle contraction (Ridding et al., 1995c), and even prior to the onset of
movement (Reynolds and Ashby, 1999). Accordingly, in PD reduced SICI at
rest may serve to facilitate the initiation of movement, representing an adaptive
motor strategy that compensates for slowness of movement
.
Plasticity in Parkinson’s disease
Dopaminergic deficit is clearly related to abnormal plasticity mechanisms at
corticostriatal synapses in animal models of PD. In the 6-hydroxydopamine
parkinsonian rat, complete dopaminergic denervation decreases both LTP and
LTD, while incomplete dopaminergic selectively affects LTP in corticostriatal
synapses. While it has not been possible to test for plasticity changes in
corticostriatal synapses in vivo in PD patients, plasticity of the sensorimotor
cortex has been extensively investigated. This was found to be abnormally
reduced and even absent in advanced PD patients when tested “off”
dopaminergic treatment (Morgante et al., 2006, Ueki et al., 2006, Suppa et al.,
2011, Kacar et al., 2012, Kishore et al. 2012) , suggesting widespread
functional abnormalities that are not confined to the BG . Dopamine plays a key
role in the modulation of mechanisms of synaptic plasticity, therefore it is not
surprising that the response to an experimental plasticity protocol recovers with
dopaminergic treatment (Morgante et al., 2006, Ueki et al., 2006). Reduced
motor cortex plasticity may be the consequence of dopamine loss within
nigrostriatal system, that via abnormal BG output affect the cortex, or it may be
a result of the dopaminergic deficit within M1. However, it should be noted that
42
not all studies reported abnormally reduced plasticity in PD. For example,
Bagnato et al. (2006) reported increased plasticity in the sensorimotor cortex in
PD patients, namely a stronger PAS-induced increase of the MEP amplitude
with a spread of the PAS effect in to non-target muscles compared to a healthy
control group. In this study, PAS response normalised when patients were
retested “on” medications. These apparently contradicting findings suggest that
the motor cortex may undergo various stages of functional reorganisation,
rather than being in a fixed disease- predetermined state.
Maladaptive plasticity at corticostriatal synapses has been implicated also in the
genesis of Levodopa induced dyskinesias. Depotentiation is a form of synaptic
plasticity that implies a reversal of established LTP by a low-frequency
stimulation protocol and also depends on dopaminergic signalling.
Depotentiation is absent in corticostriatal synapses in an experimental model of
l-DOPA-induced dyskinesias (Picconi et al., 2003). Similarly, dyksinetic but not
non-dyskinetic PD patients have impaired depotentiation in the M1, again
probably reflecting abnormal mechanisms of synaptic plasticity that generalises
across the whole BG-thalamo-cortical circuit (Huang et al., 2011).
In summary, PD is traditionally understood as a disorder with reduced motor
cortex plasticity. Even though considerable experimental evidence suggests
that this is the case in advanced PD, preclinical stages and patients in early
stages of disease have been much less investigated. If symptoms of
neurodegenerative diseases are regarded as a trade-off between compensatory
mechanisms and irreversible cell loss, it is possible that changes in plasticity in
43
PD reflect a dynamic process, that may initially have a compensatory role, while
later becoming ineffective or even maladaptive.
1.3.3 Cortical abnormalities in dystonia as revealed by TMS and their
interpretation
Dystonia is a hyperkinetic movement disorder, featuring repetitive twisting
movements and sustained abnormal postures of affected parts of the body.
Dystonia is classically thought to be a basal ganglia disorder and there are
several lines of evidence to support this: (i) Lesions of the BG and its
connections may cause dystonia. (ii) Abnormal activity or subtle changes in BG
structure have been demonstrated in primary dystonia using different imaging
techniques. (iii) Dystonia often occurs in other BG diseases or may be the main
symptom of nigrostriatal dysfunction, i.e. acute dystonic reaction and tardive
dystonia. (iv) Finally, dystonic symptoms may be cured or significantly improved
with DBS.
However, there are a limited number of experimental studies including
electrophysiological recordings from BG structures, the reason being the
relative rarity of the disease and the invasive nature of such studies. Therefore,
only patients undergoing deep brain stimulation surgery have been studied
(Vitek et al., 1999, Zhuang et al., 2004, Starr et al., 2005, Tang et al., 2007).
Another source of information on abnormal motor control in dystonia was
gathered from electrophysiological studies that involved the cortex, brainstem,
spinal cord and recently, cerebellum.
44
Loss of inhibition in dystonia
A consistent finding across neurophysiological studies in dystonia has been a
loss of inhibition at different CNS levels, including spinal cord, brainstem and
motor cortex (Berardelli et al., 1985, Nakashima et al., 1989, Ridding et al.,
1995b). It seems logical to relate the loss of inhibition to some dystonic
manifestations such as non-selective and prolonged muscle contraction.
However, deficient inhibition cannot be the sufficient explanation for the genesis
of dystonic symptoms, because the same abnormality is also present in parts of
the body not affected by dystonia (Sommer et al., 2002), in clinically unaffected
carriers of DYT1 mutations (Edwards et al., 2003), in other hyperkinetic
movement disorders such as tics (Ziemann et al., 1997) and even in hypokinetic
movement disorders such as PD (Ridding et al., 1995a).
Plasticity in dystonia
Maladaptive sensorimotor cortical plasticity has been put forward as one of the
major pathophysiological features of dystonia (Quartarone and Pisani, 2011). It
has been showed that patients with primary dystonia have enhanced response
to different experimental plasticity protocols (Quartarone et al., 2003, Edwards
et al., 2006, Weise et al., 2006, Tamura et al., 2009). In the initial study on PAS
response in writer’s cramp, patients had two main abnormalities. Firstly, the
PAS response was enhanced in the target APB muscle comparing to controls
and secondly, there was a loss of topographic specificity in patients, with an
increase of MEP in the non-target FDI muscle after PAS that was not present in
45
healthy participants (Quartarone et al., 2003). Yet, not all studies reported an
increased response to PAS in primary dystonia patients (Meunier et al., 2012).
Another way to look at plasticity changes is by indirect mapping of sensory and
motor cortices, using TMS or functional imaging. In patients with primary
dystonias, mapping studies showed enlargement of sensory receptive fields and
blurring of margins of motor maps with overlap between representations of
adjacent muscles (Thickbroom et al., 2003).
An important feature that may link the role of maladaptive plasticity to
development of dystonic symptoms is that focal limb dystonia is typically
triggered by a period of intensive training of a particular movement. In a monkey
model of dystonia, overtraining in specific hand movements may also trigger the
appearance of symptoms that resemble human dystonia (Byl et al., 1996). The
somatosensory cortex of these animals undergoes functional reorganisation,
resulting in enlargement and overlapping of receptive fields of individual digits.
The idea is that overtraining itself triggers functional changes in sensory and
motor cortices, leading to abnormal sensorimotor integration that somehow
results in dystonic symptoms. However, an important question is why only some
human subjects develop dystonia after excessive training whereas others do
not. The answer might be in the two- hit hypothesis, which suggests that
dystonia develops when use-dependent environmental factors coexist with
inherently abnormal mechanisms of plasticity within the sensorimotor cortex.
Thus, abnormal sensorimotor cortex plasticity may have a role in the
pathophysiology of dystonia, so that individuals with an excessive tendency to
form an association between sensory input and motor output may develop
46
symptoms if plastic changes are pushed to an extreme by frequent repetition of
movement (Quartarone and Pisani, 2011).
However, it should be noted that the two-hit explanation account only for task-
specific primary dystonias, as it doesn’t consider other forms dystonia in which
there is no obvious role for over-training of the affected body parts. These
include other focal and generalised primary dystonias or secondary dystonias. It
might be possible that in these other forms of dystonia abnormalities of the
plasticity mechanisms coexist with other factors that may trigger dystonia, for
example BG lesions in the case of stroke or perinatal injury, neuroleptic drug
use in the case of drug induced dystonia or still unknown environmental factors
in the case of primary dystonias that are not task specific. Alternatively,
enhanced mechanism of synaptic plasticity might be a trait specific for primary
dystonia only.
Finally, distorted plasticity is also present in cortical representations of the body
parts that are not affected by dystonia (Quartarone et al., 2008) and in
professional musicians who do not develop occupational dystonias (Rosenkranz
et al., 2007), further complicating the issue of pathophysiological significance of
abnormal plasticity in primary dystonias.
In summary, it has been traditionally understood that enhanced motor cortex
plasticity represented a maladaptive trait for the development of dystonic
symptoms. While this might be the case in primary (including genetic forms)
dystonias, increased plasticity might not be a feature of all dystonias. For
47
example, patients with psychogenic dystonia have normal response to
experimental plasticity protocols (Quartarone et al., 2009), while other forms of
dystonia including secondary forms have not been hitherto investigated. Thus,
there may be no uniform hypothesis to explain the pathophysiology of all
dystonias, but rather, different forms of dystonia may have diverse
pathophysiological backgrounds.
Neuroanatomical network of dystonia
Several studies have addressed the link between BG output and cortical,
brainstem and spinal cord functional abnormalities, by investigating the changes
in electrophysiological measures within these circuits following DBS of GPi in
patients with primary dystonia.
When abnormal BG output is modulated by DBS treatment, this results in
normalisation of previously reduced inhibition at different CNS levels (Tisch et
al., 2006a, Tisch et al., 2006b) and importantly the normalisation of
sensorimotor cortical plasticity (Tisch et al., 2007, Ruge et al., 2011).
In healthy subjects, the cerebellum modulates the extent and duration of the
response to sensorimotor plasticity protocols, in such a way that cerebellar
cortex excitation prevents the PAS inducing a sensorimotor plasticity in the
primary motor cortex (Hamada et al., 2012b, Popa et al., 2012), whereas there
is some evidence that cerebellar cortex inhibition makes the PAS more efficient
at inducing plasticity (Popa et al., 2013). In patients with writer's cramp,
48
cerebellar cortex excitation and inhibition are both ineffective in modulating
sensorimotor plasticity, suggesting that altered cerebellar processing of
incoming afferent information may result in maladjusted sensorimotor
integration and consequently abnormal response to PAS in primary dystonia
(Hubsch et al., 2013).
There may also be a link between distorted afferent input and abnormal cortical
plasticity in dystonia. For example, in focal limb dystonia altered hand cortical
maps which are index of maladaptive cortical plasticity are normalised if afferent
input is modified by botulinum toxin injections into dystonic muscles
(Thickbroom et al., 2003).
Dystonia may be thus be regarded as an abnormality of broad functional motor
network, which apart from BG include sensorimotor cortex, sensory afferent
input, the cerebellum, brainstem and spinal cord. The assumption is that
abnormalities in sensorimotor cortical plasticity in dystonia should not be
regarded as an independent fixed state, but rather as a dynamic functional
reorganisation of motor cortex influenced by inputs from different nodes in the
broad dystonia network. Furthermore, different types of dystonia might not
necessary share the involvement of the same nodes in the dystonia network,
but may rather have different neuroanatomical substrates.
49
1.4. Aim of the PhD study
The aim of my PhD research was to gain further knowledge on significance of
sensorimotor cortical plasticity changes (and other cortical electrophysiology
measures) in PD and dystonia. I tried to achieve this by studying relationship
between changes in these measures and changes in clinical manifestation of
disease in PD and primary dystonia. In addition, I compared sensorimotor
cortical plasticity and other electrophysiological measures between primary and
secondary dystonia patients to see if different types of dystonia share the same
neurophysiological pattern.
50
General Methods Chapter 2
In all the work within this thesis, I have used TMS techniques to study
corticospinal excitability, intracortical inhibition and sensorimotor cortical
plasticity in PD patients, different group of dystonia patients and healthy
participants.
2.1. Participants
PD patients and patients with primary and secondary dystonia were recruited
from the Movement Disorder Outpatient Clinics at the National Hospital for
Neurology and Neurosurgery in London and occasionally from the collaborating
institution depending on the study (Sapienza University at Rome and University
of Seville). Healthy participants were recruited from the list of healthy
participants maintained by Movement Disorders Group of the Sobell
Department of Motor Neuroscience and Movement Disorders. The exclusion
criteria for all participants were in accordance to guidelines for use of repetitive
TMS (rTMS) in research and included history of epileptic seizures and
implanted metal device (Wassermann et al., 1996, Rossi et al., 2009).
Demographic and clinical characteristics of the patients are given in
experimental chapters (Chapters 3-6).
51
Written informed consent was obtained from all participants. All studies were
approved by the local ethics committee and conducted in accordance with the
Declaration of Helsinki.
2.2. Electromyographic recordings
Participants were seated comfortably in an armchair and were instructed to
relax arm and hand muscles. EMG recordings were made from hand muscles:
abductor pollicis brevis (APB) and first dorsal interossei (FDI) or abductor digiti
minimi (ADM) muscles on the side contralateral to stimulated cortex. Ag-AgCl
surface electrodes with a belly-tendon montage were used, with a ground
electrode placed over the wrist. The level of background EMG activity was
monitored and trials with background EMG activity were rejected online. The
background EMG area for at least the 200 ms preceding the TMS pulse was
measured in all recorded trials and the EMG root mean square amplitude
calculated to ensure comparability of the baseline activity across different
experiments in patients (within-subjects) and between patients and healthy
participants (between-subjects). EMG signals were amplified (1000x) and band-
pass filtered (bandwidth 20Hz to 2 kHz) with a Digitimer D360 amplifier
(Digitimer, UK), acquired at a sampling rate of 5 kHz through a 1401 laboratory
interface (Cambridge Electronic Design, Cambridge, UK) and stored on a PC.
The EMG traces were analysed “off- line”, using customized Signal® software
version 4.00.
52
2.3. Transcranial Magnetic Stimulation
Single TMS pulses of the M1 were applied using Magstim 2002 magnetic
stimulator with a monophasic current waveform (Magstim Company,
Carmarthenshire, Wales, UK). For paired pulses techniques, two Magstim 2002
stimulators were coupled via a Bistim module. Stimulators were connected to a
standard figure-of-eight TMS coil (diameter 70 mm). The intersection of the coil
was held over the “hotspot”, tangentially to the skull with the handle pointing
backwards and laterally at an angle of ~45 degrees to the sagittal plane in order
to generate a posterior–anterior current in the brain (Kaneko et al., 1996). The
“hot spot” was marked on the participant’s head over the optimal scalp positions
for eliciting MEPs of maximal amplitudes in the contralateral APB muscle. The
same hot spot was used for assessing the MEPs in other muscles (Stefan et al.,
2000).
2.3.1. Corticospinal excitability
Active and resting motor threshold were determined according to the standard
definitions (Rossini et al., 1994). RMT was defined as the minimum intensity
that evoked a peak-to-peak MEP of 50 μV in at least 5 out of 10 consecutive
trials in the relaxed APB muscle. AMT was defined as the minimum intensity
that elicited a reproducible MEP of at least 200 μV in the tonically contracting
APB muscle in at least 5 out of 10 consecutive trials, while subject was
performing contraction of ABP at approximately 10–15% of maximum voluntary
contraction.
53
Single 1mV-MEPs were recorded using a SI adjusted to produce MEP of
approximately 1 mV amplitude in the relaxed APB muscle and this intensity was
kept constant for assessment of changes of 1mV-MEPs after PAS. IO curves
were assessed by recording four MEPs at raising SI, increasing in 10% steps,
as indicated in details in each experimental chapter.
2.3.2. Intracortical inhibition
SICI and ICF were assessed with paired-pulse paradigm (Kujirai et al., 1993).
The intensity of the test stimulus was 1mV- MEPs intensity. In studies on PD
patients described in chapters 3 and 4, the intensity of the conditioning stimulus
(CS) was 90% of RMT, an intensity known to produce a net loss of inhibition in
PD (MacKinnon et al., 2005). In studies on dystonia patients (chapters 5 and 6),
the intensity of CS was set at standard 80% of AMT. SICI and ICF were
assessed at rest, using ISIs as indicated in each experimental chapter. For SICI
and ICF 10 MEPs were collected for each ISI and for the test stimulus alone.
For assessment of CSP, 20 single TMS pulses were applied at an intensity of
120% RMT, while patients performed a constant contraction of APB at 20% of
maximum voluntary contraction.
2.4. Paired Associative Stimulation
For studies described in chapters 3, 4 and 6, I used excitatory PAS protocol
(PAS25), which consisted of 200 electrical stimuli to the median nerve at the
wrist paired with TMS stimuli over the APB hot spot, given at the rate 0.25 Hz
54
(Ziemann et al., 2004). Each TMS stimulus was preceded by an electrical
stimulus by 25 ms (ISI 25ms). Intensity of electrical stimulus was 300% of the
perceptual threshold; while TMS intensity was adjusted to the intensity that
produced 1mV-MEP in relaxed APB muscle. Median nerve electrical stimulation
was applied through a bipolar electrode, with the cathode positioned proximally
(Digitimer DS 7 stimulator; Digitimer Ltd, Welwyn Garden City, Herts, UK). The
electrical pulses were constant current square wave pulses with a pulse width of
200 µs.Subjects were instructed to look at their stimulated hand and to report
every 20th peripheral electrical stimuli they perceived in order to ensure
comparable attention levels between sessions. Number of errors in counting
peripheral nerve stimuli was noted. In the study described in chapter 5, a rapid
PAS (rPAS) protocol was used, with details explained in that chapter. In all
experiments, to assess the effect of PAS (or rPAS) on 1mV-MEPs, 20 MEPs
were recorded before PAS and at each time point after PAS.
2.5 Statistical analysis
Distribution of data was assessed using Shapiro–Wilk test of normality.
Greenhouse-Geisser method was used where necessary to correct for non-
sphericity. When data were normally distributed, parametric tests (ANOVA) with
post-hoc Tukey test were used. For non-normally distributed data and for
ordinal data, non-parametric tests were used as described in the experimental
chapters. The significance was pre-set at p ≤ 0.05. Unless otherwise stated,
data are given as mean +/- standard error of the mean (SEM).
55
Interhemispheric asymmetry in Chapter 3
sensorimotor cortical plasticity and
intracortical inhibition in early Parkinson’s
disease
In the following set of experiments we studied if clinical asymmetry of the motor
symptoms in early, drug- naïve PD patients is reflected in an asymmetry of
cortical TMS measures. In the “model” of early asymmetric PD, the more
affected side is in the more advanced stage of the disease, while less affected
side is still asymptomatic or very mildly symptomatic, despite considerable
dopaminergic loss even in the striatum corresponding to the less affected side.
The hypothesis was that if there is any functional change that prevents motor
symptom progression it is likely to be detected in the hemisphere contralateral
to the less affected side. Thus, we compared the corticospinal excitability,
intracortical excitability and sensorimotor cortical plasticity between the
hemispheres contralateral to the clinically less and more affected side.
The work presented in this Chapter was originally published in the form of a
research article: Kojovic M, Bologna M, Kassavetis P, Murase N, Palomar FJ,
Berardelli A, Rothwell JC, Edwards MJ, Bhatia KP. Functional reorganization of
sensorimotor cortex in early Parkinson disease. Neurology. 2012 May
1;78(18):1441-8.
56
3.1 Summary
Several neurophysiological measures known to be abnormal in the M1 of
patients with advanced PD were tested in the both hemispheres ( contralateral
to the more and less affected side) of 16 newly diagnosed and drug naive PD
patients and compared with 16 age-matched healthy participants. LTP-like
effects were probed using a PAS protocol. We also measured SICI, ICF, CSP
and IO curves. We found that the hemisphere contralateral to the less affected
side had preserved intracortical inhibition and a larger response to the plasticity
protocol than healthy participants. In the hemisphere contralateral to the more
affected side, there was no response to the plasticity protocol and inhibition was
reduced. There was no difference in the IO curves between sides or between
PD patients and healthy participants. Increased sensorimotor cortical plasticity
in the hemisphere contralateral to the less affected side is consistent with a
functional reorganisation of the sensorimotor cortex and may represent a
compensatory change that contributes to delaying the onset of clinical signs.
Alternatively, it may reflect a maladaptive plasticity that provokes onset of the
symptoms. As seen in the hemisphere contralateral to the more affected side,
plasticity deteriorates as the symptoms progress. The rate of change in the
interhemispheric difference of the PAS response over time could be developed
into a surrogate marker of disease progression.
3.2. Introduction
57
Motor signs in PD appear when striatal dopamine is depleted beyond the critical
threshold of approximately 60-80 % (Lee et al., 2000). Neuropathological and
neuroimaging evidence suggests that changes in the nigrostriatal system
compensate for dopamine deficiency (Zigmond et al., 1990, Kaasinen et al.,
2000, Lee et al., 2000, McCallum et al., 2006, Appel-Cresswell et al., 2010, de
la Fuente-Fernandez et al., 2011). However, given the extent of preclinical
dopaminergic denervation (Tissingh et al., 1998), it is conceivable that
compensatory changes extend beyond the nigrostriatal circuit.
Clinically asymmetric PD patients represent a valuable model for studying
compensatory reorganisation within the motor system since functional changes
that prevent symptom progression may possibly be present in the hemisphere
contralateral to the less affected side. A previous [18F]-fluorodeoxyglucose PET
(FDG-PET) study provided little evidence that this might be the case (Tang et
al., 2010). Asymmetric patients had an equally abnormal metabolic pattern in
the cortex and subcortex of both hemispheres (except within the putamen)
(Tang et al., 2010). However, an apparent absence of metabolic asymmetry in
the sensorimotor cortex, a major output of basal ganglia-cortical loops, could
reflect insufficient sensitivity of metabolic measures.
In this study we measured the excitability of circuits in the sensorimotor cortex
of clinically asymmetric drug naive PD patients with TMS techniques known to
be sensitive to dopaminergic deficit. These involved PAS, a method that
assesses long term potentiation LTP- like plasticity at cortical synapses (Stefan
et al., 2000) and which relies on sensorimotor integration of afferent input and
58
motor output, that are known to be impaired in PD (Lewis and Byblow, 2002).
In addition, we employed measures of intracortical inhibitory and excitatory
function. We compared these measures between the less and more affected
hemispheres in the patients and we contrasted them with those of healthy
participants.
3.3 Methods
3.3.1 Participants
Sixteen newly diagnosed, drug naive patients with clinically asymmetric
idiopathic PD (11men, 5 women, mean age 59 years, range 34-73 years)
(Table 3.1) and sixteen age -matched healthy participants (11men, 5 women,
mean age 60 years, range 35-73 years) were included in the study. Idiopathic
PD was diagnosed according to the UK Parkinson’s Disease Society Brain
Bank criteria (Hughes et al., 1992) and further confirmed by abnormal dopamine
transporter (DAT) SPECT in all patients. Clinical disease severity was assessed
with the motor section (items 3.1–3.18) of the MDS-UPDRS scale (Goetz et al.,
2008a). For the less and more affected side, the motor subscore was calculated
from the sum of items 3.3 to 3.8 and 3.15 to 3.17 for each side (lateralised
UPDRS score). None of the participants was on any medications that are
known to affect the measurements performed. All participants were right-
handed.
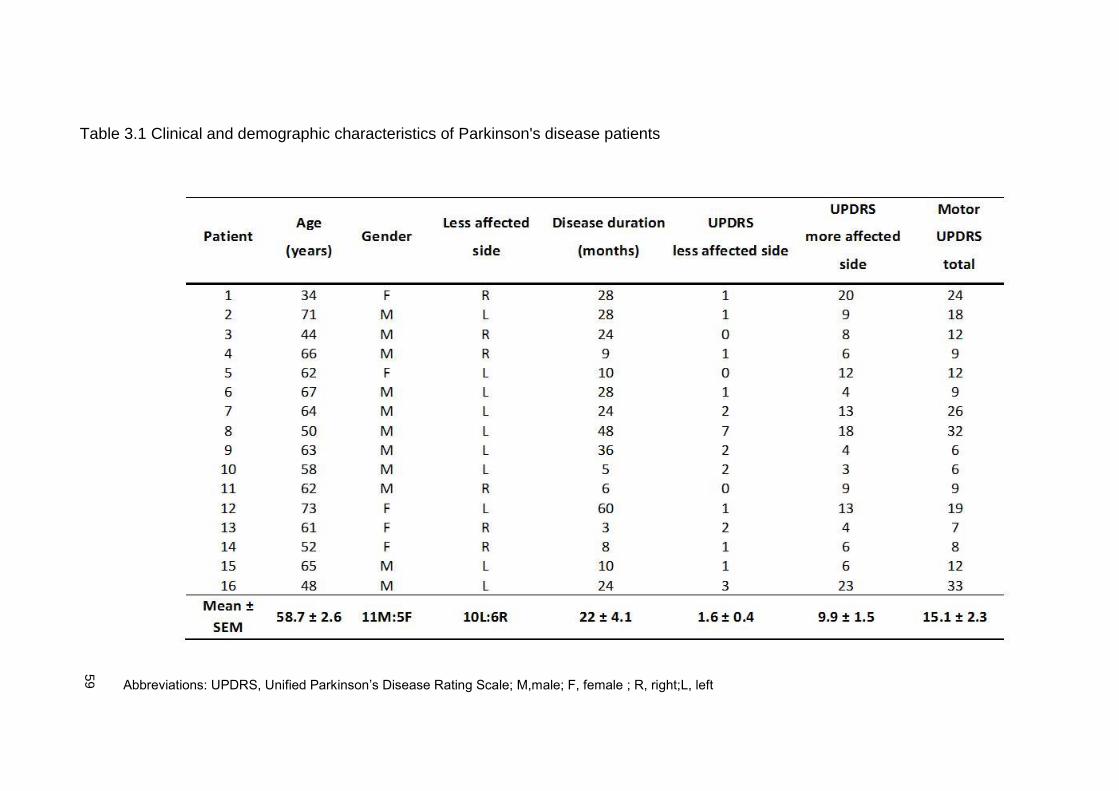
59
Table 3.1 Clinical and demographic characteristics of Parkinson's disease patients
Abbreviations: UPDRS, Unified Parkinson’s Disease Rating Scale; M,male; F, female ; R, right;L, left
60
3.2 EMG recordings and TMS
Details are given in methodological chapter 2. EMG recordings were made from
APB and ADM muscles. IO curves were assessed by recording four MEPs at
each of ten stimulation intensities, increasing in 10% steps from 80% to 170%
of RMT.SICI was assessed using ISIs of 2, 3 and 4 ms and ICF at ISI of 15 ms.
3.3.3 Experimental design
Patients were tested on both hemispheres, corresponding to the more and less
affected side in two different TMS sessions, separated by a week. The order of
the tested hemisphere (affected vs. unaffected) was randomised between
subjects. Healthy participants were tested on the dominant hemisphere only,
since there is no evidence of a difference in sensorimotor cortical plasticity and
other TMS measures between the dominant and non-dominant hemisphere. In
each session we measured RMT, AMT, 1mV MEP, IO curve, SICI, ICF and
CSP. We then delivered PAS and assessed the effect of this conditioning
protocol on corticospinal excitability (RMT, AMT and 1mV- MEPs) and CSP at
three time points: 0, 15 min and 30 min after PAS (Figure 3.1).
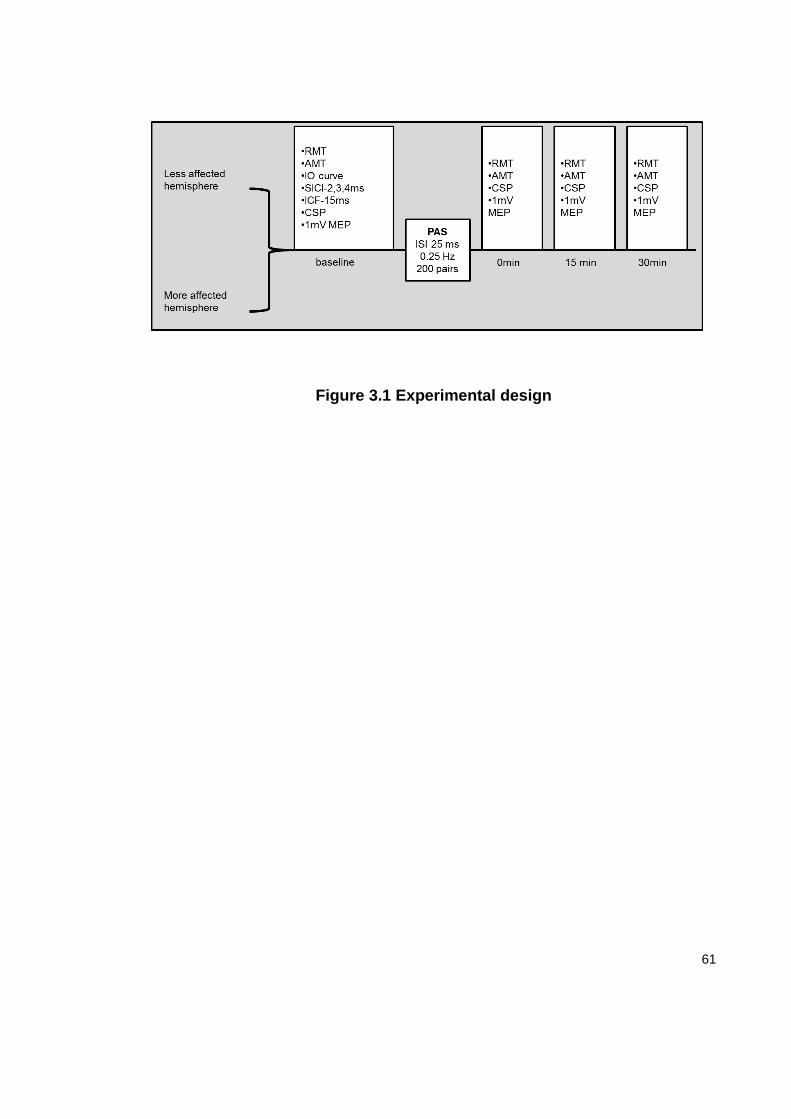
61
Figure 3.1 Experimental design
62
3.3.4 Statistical analysis
We used Wilcoxon’s signed-rank test to compare differences in the UPDRS
scores between less and more affected side and to compare age between PD
patients and healthy participants. Chi-square test was used to compare gender
distribution between PD patients and healthy participants. The TMS parameters
between the hemispheres of PD patients and healthy participants were
compared using 2-way ANOVAs with a factor GROUP (less affected vs. more
affected side vs. healthy participants) as a between-subject factor. For IO
curves the factor STIMULUS INTENSITY (10 levels of stimulator output
intensity) was used as within-subjects factor. For SICI, ISI (3 levels: normalised
MEP size at 2, 3 and 4 ms) was used as a within-subject factor. PAS produced
by stimulation of median nerve has different effects on MEPs evoked in median
and non-median innervated muscles (Stefan et al., 2000). Thus the effects on
MEPs in the APB and ADM muscles were evaluated in separate 2-way
ANOVAs for each muscle with TIME (4 levels: before PAS and 0, 15 and 30 min
after PAS) as a within-subject factor. The effect of PAS on CSP was evaluated
using TIME (3 levels: normalised CSP duration at 0, 15 and 30 min after PAS)
as a within-subject factor. Conditional on a significant F-value, to explore the
strength of main effects and patterns of significant interactions we used post
hoc Tukey HSD test and follow-up ANOVAs, respectively. Possible correlations
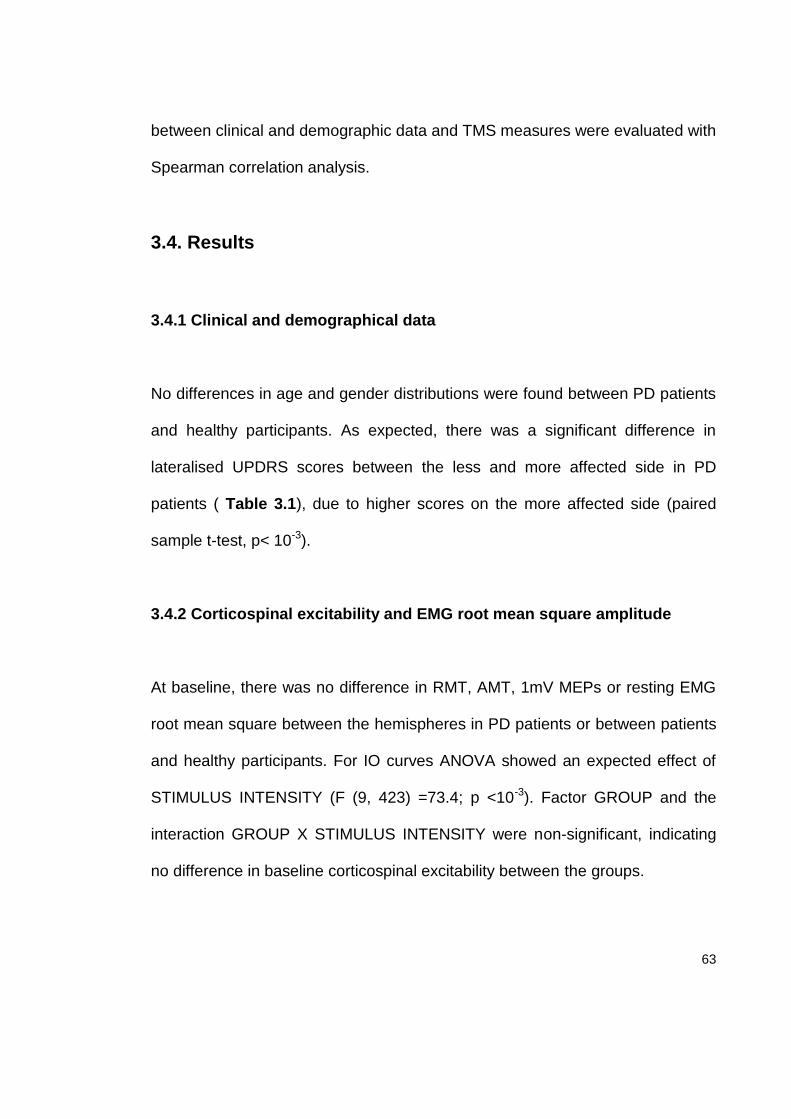
63
between clinical and demographic data and TMS measures were evaluated with
Spearman correlation analysis.
3.4. Results
3.4.1 Clinical and demographical data
No differences in age and gender distributions were found between PD patients
and healthy participants. As expected, there was a significant difference in
lateralised UPDRS scores between the less and more affected side in PD
patients ( Table 3.1), due to higher scores on the more affected side (paired
sample t-test, p< 10-3).
3.4.2 Corticospinal excitability and EMG root mean square amplitude
At baseline, there was no difference in RMT, AMT, 1mV MEPs or resting EMG
root mean square between the hemispheres in PD patients or between patients
and healthy participants. For IO curves ANOVA showed an expected effect of
STIMULUS INTENSITY (F (9, 423) =73.4; p <10-3). Factor GROUP and the
interaction GROUP X STIMULUS INTENSITY were non-significant, indicating
no difference in baseline corticospinal excitability between the groups.
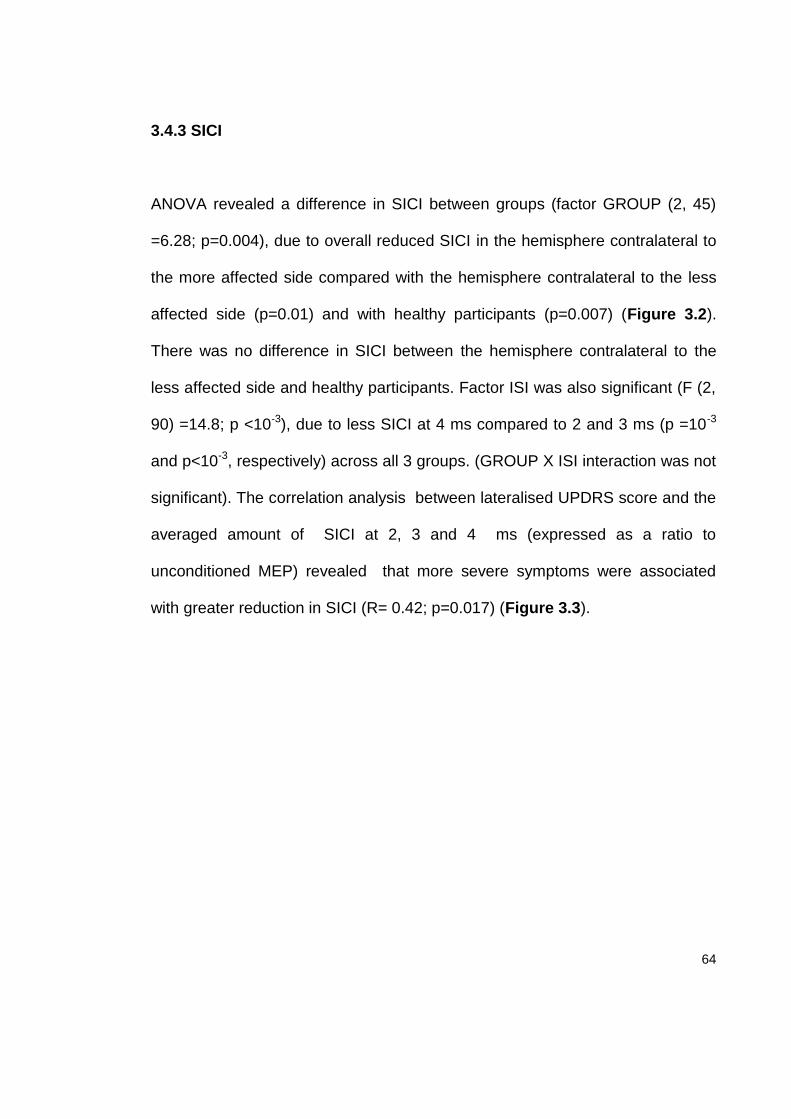
64
3.4.3 SICI
ANOVA revealed a difference in SICI between groups (factor GROUP (2, 45)
=6.28; p=0.004), due to overall reduced SICI in the hemisphere contralateral to
the more affected side compared with the hemisphere contralateral to the less
affected side (p=0.01) and with healthy participants (p=0.007) (Figure 3.2).
There was no difference in SICI between the hemisphere contralateral to the
less affected side and healthy participants. Factor ISI was also significant (F (2,
90) =14.8; p <10-3), due to less SICI at 4 ms compared to 2 and 3 ms (p =10-3
and p<10-3, respectively) across all 3 groups. (GROUP X ISI interaction was not
significant). The correlation analysis between lateralised UPDRS score and the
averaged amount of SICI at 2, 3 and 4 ms (expressed as a ratio to
unconditioned MEP) revealed that more severe symptoms were associated
with greater reduction in SICI (R= 0.42; p=0.017) (Figure 3.3).
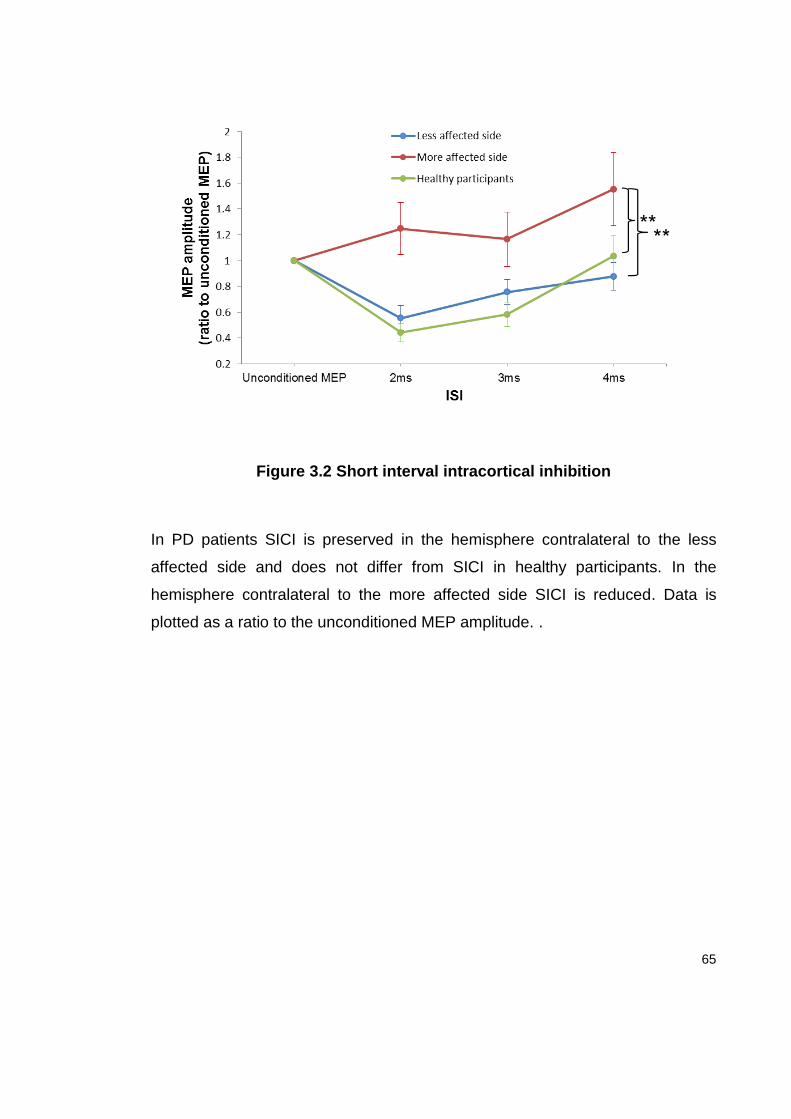
65
Figure 3.2 Short interval intracortical inhibition
In PD patients SICI is preserved in the hemisphere contralateral to the less
affected side and does not differ from SICI in healthy participants. In the
hemisphere contralateral to the more affected side SICI is reduced. Data is
plotted as a ratio to the unconditioned MEP amplitude. .
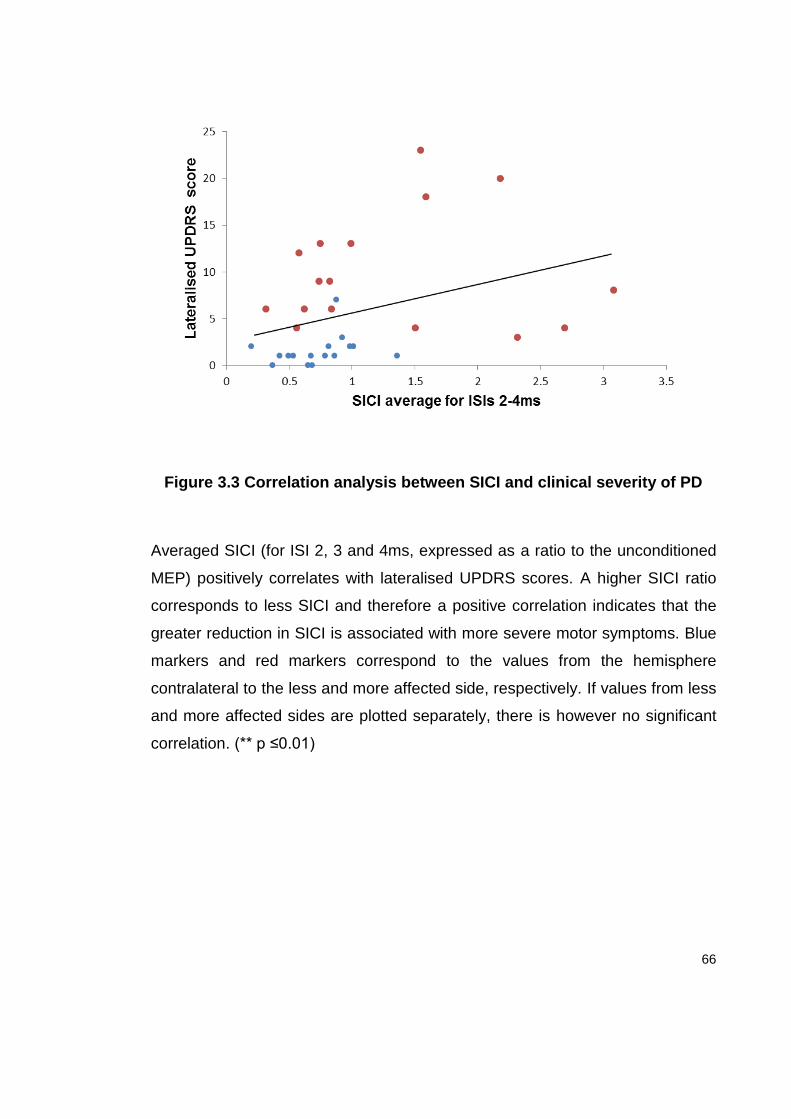
66
Figure 3.3 Correlation analysis between SICI and clinical severity of PD
Averaged SICI (for ISI 2, 3 and 4ms, expressed as a ratio to the unconditioned
MEP) positively correlates with lateralised UPDRS scores. A higher SICI ratio
corresponds to less SICI and therefore a positive correlation indicates that the
greater reduction in SICI is associated with more severe motor symptoms. Blue
markers and red markers correspond to the values from the hemisphere
contralateral to the less and more affected side, respectively. If values from less
and more affected sides are plotted separately, there is however no significant
correlation. (** p ≤0.01)
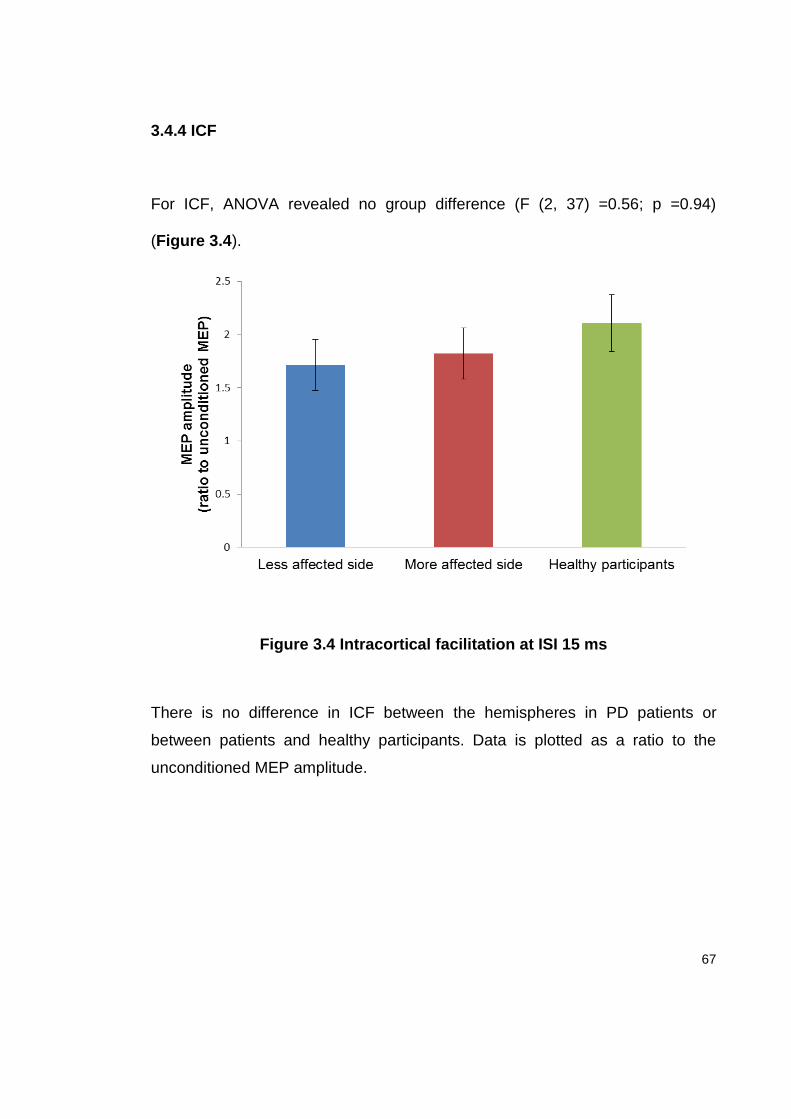
67
3.4.4 ICF
For ICF, ANOVA revealed no group difference (F (2, 37) =0.56; p =0.94)
(Figure 3.4).
Figure 3.4 Intracortical facilitation at ISI 15 ms
There is no difference in ICF between the hemispheres in PD patients or
between patients and healthy participants. Data is plotted as a ratio to the
unconditioned MEP amplitude.
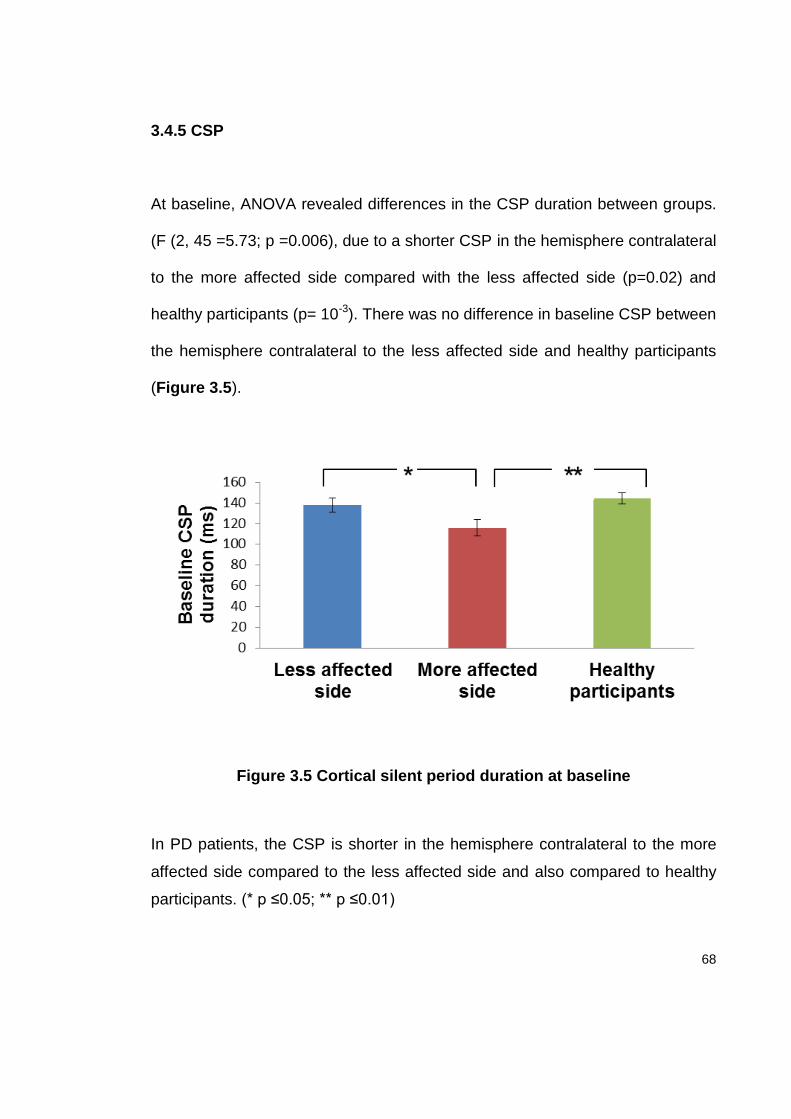
68
3.4.5 CSP
At baseline, ANOVA revealed differences in the CSP duration between groups.
(F (2, 45 =5.73; p =0.006), due to a shorter CSP in the hemisphere contralateral
to the more affected side compared with the less affected side (p=0.02) and
healthy participants (p= 10-3). There was no difference in baseline CSP between
the hemisphere contralateral to the less affected side and healthy participants
(Figure 3.5).
Figure 3.5 Cortical silent period duration at baseline
In PD patients, the CSP is shorter in the hemisphere contralateral to the more
affected side compared to the less affected side and also compared to healthy
participants. (* p ≤0.05; ** p ≤0.01)
69
3.4.6 Effect of PAS on baseline corticospinal excitability
There was no within-or between-subject differences in electrical stimuli counting
errors during PAS, suggesting equivalent attention levels in different sessions.
The results of the PAS effect on 1mV-MEP amplitude are illustrated in Figure
3.6.and 3.7. Separate 2-way ANOVAs for the APB and the ADM muscles with
factors GROUP and TIME revealed that the effect of PAS was different between
groups in both APB (GROUP X TIME interaction (F (6, 135) =2.6; p= 0.02) and
ADM (GROUP X TIME (F (6, 135) =3.4; p= 0.004). We explored these
interactions further with follow-up ANOVAs in which we made separate
comparisons between hemispheres in patients as well as comparisons of each
hemisphere with the normal group. The less affected side had a larger response
to PAS than the more affected side in both APB (GROUP X TIME (F (3, 90)
=5.44; p= 10-3) and ADM (GROUP X TIME (F (3, 90) =5.55; p= 10-3) muscles.
When the less affected side was compared to healthy participants there was no
difference between the responses to PAS in the APB muscle; however the less
affected side showed a spread of PAS effect to the ADM that was not present in
healthy participants (GROUP X TIME (F (3, 90) =4.36; p= 0.006). Finally,
comparison of the more affected side of PD patients to healthy participants
revealed that more affected side had less response to PAS in APB muscle.
There was no spread of PAS response to the ADM in the more affected side or

70
in healthy participants. Within-group effects of PAS were further confirmed in
separate ANOVAs for each group and muscle.
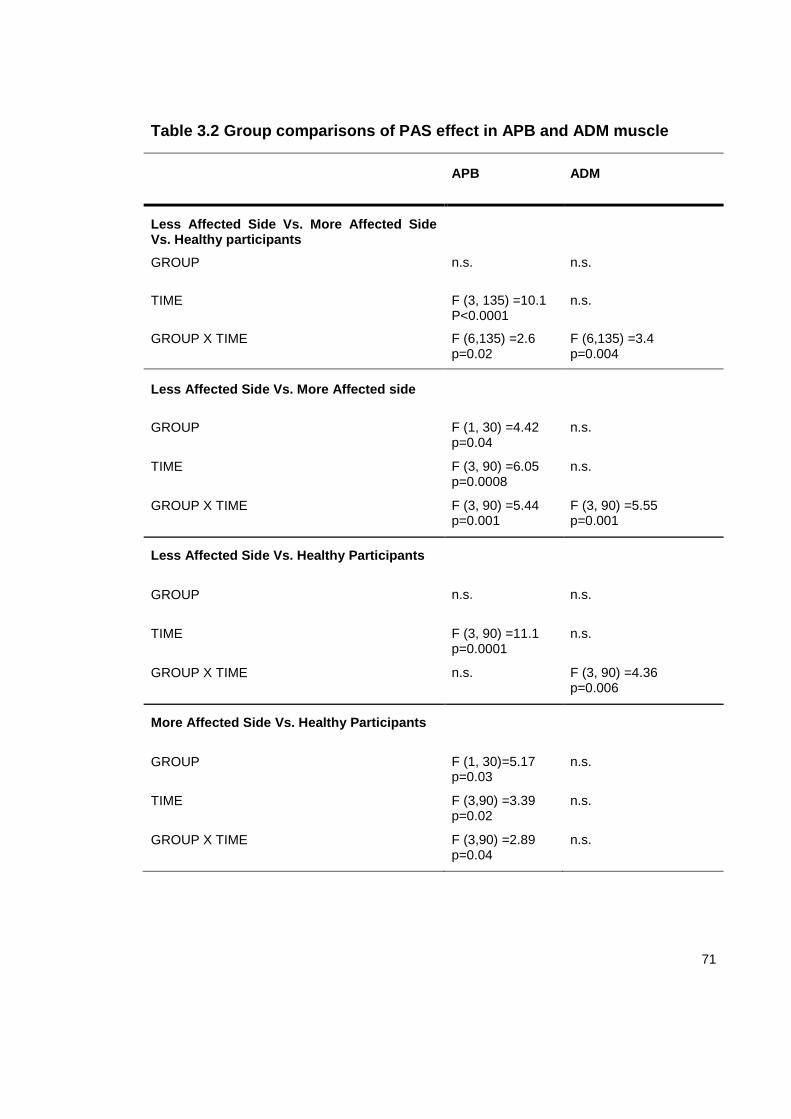
71
Table 3.2 Group comparisons of PAS effect in APB and ADM muscle
APB ADM
Less Affected Side Vs. More Affected Side Vs. Healthy participants
GROUP n.s. n.s.
TIME F (3, 135) =10.1 P<0.0001
n.s.
GROUP X TIME F (6,135) =2.6 p=0.02
F (6,135) =3.4 p=0.004
Less Affected Side Vs. More Affected side
GROUP F (1, 30) =4.42 p=0.04
n.s.
TIME F (3, 90) =6.05 p=0.0008
n.s.
GROUP X TIME F (3, 90) =5.44 p=0.001
F (3, 90) =5.55 p=0.001
Less Affected Side Vs. Healthy Participants
GROUP n.s. n.s.
TIME F (3, 90) =11.1 p=0.0001
n.s.
GROUP X TIME n.s. F (3, 90) =4.36 p=0.006
More Affected Side Vs. Healthy Participants
GROUP F (1, 30)=5.17 p=0.03
n.s.
TIME F (3,90) =3.39 p=0.02
n.s.
GROUP X TIME F (3,90) =2.89 p=0.04
n.s.
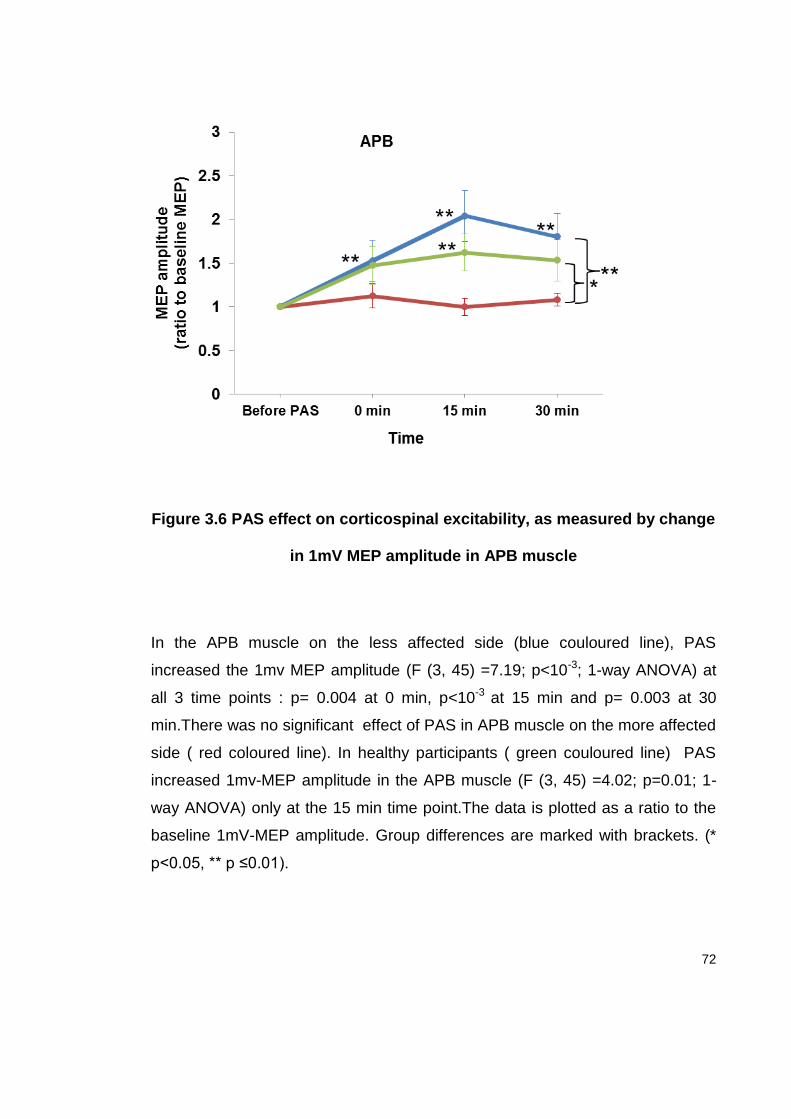
72
Figure 3.6 PAS effect on corticospinal excitability, as measured by change
in 1mV MEP amplitude in APB muscle
In the APB muscle on the less affected side (blue couloured line), PAS
increased the 1mv MEP amplitude (F (3, 45) =7.19; p<10-3; 1-way ANOVA) at
all 3 time points : p= 0.004 at 0 min, p<10-3 at 15 min and p= 0.003 at 30
min.There was no significant effect of PAS in APB muscle on the more affected
side ( red coloured line). In healthy participants ( green couloured line) PAS
increased 1mv-MEP amplitude in the APB muscle (F (3, 45) =4.02; p=0.01; 1-
way ANOVA) only at the 15 min time point.The data is plotted as a ratio to the
baseline 1mV-MEP amplitude. Group differences are marked with brackets. (*
p<0.05, ** p ≤0.01).
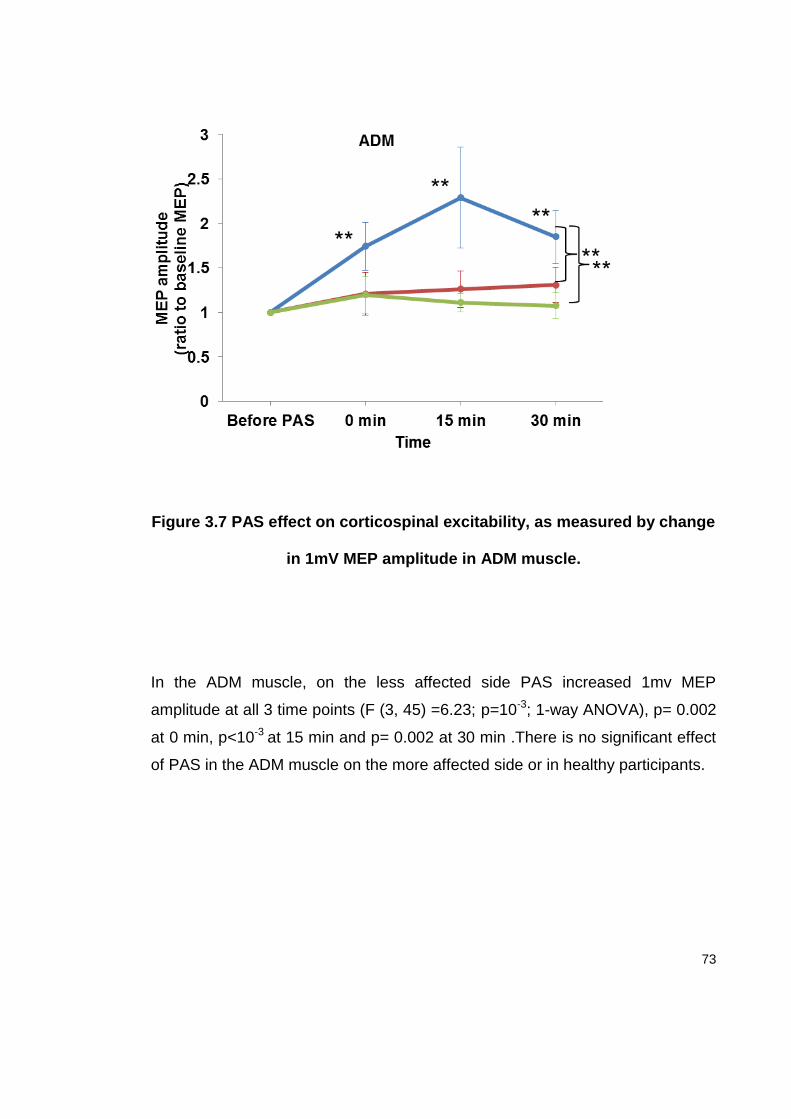
73
Figure 3.7 PAS effect on corticospinal excitability, as measured by change
in 1mV MEP amplitude in ADM muscle.
In the ADM muscle, on the less affected side PAS increased 1mv MEP
amplitude at all 3 time points (F (3, 45) =6.23; p=10-3; 1-way ANOVA), p= 0.002
at 0 min, p<10-3 at 15 min and p= 0.002 at 30 min .There is no significant effect
of PAS in the ADM muscle on the more affected side or in healthy participants.

74
Correlation analysis between lateralised UPDRS score and average PAS
response in APB disclosed that less severe motor symptoms were associated
with a greater response to PAS (R= - 0.397; p=0.025) (Figure 3.8). There was
no difference in our measure of attention during PAS between different TMS
sessions or between groups.
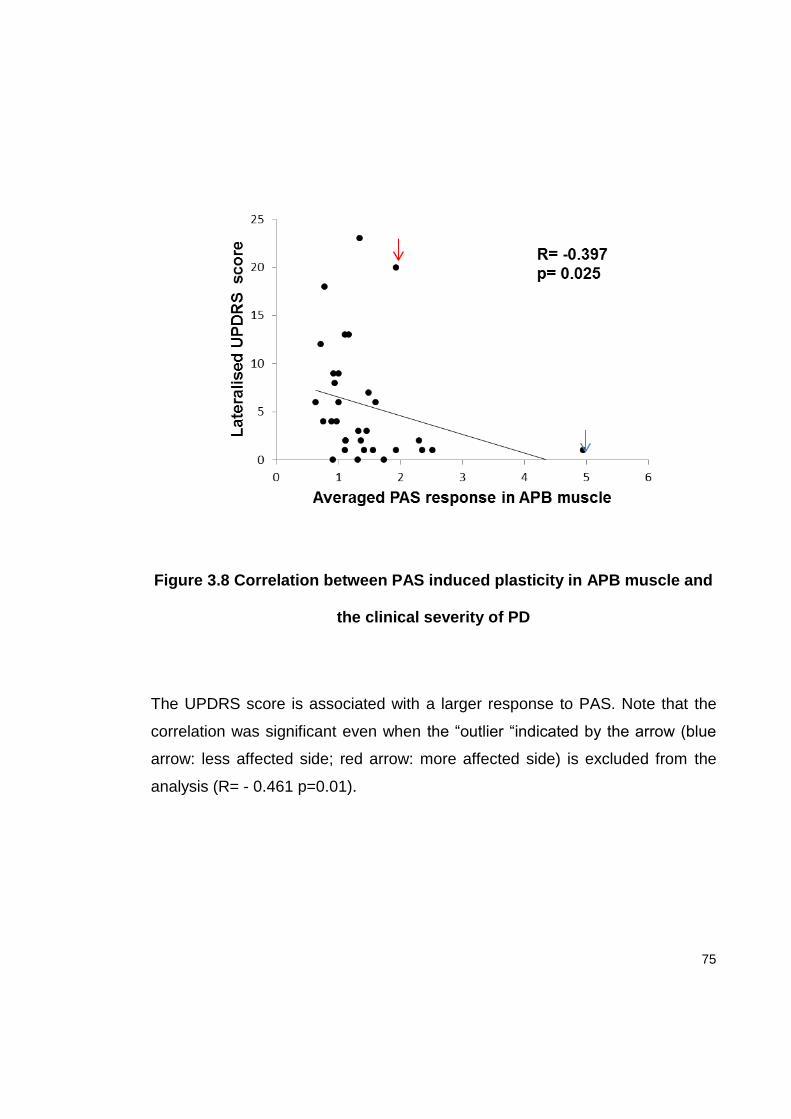
75
Figure 3.8 Correlation between PAS induced plasticity in APB muscle and
the clinical severity of PD
The UPDRS score is associated with a larger response to PAS. Note that the
correlation was significant even when the “outlier “indicated by the arrow (blue
arrow: less affected side; red arrow: more affected side) is excluded from the
analysis (R= - 0.461 p=0.01).
76
3.4.7 Effect of PAS on CSP
Since the baseline CSP was different between groups, to examine the effect of
PAS on CSP, we expressed the duration of CSP at each point after PAS as a
ratio to the baseline CSP and computed 2-way ANOVA with factors GROUP ( 3
levels) and TIME ( 3 levels: normalised CSP duration at 0,15 and 30 min after
PAS). This analysis revealed a difference between groups (factor GROUP (F (2,
45) =5.0; p= 0.01) due to an overall stronger effect of PAS on CSP duration in
the hemisphere contralateral to the more affected side compared to healthy
participants (p=0.01). There was no difference in the CSP duration between
sides in PD patients or between the hemisphere contralateral to the less
affected side in PD and healthy participants.
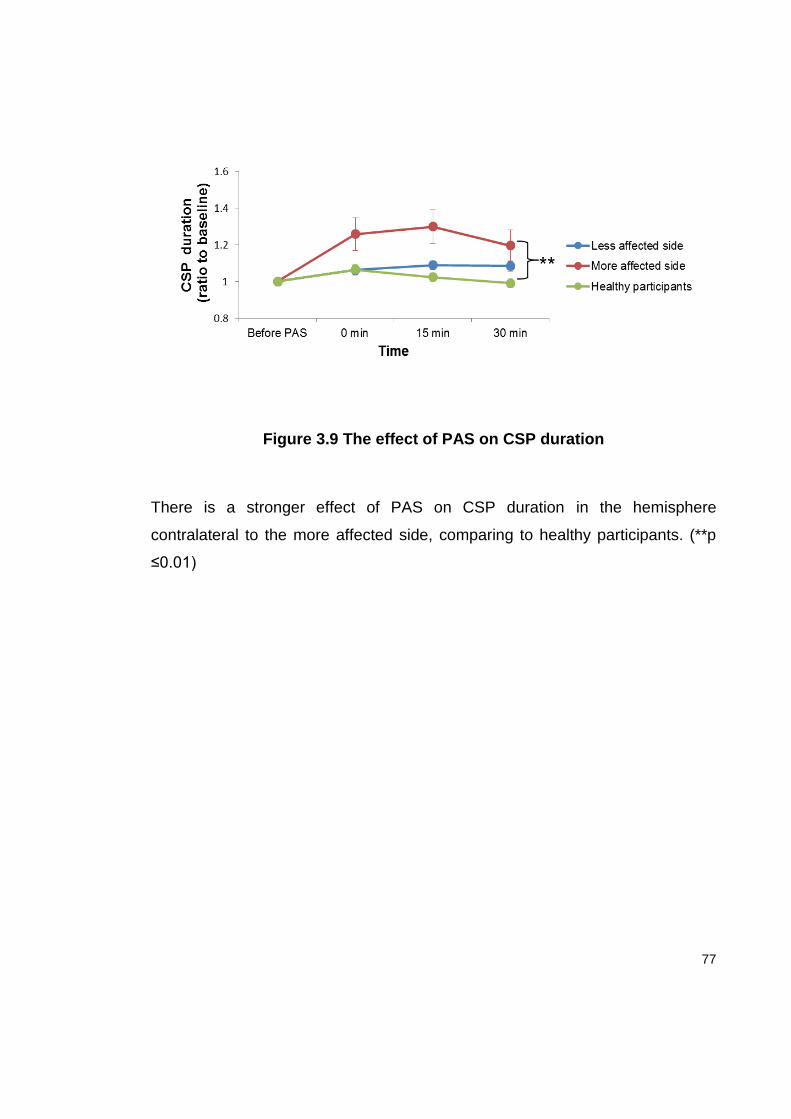
77
Figure 3.9 The effect of PAS on CSP duration
There is a stronger effect of PAS on CSP duration in the hemisphere
contralateral to the more affected side, comparing to healthy participants. (**p
≤0.01)
78
3.5 Discussion
The main finding of this study was that clinically asymmetric PD patients had a
heightened response to a plasticity protocol (PAS) in the hemisphere
contralateral to the less affected hemisphere, in contrast to an absent PAS
response in the more affected hemisphere. The asymmetry in the
electrophysiological findings between the hemispheres was also reflected in
intracortical inhibition; the hemisphere contralateral to the less affected side
showed preserved SICI and CSP, while in the hemisphere contralateral to the
more affected side SICI was reduced and CSP shortened. These asymmetries
cannot be explained by differences in the baseline corticospinal excitability, as
there were no differences in IO curves and motor thresholds between the two
sides.
The absence of the PAS response in the hemisphere contralateral to the more
affected side is in line with previous studies in patients with more advanced PD
(Morgante et al., 2006, Ueki et al., 2006), who showed a decreased response to
PAS in the “off” state that normalised with L-Dopa (Ueki et al., 2006). The
reduced response to PAS is explained as being secondary to an abnormal BG
output (Obeso et al., 2008) or to result from reduced dopamine at the cortical
level (Gaspar et al., 1991). Since there is major bilateral (albeit asymmetric)
dopaminergic loss even in early clinically asymmetrical PD (Tissingh et al.,
79
1998) one might expect a similar reduction of PAS in both hemispheres in the
tested patients. On the contrary, we found an increased (compared with healthy
age matched subjects) LTP-like plasticity with loss of topographic specificity in
the hemisphere contralateral to the less affected side suggesting that there is a
functional reorganisation of sensorimotor cortex contralateral to milder signs of
PD. These findings may represent a compensatory change or they may reflect
disease related maladaptive plasticity. The negative correlation between
severity of motor symptoms and the amount of response to PAS suggests that
this is a compensatory change.
In health, BG neurons are highly “tuned” to fire in specific circumstances related
to different parameters of movement and to contextual cues (Mink and Thach,
1991). There is evidence to suggest that BG dysfunction in PD leads to a loss of
specificity of the surviving neurons and their connected structures (Bronfeld and
Bar-Gad, 2011). Such changes could alter the precise coupling between
sensory inputs and motor outputs that is characteristic of the sensorimotor
cortex. Since PAS relies on the interaction between sensory afferents and
motor output of the homologous muscle, loss of specificity could lead to spread
of facilitation to the ADM muscle on the less affected side. The fact that the
more affected side showed no response to PAS, even in the target APB muscle,
might be explained by severe dopaminergic deficit in the more affected
hemisphere, as seen in more advanced disease. Notably, it has been shown
80
that healthy subjects have an inverted “U”-shaped dopaminergic dose–plasticity
response curve, in which low dopaminergic tone impairs plasticity, while
moderate doses facilitate plasticity (Kuo et al., 2008, Monte-Silva et al., 2009)
However the nature of such a non- linear relationship, although likely important
for understanding our results, has not been specifically investigated in PD.
Another novel finding of the present study is that PD patients had normal SICI in
the less affected hemisphere. SICI was absent in the more affected
hemisphere, in line with previous findings of reduced SICI in more advanced PD
(Ridding et al., 1995a). We used a CS intensity of 90% of RMT to test SICI
since this yields the clearest difference between PD and healthy individuals
(MacKinnon et al., 2005). Detailed studies assessing the SICI- intensity curve or
using different coil orientations indicate that GABAergic inhibitory circuits
mediating SICI might be normal in PD while decreased SICI possibly reflects a
decreased threshold for intracortical facilitation at higher CS intensities
(MacKinnon et al., 2005, Hanajima et al., 2011, Ni et al., 2013). Irrespective of
the underlying mechanism, impaired SICI in PD is thought to be related to
dopaminergic deficiency since it is normalised with dopaminergic treatment
(Ridding et al., 1995a, Pierantozzi et al., 2001). Overall, our results imply that
the dopaminergic deficit in the less affected hemisphere may still be under the
critical threshold to trigger an impairment of SICI. This would be consistent with
a positive correlation between disease severity and reduced SICI.
81
We found significantly shorter CSP in the hemisphere contralateral to the more
affected side and normal CSP in the hemisphere contralateral to the less
affected side, confirming previous reports (Cantello et al., 2007). In the present
study, the PAS effect on CSP was not statistically different between the two
sides in PD patients and was even stronger in the hemisphere contralateral to
the more affected side compared to healthy participants. This is in contrast with
advanced PD patients “off” dopaminergic treatment (Bagnato et al., 2006,
Morgante et al., 2006) and implies that circuits mediating the PAS effect on
CSP are preserved in early PD.
A critical question which is highlighted but left unresolved by this current study
is whether the alterations in the plasticity response in the hemisphere
corresponding to the clinically less affected side represent a beneficial
compensatory change that helps prevent motor symptoms progressing or a
maladaptive change that reflects disease progression. It might be possible to
determine with follow-up of early asymmetric patients if persistence of
enhanced plasticity is associated with slower progression of the motor signs on
the less affected side, suggesting that this electrophysiological change reflects
a beneficial compensatory process, or the converse which would suggest that it
reflects a maladaptive process. The change in asymmetry of the PAS response
between hemispheres over time could be developed into a electrophysiological
marker of disease progression.
82
Changes in sensorimotor cortical Chapter 4
plasticity and intracortical inhibition with
progression of Parkinson’s disease:
revealing compensatory mechanisms
Having demonstrated interhemispheric difference in sensorimotor cortical
plasticity in asymmetric PD patients, the following set of experiments sough to
answer the critical question of whether or not increased sensorimotor cortical
plasticity in the hemisphere contralateral to the less affected side reflects an
adaptive, compensatory change that helps prevent motor symptoms emerging
or it represents a maladaptive change that heralds the symptom progression.
We therefore investigated the relationship between the change in PAS
response and the other TMS measures and progression of motor signs, by
following up the same patients for a period of 1 year.
The work presented in this Chapter is submitted in Journal of Neurology,
Neurosurgery and Psychiatry: Kojovic M, Kassavetis P, Bologna M, Pareés I,
Rubio-Agusti I, Beraredelli A, Edwards MJ, Rothwell JC an Bhatia KP.
Longitudinal electrophysiological study in Parkinson’s disease: revealing
compensatory changes
83
4.1. Summary
The same patients who underwent the experiments presented in Chapter 3
were clinically examined and retested with TMS after 6 and 12 months. On each
occasion we measured MTs, IO curves, SICI, ICF and CSP and sensorimotor
cortical plasticity using the excitatory PAS protocol. Patients were also rated on
the UPDRS scale. We found no difference and no further change in MTs
between sides. The IO curve was steeper (with higher intensities) in the
hemisphere contralateral to the more affected side and this interhemispheric
difference remained constant. The asymmetry in SICI also persisted at 1 year.
In contrast, the initially reduced CSP in the hemisphere contralateral to the
more affected side subsequently increased, resulting in a side-to-side
equalisation of CSP. The interhemispheric differences in sensorimotor cortical
plasticity were still present after 1 year. In individual patients, the decline in
asymmetry of the CSP and the PAS response was correlated with the reduction
in asymmetry of the clinical symptoms. We suggest that an initially reduced
CSP in the hemisphere contralateral to the more affected side and increased
plasticity in the hemisphere contralateral to the less affected side may be
compensatory, preventing clinical expression of disease progression.
4.2. Introduction
84
In PD motor symptoms emerge after a prolonged period of dompaminergic loss,
suggesting there is activity of adaptive or compensatory mechanisms (Zigmond
et al., 1990, Hornykiewicz, 1998, Lee et al., 2000, Appel-Cresswell et al., 2010).
In the early preclinical stage, adaptive changes occur within the nigrostriatal
synapses, and through various mechanisms to keep synaptic dopamine at
relatively constant level (Hornykiewicz and Kish, 1987, Zigmond et al., 1989,
Zigmond, 1997). With further neurodegeneration, nigrostriatal compensatory
mechanisms can no longer keep up with on-going dopaminergic cell loss and
BG output structures become further involved in the compensatory process
(Bezard et al., 2003, Boulet et al., 2008). Finally, by the time of the emergence
of motor signs, compensation presumably engages cerebral circuits outside the
BG (Bezard et al., 2001, Obeso et al., 2004) including thalamo-cortical
connections and the cerebellum (Bezard et al., 2003, van Nuenen et al., 2009,
van Nuenen et al., 2012). The role of the sensorimotor cortex in compensation
for the dopaminergic deficit has been less well studied (Sabatini et al., 2000).
As found in our previous study, presented in Chapter 3, clinical asymmetry of
motor signs in early PD is reflected in interhemispheric asymmetry of the
electrophysiological measures: the less affected (LA) hemisphere has increased
sensorimotor cortical plasticity as measured by the response to PAS25 protocol,
while in the more affected (MA) hemisphere plasticity is reduced. A critical
question arising from these results is the pathophysiological significance of
enhanced plasticity: does increased motor cortical plasticity on the LA
85
hemisphere reflect an adaptive change that helps prevent motor symptoms
emerging or does it represent maladaptive change that heralds disease
progression? In the present study we aimed to answer this question by
investigating the relationship between change in the PAS response (and other
TMS measures) and progression of the motor signs in the same PD patients
during a period of one year.
4.3. Methods
4.3.1. Patients
From the 16 drug- naive patients who completed baseline set of experiments
described in Chapter 3, 12 patients completed the follow-up study. The
remaining four patients were unavailable due to different reasons: one was
undergoing treatment for newly diagnosed breast carcinoma, one lived remotely
and was not keen to travel the long distance and two decided not to participate
further, without giving particular reasons. Subsequent to the baseline set of
experiments (for which all patients were drug-naïve), the patients underwent a
consultation with a movement disorders specialist and were given all the
necessary information about available symptomatic treatments. Because of the
ethical issues, patients were not randomised into treated and untreated groups,
but it was dependent upon themselves and their treating physician to decide

86
whether and when to start treatment for PD and with what kind of dopaminergic
medications. Irrespective of the on-going treatment, patients were retested at 6
months and 12 months. At the time of follow up, all treated patients had been on
a stable dosage of dopaminergic medication for previous the 3 months and
were tested in an off-state after overnight withdrawal of treatment (at least 12
hours). Patients’ demographic, clinical and treatment data are given in table 4.
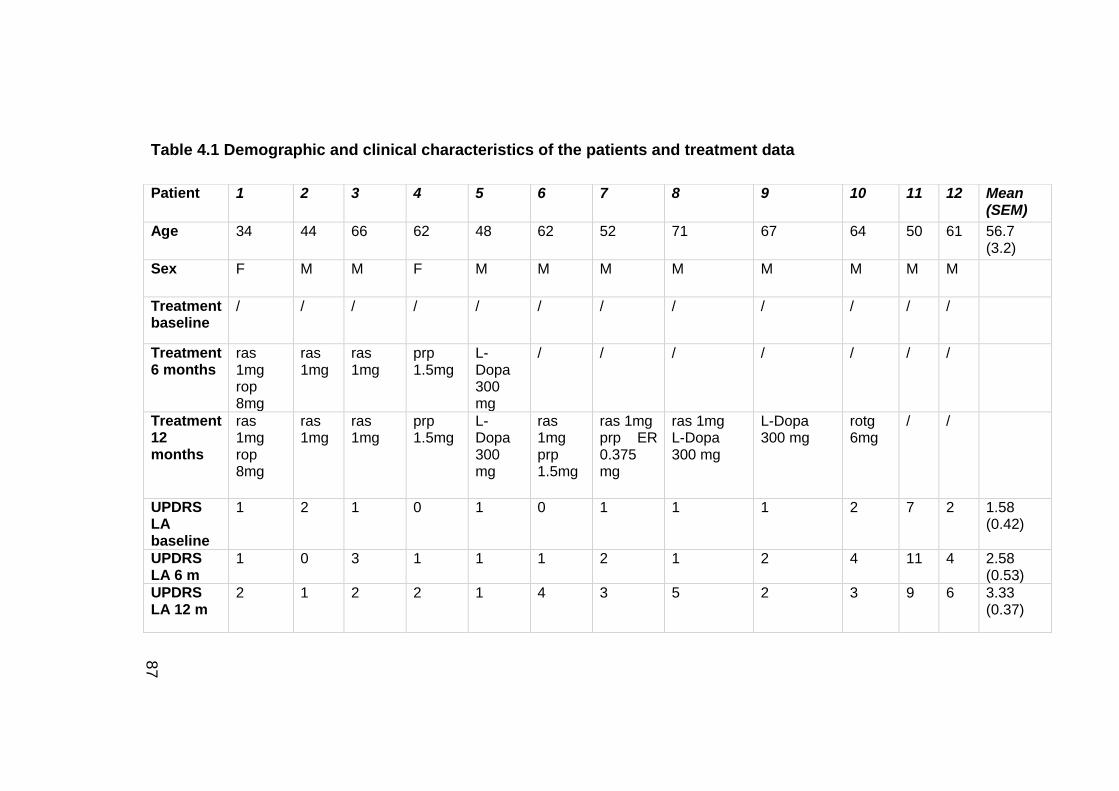
87
Table 4.1 Demographic and clinical characteristics of the patients and treatment data
Patient 1 2 3 4 5 6 7 8 9 10 11 12 Mean (SEM)
Age 34 44 66 62 48 62 52 71 67 64 50 61 56.7 (3.2)
Sex F M M F M M M M M M M M
Treatment baseline
/ / / / / / / / / / / /
Treatment 6 months
ras 1mg rop 8mg
ras 1mg
ras 1mg
prp 1.5mg
L-Dopa 300 mg
/ / / / / / /
Treatment 12 months
ras 1mg rop 8mg
ras 1mg
ras 1mg
prp 1.5mg
L-Dopa 300 mg
ras 1mg prp 1.5mg
ras 1mg prp ER 0.375 mg
ras 1mg L-Dopa 300 mg
L-Dopa 300 mg
rotg 6mg
/ /
UPDRS LA baseline
1 2 1 0 1 0 1 1 1 2 7 2 1.58 (0.42)
UPDRS LA 6 m
1 0 3 1 1 1 2 1 2 4 11 4 2.58 (0.53)
UPDRS LA 12 m
2 1 2 2 1 4 3 5 2 3 9 6 3.33 (0.37)
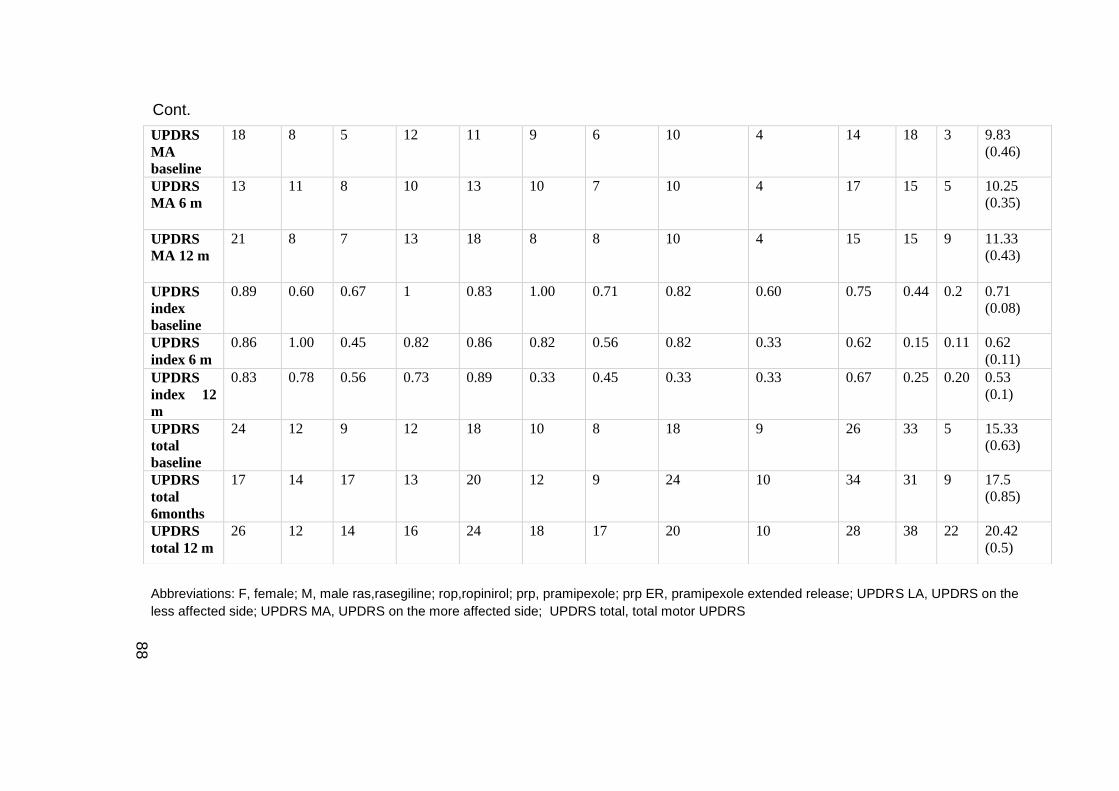
88
Abbreviations: F, female; M, male ras,rasegiline; rop,ropinirol; prp, pramipexole; prp ER, pramipexole extended release; UPDRS LA, UPDRS on the
less affected side; UPDRS MA, UPDRS on the more affected side; UPDRS total, total motor UPDRS
UPDRS
MA
baseline
18 8 5 12 11 9 6 10 4 14 18 3 9.83 (0.46)
UPDRS
MA 6 m
13 11 8 10 13 10 7 10 4 17 15 5 10.25 (0.35)
UPDRS
MA 12 m
21 8 7 13 18 8 8 10 4 15 15 9 11.33 (0.43)
UPDRS
index
baseline
0.89 0.60 0.67 1 0.83 1.00 0.71 0.82
0.60 0.75 0.44 0.2 0.71 (0.08)
UPDRS
index 6 m 0.86 1.00 0.45 0.82 0.86 0.82 0.56 0.82 0.33 0.62 0.15 0.11 0.62
(0.11)
UPDRS
index 12
m
0.83 0.78 0.56 0.73 0.89 0.33 0.45 0.33 0.33 0.67 0.25 0.20 0.53 (0.1)
UPDRS
total
baseline
24 12 9 12 18 10 8 18 9 26 33 5 15.33 (0.63)
UPDRS
total
6months
17 14 17 13 20 12 9 24 10 34 31 9 17.5 (0.85)
UPDRS
total 12 m 26 12 14 16 24 18 17 20 10 28 38 22 20.42
(0.5)
Cont.
89
4.3.2. Clinical measures
Clinical disease severity was assessed with the motor section of the MDS-
UPDRS scale (Goetz et al., 2008b). For the less and more affected side,
lateralised UPDRS scores were calculated as the sum of the items for
bradykinesia, rigidity and tremor (items 3.3 to 3.8 and 3.15 to 3.17) for each
side. To express the severity of motor symptoms and their distribution between
sides within one measure we calculated an UPDRS asymmetry index, given as:
(MA-LA)/ (MA + LA), where MA and LA represent lateralised UPDRS score from
more and less affected side respectively (Espay et al., 2005, Li et al., 2007).
The UPDRS asymmetry index ranges from 1 when symptoms are only on one
side (i.e. complete asymmetry of symptoms) to 0, when symptoms are evenly
distributed.
4.3.3. EMG recordings and TMS
We used exactly the same methods as performed for the baseline set of
experiments (chapter 3).
4.3.4. Experimental design
At baseline, 6 months and 12 months patients were tested on both
hemispheres, corresponding to the less and more affected side in different TMS
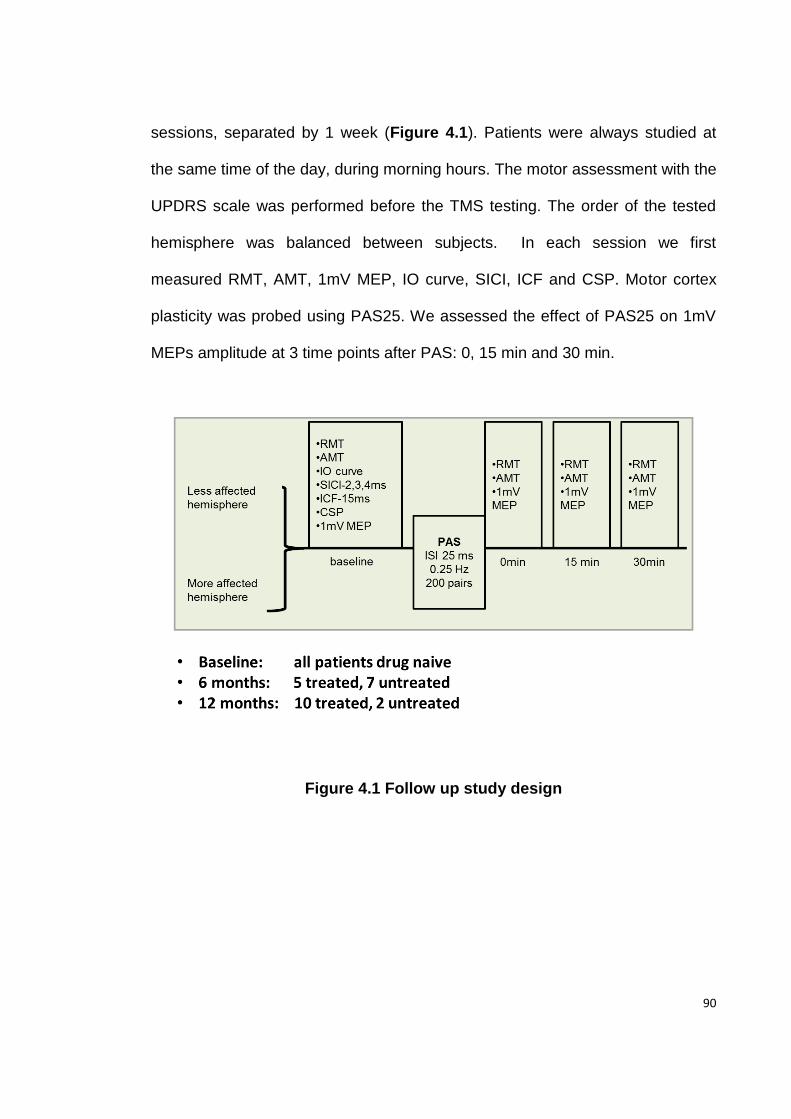
90
sessions, separated by 1 week (Figure 4.1). Patients were always studied at
the same time of the day, during morning hours. The motor assessment with the
UPDRS scale was performed before the TMS testing. The order of the tested
hemisphere was balanced between subjects. In each session we first
measured RMT, AMT, 1mV MEP, IO curve, SICI, ICF and CSP. Motor cortex
plasticity was probed using PAS25. We assessed the effect of PAS25 on 1mV
MEPs amplitude at 3 time points after PAS: 0, 15 min and 30 min.
Figure 4.1 Follow up study design
91
4.3.5 Statistical analysis
Since all patients were tested “off” dopaminergic medications, we began our
analysis by considering treated and untreated patients together. Friedman
ANOVAs were used to assess changes in the motor total UPDRS score, the
lateralised UPDRS score and the UPDRS index over time (baseline, 6 months,
and 12 months). To test the changes in electrophysiological measures we used
ANOVAs with factors TIME and SIDE (for RMT, AMT, CSP and ICF) or
ANOVAs with additional within-subjects factors depending on the variable
tested. For changes of IO curves factor STIMULUS INTENSITY (10 levels of
stimulator output intensity) was used. For analysis of SICI, for each ISI,
conditioned MEP amplitude was averaged and normalized to average
unconditioned MEP amplitude and entered into ANOVA with factors: SIDE,
TIME and ISI ( 2,3, and 4 ms). For analysis of the PAS effect, for each time
point after PAS the amplitude of the MEP was averaged and normalized to the
average MEP amplitude before PAS and entered into ANOVA with factors:
TIME, SIDE, MUSCLE (APB and ADM) and TIME POINT AFTER PAS (0 , 15
min and 30 min after PAS ). In addition, we expressed the interhemispheric
difference in electrophysiological measures between the LA and MA side as the
ratio between sides and entered it in ANOVA with factor TIME.
In a secondary analysis, we compared treated and non-treated PD patients. At
6 months, we used ANOVA with the factor GROUP (treated vs. untreated) as a
92
between-subject factor and factor TIME (baseline vs. 6 months) and SIDE as
within subjects factor. At 12 months, the majority of patients were treated and
the difference between treated and untreated could not be assessed due to the
small number of untreated patients. We however assessed if there were
differences between “early” vs. “late” treated patients. Early treatment refers to
initiation of treatment within 1 month of the baseline set of experiments (5
patients), while late treatment refers to initiation of treatment after the second
set of experiments (5 patients) or no treatment at all at the time of 3rd set of
experiments (2 patients).
To determine the relationship between changes in motor scores and the
electrophysiological measures over the all three longitudinal time points we
computed within-subject correlation coefficients (Bland and Altman, 1995) using
the UPDRS index as an outcome variable, while subjects and the
interhemispheric ratio of the electrophysiological measure of interest ( PAS
ratio, SICI ratio or CSP ratio) were predictor variables. Statistical analysis was
done on the raw data. However, to plot the correlation figures, data at each
time point were first expressed as a difference ( delta) between measurement
at that time point and patient‘s average of all 3 time points and this value was
then expressed as a fraction of the individual patient's average, using the
following computation : (CSP ratio baseline, 6 or 12 months- average CSP ratio) /
average CSP ratio or (PAS ratio baseline, 6 or 12 months- average PAS ratio) / average
93
PAS ratio; and (UPDRS index baseline, 6 or 12 months- average UPDRS index) /
average UPDRS index.
4.4. Results
4.4.1. Clinical measures
Results on changes in clinical measures are illustrated in Figure 4.2. As noted
in the table 4. 1, none of the patients were taking any anti-parkinsonian
medication at baseline, five had started treatment at 6 months and 10 of the 12
were treated at 12 months. As expected, the patients’ practically defined “off”
state deteriorated gradually over time. A Friedman ANOVA on total UPDRS
score revealed a significant effect of TIME (χ2 =12.6; p =0.002) which was due
to the score being higher at 12 months compared to baseline (p=0.003), while
the difference between baseline vs. 6 months and 6 vs. 12 months just failed to
reach significance (p=0.06 and p=0.09, respectively). Breaking down the data
into results from the LA and MA sides showed that although the scores
increased on both sides, this was significant only on the LA side (χ 2 =10.6; p
=0.005), due to the score being higher at 12 months compared to baseline
(p=0.007), while there was no significant difference between 6 months and
baseline (p=0.06) or 6 vs. 12 months (p=0. 2). For MA side, there was no
significant change in the UPDRS score over time (χ 2 =3.3; p =0.2). Despite
changes in the lateralised scores, the side difference in symptom severity
persisted, with the MA side having higher UPDRS at all 3 time points (Wilcoxon
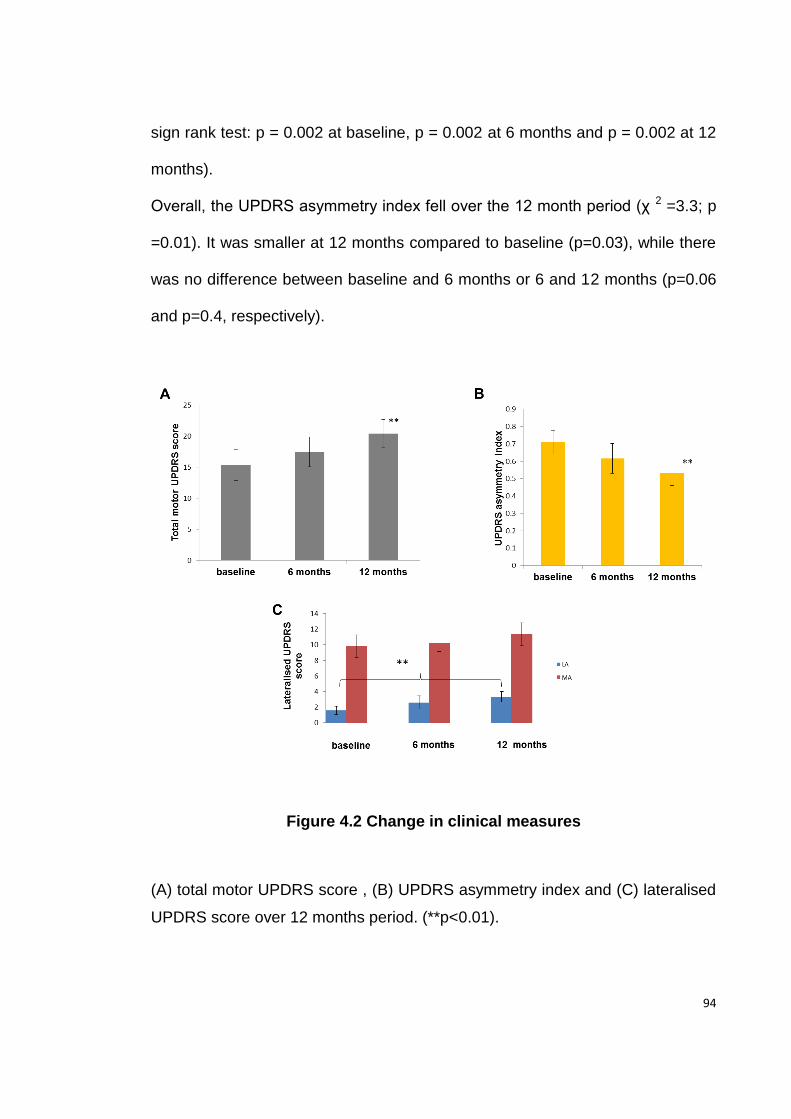
94
sign rank test: p = 0.002 at baseline, p = 0.002 at 6 months and p = 0.002 at 12
months).
Overall, the UPDRS asymmetry index fell over the 12 month period (χ 2 =3.3; p
=0.01). It was smaller at 12 months compared to baseline (p=0.03), while there
was no difference between baseline and 6 months or 6 and 12 months (p=0.06
and p=0.4, respectively).
Figure 4.2 Change in clinical measures
(A) total motor UPDRS score , (B) UPDRS asymmetry index and (C) lateralised
UPDRS score over 12 months period. (**p<0.01).
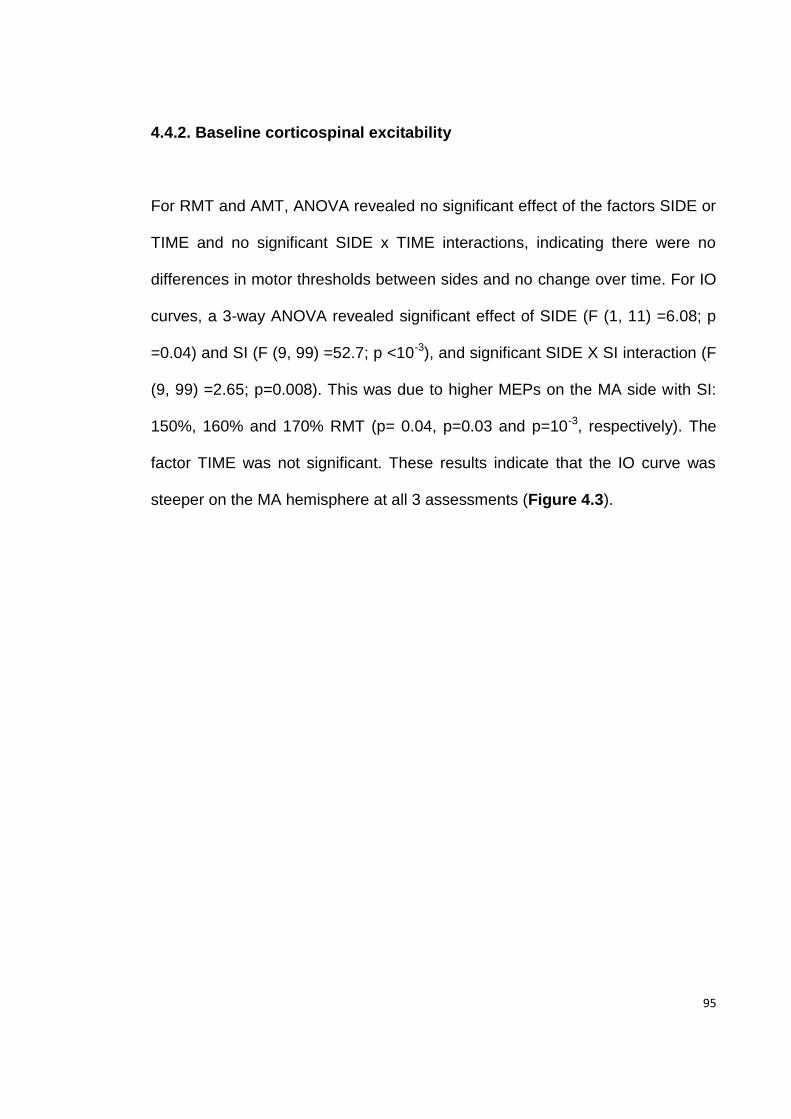
95
4.4.2. Baseline corticospinal excitability
For RMT and AMT, ANOVA revealed no significant effect of the factors SIDE or
TIME and no significant SIDE x TIME interactions, indicating there were no
differences in motor thresholds between sides and no change over time. For IO
curves, a 3-way ANOVA revealed significant effect of SIDE (F (1, 11) =6.08; p
=0.04) and SI (F (9, 99) =52.7; p <10-3), and significant SIDE X SI interaction (F
(9, 99) =2.65; p=0.008). This was due to higher MEPs on the MA side with SI:
150%, 160% and 170% RMT (p= 0.04, p=0.03 and p=10-3, respectively). The
factor TIME was not significant. These results indicate that the IO curve was
steeper on the MA hemisphere at all 3 assessments (Figure 4.3).
96
Figure 4.3 IO Curve- change over 12 months
The mean MEP amplitude (±SEM) is given on the y-axis against the stimulus
intensity given on the x-axis (as a percentage of RMT stimulus intensity). There
is an interhemispheric difference in IO curve: at higher stimulus intensity IO
curve is steeper in the hemisphere contralateral to the more affected side
comparing to the hemisphere contralateral to the less affected side. This
difference between sides is evident at baseline, and even more so at 6 months
and 12 months.
97
4.4.3. SICI
Like the IO curves above, SICI was less effective in the MA hemisphere but did
not change over the 12 month assessment period. A 3-way ANOVA showed
significant effects of SIDE (F (1, 11) =11.1; p=0.006) and ISI (F (2, 22) =10.51;
p <10-3) due to the fact that there was less effective SICI on the MA hemisphere
and greater SICI at ISIs 2 ms and 3 ms compared to 4 ms (p <10-3 and p= 0.01,
respectively). There was no effect of TIME nor any 2-way or 3-way interactions
(Figure 4.4). There was no correlation between changes in SICI
interhemispheric ratio and changes in UPRDS asymmetry index.
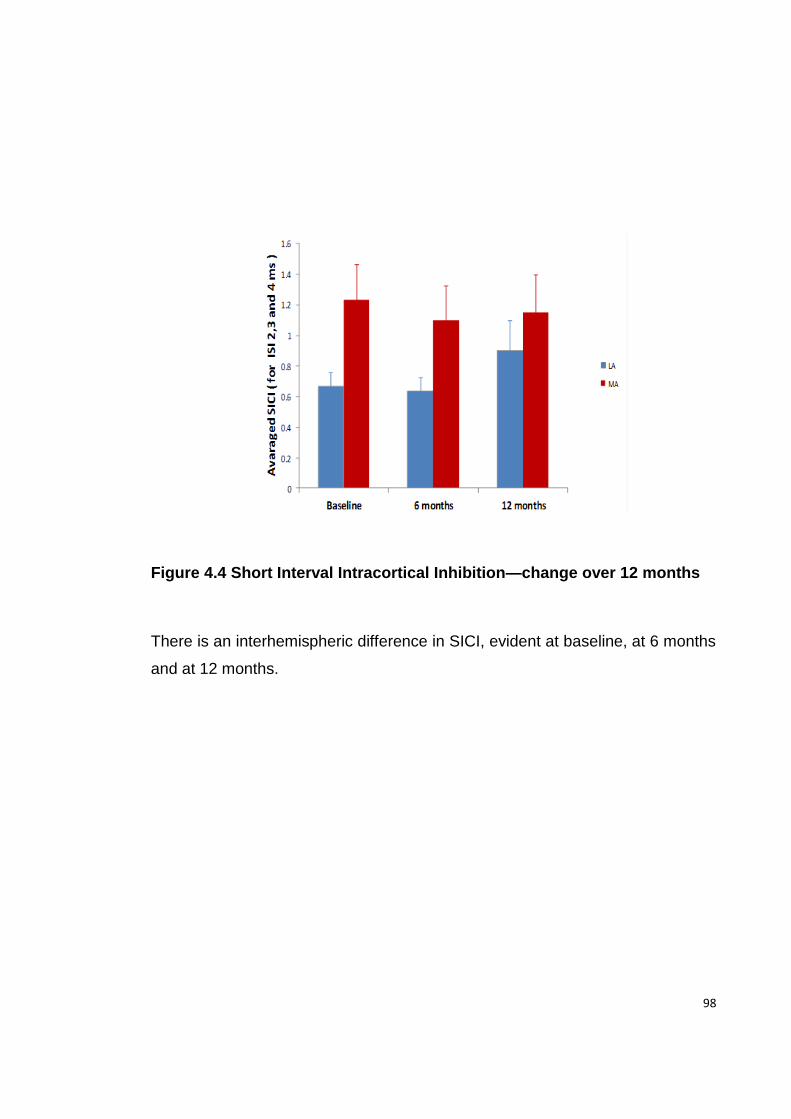
98
Figure 4.4 Short Interval Intracortical Inhibition—change over 12 months
There is an interhemispheric difference in SICI, evident at baseline, at 6 months
and at 12 months.
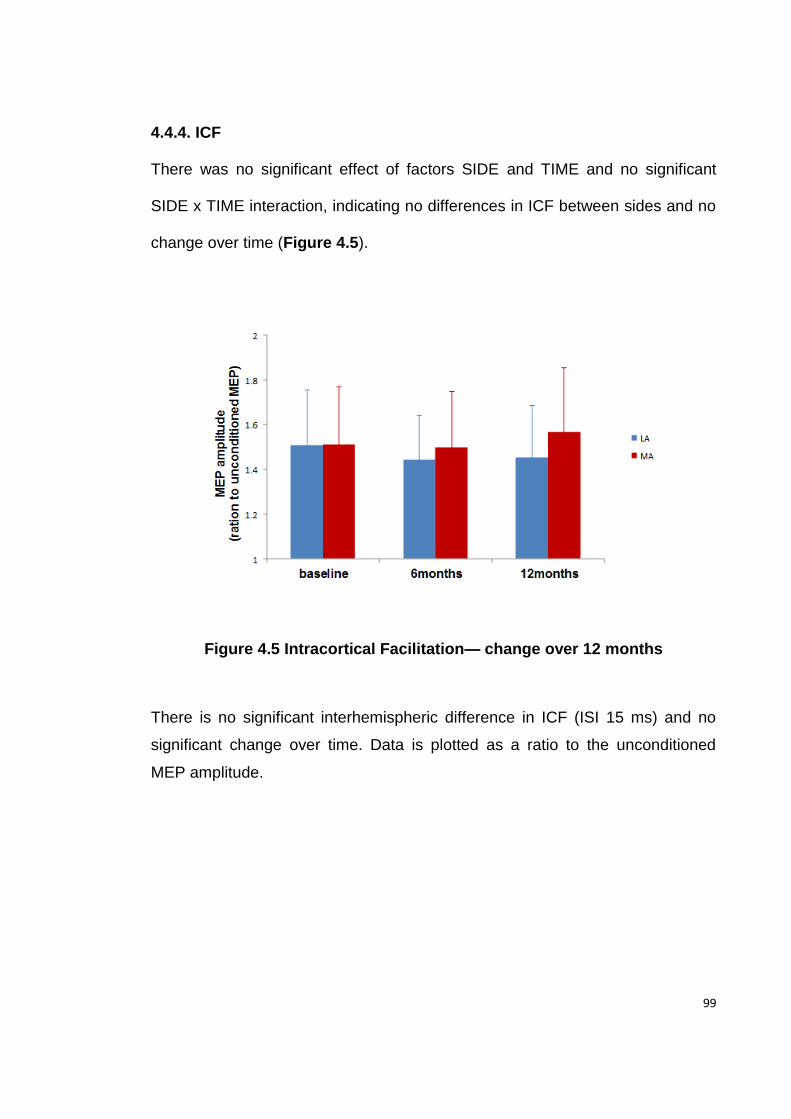
99
4.4.4. ICF
There was no significant effect of factors SIDE and TIME and no significant
SIDE x TIME interaction, indicating no differences in ICF between sides and no
change over time (Figure 4.5).
Figure 4.5 Intracortical Facilitation— change over 12 months
There is no significant interhemispheric difference in ICF (ISI 15 ms) and no
significant change over time. Data is plotted as a ratio to the unconditioned
MEP amplitude.
100
4.4.5. CSP
ANOVA revealed no significant effect of the factors TIME or SIDE. However
there was significant TIME X SIDE interaction (F (2, 22) =5.42; p=0.01) due to
the fact that the CSP in the MA hemisphere was longer at 6 and 12 months
compared to baseline (p=0.02 and p= 0.02, respectively). Thus, an initially
shorter CSP in the MA hemisphere increased at 6 months, resulting in
equalisation of the CSP between sides (Figure 4.6). There was no change on
the LA hemisphere. Within-subject correlation analysis revealed that the
reduced difference between the CSP duration in the two hemispheres was
correlated with the decrease in UPDRS asymmetry index (r=0.5, p=0.02)
(Figure 4.7)
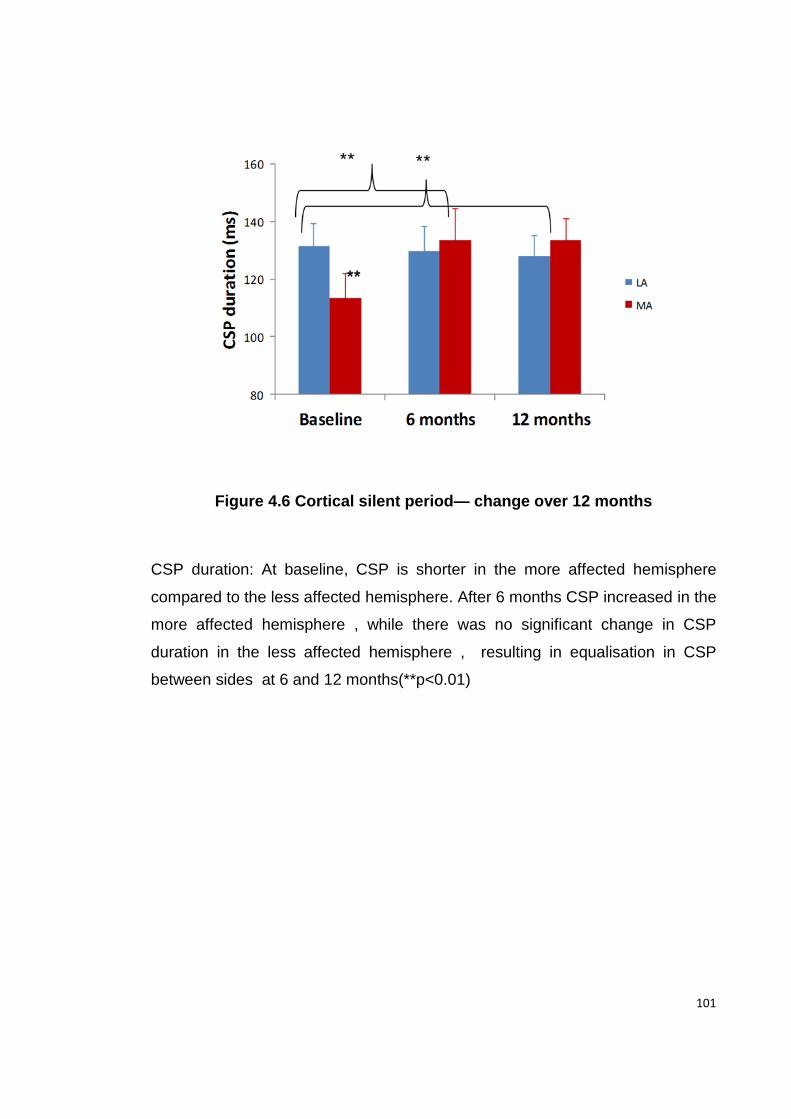
101
Figure 4.6 Cortical silent period— change over 12 months
CSP duration: At baseline, CSP is shorter in the more affected hemisphere
compared to the less affected hemisphere. After 6 months CSP increased in the
more affected hemisphere , while there was no significant change in CSP
duration in the less affected hemisphere , resulting in equalisation in CSP
between sides at 6 and 12 months(**p<0.01)
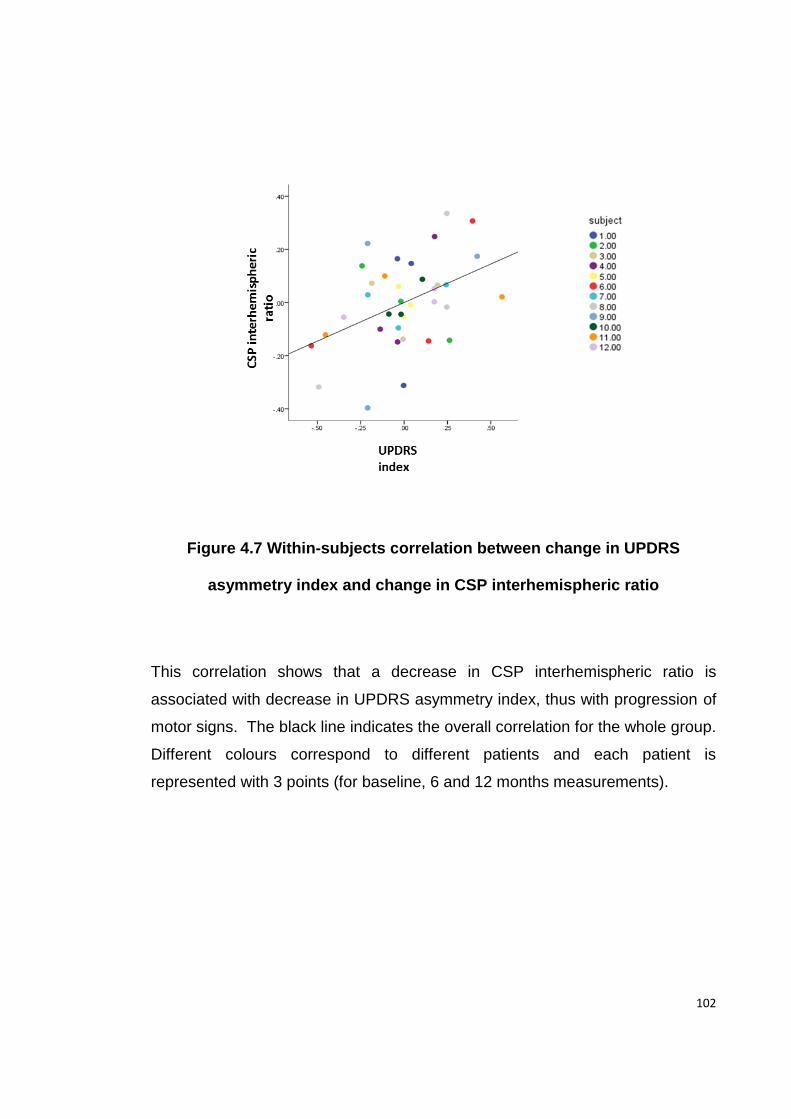
102
Figure 4.7 Within-subjects correlation between change in UPDRS
asymmetry index and change in CSP interhemispheric ratio
This correlation shows that a decrease in CSP interhemispheric ratio is
associated with decrease in UPDRS asymmetry index, thus with progression of
motor signs. The black line indicates the overall correlation for the whole group.
Different colours correspond to different patients and each patient is
represented with 3 points (for baseline, 6 and 12 months measurements).
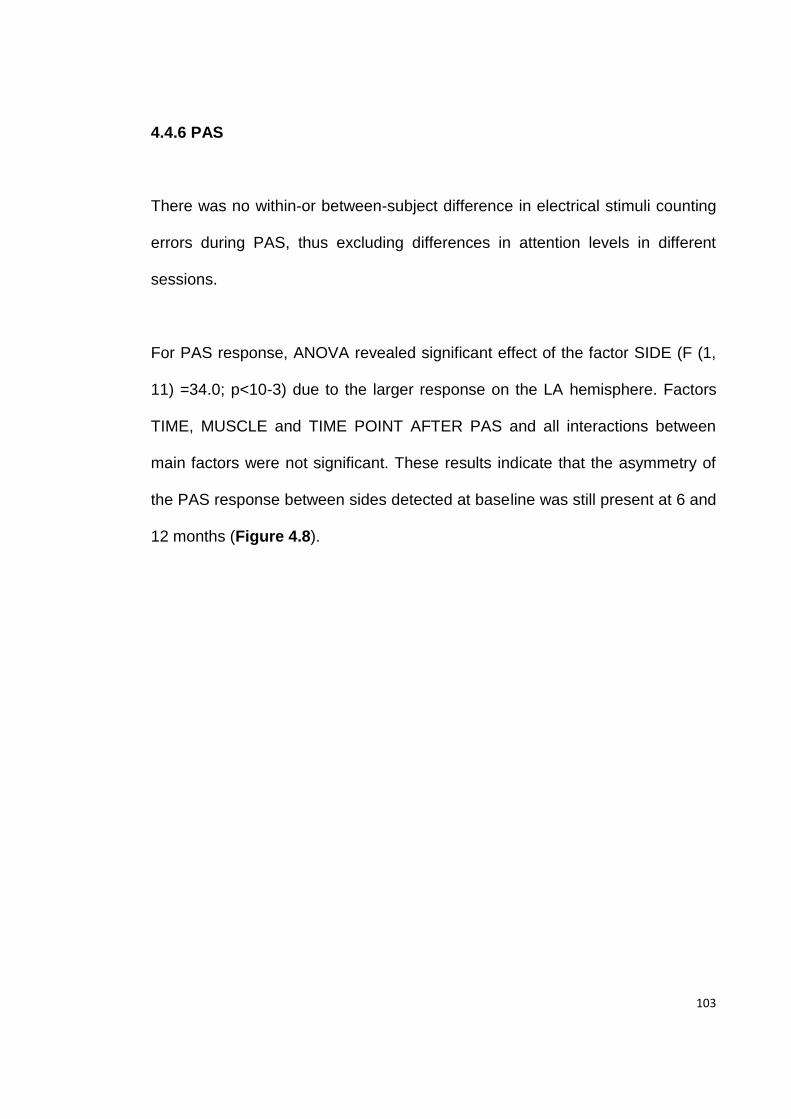
103
4.4.6 PAS
There was no within-or between-subject difference in electrical stimuli counting
errors during PAS, thus excluding differences in attention levels in different
sessions.
For PAS response, ANOVA revealed significant effect of the factor SIDE (F (1,
11) =34.0; p<10-3) due to the larger response on the LA hemisphere. Factors
TIME, MUSCLE and TIME POINT AFTER PAS and all interactions between
main factors were not significant. These results indicate that the asymmetry of
the PAS response between sides detected at baseline was still present at 6 and
12 months (Figure 4.8).
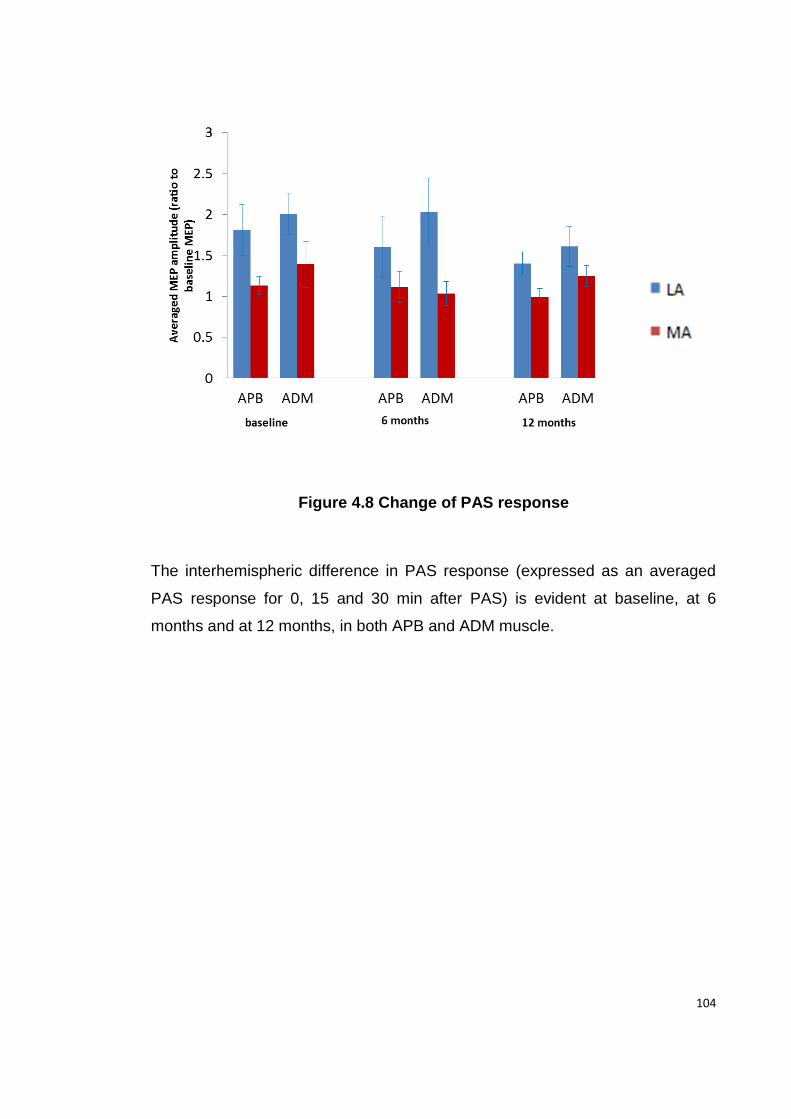
104
Figure 4.8 Change of PAS response
The interhemispheric difference in PAS response (expressed as an averaged
PAS response for 0, 15 and 30 min after PAS) is evident at baseline, at 6
months and at 12 months, in both APB and ADM muscle.
105
However there were substantial inter-individual differences in how PAS
changed over time. Within individual patients, a decrease in the PAS
interhemispheric ratio was associated with decrease in UPDRS asymmetry
index (Figure 4.9).There was a positive within-subjects correlation between
APB interhemispheric (and ADM interhemispheric ratio) and UPDRS
asymmetry index (APB: r=0.51, p=0.03 and ADM: r=0.43, p=0.03).
Figure 4.9 Within-subjects correlation between change in UPDRS
asymmetry index and change in PAS interhemispheric ratio.
This correlation shows that the decrease in PAS interhemispheric ratio in both
APB and ADM muscles is associated with a decrease in the UPDRS asymmetry
index, and thus with progression of the motor signs. Black lines indicate the
overall correlation for the whole group.
106
4.4.7 Treated vs. untreated patients and Early vs. Late treated patients
For all clinical measures and all TMS measures there was no difference
between treated and untreated patients or between early and late treated, as
indicated by no significant effect of the factor GROUP and no interactions of
GROUP with TIME in any of the analysis.
4.5. Discussion
This is the first longitudinal study that was design to address changes in
different electrophysiological measures with the progression of early PD. In the
first year after initial presentation, there was a gradual decrease in clinical
asymmetry. Despite the clinical deterioration, there was no overall change in:
motor thresholds to TMS, IO curves of MEP recruitment; GABAa inhibition
measured in the SICI protocol, ICF; or synaptic plasticity of sensorimotor cortex
measured using the PAS protocol. Initial asymmetries in IO curves, SICI and
PAS persisted between the less and more affected hemispheres. The only
physiological measure that changed was the GABAb mediated CSP, which was
shorter in the LA hemisphere at onset but became equalised between the two
sides after 6 months and remained the same after 1 year. Although the sample
was small, there was no difference between “early” and “late” treated patients,
similar to previous physiological work that suggested that there are no long-term
107
modifying effects of L-Dopa on electrophysiological measures (Kacar et al.,
2012).
The apparent lack of change in the mean data, however, conceals a variation in
the rate of progression in individual patients. When we expressed the clinical
scores conventionally as an asymmetry index, which normalises the between-
side differences to the total score on both sides, there was a significant
correlation between the reduction in clinical asymmetry and the corresponding
reductions in the asymmetry of CSP and PAS response.
Changes in intracortical inhibition and facilitation
Pharmacologically, short-interval intracortical inhibition is primarily mediated by
GABAa receptors and the cortical silent period is subserved by GABAb
receptors (Ziemann, 2004, Di Lazzaro et al., 2006). Our results on SICI and
CSP suggest that these circuits are differently affected during the course of PD.
While the interhemispheric difference in SICI detected at baseline persisted
after 6 and 12 months, the initial asymmetry of the CSP between hemispheres
subsequently disappeared: the shorter CSP on the MA side increased towards
values for the LA side at 6 months. Interestingly, a decrease in the
interhemispheric CSP ratio correlated with a decrease in the UPDRS
asymmetry index. Thus an initially shorter CSP in the MA hemisphere may
reflect a compensatory change serving to facilitate the movement on the side
most affected by symptoms. Prolongation of CSP could also be interpreted as
108
an effect of dopaminergic treatment, but this seems unlikely given that the same
change occurred in both treated and untreated patients.
There was no side difference in ICF and no change over 1 year. Many previous
studies (Ridding et al., 1995a, Berardelli et al., 1996, Strafella et al., 2000,
Kacar et al., 2012) showed normal ICF in patients with more advanced PD,
which together with our results suggest that there is no major involvement of the
interneurons mediating ICF during the course of PD.
Changes in sensorimotor cortical plasticity
We described in Chapter 3 that early PD patients have an enhanced response
to PAS25 on the LA side while the response to PAS25 is absent on the MA
side. In the present study, we demonstrate that the interhemispheric difference
in sensorimotor cortical plasticity still persists after 1 year. However, this
conceals a large variability between patients. In some patients, the asymmetry
in PAS response between hemispheres declined whereas there was little
change in others. Overall, the rate of change in PAS asymmetry correlated well
with the change in asymmetry of the UPDRS: the greater the reduction in PAS
asymmetry, the greater the reduction in the asymmetry of the UPDRS. Notably,
asymmetry in IO curves is unlikely to be the cause of an asymmetric PAS
response in our patients, because if this were the case, we would expect a
greater response to PAS on the side with the steeper IO curve, i.e. the MA side
(Rosenkranz, 2010). We found the opposite pattern.
109
Therefore our results challenge the classical view of a generally reduced
sensorimotor cortical plasticity in PD. Apart from one study (Bagnato et al.,
2006), there is a general consensus that the response to PAS25 is reduced or
absent in patients tested “off” medications (Morgante et al., 2006, Ueki et al.,
2006, Kacar et al., 2012, Kawashima et al., 2013, Kishore et al., 2013, Udupa
and Chen, 2013). However, all these studies dealt with patients who had more
advanced PD compared to our patients. Our present results show that motor
cortex plasticity can change from being increased early in the course of disease
(as it was in the LA hemisphere of our patients), to a complete loss of plasticity
response (as in the MA hemisphere in the present patients). We suspect that
the two sides in our patients will reach a similar pattern of electrophysiological
abnormalities with further disease progression.
Our hypothesis is that the interhemispheric difference in sensorimotor cortical
plasticity in early PD represents an adaptive rather than maladaptive change.
The increased plasticity at, and perhaps prior to clinical onset may allow cortical
areas to compensate in some way for the underlying deterioration in BG output.
A possible role of interhemispheric interaction in compensation for
dopaminergic deficit has been proposed by Blesa et al.(Blesa et al., 2011),
based on the 18F-DOPA PET study of asymmetric PD patients and
experiments on MPTP lesioned monkeys. It was proposed that a higher
asymmetry of nigrostriatal dopamine deficit, as defined by the relatively
110
preserved dopaminergic innervation in the less-affected compared to the more
affected striatum, might relate to a better compensatory capacity, resulting in
higher thresholds for the appearance of motor symptoms on the clinically less
affected side. Our study also supports the role of asymmetric hemispheric
reorganisation in compensation for PD, although it cannot address the
mechanism through which this might be occurring.
Limitations of the study
There are some interpretational issues I would like to mention. The association
between change in interhemispheric difference in cortical plasticity and clinical
progression is not necessarily sufficient to confirm a direct relationship. Thus,
we cannot exclude the existence of some third factor that could have influenced
both variables independently. This however seems less likely in the light of a
number of previous studies showing the relationship between various excitatory
plasticity protocols that work by inducing LTP-like changes at cortical synapses,
and improvement in the motor symptoms of PD (Khedr et al., 2003, Khedr et al.,
2006, Lomarev et al., 2006).
We found no significant difference between treated and untreated patients or
between early and late treated patients in clinical or electrophysiological
measures, suggesting that early initiation of dopaminergic treatment does not
affect the electrophysiological changes that occur with disease progression.
111
However, there are limitations to be considered. First, the present study was not
primarily aimed to assess the effect of treatment, considering the small number
of patients in each group and the relatively short follow-up period. Therefore,
subtle differences could have been missed and we cannot exclude that a
potentially modifying effect of early dopamine replacement would become
apparent after a longer follow- up period. However, this is not the first time that
no differences between treated and non-treated patients have been identified.
Kacar et al. (2012) also found no clinical differences and no differences in TMS
measures, including PAS response, between PD patients who have never been
treated with dopaminergic medications and the group of treated patients with
similar disease duration, arguing against a disease modifying effect of early
treatment.
Finally, as we used as measures of clinical progression a change in lateralised
UPDRS score and UPDRS index, that both take into account 3 cardinal motor
signs (i.e. rigidity, bradykinesia and tremor) together, we cannot comment if
predominant presence of one of the motor signs is associated with specific
electrophysiological changes in the sensorimotor cortex. This could be
addressed in future studies with a large enough sample of PD patients.
Conclusion
Changes in motor cortex plasticity and GABAb intracortical inhibition are likely
sensitive electrophysiological measures of clinical progression in PD. Enhanced
cortical plasticity and shortening of the CSP probably reflect compensatory

112
processes in early PD, which might be relevant for potential therapeutic
interventions using non-invasive brain stimulation techniques.
113
Modulation of sensorimotor Chapter 5
cortical plasticity with Botulinum Toxin
injections in primary dystonia
Abnormal brain plasticity is thought to play a major role in pathophysiology of
primary dystonias. In particular, it has been shown that sensorimotor cortical
plasticity is increased as measured by response to a PAS protocol that relies on
the integration of sensory input and motor output. In the following set of
experiments, we investigated if modification of the afferent input by botulinum
toxin (BT) injections may affect sensorimotor cortical plasticity.
The work presented in this Chapter is published in the form of a research
article: Kojovic M, Caronni A, Bologna M, Rothwell JC, Bhatia KP, Edwards MJ.
Botulinum toxin injections reduce associative plasticity in patients with primary
dystonia. Mov Disord. 2011 Jun;26(7):1282-9.
5.1 Summary
BT injections ameliorate dystonic symptoms by blocking the neuro-muscular
junction and weakening dystonic contractions. We investigated whether BT
injections in dystonia patients also affect the integrity of sensorimotor cortical
plasticity, one of the key pathophysiological features of dystonia. We applied
114
rPAS protocol, known to induce LTP-like changes in the primary motor cortex
hand area (Quartarone et al., 2006a) to 12 patients with cervical dystonia
before, 1 and 3 months after BT injections to the neck muscles. M1 excitability
was probed by measuring TMS-evoked MEPs before and after rPAS. We also
measured IO curve, SICI, ICF, short afferent inhibition (SAI) and long afferent
inhibition (LAI) in the hand muscles and the clinical severity of the dystonia. We
found that before BT, rPAS significantly facilitated MEPs in hand muscles. 1
month after injections this effect was abolished, with partial recovery after 3
months. There were significant positive correlations between the facilitation
produced by rPAS and (i) the time elapsed since injections of BT and (ii) the
clinical dystonia score. One effect of BT treatment is to modulate the afferent
input from the neck and we propose that the subsequent reorganisation of the
motor cortex representation of the hand muscles may explain the effect of BT
on motor cortex plasticity.
5.2 Introduction
The lack of inhibition at multiple CNS levels (Berardelli et al., 1985, Nakashima
et al., 1989, Ridding et al., 1995b) and abnormal cortical plasticity contribute to
the pathophysiology of dystonia (Quartarone et al., 2003, Edwards et al., 2006).
In dystonia, enhanced sensorimotor cortical plasticity extends beyond the
clinically affected region and may be detected in the unaffected upper limbs of
patients with cervical dystonia (Quartarone et al., 2008). BT inhibits
115
acetylcholine release from α -motoneurons and is used as an effective
treatment for different forms of focal and segmental dystonia. Although the
clinical improvement roughly parallels weakness, it is commonly observed that
the clinical benefit seems out of proportion to the weakness caused by the
injections, suggesting an additional, possibly central effect of BT (Priori et al.,
1995, Trompetto et al., 2006). The effects of BT in dystonia have been
addressed in several studies. (Priori et al., 1995, Byrnes et al., 1998, Gilio et al.,
2000, Thickbroom et al., 2003, Quartarone et al., 2006b, Trompetto et al.,
2006). For example, the tonic vibration reflex in patients with writer’s cramp is
suppressed to a greater extent than maximal voluntary contraction (MVC) and
maximum M wave amplitude (M-max) after BT injections and this effect persists
even when MVC and M-max returned to baseline, even though some patients
still experienced some benefit from the injections (Trompetto et al., 2006). BT
treatment normalizes reduced spinal reciprocal inhibition (Priori et al., 1995) and
reduced intracortical inhibition (Gilio et al., 2000). Abnormal cortical hand
representations revert to normal in patients with focal limb or cervical dystonia
after BT injections (Byrnes et al., 1998, Thickbroom et al., 2003). BT has also
been shown to reduce the abnormally enhanced plasticity of the trigeminal blink
reflex in patients with blepharospasm (Quartarone et al., 2006b). These effects
have all been explained in part by a change in the Ia afferent input from muscle
spindles caused by BT (Filippi et al., 1993, Rosales et al., 1996).
116
In the present study, we hypothesized that BT injections may change the
response to an experimental cortical plasticity protocol, which is known to be
enhanced in primary dystonia (Edwards et al., 2006, Weise et al., 2006). We
studied the response to PAS in patients with cervical dystonia (CD) (with or
without arm involvement) before, 1 month and 3 months after BT injections into
the neck muscles.
5.3 Methods
5.3.1 Participants
We studied 12 patients (8 women, mean age: 53 years; range: 30-72 years)
with clinically definite primary CD. Six patients had pure focal CD and 6 patients
had CD with mild arm involvement (4 writing dystonia and 2 dystonic arm
tremor) that did not require treatment. For the clinical assessment of dystonia
we used the Burke-Fahn-Marsden (BFM) scale in order to capture the additional
arm involvement in CD and any possible change with BT injections to the neck
muscles. The mean duration of the disease was 14 years (range: 3-30 years)
and all but one patient was chronically treated with BT type A (Dysport, Ipsen,
UK), for an average of 7 years (range: 1-21 years). BT was injected solely into
the cervical muscles with a dose ranging from 325 to 850 IU (mean dose 487
IU). None of the patients had ever had injections into their arm muscles. At the
time of the study, no patient was receiving medication that we believe could
affect the measures performed. Clinical and demographic data are given in
Table 5.1. All patients were the right-handed.
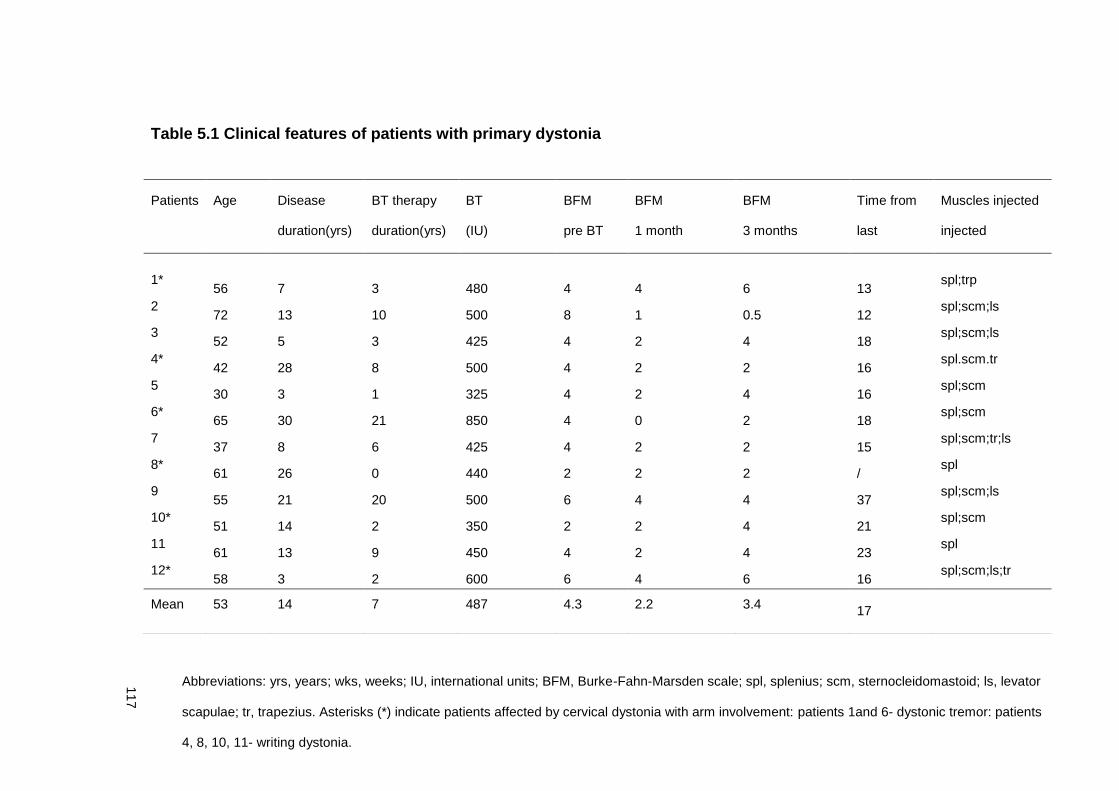
117
Table 5.1 Clinical features of patients with primary dystonia
Patients Age
(yrs)
Disease
Duration
(yrs)
BT therapy
Duration
(yrs)
BT
lasinjection
total dose
(IU)
BFM
Before
BT
BFM
1 m-onth after
BT
BFM
3 months after
BT
Time from Muscles injected
3 months after
BT
duration(yrs) duration(yrs) (IU) pre BT 1 month 3 months last
BT(wks)
injected
1* 56 7 3 480 4 4 6 13
spl;trp
2 72 13 10 500 8 1 0.5 12
spl;scm;ls
3 52 5 3 425 4 2 4 18
spl;scm;ls
4* 42 28 8 500 4 2 2 16
spl.scm.tr
5 30 3 1 325 4 2 4 16
spl;scm
6* 65 30 21 850 4 0 2 18
spl;scm
7 37 8 6 425 4 2 2 15
spl;scm;tr;ls
8* 61 26 0 440 2 2 2 /
spl
9 55 21 20 500 6 4 4 37
spl;scm;ls
10* 51 14 2 350 2 2 4 21
spl;scm
11 61 13 9 450 4 2 4 23
spl
12* 58 3 2 600 6 4 6 16
spl;scm;ls;tr
Mean 53 14 7 487 4.3 2.2 3.4 17
Abbreviations: yrs, years; wks, weeks; IU, international units; BFM, Burke-Fahn-Marsden scale; spl, splenius; scm, sternocleidomastoid; ls, levator
scapulae; tr, trapezius. Asterisks (*) indicate patients affected by cervical dystonia with arm involvement: patients 1and 6- dystonic tremor: patients
4, 8, 10, 11- writing dystonia.
118
5.3.2 EMG recordings and TMS
EMG recordings were made from the APB and FDI muscles. Single and paired
pulse TMS of the left primary motor cortex was applied as indicated in Chapter
2. The IO curve was assessed using SI from 70 to 130 % RMT. The SICI and
ICF were probed at ISI of 2 and 12 ms, respectively.
Short-latency afferent inhibition (SAI) and long-latency afferent inhibition (LAI)
were assessed according to the protocol by Tokimura et al.(2000).For the
electrical median nerve stimulation, the intensity was set just above the
threshold for evoking a visible twitch of the thenar muscles (approximately three
times perceptual threshold). The intensity of the TMS was set to evoke 1mV-
MEPs. SAI was probed at the ISI of 25 ms. At this ISI, in healthy subjects, SAI
is present and may be modified by rPAS (Quartarone et al., 2006a). LAI was
probed at ISIs of 200 ms. For both SAI and LAI, the electrical stimulus preceded
the TMS stimulus.
rPAS protocol was delivered using Magstim Rapid² stimulator (Magstim
Company, Carmarthenshire, Wales, UK), as described by Quartarone et al.
(2006a).The protocol consisted of 600 pairs of median nerve and TMS stimuli
continuously delivered on the APB hot spot of the left hemisphere, at a rate of 5
Hz. Each TMS stimulus was preceded by an electrical conditioning stimulus
given to the right median nerve at ISI of 25 ms. The median nerve was
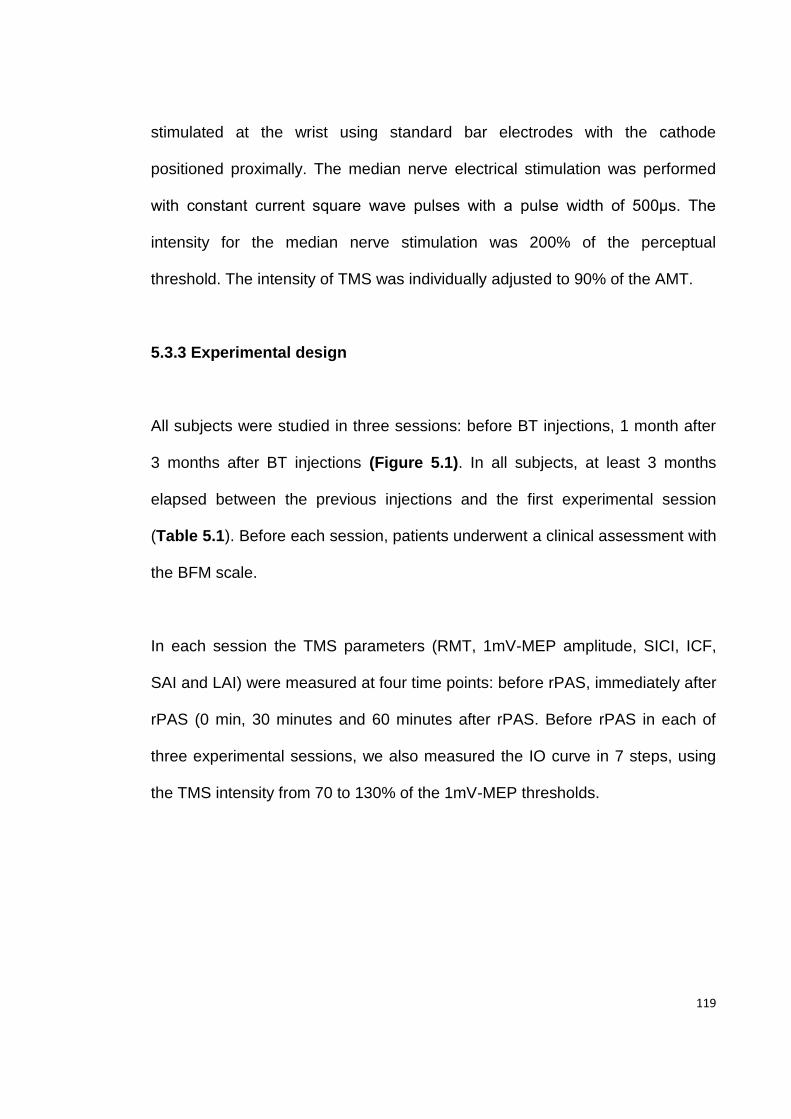
119
stimulated at the wrist using standard bar electrodes with the cathode
positioned proximally. The median nerve electrical stimulation was performed
with constant current square wave pulses with a pulse width of 500µs. The
intensity for the median nerve stimulation was 200% of the perceptual
threshold. The intensity of TMS was individually adjusted to 90% of the AMT.
5.3.3 Experimental design
All subjects were studied in three sessions: before BT injections, 1 month after
3 months after BT injections (Figure 5.1). In all subjects, at least 3 months
elapsed between the previous injections and the first experimental session
(Table 5.1). Before each session, patients underwent a clinical assessment with
the BFM scale.
In each session the TMS parameters (RMT, 1mV-MEP amplitude, SICI, ICF,
SAI and LAI) were measured at four time points: before rPAS, immediately after
rPAS (0 min, 30 minutes and 60 minutes after rPAS. Before rPAS in each of
three experimental sessions, we also measured the IO curve in 7 steps, using
the TMS intensity from 70 to 130% of the 1mV-MEP thresholds.
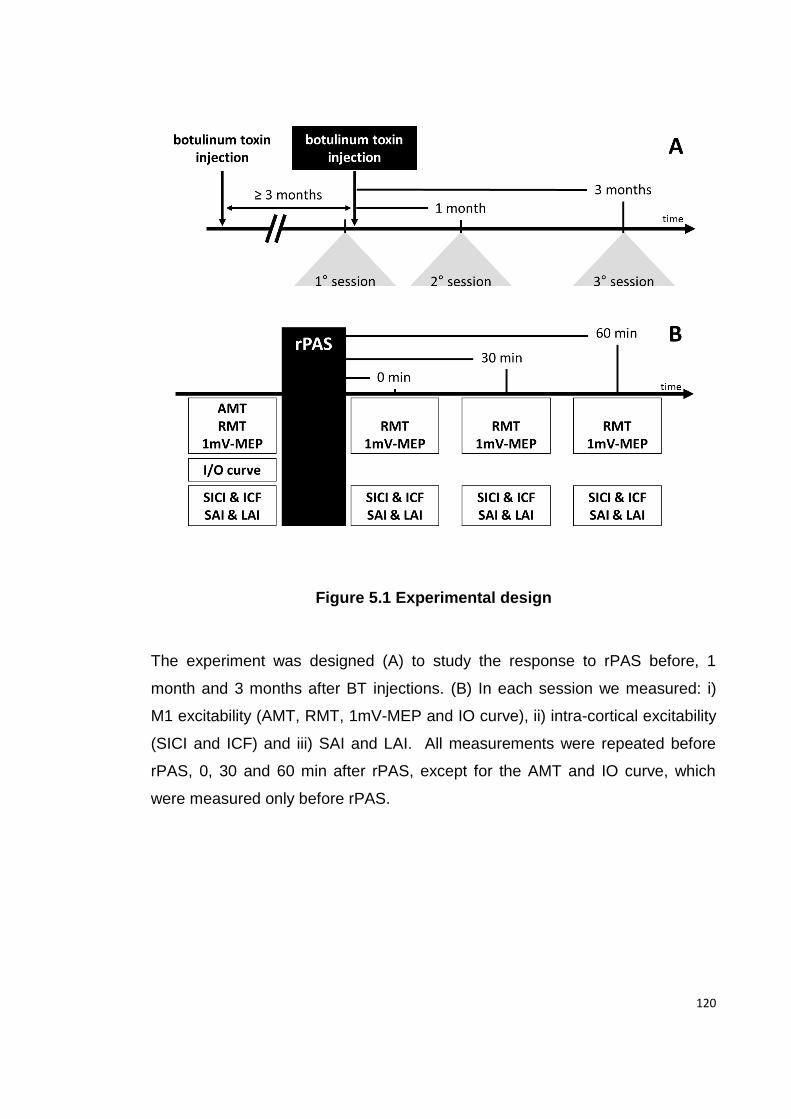
120
Figure 5.1 Experimental design
The experiment was designed (A) to study the response to rPAS before, 1
month and 3 months after BT injections. (B) In each session we measured: i)
M1 excitability (AMT, RMT, 1mV-MEP and IO curve), ii) intra-cortical excitability
(SICI and ICF) and iii) SAI and LAI. All measurements were repeated before
rPAS, 0, 30 and 60 min after rPAS, except for the AMT and IO curve, which
were measured only before rPAS.
121
5.3.4 Statistical Analysis
To test if the subjects with arm involvement had different responses to rPAS
than the patients with isolated CD, we first used a preliminary 3- way ANOVA
(ARM INVOLVEMENT x BT INJECTIONS x rPAS). Then, we used repeated
measures ANOVA to determine the interaction between BT injections and our
measures of interest: baseline measures of cortical excitability (including IO
curves), response to rPAS, SICI, ICF, SAI and LAI. The clinical effect of BT
injections was assessed by non-parametric Friedman’s ANOVA. We also
correlated the rPAS response at 30min (as a % of the pre rPAS MEP amplitude)
in the first session with patients’ demographic characteristics, using Spearman’s
correlation analysis. In addition, a correlation analysis was performed between
normalised rPAS response at 30min (since the response peaked at 30 min) in
the first, second and third session and the time elapsed since the previous BT
injections (in weeks) and BFM score. Since in this analysis within subjects
repeated measures are combined, the correlation coefficient was calculated
according to the Bland and Altman correction (Bland and Altman, 1995).
122
5.4 Results
5.4.1 Clinical effect of BT injections
As expected, there was a clinical improvement of dystonia after BT injections
(Friedman’s χ2 (2) =10.8, p<0.01). Post hoc analysis showed that the BFM score
was significantly lower (indicating less severe dystonia) 1 month after injections
than before and 3 months after BT injections (p< 0.01), while no significant
difference was found in BFM score before and 3 months after BT injections.
5.4.2 BT injections into neck muscles do not modify baseline cortical-
spinal excitability
BT did not change the RMT or AMT of the APB muscle. A two-way ANOVA
comparing the MEP IO curve before rPAS in each of the three experimental
sessions showed a significant effect of STIMULUS INTENSITY (F (2, 14) =
41.15; p<0.01) but no effect of BT INJECTIONS and no STIMULUS INTENSITY
x BT INJECTIONS interaction (Figure 5.2 ). Further analysis of the IO curve in
the range of intensities from 90 to 110 % of 1mV MEP, which correspond to the
range of MEP amplitudes before and after rPAS in all 3 experimental sessions,
confirmed that there was a main effect of STIMULUS INTENSITY, but no effect
of BT INJECTIONS or interaction INTENSITY X BT INJECTIONS.
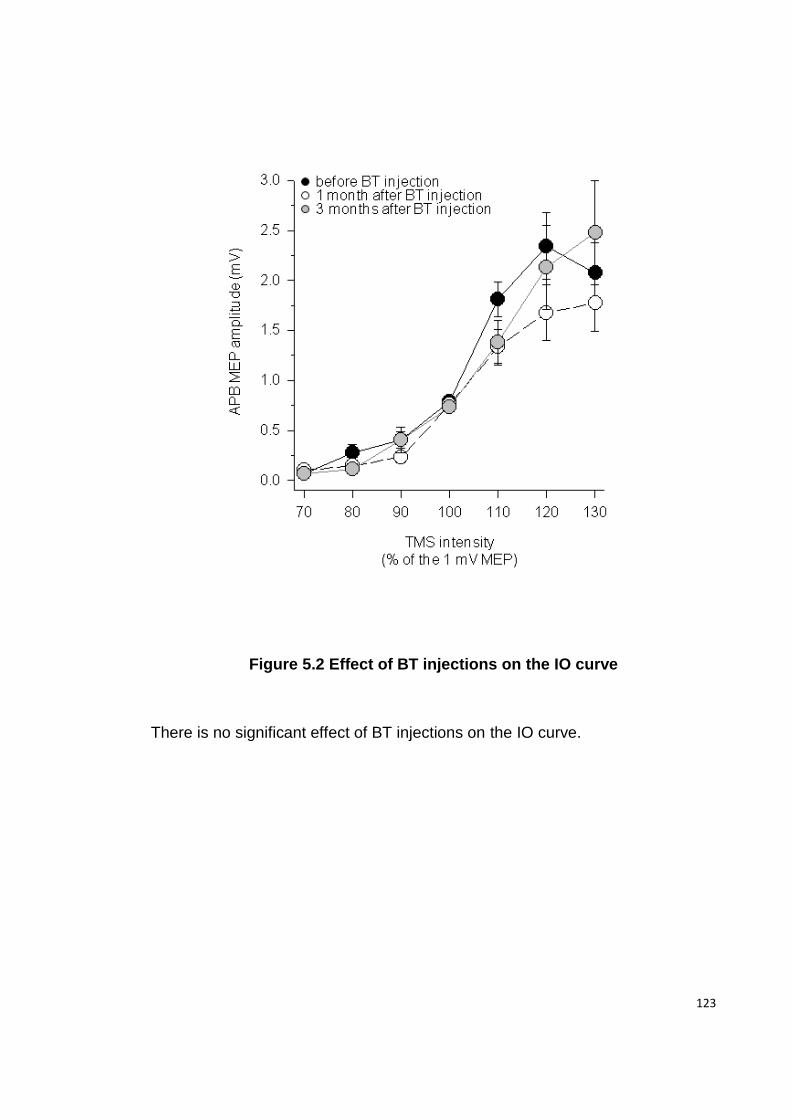
123
Figure 5.2 Effect of BT injections on the IO curve
There is no significant effect of BT injections on the IO curve.
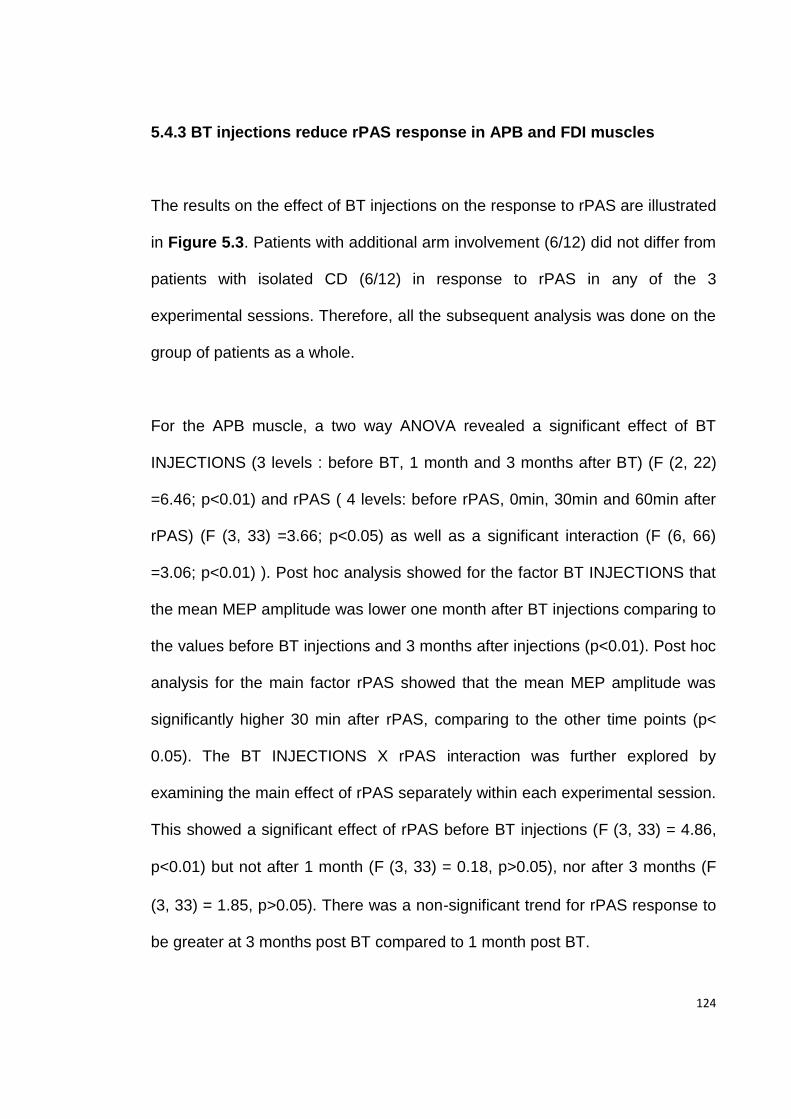
124
5.4.3 BT injections reduce rPAS response in APB and FDI muscles
The results on the effect of BT injections on the response to rPAS are illustrated
in Figure 5.3. Patients with additional arm involvement (6/12) did not differ from
patients with isolated CD (6/12) in response to rPAS in any of the 3
experimental sessions. Therefore, all the subsequent analysis was done on the
group of patients as a whole.
For the APB muscle, a two way ANOVA revealed a significant effect of BT
INJECTIONS (3 levels : before BT, 1 month and 3 months after BT) (F (2, 22)
=6.46; p<0.01) and rPAS ( 4 levels: before rPAS, 0min, 30min and 60min after
rPAS) (F (3, 33) =3.66; p<0.05) as well as a significant interaction (F (6, 66)
=3.06; p<0.01) ). Post hoc analysis showed for the factor BT INJECTIONS that
the mean MEP amplitude was lower one month after BT injections comparing to
the values before BT injections and 3 months after injections (p<0.01). Post hoc
analysis for the main factor rPAS showed that the mean MEP amplitude was
significantly higher 30 min after rPAS, comparing to the other time points (p<
0.05). The BT INJECTIONS X rPAS interaction was further explored by
examining the main effect of rPAS separately within each experimental session.
This showed a significant effect of rPAS before BT injections (F (3, 33) = 4.86,
p<0.01) but not after 1 month (F (3, 33) = 0.18, p>0.05), nor after 3 months (F
(3, 33) = 1.85, p>0.05). There was a non-significant trend for rPAS response to
be greater at 3 months post BT compared to 1 month post BT.
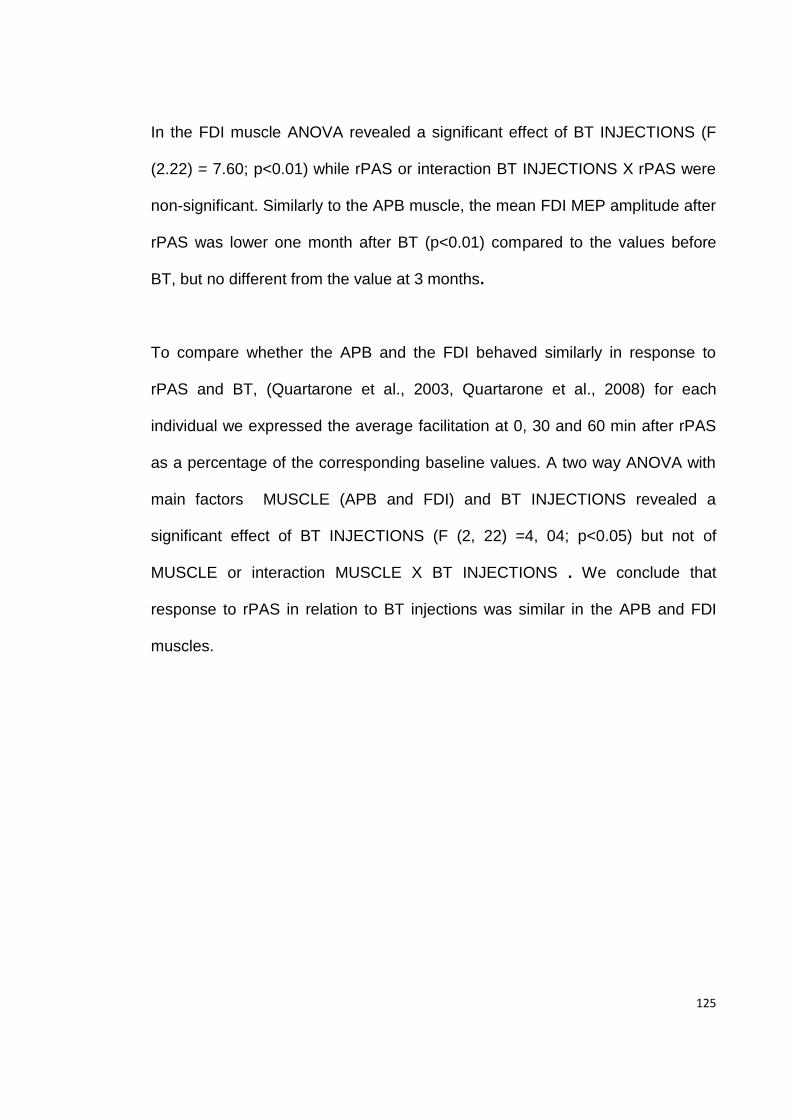
125
In the FDI muscle ANOVA revealed a significant effect of BT INJECTIONS (F
(2.22) = 7.60; p<0.01) while rPAS or interaction BT INJECTIONS X rPAS were
non-significant. Similarly to the APB muscle, the mean FDI MEP amplitude after
rPAS was lower one month after BT (p<0.01) compared to the values before
BT, but no different from the value at 3 months.
To compare whether the APB and the FDI behaved similarly in response to
rPAS and BT, (Quartarone et al., 2003, Quartarone et al., 2008) for each
individual we expressed the average facilitation at 0, 30 and 60 min after rPAS
as a percentage of the corresponding baseline values. A two way ANOVA with
main factors MUSCLE (APB and FDI) and BT INJECTIONS revealed a
significant effect of BT INJECTIONS (F (2, 22) =4, 04; p<0.05) but not of
MUSCLE or interaction MUSCLE X BT INJECTIONS . We conclude that
response to rPAS in relation to BT injections was similar in the APB and FDI
muscles.
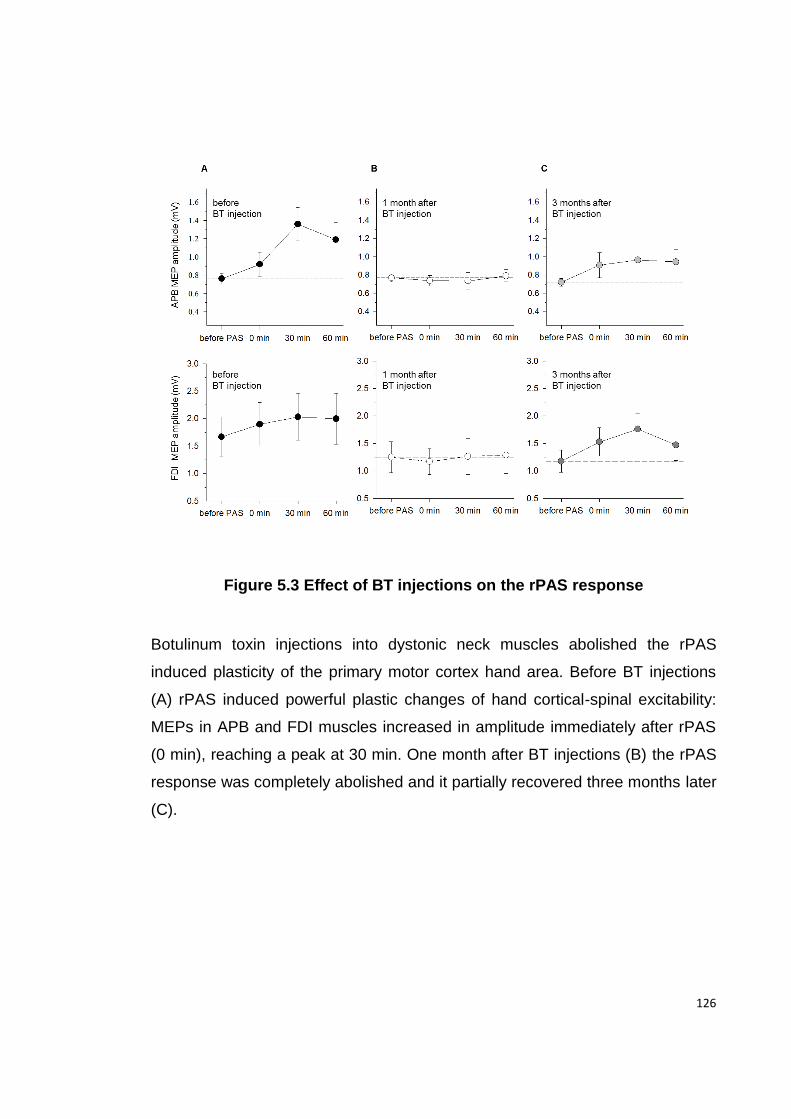
126
Figure 5.3 Effect of BT injections on the rPAS response
Botulinum toxin injections into dystonic neck muscles abolished the rPAS
induced plasticity of the primary motor cortex hand area. Before BT injections
(A) rPAS induced powerful plastic changes of hand cortical-spinal excitability:
MEPs in APB and FDI muscles increased in amplitude immediately after rPAS
(0 min), reaching a peak at 30 min. One month after BT injections (B) the rPAS
response was completely abolished and it partially recovered three months later
(C).
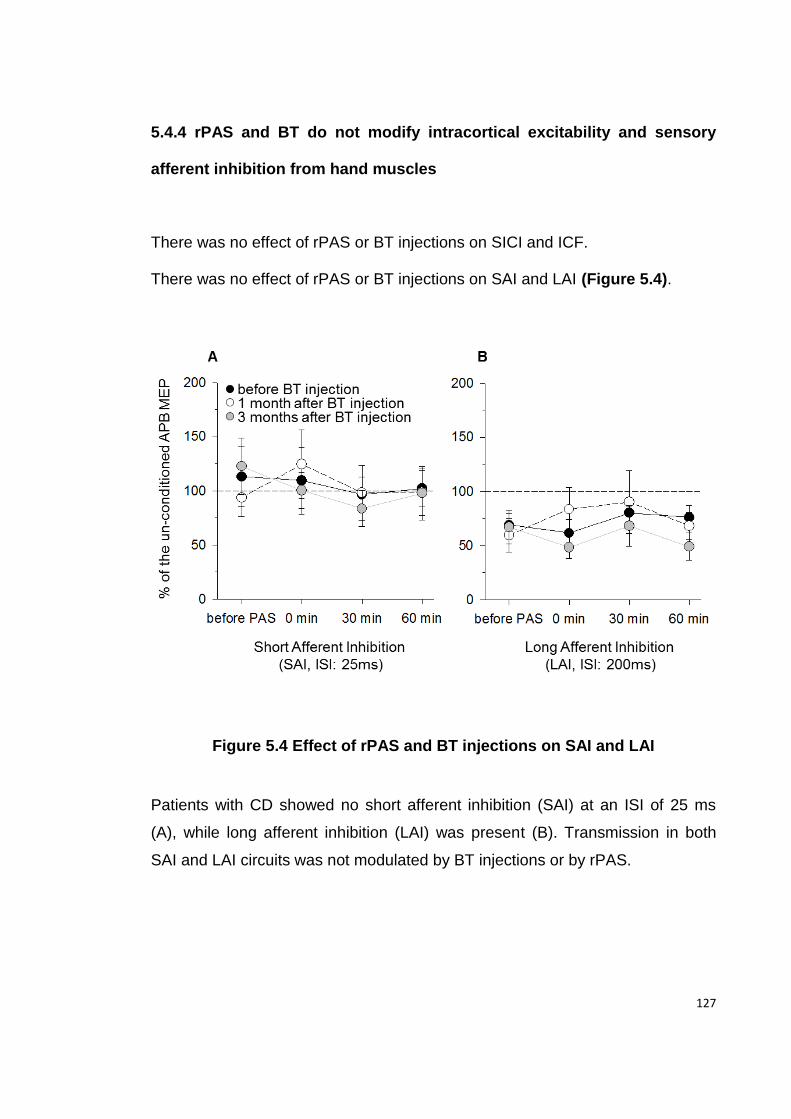
127
5.4.4 rPAS and BT do not modify intracortical excitability and sensory
afferent inhibition from hand muscles
There was no effect of rPAS or BT injections on SICI and ICF.
There was no effect of rPAS or BT injections on SAI and LAI (Figure 5.4).
Figure 5.4 Effect of rPAS and BT injections on SAI and LAI
Patients with CD showed no short afferent inhibition (SAI) at an ISI of 25 ms
(A), while long afferent inhibition (LAI) was present (B). Transmission in both
SAI and LAI circuits was not modulated by BT injections or by rPAS.
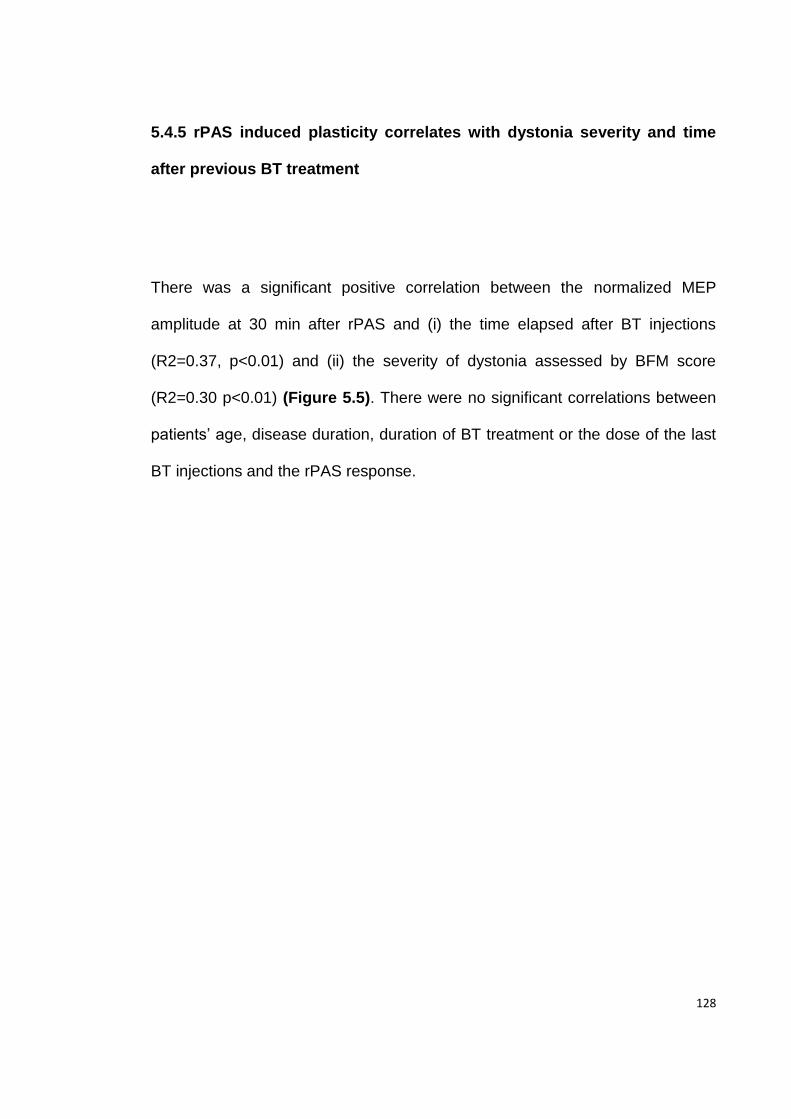
128
5.4.5 rPAS induced plasticity correlates with dystonia severity and time
after previous BT treatment
There was a significant positive correlation between the normalized MEP
amplitude at 30 min after rPAS and (i) the time elapsed after BT injections
(R2=0.37, p<0.01) and (ii) the severity of dystonia assessed by BFM score
(R2=0.30 p<0.01) (Figure 5.5). There were no significant correlations between
patients’ age, disease duration, duration of BT treatment or the dose of the last
BT injections and the rPAS response.
129
Figure 5.5 Correlation between rPAS induced plasticity of the primary
motor cortex and timing of previous BT injection or clinical symptoms of
dystonia.
Peak-to-peak amplitude of the normalised APB MEPs recorded 30 min
after rPAS positively correlated with (A) the time elapsed since the
previous BT injections in weeks and with (B) the Burke-Fahn-Marsden
dystonia severity score. Each patient with their corresponding values of
rPAS response and the number of weeks since the previous BT
injections (A) or BFM score (B) is plotted 3 times -before BT injections,
1month and 3 months after BT injections.
130
5 5 Discussion
BT transiently abolished the response to an experimental sensorimotor plasticity
protocol in patients with CD. Before BT injections, rPAS significantly facilitated
MEP amplitude in the hand muscles. One month after injections this facilitation
was suppressed, while at 3 months it partially recovered. The response to rPAS
correlated significantly with the time elapsed after previous BT injections and
with the clinical severity of dystonia as measured by BFM total score. We saw
no clinical improvement in the severity of arm dystonia in those patients with CD
with additional arm involvement, after injections into the neck muscles.
Possible BT action on the mechanism of cortical plasticity
BT can affect the release of neurotransmitters that are important for brain
plasticity and is used in animal studies to block the connection between different
brain areas, in order to study changes in brain plasticity (Ando et al., 2002,
Costantin et al., 2005, Caleo et al., 2007) . Although there is some evidence to
support hematogenous and axonal spread of large doses of BT in animals
(Boroff and Chen, 1975, Antonucci et al., 2008) similar evidence in humans is
lacking. Therefore a direct central effect of BT on plasticity in our patients is
unlikely, particularly at the doses used for treatment of dystonia.
131
Another explanation for our results is that the effect of BT on cortical plasticity
may be secondary to changes in the motor maps that occurred after afferent
input from cervical muscles was altered by injections (Byrnes et al., 1998,
Thickbroom et al., 2003). A considerable body of evidence demonstrates the
importance of afferent input in modulating both cortical organization and its
excitability (Brasil-Neto et al., 1992, Ridding and Rothwell, 1995, Ziemann et al.,
1998a, Ziemann et al., 1998b). In dystonia, changes in “motor maps” of the
hand muscles have been described after BT injections (Byrnes et al., 1998,
Thickbroom et al., 2003). Thickbroom et al. (2003) reported that in patients with
CD, motor maps of the APB are displaced in the hemisphere contralateral to the
direction of head rotation. After BT injections into cervical muscles, the APB
motor maps reverted to a more normal position, thus showing that changes in
the motor cortical topography after injections may extend outside the area
representing the treated muscles. This may be relevant for the experimental
plasticity protocol we used. PAS relies on the interaction between sensory
afferents and the motor output of the homologous muscle. If motor maps
change in location after BT, then there may be a degree of disconnection
between the sensory afferents and the altered location of the hand motor maps
leading to a reduced PAS response as measured in the hand muscles.
132
Measures of sensorimotor cortical inhibition and their relation to BT
injections and rPAS
LAI was present in our group of dystonia patients, and was not modified with
rPAS or in relation to BT injections (Figure 5.4 B). However, the SAI at an ISI of
25 ms was absent and was not modified after rPAS (Figure 5.4 A). We
measured SAI at an ISI of 25ms based on previous data on healthy subjects
from Quartarone et al. (2006a), who found that SAI at 25ms ISI is present and
may be modulated by rPAS. When Kessler et al. (2005) studied SAI in patients
with writer’s cramp at ISIs ranging from 14 to 36 ms the strongest inhibition was
present at an ISI of 20 ms. Therefore, it is possible that we may have missed
SAI at shorter intervals. Alternatively, our findings of absent SAI in CD patients
(while not the main objective of this study) might reflect an abnormality in
afferent inhibition in CD.
Limitations of the study
We did not record the H reflex or F-waves to monitor possible changes in α
motoneuron excitability secondary to BT. However, we did not find any effect of
BT on RMT, AMT and IO curves, i.e. in parameters which test the excitability of
the entire corticospinal tract including the α motoneuron. In line with our
observations, Priori et al.(Priori et al., 1995) found that 1 month after BT
injections to the arm, the Hmax:Mmax ratio is unchanged, thus suggesting that
133
BT does not affect α motoneuron excitability. We found that BT injections
reduce cortical plasticity in chronically treated dystonia patients, but we cannot
comment on whether a similar effect would be present in dystonia patients
naïve to BT. Another limitation of the study is the lack of comparison with
healthy controls. However, a number of previous studies on different forms of
dystonia, including CD, have demonstrated that dystonia patients have
abnormally enhanced responses to PAS protocols compared to normal subjects
(Quartarone et al., 2003, Weise et al., 2006, Quartarone et al., 2008). Our
primary interest was to assess the change in PAS response with BT injections
rather than the absolute level of PAS response at baseline. In the context of this
study we consider that a comparison group of CD patients treated with placebo
injections or a healthy participant group given BT injections would not have
been justified ethically.
Conclusion
BT injections into dystonic neck muscles decreased sensorimotor associative
plasticity in the hand area in patients with CD. We propose that this central
effect is mediated by changes in motor maps, caused by reduced afferent input
from the neck muscles following injections. Modulation of sensorimotor plasticity
by changing the afferent input from the dystonic muscles may perhaps
contribute to the clinical benefit of BT injections in dystonia over and above the
effects caused by weakness in the injected muscles.
134
Pathophysiological differences Chapter 6
between secondary and primary dystonias:
the roles of cortical plasticity and
intracortical inhibition
Primary dystonia is thought to be a disorder of the BG because the symptoms
resemble those of patients who have anatomical lesions in the same regions of
brain (secondary dystonia). However, these two groups of patients respond
differently to therapy suggesting differences in the pathophysiological
mechanisms. In the following experiments we investigated if primary and
secondary dystonia share the same pattern of electrophysiological
abnormalities. We used TMS to study cortical functional involvement and the
eye-blink classical conditioning paradigm to assess cerebellar functional
involvement.
The work presented in this Chapter is published in the form of a research
article: Kojovic M, Pareés I, Kassavetis P, Palomar FJ, Mir P, Teo JT,
Cordivari C, Rothwell JC, Bhatia KP and. Edwards MJ .Secondary and primary
dystonia: pathophysiological differences. Brain. 2013 Jul;136(Pt 7):2038-49.
135
6.1 Summary
Pathophysiological deficits in primary dystonia are well characterised and
include reduced inhibition at many levels of the motor system and increased
plasticity, while emerging evidence suggests there are additional cerebellar
deficits. We compared the electrophysiological features of primary and
secondary dystonia, using TMS of the motor cortex and the eye blink classical
conditioning (EBCC) paradigm, to test whether dystonic symptoms share the
same underlying mechanism. 11 patients with hemidystonia caused by BG or
thalamic lesions were tested over both hemispheres, corresponding to the
clinically affected and non-affected side and were compared to ten patients with
primary segmental dystonia with arm involvement and ten healthy participants
of similar age. We measured RMT, AMT, IO curve, SICI and CSP. Plasticity
was probed using PAS 25. In secondary dystonia cerebellar-dependent
conditioning was measured using the EBCC paradigm and results were
compared to the data obtained from primary dystonia patients previously in our
lab using the same technique. We found no difference in the MTs, IO curves or
CSP between the secondary and primary dystonia patients or the healthy
controls. In secondary dystonia SICI was reduced on the affected side, while it
was normal on the non -affected side. Secondary dystonia patients had a
normal response to the plasticity protocol on both affected and non-affected
side and a normal EBCC that was not different from healthy participants. In
contrast, patients with primary dystonia showed increased cortical plasticity and
136
reduced EBCC. Normal motor cortex plasticity in secondary dystonia
demonstrates that abnormally enhanced cortical plasticity is not required for
clinical expression of dystonia, and the normal EBCC suggests an absence of
functional cerebellar involvement in this form of dystonia. Reduced SICI on the
side of the lesion may result from abnormal BG output or be a consequence of
maintaining an abnormal dystonic posture. Dystonia appears to be a motor
symptom that can reflect different pathophysiological states triggered by a
variety of insults.
6.2 Introduction
Dystonia is a hyperkinetic movement disorder characterised by sustained
muscle contraction leading to twisting, repetitive movements and abnormal
postures of affected body parts (Fahn, 1988). In the absence of any
pathological cause, Marsden et al. (1985) initially proposed that primary
dystonia was a BG disease on the basis that the symptoms closely resembled
those of some patients with identified lesions of the BG or their output pathways
(now classified as secondary dystonia). The implication was that the similarity of
symptoms was caused by a similar underlying pathophysiology. However,
primary and secondary dystonias differ in their response to treatment (Neychev
et al., 2011); in addition there is emerging evidence that a cerebellar deficit may
contribute to the symptoms of primary dystonia (Sadnicka et al., 2012) .Given
the etiological and clinical heterogeneity of dystonia, the aim of the present
137
study was to test whether the primary and secondary forms share a similar
pathophysiological mechanism.
Most electrophysiological and neuroimaging studies in dystonia have been
conducted on patients with primary dystonia since this is the commonest form of
the condition (Bressman, 2004). A consistent finding is loss of inhibition at
different levels of the CNS, including spinal cord, brainstem and motor cortex
(Berardelli et al., 1985, Nakashima et al., 1989, Ridding et al., 1995b). Recent
evidence from human studies suggests that abnormally enhanced synaptic
plasticity is also an important factor in the pathophysiology of the primary
dystonias (Peterson et al., 2010, Quartarone and Pisani, 2011). Patients with
primary focal and primary generalised dystonia have an abnormally enhanced
response to different plasticity protocols that probe LTP-like and LTD-like
synaptic plasticity in the motor cortex (Quartarone et al., 2003, Edwards et al.,
2006, Weise et al., 2006, Gilio et al., 2007, Quartarone et al., 2008) or
brainstem circuits (Quartarone et al., 2006b). Finally, a range of recent evidence
from structural and functional imaging and electrophysiology (Teo et al., 2009)
suggests that the cerebellum may also play some role in primary dystonia.
Thus, voxel based morphometric studies have found grey matter changes in the
cerebellum of patients with focal dystonias (Draganski et al., 2003, Delmaire et
al., 2007, Obermann et al., 2007), functional MRI has revealed changes in
movement-related activity (Odergren et al., 1998, Carbon and Eidelberg, 2009)
and metabolic profile (Hutchinson et al., 2000).
138
Although there are some reports that patients with secondary dystonia may
share similar abnormalities in inhibitory networks of the motor system
(Nakashima et al., 1989, Trompetto et al., 2012), there is no information about
plasticity or cerebellar function in this group of patients. The aim of the present
study was to provide a more comprehensive comparison of the underlying
pathophysiology in primary and secondary dystonias. The results show that
there are distinct differences in physiology, implying that the clinical syndrome
of dystonia has more than one physiological phenotype. This would be
consistent with the fact that dystonia can have many different causes and can
respond quite differently to treatment (Neychev et al., 2011). The conclusion is
that dystonia represents one (of many) possible stable state(s) into which the
motor system can be pushed through a variety of insults.
6.3 Methods
6.3.1 Participants
We studied 11 patients with secondary dystonia caused by a structural brain
lesion (5 men and 6 women, mean age 45.8 years, range 28-68, Table 6.1), 10
patients with primary segmental dystonia (4 men and 6 women, mean age 46.7
years, range 31-67, Table 6.2) and 10 age -matched healthy participants (5
men and 5 women, mean age 48.7 years, range 27-67). Patients with
secondary dystonia were included if they had: (i) unilateral distribution of
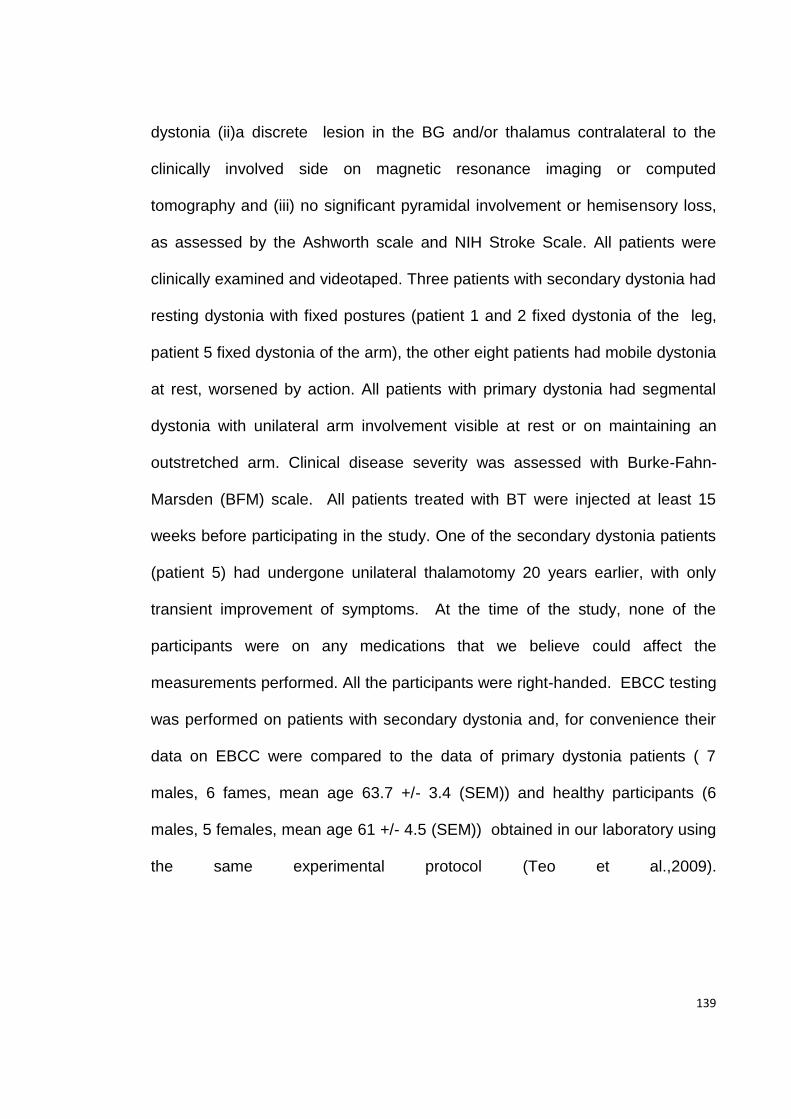
139
dystonia (ii)a discrete lesion in the BG and/or thalamus contralateral to the
clinically involved side on magnetic resonance imaging or computed
tomography and (iii) no significant pyramidal involvement or hemisensory loss,
as assessed by the Ashworth scale and NIH Stroke Scale. All patients were
clinically examined and videotaped. Three patients with secondary dystonia had
resting dystonia with fixed postures (patient 1 and 2 fixed dystonia of the leg,
patient 5 fixed dystonia of the arm), the other eight patients had mobile dystonia
at rest, worsened by action. All patients with primary dystonia had segmental
dystonia with unilateral arm involvement visible at rest or on maintaining an
outstretched arm. Clinical disease severity was assessed with Burke-Fahn-
Marsden (BFM) scale. All patients treated with BT were injected at least 15
weeks before participating in the study. One of the secondary dystonia patients
(patient 5) had undergone unilateral thalamotomy 20 years earlier, with only
transient improvement of symptoms. At the time of the study, none of the
participants were on any medications that we believe could affect the
measurements performed. All the participants were right-handed. EBCC testing
was performed on patients with secondary dystonia and, for convenience their
data on EBCC were compared to the data of primary dystonia patients ( 7
males, 6 fames, mean age 63.7 +/- 3.4 (SEM)) and healthy participants (6
males, 5 females, mean age 61 +/- 4.5 (SEM)) obtained in our laboratory using
the same experimental protocol (Teo et al.,2009).
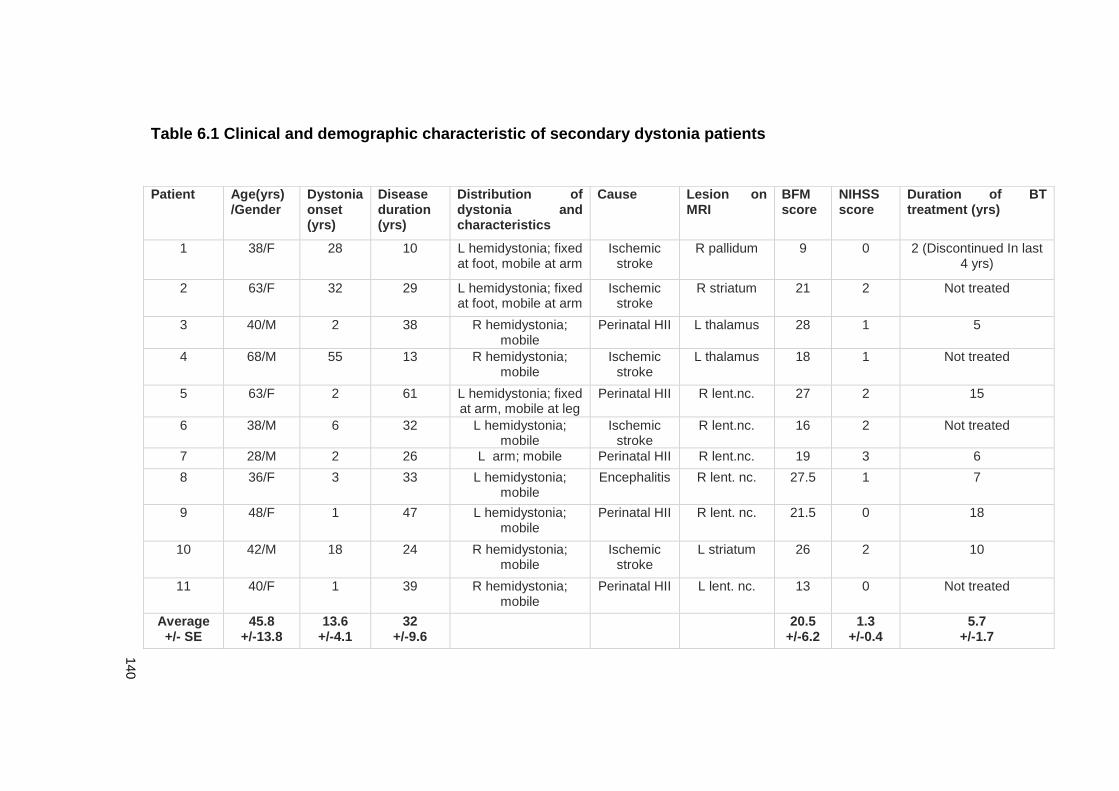
140
Table 6.1 Clinical and demographic characteristic of secondary dystonia patients
Patient Age(yrs) /Gender
Dystonia onset (yrs)
Disease duration (yrs)
Distribution of dystonia and characteristics
Cause Lesion on MRI
BFM score
NIHSS score
Duration of BT treatment (yrs)
1 38/F 28 10 L hemidystonia; fixed at foot, mobile at arm
Ischemic stroke
R pallidum 9 0 2 (Discontinued In last 4 yrs)
2 63/F 32 29 L hemidystonia; fixed at foot, mobile at arm
Ischemic stroke
R striatum 21 2 Not treated
3 40/M 2 38 R hemidystonia; mobile
Perinatal HII L thalamus 28 1 5
4 68/M 55 13 R hemidystonia; mobile
Ischemic stroke
L thalamus 18 1 Not treated
5 63/F 2 61 L hemidystonia; fixed at arm, mobile at leg
Perinatal HII R lent.nc. 27 2 15
6 38/M 6 32 L hemidystonia; mobile
Ischemic stroke
R lent.nc. 16 2 Not treated
7 28/M 2 26 L arm; mobile Perinatal HII R lent.nc. 19 3 6
8 36/F 3 33 L hemidystonia; mobile
Encephalitis R lent. nc. 27.5 1 7
9 48/F 1 47 L hemidystonia; mobile
Perinatal HII R lent. nc. 21.5 0 18
10 42/M 18 24 R hemidystonia; mobile
Ischemic stroke
L striatum 26 2 10
11 40/F 1 39 R hemidystonia; mobile
Perinatal HII L lent. nc. 13 0 Not treated
Average +/- SE
45.8 +/-13.8
13.6 +/-4.1
32 +/-9.6
20.5 +/-6.2
1.3 +/-0.4
5.7 +/-1.7
141
Table 6.2 Clinical and demographic characteristic of primary dystonia patients
Patient Age(yrs)
/Gender
Age of dystonia
onset
Disease
duration(yrs)
Distribution of dystonia and
characteristics
BFM
score
Duration of BT
treatment (yrs)
1 39/F 29 10 CD and R arm dystonia 12 5
2 63/F 59 4 BSP, CD and R arm dystonia 13 2
3 29/F 23 6 CD and R arm dystonia
9 Not treated
4 44/M 40 4 CD and L arm dystonia 8 2
5 31/M 24 7 CD and R hand dystonia 8 Not treated
6 53/F 47 6 Laryngeal dystonia, CD and L arm
dystonia
26 6
7 40/F 32 8 CD and R arm dystonia 12 2
8 67/M 20 47 Laryngeal dystonia and L arm
dystonia, L dystonic tremor
9 26
9 50/M 43 7 CD and R hand dystonia
16 5
10 51/M 29 10 BSP, CD and R arm dystonia 9 5
Average +/- SE
46.7 +/-14.8
34.6 +/-10.9
10.9 +/-3.4
12.2 +/-39
5.3 +/-1.7
Abbreviations: yrs: years; BFM: Burke-Fahn-Marsden dystonia score; BT: Botulinum Toxin; F: Female; M: Male; BSP, blepharospasm; CD, cervical dystonia; R: Right; L: Left
142
6.3.2 EMG recordings and TMS
EMG recordings were made from the APB and ADM on the side contralateral to
the stimulated hemisphere. We used single-pulse and paired-pulse TMS and
PAS25 protocol, as indicated in Chapter 2. SICI was assessed at an ISI of 2
ms.
6.3.3 Eye blink classical conditioning (EBCC)
An electrical stimulus was applied through a bipolar electrode, with the cathode
positioned proximally. The electrical stimuli were constant current square wave
pulses with a pulse width of 200 µs, i.e. unconditioining stimulus (US) and were
delivered to the right supraorbital nerve at an intensity adjusted to obtain stable
R2 responses (approximately 4-6 times the sensory threshold). Electrical
supraorbital nerve stimulus was preceded by a tone, i.e. the conditioning
stimulus (CS), produced by a tone generator and presented bilaterally to the
subject via binaural headphones at an intensity 50–70 dB above the individual
hearing threshold. The CS intensity was kept constant during experiment. The
CS inconsistently produced an acoustic startle response (alpha blink) occurring
within 200 ms after the CS onset. Repeated pairs of CS and US at 400 ms
intervals induced a conditioned eye blink response (CR) to appear with onsets
within 200 ms before US. EBCC sessions consisted of seven blocks: six
acquisition blocks (each block contained 11 trials in: nine trials of CS–US pairs,
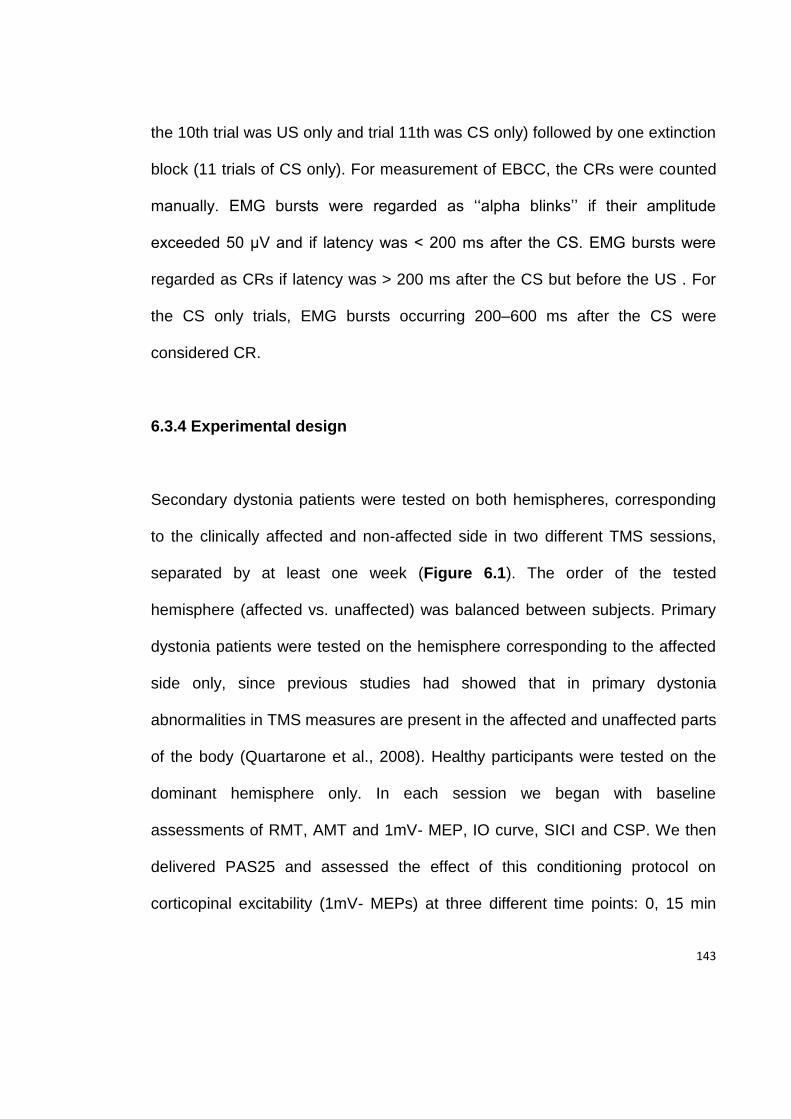
143
the 10th trial was US only and trial 11th was CS only) followed by one extinction
block (11 trials of CS only). For measurement of EBCC, the CRs were counted
manually. EMG bursts were regarded as ‘‘alpha blinks’’ if their amplitude
exceeded 50 µV and if latency was < 200 ms after the CS. EMG bursts were
regarded as CRs if latency was > 200 ms after the CS but before the US . For
the CS only trials, EMG bursts occurring 200–600 ms after the CS were
considered CR.
6.3.4 Experimental design
Secondary dystonia patients were tested on both hemispheres, corresponding
to the clinically affected and non-affected side in two different TMS sessions,
separated by at least one week (Figure 6.1). The order of the tested
hemisphere (affected vs. unaffected) was balanced between subjects. Primary
dystonia patients were tested on the hemisphere corresponding to the affected
side only, since previous studies had showed that in primary dystonia
abnormalities in TMS measures are present in the affected and unaffected parts
of the body (Quartarone et al., 2008). Healthy participants were tested on the
dominant hemisphere only. In each session we began with baseline
assessments of RMT, AMT and 1mV- MEP, IO curve, SICI and CSP. We then
delivered PAS25 and assessed the effect of this conditioning protocol on
corticopinal excitability (1mV- MEPs) at three different time points: 0, 15 min

144
and 30 min after PAS. In addition, secondary dystonia patients underwent a
third session for EBCC testing.
145
Figure 6.1 Experimental design
146
6.3.5 Statistical analysis
ANOVA was used to test the age differences between secondary dystonia
patients, primary dystonia patients and healthy controls. The differences in
disease duration, BFM scores and duration of BT treatment between secondary
and primary dystonia patients were assessed with Mann-Whitney U test.
The primary aim of this study was to compare the TMS parameters between the
affected side in secondary dystonia patients and primary dystonia patients and
healthy participants. RMT, AMT, EMG root square amplitude, SICI and CSP
were compared between groups using ANOVAs with a factor GROUP (3 levels:
secondary dystonia-affected side, primary dystonia and healthy participants) as
a between-subject factor. For analysis of SICI, conditioned MEP amplitudes
were averaged, normalized to average unconditioned MEP amplitudes and
entered into ANOVA with factor GROUP as between-subjects factor. IO curves
were compared between groups in ANOVA with the factor GROUP and the
factor STIMULUS INTENSITY (10 levels of stimulator output intensity ranging
from 80 % to 170% of RMT intensity) as a within-subjects factor. For analysis of
the PAS effect, MEP amplitudes at each time point were averaged, normalized
to baseline MEPs and entered into ANOVA with factor GROUP as between-
subjects factor and factors MUSCLE (2 levels: APB and ADM muscle) and
TIME POINT (3 levels: 0 min, 15 min and 30 min after PAS) as a within-
subjects factors. As a secondary analysis, we assessed how TMS measures
147
compared between the affected and non-affected side in secondary dystonia
patients, using repeated measures ANOVA or paired sample t-test. For EBCC,
the percentage of CRs over different blocks did not follow the normal
distribution, therefore non-parametric tests were used. We first compared the
number of overall CR ( for all blocks) in each group using Kruskal -Wallis
ANOVA. The differences in the number of CR in each block between groups
were then assessed by Mann-Whitney U test. Finally, for each group we used
Friedman ANOVA to test if there was a conditioning of eye blink responses
across blocks.
Possible correlations between clinical and demographic data (disease duration,
BFM score, duration of BT injection treatment) and TMS measures (SICI,
averaged PAS response) were evaluated with the Spearman correlation
analysis.
6.4 Results
6.4.1 Clinical and demographical data
There was no significant difference in age between the secondary and primary
dystonia patients and healthy participants. As expected, the BFM score was
higher in the secondary compared to primary dystonia patients (z=-2.9;
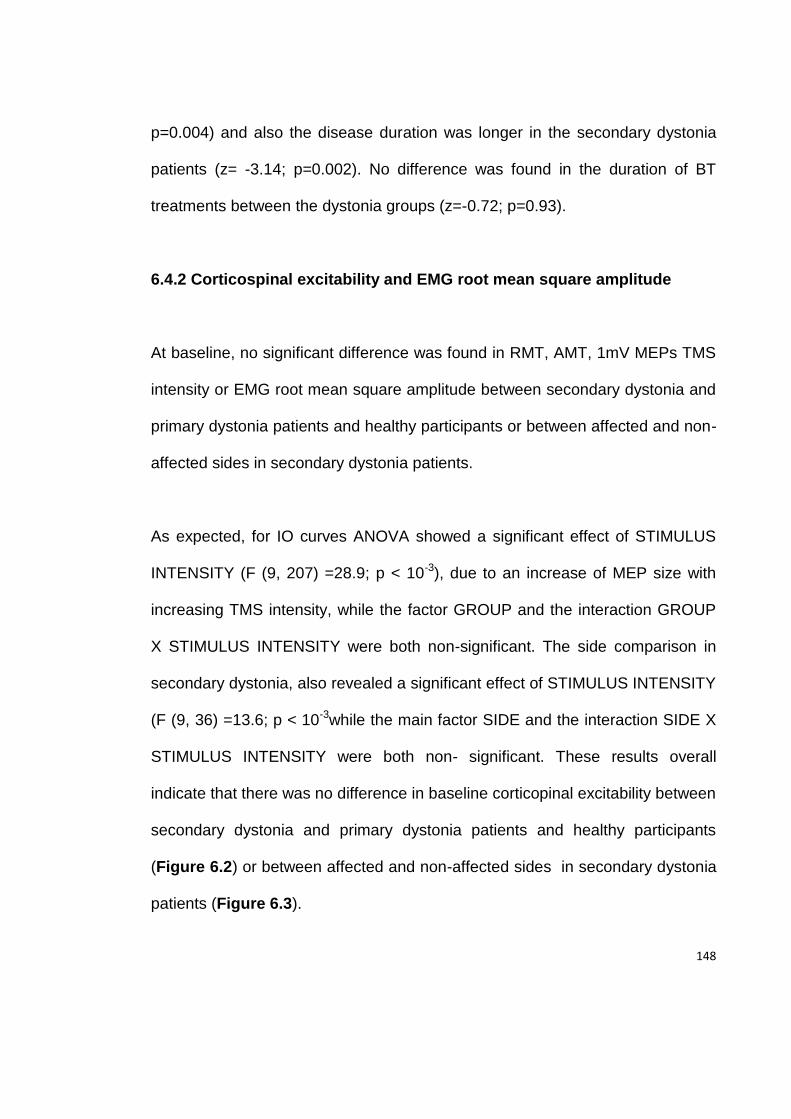
148
p=0.004) and also the disease duration was longer in the secondary dystonia
patients (z= -3.14; p=0.002). No difference was found in the duration of BT
treatments between the dystonia groups (z=-0.72; p=0.93).
6.4.2 Corticospinal excitability and EMG root mean square amplitude
At baseline, no significant difference was found in RMT, AMT, 1mV MEPs TMS
intensity or EMG root mean square amplitude between secondary dystonia and
primary dystonia patients and healthy participants or between affected and non-
affected sides in secondary dystonia patients.
As expected, for IO curves ANOVA showed a significant effect of STIMULUS
INTENSITY (F (9, 207) =28.9; p < 10-3), due to an increase of MEP size with
increasing TMS intensity, while the factor GROUP and the interaction GROUP
X STIMULUS INTENSITY were both non-significant. The side comparison in
secondary dystonia, also revealed a significant effect of STIMULUS INTENSITY
(F (9, 36) =13.6; p < 10-3while the main factor SIDE and the interaction SIDE X
STIMULUS INTENSITY were both non- significant. These results overall
indicate that there was no difference in baseline corticopinal excitability between
secondary dystonia and primary dystonia patients and healthy participants
(Figure 6.2) or between affected and non-affected sides in secondary dystonia
patients (Figure 6.3).
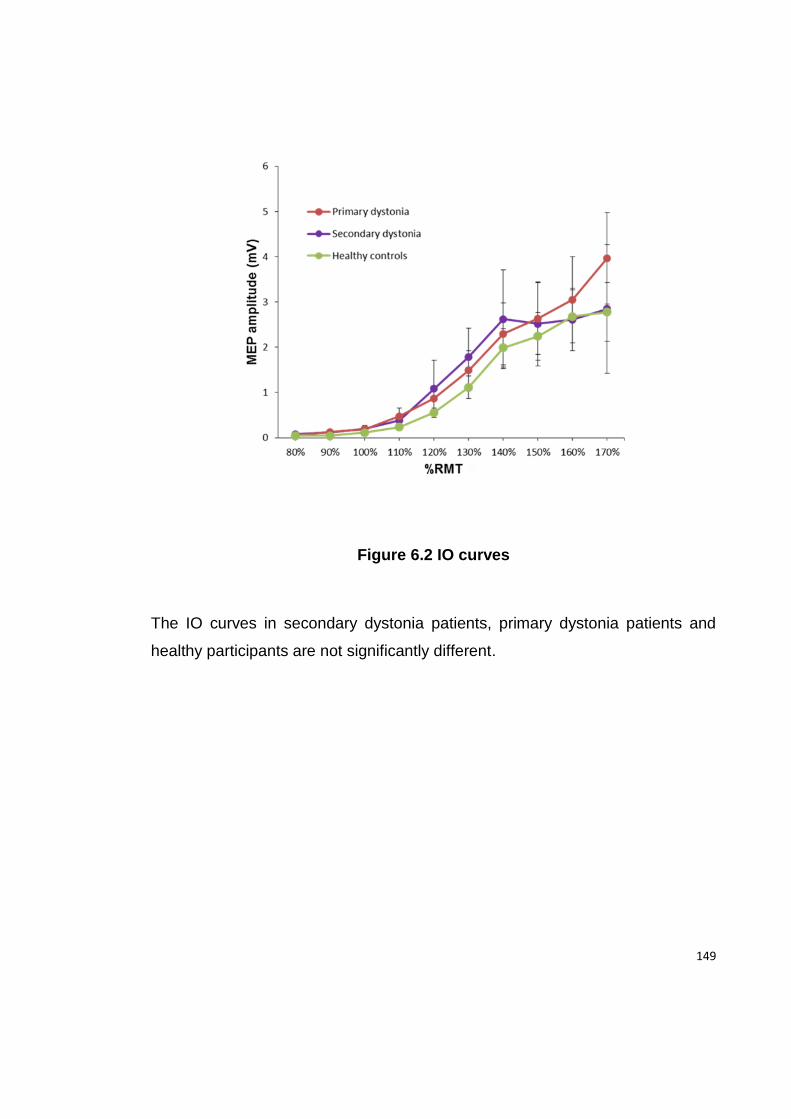
149
Figure 6.2 IO curves
The IO curves in secondary dystonia patients, primary dystonia patients and
healthy participants are not significantly different.
150
Figure 6.3 IO curves in affected and non-affected side in secondary
dystonia patients
There is no difference in the IO curves between the affected and non-affected
sides of secondary dystonia patients.
151
6.4.3 SICI
ANOVA revealed a significant effect of factor GROUP (F (2, 27) =5.11; p =
0.01), due to less SICI in secondary dystonia patients compared to healthy
participants (p=0.01), while there was no difference between primary and
secondary dystonia or between primary dystonia and healthy participants.
When the affected side was compared to the non-affected side in secondary
dystonia, a paired-sample t-test revealed significant difference (p=0.02) due to
less SICI on the more affected side (Figure 6.4).
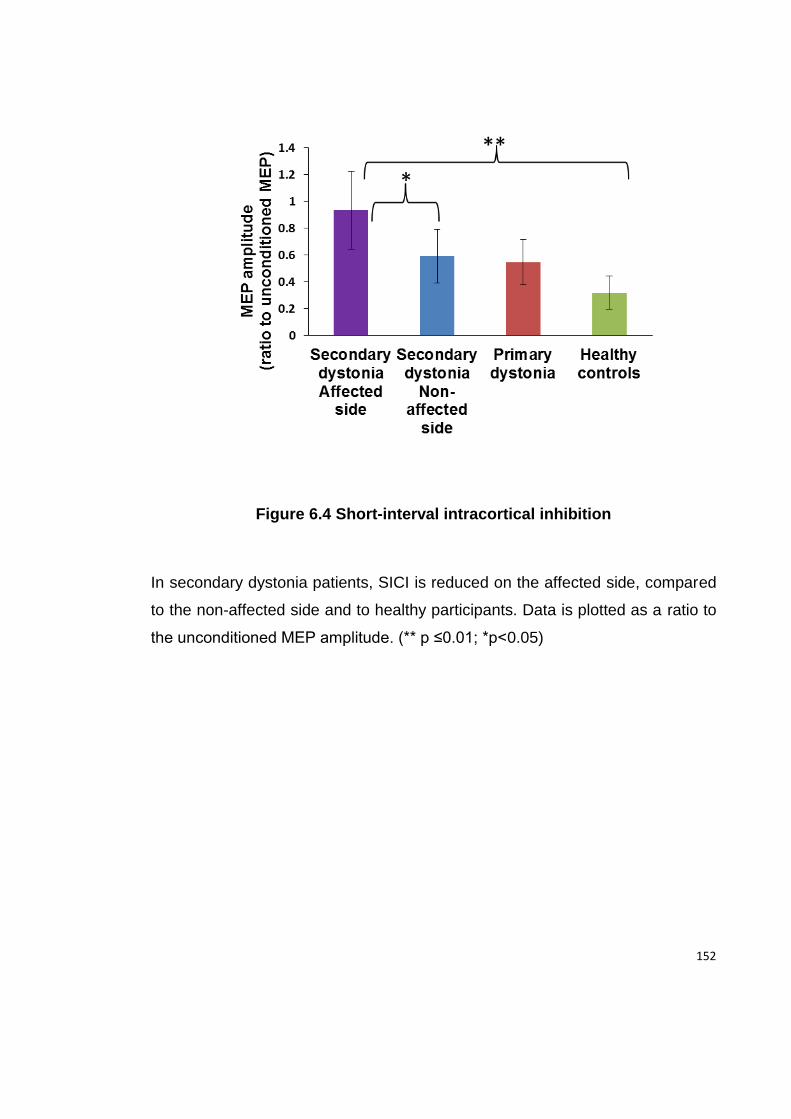
152
Figure 6.4 Short-interval intracortical inhibition
In secondary dystonia patients, SICI is reduced on the affected side, compared
to the non-affected side and to healthy participants. Data is plotted as a ratio to
the unconditioned MEP amplitude. (** p ≤0.01; *p<0.05)
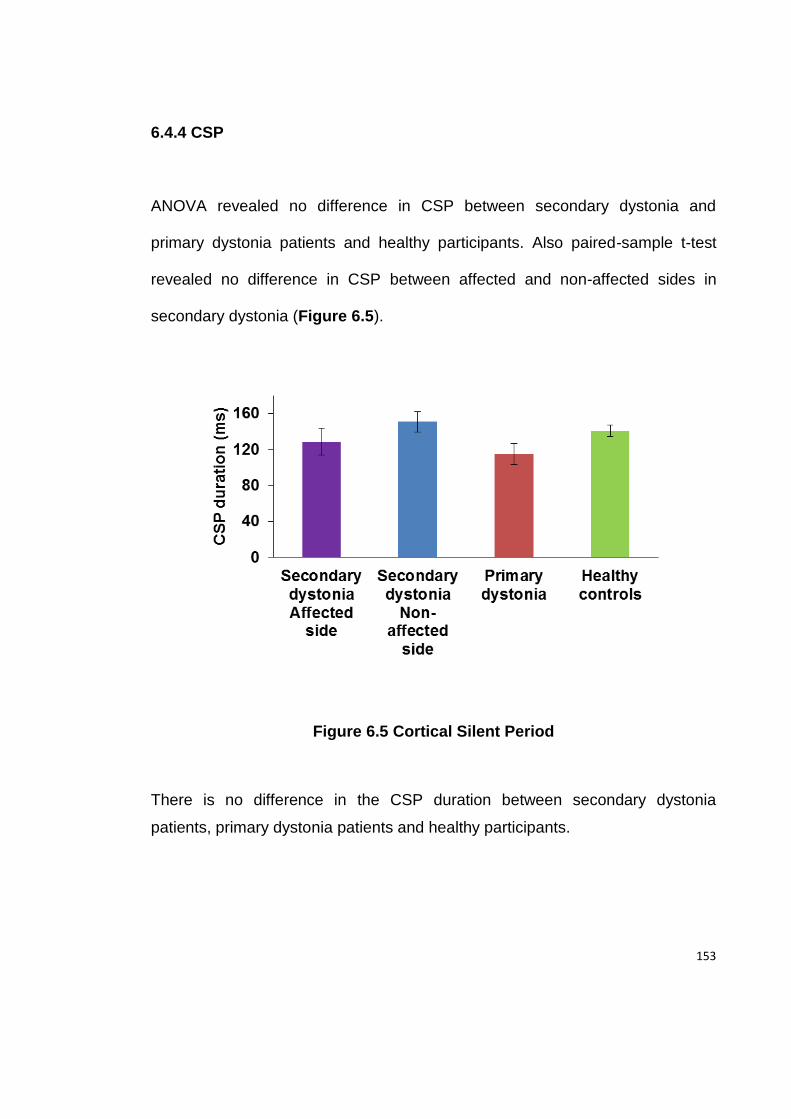
153
6.4.4 CSP
ANOVA revealed no difference in CSP between secondary dystonia and
primary dystonia patients and healthy participants. Also paired-sample t-test
revealed no difference in CSP between affected and non-affected sides in
secondary dystonia (Figure 6.5).
Figure 6.5 Cortical Silent Period
There is no difference in the CSP duration between secondary dystonia
patients, primary dystonia patients and healthy participants.
154
6.4.5 PAS
There was no within-or between-subject difference in electrical stimuli counting
errors during PAS, thus excluding differences in attention levels in different
sessions.
The results of PAS effect are given in Figures 6.6, 6.7 and 6.8. Figure 6.9
represents averaged PAS response in individual participants. ANOVA revealed
significant effect of the factor GROUP (F (2, 28) =12; p < 10-3), due to higher
response to PAS in primary dystonia patients comparing to both secondary
dystonia patients (p < 10-3) and healthy participants (p < 10-3), while there was
no difference between secondary dystonia patients and healthy participants.
Factors MUSCLE and TIME POINT were not significant and all 2 -way and 3-
way interactions were also not significant, indicating that PAS response was
higher in primary dystonia at all 3 time points after the PAS and in both APB
and ADM muscles (Figure 6.6 and 6.7). When the affected side was compared
to non-affected side in secondary dystonia, ANOVA revealed the significant
effect of the factor MUSCLE (F (1, 9) =8.7; p=0.02), due to higher response to
PAS in the APB compared to the ADM muscle. Factors SIDE and TIME POINT
were not significant as were the interactions between main factors, indicating
that there was no difference in the PAS response between the affected and
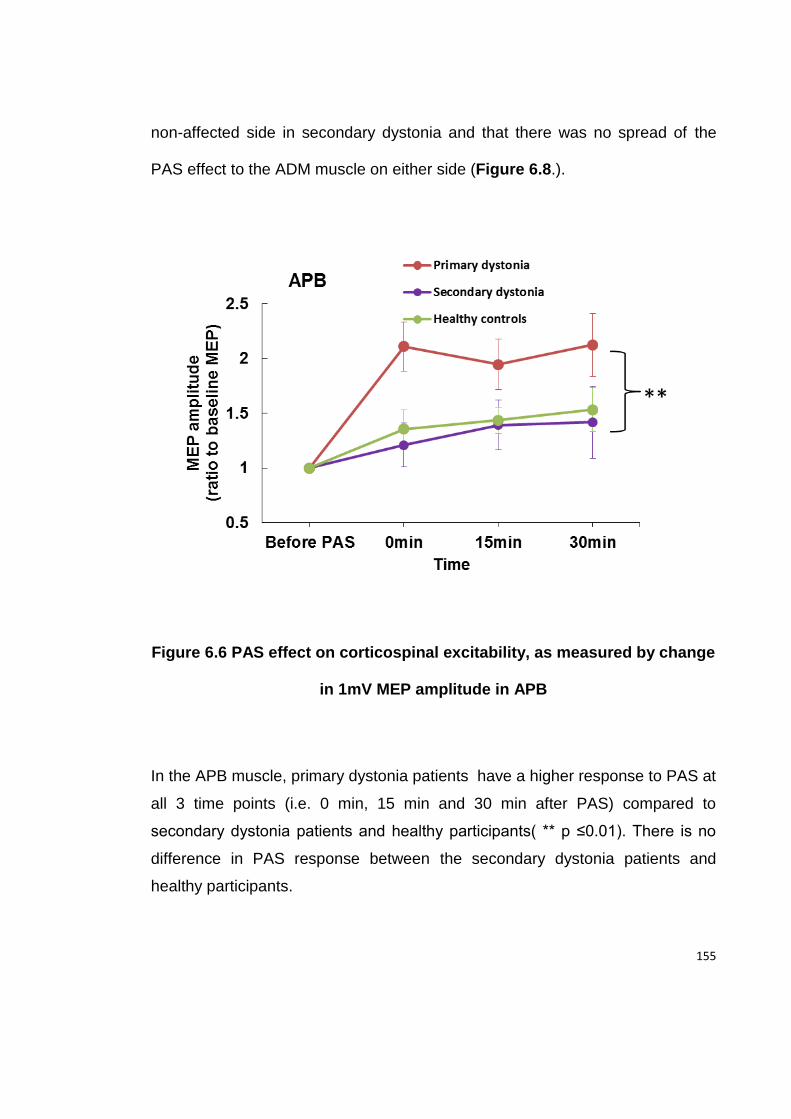
155
non-affected side in secondary dystonia and that there was no spread of the
PAS effect to the ADM muscle on either side (Figure 6.8.).
Figure 6.6 PAS effect on corticospinal excitability, as measured by change
in 1mV MEP amplitude in APB
In the APB muscle, primary dystonia patients have a higher response to PAS at
all 3 time points (i.e. 0 min, 15 min and 30 min after PAS) compared to
secondary dystonia patients and healthy participants( ** p ≤0.01). There is no
difference in PAS response between the secondary dystonia patients and
healthy participants.
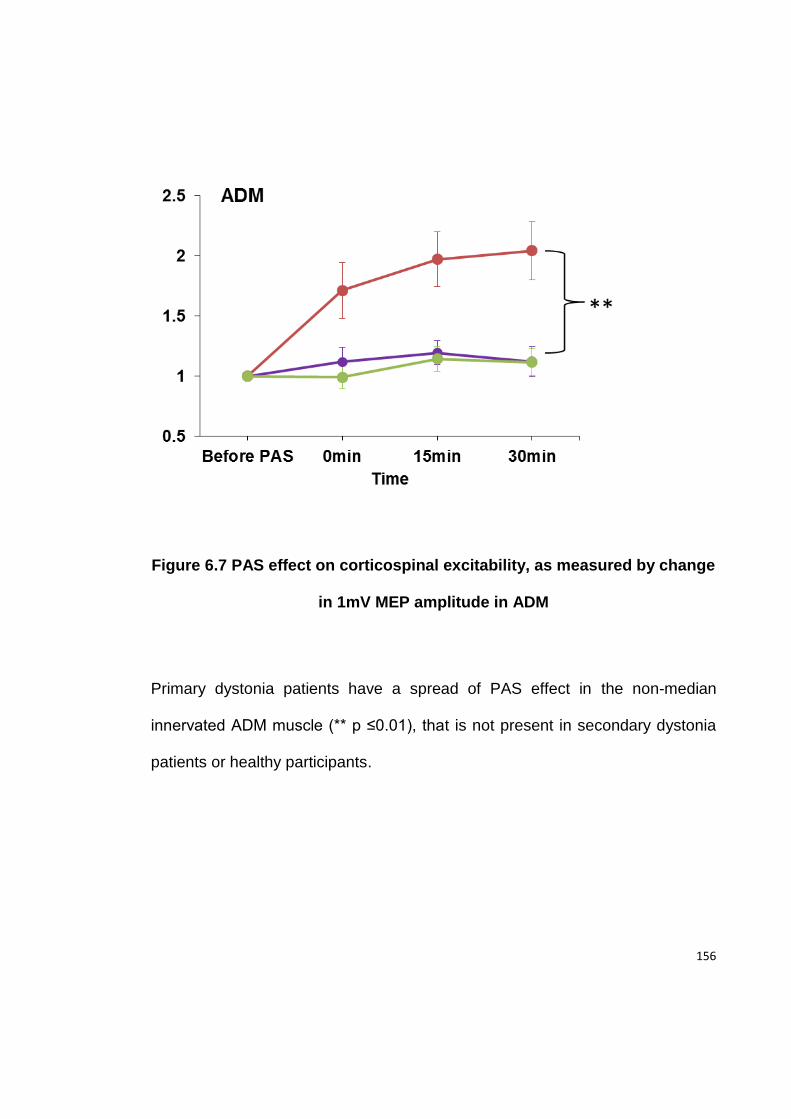
156
Figure 6.7 PAS effect on corticospinal excitability, as measured by change
in 1mV MEP amplitude in ADM
Primary dystonia patients have a spread of PAS effect in the non-median
innervated ADM muscle (** p ≤0.01), that is not present in secondary dystonia
patients or healthy participants.
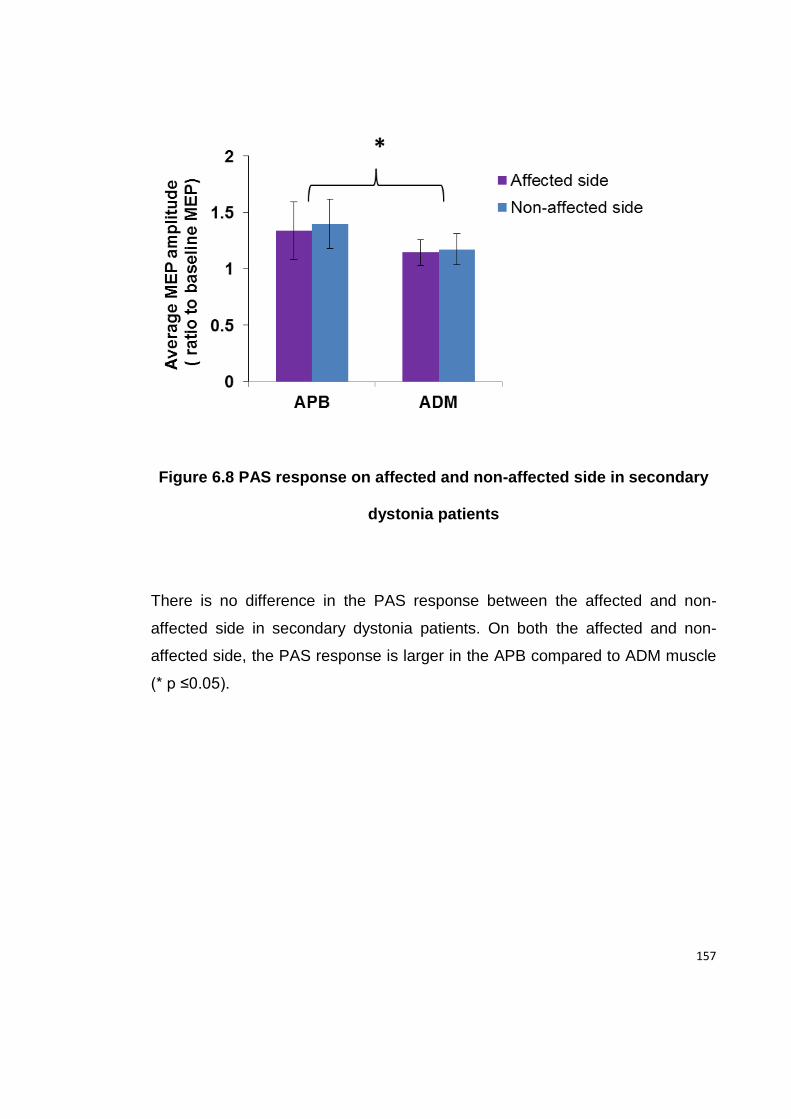
157
Figure 6.8 PAS response on affected and non-affected side in secondary
dystonia patients
There is no difference in the PAS response between the affected and non-
affected side in secondary dystonia patients. On both the affected and non-
affected side, the PAS response is larger in the APB compared to ADM muscle
(* p ≤0.05).
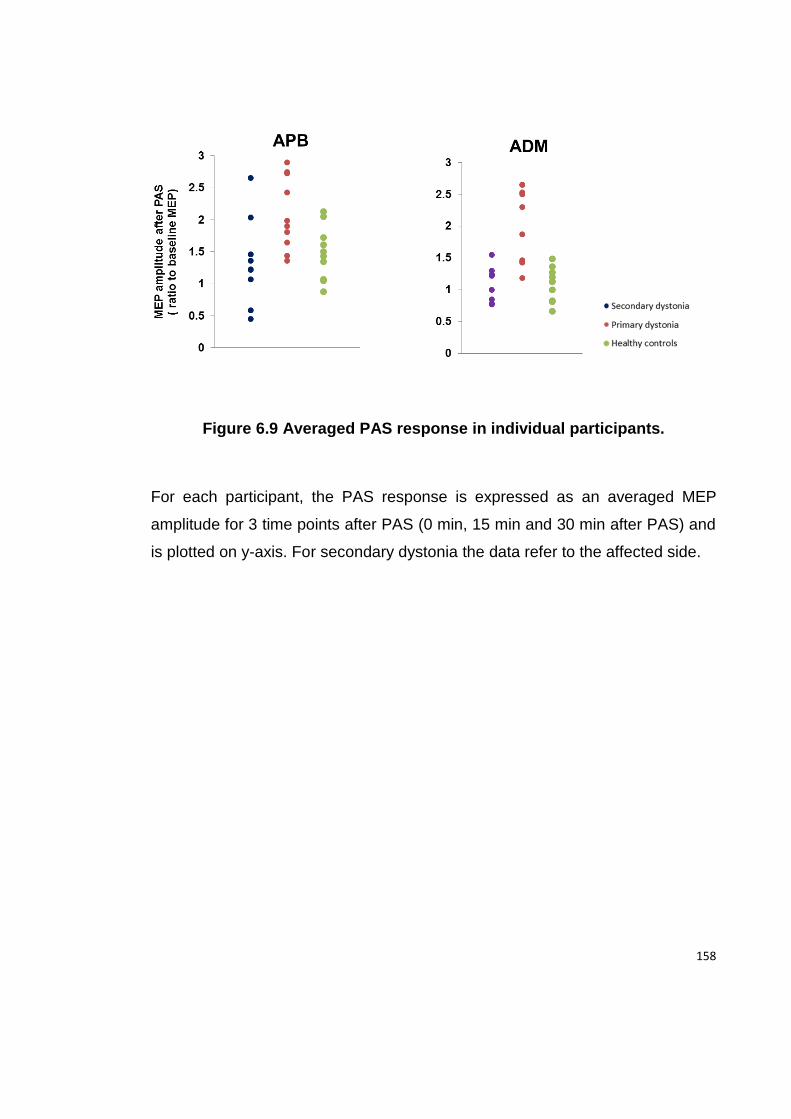
158
Figure 6.9 Averaged PAS response in individual participants.
For each participant, the PAS response is expressed as an averaged MEP
amplitude for 3 time points after PAS (0 min, 15 min and 30 min after PAS) and
is plotted on y-axis. For secondary dystonia the data refer to the affected side.
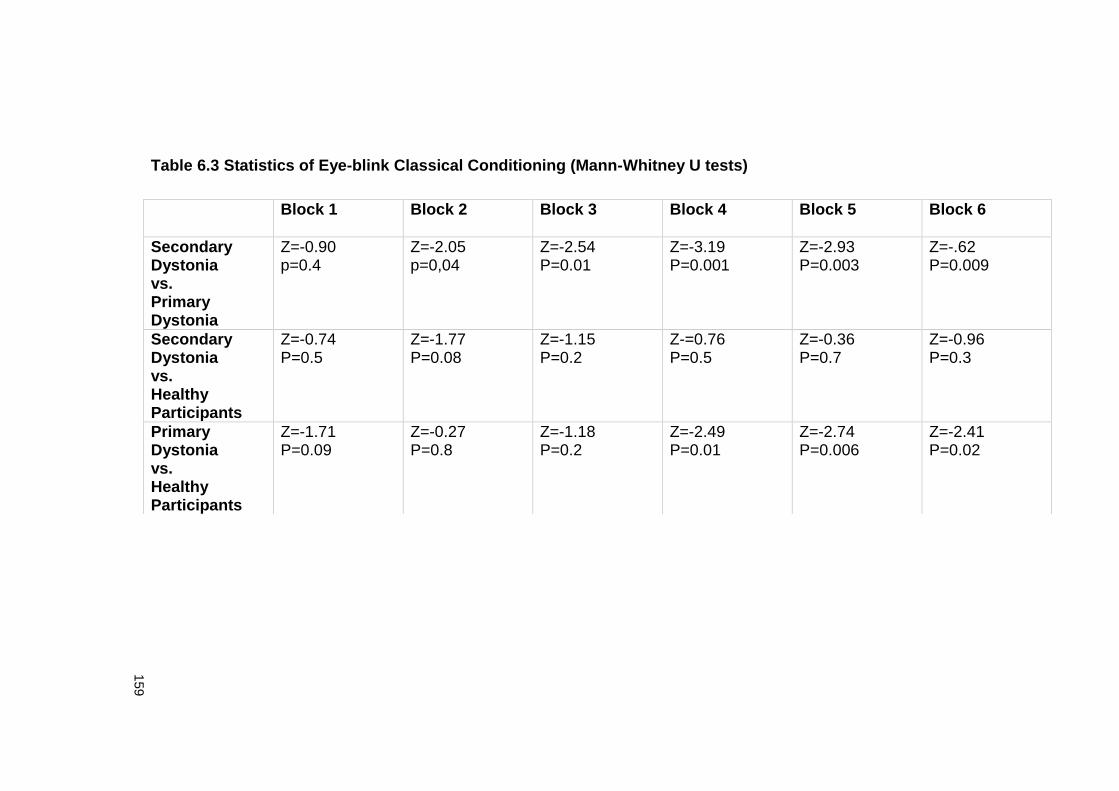
159
Table 6.3 Statistics of Eye-blink Classical Conditioning (Mann-Whitney U tests)
Block 1
Block 2 Block 3 Block 4 Block 5 Block 6
Secondary Dystonia vs. Primary Dystonia
Z=-0.90 p=0.4
Z=-2.05 p=0,04
Z=-2.54 P=0.01
Z=-3.19 P=0.001
Z=-2.93 P=0.003
Z=-.62 P=0.009
Secondary Dystonia vs. Healthy Participants
Z=-0.74 P=0.5
Z=-1.77 P=0.08
Z=-1.15 P=0.2
Z-=0.76 P=0.5
Z=-0.36 P=0.7
Z=-0.96 P=0.3
Primary Dystonia vs. Healthy Participants
Z=-1.71 P=0.09
Z=-0.27 P=0.8
Z=-1.18 P=0.2
Z=-2.49 P=0.01
Z=-2.74 P=0.006
Z=-2.41 P=0.02
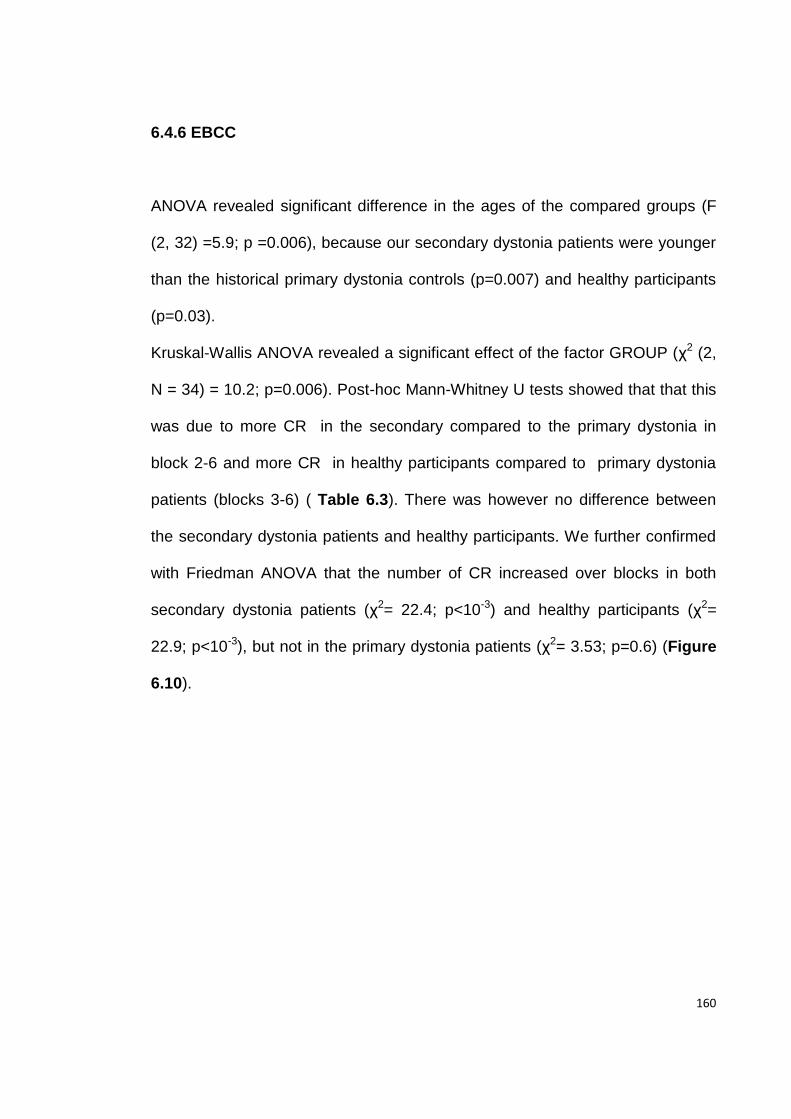
160
6.4.6 EBCC
ANOVA revealed significant difference in the ages of the compared groups (F
(2, 32) =5.9; p =0.006), because our secondary dystonia patients were younger
than the historical primary dystonia controls (p=0.007) and healthy participants
(p=0.03).
Kruskal-Wallis ANOVA revealed a significant effect of the factor GROUP (χ2 (2,
N = 34) = 10.2; p=0.006). Post-hoc Mann-Whitney U tests showed that that this
was due to more CR in the secondary compared to the primary dystonia in
block 2-6 and more CR in healthy participants compared to primary dystonia
patients (blocks 3-6) ( Table 6.3). There was however no difference between
the secondary dystonia patients and healthy participants. We further confirmed
with Friedman ANOVA that the number of CR increased over blocks in both
secondary dystonia patients (χ2= 22.4; p<10-3) and healthy participants (χ2=
22.9; p<10-3), but not in the primary dystonia patients (χ2= 3.53; p=0.6) (Figure
6.10).
161
Figure 6.10 Eye Blink Classical Conditioning (EBCC)
Patients with secondary dystonia have significantly more conditioned eye blink
responses compared to primary dystonia patients. Note that the secondary
dystonia patient’ data in the present study are compared to historical data from
primary dystonia patients and healthy participants obtained in our laboratory
using the same experimental protocol.
162
We found no significant correlation between the clinical and demographic data
and TMS measures in our patients.
6.5 Discussion
The main findings of the present study are: (i) in secondary dystonia patients a
response to PAS is no different than in healthy participants, in contrast to the
enhanced response of patients with primary dystonia; (ii) secondary dystonia
patients have reduced SICI, on the side of the lesion only; and (iii) EBCC is
worse in patients with primary than in those with secondary dystonia.
Differences in PAS induced plasticity between secondary and primary
dystonia
The enhanced response to PAS that we found in our patients with primary
dystonia is in line with many previous studies using a variety of plasticity-testing
protocols (Quartarone et al., 2003, Edwards et al., 2006, Weise et al., 2006). It
was, however, surprising to find that the response to PAS was normal in
secondary dystonia. This is unlikely to be due to differences in baseline
corticospinal excitability, as the IO curves and motor thresholds were the same
in all three groups that we studied. Nor is it likely to be a result of the longer
duration and more severe dystonic symptoms in the patients with secondary
dystonia. Although the present study only examined cases of primary segmental
163
dystonia, previous investigations from this laboratory have found enhanced
responses to experimental plasticity protocols even in patients with primary
generalised dystonia, whose symptoms began in childhood (Edwards et al,
2006) and were so severe as to require bilateral pallidal deep brain stimulation
(Ruge et al, 2011). In addition, there was no correlation between disease
duration and the response to PAS in our secondary dystonia patients.
As we found in the study described in Chapter 5 , BT treatment can transiently
reduce the response to PAS in patients with primary dystonia, which then
returns to levels found before BT injection after a few months. Since all the
present patients were studied at least 15 weeks after their last injection, this
acute effect of BT is unlikely to have influenced the present results.
Nevertheless, it is difficult to speculate on whether there might have been
possible chronic effects of BT on motor cortex plasticity, as this has not been
previously investigated. Several of the patients with secondary dystonia had
been treated for many years and it is possible that this could have permanently
reduced their PAS response and skewed the group data even though there was
no difference in the mean duration of treatment in the primary and secondary
cases. This seems unlikely to have been the case as there was no correlation
between the duration of BT treatment and the response to PAS protocol.
In the absence of other explanations, we suggest that enhanced motor cortex
plasticity is an inherent, genetically determined trait (endophenotype) specific
164
for primary dystonia that predisposes some individuals to develop dystonia. As
suggested by Quartarone et al .(2006c) this may result in an excessive
tendency to form associations between sensory input and motor output, leading
to dystonia, particularly under circumstances involving frequent repetition of
specific movements . In contrast, secondary dystonia is believed to be related to
functional changes in sensorimotor circuits following brain injury (Burke et al.,
1980). The exact mechanism underlying the changes resulting in secondary
dystonia and the anatomical regions in which they occur are not well
understood but it may be that the principal pathological processes spare the
function of the primary motor cortex. Thus, using PET activation study
Ceballos-Baumann et al. (1995) showed that pattern of primary motor cortex
activity differs between acquired hemidystonia and idiopathic torsion dystonia
patients. Similarly, a combined fMRI and DTI study on a patient with
hemidystonia caused by penetrating injury of caudate and lentiform nucleus
showed that there was no significant functional reorganisation in the primary
motor cortex after injury (Werring et al., 1998). This would be consistent with
our finding of a normal response to PAS in our patients.
EBCC and its possible relation to PAS response in dystonia
EBCC, as used in human studies, is a form of predictive learning that lesion
studies have shown to depend on the integrity of the olivo-cerebellar circuit
(Gerwig et al., 2007). Indeed, in healthy individuals, continuous theta burst
165
stimulation (cTBS) over cerebellum, which is thought to interfere with function in
cerebellar circuits, abolishes EBCC (Hoffland et al., 2012). Previously we had
found that EBCC was markedly reduced compared to healthy volunteers in
patients with primary focal hand and/or cervical dystonia and had speculated
that this was further evidence in favour of cerebellar involvement in primary
dystonias (Teo et al., 2009). In the present study, our patients with secondary
dystonia showed preserved EBCC that did not differ from that of healthy
controls. EBCC decreases with age, (Finkbiner and Woodruff-Pak, 1991,
Bellebaum and Daum, 2004) and therefore the age difference between the
different groups could have been a confounding factor. However, even though
our secondary dystonia patients were younger than both healthy controls and
primary dystonia patients, their EBCC was similar to that of healthy controls and
superior to EBCC in primary dystonia. Therefore, a younger age is unlikely to be
a reason for the apparently normal EBCC in our secondary dystonia patients.
The implication of our findings is that the pathophysiology of secondary dystonia
is more localised than that of primary dystonia.
Although EBCC and PAS are usually thought to test quite different circuits in
different parts of the brain, there may be some connection between them that
could potentially link the present results in primary and secondary dystonias.
Recent work has shown that the response to some PAS protocols is modulated
by inputs from the cerebellum; thus a disordered cerebellum could potentially
lead to abnormal PAS. In healthy volunteers, the effect of a PAS25 protocol
166
(that is, with an interval of 25ms between median nerve and TMS pulse) is
reduced or abolished by concurrent anodal direct current stimulation over the
cerebellum or by preconditioning with excitatory intermittent theta burst
stimulation (Hamada et al., 2012a); in contrast, preconditioning the cerebellum
with cTBS enhanced PAS (Popa et al., 2012). Thus, the effect of motor cortex
PAS25 depends on the functional state of the cerebellar output.
From the data outlined above, the combination of enhanced response to PAS25
and decreased EBCC in primary dystonia is similar to what occurs with
cerebellar cTBS in healthy volunteers: EBCC is reduced and PAS25 plasticity
increased. The conclusion is that a cerebellar disorder in patients with primary
dystonia could contribute to their abnormal response to PAS. However, this is
unlikely to be the whole story. The response to PAS21.5 (that is, PAS with a
21.5ms interval between stimuli) is unaffected by cerebellar direct current
stimulation (Hamada et al., 2012a) in healthy participants yet it is still enhanced
in primary dystonias (Weise et al., 2006), suggesting that there is an intrinsic
disorder of cortical plasticity in addition to any secondary influence from a
disordered cerebellum.
The role of reduced intracortical inhibition in dystonia
The final finding of our study is that secondary dystonia patients had decreased
SICI on the affected side. This is in line with recent finding of reduced SICI in
patients with dystonia caused by lentiform nucleus lesions (Trompetto et al.,
167
2012). Nevertheless, the pathophysiological significance of reduced intracortical
inhibition in dystonia remains obscure (Berardelli et al., 2008). Reduced SICI is
not specific for dystonia and is found in other BG diseases, including PD and
Tourette syndrome (Ridding et al., 1995a, Ziemann et al., 1997) and is also
found in clinically unaffected carriers of DYT1 gene mutations (Edwards et al.,
2003). Therefore, a loss of intracortical inhibition may be regarded as a non-
specific maladaptive change within the motor cortex, caused by chronically
disorganised BG output. Our finding would fit into this hypothesis, since SICI
was only abnormal on the clinically affected side of our patients with secondary
dystonia. It is also possible that reduced SICI arises as a consequence of
maintaining an abnormal dystonic posture that could have triggered cortical
reorganisation through aberrant afferent input (Espay et al., 2006).
The present data showed only a non-significant trend towards reduced SICI in
patients with primary dystonia. Other studies have also reported normal SICI in
primary dystonia (Rona et al., 1998, Brighina et al., 2009). This probably reflects
the enormous between-subject variability of intracortical inhibition present even
in healthy subjects (Wassermann, 2002).
There was no significant difference in the CSP duration between groups,
although there was a tendency toward a shortening of the CSP on the affected
side in both secondary and primary dystonia, compared to controls. The
literature on CSP in dystonia has been less consistent than for SICI, with
168
studies reporting normal CSP (Stinear and Byblow, 2005) or reduced CSP
(Chen et al., 1997) or an abnormality was restricted to a specific task (Tinazzi et
al., 2005). SICI and the CSP are thought to depend on GABAa and GABAb
cortical interneurons respectively and therefore could be differentially affected
by disease (Werhahn et al., 1999, Di Lazzaro et al., 2006, Hallett, 2011). This
might explain the abnormal SICI and normal CSP in our secondary dystonia
patients. Trompetto et al. (2012) suggested that CSP is reduced in secondary
dystonia when the lesion is restricted to the striatum, while it might be normal if
the lesion involves the pallidum or thalamus. We did not find the duration of
CSP to be related to the anatomical site of the lesion.
Limitations of the study
We acknowledge the limitations of our study. Our sample of secondary dystonia
patients is heterogeneous regarding etiology and anatomical site of the lesion.
Although it is possible that different lesions could have different functional effect
on the motor cortex plasticity, we believe this is unlikely given the similar
response to PAS among all secondary dystonia patients, including the lack of
spread into the non-target ADM muscle. Another limitation of our data is the
long interval between the brain injury and the TMS study. With the present
design, we cannot exclude the possibility that motor cortex plasticity was
affected at the time of emergence of dystonia, and then over time has reverted
to normal. This issue could be addressed in a prospective study that would
169
need to include a large number of patients, given that only a small proportion of
patients with subcortical lesions will go on to develop dystonia.
Conclusion
We have demonstrated that primary and secondary dystonia do not share the
same pattern of electrophysiological abnormalities. In secondary dystonia
caused by structural brain lesions, the response to PAS is normal, and therefore
abnormally enhanced sensorimotor cortical plasticity is not required for the
clinical expression of dystonia. In addition, cerebellar function as measured by
EBCC is not affected in secondary dystonia, indicating that functional
involvement of cerebellum is not an universal feature of dystonia. Our findings
may give some insight into why the stimulation-based therapeutic interventions
which are thought to interfere with motor cortex plasticity, such as repetitive
TMS and DBS, might not be as useful in secondary as in primary dystonia
patients (Andrews et al., 2010, Vidailhet et al., 2012). Further exploration of the
difference in pathophysiological mechanisms in different types of dystonias may
have implications in selecting the most appropriate treatment among different
alternatives and also for developing new therapeutic strategies.
170
General Discussion and Chapter 7
Conclusion
In the present series of studies TMS was used to investigate cortical
pathophysiology in two common movement disorders, PD and dystonia. The
sensorimotor cortex was not considered to be a passive translator of abnormal
BG input into aberrant motor output, but rather as a place that could tune the
various inputs it receives before providing a final output for movement.
Importantly, it was considered that in each disorder, the sensorimotor cortex
could take on a dynamic role, going through different levels of functional
reorganisation depending on many factors including: disease stage, disease
type (i.e. primary vs. secondary dystonia) as well as the functional state of other
nodes in the motor network such as the cerebellum and afferent input. With this
approach, any changes in electrophysiological measures at the level of
sensorimotor cortex could be viewed as either compensatory, maladaptive or as
an epiphenomenon of no significance for the disease. This thesis concentrates
on the changes the in response to experimental plasticity protocols, given the
reputed role of brain plasticity in adaptation to various physiological and
pathological inputs.
It has been classically considered that sensorimotor cortical plasticity is reduced
or absent in PD (Ueki et al., 2006, Udupa and Chen, 2013), while it is increased
171
in dystonia (Quartarone et al., 2003, Quartarone and Pisani, 2011). The present
series of experiments provides evidence that this is not necessarily always the
case.
By using the natural model of clinical asymmetry in PD, we have shown that
cortical plasticity changes from being increased early in the course of the
disease (and perhaps in the preclinical stage), to being smaller than normal as
the disease progresses further. Increased sensorimotor cortical plasticity
probably represents a compensatory response, which slows down the
appearance and progression of motor signs. This is suggested by the
association between the decrease in interhemispheric asymmetry of the PAS
response and decrease in motor asymmetry of disease. Thus, early in PD
changes in cortical plasticity are probably adaptive. The reduced
responsiveness of the sensorimotor cortex to plasticity protocols in advanced
PD most likely reflects the deficit of dopamine, which is an important
neuromodulator of both LTP and LTD.
We have shown that increased plasticity is not a “sine qua non” of dystonias.
Secondary dystonias caused by BG lesions do not manifest enhanced
responses to experimental plasticity protocols. This has several implications.
Firstly, enhanced plasticity is not a pathophysiological feature of all dystonias
but may be a trait only of the primary dystonias. Secondly, changes in cortical
plasticity are not needed for the clinical expression of dystonic symptoms
172
whether they arise as a consequence of cortical reorganisation secondary to
abnormal BG output or are secondary to dystonic activity at the periphery, as
suggested by normal plasticity in secondary dystonia patients. Moreover, even
when present, plasticity changes are not fixed but can be modified by
manipulating various other inputs to the sensorimotor cortex. This explains why
modifying afferent input with BT injections in cervical dystonia reduces excess
plasticity. There are other examples in the literature demonstrating changes in
plasticity with changes in BG cortical input after DBS of GPi (Tisch et al., 2007,
Ruge et al., 2011).
A second pathophysiological difference between secondary and primary
dystonia is in the presence of cerebellar involvement. Cerebellar function as
measured by EBCC is not affected in secondary dystonia caused by BG
lesions, indicating that functional involvement of cerebellum is not a universal
feature of dystonia. However, the on-going debate as to whether changes in
cerebellar activity in primary dystonia are (a) compensatory or (b) an
epiphenomenon occurring secondary to abnormal activity elsewhere within the
sensorimotor network or (c) are a primary part of the pathophysiology of
dystonia (Teo et al., 2009, Sadnicka et al., 2012) is still not resolved. The
compensation hypothesis is based on the idea that cerebellar hyperactivity, as
seen in functional brain imaging of patients with primary dystonia can
compensate for abnormalities in motor cortical plasticity. It is supported to some
extent by the fact that in healthy subjects’ alterations of cerebellar activity using
173
transcranial direct current stimulation reduces responsiveness to a subsequent
PAS protocol (Hamada et al., 2012b). In primary dystonia this compensatory
activity may have deleterious effects on sensitive tests of cerebellar function,
such as eye-blink conditioning, even though clinical signs of cerebellar
dysfunction are absent. This would fit with our finding that since there are no
abnormalities in motor cortical plasticity in secondary dystonia, there is no need
for compensatory cerebellar activity, and thus EBCC is normal. Nevertheless,
the data also could fit into the alternative hypothesis that cerebellar
abnormalities are an intrinsic feature of primary dystonia, since they are absent
in secondary cases.
7.1. Further studies
Though of interest in their own right, the findings here open up options for
further studies into the mechanism of plasticity changes in PD and dystonia and
importantly, highlight the therapeutic potential of TMS in both disorders
7.1.1 Delineating the mechanism of increased cortical plasticity in PD
Our data support the role of asymmetric hemispheric reorganisation in
compensation for PD, however further studies should address the mechanism
through which this might have been occurring.
174
1) Asymmetric functional cortical reorganisation in early PD may be a
consequence of asymmetric BG output from the less and more affected sides.
This issue could be addressed in longitudinal studies of clinically still unaffected
individuals who are at a high risk of developing PD, such as carriers of PD
genes that have a high penetrance. In the potential study, changes in plasticity
over time could be correlated with functional neuroimaging of the BG, such as
FDG-PET and/or DAT-SCAN.
2) An additional mechanism responsible for the asymmetry of LTP-like
plasticity in early PD could be related to abnormal interhemispheric connectivity,
consistent with the model of interhemispheric competition in the motor system.
This model has been investigated in detail in stroke patients and implies that the
affected hemisphere is disabled both by its own damage and by stronger
inhibition from the unaffected hemisphere (Murase et al., 2004, Ward and
Cohen, 2004). Extending the model of interhemispheric competition to cover our
findings, reduced inhibition from the more to the less affected hemisphere could
account for increased motor cortex plasticity in the less affected hemisphere.
There is previous evidence for reduced transcallosal inhibition in PD, as
demonstrated by shortening of the ipsilateral silent period (Priori et al., 1994)
and reduced interhemispheric inhibition from the more to the less affected
hemisphere in PD patients with mirror movements (Li et al., 2007, Spagnolo et
al., 2013). However, no studies have so far investigated if interhemispheric
175
projections from M1 may affect LTP-like plasticity in the contralateral target
hemisphere.
3) A compensatory role of the cerebellum has been suggested in PD
(Ballanger et al., 2008, Wu and Hallett, 2013). Recent work has shown that in
healthy subjects, sensorimotor cortical plasticity as measured by the response
to a facilitatory PAS protocol depends on the functional state of cerebellar
output (Hamada et al., 2012b, Popa et al., 2013). If the response to PAS is
modulated by inputs from the cerebellum, then an increase in cortical plasticity
may be driven by potential compensatory influences from the cerebellum. This
may be further investigated in early clinically asymmetric PD patients by
studying how the response to PAS in each hemisphere changes after
preconditioning the ipsilateral cerebellum with stimulatory and inhibitory TMS
protocols.
7.1.2 Therapeutic use of TMS in PD
If increased sensorimotor cortical plasticity of the less affected hemisphere in
early PD is an adaptive change that slows down progression of the motor signs,
then further enhancing plasticity using non-invasive brain stimulation techniques
may result in additional benefits for patients. This may be achieved by applying
repeated sessions of stimulatory TMS protocols over the less affected side of
early PD patients or even in the preclinical phase of disease. It would also be
176
interesting to investigate if the response to rTMS depends on the treatment
status of the patients. In our study, we have not shown that early initiation of
dopaminergic treatment affects the change in the PAS response that occurs
with disease progression, however our sample was small and our study was not
primarily designed to answer this question.
7.1.3 Further defining the role of cortical plasticity in dystonias
Previous work (Quartarone et al., 2003, Weise et al., 2006) and our study
provide evidence that plasticity is abnormal in the primary dystonias, while we
show that plasticity is normal in patients with secondary dystonia due to BG
lesions, as it is in patients with psychogenic dystonia (Quartarone et al., 2009).
This suggests that functional cortical involvement differs between various forms
of dystonia. Further studies may address whether cortical plasticity and
cerebellar function are involved in some other dystonias, such as drug-induced
dystonias or Dopa-responsive dystonias. This could help to resolve the debate
on whether there is a common pathophysiological model for all the dystonias or
rather different forms of dystonia may have different faulty neuroanatomical
networks.
Furthermore, as all electrophysiological studies on primary dystonias have dealt
with patients who have had at least several years history of dystonic symptoms,
it is still not known if abnormal plasticity is present at the initial presentation of
177
the disease, as would be expected if enhanced plasticity is indeed
pathophysiological trait that predisposes individuals to developing symptoms.
Finally, we have shown that injection of BT injections temporarily reduces
plasticity for a short period after the injections (Chapter 5), while it remains to be
studied if chronic BT treatment affects plasticity in the long term.
7.2 Methodological “lesson”: resolving controversies
Increasing numbers of TMS studies in PD and dystonia have contributed to the
progress in the electrophysiological characterization of BG diseases.
Nevertheless, assometimes quite opposite findings have been recorded in the
same disease, confusion has occurred when interpreting the pathophysiological
findings. For example, in PD, the response to PAS is typically reported as being
reduced (Morgante et al., 2006, Ueki et al., 2006, Kawashima et al., 2013), but
some studies have found the opposite, namely an increased response to PAS
(Bagnato et al., 2006). Opposite findings exist also for iTBS induced cortical
plasticity in PD (Suppa et al., 2011, Zamir et al., 2012). In dystonia, intracortical
inhibition as measured by SICI or CSP has been reported as either reduced or
normal (Hallett, 2011). These controversies can be explained by the details of
the experimental protocols and also by the characteristics of the patients being
studied. Although the average picture of electrophysiological characteristics in
PD and dystonia (and other BG disease) may be best revealed by
methodological studies on large-scale heterogeneous populations, we believe
178
that our four studies contribute to resolving some of the controversies, and have
some important methodological implications:
1) Our results show that the clinical asymmetry of PD is reflected in
asymmetry of cortical TMS parameters. This fact might be one of the
reasons for the conflicting findings in previous studies which did not take
into account the side of symptom onset. The problem may be avoided if
all the patients included in a study are tested on either more or the less
affected side.
2) By longitudinally studying the same PD patients, we have shown that
electrophysiological abnormalities are not fixed, but rather change with
disease progression. This implies that the disease duration can affect
TMS measurements, thus contributing to the variability of results. It is
therefore important that patients included in TMS studies have similar
duration of parkinsonian symptoms.
3) In dystonia patients, the response to an experimental plasticity protocol
correlates positively with the time from previous BT injections. The
implication is that in studies of dystonia, patients should all be treated
with BT at the same time before commenicng the experiments.
179
4) Different forms of dystonia do not share the same pattern of
electrophysiological abnormalities. We have shown differences between
secondary and primary dystonia patients, and there is one study
providing similar evidence for differences between genetic and non-
genetic causes of primary dystonias (Sadnicka et al., in preparation).
Therefore, lumping patients with different types of dystonia together
should better be avoided, as this may lead to heterogeneous results and
add the confusion rather than increasing the knowledge of the
pathophysiology of the dystonias.
7.3. General limitations of the studies
There are limitations associated with statistical analysis used, which I will avoid
in my future studies. For example, the possibility of type I statistical error (“false
positive”) may be minimized using Bonferonni corrections for multiple post-hoc
comparisons and correlations. Type II statistical error (“false negative”) may be
minimised if an optimum sample size is based on the power calculations for the
expected responses from the previously published studies. I will also report the
statistics and the p values of the non-significant results. Finally, I will express
variability of the results not only in terms of measures of the central tendency
(average values) +/- standard error of the mean, but also in terms of confidence
intervals and effect size. This would allow not only more precise estimations of
180
how much the average values of the clinical and electrophysiological variables
are likely to fluctuate but will also permit the results to be included in the future
metanalysis studies.
7.4 Conclusions
This work is focused on two intriguing movement disorders, PD and dystonia, in
which functional reorganisation of the sensorimotor cortex seems to have an
important pathophysiological role. Our approach was to study cortical plasticity
and intracortical inhibition in these disorders, and in particular, the relation of
these measures with other disease related factors, including duration of
disease, etiology, and the impact of medical treatment..
We found that PD is initially characterised by an increase in sensorimotor
plasticity, which probably reflects adaptive process that compensate for the
presence of motor symptoms. However, with time plasticity decreases as this
compensation is lost and the motor symptoms evolve further. Thus, a potential
treatment approach to PD could be to intervene in a way that sustains or further
increases sensorimotor cortical plasticity, aiming to slow down the progression
of the motor signs.
In dystonia, enhanced plasticity seems to represent a maladaptive trait of
primary but not secondary forms of the disease. This may explain the well-
181
known differences in their responses to treatments, as well as providing a
rational basis for further therapeutic approaches. Non-invasive brain stimulation
techniques that interfere with plasticity might be more appropriate in primary
dystonias than in patients with secondary dystonias caused by structural brain
lesions.
In conclusion, brain plasticity should be understood as a process of constant
adjustment to various situations, wheteher or not these are good or bad, short-
lived or enduring. As a consequence of this continuous process, manifestations
of neurological disorders may not only depend on the impact of the disease
pathology, but also on the brain’s potential to undergo plastic changes, adaptive
or maladaptive. And even though we may be born with our brain having pre-
determined potential to undergo plastic changes, there may still be a prospect
of interfering with plasticity for the good of a patient. With this in mind, the first
step is to disentangle the functional significance of plasticity changes in
neurological disorders, as this will eventually enable us to modify them in a
desirable direction, inhibiting changes that lead to disease manifestation and
enhancing those that help the patient.
182
APPENDIX 1: Publications during PhD period related to this thesis
Kojovic M, Pareés I, Kassavetis P, Palomar FJ, Mir P, Teo JT, Cordivari C,
Rothwell JC, Bhatia KP and. Edwards MJ .Secondary and primary dystonia:
pathophysiological differences. Brain. 2013 Jul;136(Pt 7):2038-49.
Kojovic M, Bologna M, Kassavetis P, Murase N, Palomar FJ, Berardelli A,
Rothwell JC, Edwards MJ, Bhatia KP. Functional reorganization of sensorimotor
cortex in early Parkinson disease. Neurology. 2012 May 1;78(18):1441-8.
Bologna M and Kojovic M. Interfacing basal ganglia models and Parkinson's
disease phenomenology: how can we translate the findings of
electrophysiological studies from research to clinic? Basal Ganglia, 2 (2012)
189-193
Kojovic M, Edwards MJ, Parees I, Rothwell JC, Bhatia KP. Secondary cervical
dystonia caused by cerebellar cystic lesion--a case study with transcranial
magnetic stimulation. Clin Neurophysiol. 2012 Feb;123(2):418-9.
Kojovic M, Caronni A, Bologna M, Rothwell JC, Bhatia KP, Edwards MJ.
Botulinum toxin injections reduce associative plasticity in patients with primary
dystonia. Mov Disord. 2011 Jun;26(7):1282-9.
183
APPENDIX 2: Other publications during PhD period
Pareés I, Kojovic M, Pires C, Rubio-Agusti I, Saifee TA, Sadnicka A,
Kassavetis P, Macerollo A, Bhatia KP, Carson A, Stone J, Edwards MJ Physical
precipitating factors in functional movement disorders.J Neurol Sci. 2014 Jan.
doi: 10.1016/j.jns.2013.12.046. [Epub ahead of print]
Pareés I, Saifee TA, Kojovic M, Kassavetis P, Rubio-Agusti I, Sadnicka A,
Bhatia KP, Edwards MJ. Functional (psychogenic) symptoms in Parkinson's
disease. Mov Disord. 2013 Oct;28(12):1622-7
Rubio-Agusti I, Pareés I, Kojovic M, Stamelou M, Saifee TA, Charlesworth
G,Sheerin UM, Edwards MJ, Bhatia KP. Tremulous cervical dystonia is likely to
be familial: Clinical characteristics of a large cohort. Parkinsonism Relat Disord.
2013 Jun;19(6):634-8
Kojovic M, Pareés I, Lampreia T, Pienczk-Reclawowicz K, Xiromerisiou
G,Rubio-Agusti I, Kramberger M, Carecchio M, Alazami AM, Brancati F, Slawek
J, Pirtosek Z, Valente EM, Alkuraya FS, Edwards MJ, Bhatia KP. The syndrome
of deafness-dystonia: Clinical and genetic heterogeneity. Mov Disord. 2013
Jun;28(6):795-803
Rubio-Agusti I, Carecchio M, Bhatia KP, Kojovic M, Parees I, Chandrashekar
HS, Footitt EJ, Burke D, Edwards MJ, Lachmann RH, Murphy E. Movement
Disorders in Adult Patients With Classical Galactosemia. Mov Disord. 2013
Jun;28(6):804-10
Kojovic M, Sheerin UM, Rubio-Agusti I, Saha A, Bras J, Gibbons V, Palmer
R,Houlden H, Hardy J, Wood NW, Bhatia KP. Young-onset parkinsonism due to
184
homozygous duplication of α-synuclein in a consanguineous family. Mov Disord.
2012 Dec;27(14):1827-9.
Rubio-Agusti I, Kojovic M, Edwards MJ, Murphy E, Chandrashekar HS,
Lachmann RH, Bhatia KP. Atypical parkinsonism and cerebrotendinous
xanthomatosis: report of a family with corticobasal syndrome and a literature
review. Mov Disord. 2012 Dec;27(14):1769-74.
Kassavetis P, Saifee TA, Sadnicka A, Pareés I, Kojovic M, Rothwell JC,
Edwards MJ. Adaptation of surround inhibition in the human motor system. Exp
Brain Res. 2012 Oct;222(3):211-7.
Saifee TA, Kassavetis P, Pareés I, Kojovic M, Fisher L, Morton L, Foong
J,Price G, Joyce EM, Edwards MJ. Inpatient treatment of functional motor
symptoms: a long-term follow-up study. J Neurol. 2012 Sep;259(9):1958-63.
Kojovic M, Pareés I, Sadnicka A, Kassavetis P, Rubio-Agusti I, Saifee
TA,Bologna M, Rothwell JC, Edwards MJ, Bhatia KP. The brighter side of music
in dystonia. Arch Neurol. 2012 Jul;69(7):917-9.
Rubio-Agusti I, Kojovic M, Chandrashekar HS, Edwards MJ, Bhatia KP.
Cervical dystonia and joint hypermobility syndrome: a dangerous combination.
Mov Disord. 2012 Feb;27(2):203-4.
Kojovic M, Glavač D, Ožek B, Zupan A, Popović M. De novo P102L mutation in
a patient with Gerstmann-Sträussler-Scheinker disease. Eur J Neurol. 2011
Dec;18(12):e152-3
Pareés I, Saifee TA, Kassavetis P, Kojovic M, Rubio-Agusti I, Rothwell
JC,Bhatia KP, Edwards MJ. Believing is perceiving: mismatch between self-
report and actigraphy in psychogenic tremor. Brain. 2012 Jan;135(Pt 1):117-23.
185
Stamelou M, Kojovic M, Edwards MJ, Bhatia KP. Ability to cycle despite severe
freezing of gait in atypical parkinsonism in Fahr's syndrome. Mov Disord. 2011
Sep;26(11):2141-2.
Kojovic M, Cordivari C, Bhatia K. Myoclonic disorders: a practical approach for
diagnosis and treatment. Ther Adv Neurol Disord. 2011 Jan;4(1):47-62.
Pareés I, Kojovic M, Prasad Korlipara LV, Bhatia KP. Cervical dystonia
associated with facioscapulohumeral dystrophy: expanding the clinical
spectrum? Mov Disord. 2011 Mar;26(4):765-6.
Kojovic M, Kuoppamäki M, Quinn N, Bhatia KP. "Progressive delayed-onset
postanoxic dystonia" diagnosed with PANK2 mutations 26 years after onset-an
update. Mov Disord. 2010 Dec 15;25(16):2889-91
Alazami AM, Schneider SA, Bonneau D, Pasquier L, Carecchio M, Kojovic M,
Steindl K, de Kerdanet M, Nezarati MM, Bhatia KP, Degos B, Goh E, Alkuraya
FS. C2orf37 mutational spectrum in Woodhouse-Sakati syndrome patients. Clin
Genet. 2010 Dec;78(6):585-90.
186
References
Allison T, McCarthy G, Wood CC, Jones SJ (Potentials evoked in human and monkey cerebral cortex by stimulation of the median nerve. A review of scalp and intracranial recordings. Brain : a journal of neurology 114 ( Pt 6):2465-2503.1991).
Ando S, Kobayashi S, Waki H, Kon K, Fukui F, Tadenuma T, Iwamoto M, Takeda Y, Izumiyama N, Watanabe K, Nakamura H (Animal model of dementia induced by entorhinal synaptic damage and partial restoration of cognitive deficits by BDNF and carnitine. J Neurosci Res 70:519-527.2002).
Andrews C, Aviles-Olmos I, Hariz M, Foltynie T (Which patients with dystonia benefit from deep brain stimulation? A metaregression of individual patient outcomes. J Neurol Neurosurg Psychiatry 81:1383-1389.2010).
Antonucci F, Rossi C, Gianfranceschi L, Rossetto O, Caleo M (Long-distance retrograde effects of botulinum neurotoxin A. J Neurosci 28:3689-3696.2008).
Appel-Cresswell S, de la Fuente-Fernandez R, Galley S, McKeown MJ (Imaging of compensatory mechanisms in Parkinson's disease. Curr Opin Neurol 23:407-412.2010).
Bagnato S, Agostino R, Modugno N, Quartarone A, Berardelli A (Plasticity of the motor cortex in Parkinson's disease patients on and off therapy. Mov Disord 21:639-645.2006).
Ballanger B, Baraduc P, Broussolle E, Le Bars D, Desmurget M, Thobois S (Motor urgency is mediated by the contralateral cerebellum in Parkinson's disease. J Neurol Neurosurg Psychiatry 79:1110-1116.2008).
Barker AT, Jalinous R, Freeston IL (Non-invasive magnetic stimulation of human motor cortex. Lancet 1:1106-1107.1985).
Bellebaum C, Daum I (Effects of age and awareness on eyeblink conditional discrimination learning. Behavioral neuroscience 118:1157-1165.2004).
187
Berardelli A, Abbruzzese G, Chen R, Orth M, Ridding MC, Stinear C, Suppa A, Trompetto C, Thompson PD (Consensus paper on short-interval intracortical inhibition and other transcranial magnetic stimulation intracortical paradigms in movement disorders. Brain Stimul 1:183-191.2008).
Berardelli A, Rona S, Inghilleri M, Manfredi M (Cortical inhibition in Parkinson's disease. A study with paired magnetic stimulation. Brain : a journal of neurology 119 ( Pt 1):71-77.1996).
Berardelli A, Rothwell JC, Day BL, Marsden CD (Pathophysiology of blepharospasm and oromandibular dystonia. Brain 108 ( Pt 3):593-608.1985).
Bezard E, Crossman AR, Gross CE, Brotchie JM (Structures outside the basal ganglia may compensate for dopamine loss in the presymptomatic stages of Parkinson's disease. FASEB journal : official publication of the Federation of American Societies for Experimental Biology 15:1092-1094.2001).
Bezard E, Gross CE, Brotchie JM (Presymptomatic compensation in Parkinson's disease is not dopamine-mediated. Trends in neurosciences 26:215-221.2003).
Bi GQ, Poo MM (Synaptic modifications in cultured hippocampal neurons: dependence on spike timing, synaptic strength, and postsynaptic cell type. J Neurosci 18:10464-10472.1998).
Bland JM, Altman DG (Calculating correlation coefficients with repeated observations: Part 1--Correlation within subjects. Bmj 310:446.1995).
Blesa J, Juri C, Garcia-Cabezas MA, Adanez R, Sanchez-Gonzalez MA, Cavada C, Obeso JA (Inter-hemispheric asymmetry of nigrostriatal dopaminergic lesion: a possible compensatory mechanism in Parkinson's disease. Front Syst Neurosci 5:92.2011).
Bliss TV, Lomo T (Long-lasting potentiation of synaptic transmission in the dentate area of the anaesthetized rabbit following stimulation of the perforant path. J Physiol 232:331-356.1973).
188
Boroff DA, Chen GS (On the question of permeability of the blood-brain barrier to botulinum toxin. Int Arch Allergy Appl Immunol 48:495-504.1975).
Boulet S, Mounayar S, Poupard A, Bertrand A, Jan C, Pessiglione M, Hirsch EC, Feuerstein C, Francois C, Feger J, Savasta M, Tremblay L (Behavioral recovery in MPTP-treated monkeys: neurochemical mechanisms studied by intrastriatal microdialysis. J Neurosci 28:9575-9584.2008).
Brasil-Neto JP, Cohen LG, Pascual-Leone A, Jabir FK, Wall RT, Hallett M (Rapid reversible modulation of human motor outputs after transient deafferentation of the forearm: a study with transcranial magnetic stimulation. Neurology 42:1302-1306.1992).
Bressman SB (Dystonia genotypes, phenotypes, and classification. Adv Neurol 94:101-107.2004).
Brighina F, Romano M, Giglia G, Saia V, Puma A, Giglia F, Fierro B (Effects of cerebellar TMS on motor cortex of patients with focal dystonia: a preliminary report. Experimental brain research Experimentelle Hirnforschung Experimentation cerebrale 192:651-656.2009).
Bronfeld M, Bar-Gad I (Loss of specificity in Basal Ganglia related movement disorders. Front Syst Neurosci 5:38.2011).
Buhmann C, Gorsler A, Baumer T, Hidding U, Demiralay C, Hinkelmann K, Weiller C, Siebner HR, Munchau A (Abnormal excitability of premotor-motor connections in de novo Parkinson's disease. Brain : a journal of neurology 127:2732-2746.2004).
Burke RE, Fahn S, Gold AP (Delayed-onset dystonia in patients with "static" encephalopathy. J Neurol Neurosurg Psychiatry 43:789-797.1980).
Byl NN, Merzenich MM, Jenkins WM (A primate genesis model of focal dystonia and repetitive strain injury: I. Learning-induced dedifferentiation of the representation of the hand in the primary somatosensory cortex in adult monkeys. Neurology 47:508-520.1996).
Byrnes ML, Thickbroom GW, Wilson SA, Sacco P, Shipman JM, Stell R, Mastaglia FL (The corticomotor representation of upper limb muscles in
189
writer's cramp and changes following botulinum toxin injection. Brain 121 ( Pt 5):977-988.1998).
Calancie B, Nordin M, Wallin U, Hagbarth KE (Motor-unit responses in human wrist flexor and extensor muscles to transcranial cortical stimuli. Journal of neurophysiology 58:1168-1185.1987).
Caleo M, Restani L, Gianfranceschi L, Costantin L, Rossi C, Rossetto O, Montecucco C, Maffei L (Transient synaptic silencing of developing striate cortex has persistent effects on visual function and plasticity. J Neurosci 27:4530-4540.2007).
Cantello R, Tarletti R, Varrasi C, Cecchin M, Monaco F (Cortical inhibition in Parkinson's disease: new insights from early, untreated patients. Neuroscience 150:64-71.2007).
Caporale N, Dan Y (Spike timing-dependent plasticity: a Hebbian learning rule. Annual review of neuroscience 31:25-46.2008).
Carbon M, Eidelberg D (Abnormal structure-function relationships in hereditary dystonia. Neuroscience 164:220-229.2009).
Ceballos-Baumann AO, Passingham RE, Marsden CD, Brooks DJ (Motor reorganization in acquired hemidystonia. Ann Neurol 37:746-757.1995).
Chen R, Garg RR, Lozano AM, Lang AE (Effects of internal globus pallidus stimulation on motor cortex excitability. Neurology 56:716-723.2001).
Chen R, Wassermann EM, Canos M, Hallett M (Impaired inhibition in writer's cramp during voluntary muscle activation. Neurology 49:1054-1059.1997).
Cicinelli P, Traversa R, Bassi A, Scivoletto G, Rossini PM (Interhemispheric differences of hand muscle representation in human motor cortex. Muscle & nerve 20:535-542.1997).
Costantin L, Bozzi Y, Richichi C, Viegi A, Antonucci F, Funicello M, Gobbi M, Mennini T, Rossetto O, Montecucco C, Maffei L, Vezzani A, Caleo M (Antiepileptic effects of botulinum neurotoxin E. J Neurosci 25:1943-1951.2005).
190
Cunic D, Roshan L, Khan FI, Lozano AM, Lang AE, Chen R (Effects of subthalamic nucleus stimulation on motor cortex excitability in Parkinson's disease. Neurology 58:1665-1672.2002).
Daskalakis ZJ, Christensen BK, Fitzgerald PB, Chen R (Dysfunctional neural plasticity in patients with schizophrenia. Archives of general psychiatry 65:378-385.2008).
de la Fuente-Fernandez R, Schulzer M, Kuramoto L, Cragg J, Ramachandiran N, Au WL, Mak E, McKenzie J, McCormick S, Sossi V, Ruth TJ, Lee CS, Calne DB, Stoessl AJ (Age-specific progression of nigrostriatal dysfunction in Parkinson's disease. Ann Neurol 69:803-810.2011).
Delmaire C, Vidailhet M, Elbaz A, Bourdain F, Bleton JP, Sangla S, Meunier S, Terrier A, Lehericy S (Structural abnormalities in the cerebellum and sensorimotor circuit in writer's cramp. Neurology 69:376-380.2007).
Di Lazzaro V, Oliviero A, Pilato F, Saturno E, Dileone M, Mazzone P, Insola A, Tonali PA, Rothwell JC (The physiological basis of transcranial motor cortex stimulation in conscious humans. Clinical neurophysiology : official journal of the International Federation of Clinical Neurophysiology 115:255-266.2004).
Di Lazzaro V, Pilato F, Dileone M, Ranieri F, Ricci V, Profice P, Bria P, Tonali PA, Ziemann U (GABAA receptor subtype specific enhancement of inhibition in human motor cortex. The Journal of physiology 575:721-726.2006).
Draganski B, Thun-Hohenstein C, Bogdahn U, Winkler J, May A ("Motor circuit" gray matter changes in idiopathic cervical dystonia. Neurology 61:1228-1231.2003).
Edwards MJ, Huang YZ, Mir P, Rothwell JC, Bhatia KP (Abnormalities in motor cortical plasticity differentiate manifesting and nonmanifesting DYT1 carriers. Movement disorders : official journal of the Movement Disorder Society 21:2181-2186.2006).
Edwards MJ, Huang YZ, Wood NW, Rothwell JC, Bhatia KP (Different patterns of electrophysiological deficits in manifesting and non-manifesting carriers of the DYT1 gene mutation. Brain : a journal of neurology 126:2074-2080.2003).
191
Enticott PG, Oberman LM (Synaptic plasticity and non-invasive brain stimulation in autism spectrum disorders. Dev Med Child Neurol 55:13-14.2013).
Espay AJ, Li JY, Johnston L, Chen R, Lang AE (Mirror movements in parkinsonism: evaluation of a new clinical sign. J Neurol Neurosurg Psychiatry 76:1355-1358.2005).
Espay AJ, Morgante F, Purzner J, Gunraj CA, Lang AE, Chen R (Cortical and spinal abnormalities in psychogenic dystonia. Ann Neurol 59:825-834.2006).
Fahn S (Concept and classification of dystonia. Adv Neurol 50:1-8.1988).
Filippi GM, Errico P, Santarelli R, Bagolini B, Manni E (Botulinum A toxin effects on rat jaw muscle spindles. Acta Otolaryngol 113:400-404.1993).
Finkbiner RG, Woodruff-Pak DS (Classical eyeblink conditioning in adulthood: effects of age and interstimulus interval on acquisition in the trace paradigm. Psychology and aging 6:109-117.1991).
Fratello F, Veniero D, Curcio G, Ferrara M, Marzano C, Moroni F, Pellicciari MC, Bertini M, Rossini PM, De Gennaro L (Modulation of corticospinal excitability by paired associative stimulation: reproducibility of effects and intraindividual reliability. Clinical neurophysiology : official journal of the International Federation of Clinical Neurophysiology 117:2667-2674.2006).
Gaspar P, Duyckaerts C, Alvarez C, Javoy-Agid F, Berger B (Alterations of dopaminergic and noradrenergic innervations in motor cortex in Parkinson's disease. Ann Neurol 30:365-374.1991).
Gerwig M, Kolb FP, Timmann D (The involvement of the human cerebellum in eyeblink conditioning. Cerebellum 6:38-57.2007).
Gilio F, Curra A, Lorenzano C, Modugno N, Manfredi M, Berardelli A (Effects of botulinum toxin type A on intracortical inhibition in patients with dystonia. Ann Neurol 48:20-26.2000).
192
Gilio F, Suppa A, Bologna M, Lorenzano C, Fabbrini G, Berardelli A (Short-term cortical plasticity in patients with dystonia: a study with repetitive transcranial magnetic stimulation. Mov Disord 22:1436-1443.2007).
Goetz CG, Tilley BC, Shaftman SR, Stebbins GT, Fahn S, Martinez-Martin P, Poewe W, Sampaio C, Stern MB, Dodel R, Dubois B, Holloway R, Jankovic J, Kulisevsky J, Lang AE, Lees A, Leurgans S, LeWitt PA, Nyenhuis D, Olanow CW, Rascol O, Schrag A, Teresi JA, van Hilten JJ, LaPelle N (Movement Disorder Society-sponsored revision of the Unified Parkinson's Disease Rating Scale (MDS-UPDRS): scale presentation and clinimetric testing results. Mov Disord 23:2129-2170.2008a).
Goetz CG, Tilley BC, Shaftman SR, Stebbins GT, Fahn S, Martinez-Martin P, Poewe W, Sampaio C, Stern MB, Dodel R, Dubois B, Holloway R, Jankovic J, Kulisevsky J, Lang AE, Lees A, Leurgans S, LeWitt PA, Nyenhuis D, Olanow CW, Rascol O, Schrag A, Teresi JA, van Hilten JJ, LaPelle N, Movement Disorder Society URTF (Movement Disorder Society-sponsored revision of the Unified Parkinson's Disease Rating Scale (MDS-UPDRS): scale presentation and clinimetric testing results. Mov Disord 23:2129-2170.2008b).
Gualtierotti T, Paterson AS (Electrical stimulation of the unexposed cerebral cortex. J Physiol 125:278-291.1954).
Gubellini P, Pisani A, Centonze D, Bernardi G, Calabresi P (Metabotropic glutamate receptors and striatal synaptic plasticity: implications for neurological diseases. Prog Neurobiol 74:271-300.2004).
Hallett M (Neurophysiology of dystonia: The role of inhibition. Neurobiol Dis 42:177-184.2011).
Hallett M, Chen R, Ziemann U, Cohen LG (Reorganization in motor cortex in amputees and in normal volunteers after ischemic limb deafferentation. Electroencephalogr Clin Neurophysiol Suppl 51:183-187.1999).
Hamada M, Murase N, Hasan A, Balaratnam M, Rothwell JC (The Role of Interneuron Networks in Driving Human Motor Cortical Plasticity. Cereb Cortex.2012a).
193
Hamada M, Strigaro G, Murase N, Sadnicka A, Galea JM, Edwards MJ, Rothwell JC (Cerebellar modulation of human associative plasticity. J Physiol 590:2365-2374.2012b).
Hanajima R, Terao Y, Shirota Y, Ohminami S, Nakatani-Enomoto S, Okabe S, Matsumoto H, Tsutsumi R, Ugawa Y (Short-interval intracortical inhibition in Parkinson's disease using anterior-posterior directed currents. Experimental brain research Experimentelle Hirnforschung Experimentation cerebrale 214:317-321.2011).
Hebb DO (1949) The Organization of Behavior: A Neuropsychological Theory. New York: Wiley.
Hoffland BS, Bologna M, Kassavetis P, Teo JT, Rothwell JC, Yeo CH, van de Warrenburg BP, Edwards MJ (Cerebellar theta burst stimulation impairs eyeblink classical conditioning. J Physiol 590:887-897.2012).
Hornykiewicz O (Biochemical aspects of Parkinson's disease. Neurology 51:S2-9.1998).
Hornykiewicz O, Kish SJ (Biochemical pathophysiology of Parkinson's disease. Adv Neurol 45:19-34.1987).
Huang YZ, Rothwell JC, Lu CS, Chuang WL, Chen RS (Abnormal bidirectional plasticity-like effects in Parkinson's disease. Brain : a journal of neurology 134:2312-2320.2011).
Hubsch C, Roze E, Popa T, Russo M, Balachandran A, Pradeep S, Mueller F, Brochard V, Quartarone A, Degos B, Vidailhet M, Kishore A, Meunier S (Defective cerebellar control of cortical plasticity in writer's cramp. Brain : a journal of neurology 136:2050-2062.2013).
Hughes AJ, Daniel SE, Kilford L, Lees AJ (Accuracy of clinical diagnosis of idiopathic Parkinson's disease: a clinico-pathological study of 100 cases. J Neurol Neurosurg Psychiatry 55:181-184.1992).
Hutchinson M, Nakamura T, Moeller JR, Antonini A, Belakhlef A, Dhawan V, Eidelberg D (The metabolic topography of essential blepharospasm: a focal dystonia with general implications. Neurology 55:673-677.2000).
194
Inghilleri M, Conte A, Curra A, Frasca V, Lorenzano C, Berardelli A (Ovarian hormones and cortical excitability. An rTMS study in humans. Clinical neurophysiology : official journal of the International Federation of Clinical Neurophysiology 115:1063-1068.2004).
Jacob V, Brasier DJ, Erchova I, Feldman D, Shulz DE (Spike timing-dependent synaptic depression in the in vivo barrel cortex of the rat. J Neurosci 27:1271-1284.2007).
Johnston MV (Clinical disorders of brain plasticity. Brain & development 26:73-80.2004).
Kaasinen V, Ruottinen HM, Nagren K, Lehikoinen P, Oikonen V, Rinne JO (Upregulation of putaminal dopamine D2 receptors in early Parkinson's disease: a comparative PET study with [11C] raclopride and [11C]N-methylspiperone. J Nucl Med 41:65-70.2000).
Kacar A, Filipovic SR, Kresojevic N, Milanovic SD, Ljubisavljevic M, Kostic VS, Rothwell JC (History of exposure to dopaminergic medication does not affect motor cortex plasticity and excitability in Parkinson's disease. Clinical neurophysiology : official journal of the International Federation of Clinical Neurophysiology.2012).
Kaneko K, Kawai S, Fuchigami Y, Morita H, Ofuji A (The effect of current direction induced by transcranial magnetic stimulation on the corticospinal excitability in human brain. Electroencephalogr Clin Neurophysiol 101:478-482.1996).
Kawashima S, Ueki Y, Mima T, Fukuyama H, Ojika K, Matsukawa N (Differences in dopaminergic modulation to motor cortical plasticity between Parkinson's disease and multiple system atrophy. PLoS One 8:e62515.2013).
Kessler KR, Ruge D, Ilic TV, Ziemann U (Short latency afferent inhibition and facilitation in patients with writer's cramp. Mov Disord 20:238-242.2005).
Khedr EM, Farweez HM, Islam H (Therapeutic effect of repetitive transcranial magnetic stimulation on motor function in Parkinson's disease patients. Eur J Neurol 10:567-572.2003).
195
Khedr EM, Rothwell JC, Shawky OA, Ahmed MA, Hamdy A (Effect of daily repetitive transcranial magnetic stimulation on motor performance in Parkinson's disease. Mov Disord 21:2201-2205.2006).
Kishore A, Popa T, Balachandran A, Chandran S, Pradeep S, Backer F, Krishnan S, (Cerebellar Sensory Processing Alterations Impact Motor Cortical Plasticity in Parkinson's Disease: Clues from Dyskinetic Patients. Cerebral cortex.2013).
Kishore A, Popa T, Velayudhan B, Joseph, T, Balachandran, Meunier S ( Acute dopamine boost has a negative effect on plasticity of the primary motor cortex in advanced Parkinson’s disease. Brain 2012)
Kujirai T, Caramia MD, Rothwell JC, Day BL, Thompson PD, Ferbert A, Wroe S, Asselman P, Marsden CD (Corticocortical inhibition in human motor cortex. The Journal of physiology 471:501-519.1993).
Kukowski B, Haug B (Quantitative evaluation of the silent period, evoked by transcranial magnetic stimulation during sustained muscle contraction, in normal man and in patients with stroke. Electromyography and clinical neurophysiology 32:373-378.1992).
Kuo MF, Paulus W, Nitsche MA (Boosting focally-induced brain plasticity by dopamine. Cereb Cortex 18:648-651.2008).
Lee CS, Samii A, Sossi V, Ruth TJ, Schulzer M, Holden JE, Wudel J, Pal PK, de la Fuente-Fernandez R, Calne DB, Stoessl AJ (In vivo positron emission tomographic evidence for compensatory changes in presynaptic dopaminergic nerve terminals in Parkinson's disease. Ann Neurol 47:493-503.2000).
Lewis GN, Byblow WD (Altered sensorimotor integration in Parkinson's disease. Brain 125:2089-2099.2002).
Li JY, Espay AJ, Gunraj CA, Pal PK, Cunic DI, Lang AE, Chen R (Interhemispheric and ipsilateral connections in Parkinson's disease: relation to mirror movements. Mov Disord 22:813-821.2007).
Lomarev MP, Kanchana S, Bara-Jimenez W, Iyer M, Wassermann EM, Hallett M (Placebo-controlled study of rTMS for the treatment of Parkinson's disease. Mov Disord 21:325-331.2006).
196
Luscher C, Malenka RC (NMDA receptor-dependent long-term potentiation and long-term depression (LTP/LTD). Cold Spring Harbor perspectives in biology 4.2012).
MacKinnon CD, Gilley EA, Weis-McNulty A, Simuni T (Pathways mediating abnormal intracortical inhibition in Parkinson's disease. Ann Neurol 58:516-524.2005).
Maffei A (The many forms and functions of long term plasticity at GABAergic synapses. Neural plasticity 2011:254724.2011).
Magee JC, Johnston D (A synaptically controlled, associative signal for Hebbian plasticity in hippocampal neurons. Science 275:209-213.1997).
Malenka RC, Bear MF (LTP and LTD: an embarrassment of riches. Neuron 44:5-21.2004).
Manfredi L, Garavaglia P, Beretta S, Pellegrini G (Increased cortical inhibition induced by apomorphine in patients with Parkinson's disease. Neurophysiol Clin 28:31-38.1998).
Marsden CD, Obeso JA, Zarranz JJ, Lang AE (The anatomical basis of symptomatic hemidystonia. Brain : a journal of neurology 108 ( Pt 2):463-483.1985).
McCallum SE, Parameswaran N, Perez XA, Bao S, McIntosh JM, Grady SR, Quik M (Compensation in pre-synaptic dopaminergic function following nigrostriatal damage in primates. J Neurochem 96:960-972.2006).
Merton PA, Morton HB (Stimulation of the cerebral cortex in the intact human subject. Nature 285:227.1980).
Meunier S, Russmann H, Shamim E, Lamy JC, Hallett M (Plasticity of cortical inhibition in dystonia is impaired after motor learning and paired-associative stimulation. Eur J Neurosci 35:975-986.2012).
Mink JW, Thach WT (Basal ganglia motor control. II. Late pallidal timing relative to movement onset and inconsistent pallidal coding of movement parameters. Journal of neurophysiology 65:301-329.1991).
197
Missitzi J, Gentner R, Geladas N, Politis P, Karandreas N, Classen J, Klissouras V (Plasticity in human motor cortex is in part genetically determined. J Physiol 589:297-306.2011).
Monte-Silva K, Kuo MF, Thirugnanasambandam N, Liebetanz D, Paulus W, Nitsche MA (Dose-dependent inverted U-shaped effect of dopamine (D2-like) receptor activation on focal and nonfocal plasticity in humans. J Neurosci 29:6124-6131.2009).
Morgante F, Espay AJ, Gunraj C, Lang AE, Chen R (Motor cortex plasticity in Parkinson's disease and levodopa-induced dyskinesias. Brain 129:1059-1069.2006).
Muller-Dahlhaus F, Ziemann U, Classen J (Plasticity resembling spike-timing dependent synaptic plasticity: the evidence in human cortex. Frontiers in synaptic neuroscience 2:34.2010).
Muller-Dahlhaus JF, Orekhov Y, Liu Y, Ziemann U (Interindividual variability and age-dependency of motor cortical plasticity induced by paired associative stimulation. Experimental brain research Experimentelle Hirnforschung Experimentation cerebrale 187:467-475.2008).
Murase N, Duque J, Mazzocchio R, Cohen LG (Influence of interhemispheric interactions on motor function in chronic stroke. Ann Neurol 55:400-409.2004).
Nakashima K, Rothwell JC, Day BL, Thompson PD, Shannon K, Marsden CD (Reciprocal inhibition between forearm muscles in patients with writer's cramp and other occupational cramps, symptomatic hemidystonia and hemiparesis due to stroke. Brain 112 ( Pt 3):681-697.1989).
Nakashima K, Wang Y, Shimoda M, Sakuma K, Takahashi K (Shortened silent period produced by magnetic cortical stimulation in patients with Parkinson's disease. J Neurol Sci 130:209-214.1995).
Neychev VK, Gross RE, Lehericy S, Hess EJ, Jinnah HA (The functional neuroanatomy of dystonia. Neurobiol Dis 42:185-201.2011).
Ni Z, Bahl N, Gunraj CA, Mazzella F, Chen R (Increased motor cortical facilitation and decreased inhibition in Parkinson disease. Neurology 80:1746-1753.2013).
198
Obermann M, Yaldizli O, De Greiff A, Lachenmayer ML, Buhl AR, Tumczak F, Gizewski ER, Diener HC, Maschke M (Morphometric changes of sensorimotor structures in focal dystonia. Mov Disord 22:1117-1123.2007).
Obeso JA, Marin C, Rodriguez-Oroz C, Blesa J, Benitez-Temino B, Mena-Segovia J, Rodriguez M, Olanow CW (The basal ganglia in Parkinson's disease: current concepts and unexplained observations. Ann Neurol 64 Suppl 2:S30-46.2008).
Obeso JA, Rodriguez-Oroz MC, Lanciego JL, Rodriguez Diaz M (How does Parkinson's disease begin? The role of compensatory mechanisms. Trends Neurosci 27:125-127; author reply 127-128.2004).
Odergren T, Stone-Elander S, Ingvar M (Cerebral and cerebellar activation in correlation to the action-induced dystonia in writer's cramp. Mov Disord 13:497-508.1998).
Oldfield RC (The assessment and analysis of handedness: the Edinburgh inventory. Neuropsychologia 9:97-113.1971).
Orth M, Rothwell JC (The cortical silent period: intrinsic variability and relation to the waveform of the transcranial magnetic stimulation pulse. Clinical neurophysiology : official journal of the International Federation of Clinical Neurophysiology 115:1076-1082.2004).
Pascual-Leone A, Amedi A, Fregni F, Merabet LB (The plastic human brain cortex. Annual review of neuroscience 28:377-401.2005).
Pascual-Leone A, Freitas C, Oberman L, Horvath JC, Halko M, Eldaief M, Bashir S, Vernet M, Shafi M, Westover B, Vahabzadeh-Hagh AM, Rotenberg A (Characterizing brain cortical plasticity and network dynamics across the age-span in health and disease with TMS-EEG and TMS-fMRI. Brain topography 24:302-315.2011).
Peterson DA, Sejnowski TJ, Poizner H (Convergent evidence for abnormal striatal synaptic plasticity in dystonia. Neurobiol Dis 37:558-573.2010).
Picconi B, Centonze D, Hakansson K, Bernardi G, Greengard P, Fisone G, Cenci MA, Calabresi P (Loss of bidirectional striatal synaptic plasticity in L-DOPA-induced dyskinesia. Nature neuroscience 6:501-506.2003).
199
Pierantozzi M, Palmieri MG, Marciani MG, Bernardi G, Giacomini P, Stanzione P (Effect of apomorphine on cortical inhibition in Parkinson's disease patients: a transcranial magnetic stimulation study. Exp Brain Res 141:52-62.2001).
Popa T, Velayudhan B, Hubsch C, Pradeep S, Roze E, Vidailhet M, Meunier S, Kishore A (Cerebellar Processing of Sensory Inputs Primes Motor Cortex Plasticity. Cereb Cortex.2012).
Popa T, Velayudhan B, Hubsch C, Pradeep S, Roze E, Vidailhet M, Meunier S, Kishore A (Cerebellar processing of sensory inputs primes motor cortex plasticity. Cereb Cortex 23:305-314.2013).
Priori A, Berardelli A, Inghilleri M, Accornero N, Manfredi M (Motor cortical inhibition and the dopaminergic system. Pharmacological changes in the silent period after transcranial brain stimulation in normal subjects, patients with Parkinson's disease and drug-induced parkinsonism. Brain : a journal of neurology 117 ( Pt 2):317-323.1994).
Priori A, Berardelli A, Mercuri B, Manfredi M (Physiological effects produced by botulinum toxin treatment of upper limb dystonia. Changes in reciprocal inhibition between forearm muscles. Brain 118 ( Pt 3):801-807.1995).
Priori A, Oliviero A, Donati E, Callea L, Bertolasi L, Rothwell JC (Human handedness and asymmetry of the motor cortical silent period. Experimental brain research Experimentelle Hirnforschung Experimentation cerebrale 128:390-396.1999).
Quartarone A, Bagnato S, Rizzo V, Siebner HR, Dattola V, Scalfari A, Morgante F, Battaglia F, Romano M, Girlanda P (Abnormal associative plasticity of the human motor cortex in writer's cramp. Brain 126:2586-2596.2003).
Quartarone A, Morgante F, Sant'angelo A, Rizzo V, Bagnato S, Terranova C, Siebner HR, Berardelli A, Girlanda P (Abnormal plasticity of sensorimotor circuits extends beyond the affected body part in focal dystonia. J Neurol Neurosurg Psychiatry 79:985-990.2008).
Quartarone A, Pisani A (Abnormal plasticity in dystonia: Disruption of synaptic homeostasis. Neurobiol Dis 42:162-170.2011).
200
Quartarone A, Rizzo V, Bagnato S, Morgante F, Sant'Angelo A, Girlanda P, Siebner HR (Rapid-rate paired associative stimulation of the median nerve and motor cortex can produce long-lasting changes in motor cortical excitability in humans. J Physiol 575:657-670.2006a).
Quartarone A, Rizzo V, Terranova C, Morgante F, Schneider S, Ibrahim N, Girlanda P, Bhatia KP, Rothwell JC (Abnormal sensorimotor plasticity in organic but not in psychogenic dystonia. Brain : a journal of neurology 132:2871-2877.2009).
Quartarone A, Sant'Angelo A, Battaglia F, Bagnato S, Rizzo V, Morgante F, Rothwell JC, Siebner HR, Girlanda P (Enhanced long-term potentiation-like plasticity of the trigeminal blink reflex circuit in blepharospasm. J Neurosci 26:716-721.2006b).
Quartarone A, Siebner HR, Rothwell JC (Task-specific hand dystonia: can too much plasticity be bad for you? Trends Neurosci 29:192-199.2006c).
Reynolds C, Ashby P (Inhibition in the human motor cortex is reduced just before a voluntary contraction. Neurology 53:730-735.1999).
Ridding MC, Flavel SC (Induction of plasticity in the dominant and non-dominant motor cortices of humans. Experimental brain research Experimentelle Hirnforschung Experimentation cerebrale 171:551-557.2006).
Ridding MC, Inzelberg R, Rothwell JC (Changes in excitability of motor cortical circuitry in patients with Parkinson's disease. Ann Neurol 37:181-188.1995a).
Ridding MC, Rothwell JC (Reorganisation in human motor cortex. Can J Physiol Pharmacol 73:218-222.1995).
Ridding MC, Sheean G, Rothwell JC, Inzelberg R, Kujirai T (Changes in the balance between motor cortical excitation and inhibition in focal, task specific dystonia. J Neurol Neurosurg Psychiatry 59:493-498.1995b).
Ridding MC, Taylor JL, Rothwell JC (The effect of voluntary contraction on cortico-cortical inhibition in human motor cortex. J Physiol 487 ( Pt 2):541-548.1995c).
201
Rona S, Berardelli A, Vacca L, Inghilleri M, Manfredi M (Alterations of motor cortical inhibition in patients with dystonia. Mov Disord 13:118-124.1998).
Rosales RL, Arimura K, Takenaga S, Osame M (Extrafusal and intrafusal muscle effects in experimental botulinum toxin-A injection. Muscle Nerve 19:488-496.1996).
Rosen I, Asanuma H (Peripheral afferent inputs to the forelimb area of the monkey motor cortex: input-output relations. Experimental brain research Experimentelle Hirnforschung Experimentation cerebrale 14:257-273.1972).
Rosenkranz K (Plasticity and intracortical inhibition in dystonia--methodological reconsiderations. Brain : a journal of neurology 133:e146; author reply e147.2010).
Rosenkranz K, Williamon A, Rothwell JC (Motorcortical excitability and synaptic plasticity is enhanced in professional musicians. J Neurosci 27:5200-5206.2007).
Rossi S, Hallett M, Rossini PM, Pascual-Leone A, Safety of TMSCG (Safety, ethical considerations, and application guidelines for the use of transcranial magnetic stimulation in clinical practice and research. Clinical neurophysiology : official journal of the International Federation of Clinical Neurophysiology 120:2008-2039.2009).
Rossini PM, Barker AT, Berardelli A, Caramia MD, Caruso G, Cracco RQ, Dimitrijevic MR, Hallett M, Katayama Y, Lucking CH, et al. (Non-invasive electrical and magnetic stimulation of the brain, spinal cord and roots: basic principles and procedures for routine clinical application. Report of an IFCN committee. Electroencephalogr Clin Neurophysiol 91:79-92.1994).
Rossini PM, Calautti C, Pauri F, Baron JC (Post-stroke plastic reorganisation in the adult brain. Lancet Neurol 2:493-502.2003).
Ruge D, Tisch S, Hariz MI, Zrinzo L, Bhatia KP, Quinn NP, Jahanshahi M, Limousin P, Rothwell JC (Deep brain stimulation effects in dystonia: time course of electrophysiological changes in early treatment. Mov Disord 26:1913-1921.2011).
202
Sabatini U, Boulanouar K, Fabre N, Martin F, Carel C, Colonnese C, Bozzao L, Berry I, Montastruc JL, Chollet F, Rascol O (Cortical motor reorganization in akinetic patients with Parkinson's disease: a functional MRI study. Brain : a journal of neurology 123 ( Pt 2):394-403.2000).
Sadnicka A, Hoffland BS, Bhatia KP, van de Warrenburg BP, Edwards MJ (The cerebellum in dystonia - help or hindrance? Clinical neurophysiology : official journal of the International Federation of Clinical Neurophysiology 123:65-70.2012).
Sadnicka A, Teo J, Kojovic M, Kassavetis P, Pareés I, Saifee TA, Swingenschuh P, Bhatia KP, Rothwell JC, Edwards MJ1(All in the blink of an eye: insights into the pathophysiology of DYT1 and DYT6 dystonia, submitted)
Sale MV, Ridding MC, Nordstrom MA (Factors influencing the magnitude and reproducibility of corticomotor excitability changes induced by paired associative stimulation. Experimental brain research Experimentelle Hirnforschung Experimentation cerebrale 181:615-626.2007).
Sale MV, Ridding MC, Nordstrom MA (Cortisol inhibits neuroplasticity induction in human motor cortex. The Journal of neuroscience : the official journal of the Society for Neuroscience 28:8285-8293.2008).
Sommer M, Ruge D, Tergau F, Beuche W, Altenmuller E, Paulus W (Intracortical excitability in the hand motor representation in hand dystonia and blepharospasm. Mov Disord 17:1017-1025.2002).
Spagnolo F, Coppi E, Chieffo R, Straffi L, Fichera M, Nuara A, Gonzalez-Rosa J, Martinelli V, Comi G, Volonte MA, Leocani L (Interhemispheric balance in Parkinson's disease: a transcranial magnetic stimulation study. Brain Stimul 6:892-897.2013).
Starr PA, Rau GM, Davis V, Marks WJ, Jr., Ostrem JL, Simmons D, Lindsey N, Turner RS (Spontaneous pallidal neuronal activity in human dystonia: comparison with Parkinson's disease and normal macaque. Journal of neurophysiology 93:3165-3176.2005).
Stefan K, Kunesch E, Benecke R, Cohen LG, Classen J (Mechanisms of enhancement of human motor cortex excitability induced by
203
interventional paired associative stimulation. The Journal of physiology 543:699-708.2002).
Stefan K, Kunesch E, Cohen LG, Benecke R, Classen J (Induction of plasticity in the human motor cortex by paired associative stimulation. Brain : a journal of neurology 123 Pt 3:572-584.2000).
Stefan K, Wycislo M, Classen J (Modulation of associative human motor cortical plasticity by attention. Journal of neurophysiology 92:66-72.2004).
Stent GS (A physiological mechanism for Hebb's postulate of learning. Proc Natl Acad Sci U S A 70:997-1001.1973).
Stinear CM, Byblow WD (Task-dependent modulation of silent period duration in focal hand dystonia. Mov Disord 20:1143-1151.2005).
Stinear JW, Hornby TG (Stimulation-induced changes in lower limb corticomotor excitability during treadmill walking in humans. J Physiol 567:701-711.2005).
Strafella AP, Valzania F, Nassetti SA, Tropeani A, Bisulli A, Santangelo M, Tassinari CA (Effects of chronic levodopa and pergolide treatment on cortical excitability in patients with Parkinson's disease: a transcranial magnetic stimulation study. Clinical neurophysiology : official journal of the International Federation of Clinical Neurophysiology 111:1198-1202.2000).
Suppa A, Marsili L, Belvisi D, Conte A, Iezzi E, Modugno N, Fabbrini G, Berardelli A (Lack of LTP-like plasticity in primary motor cortex in Parkinson's disease. Exp Neurol 227:296-301.2011).
Tamura Y, Ueki Y, Lin P, Vorbach S, Mima T, Kakigi R, Hallett M (Disordered plasticity in the primary somatosensory cortex in focal hand dystonia. Brain : a journal of neurology 132:749-755.2009).
Tang CC, Poston KL, Dhawan V, Eidelberg D (Abnormalities in metabolic network activity precede the onset of motor symptoms in Parkinson's disease. J Neurosci 30:1049-1056.2010).
204
Tang JK, Moro E, Mahant N, Hutchison WD, Lang AE, Lozano AM, Dostrovsky JO (Neuronal firing rates and patterns in the globus pallidus internus of patients with cervical dystonia differ from those with Parkinson's disease. Journal of neurophysiology 98:720-729.2007).
Teo JT, van de Warrenburg BP, Schneider SA, Rothwell JC, Bhatia KP (Neurophysiological evidence for cerebellar dysfunction in primary focal dystonia. J Neurol Neurosurg Psychiatry 80:80-83.2009).
Thickbroom GW, Byrnes ML, Stell R, Mastaglia FL (Reversible reorganisation of the motor cortical representation of the hand in cervical dystonia. Mov Disord 18:395-402.2003).
Tinazzi M, Farina S, Edwards M, Moretto G, Restivo D, Fiaschi A, Berardelli A (Task-specific impairment of motor cortical excitation and inhibition in patients with writer's cramp. Neurosci Lett 378:55-58.2005).
Tisch S, Limousin P, Rothwell JC, Asselman P, Quinn N, Jahanshahi M, Bhatia KP, Hariz M (Changes in blink reflex excitability after globus pallidus internus stimulation for dystonia. Mov Disord 21:1650-1655.2006a).
Tisch S, Limousin P, Rothwell JC, Asselman P, Zrinzo L, Jahanshahi M, Bhatia KP, Hariz MI (Changes in forearm reciprocal inhibition following pallidal stimulation for dystonia. Neurology 66:1091-1093.2006b).
Tisch S, Rothwell JC, Bhatia KP, Quinn N, Zrinzo L, Jahanshahi M, Ashkan K, Hariz M, Limousin P (Pallidal stimulation modifies after-effects of paired associative stimulation on motor cortex excitability in primary generalised dystonia. Exp Neurol 206:80-85.2007).
Tissingh G, Bergmans P, Booij J, Winogrodzka A, van Royen EA, Stoof JC, Wolters EC (Drug-naive patients with Parkinson's disease in Hoehn and Yahr stages I and II show a bilateral decrease in striatal dopamine transporters as revealed by [123I]beta-CIT SPECT. J Neurol 245:14-20.1998).
Tokimura H, Di Lazzaro V, Tokimura Y, Oliviero A, Profice P, Insola A, Mazzone P, Tonali P, Rothwell JC (Short latency inhibition of human hand motor cortex by somatosensory input from the hand. J Physiol 523 Pt 2:503-513.2000).
205
Trompetto C, Avanzino L, Marinelli L, Mori L, Pelosin E, Roccatagliata L, Abbruzzese G (Corticospinal excitability in patients with secondary dystonia due to focal lesions of the basal ganglia and thalamus. Clinical neurophysiology : official journal of the International Federation of Clinical Neurophysiology 123:808-814.2012).
Trompetto C, Curra A, Buccolieri A, Suppa A, Abbruzzese G, Berardelli A (Botulinum toxin changes intrafusal feedback in dystonia: a study with the tonic vibration reflex. Mov Disord 21:777-782.2006).
Udupa K, Chen R (Motor Cortical Plasticity in Parkinson's Disease. Frontiers in neurology 4:128.2013).
Ueki Y, Mima T, Kotb MA, Sawada H, Saiki H, Ikeda A, Begum T, Reza F, Nagamine T, Fukuyama H (Altered plasticity of the human motor cortex in Parkinson's disease. Ann Neurol 59:60-71.2006).
Valls-Sole J, Pascual-Leone A, Brasil-Neto JP, Cammarota A, McShane L, Hallett M (Abnormal facilitation of the response to transcranial magnetic stimulation in patients with Parkinson's disease. Neurology 44:735-741.1994).
van Nuenen BF, Helmich RC, Ferraye M, Thaler A, Hendler T, Orr-Urtreger A, Mirelman A, Bressman S, Marder KS, Giladi N, van de Warrenburg BP, Bloem BR, Toni I, Consortium LAJ (Cerebral pathological and compensatory mechanisms in the premotor phase of leucine-rich repeat kinase 2 parkinsonism. Brain : a journal of neurology 135:3687-3698.2012).
van Nuenen BF, van Eimeren T, van der Vegt JP, Buhmann C, Klein C, Bloem BR, Siebner HR (Mapping preclinical compensation in Parkinson's disease: an imaging genomics approach. Movement disorders : official journal of the Movement Disorder Society 24 Suppl 2:S703-710.2009).
Vidailhet M, Jutras MF, Grabli D, Roze E (Deep brain stimulation for dystonia. J Neurol Neurosurg Psychiatry.2012).
Vitek JL, Chockkan V, Zhang JY, Kaneoke Y, Evatt M, DeLong MR, Triche S, Mewes K, Hashimoto T, Bakay RA (Neuronal activity in the basal ganglia in patients with generalized dystonia and hemiballismus. Ann Neurol 46:22-35.1999).
206
Ward NS, Cohen LG (Mechanisms underlying recovery of motor function after stroke. Arch Neurol 61:1844-1848.2004).
Wassermann EM (Variation in the response to transcranial magnetic brain stimulation in the general population. Clinical neurophysiology : official journal of the International Federation of Clinical Neurophysiology 113:1165-1171.2002).
Wassermann EM, Cohen LG, Flitman SS, Chen R, Hallett M (Seizures in healthy people with repeated "safe" trains of transcranial magnetic stimuli. Lancet 347:825-826.1996).
Weise D, Schramm A, Stefan K, Wolters A, Reiners K, Naumann M, Classen J (The two sides of associative plasticity in writer's cramp. Brain : a journal of neurology 129:2709-2721.2006).
Werhahn KJ, Kunesch E, Noachtar S, Benecke R, Classen J (Differential effects on motorcortical inhibition induced by blockade of GABA uptake in humans. J Physiol 517 ( Pt 2):591-597.1999).
Werring DJ, Clark CA, Barker GJ, Miller DH, Parker GJ, Brammer MJ, Bullmore ET, Giampietro VP, Thompson AJ (The structural and functional mechanisms of motor recovery: complementary use of diffusion tensor and functional magnetic resonance imaging in a traumatic injury of the internal capsule. J Neurol Neurosurg Psychiatry 65:863-869.1998).
Wolters A, Sandbrink F, Schlottmann A, Kunesch E, Stefan K, Cohen LG, Benecke R, Classen J (A temporally asymmetric Hebbian rule governing plasticity in the human motor cortex. Journal of neurophysiology 89:2339-2345.2003).
Wu T, Hallett M (The cerebellum in Parkinson's disease. Brain : a journal of neurology 136:696-709.2013).
Zamir O, Gunraj C, Ni Z, Mazzella F, Chen R (Effects of theta burst stimulation on motor cortex excitability in Parkinson's disease. Clinical neurophysiology : official journal of the International Federation of Clinical Neurophysiology 123:815-821.2012).
Zhuang P, Li Y, Hallett M (Neuronal activity in the basal ganglia and thalamus in patients with dystonia. Clinical neurophysiology : official journal of the
207
International Federation of Clinical Neurophysiology 115:2542-2557.2004).
Ziemann U (TMS and drugs. Clinical neurophysiology : official journal of the International Federation of Clinical Neurophysiology 115:1717-1729.2004).
Ziemann U, Corwell B, Cohen LG (Modulation of plasticity in human motor cortex after forearm ischemic nerve block. J Neurosci 18:1115-1123.1998a).
Ziemann U, Hallett M, Cohen LG (Mechanisms of deafferentation-induced plasticity in human motor cortex. J Neurosci 18:7000-7007.1998b).
Ziemann U, Ilic TV, Pauli C, Meintzschel F, Ruge D (Learning modifies subsequent induction of long-term potentiation-like and long-term depression-like plasticity in human motor cortex. J Neurosci 24:1666-1672.2004).
Ziemann U, Lonnecker S, Steinhoff BJ, Paulus W (The effect of lorazepam on the motor cortical excitability in man. Experimental brain research Experimentelle Hirnforschung Experimentation cerebrale 109:127-135.1996).
Ziemann U, Paulus W, Nitsche MA, Pascual-Leone A, Byblow WD, Berardelli A, Siebner HR, Classen J, Cohen LG, Rothwell JC (Consensus: Motor cortex plasticity protocols. Brain Stimul 1:164-182.2008).
Ziemann U, Paulus W, Rothenberger A (Decreased motor inhibition in Tourette's disorder: evidence from transcranial magnetic stimulation. Am J Psychiatry 154:1277-1284.1997).
Ziemann U, Tergau F, Wischer S, Hildebrandt J, Paulus W (Pharmacological control of facilitatory I-wave interaction in the human motor cortex. A paired transcranial magnetic stimulation study. Electroencephalogr Clin Neurophysiol 109:321-330.1998c).
Zigmond MJ (Do compensatory processes underlie the preclinical phase of neurodegenerative disease? Insights from an animal model of parkinsonism. Neurobiol Dis 4:247-253.1997).

208
Zigmond MJ, Abercrombie ED, Berger TW, Grace AA, Stricker EM (Compensations after lesions of central dopaminergic neurons: some clinical and basic implications. Trends Neurosci 13:290-296.1990).
Zigmond MJ, Berger TW, Grace AA, Stricker EM (Compensatory responses to nigrostriatal bundle injury. Studies with 6-hydroxydopamine in an animal model of parkinsonism. Molecular and chemical neuropathology / sponsored by the International Society for Neurochemistry and the World Federation of Neurology and research groups on neurochemistry and cerebrospinal fluid 10:185-200.1989).

209