Embed Size (px)
Citation preview

The Role of Prolactin in Pregnancy-Induced
Changes in Food Intake
Natasha Danielle Stenhouse
A thesis submitted in partial fulfilment of the requirements for the degree of
Bachelor of Biomedical Science with Honours
at the University of Otago, Dunedin,
New Zealand.
2012

ii
Abstract
Pregnancy is associated with a significant increase in food intake. This
occurs in order to supply the mother with sufficient energy to support both
herself and the developing fetus throughout pregnancy and lactation when
metabolic demand is high. This increase in food intake occurs despite an
elevation in circulating levels of the appetite-suppressing hormone leptin.
Hence, pregnancy is considered a state of leptin resistance. The hormone
prolactin, the levels of which are significantly increased during pregnancy,
is thought to be involved in increasing food intake during pregnancy.
Exogenous administration of prolactin in rodents is associated with
increased food intake and reduced response to leptin. As such, it is possible
that the pregnancy-induced increases in prolactin may have the same effect.
We hypothesised that prolactin acts centrally to mediate the changes in food
intake that occur during pregnancy. Thus, the aim of this experiment was to
measure food intake during pregnancy in mice that specifically lack
prolactin receptors in the brain.
To characterise food intake in these mice, food intake and bodyweight
were measured daily in non-pregnant, pregnant and lactating neuron-
specific prolactin receptor knockout mice and controls. This neuron-specific
prolactin receptor knockout model has lost prolactin receptors throughout

iii
the brain and thus exhibits impaired central prolactin response.
Immunohistochemistry for phosphorylated signal transducer and activator
of transcription 5 (pSTAT5), a marker of prolactin receptor activation, was
performed in order to assess the success of the knockout animal. Finally,
because there appeared to be a difference in bodyweight in the non-pregnant
knockout animals, non-pregnant mice were subjected to a fast and refeed
protocol and then placed on a high fat diet in order to further characterise
their food intake regulatory systems.
Food intake increased significantly over pregnancy and was higher still
during lactation in both animal groups. Bodyweight also increased over
pregnancy, then remained stable during the lactation period. Food intake
was significantly higher throughout pregnancy in the knockout animals
compared with the controls. Unexpectedly, food intake and bodyweight
were significantly higher in the non-pregnant knockout animals compared
with the controls suggesting a basal difference in bodyweight regulation.
Immunohistochemistry for pSTAT5 demonstrated significant, but not
complete loss, of the prolactin receptor throughout the brain, specifically in
the arcuate nucleus and medial preoptic area. There was no significant
difference between the animal groups in the fast and refeed protocol. The
high fat diet data demonstrated that the knockout animals on a high fat diet
gained significantly more weight than the control animals on a control diet.

iv
The results obtained did not support our hypothesis that prolactin action
in the brain critically mediates changes in food intake during pregnancy.
However, interpretation of these results was complicated by the non-
pregnant animal results and the incomplete nature of the knockout. It
remains possible the remaining prolactin-responsive neurons in the brain
may mediate prolactin action to stimulate food intake. This latter
interpretation is supported by the changes in bodyweight in the non-
pregnant knockout animals. Despite the failure to support or disprove our
hypothesis, a significant step towards characterisation of this knockout
model was made.

v
Acknowledgements
I can't believe it's almost over. This has been such a big year and there
are so many people who have been so important in making sure this was a
success that I really wouldn't be able to name all of them by name.
First off, I would like to thank my supervisors Sharon and Dave for
everything, I really can't fit it all in here. Thank you Dave, for your
unending wisdom and guidance throughout the year. You were always
available even when in a different hemisphere! And Sharon for the patience
and support you've shown throughout this whole process. And for always
having the answer.
To the rest of the Grattan Lab, for answering endless questions about any
number of things throughout the year and for patiently listening to all my
presentations! Special thanks to Ilona. You always had time for me no
matter how busy you were. Whether I had questions, concerns, proof
reading that I needed help with, it didn't matter you were always available.
To the rest of the CNE and the department of Anatomy for supporting
my project and providing constant entertainment during the long hours
spent in the lab.

vi
I would like to thank my amazing family for tolerating me throughout
this process. I'm sure it has been as trying for you all as it has for me. All
my friends, Papi for all the help formatting and proofreading and Jessie, for
always being there and making sure I stayed semi-sane and stopped me
rewriting my whole thesis! I'd like to thank my Dad for his proofreading
skills, , Matt who has provided endless support and pretended to know what
I was talking about when even I didn't and Allegra for being the greatest. I
couldn't have done it without all you guys!
Natasha

vii
Contents
Abstract ii
Acknowledgements v
Contents vii
List of Figures xi
List of Abbreviations 1
1.0 Introduction 3 1.1: Overview ........................................................................................... 3
1.2 Food intake regulation in the non-pregnant individual ...................... 3
1.3 Energy Homeostasis During Pregnancy ............................................. 5
1.4 Prolactin .............................................................................................. 6
1.5 The role of prolactin in leptin resistance ............................................ 9
2.0 Methods 12 2.1 Overview .......................................................................................... 12
2.2 Generation of Conditional Knockout Mice ...................................... 12
2.3 Animals ............................................................................................. 13
2.4: Experiment 1: Food intake, body weight and litter growth
during different reproductive states ............................................. 14
2.4.1 Estrous Cycle Assessment ................................................... 14
2.5: Experiment 2: Confirmation of prolactin receptor deletion in
the brain ........................................................................................ 15

viii
2.5.1 Immunohistochemistry for pSTAT5 ................................... 17
2.5.2 Immunohistochemistry for GFP .......................................... 19
2.5.3 Immunohistochemical Analysis .......................................... 20
2.6 Experiment 3: Postfasting feeding behaviours and response to
a high fat diet ................................................................................ 20
2.6.1 Fast and Refeed Study ......................................................... 21
2.6.2 High Fat Diet Study ............................................................ 21
2.7 Statistical Analysis ........................................................................... 22
3.0 Results 23 3.1 Experiment 1 .................................................................................... 23
3.1.1 Neuron-specific prolactin receptor knockout mice
have abnormal estrus cycles ........................................... 23
3.1.2 Food intake and bodyweight during different
reproductive states .......................................................... 26
3.1.3 Litter Weight Gain During Lactation .................................. 27
3.2 Experiment 2 .................................................................................... 31
3.2.1 pSTAT5 Immunohistochemistry ......................................... 31
3.2.2 GFP Immunohistochemistry ............................................... 31
3.3 Experiment 3 .................................................................................... 39
3.3.1 Fast and Refeed: .................................................................. 39
3.3.2 Response to a High Fat Diet ................................................ 39
4.0 Discussion 42

ix
4.1 Overview .......................................................................................... 42
4.2 Success of the Knockout and Immunohistochemistry for
pSTAT5: ....................................................................................... 43
4.3 Knockout mice have abnormal estrous cyclicity .............................. 46
4.4 Food Intake and Bodyweight During Different Reproductive
States ............................................................................................ 49
4.5 Litter Characteristics ........................................................................ 54
4.6 Response to a Fast and Refeed protocol and a High Fat Diet
study ............................................................................................. 56
4.7 Limitations ........................................................................................ 57
4.8 Conclusions ...................................................................................... 59
5.0 References 60
Appendices 69 Appendix A: Fixatives ............................................................................ 69
0.2 M Phosphate Buffer (1 litre) ..................................... 69
4% (w/v) Paraformaldehyde in 0.1 M PB .................................... 69
30% Sucrose Solution .................................................................. 70
Appendix B: Solutions Used For Immunhistochemistry ........................ 71
Cryoprotectant (1 litre) ............................................... 71
10x Tris-buffered saline (TBS) stock solution (2 litres) ......... 71
1x TBS Working Solution (1 litre) ...................... 71
TBS+0.3% Triton X (100 ml) ......................................... 72

x
Blocking solution (100 ml) ............................................ 72
Hydrogen peroxide solution (50 ml) ................................. 72
Avidin-Biotin complex solution (25 ml) ............................. 72

xi
List of Figures
Figure 1.1 Diagrammatic representation of prolactin receptor
signalling via the JAK/STAT pathway ................................ 7
Figure 3.1 Estrus cyclicity ................................................................... 25
Figure 3.2 Food intake during different reproductive states ............... 28
Figure 3.3 Bodyweight during different reproductive states ............... 29
Figure 3.4 Litter growth during lactation ............................................ 30
Figure 3.5 Prolactin-induced pSTAT5 in the medial preoptic
area ..................................................................................... 34
Figure 3.6 Prolactin-induced pSTAT5 in the paraventricular
nucleus of the hypothalamus ............................................. 35
Figure 3.7 Prolactin-induced pSTAT5 in the arcuate nucleus of
the hypothalamus ............................................................... 36
Figure 3.8 Prolactin-induced pSTAT5 in the ventromedial
nucleus of the hypothalamus ............................................. 37
Figure 3.9 Green fluorescent protein in the paraventricular
nucleus of the hypothalamus ............................................. 38
Figure 3.10 Animal response to a fast and refeed protocol ................... 40
Figure 3.11 Animal response to a high fat diet ..................................... 41

xii
Figure 4.1 Diagrammatic representation of short loop negative
feedback of prolactin secretion in the arcuate
nucleus ............................................................................... 48

1
List of Abbreviations
ABC avidin-biotin-complex
AGRP agouti-related peptide
ARC arcuate nucleus of the hypothalamus
DAB diaminobenzidine
DPX 1,3-diethyl-8-phenylxanthine
GFP green-fluorescent protein
HFD high fat diet
i.p. intraperitoneal
JAK janus kinase
kg kilogram
M molar
ME median eminence
mg milligram
ml millilitre
mm millimetre
MPOA medial preoptic area
mRNA messenger ribonucleic acid
NPY neuropeptide Y
OC optic chiasm
POMC pro-opiomelanocortin
2
PVN paraventricular nucleus of the hypothalamus
STAT3 signal transducer and activator of transcription 3
STAT5 signal transducer and activator of transcription 5
pSTAT5 phosphorylated signal transducer and activator of
transcription 5
TBS tris-buffered saline
TIDA tuberoinfudibular dopaminergic
VMH ventromedial nucleus of the hypothalamus
3V third ventricle
ɑ-MSH ɑ-melanocyte stimulating hormone
µl microlitre
µm micrometre

3
1.0 Introduction
1.1: Overview
The expression “eating for two” is often used to justify the significant
increase in food intake associated with pregnancy. Pregnant females must
not only ensure their own energy needs are met, they must also supply
nutrients to the growing fetus and produce energy stores that can be used
during the metabolically-demanding period of lactation. However, this
change in food intake begins long before it is required by any significant
alteration in metabolic activity. Thus, early pregnancy is characterised by a
period of positive energy balance. The increase in food intake during
pregnancy occurs despite an increase in levels of the appetite suppressing
hormone leptin. This suggests that the body must somehow override the
normal food intake regulatory mechanisms in order to facilitate the state of
pregnancy-induced hyperphagia (1).
1.2 Food intake regulation in the non-pregnant individual
In the non-pregnant individual, energy balance is tightly regulated
through the actions of various homeostatic mechanisms. Long-term energy

4
regulation is achieved through the activity of hormones such as leptin and
insulin. Mice unable to produce leptin (ob/ob mice) and those lacking a
functional leptin receptor (db/db) have considerably increased food intake
and are grossly obese (2-4). These animals demonstrate the critical role
leptin plays in food intake regulation.
Leptin, which is produced in the periphery, acts centrally to reduce food
intake. It is secreted predominantly by adipocytes in proportion to the fat
mass of an individual, with the stomach and the placenta producing lesser
amounts (5, 6). Leptin's food intake regulatory actions are mediated through
a number of different pathways. In the arcuate nucleus (ARC) of the
hypothalamus, a key site of food intake regulation, leptin acts directly upon
pro-opiomelanocortin neurons (POMC) and neuropeptide-Y (NPY)/agouti-
related peptide (AGRP) expressing neurons (7). These anatomically distinct
neuronal populations have opposing effects. POMC neuron activation
causes release of the anorectic peptide ɑ-melanocyte-stimulating hormone
(ɑ-MSH) whilst activation of NPY/AGRP expressing neurons increases the
release of these two orexigenic neuropeptides. Leptin stimulates POMC
neuron activation and thus increases ɑ-MSH levels while simultaneously
inhibiting NPY/AGRP neurons (8). This causes an overall increase in
anorectic and decrease in orexigenic signals respectively, with a consequent
decrease in food intake.

5
In addition to leptin, there are other factors involved in the regulation of
food intake. Both the stomach and the gut release hormones on a daily basis
which act, in the short term, to either stimulate or suppress appetite (9).
These include hormones such as cholecystokinin, an anorectic peptide that
is released from the gut (9) and ghrelin, a centrally-acting orexigenic
peptide that is released from the stomach (10). These signals combine to
form an integrated system which ensures energy balance is appropriately
regulated in the non-pregnant individual.
1.3 Energy Homeostasis During Pregnancy
A pregnancy-associated increase in food intake has been well established
in both rats and mice (11-15). A number of alterations in the homeostatic
mechanisms responsible for regulating energy balance facilitate the
development of this pregnancy-induced hyperphagia (16). Pregnancy is
associated with a paradoxical increase in leptin levels (11, 17, 18). In a non-
pregnant individual, this state of hyperleptinemia would cause a reduction
in food intake. However, pregnancy is thought to induce a state of central
leptin resistance, which means that these leptin-induced appetite-
suppressive effects are lost. This pregnancy-induced leptin resistance is
associated with a decrease in the leptin-induced activation of signal
transducer and activator of transcription 3 (STAT3) and downregulation of

6
leptin receptor mRNA in the hypothalamus (11, 19). This decrease in leptin
responsiveness means that hyperphagia can be maintained throughout
pregnancy and excess energy consumed stored as fat deposits. The
mechanism by which pregnancy-induced leptin resistance develops is not
clear, but it is thought to be caused by changes in hormone levels during
pregnancy.
1.4 Prolactin
During pregnancy, there is an increase in prolactin receptor activity due
to increasing levels of prolactin and its placental homologues, placental
lactogens (20). Prolactin plays a wide range of roles in the body, including
development and maintenance of the mammary glands (21), stimulation of
neurogenesis (22) and maternal behavioural adaptations (23). It has also
been implicated in this state of pregnancy-induced central leptin resistance.
The hormone prolactin is also thought to play a role in the regulation of
energy balance. Prolactin receptors have been identified in a number of
tissue types such as adipose and liver tissue (24), and in areas of the brain
involved in maintaining energy homeostasis including the ARC,
paraventricular nucleus of the hypothalamus (PVN) and ventromedial
nucleus of the hypothalamus (VMH) (25). Prolactin exerts its effects

7
through signalling via the JAK/STAT pathway (see figure 1.1) (26). When
prolactin binds to its receptor, receptor-associated JAK proteins are
activated. These JAK proteins phosphorylate signal transducer and activator
of transcription 5 (STAT5) molecules. These phosphorylated STAT5
(pSTAT5) molecules dimerise, then translocate to the nucleus where they
regulate gene transcription.
Figure 1.1: Prolactin signalling via the JAK/STAT pathway. Adapted
from Grattan, 2002, Reproduction (27)
8
Numerous studies have supported a role for prolactin in increasing food
intake in both birds (28-30) and mammals (31, 32). Noel and Woodside (32)
demonstrated that in female rats, prolactin administered peripherally and
centrally increased food intake independent of the dose. Further research
confirmed the results of the above study but whether the observed effect
was dose dependent is inconclusive (33, 34). It seems that the appearance of
these prolactin-induced hyperphagic effects depends on the length of
treatment time. Prolactin treatment for seven days or less has been shown to
be ineffective. In order for a significant hyperphagic effect to be displayed,
a treatment period of nine (35) or more (31, 36) days is required.
Furthermore, constantly elevated prolactin levels are more effective at
inducing hyperphagia than phasic prolactin administration (34). The route
of prolactin administration must also be considered, as it may influence the
mechanism by which this hyperphagia occurs. Indeed, research has shown
that prolactin administered peripherally can induce acyclicity in female rats
(37). Acyclicity is also associated with increased food intake.
Initially, it was proposed that the hyperphagic effects of prolactin were
possibly mediated through activation of receptors for an alternative peptide.
However, injection of an anti-prolactin receptor antibody antagonised this
prolactin-induced increase in food intake suggesting that this effect was a
direct consequence of prolactin receptor activation (30). While it is
9
hypothesised that prolactin promotes hyperphagia through altering the leptin
response in both pregnant and non-pregnant animals, the exact role
prolactin plays in this process has not yet been determined.
1.5 The role of prolactin in leptin resistance
Attenuation of the leptin response after simultaneous treatment with both
prolactin and leptin in non-pregnant rats has further supported the role of
prolactin in the induction of leptin resistance. Central leptin injections (4
µg) were sufficient to considerably reduce food intake in saline-infused rats.
In contrast, this treatment did not reduce food intake in rats subjected to
chronic infusions of prolactin (5µg/h) for 10 days. There was also a
significant decrease in pSTAT3 expression (a marker of leptin response) in
the prolactin treated rats compared with control (34). The appetite
suppressive effects of leptin were also lost in pseudopregnant rats treated
with chronic prolactin infusion further supporting this idea of prolactin-
induced central leptin resistance (38).
It has been proposed that prolactin may impair the leptin response by
inducing downregulation of leptin receptors in the brain. Decreased leptin
receptor mRNA expression was seen in leptin resistant male rats following
prolonged leptin infusion (39). Additionally, Ladyman and Grattan

10
demonstrated that leptin mRNA expression in the VMH is significantly
lower during pregnancy but whether this is a direct result of prolactin
signalling is yet to be determined (19). It is also a possibility that prolactin
may directly interfere with leptin signalling. Prolactin acts to increase
expression of suppressor of cytokine signalling 3 molecule (SOCS3) (40,
41). SOCS3 expression causes subsequent downregulation of STAT
signalling and consequently, impairs leptin signalling which is dependent on
STAT3 activation (42). However, both of these theories require neurons that
are dually responsive to prolactin and leptin. Prolactin receptors have been
identified in a number of neurons in the VMH and paraventricular nucleus
(PVN) but colocalisation of leptin receptors on these neurons has not yet
been demonstrated.
There is significant evidence suggesting that prolactin can induce
changes in food intake. As such, we hypothesised that prolactin is critically
involved in causing leptin resistance and therefore increasing food intake
during pregnancy. Assessing food intake in pregnant, prolactin-receptor
knockout animals would help clarify the role of prolactin in these changes
but global loss of the prolactin-receptor causes infertility. Recent advances
in transgenic techniques have facilitated the development of a novel,
neuron-specific prolactin receptor knockout mouse. The aim of this project
was to measure food intake during pregnancy in both neuron-specific

11
prolactin receptor knockout and control mice. If prolactin plays an
important role in pregnancy-related central leptin resistance, then the
hyperphagic state that would normally occur during pregnancy would not be
observed.

12
2.0 Methods
2.1 Overview
This thesis was comprised of three experimental components. The aim of
the first component was to assess daily food intake, body weight and litter
weight (where applicable) in non-pregnant, pregnant and lactating neuron-
specific prolactin receptor knockout animals and controls. The second
experiment was to confirm loss of the prolactin receptor in the brain of
these mice to validate the experimental model. This was achieved through
immunohistochemistry for pSTAT5 as a marker of functional prolactin
response. Based on initial observations in experiment 1 that suggested
appetite might be different in the knockout mice, a third experiment was
added to the project. The third experiment was to examine the post-fasting
feeding behaviours of animals and changes in body weight when fed a high
fat diet in non-pregnant neuron-specific prolactin receptor knockout animals
and controls.
2.2 Generation of Conditional Knockout Mice
Animals used in the experiments were CamK-II-Cre;Prlrflox/flox adult
female mice. These animals were generated using two different transgenic

13
strains. A female prolactin receptor floxed mouse (Prlrflox/flox), in which the
critical coding region for the prolactin receptor gene was flanked by loxP
sites, was mated with a CamKII-Cre expressing male animal, which
expresses cre-recombinase neuron-specifically (43).A second round of
mating between the heterozygous CamKII-Cre;Prlrflox/wt and Prlrflox/flox
generated animals which were homozygous for the floxed gene and either
cre-positive or cre-negative. These cre-positive mice would undergo cre-
mediated recombination of the coding sequence between the loxP sites and
thus functional loss of the prolactin receptor in cells expressing the CamKII
promoter. Control mice were homozygotic for the floxed gene but did not
express cre. The floxed prolactin receptor construct was such that when
recombined by cre, it would activate green fluorescent protein (GFP), as an
indicator of successful recombination.
2.3 Animals
Animals were individually housed in controlled temperature (22 ± 1°C)
and lighting (12L:12D cycles, with lights-on at 0600 h). All animals were
allowed free access to food (unless otherwise stated) and water. All animal
manipulations and protocols required for this thesis were approved by the
University of Otago Committee on Ethics in the Care and Use of Laboratory
Animals (Ethics Number 106/10).

14
2.4: Experiment 1: Food intake, body weight and litter growth
during different reproductive states
The food intake and body weight of female, virgin mice were monitored
daily using a FX300i Wp scale (range 0-320g, accuracy 0.001g, M&D
Company Ltd). Estrous cyclicity was also monitored using daily vaginal
smearing. After 14 days, females were paired with male mice in order to
achieve pregnancy and were checked daily for the presence of a vaginal
plug. Appearance of a vaginal plug was used to indicate pregnancy day 1.
Food intake and body weight were measured throughout gestation until
parturition on day 19. Litters were normalised to five pups and
measurements including bodyweight, food intake and pup weight
recommenced six days post-delivery in order to monitor growth and food
intake during lactation without interfering with establishment of maternal
behaviour. Measurements were taken until weaning at 21 days postpartum.
2.4.1 Estrous Cycle Assessment
The estrous cycle was assessed through daily vaginal smearing between
0900 and 1000 hours. This involved insertion of a small wire loop into the
vaginal opening of a mouse which was gently rotated to collect cells from
the vaginal epithelium. Any displaced cells collected on the loop were then

15
transferred to a glass slide. The slide was then stained with 3 drops of
0.05% Toluidine blue and left for 1 minute. The cells were then examined
under a light microscope at low magnification. The stage of the estrous
cycle was based on epithelial cell morphology and distribution using the
following guidelines:
Proestrus: Predominantly round, nucleated epithelial cells arranged
in clusters.
Estrus: Large numbers of enucleated, cornified epithelial cells.
Metestrus: Cornified epithelial cells and large numbers of small,
granular leukocytes.
Diestrus: Small number of epithelial cells and/or leukocytes.
2.5: Experiment 2: Confirmation of prolactin receptor deletion
in the brain
At the conclusion of experiment 1, all pups were culled and the female
mice left for 1-3 weeks before the brains were collected for
immunohistochemistry for prolactin-induced pSTAT5 as a marker of
functional prolactin response in the brain. These animals were subjected to a

16
series of subcutaneous bromocriptine (5 mg/ml, 200 µl volume) injections
twenty four hours, twelve hours and two hours prior to perfusion in order to
suppress endogenous prolactin. Forty minutes before perfusion, animals
were administered prolactin (5mg/kg) via intraperitoneal (i.p) injection.
Mice were then anesthetised using a single i.p. injection of sodium
pentobarbitone (15 mg/ml, 150 µl volume). Once loss of the pedal
withdrawal reflex indicated that the animal was deeply anesthetized, a small
incision was made in the abdomen just below the final rib exposing the
diaphragm. The diaphragm was then pierced using surgical scissors and the
rib cage removed allowing access to the heart. A 22 gauge needle was then
inserted into the left ventricle of the heart and 20 mls of 4%
paraformaldehyde (Appendix A) injected over two minutes. Rigidity of the
body was used to indicate successful perfusion. Brains were collected and
post-fixed for 1 hour in the same fixative then placed in 30% sucrose
(Appendix A) in phosphate buffered saline (Appendix A) at 4oC until they
sank. They were then flash frozen using powdered dry ice and stored at -
80oC until tissue processing.
The brain stem and cerebellum were removed from the posterior aspect
of the mouse brain with a single cut through the level of the pons and the
brain was mounted cut surface down in TissueTek® (O.C.T.
Compound;Sakura Finetek USA Inc., CA, USA) onto a cryostat chuck.

17
Thirty µm thick coronal sections were sliced at -21°C in three series, each
containing sections 90 µm apart. Slices were collected from the beginning
of the medial preoptic area (MPOA) (0.26 mm relative to Bregma) to the
end of the VMH (approximately -2.06 mm relative to Bregma) and placed
in a 24 well multiplate (44). Sections were placed in cryoprotectant
(Appendix B) and refrigerated at -20°C until further processing.
2.5.1 Immunohistochemistry for pSTAT5
Immunohistochemistry allows for visualisation of a protein of interest
through utilising the binding properties of an antibody conjugated to a
visual marker to a specific antigen. A tissue specimen is exposed to primary
antibody specific for the desired protein. A biotinylated secondary antibody
is then added which binds to the primary antibody amplifying the signal and
this complex is then visualised with a streptavidin complex bound to
horseradish peroxidase, using diaminobenzidine (DAB) as the colour
reagent. Appendix B describes the details of all buffer and solution
protocols used in the immunohistochemical process.
One series of sections was processed for immunohistochemistry for
pSTAT5. All steps were carried out on an orbital shaker unless otherwise
stated. Sections were washed in 1x tris-buffered saline (TBS; Appendix B)

18
6 times for 10 minutes each, to remove any remaining cryoprotectant. Any
further wash steps involved 3 times 10 minute TBS washes. Antigen
retrieval was then achieved through transferring sections into just boiled
0.01 M Tris (pH 10) for 5 minutes. Sections were then cooled for 10
minutes on the bench and placed in blocking solution (see Appendix B) for
10 minutes and then washed. The sections were then incubated for 36 hours
at 4oC in 1 ml of blocking solution (Appendix B) containing the primary
antibody (rabbit anti-pSTAT5, tyr 649, Cell Signalling Technology) at a
1:1000 dilution and 2% normal goat serum. Following this, sections were
washed and then incubated at room temperature for 90 minutes in
biotinylated goat anti-rabbit antibody (1:300 dilution, BA-1000, Vector
Laboratories, Inc., CA, USA). This solution was washed off and sections
incubated in Vectastain Elite avidin-biotin complex (ABC) solution (Vector
Laboratories, Inc., CA, USA; Appendix B). After 60 minutes the sections
were washed again and then reacted with nickel-enhanced DAB (Vector
Laboratories, Inc., CA, USA). The DAB reaction progress was monitored
under a light microscope to ensure sufficient visualisation of the desired
proteins. A final wash was performed. The sections were then float-
mounted onto ATS-coated slides in TBS+0.3% TritonX and left to dry
overnight. Slides were dehydrated using graded alcohol (3 minutes per step)
and then two 3-minute xylene incubations. Finally, a few drops of 1,3-

19
diethyl-8-phenylxanthine (DPX; Merck (N.Z.) Ltd, N.Z.) were added and
the slide coverslipped and left to dry.
2.5.2 Immunohistochemistry for GFP
A second series of sections was processed for immunohistochemistry for
green fluorescent protein. All steps took place on an orbital shaker at room
temperature except where stated. Sections were washed in TBS six times for
10 minutes each to remove any residual cryoprotectant. All subsequent
wash steps involve 3 washes in TBS for ten minutes each. Tissue was
incubated, without shaking, in 0.3% H2O2 for 10 minutes and washed.
Sections were placed in blocking solution (Appendix B) for 1 hour then
directly transferred into 2 ml of primary antibody (1:20,000 dilution, anti-
GFP rabbit polyclonal [A6455], Invitrogen) diluted in blocking buffer for
72 hours at 4oC then washed. Following this, sections were transferred into
secondary antibody (1:200 dilution, biotinylated goat anti-rabbit, Vector
BA-1000) in TBS+0.3% TritonX for 1 hour and washed. While the sections
were incubating, the ABC (Vector Laboratories, Inc., CA, USA; Appendix
B) solution was made and left at room temperature for 30 minutes. Sections
were then transferred to the ABC solution for 60 minutes then washed.
Tissue was reacted with DAB complex and the reaction monitored under a
light microscope. Following this, the sections were placed in a final wash.

20
Sections were then float-mounted, dehydrated and coverslipped using the
procedure detailed above.
2.5.3 Immunohistochemical Analysis
All immunohistochemical analysis was purely qualitative with no formal
quantitative analysis performed. Each section was photographed using an
Olympus AX70 research microscope (10x objective) with a digital camera
attached. For the pSTAT5 immunohistochemical staining, four different
brain regions were assessed: the MPOA, PVN, ARC and VMH. Each region
was defined using the mouse brain atlas (44). Each of these regions in a
knockout animal was compared to a similar area in a control animal to
examine the differential pSTAT5 expression. A similar procedure was used
to assess GFP staining however only the PVN was assessed in these slides
due to difficulties with tissue sections.
2.6 Experiment 3: Postfasting feeding behaviours and response
to a high fat diet
The original goal of our experiments was to describe food intake and
bodyweight changes in neuron-specific prolactin receptor knockout animals
and controls. However, based on initial observations from experiment 1 that

21
the non-pregnant knockout animals displayed higher bodyweight and food
intake compared with control, a third experiment was added. In order to
gain further insight into the possible mechanisms behind these increases in
bodyweight and food intake in our non-pregnant knockout animals a fast
and refeed study and a high fat diet study were performed (45).
2.6.1 Fast and Refeed Study
Fourteen female mice (6 controls and 8 knockouts) were fasted for 24
hours. Food was returned and food intake and body weight measurements
taken daily for seven days post-fast.
2.6.2 High Fat Diet Study
Mice included in the fast and refeed study and an additional 8 mice were
placed on either a high fat (45% kilojoules from fat, D12451, Research
Diets, NJ, USA) diet (HFD) (control n=5, knockout n=7) or a control diet
(10% kilojoules from fat, D1245B, Research Diets, NJ, USA) (control n=5,
knockout n=5). Food intake and body weight were measured daily for five
days. After this initial period the measurements were taken every three days
for a further three weeks.

22
2.7 Statistical Analysis
Daily food intake and bodyweight in non-pregnant animals and
cumulative litter weight gain from day 7 to day 19 was assessed using a
paired, Students t-test. Data collected for daily food intake and bodyweight
during pregnancy and lactation and litter weight over lactation were
analysed using repeated measures ANOVA to assess the effect of
interaction, time and animal group. Bonferroni post-hoc tests were used
where necessary. One way ANOVA with a Dunnet post-hoc test was then
performed on daily food intake and bodyweight data during pregnancy and
lactation for each animal group to determine the point in time at which these
parameters changed. Grubbs outliers test was used to assess whether there
were any significantly outlying data points in cumulative litter weight gain
from day 7 to day 19 data. Food intake post high fat diet administration was
analysed using a two-way ANOVA. Bonferroni post-hoc tests were
performed where appropriate. In all instances, results were deemed
statistically significant at P value <0.05.

23
3.0 Results
3.1 Experiment 1
3.1.1 Neuron-specific prolactin receptor knockout mice have abnormal
estrus cycles
Time spent in each stage of the estrous cycle was different between the
two knockout and control animals (figure 3.1A). Both groups spent 8% of
time in proestrus. However, time spent in estrus and in metestrus and
diestrus differed. The control animals spent considerably more time in
estrus (34.0%) compared with the knockout animals (11%). By contrast, the
knockout animals spent the majority of their time in met/diestrus (81.4%)
while the control animals spent 57.0% of time met/diestrus. This abnormal
estrous cyclicity was indicative of a pseudopregnancy state.
There was considerable disparity between the knockout and control
groups in the number of animals that were housed with a male mouse and
achieved pregnancy (figure 3.1B). In the wildtype group, 72.7% (16 of 22)
of animals that were mated became pregnant. This percentage decreased in
the knockout animals with only 42.8% (12 of 28) of the animals house with
a male achieving pregnancy. It also took significantly longer for knockout

24
animals to get pregnant (19 days) compared with the controls (12 days)
(figure 3.1C).

25
Figure 3.1: A: Columns represent percentage of time spent in each stage of the estrus cycle over a 14 day period (n=9 per group). B: Columns represent percentage of animals that were housed with a breeder male that achieved pregnancy (n control= 22, n knockout= 28). C: Columns represent mean±SEM number of days from placing a female with a breeder male to pregnancy (n control= 22, n knockout= 28). * p<0.05. Animals that did not get pregnant after 4 weeks were allocated a value of 28. Individual points represent individual animal values.
A
B
Proestrus Estrus Metestrus/Diestrus0
20
40
60
80
100
ControlKnockout
Stage of Estrous Cycle
% o
f Tim
e
C
Control Knockout0
10
20
30 *
Num
ber
of d
ays
to p
regn
ancy
Control Knockout0
20
40
60
80
% a
nim
als
hous
ed w
ith a
mal
e th
atac
hiev
ed p
regn
ancy

26
3.1.2 Food intake and bodyweight during different reproductive states
Mean food intake over the fourteen day period in non-pregnant control
animals was 3.7±0.05 g. Unexpectedly, food intake was significantly higher
in our knockout animals with mean food intake in this group 4.0±0.04 g
(figure 3.2A). During pregnancy, food intake increased significantly over
the course of pregnancy with food intake significantly higher by day 10 in
the control and day 15 in the knockout animals. Furthermore there was a
significant effect of genotype between the two animal groups with the
knockouts eating significantly more overall during pregnancy than the
controls (figure 3.2B).
There was no overall difference in food intake during lactation between
the knockout and control groups (figure 3.2C). However, food intake did
change over time, with food intake in the control animals starting to
increase significantly compared to day 6 of lactation by day 12. In contrast,
food intake was not significantly different from day 6 at any point during
lactation in the knockout group.
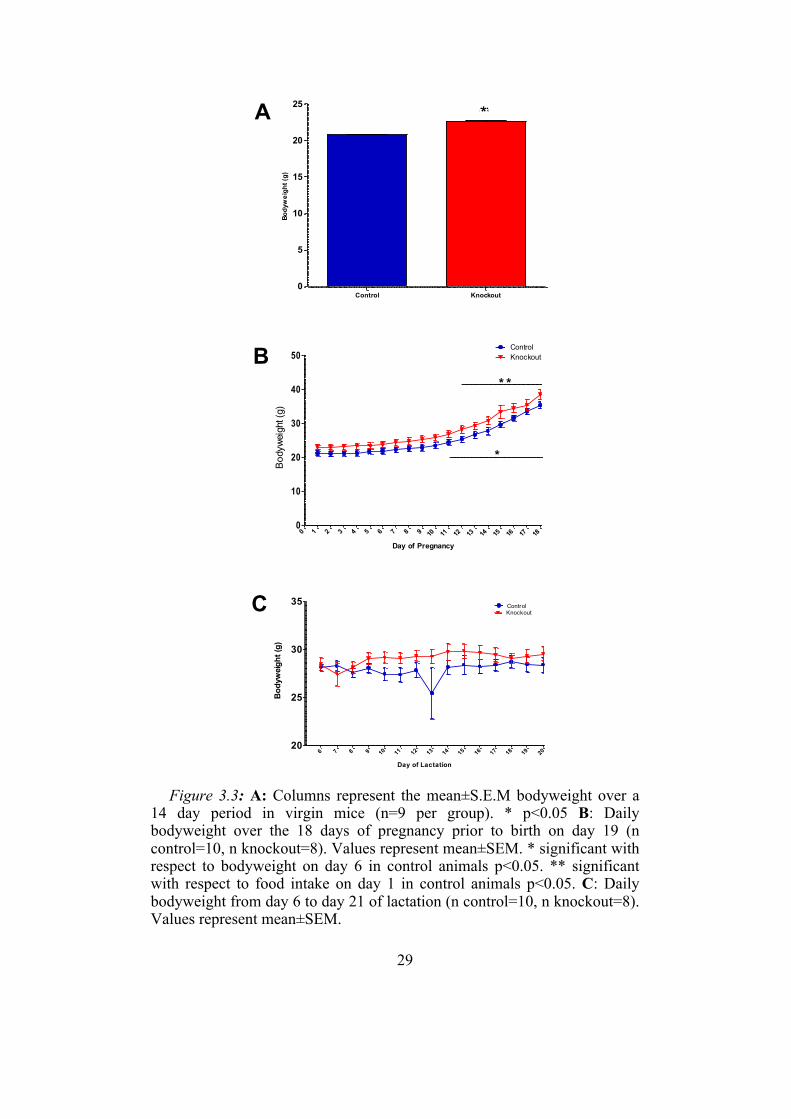
Bodyweight was significantly higher in the non-pregnant knockout
animals compared with controls (figure 3.3A). During pregnancy,
bodyweight increased dramatically in both animal groups with the control

27
animals displaying significantly increased bodyweight by day 11 of
pregnancy and the knockout animals by day 12 (3.3A). There was no
significant difference between the knockout and control animals in overall
bodyweight gain during this time. From day 6 of lactation, bodyweight
remained relatively stable in both animal groups (3.3B). Again, no
significant difference in overall weight gain between the two animal groups
was found.
3.1.3 Litter Weight Gain During Lactation
During the experiment, the subjective impression was that the litter
produced by the knockout animals had significantly lower growth rates
during lactation compared with control. While there was a significant
difference in litter growth pattern over time, there was no significant overall
difference in growth between the two groups (figure 3.4A). Furthermore,
there was no significant difference in cumulative litter weight gain from day
7 to day 19 between the knockout and control litters (figure 3.4B). One
animal appeared to be different from the rest of the group when litter weight
gain from day 7 to day 19 was analysed. However, a Grubbs outlier test
demonstrated that this point was not a significant outlier. Nevertheless,
removal of this point brings the litter growth from day 7 to day 19 to
statistical significance.

28
Figure 3.2: A: Bars represent mean±S.E.M food intake over a 14 day
period in virgin mice (n=9 per group). * p<0.05 B: Daily food intake over the 18 days of pregnancy prior to birth on day 19 (n control=10, n knockout=8). Values represent mean±SEM. * significant with respect to food intake on day 1 in control animals p<0.05. ** significant with respect to food intake on day 1 in control animals p<0.05. C: Daily food intake from day 6 to day 20 of lactation (n control=10, n knockout=8). Values represent mean±SEM. * significant with respect to food intake on day 6 in control animals p<0.05.
Control Knockout0
1
2
3
4
5
*
Food
Inta
ke (g
)
6 7 8 9 10 11 12 13 14 15 16 17 18 19 206
8
10
12
14 ControlKnockout
*
Day of Lactation
Food
inta
ke (g
)
A
B
C
1 2 3 4 5 6 7 8 9 10 11 12 13 14 15 16 17 180
2
4
6
8 ControlKnockout
Day of Pregnancy
*
*
*
Food
inta
ke (g
)
29
Figure 3.3: A: Columns represent the mean±S.E.M bodyweight over a 14 day period in virgin mice (n=9 per group). * p<0.05 B: Daily bodyweight over the 18 days of pregnancy prior to birth on day 19 (n control=10, n knockout=8). Values represent mean±SEM. * significant with respect to bodyweight on day 6 in control animals p<0.05. ** significant with respect to food intake on day 1 in control animals p<0.05. C: Daily bodyweight from day 6 to day 21 of lactation (n control=10, n knockout=8). Values represent mean±SEM.
6 7 8 9 10 11 12 13 14 15 16 17 18 19 2020
25
30
35 ControlKnockout
Day of Lactation
Bod
ywei
ght (
g)
A
B
C
0 1 2 3 4 5 6 7 8 9 10 11 12 13 14 15 16 17 180
10
20
30
40
50ControlKnockout
*
**
Day of Pregnancy
Bod
ywei
ght (
g)Control Knockout
0
5
10
15
20
25 ***
Body
wei
ght (
g)

30
Figure 3.4: A: Litter weight from day 6 to day 20 of lactation. (n litters
control=10, n litters knockout=8). Values represent mean±SEM. B: Columns represent mean±S.E.M pup growth from day 7 to day 19 of lactation. Individual points represent individual animal values.
Control Knockout
0
10
20
30
Pup
grow
th f
rom
day
7 t
o da
y 19
(g)
A
B
6 7 8 9 10 11 12 13 14 15 16 17 18 19 200
10
20
30
40
50 ControlKnockout
Day of lactation
Litt
er w
eigh
t (g
)

31
3.2 Experiment 2
3.2.1 pSTAT5 Immunohistochemistry
The MPOA, PVN, ARC and VMH were qualitatively assessed for
pSTAT5 expression (figure 3.5). Prolactin treatment resulted in our control
animals displaying dense staining for pSTAT5 in all brain regions assessed.
However, our knockout animals displayed differential pSTAT5 distribution
based on the brain region of interest. There was considerable pSTAT5
expression in the MPOA of the control animals. In the knockout animal
brain, there was only scattered pSTAT5 expression in this area (figure 3.6).
The PVN of the hypothalamus showed some pSTAT5 expression in the
control animals. By contrast, there was no staining seen in this area in the
knockout animals (figure 3.7). The ARC showed extensive, but not
complete, loss of prolactin induced pSTAT5 in the knockout animals
compared with the controls (figure 3.8). There was almost complete loss of
pSTAT5 staining in the VMH in the knockouts compared with controls
(figure 3.9).
3.2.2 GFP Immunohistochemistry
Technical difficulties meant that only limited brain regions were
assessable. The PVN of the hypothalamus showed considerable GFP

32
expression in the knockout animals compared with control (figure 3.10).
This corroborates with the pSTAT5 data which showed no pSTAT5 staining
in this area.

33
Figure 3.5: Diagram of coronal mouse brain section indicating areas
assessed for the presence of cells positive for pSTAT5 and GFP. Areas of interest included medial preoptic area (top), paraventricular nucleus (middle), arcuate nucleus and ventromedial nucleus (bottom).

34
Figure 3.6: Representative images of pSTAT5 staining in the medial preoptic area (outlined in red) in control (top) and knockout (bottom) animals. Black dots (indicated by red arrows) indicate a cell positive for pSTAT5 and therefore the prolactin receptor. Inset scale bar approximately 100µm. 3V=Third ventricle, OC=optic chiasm.

35
Figure 3.7: Representative images of pSTAT5 staining in the paraventricular nucleus of the hypothalamus (outlined in red) in control (top) and knockout (bottom) animals. Black dots (indicated by red arrows) indicate a cell positive for pSTAT5 and therefore the prolactin receptor. Inset scale bar approximately 100µm. 3V=Third ventricle

36
Figure 3.8: Representative images of pSTAT5 staining in the arcuate
nucleus of the hypothalamus (outlined in red) in control (top) and knockout (bottom) animals. Black dots (indicated by red arrows) indicate a cell positive for pSTAT5 and therefore the prolactin receptor. Inset scale bar approximately 100µm. 3V=Third ventricle, ME=median eminence

37
Figure 3.9: Representative images of pSTAT5 staining in the
ventromedial nucleus of the hypothalamus (outlined in red) in control (top) and knockout (bottom) animals. Black dots (indicated by red arrows) indicate a cell positive for pSTAT5 and therefore the prolactin receptor. Inset scale bar approximately 100µm. 3V=Third ventricle

38
Figure 3.10: Representative images of GFP staining in the paraventricular nucleus of the hypothalamus (outlined in red) in control (top) and knockout (bottom) animals. Black dots (indicated by red arrows) indicate a cell positive for GFP. Inset scale bar approximately 100µm.3V=Third ventricle
3V
3V
3V

39
3.3 Experiment 3
3.3.1 Fast and Refeed:
There was no significant difference in food intake immediately after the
fast, basal food intake levels or food intake over the 7 days after the fast
between the two animal groups (figures 3.11A, 3.11 B and 3.11C).
However, the knockout animals had significantly higher mean bodyweight
(25.1±0.9 g) compared with the controls (21.3±0.6 g) (figure 3.11D ).
3.3.2 Response to a High Fat Diet
There was a decrease in food intake after the first day animals were
placed on a high fat diet (figure 3.12A). This change did not differ
significantly between the knockout and control animal groups. The
knockout animals placed on a high fat diet gained significantly more weight
(1.8±0.6 g) than the control animals on the same diet (figure 3.12B).

40
Figure 3.11: A and B: Columns represent mean±S.E.M food intake immediately post-fast and basal food intake respectively. C: Food intake for the 7 days postfast each point represents mean±S.E.M. D: Columns represent mean±S.E.M bodyweight over the 7 day measurement period (n control=6, n knockout=8). * p<0.05.
Control Knockout0
2
4
6
Food
Inta
ke P
ost-F
ast (
g)
Control Knockout0
2
4
6
Bas
al F
ood
Inta
ke (g
)
1 2 3 4 5 6 70
2
4
6
8
10ControlKnockout
Day Post-Fast
Food
Inta
ke (g
)
Control Knockout0
10
20
30*
Body
wei
ght (
g)
A
C
B
D

41
Figure 3.12: A: Food intake over the initial four day period post
administration of HFD or control. Points represent mean±S.E.M. B: Change in bodyweight from day 1 to day 25. * significant with respect to control animals on a control diet p<0.05
1 2 3 40
2
4
6
8Control CDControl HFDKnockout CDKnockout HFD
Day
Food
Inta
ke (g
)
-2
-1
0
1
2
3Control CDControl HFDKnockout CDKnockout HFD
*
Cha
nge
in b
odyw
eigh
tfr
om d
ay 1
to d
ay 2
5 (g
)A
B

42
4.0 Discussion
4.1 Overview
Pregnancy is associated with a substantial increase in energy
requirements. A number of adaptations during pregnancy, such as increased
food intake and increased nutrient absorption, allow the maternal body to
meet these demands. Pregnancy-induced hyperphagia is accompanied by a
paradoxical increase in leptin levels, suggesting that the maternal brain is
leptin resistant. Indeed, exogenous leptin administration to pregnant rodents
failed to elicit appetite-suppressive effects such as those seen in non-
pregnant animals (11, 46). Pregnancy is also associated with
downregulation of leptin receptor mRNA and leptin-induced STAT3
phosphorylation, further supporting this idea of pregnancy-induced leptin
resistance accompanied by hyperphagia (19, 46). The exact mechanism by
which these changes occur is yet to be determined, however the pregnancy
hormone prolactin is thought to be involved. There is significant evidence
demonstrating that exogenous prolactin can increase food intake in a
number of species (29, 31, 35). Additionally, central prolactin infusion has
been shown to inhibit responses to exogenous leptin through induction of
central leptin resistance (34, 38). Thus, the aim of this study was to block

43
prolactin action in the brain using a recently developed transgenic knockout
mouse to see if this prevented the expected increases in food intake during
pregnancy.
To investigate the role of prolactin in pregnancy-induced changes in
food intake, we measured food intake during pregnancy in a neuron-specific
prolactin-receptor knockout mouse. There was an overall difference in food
intake during pregnancy between the two animal groups. However, this
trend was the reverse of what we would expect, with the knockout animals
showing increased food intake compared with the controls. Furthermore
there was a significant increase in both food intake and bodyweight in our
non-pregnant knockout animals compared with controls. These unexpected
changes in our non-pregnant knockout group suggested that further
characterisation of this knockout model was necessary in order to elucidate
the possible mechanisms by which these changes arose.
4.2 Success of the Knockout and Immunohistochemistry for
pSTAT5:
A critical issue that must be considered when interpreting the data is
whether the experimental model had achieved the expected deletion of the

44
prolactin receptor from the brain. To determine the success of the CamK-II-
Cre;Prlflox/flox knockout animal model used, pSTAT5 immunohistochemistry
was performed to assess the extent of prolactin receptor signalling loss on
neurons. Prolactin-induced pSTAT5 provides a well characterised marker
for prolactin receptor expression and functional activity in neurons (25).
The results showed differential staining patterns between the knockout and
control animals. While the knockout animals expressed considerably less
pSTAT5 than the controls, there was still staining in areas such as the ARC
and MPOA. This indicated that there were still a number of cells expressing
the prolactin receptor.
There are a number of possible reasons why this knockout model was
incomplete. It is possible that the CamKII promoter is not expressed in all
neurons. Therefore, in those cells lacking the promoter prolactin receptors
would not be excised. The pattern of expression of the CamKII promoter in
cells of the hypothalamus is a source of controversy. It has been
successfully used in previous experiments to delete estrogen receptor-ɑ
specifically out of neurons (47). However, other descriptions of CamKII
expression show incomplete or scattered distribution in the hypothalamus
which is perhaps more consistent with our data (48). Alternatively, the
prolactin receptor may be expressed by other cell types, such as glia, that do
not express CamKII-Cre. These cells may influence the activity of
45
surrounding neurons thus indirectly influencing food intake. While it is
clear that there is still some prolactin receptor expression in the brains of the
knockout animals, the specific cell types retaining the receptor have not
been determined. As such, the incomplete nature of the knockout animal
must be taken into consideration when interpreting results.
Interestingly, the control animals displayed pSTAT5 staining in the PVN
post-weaning. Previous research has found that pSTAT5 is not expressed in
the PVN of virgin, diestrous animals in response to exogenous prolactin
administration (49). However, during lactation, multiple brain regions,
including the PVN, become more sensitive to prolactin (49). This is an
adaptive response which facilitates the prolactin-induced changes that are
necessary for healthy pregnancy and lactation. The results from the present
study, showing expression of pSTAT5 in the PVN in a post-weaning animal
suggest that this increased sensitivity to prolactin during pregnancy and
lactation may persist post-weaning and not return to non-pregnant levels.
This augmented prolactin response in the brain as a result of reproductive
experience is consistent with previous studies in rats (50, 51) and suggests
that this might be a phenomenon common to several species.
Immunohistochemistry for green fluorescent protein was also used to
assess cre-mediated recombination of the prolactin receptor floxed gene and

46
therefore identify the cells which had lost the prolactin receptor. While
difficulties with the tissue sections limited the number of brain regions
assessable, there was significant expression of the protein throughout the
brains of the knockout animals. The PVN showed significant GFP
expression in the knockout mice. This is consistent with our pSTAT5 results
which showed complete loss of prolactin-induced pSTAT5 in the PVN.
4.3 Knockout mice have abnormal estrous cyclicity
As part of the characterisation process of this mouse, estrous cyclicity
was monitored over a 14 day period. These results provided the first
indication of the physiological differences occurring in the knockout group
due to loss of the prolactin receptor. The knockout animals spent
considerably more time in met/diestrus and less time in estrus compared
with the control animals. These changes were likely due to the animals
displaying a state of pseudopregnancy induced by raised prolactin levels.
Mice, like other rodents, have a four day long estrous cycle (52). The
luteal phase of this cycle is only a few hours long in the absence of mating.
When mating occurs, stimulation of the cervix in the female causes
prolactin surges which maintain the corpus luteum allowing for a
subsequent rise in progesterone levels. These mating-induced prolactin

47
surges last long enough for embryo implantation and placental
development. After this point, the placenta produces placental lactogens
(prolactin homologues) in quantities sufficient to maintain high
progesterone levels and thus the viability of the pregnancy (20). In a normal
animal, the corpus luteum would degenerate rapidly if ovulation occurred in
the absence of mating because they lack the high prolactin levels that are
essential for luteotrophic support. In contrast to this, when the
hyperprolactinemic knockout animals ovulate, their high prolactin levels act
to maintain the corpus luteum for an extended period of time. This results in
the animal displaying a pseudopregnancy, a prolonged period of diestrous-
like smears resembling early pregnancy but in the absence of a fetus.
Furthermore, because ovulation triggers the development of the corpus
luteum and this prolonged, anovulatory, pseudopregnant state, animals do
not ovulate as frequently. This is possibly why our knockout animals spent
only a very small proportion of time in the estrus stage of the cycle.
The disrupted estrous cycles of these animals were also reflected in the
difficulties encountered when trying to get sufficient female mice pregnant.
Less than half of the knockout animals that were placed with a breeder male
achieved pregnancy. Moreover, the time taken to achieve pregnancy after
females were placed with a male was significantly longer in the knockout
animals compared with controls. Because the knockout animals ovulate so

48
infrequently, there are considerably fewer opportunities for mating and thus
pregnancy. Consequently, a large number of animals had to be mated for a
prolonged period of time in order to get a sufficient number of pregnant
knockout mice for our experiments.
The hyperprolactinemia exhibited by the knockout animals is likely due
to impaired negative feedback on prolactin secretion. Previous data from
our laboratory demonstrates that there is significant loss of prolactin
receptor on the tuberoinfundibular dopaminergic (TIDA) neuron population
of the arcuate nucleus in the CamK-II-Cre;Prlrflox/flox mice (Kokay pers
comm). The TIDA neurons mediate the short loop negative feedback
system critically involved in regulating prolactin secretion (see Ben-
Jonathan and Hnasko (53) for a review) (figure 4.1).
Figure 4.1: Short loop negative feedback of prolactin secretion Grattan
2002 Reproduction (27)

49
The TIDA neurons release dopamine, which in turn inhibits prolactin
secretion from the anterior pituitary gland. Increased prolactin levels
stimulate the TIDA neurons to increase dopamine secretion and therefore
inhibit prolactin secretion from the anterior pituitary. In this way, prolactin
negatively regulates itself. Loss of the prolactin receptor on the TIDA
neurons of the knockout animals impedes this negative feedback system. As
such, their prolactin levels are significantly higher than controls. In fact,
radioimmunoassay results from our laboratory found that prolactin levels
were up to 3 times higher in the knockouts compared with the controls
(Brown pers comm). These chronically high prolactin levels may be
inducing these changes in the natural reproductive cycle of the mouse
through actions in the ovary.
4.4 Food Intake and Bodyweight During Different
Reproductive States
The non-pregnant knockout animals had significantly higher food intake
and bodyweight compared with the control animals. It is the
hyperprolactinemic nature of the knockout animals, as described above, that
is hypothesised to cause these significant increases in food intake and
bodyweight in the non-pregnant state. However, there are multiple

50
mechanisms by which these high prolactin levels may cause these changes.
A number of studies have found that increasing prolactin levels through
administration of exogenous prolactin increases food intake in a variety of
animal species (28, 29, 31, 33, 35, 36). Thus, it is possible that the increased
endogenous prolactin levels displayed by the knockout animals may have
had similar consequences. Alternatively, as described above, it is possible
that the high prolactin levels maintain the corpus luteum for an extended
period of time. Because of this, the animal is also exposed to increased
progesterone levels. High progesterone levels have been associated with an
increase in food intake, an increase in water retention and consequently an
increase in bodyweight. Additionally, acyclicity has been associated with an
increase in food intake in non-pregnant rats (37). Further research as to
whether the neurons retaining the prolactin receptor are involved in food
intake or not would help clarify whether these differences are caused by
raised prolactin levels or raised progesterone levels.
Food intake was significantly higher by day 15 of pregnancy in the
knockout animals and day 10 in the control animals. This result is consistent
with our hypothesis that the prolactin receptor is involved in increasing food
intake in the earlier stages of pregnancy when metabolic demand is not the
primary driving factor. However, it is more likely that this delayed increase
in food intake during pregnancy is caused by the pseudopregnant state

51
exhibited by the non-pregnant animals. The hyperprolactinemia causes the
non-pregnant animals to display a hormone profile essentially identical to
that of a pregnant animal (54-56). These hormonal changes are likely why
the knockout animals exhibit increased food intake. Therefore, the
development of pregnancy, as distinct from pseudopregnancy, is unlikely to
change this hormone-driven hyperphagia any further.
The knockout animal group displayed significantly higher food intake
over pregnancy compared with the control animals. These data did not
support our hypothesis that prolactin receptor action is critically involved in
mediating changes in food intake over pregnancy. In fact, this trend was the
reverse of what we anticipated, as it was hypothesised that due to loss of the
prolactin receptor in the brain, the expected increases in food intake during
pregnancy would be inhibited in the knockout group. It is likely that these
results were influenced by the non-pregnant animal data. The non-pregnant
knockout animals ate significantly more and thus it is possible that this
hyperphagic state was maintained throughout the course of the pregnancy
which is reflected in the overall increased food intake seen in this group.
However, a number of caveats with the experiment make it difficult to draw
any firm conclusions as to the mechanisms behind these changes.

52
Interpretation of these results was complicated by the pSTAT5
immunohistochemistry results because we could not determine whether the
cells retaining the prolactin receptor were involved in food intake
regulation. If the cells involved in food intake regulation had lost the
prolactin receptor, this would suggest that prolactin is possibly not as
critical to the regulation of food intake during pregnancy as was previously
thought. Alternatively, failure to lose prolactin receptors from neurons
involved in food intake would mean that the hyperprolactinemia in these
animals would be acting on the remaining prolactin receptor sensitive
neurons, potentially continuing to stimulate food intake. As such, until the
neuronal populations retaining the prolactin receptor are identified, no firm
conclusions from our pregnancy data can be drawn. Additionally, the
significant changes seen in our non-pregnant knockout animals suggested
that their normal food intake regulatory mechanisms were altered. Because
we were unable to determine how these changes in food intake regulation
arose in our non-pregnant animals, it is difficult to speculate as to how
pregnancy might change this further.
Bodyweight displayed a significant increase over pregnancy but there
was no significant difference between the two animal groups. It was
anticipated that both groups would exhibit an increase over the course of the
pregnancy due to growth of the developing fetuses. However, we

53
hypothesised that, should the increases in food intake during pregnancy be
inhibited in the knockout group, bodyweight gain in these animals would be
lower to reflect this. Because we did not see the expected decreases in food
intake in the pregnant knockout animals, any decreases in bodyweight as a
direct consequence of this also did not occur.
Food intake and bodyweight were also monitored in both animal groups
throughout the 21 day lactation period. There was no overall significant
difference in food intake or bodyweight between the two animal groups.
However, the control group showed a significantly greater increase in food
intake over the course of lactation compared to the knockouts. Furthermore,
food intake during lactation in the knockout animals did not differ
significantly at any point compared with day 6 of lactation, whereas the
control animals showed a significant increase in food intake by day 12 of
lactation compared with day 6.
Significant differences in food intake between the knockout and control
animals were not necessarily expected as there are different factors driving
the increased food intake in lactation compared with pregnancy. During
pregnancy, increases in food intake occur in anticipation of the changes in
metabolic demand that lie ahead. This means that non-metabolic signals,
such as prolactin, must be present to cause these changes. During lactation,

54
the metabolic demands are sufficient to signal to the body that increased
food intake is necessary. Because these signals are metabolic as opposed to
hormonal, it is anticipated that changes in prolactin receptor expression
should not alter food intake during lactation significantly. The significant
increase in food intake over the lactation period may reflect differences in
metabolic demand between the two groups as a downstream effect of
prolactin receptor loss. These changes may be occurring due to impaired
maternal behaviour and decreased milk production or delivery. This
decrease in milk production causes a decline in metabolic demand, and food
intake decreases to ensure appropriate energy balance is maintained. This
hypothesis is further supported by the decrease in rate of knockout litter
weight gain which occurred at a similar time point to the decreases in food
intake during lactation in this animal group.
4.5 Litter Characteristics
Preliminary observations suggested that the knockout animal litters
weights were significantly lower than their control counterparts although
statistical analysis showed no significant difference in cumulative pup
growth from day 7 to day 19 between the knockout and control groups.
Initial assessment of the data suggested that one litter in the knockout group
was considerably heavier than the others. However, this point was not

55
considered a significant outlier when subjected to a Grubbs outliers test.
Despite this, removal of that one point brought the results to statistical
significance. Additionally, litter growth over time was significantly lower in
the knockout compared with the control animals.
These differences in litter growth may be due to differences in maternal
behaviour between the two animal groups. Prolactin has been demonstrated
as critical to the development of maternal behaviours. In fact, centrally
administered exogenous prolactin is sufficient in rats to cause
reproductively inexperienced females to exhibit maternal behaviour towards
pups (57). Furthermore, mice that are heterozygous for a null mutation in
the gene encoding the prolactin receptor have been observed to have
impaired maternal behaviour development (23). Therefore, it would be
expected that significant loss of the prolactin receptor in critical areas, such
as the MPOA, would have similar effects. Impairment of normal behaviours
due to this, such as time spent suckling, could influence the feeding habits
of the pups and thus their weight gain. Alternatively, there may be inherent
characteristics of the pups that cause them to display different growth
patterns compared with control litters. A cross-fostering study, in which
knockout litters are placed with control mothers and vice versa, would help
determine whether these changes occurred due to differences in the pup
phenotype or due to changes in maternal behavioural characteristics.

56
4.6 Response to a Fast and Refeed protocol and a High Fat
Diet study
The difference in bodyweight and food intake in the non-pregnant
knockout animals was unexpected and prompted us to undertake additional
investigations. Previous research suggests that a fast and refeed protocol
and a high fat diet experiment are the first steps to investigating a
bodyweight phenotype in a specific knockout population (see review by
Ellacott et al., (45)). When an animal is fasted, a post-fast hyperphagic
response normally occurs to compensate for the period of negative energy
balance. Failure to refeed may indicate defects in the animals’ ability to
maintain energy homeostasis. Alternatively, excessive refeeding responses
may suggest that the animals’ satiety signals are altered. There was no
significant difference in the refeeding response of our animals. However,
there was a significant increase in bodyweight between the two groups. This
confirms the results we found in our non-pregnant animals and provides
further evidence for an altered food intake-regulatory system in our
knockout animals.

57
Response to a HFD can also be used to indicate possible dysfunction in
energy regulation. There was a dramatic increase in food intake in all
groups over the first day the animals were placed on a HFD. However, this
significant increase lasted only the first day. Bodyweight gain was
significantly higher in the knockout animals on the HFD compared with the
control animals on the control diet. There also was a trend towards
significantly higher weight gain in the knockout animals on the control diet.
While this difference was not significant, it is likely that increasing our
group sizes would cause this result to reach statistical significance. This
increased bodyweight in the knockout animals on both diets, further
supports the idea that these knockout animals have some impairment in
bodyweight homeostasis which requires further investigation.
4.7 Limitations
A number of limitations with the methods that were used may have
influenced the results obtained. The key problem with this experiment was
the failure of our knockout model to lose the prolactin receptor in all areas
of the brain. As was discussed earlier, there is debate as to the expression of
the CamKII promoter within cells of the hypothalamus. However, because it

58
had been successfully used in previous experiments to knock out estrogen
receptors from neurons, it was anticipated that it could also be used to
knock the prolactin receptor out neuron-specifically. In order to rectify this
problem, our laboratory is currently breeding a prolactin receptor floxed
mouse with a nestin-cre expressing mouse. The nestin promoter is
expressed during early embryonic development in progenitor cell types of
the neuroectoderm, developing mesonephros and the somites (58). It is
anticipated that this nestin promoter will be more successful in achieving
global neuronal loss of the prolactin receptor compared with the CamKII
promoter.
The most likely target of prolactin in food intake regulation is the
oxytocin neuronal population in the PVN where we seemed to have
achieved deletion of the prolactin receptor. This suggests that there may be
other brain areas involved in prolactin-induced changes in food intake
regulation. The brainstem is well established as one of the centres involved
in food intake regulation and it has also been shown to express the prolactin
receptor during lactation (49). This suggests that it may have been
responsible for mediating the changes we saw.
Food intake data collection is also likely to be prone to error. In the
mouse, food consumption is so small that any losses that may occur through

59
means such as transfer to scales or dropping into the bottom of the cage, can
significantly skew results. Furthermore, as such small amounts are
consumed, significant changes may be too small to detect using
conventional statistical analysis.
4.8 Conclusions
While our data did not support the hypothesis that prolactin is critically
involved in increasing food intake during pregnancy, a number of factors
limited our ability to draw finite conclusions about the results. Nevertheless,
a significant step towards characterising this knockout mouse model was
taken. Obesity and excess weight gain during pregnancy is now being
considered 'the most common clinical risk factor encountered in obstetric
practice' (59). It is implicated in a number of pregnancy-related
complications including pre-eclampsia and gestational diabetes. Through
improving comprehension of the role of prolactin in appetite and weight
regulation in pregnancy we can better understand how excess weight gain
and obesity during pregnancy occurs and how dysregulation of this pathway
may affect the outcome of pregnancy.

60
5.0 References
1. Augustine RA, Ladyman SR, Grattan DR. From feeding one to feeding
many: hormone-induced changes in bodyweight homeostasis during
pregnancy. The Journal of Physiology. 2008;586(2):387-97.
2. Pelleymounter MA, Cullen MJ, Baker MB, Hecht R, Winters D, Boone
T, et al. Effects of the obese gene product on body weight regulation in
ob/ob mice. Science. 1995;269(5223):540-3.
3. Lee G-H, Proenca R, Montez JM, Carroll KM, Darvishzadeh JG, Lee JI,
et al. Abnormal splicing of the leptin receptor in diabetic mice. Nature.
1996;379(6566):632-5.
4. Chen H, Charlat O, Tartaglia LA, Woolf EA, Weng X, Ellis SJ, et al.
Evidence that the diabetes gene encodes the leptin receptor: identification of
a mutation in the leptin receptor gene in db/db mice. Cell. 1996;84(3):491-
5.
5. Bado A, Levasseur S, Attoub S, Kermorgant S, Laigneau JP, Bortoluzzi
MN, et al. The stomach is a source of leptin. Nature. 1998;394(6695):790-3.
6. Masuzaki H, Ogawa Y, Sagawa N, Hosoda K, Matsumoto T, Mise H, et
al. Nonadipose tissue production of leptin: leptin as a novel placenta-
derived hormone in humans. Nature Medicine. 1997;3(9):1029-33.
7. Hahn TM, Breininger JF, Baskin DG, Schwartz MW. Coexpression of
Agrp and NPY in fasting-activated hypothalamic neurons. Nature
Neuroscience. 1998;1(4):271-2.
61
8. Cowley MA, Smart JL, Rubinstein M, Cerdán MG, Diano S, Horvath
TL, et al. Leptin activates anorexigenic POMC neurons through a neural
network in the arcuate nucleus. Nature. 2001;411(6836):480-4.
9. Gibbs J, Young RC, Smith GP. Cholecystokinin decreases food intake in
rats. Journal of Comparative and Physiological Psychology.
1973;84(3):488-95.
10. Nakazato M, Murakami N, Date Y, Kojima M, Matsuo H, Kangawa
K, et al. A role for ghrelin in the central regulation of feeding. Nature.
2001;409(6817):194-8.
11. Ladyman SR, Grattan DR. Region-Specific Reduction in Leptin-
Induced Phosphorylation of Signal Transducer and Activator of
Transcription-3 (STAT3) in the Rat Hypothalamus Is Associated with
Leptin Resistance during Pregnancy. Endocrinology. 2004;145(8):3704-11.
12. Cripps AW, Williams VJ. The effect of pregnancy and lactation on
food intake, gastrointestinal anatomy and the absorptive capacity of the
small intestine in the albino rat. The British Journal of Nutrition.
1975;33(1):17-32.
13. Seeber RM, Smith JT, Waddell BJ. Plasma Leptin-Binding Activity
and Hypothalamic Leptin Receptor Expression During Pregnancy and
Lactation in the Rat. Biology of Reproduction. 2002;66(6):1762-7.
14. Rocha M, Bing C, Williams G, Puerta M. Pregnancy-induced
hyperphagia is associated with increased gene expression of hypothalamic
agouti-related peptide in rats. Regulatory Peptides. 2003;114(2–3):159-65.
15. Speakman JR, McQueenie J. Limits to Sustained Metabolic Rate: The
Link between Food Intake, Basal Metabolic Rate, and Morphology in

62
Reproducing Mice, Mus musculus. Physiological Zoology. 1996;69(4):746-
69.
16. Cummings DE, Overduin J. Gastrointestinal regulation of food intake.
The Journal of Clinical Investigation. 2007;117(1):13-23.
17. Butte NF, Hopkinson JM, Nicolson MA. Leptin in human
reproduction: serum leptin levels in pregnant and lactating women. The
Journal of Clinical Endocrinology and Metabolism. 1997;82(2):585-9.
18. Amico JA, Thomas A, Crowley RS, Burmeister LA. Concentrations
of leptin in the serum of pregnant, lactating, and cycling rats and of leptin
messenger ribonucleic acid in rat placental tissue. Life Sciences.
1998;63(16):1387-95.
19. Ladyman SR, Grattan DR. Suppression of Leptin Receptor Messenger
Ribonucleic Acid and Leptin Responsiveness in the Ventromedial Nucleus
of the Hypothalamus during Pregnancy in the Rat. Endocrinology.
2005;146(9):3868-74.
20. Cerruti R. Mammogenic Activities of the Mid-Gestational Mouse
Placenta. Endocrinology. 1960;67(6):884-7.
21. Liu X, Robinson GW, Wagner KU, Garrett L, Wynshaw-Boris A,
Hennighausen L. Stat5a is mandatory for adult mammary gland
development and lactogenesis. Genes & Development. 1997;11(2):179-86.
22. Shingo T, Gregg C, Enwere E, Fujikawa H, Hassam R, Geary C, et al.
Pregnancy-stimulated neurogenesis in the adult female forebrain mediated
by prolactin. Science Signalling. 2003;299(5603):117.

63
23. Lucas BK, Ormandy CJ, Binart N, Bridges RS, Kelly PA. Null
Mutation of the Prolactin Receptor Gene Produces a Defect in Maternal
Behavior. Endocrinology. 1998;139(10):4102-7.
24. Ling C, Hellgren G, Gebre-Medhin M, Dillner K, Wennbo H,
Carlsson B, et al. Prolactin (PRL) Receptor Gene Expression in Mouse
Adipose Tissue: Increases during Lactation and in PRL-Transgenic Mice.
Endocrinology. 2000;141(10):3564-72.
25. Brown RSE, Kokay IC, Herbison AE, Grattan DR. Distribution of
prolactin-responsive neurons in the mouse forebrain. The Journal of
Comparative Neurology. 2010;518(1):92-102.
26. Schindler C, Darnell JE. Transcriptional Responses to Polypeptide
Ligands: The JAK-STAT Pathway. Annual Review of Biochemistry.
1995;64(1):621-52.
27. Grattan D. Behavioural significance of prolactin signalling in the
central nervous system during pregnancy and lactation. Reproduction.
2002;123(4):497-506.
28. Buntin JD. Time course and response specificity of prolactin-induced
hyperphagia in ring doves. Physiol Behav. 1989;45(5):903-9.
29. Buntin JD, Figge GR. Prolactin and growth hormone stimulate food
intake in ring doves. Pharmacol Biochem Behav. 1988;31(3):533-40.
30. Li C, Kelly PA, Buntin JD. Inhibitory effects of anti-prolactin
receptor antibodies on prolactin binding in brain and prolactin-induced
feeding behavior in ring doves. Neuroendocrinology. 1995;61(2):125-35.

64
31. Byatt JC, Staten NR, Salsgiver WJ, Kostelc JG, Collier RJ.
Stimulation of food intake and weight gain in mature female rats by bovine
prolactin and bovine growth hormone. American Journal of Physiology -
Endocrinology And Metabolism. 1993;264(6):E986-E92.
32. Noel MB, Woodside B. Effects of systemic and central prolactin
injections on food intake, weight gain, and estrous cyclicity in female rats.
Physiology & Behavior. 1993;54(1):151-4.
33. Sauve D, Woodside B. The effect of central administration of
prolactin on food intake in virgin female rats is dose-dependent, occurs in
the absence of ovarian hormones and the latency to onset varies with
feeding regimen. Brain Research. 1996;729(1):75-81.
34. Naef L, Woodside B. Prolactin/Leptin Interactions in the Control of
Food Intake in Rats. Endocrinology. 2007;148(12):5977-83.
35. Gerardo-Gettens T, Moore BJ, Stern JS, Horwitz BA. Prolactin
stimulates food intake in a dose-dependent manner. The American Journal
of Physiology. 1989;256(1 Pt 2):R276-80.
36. Moore BJ, Gerardo-Gettens T, Horwitz BA, Stern JS.
Hyperprolactinemia stimulates food intake in the female rat. Brain Research
Bulletin. 1986;17(4):563-9.
37. Tarttelin MF, Gorski RA. Variations in food and water intake in the
normal and acyclic female rat. Physiology & Behavior. 1971;7(6):847-52.
38. Augustine RA, Grattan DR. Induction of Central Leptin Resistance in
Hyperphagic Pseudopregnant Rats by Chronic Prolactin Infusion.
Endocrinology. 2008;149(3):1049-55.

65
39. Martin RL, Perez E, He YJ, Dawson R, Jr., Millard WJ. Leptin
resistance is associated with hypothalamic leptin receptor mRNA and
protein downregulation. Metabolism. 2000;49(11):1479-84.
40. Steyn FJ, Anderson GM, Grattan DR. Hormonal Regulation of
Suppressors of Cytokine Signaling (SOCS) Messenger Ribonucleic Acid in
the Arcuate Nucleus during Late Pregnancy. Endocrinology.
2008;149(6):3206-14.
41. Anderson GM, Beijer P, Bang AS, Fenwick MA, Bunn SJ, Grattan
DR. Suppression of prolactin-induced signal transducer and activator of
transcription 5b signaling and induction of suppressors of cytokine
signaling messenger ribonucleic acid in the hypothalamic arcuate nucleus of
the rat during late pregnancy and lactation. Endocrinology.
2006;147(10):4996-5005.
42. Bjorbak C, Lavery HJ, Bates SH, Olson RK, Davis SM, Flier JS, et al.
SOCS3 mediates feedback inhibition of the leptin receptor via Tyr985. J
Biol Chem. 2000;275(51):40649-57.
43. Tsien JZ, Chen DF, Gerber D, Tom C, Mercer EH, Anderson DJ, et
al. Subregion-and cell type-restricted gene knockout in mouse brain. Cell.
1996;87(7):1317-26.
44. Paxinos G, Franklin K. The mouse brain in stereotaxic coordinates:
compact second edition. San Diego: Academic. 2003.
45. Ellacott KLJ, Morton GJ, Woods SC, Tso P, Schwartz MW.
Assessment of Feeding Behavior in Laboratory Mice. Cell Metabolism.
2010;12(1):10-7.

66
46. Ladyman SR, Fieldwick DM, Grattan DR. Suppression of leptin-
induced hypothalamic JAK/STAT signaling and feeding response during
pregnancy in the mouse. Reproduction. 2012.
47. Wintermantel TM, Campbell RE, Porteous R, Bock D, Gröne H-J,
Todman MG, et al. Definition of Estrogen Receptor Pathway Critical for
Estrogen Positive Feedback to Gonadotropin-Releasing Hormone Neurons
and Fertility. Neuron. 2006;52(2):271-80.
48. Gavériaux-Ruff C, Kieffer BL. Conditional gene targeting in the
mouse nervous system: Insights into brain function and diseases.
Pharmacology & Therapeutics. 2007;113(3):619-34.
49. Brown RSE, Herbison AE, Grattan DR. Differential Changes in
Responses of Hypothalamic and Brainstem Neuronal Populations to
Prolactin During Lactation in the Mouse. Biology of Reproduction.
2011;84(4):826-36.
50. Anderson GM, Grattan DR, van den Ancker W, Bridges RS.
Reproductive Experience Increases Prolactin Responsiveness in the Medial
Preoptic Area and Arcuate Nucleus of Female Rats. Endocrinology.
2006;147(10):4688-94.
51. Sjoeholm A, Bridges RS, Grattan DR, Anderson GM. Region-,
Neuron-, and Signaling Pathway-Specific Increases in Prolactin
Responsiveness in Reproductively Experienced Female Rats.
Endocrinology. 2011;152(5):1979-88.
52. Hilliard J. Corpus luteum function in guinea pigs, hamsters, rats, mice
and rabbits. Biology of Reproduction. 1973;8(2):203-21.

67
53. Ben-Jonathan N, Hnasko R. Dopamine as a prolactin (PRL) inhibitor.
Endocrine reviews. 2001;22(6):724-63.
54. Smith MS, Freeman ME, Neill JD. The Control of Progesterone
Secretion During the Estrous Cycle and Early Pseudopregnancy in the Rat:
Prolactin, Gonadotropin and Steroid Levels Associated with Rescue of the
Corpus Luteum of Pseudopregnancy. Endocrinology. 1975;96(1):219-26.
55. Freeman ME, Smith MS, Nazian SJ, Neill JD. Ovarian and
Hypothalamic Control of the Daily Surges of Prolactin Secretion During
Pseudopregnancy in the Rat. Endocrinology. 1974;94(3):875-82.
56. Freeman ME, Neill JD. The Pattern of Prolactin Secretion during
Pseudopregnancy in the Rat: A Daily Nocturnal Surge. Endocrinology.
1972;90(5):1292-4.
57. Bridges RS, Numan M, Ronsheim PM, Mann PE, Lupini CE. Central
prolactin infusions stimulate maternal behavior in steroid-treated,
nulliparous female rats. Proceedings of the National Academy of Sciences
of the United States of America. 1990;87(20):8003-7.
58. Dubois NC, Hofmann D, Kaloulis K, Bishop J, Trumpp A. Nestin-Cre
transgenic mouse line Nes-Cre1 mediates highly efficient Cre/loxP
mediated recombination in the nervous system, kidney, and somite-derived
tissues. Genesis. 2006;44(8):355-60.
59. Bhattacharya S, Campbell D, Liston W, Bhattacharya S. Effect of
Body Mass Index on pregnancy outcomes in nulliparous women delivering
singleton babies. BMC Public Health. 2007;7(1):168.

68

69
Appendices
Appendix A: Fixatives
0.2 M Phosphate Buffer (1 litre)
Sodium dibasic anhydrous (Na2HPO4) 22.72 g
Sodium bonobasic 1x hydrous (NaH2PO4.H2O) 5.52 g
Dissolve in 900 ml milliQ-H2O
Store at room temperature
4% (w/v) Paraformaldehyde in 0.1 M PB
In fumehood:
Dissolve 4g paraformaldehyde powder in 50 ml of 55O C milliQ-H2O.
Continue heating on stirrer unit with thermometer to 60 degrees.
Once solution is 60 degrees add 2-3 drops of 1 M NaOH.
Continue stirring until all the paraformaldehyde powder has dissolved
and the solution is clear.
Cool solution on bench until room temperature
Make up to 100 ,l with 0.2 M phosphate buffer.
Filter solution.

70
Ensure pH is 7.3-7.4
Store at 4OC until use.
For transcardial mouse perfusion use 20 mL per animal.
30% Sucrose Solution
Sucrose 30 g
Dissolve in 100 ml 0.1 M phosphate buffer
Store at 4OC until use.

71
Appendix B: Solutions Used For Immunhistochemistry
Cryoprotectant (1 litre)
0.1 M PB 500 ml
NaCl 9 g
Sucrose 300 g
Polyvinyl pyrrolidine (PVP-40) 10 g
Ethylene glycol 300 ml
Make up to 1 litre final volume with milliQ-H2O.
Store at 4OC until use.
10x Tris-buffered saline (TBS) stock solution (2 litres)
100 mM Tris 24.2 g
1. M NaCl 1 752 g
Dissolve in 1800ml milliQ-H2O
Adjust pH to 7.6 with concentrated HCl.
Make up to final volume of 2 litres with milliQ-H2O
1x TBS Working Solution (1 litre)
Dilute 100 ml of the stock solution (10x TBS) in 900 ml milliQ-H2O.
Store at room temperature.

72
TBS+0.3% Triton X (100 ml)
Triton-X 300 μl
1x Tris-buffered saline 100 ml
Blocking solution (100 ml)
TBS+0.3% TritonX 100 ml
Bovine serum albumin 0.25 g
Normal goat serum 2000 μl
Hydrogen peroxide solution (50 ml)
1x TBS 28.5 ml
Methanol 20 ml
30% Hydrogen peroxide 1.5 ml
Avidin-Biotin complex solution (25 ml)
Made up using manufacturers instructions
60 minutes prior to use:
Prepare enough for 1 ml per well:
TBS 2 5 ml
Solution A 10 μl
Solution B 10 μl

73