Embed Size (px)
Citation preview

THE ROLE OF PROACTIVE ADAPTATION IN INTERNATIONAL MITIGATION COALITIONS
Kelly de Bruin @ CERE

Introduction: climate change
Climate change creates an environmental threat
Increased GHG emissions are changing the climate making it hotter and more variable
Economics can be used as a tool to analyse this problem and its possible solutions

Introduction: policy options
Policy options include adaptation and mitigation
Adaptation is a private good where the damages of climate change are reduced
Mitigation is a public good where emissions are reduced limiting climate change
Cooperation is needed to ensure global optimal level of mitigation
Introduction: purpose
Adaptation has been ignored in ICA literature, where it is assumed that adaptation will be applied optimally w.r.t. the expected climate change
How can adaptation affect mitigation coalition formation and stability

Previous studies
Barrett (2008) defines adaptation in an ICA as taking place after coalition is in place and hence ineffective in signaling other members. No credible threat.
Zehaie (2009) assumes adaptation takes place before mitigation cooperation and has a strategic role, by increasing the other regions mitigation.
Zehaie looks at only 2 regions and not at coalition formation and stability.

Proactive vs reactive adaptation
Adaptation is often divided into 2 categories: proactive and reactive.
Proactive adaptation takes place before climate change is felt and involves large scale infrastructure e.g. seawalls
Reactive adaptation takes place in reaction to climate change and involves small scale adjustments, e.g. crop changes

Proactive vs reactive adaptation
We distinguish between these 2 forms assuming they take place before and after coalition formation:
CoalitionProactiveadaptation
Reactiveadaptation

Methodology
In this paper we apply a three stage cartel game of coalition formation and an applied game theoretical model: AD-STACO

The game
3- stage one shot coalition formation game
First stage: set proactive adaptation level
Second stage: decide whether or not to join a unique coalition
Third stage: transboundary pollution game: set mitigation levels. Singletons optimise regional benefits, coalition members maximise coalition benefits

The game
Heterogeneous regions Atleast 3 regions One unique coalition Adaptation is given by
Mitigation is given by
The game
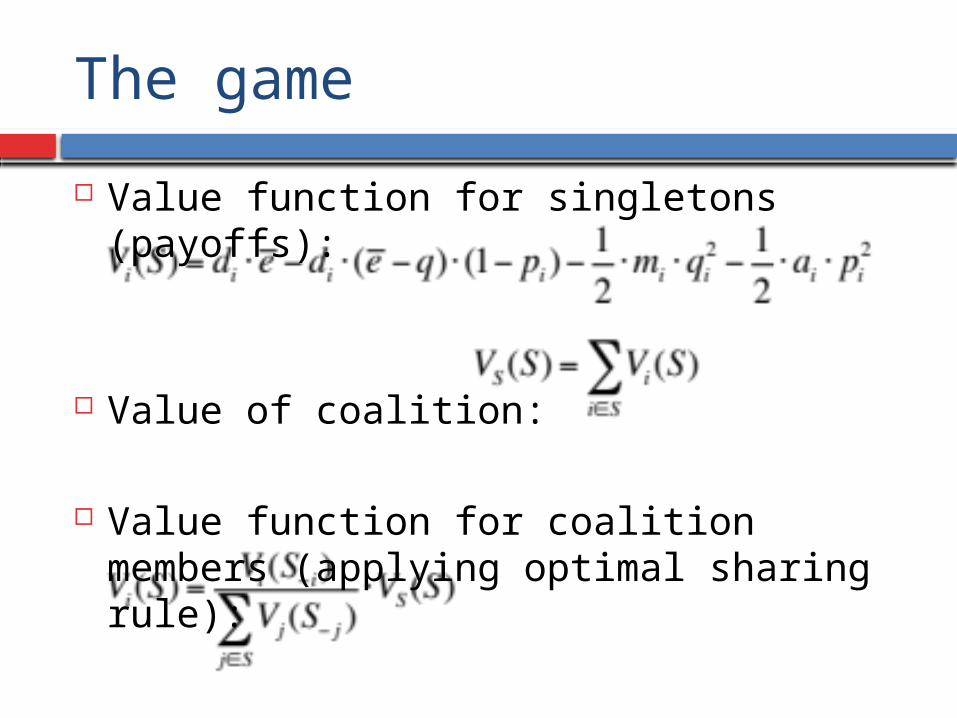
Value function for singletons (payoffs):
Value of coalition:
Value function for coalition members (applying optimal sharing rule):

The game
Calculate optimal levels of mitigation and adaptation for each coalition
Check if coalition is internally and externally stable
Generally the optimal level of adaptation depends on the level of damages only
But by over-adapting, a region could use adaptation strategically to influence other regions

Adaptation strategies
Due to constant marginal benefits of mitigation adaptation has no strategic effect as a singleton
Adaptation of coalition members has an effect through the sharing rule:
can increase
can decrease
can decrease
The model: AD-STACO
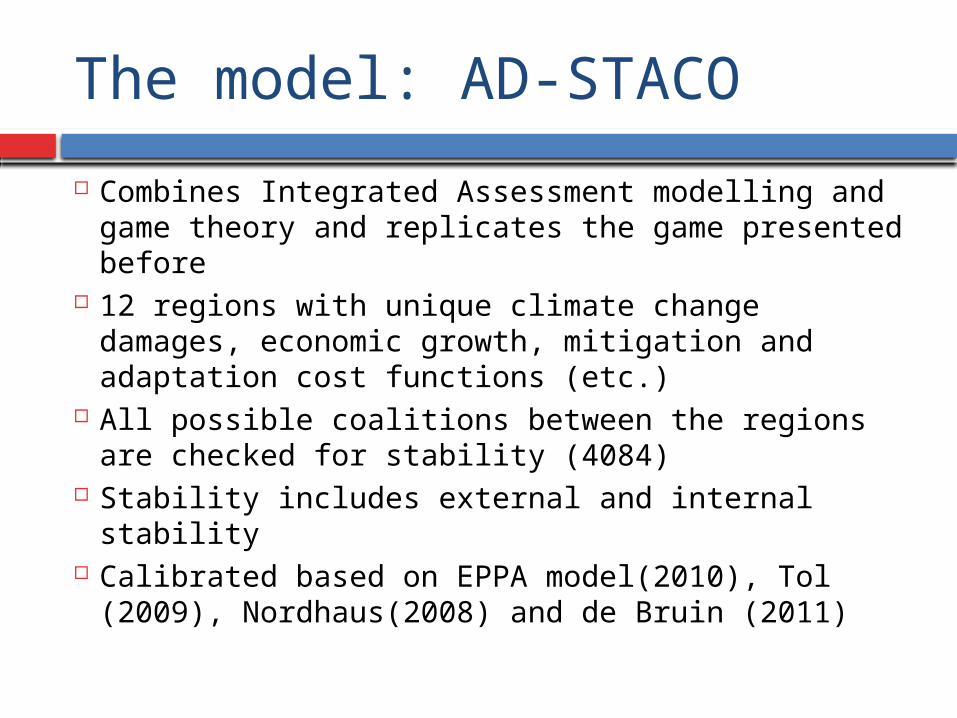
Combines Integrated Assessment modelling and game theory and replicates the game presented before
12 regions with unique climate change damages, economic growth, mitigation and adaptation cost functions (etc.)
All possible coalitions between the regions are checked for stability (4084)
Stability includes external and internal stability Calibrated based on EPPA model(2010), Tol
(2009), Nordhaus(2008) and de Bruin (2011)

AD-STACO regions
USA
Japan
EU15
Eastern European regionsOther OECD
China
Brazil
Former Soviet UnionRest of the world
India
Energy exporting regions
Dynamic Asian economies

Results
We look at 2 levels of adaptation: GC adaptation and AS adaptation
GC is lower rational level AS is upper rational level Grand Coalition Stable coalitions Best performing stable coalition Strategic adaptation

GC payoffs (NPV in Bln $ over 100 years)
Region GC adapNo transfers
AS adapNo transfers
GC adapTransfers
AS adapTransfers
USA 7021 6996 6067 6052
JPN 8495 8449 7230 7212
EU15 7985 7946 6591 6571
OOECD 865 863 932 929
EET 183 185 357 356
FSU 1622 1619 1718 1713
EEX 470 472 714 712
CHN -753 -724 1268 1268
IND 754 757 1035 1033
DAE 413 415 621 620
BRA 439 438 402 400
ROW 1635 1632 1723 1717
Global 29130 29048 28657 28583
GC payoffs
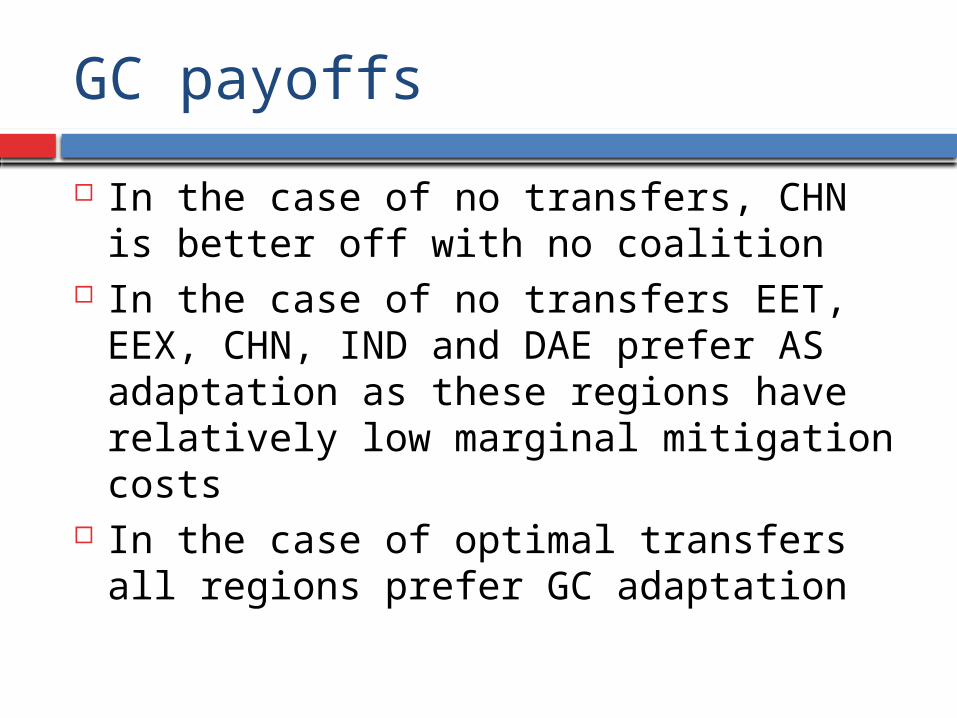
In the case of no transfers, CHN is better off with no coalition
In the case of no transfers EET, EEX, CHN, IND and DAE prefer AS adaptation as these regions have relatively low marginal mitigation costs
In the case of optimal transfers all regions prefer GC adaptation
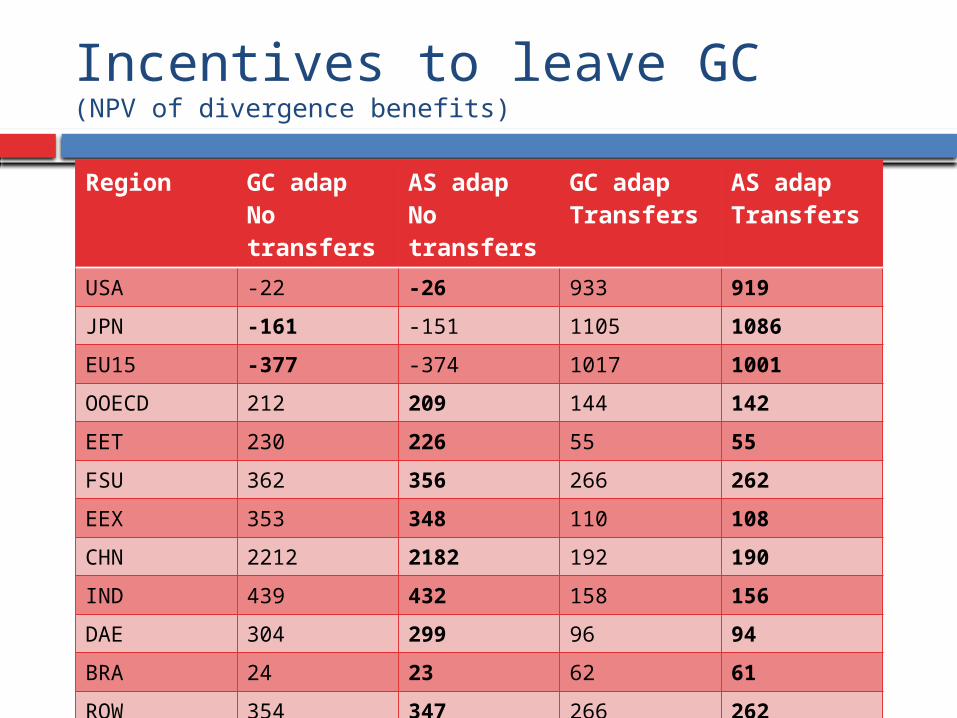
Incentives to leave GC(NPV of divergence benefits)
Region GC adapNo transfers
AS adapNo transfers
GC adapTransfers
AS adapTransfers
USA -22 -26 933 919
JPN -161 -151 1105 1086
EU15 -377 -374 1017 1001
OOECD 212 209 144 142
EET 230 226 55 55
FSU 362 356 266 262
EEX 353 348 110 108
CHN 2212 2182 192 190
IND 439 432 158 156
DAE 304 299 96 94
BRA 24 23 62 61
ROW 354 347 266 262
GC incentives
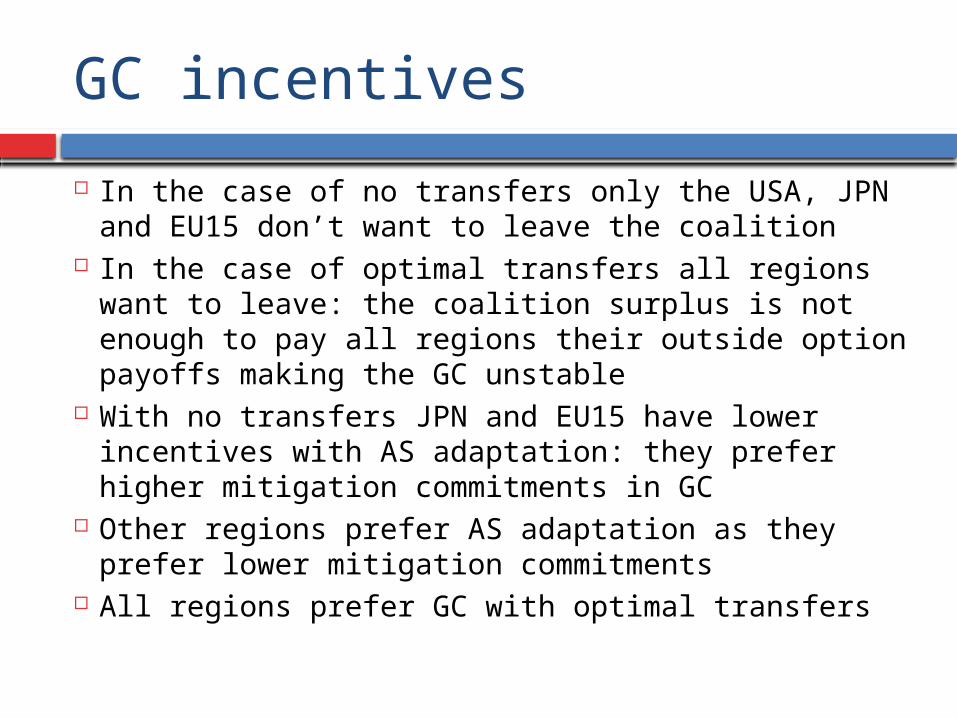
In the case of no transfers only the USA, JPN and EU15 don’t want to leave the coalition
In the case of optimal transfers all regions want to leave: the coalition surplus is not enough to pay all regions their outside option payoffs making the GC unstable
With no transfers JPN and EU15 have lower incentives with AS adaptation: they prefer higher mitigation commitments in GC
Other regions prefer AS adaptation as they prefer lower mitigation commitments
All regions prefer GC with optimal transfers

Stable Coalitions: top 10
Coalition members performance
USA, EET, CHN, IND, DAE 48 %
EU15, EET, CHN, IND, DAE 47 %
USA, EET, EEX, CHN, DAE, BRA 46 %
USA, CHN, IND, BRA 45 %
USA, EEX, CHN, IND 44 %
EU15, EET, EEX, CHN, DAE, BRA 44 %
USA, FSU, EEX, CHN 44 %
EU15, OOECD, EEX, CHN, DAE 44 %
USA, FSU, EEX, CHN 43 %
USA, CHN, DAE, ROW 43 %
Stable coalitions: effect of adaptation
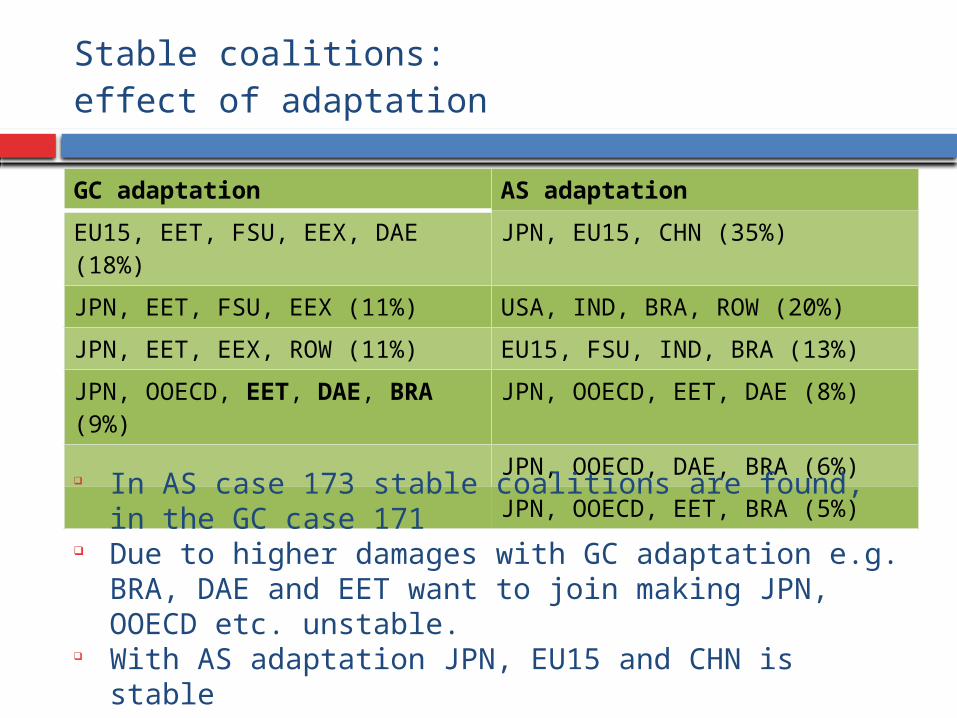
GC adaptation AS adaptation
EU15, EET, FSU, EEX, DAE (18%) JPN, EU15, CHN (35%)
JPN, EET, FSU, EEX (11%) USA, IND, BRA, ROW (20%)
JPN, EET, EEX, ROW (11%) EU15, FSU, IND, BRA (13%)
JPN, OOECD, EET, DAE, BRA (9%)
JPN, OOECD, EET, DAE (8%)
JPN, OOECD, DAE, BRA (6%)
JPN, OOECD, EET, BRA (5%) In AS case 173 stable coalitions are found, in the GC
case 171 Due to higher damages with GC adaptation e.g. BRA,
DAE and EET want to join making JPN, OOECD etc. unstable.
With AS adaptation JPN, EU15 and CHN is stable
Best performing stable coalition
Best performing stable coalition is between USA, EET, CHN, IND and DAE
This coalition captures 48 % of the GC benefits
We look at the effects of unilateral divergence from GC to AS adaptation in the BPSC
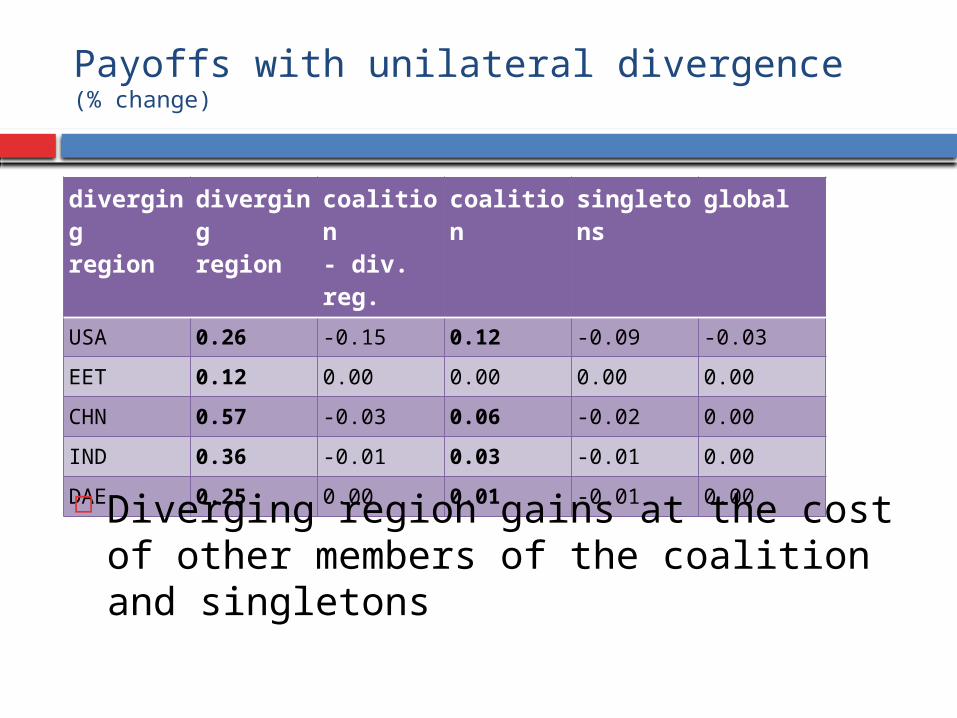
Payoffs with unilateral divergence(% change)
divergingregion
divergingregion
coalition- div. reg.
coalition singletons
global
USA 0.26 -0.15 0.12 -0.09 -0.03
EET 0.12 0.00 0.00 0.00 0.00
CHN 0.57 -0.03 0.06 -0.02 0.00
IND 0.36 -0.01 0.03 -0.01 0.00
DAE 0.25 0.00 0.01 -0.01 0.00
Diverging region gains at the cost of other members of the coalition and singletons

Outside option payoffs (% change)
Diverger
USA EET CHN IND DAE
USA 0.15 -0.29 -0.23 -0.30 -0.28
EET -0.01 0.12 0.00 0.00 0.00
CHN -0.09 -0.08 0.52 -0.08 -0.08
IND -0.04 -0.04 -0.03 0.34 -0.04
DAE -0.02 -0.02 -0.01 -0.02 0.24

Conclusions
Adaptation levels affect the GC payoffs and incentives: payoffs increase will incentives to join the GC decrease
Adaptation affects the stable coalitions found: higher adaptation can increase incentives of low abatements level region to join a coalition
Strategic over-adaptation by coalition members can increase their payoffs
Further research
The scenarios run here represent only unilateral divergences and hence not a Nash equilibrium
Further work is needed to incorporate strategic adaptation simultaneously for all players