Embed Size (px)
Citation preview

THE ROLE OF OCEAN OBSERVATORIES IN CLIMATE CHANGE MONITORING, MULTI-HAZARD EARLY WARNING AND DISASTER RISK REDUCTION
Tania L. Insua, Moran, K., De Leo, F., Sastri, A., Heesemann, M., Dewey, R.UNOOSA Conference November 2017 [email protected]


OCEAN NETWOKS USERS AND DATA VOLUME
1. Canada2. United States3. Ucraine4. Russia5. China6. UK7. France8. Germany9. Spain10. India
• 850+ km seafloor backbone cables• 400 instruments containing over 5000 sensors online 24/7/365• 500+ TB of data archived in over 26 million files• 280 GB of data collected and 35 GB distributed per day

CLIMATE CHANGE STUDIES

THE IMPORTANCE OF THE OCEAN
Food sustainabilityEnergy
Economic importanceEmployment Sustainable industry and innovation
Goal 14: Conserve and sustainably use the oceans, seas and marine resources for sustainable development
Weather and climate
Terrestrial ecosystems influencer

(Ferry Ocean ColourObservation System)
Slide courtesy of Dr. Maycira Costa
MODIS Sentinel 3
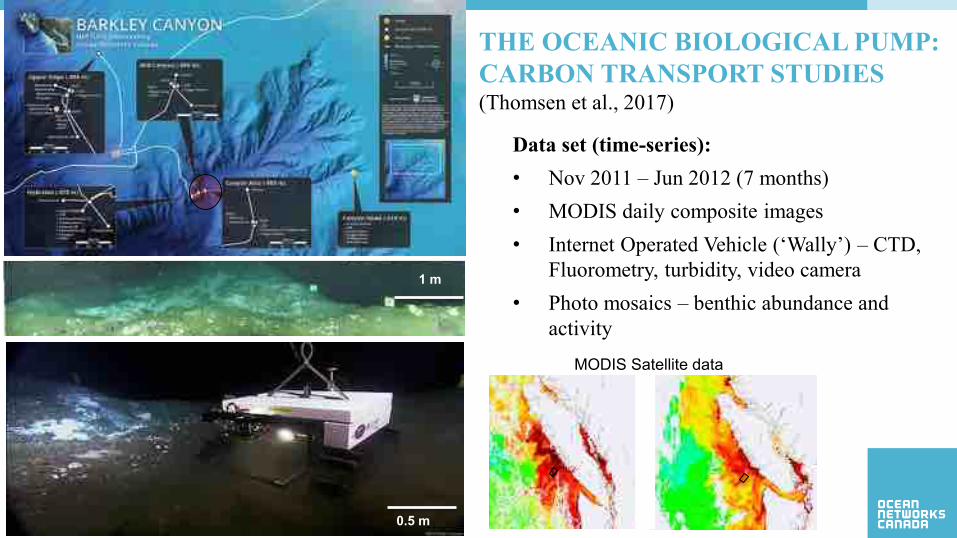
THE OCEANIC BIOLOGICAL PUMP: CARBON TRANSPORT STUDIES(Thomsen et al., 2017)
Data set (time-series): • Nov 2011 – Jun 2012 (7 months)• MODIS daily composite images• Internet Operated Vehicle (‘Wally’) – CTD,
Fluorometry, turbidity, video camera• Photo mosaics – benthic abundance and
activity
1 m
0.5 m
MODIS Satellite data

THE OCEANIC BIOLOGICAL PUMP: CARBON TRANSPORT STUDIES(Thomsen et al., 2017
• Transfer of CO2 to Particulate Organic Carbon• Exported carbon from winter blooms arrived with
a 1-3 days lag at the seafloor;• Comparable chlorophyll signals at BBL to spring
conditions;• Significant response by benthic megafauna:
increase in abundance and activity: feeding and movement
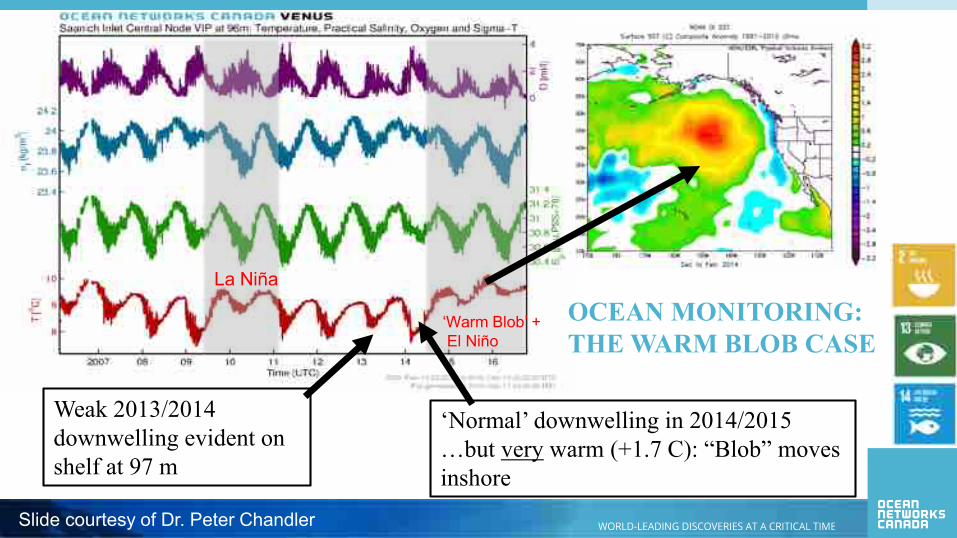
La Niña
‘Warm Blob’ +El Niño
Weak 2013/2014 downwelling evident on shelf at 97 m
‘Normal’ downwelling in 2014/2015 …but very warm (+1.7 C): “Blob” moves inshore
OCEAN MONITORING: THE WARM BLOB CASE
Slide courtesy of Dr. Peter Chandler
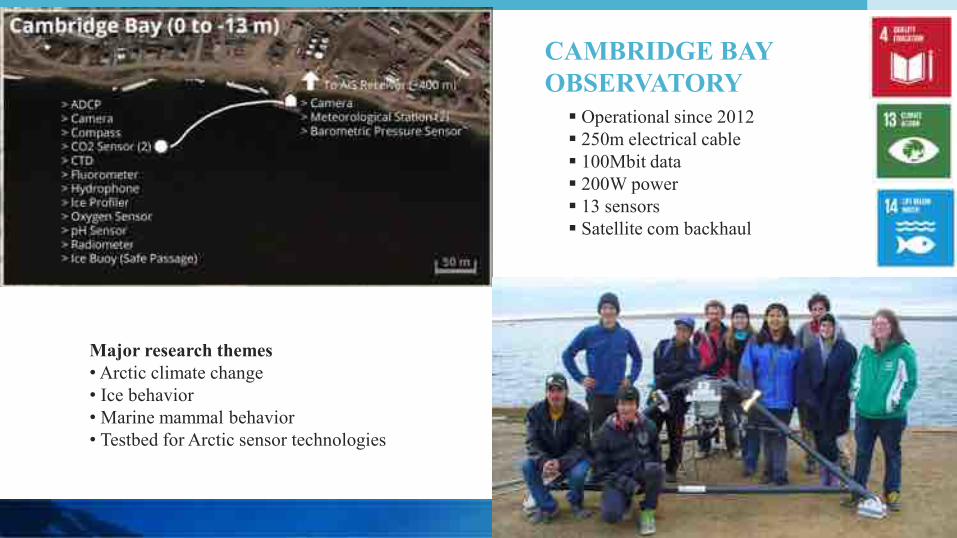
CAMBRIDGE BAY OBSERVATORY
� Operational since 2012� 250m electrical cable� 100Mbit data� 200W power � 13 sensors� Satellite com backhaul
Major research themes• Arctic climate change• Ice behavior• Marine mammal behavior• Testbed for Arctic sensor technologies

CAMBRIDGE BAY COMUNITY OBSERVATORY
Goal 2: Food securityGoal 14: Ocean sustainability
MULTI-HAZARD EARLY WARNING AND DISASTER RISK REDUCTION

GEODESY STUDIESNorthern Cascadia Subduction Zone Observatory
(Wang and Tréhu, 2016)
GPS measurements on land do not provide sufficient constraints for offshore locking pattern!

GEODESY STUDIESNorthern Cascadia Subduction Zone Observatory
1,2 monitor the movement of the incoming plate.
3-7 monitor deformation of the slope which will allow to constrain which locking pattern is real.
GPS-Acoustic method can determine the position of transponders on the seafloor.
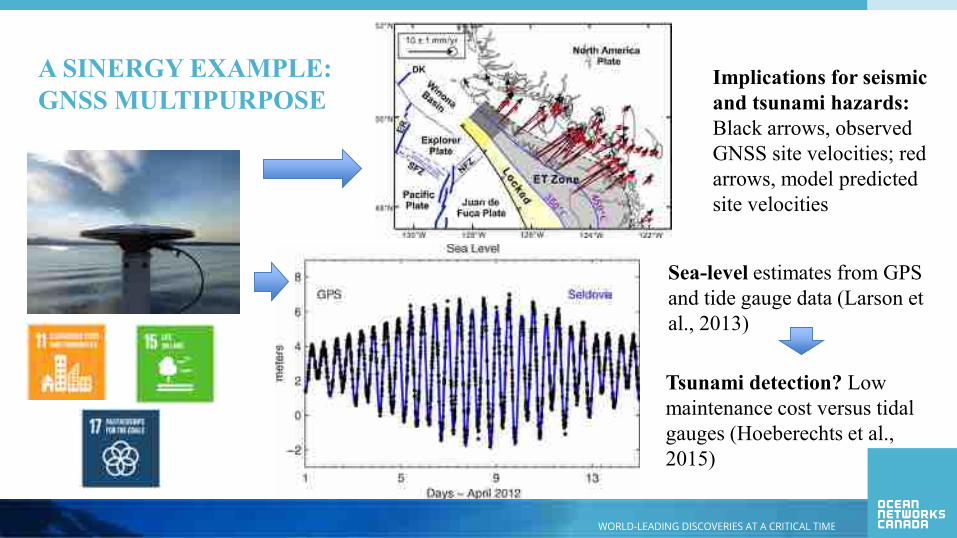
A SINERGY EXAMPLE: GNSS MULTIPURPOSE
Sea-level estimates from GPS and tide gauge data (Larson et al., 2013)
Implications for seismic and tsunami hazards:Black arrows, observed GNSS site velocities; red arrows, model predicted site velocities
Tsunami detection? Low maintenance cost versus tidal gauges (Hoeberechts et al., 2015)

VIRTUAL REALITY: EMERGENCY OPERATION CENTRESubhead could go in this style
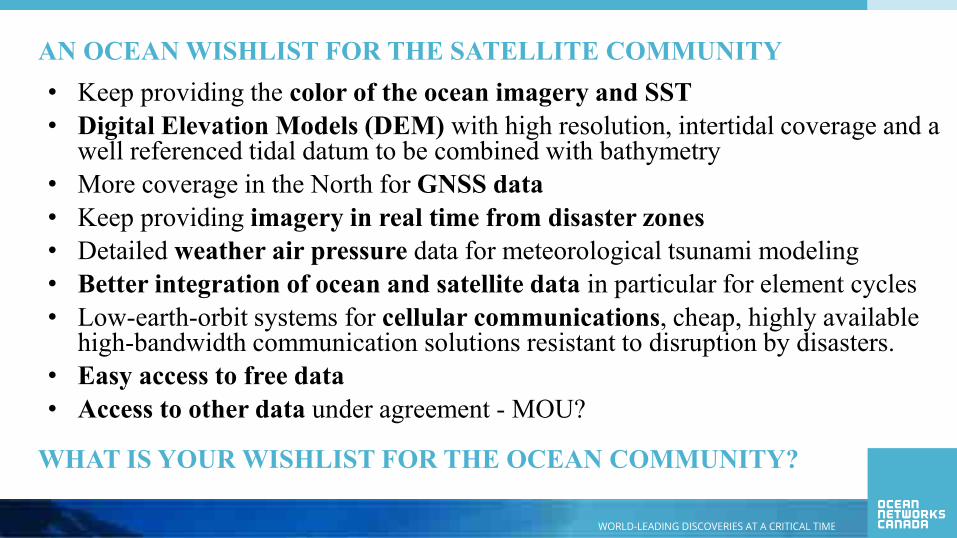
AN OCEAN WISHLIST FOR THE SATELLITE COMMUNITY• Keep providing the color of the ocean imagery and SST• Digital Elevation Models (DEM) with high resolution, intertidal coverage and a
well referenced tidal datum to be combined with bathymetry• More coverage in the North for GNSS data• Keep providing imagery in real time from disaster zones• Detailed weather air pressure data for meteorological tsunami modeling • Better integration of ocean and satellite data in particular for element cycles• Low-earth-orbit systems for cellular communications, cheap, highly available
high-bandwidth communication solutions resistant to disruption by disasters.• Easy access to free data • Access to other data under agreement - MOU?
WHAT IS YOUR WISHLIST FOR THE OCEAN COMMUNITY?


SMART OCEAN SYSTEMSTM
Smart Ocean SystemsTM are designed to detect, analyze and alert about natural hazards and anthropogenic events
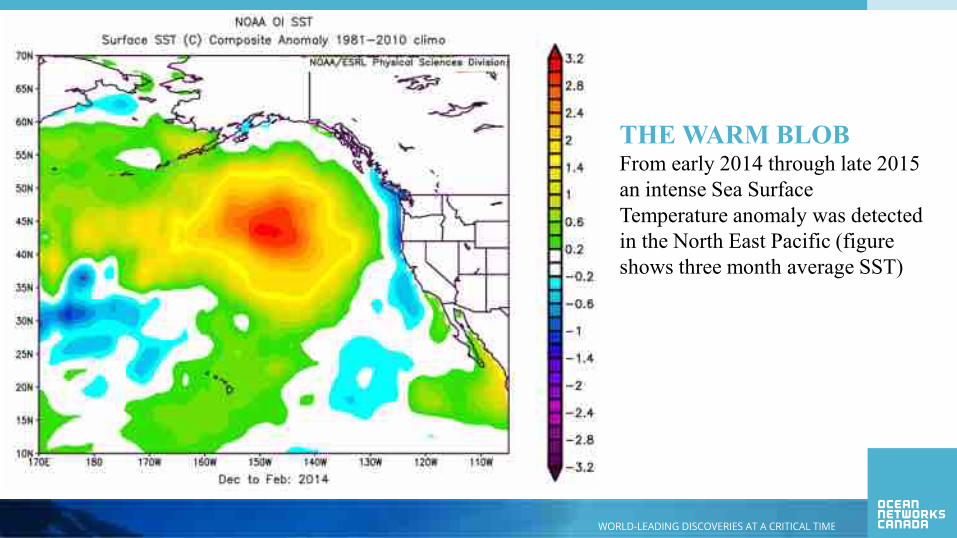
THE WARM BLOBFrom early 2014 through late 2015 an intense Sea Surface Temperature anomaly was detected in the North East Pacific (figure shows three month average SST)
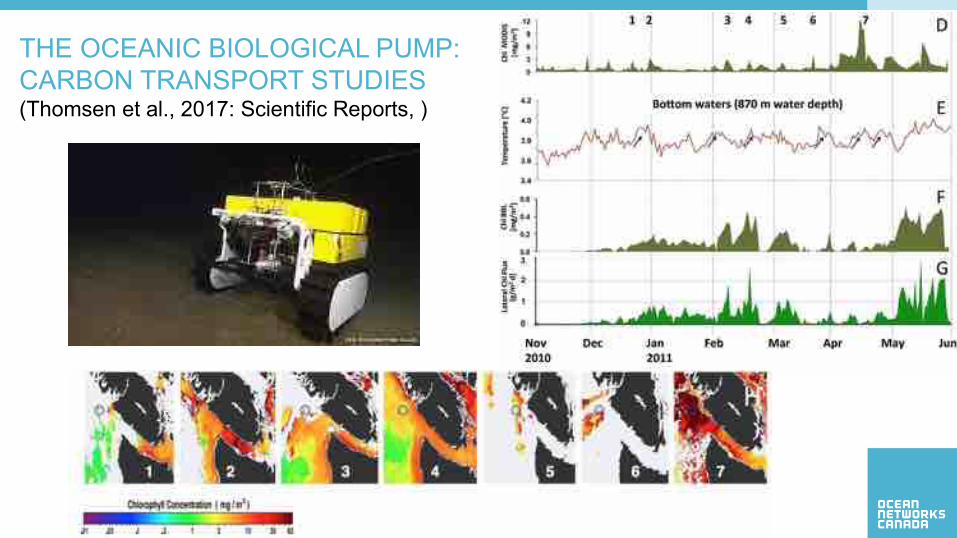
THE OCEANIC BIOLOGICAL PUMP: CARBON TRANSPORT STUDIES(Thomsen et al., 2017: Scientific Reports, )

GEODESY STUDIESNorthern Cascadia Subduction Zone Observatory
GPS-Acoustic method can determine the position of transponders on the seafloor.