Embed Size (px)
Citation preview
University of Massachusetts AmherstScholarWorks@UMass AmherstEnvironmental & Water Resources EngineeringMasters Projects Civil and Environmental Engineering
Fall 12-2016
The Role of Nitrification and Denitrification inSuccessful Cultivation of Oxygenic Photogranulesfor Wastewater TreatmentKristie Stauch-White
Follow this and additional works at: https://scholarworks.umass.edu/cee_ewre
Part of the Environmental Engineering Commons
This Article is brought to you for free and open access by the Civil and Environmental Engineering at ScholarWorks@UMass Amherst. It has beenaccepted for inclusion in Environmental & Water Resources Engineering Masters Projects by an authorized administrator of ScholarWorks@UMassAmherst. For more information, please contact [email protected].
Stauch-White, Kristie, "The Role of Nitrification and Denitrification in Successful Cultivation of Oxygenic Photogranules forWastewater Treatment" (2016). Environmental & Water Resources Engineering Masters Projects. 81.https://doi.org/10.7275/jtgm-8668
TheRoleofNitrificationandDenitrificationinSuccessfulCultivationofOxygenic
PhotogranulesforWastewaterTreatment
AMastersProjectPresented
By
KristieStauch-White
SubmittedtotheGraduateSchooloftheUniversityofMassachusettsinpartial
fulfillmentoftherequirementsforthedegreeof
MastersofScienceinEnvironmentalEngineering
December2016
CivilandEnvironmentalEngineeringDepartment


iii
Acknowledgements
I’d like to thank my advisor, Dr. Caitlyn Butler, for her support throughout my non-traditional
Ph.D/Master’s experience, both academically and as a woman in STEM. I’d also like to thank Dr. Chul
Park and Dr. David Reckhow for participating in my committee, investing the time to support my thesis
effort and give valuable feedback.
My ambitious class and research schedule would not have been possible without the generous
support of my husband, Michael. During my first year, he uncomplainingly took over almost all cooking,
shopping, cleaning and evening childcare duties. Additionally, he took our children to all their weekend
activities and on special outings to give me time to study and do lab work. In the years after that, although I
was able to participate in family activities more, he still shared in the brunt of household and family tasks.
Of course I have to acknowledge my children, who gave up the undivided attention of their
mother. I ask myself continually if it was all worth it. The answer came the other day when my daughter,
Frannie asked me if I was going to be president and if I went to school with Hilary Clinton.
Academic research skills and inspiration were shared with me generously by Kaoru Ikuma. With
her tireless support, I gained many of the microbiology and laboratory skills I needed to complete my
research. She additionally imparted a great deal of insight into critical thinking and bolstered my
confidence as a woman in STEM.
I would also like to acknowledge George Hamaoui who generously spent his time helping me
troubleshoot qPCR issues and advance my laboratory techniques. Of course, I’d also like to thank Dr.
Klaus Neusslein for generously allowing me to use equipment in his lab critical to the completion of my
DNA analysis.
Finally, I’d like to acknowledge the support of NSF, first through the NSF OPG program, and then
through the Graduate Research Fellowship program. I also received generous support from the University
of Massachusetts in the form of the Joseph L. Boscov Fellowship and the Raymond A Noga and Karen
Murphy Noga fellowships. Without these generous programs, my research would not have been possible.

iv
Abstract
Oxygenic photogranules (OPGs) are compact, spherical, self-immobilizing biofilms in the form of dense
aggregates of microorganisms with a predomination of filamentous cyanobacteria cultivated from photo-
illuminated activated sludge. In this study, aerobic and anaerobic nitrogen transformation processes
occurring simultaneously within OPGs, during both successful and unsuccessful cultivations, were
examined. Chemical analyses including ammonium, nitrate, and nitrite concentrations at the beginning and
periodically during OPG cultivations indicated nitrogen transformations occurring during successful
cultivations. Additionally, qPCR studies revealed that successful cultivations supported a greater relative
abundance of cyanobacteria, nitrifying, and denitrifying populations during the cultivation period.
Dissolved oxygen microprofiles within a successfully cultivated mature OPG exposed to light revealed
steep oxygen gradients that provide ecological niches for both nitrification and denitrification processes.
Although OPGs have been cultivated from a variety of wastewater sources worldwide, it is unclear what
parameters determine the success of granule growth from one cultivation to the next. In this study,
preliminary evidence supporting the necessity of a minimal initial nitrogen concentration was discovered.

v
TableofContentsAcknowledgements……………………………………………………………..………………………….iiiAbstract……………………………………………………………………………….………..……………….ivListofTables…………………………………………………………………….……………………………viListofFigures…………………………………………………………………….………………………….viiIntroduction…………………………………………………………….………….…………………………..1MethodsandMaterials………………………………………….…………….…………………………..5Results…………………………………………………………………..……………………………………….9Discussion………………………………………………………………………….…………………………15References………………………………….…………………………………………….…………………..18Appendix………………………………………………………………………………………………………21
vi
ListofTablesTable 1. Primers used in this study for PCR and qPCR analysis………………………………………..………7
Table 2. Primers used in this study for PCR with either no amplification detected or non-specific binding…....8
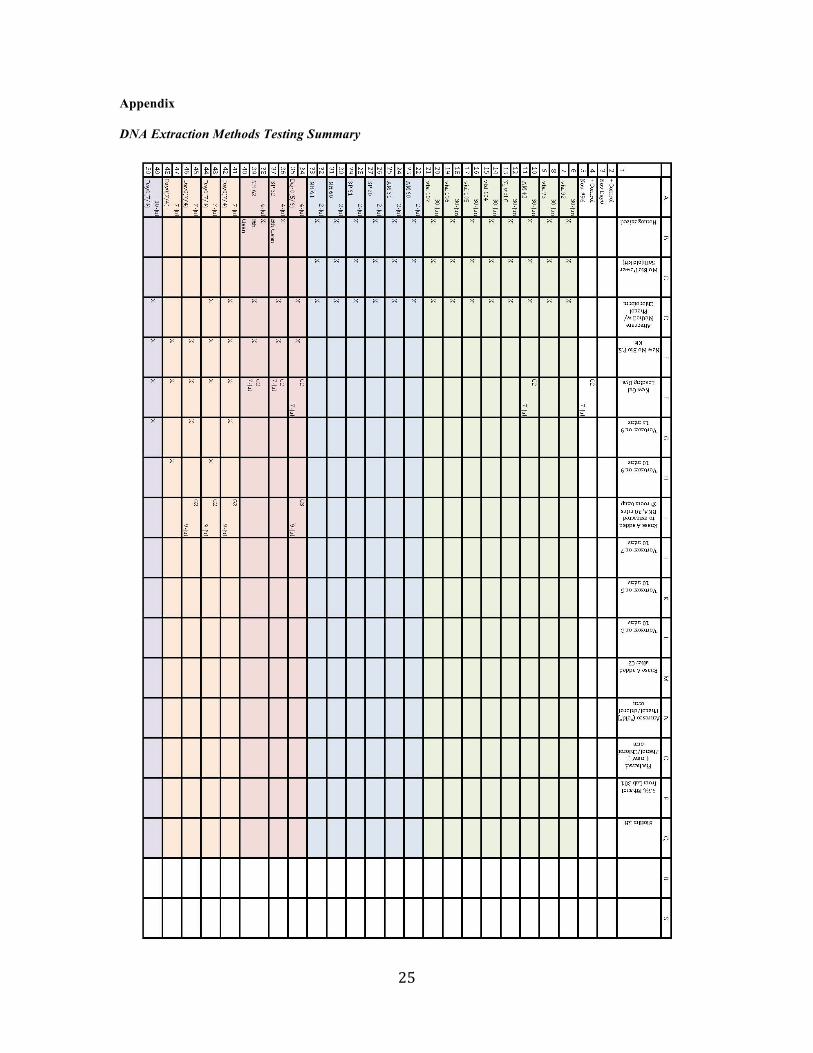
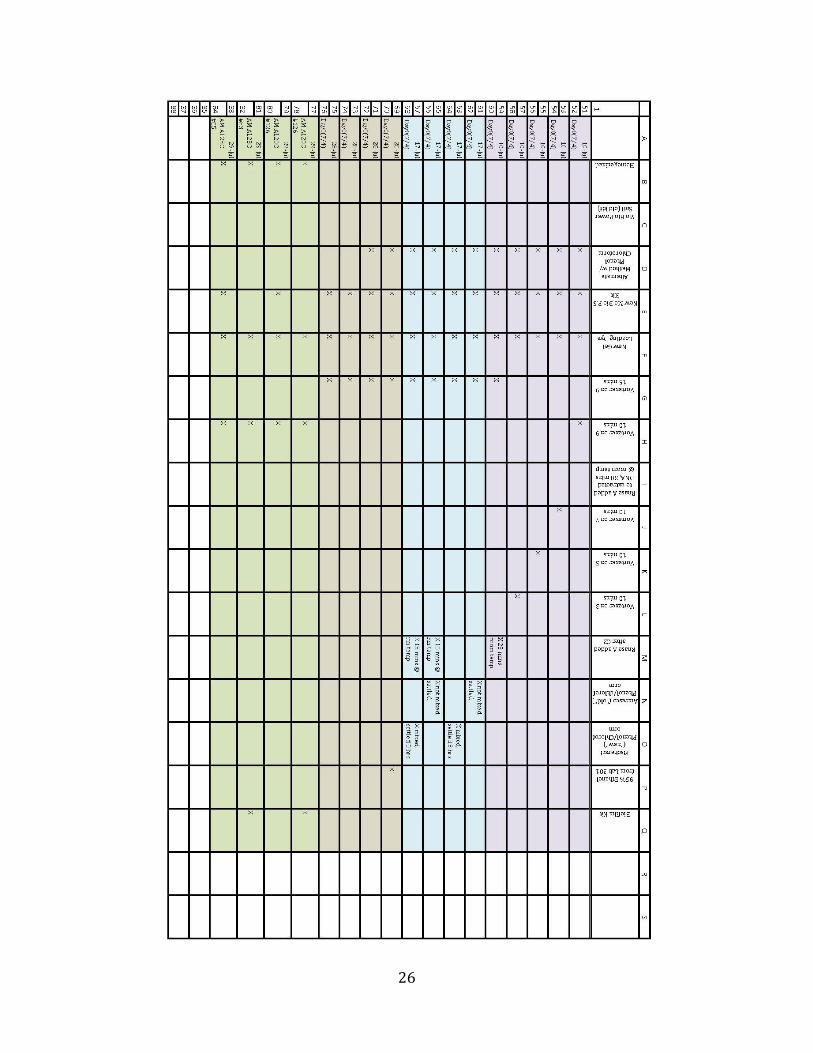
Table A.1. Summary of DNA extraction methods tested…………………………………………………..21, 22

vii
ListofFiguresFigure1.MagnifiedimageofOPGshowinginterwovencyanobacteriaaggregate.……………………………………………………………………………………….……..……………2Figure2.SuccessfulandunsuccessfulOPGcultivationspicturedwithshaketesttodemonstratedefinitionofsuccessfulandunsuccessfulgranuleproduction…..……….9Figure3.Concentrationsofnitrite,nitrateandammoniumalongwithpHvaluesduringthecourseofOPGcultivations…………………………………………………………………10Figure4.Initialconcentrationoftotalnitrogen,ammoniumandnitrateforfivecultivationsperformed,includingsuccessfulandunsuccessfuloutcomes……….........10Figure5.PhosphateconcentrationduringthecourseofOPGcultivations………….…11Figure6.ChlorophyllAconcentrationduringthecourseofanOPGcultivation.……11Figure7.a)CODconcentrationsoverthecourseofOPGcultivation,b)VSSoverthecourseofasuccessfulandanunsuccessfulcultivation…………………………..……....……12Figure8.DissolvedoxygenprofilewithrespecttodepthwithinanOPG…….…..……13Figure9.a)TherelativequantificationoftheamoAmarkergeneinasuccessfulvs.anunsuccessfulOPGcultivationwithrespectto16S;b)TherelativequantificationofthenarGmarkergeneinasuccessfulvs.anunsuccessfulOPGcultivation………….....14Figure10.TherelativequantificationoftheCYANmarkergeneinasuccessfulvs.anunsuccessfulOPGcultivationwithrespectto16S…………………………………………..........15Figure11.A)AnOPGslicedinhalftoshowstrataofalgaeandbacterialcommunitiescorrespondingtooxygenic,oxicandanoxicredoxzones,B)Amodeldepictingoxygenic,oxicandanoxicredoxzoneswithinOPG………………………………….………...…18
Introduction
Cyanobacterial aggregates form in many environmental conditions on earth and support extremely diverse
microcosms of both prokaryotic and eukaryotic life. Cyanobacteria themselves are an extremely diverse
phylum, exceedingly adaptive and are major contributors to global carbon, oxygen, and nitrogen cycling
(Tamulonis & Kaandorp, 2014), with Prochlorococcus alone contributing an estimated 4 gigatons of fixed
carbon each year (Biller, Berube, Lindell, & Chisholm, 2014). Diazatrophic cyanobacteria contribute
nitrogen by the fixation of dinitrogen in nitrogen-poor areas, such as in marine environments (Klawonn,
Bonaglia, Brüchert, & Ploug, 2015; Severin & Stal, 2010; J. M. Tuomainen, Hietanen, Kuparinen,
Martikainen, & Servomaa, 2003). In nitrogen-rich zones, cyanobacteria assimilate nitrogen in the form of
ammonium, nitrate, or nitrite and create biomass through growth, making them the base of aquatic food
webs at the primary level (Tamulonis & Kaandorp, 2014).
Microbial mats are a type of biofilm with dense communities of microorganisms with integral functional
relationships (Severin & Stal, 2010; Stal, 1995). The community members rely on each other for the
exchange of chemicals such as oxygen, carbon, and nitrogen species (Abed, 2010; Muro-Pastor, Reyes, &
Florencio, 2005; Stal, 1995). In some cases, the communities align themselves along strata corresponding
to their functional relationships (Stal, 1995). Within the ecological community, many different species,
phyla, and even kingdoms are essential to provide the genes necessary to perform the interconnected
biochemical community functions (Cary, Chishold, & National Science Foundation, 2000). Where
cyanobacteria are present and exposed to light, they serve to oxygenate their surroundings, Cyanobacteria
are also capable of metabolizing during dark periods by fermentation or glycogen metabolism via
glycolysis (Embden Meyerhof Pathway). Because of their facultative nature, cyanobacteria are able to exist
in multiple layers of a microbial mat, and move throughout the mats by gliding action. They are also known
to self-organize into stable population patterns (Tamulonis & Kaandorp, 2014), which may serve to
distribute metabolites between strata.
Microbial mats containing cyanobacteria form naturally in marine and freshwater environments and can be
expressed as spherical biofilm aggregates or granules. One type of cyanobacteria aggregate, cryoconite

2
granules, are spherical cyanobacterial biofilms found in glacial potholes (Takeuchi, Kohshima, & Seka,
2016). These aggregates are thought to form from nutrients found in dust, and from debris from birds
(Segawa et al., 2014; Takeuchi et al., 2016). Other types of nitrogen-fixing cyanobacterial aggregates
formed with algal and bacterial species are found ubiquitously in marine environments, often surrounding
fecal pellets (Klawonn et al., 2015; J. M. Tuomainen et al., 2003). Although it is unknown by what
mechanism cyanobacterial aggregates sustain strong granule-like formation, studies have pointed to the
stickiness of extracellular polymeric substances (Segawa et al., 2014; J. M. Tuomainen et al., 2003; Zarsky
et al., 2013), filament entanglement (Weber, Ludwig, Schleifer, & Fried, 2007), gliding actions that form
cohesive patterns (Tamulonis & Kaandorp, 2014), and gliding actions that serve as a defense against
extreme light conditions or predation by microbial grazers (Fiałkowska & Pajdak-Stós, 2002). It is likely
that the community benefit of simple opportunistic sharing of metabolites such as nitrogenous compounds
provides the basic mechanism for granule formation. Although little is known about the microbial
communities in marine aggregates and their syntrophic relationships, studies have shown limited
denitrification activities in these cyanobacterial mats and aggregates (J. Tuomainen, Hietanen, Kuparinen,
Martikainen, & Servomaa, 2006; J. M. Tuomainen et al., 2003). This finding is consistent with nitrogen
scarcity in the marine environment, incentivizing nitrogen fixation, an energetically expensive process.
Figure1.OPGat2Xmagnification.TheexteriorlayerofanOPGisdominatedbyaninterwovenweboffilamentouscyanobacteria.Extracellularpolymericsubstances(EPS)associatedwiththecyanobacteriacausesbacteriaandfloatingbiomasstosticktoit.
3
Oxygenic photogranules (OPGs) produced in the lab from photo-illuminated activated sludge resemble
spherical cyanobacterial aggregates found in nature. OPGs are dense, spherical, interwoven microbial
biofilms comprised of cyanobacteria and a host of heterotrophs, autotrophs, and algae as in Figure 1. Like
many microbial biofilms found in nature, they are striated with layers of communities and functions. Since
naturally-occurring microbial mats are able to sustain themselves during extreme environmental
fluctuations such as diurnal and seasonal changes and weather events, the capacity of the mat’s community
to adapt is critical. This is particularly important in a wastewater treatment setting, where working
microbial communities must be resilient during diurnal cycles, seasonal changes, and even extreme events
such as flooding, intermittent loading (such as seasonal/weekend residency), or overloading during times of
extreme increase of temporary residency. Both cyanobacteria and algae have extremely versatile
metabolisms allowing them to live and thrive in an ever-changing environment, syntrophically supporting
and being supported by the non-photosynthetic bacteria within the biofilm community. Additionally, their
density allows them to be easily separated from the waste stream, allowing a decoupling of liquid and solid
retention times, resulting in less costly, more efficient, lower volume wastewater treatment systems
(Abouhend, Park, Butler, & El-Moselhy, 2016; Liu, Sheng, & Yu, 2009; C. Park et al., 2016; Van
Loosdrecht & Brdjanovic, 2014)
OPG cultivations represent an excellent model system to understand granule evolution, with the intent of
developing an improved wastewater treatment approach. OPG wastewater treatment processes have been
proposed that are expected to improve energy efficiency of wastewater treatment by reducing requirements
for mechanical aeration. When used as a wastewater treatment option, OPGs remove organic nutrients
including COD and nitrogenous compounds without external aeration by supporting the symbiotic growth
of bacteria and algae (Abouhend et al., 2016; C. Park et al., 2016), saving 25-60% of the operating costs of
municipal wastewater treatment, representing a staggering 2-3% of the total annual U.S. energy
consumption (U.S. Environmental Protection Agency, 2010). Additionally, effective nitrogen removal
processes are now more needed than ever as nitrogenous constituents are becoming more stringently
regulated in wastewater. Ammonia and nitrate can cause serious health effects if they enter drinking water
and nitrogenous compounds have deleterious effects on the environment, especially in areas where excess

4
nitrogen stimulates excess plant growth leading to eutrophication. Full treatment of nitrogenous compounds
in wastewater includes conversion of ammonia to nitrate or nitrite via nitrification and the conversion of
nitrate and nitrite to nitrogen gas via denitrification. Denitrification is a process requiring several
intermediaries including nitric oxide and nitrous oxide. Nitrous oxide is a greenhouse gas approximately
300 times more potent than carbon dioxide (IPCC, Climate Change 2001; The Scientific Basis; Cambridge
University Press, 2001). Therefore, it is important that nitrogen compounds in any proposed wastewater
treatment process complete the nitrogen cycle, converting ammonia fully to nitrogen gas.
To engineer OPG granules for wastewater treatment, it is key to understand their symbiotic functionality,
versatility, and resilience. In contrast to aggregates found in nature, OPGs produced in our lab originate
from wastewater rich in nitrogen relative to the marine environment. Nitrogen transformations during
granule cultivation and within the granule’s diverse community is believed to be integral to successful
granule growth. It is hypothesized that OPGs contain zones of oxygen super-saturation, saturation, anoxic
and oxygen minimum zones (OMZ), much like microbial biofilms, particularly during changing light
availability during diurnal cycles. This is significant since “hot spots” of nitrogen transformation occur at
oxic-anoxic interfaces (Wright, Konwar, & Hallam, 2012). Critical to our investigation of the cultivation
process is the understanding of such factors leading to successful granule growth. The contribution of the
initial nitrogen content of the activated sludge growth medium may be an integral factor, as it is
hypothesized that nitrification and denitrification processes are active during a successful cultivation. The
focus of this study is the analysis of physiological, microscopic, chemical, and biological constraints
contributing to the occurrence of nitrogen transformation during granule cultivation.

5
Materials and Methods
Cultivation
Activated sludge from the Amherst Wastewater Treatment Plant in Amherst, Massachusetts was collected
and 10 mL aliquots were pipetted into 20 mL scintillation vials and capped, leaving head space. Vials were
kept in static conditions, illuminated under broadband fluorescent lights at approximately 10 klux, 24 hours
per day at room temperature. Sampling was done roughly every two days during the first two weeks, and
then weekly for 42 days. At day 42 the cultivation was considered complete and a final sample collection
was performed. To determine the success of granulation (>50% of vials yielded a granule), a shake test was
performed on the remaining vials by using three firm vertical shakes and then observing the vial contents
(Figure 2). When a granule remained intact with little to no cloud of particulates in the bulk liquid,
granulation was determined to be successful (Figure 2). Five cultivations were performed over the period of
one year. Each cultivation consisted of 200 to 300 vials to allow for the destructive sampling of 2-3 vials
for each analysis at each sampling point.
Microscopy
Microscopy was performed on an EVOS FL Color AMEFC 4300 light microscope by sectioning granules
in a petri dish with a razor blade and then placing sampled sections on a microscope slide. At least 3
selections from each section were inspected, from at least 2 sampled vials during cultivation in which
microscopy was performed. Photos of communities were taking at 2X, 40X, and 100X magnification in
multiple locations for each sample.
Chemical Analysis
Nitrate, nitrite, phosphate, chloride, sulfate, and ammonium were measured by ion chromatography on a
Metrohm chromatograph following 0.2 µm filtration with an acetate fiber filter. Ammonium, total and
soluble nitrogen and COD were measured using Hach kits (Hach, Loveland, CO, USA), per standard
methods 10023, 10071, 8000. Chlorophyll, TSS and VSS were measured using standard methods 10020,
208E (APHA, 2005). pH was measured using a Fisher-Scientific probe.
6
Microprofiling was done on two randomly selected vials for each sampling period using a Unisense clark-
type dissolved oxygen microsensor with a 0.1 or a 0.25 µm tip and with a Unisense clark-type nitrous oxide
microsensor with a 0.1 µm tip. Measurements were taken every 50 - 100 µm in the bulk liquid to
approximately 1 cm depth. Measurements were taken in light conditions with nitrogen gas blown over the
surface of the bulk liquid during measurements to prevent falsely elevated dissolved oxygen readings.
DNA Extraction
DNA extraction testing was performed using 16 different methods (Table A.1), to determine optimal
extraction protocol. Results suggested that each method resulted in some downstream bias. From the results
of these tests, the MoBio PowerSoil DNA kit was chosen, using the manufacturer’s protocol, except with
only 0.8g of granule biomass rather than the prescribed 0.25g, for consistency and repeatability. Total
microbial DNA was extracted using a MoBio PowerSoil DNA Extraction kit following kit instructions.
DNA was extracted from 3 vials on each sampling day, using 0.08g of granule biomass following 10 s
homogenization (IKA T18 basic ULTRA-TURRAX homogenizer) and dewatering by centrifuge and
pipette. DNA quantity and quality was determined by Nanodrop, and was between 5 and 50 ng/µL.
PCR and quantitative PCR
Functional marker gene analyses were performed on either an Applied Biosystems Step One or an MJ
Research quantitative PCR system. qPCR reactions were done in 25 µL reactions using 12.5 µL iTaq 2X
Universal SYBR Green Supermix, 0.2 µM each forward and reverse primers and 10 ng template DNA.
Real-time amplification was performed at 95oC for 10 mins. followed by 40 cycles consisting of 95oC for
15 seconds, 55oC for 1 min., and 72oC for 30 sec., followed by 30 s at 55oC and a +0.3oC ramp up every
15s to 95oC to determine the melting curve for amoA. The same protocol was followed for each of the
target genes in Tables 1 and 2, except with the appropriate the annealing temperature listed for each primer.
All samples were tested in triplicate and for two different vials per sampling date. All primers tested and
used in this study are listed in Tables 1 and 2 with the annealing temperature used and the product length.

7
qPCR data was analyzed using the Pfaffl method (Pfaffl, 2001; Schmittgen & Livak, 2008). Three copy
numbers per genome were assumed for narG (Kandeler, Deiglmayr, Tscherko, Bru, & Philippot, 2006).
Table 1. Primers used in this study for PCR and qPCR analysis. Target Gene
Target Description Primer Name Sequence (5’ – 3’) Anneal (oC)
Length (bp)
References
amoA Betaproteobacteria ammonia monoxygenase
amoA-1F amoA-2R
GGGGHTTYTACTGGTGGT CCCCTCKGSAAAGCCTTCTTC
52,55,58*
491
(Rotthauwe, Witzel, & Liesack, 1997; Segawa et al., 2014)
narG Nitrate reductase narG-F narG-R
TCGCCSATYCCGGCSATGTC GAGTTGTACCAGTCRGCSGAYTCSG
60 173 (Bru, Sarr, & Philippot, 2007)
CYAN Cyanobacteria CYAN 108F CYAN 377R
ACGGGTGAGTAACRCGTRA CCATGGCGGAAAATTCCC
52 269 (Martins & Vasconcelos, 2011; Urbach, Robertson, & Chisholm, 1992)
16S Universal 16S 1114 1275
CGGCAACGAGCGCAACCC CCATTGTAGCACGTGTGTAGCC
60 161 (Denman & McSweeney, 2006)
*When multiple annealing temperatures are listed, the last one is the one used in this study.

8
Table 2. Primers used in this study for PCR with either no amplification detected or non-specific binding. Target Gene
Target Description Primer Name Sequence (5’ – 3’) Anneal (oC)
Length (bp)
References
amoA Betaproteobacteria ammonia monoxygenase
19F A616r48x
GGWGTKCCRGGRACWGCMAC GCCATCCABCKRTANGTCCA
55,60 60 (Leininger et al., 2006; Schauss et al., 2009; Zarsky et al., 2013)
amoA Nitrosomona related ammonia monoxygenase
amoA-nitrosomo- SEGF amoA-nitrosomo-SEGR
CGTATCGATGCTGATGTTCTG GAAAGCGGTGCAATACAGTTT
60 60 (Segawa et al., 2014)
amoA Nitrosospira-related ammonia monooxygenase
amoA-nitrososp-SEGF amoA-nitrososp-SEGR
CCGATCAACTTCGTATTTCCW ARTGCCGTGATCATCCAGTT
60 94 (Segawa et al., 2014)
nirK Nitrite Reductase nirK-876 nirK-1040
ATYGGCGGVCAYGGCGA GCCTCGATCAGRTTRTGGTT
63 165 (Henry et al., 2004; Segawa et al., 2014)
nifH Cyanobacterial Nitrogenase
nifH-seg-1F nifH-seg-1R
CGYTGTTCMTCGACAGCCAG CCTGAGCCTTGGCGTGAA
52,57,60 85 (Segawa et al., 2014)
nifH Nitrogenase reductase nifHF nifHRc
AAAAGGYGGWATCGGYAARTCCACCAC TGGGCYTTGTTYTCRCGGATYGGCAT
57,62,67 400 (Rösch & Bothe, 2005)
narG Nitrate reductase narG 1960m2f narG 2050m2r
TAYGTSGGGCAGGARAAACTG CGTAGAAGAAGCTGGTGCTGTT
63 110 (López-Gutiérrez et al., 2004)
nosZ Nitrous oxide reductase nosZ-F nosZ-1622R
CGYTGTTCMTCGACAGCCAG CGYTGTTCMTCGACAGCCAG
60 453 (Kloos, Mergel, Rosch, & Bothe, 2001)
napA Nitrate reductase
V67F V67R
TAYTTYYTNHSNAARATHATGTAYGG DATNGGRTGCATYTCNGCCATRTT
60 414 (Smith, Nedwell, Dong, & Osborn, 2007)
napA Nitrate reductase
3F 4R
TGGACVATGGGYTTYAAYC ACYTCRCGHGCVGTRCCRCA
60 152 (Bru et al., 2007; Correa-Galeote et al., 2013; Smith et al., 2007)
nirS Nitrite reductase Cd3aF SR3cd
GT(C/G) AAC GT(C/G) AAG GA(A/G) AC(C/G) GG GASTTCGGRTGSGTCTTSAYGAA
58** 387-425 (Throbäck, Enwall, Jarvis, & Hallin, 2004)
nirS Nitrite reductase nirSCd3aF (mod) nirSR3CD
AACGYSAAGGARACSGG GASTTCGGRTGSGTCTTSAYGAA
58** 387-425 (Kandeler et al., 2006; Throbäck et al., 2004)
16S Universal 16S U519F E685R
CAGCMGCCGCGGTAATWC ATCTACGCATTTCACCGCTAC
51 166 (Baker, Smith, & Cowan, 2003; Wang & Qian, 2009)
nifH Cyanobacterial nitrogenase
nifH-seg-1F nifH-seg-1R
CGYTGTTCMTCGACAGCCAG CCTGAGCCTTGGCGTGAA
60 85 (Segawa et al., 2014)
** touchdown protocol from 58 to 63oC over 6 cycles

9
Results
Of the five cultivations performed, two successfully produced OPGs in over 50% of the vials within 42
days. OPGs produced were between 1 to 2 cm in diameter, consisting of a dense aggregate of
microorganisms resembling a multi-layered spherical agglomeration of filamentous cyanobacteria, algae,
and bacteria. Results for two cultivations, one successful (January 2016) and one unsuccessful (November
2015) are reported here as representative of the similarities and differences in trends seen overall between
cultivations.
Figure2.1)AsuccessfulOPGcultivationa)OnDay1,vialscontainfloatingbiomass,b)Theprogressiontowardsgranulationcanbeseenondays2,14,and42,c)Agranulecanbeseenintactbeforeandafter3vigorousshakes.2)AnunsuccessfulOPGcultivationonday1,2,14and42showsloosebiomasssettledonthebottomofthevial.Theshaketestrevealsthatevenagglomeratedbiomassonday42iseasilyshakenapart.

10
indicating nitrification activity. In unsuccessful cultivations, by contrast, the initial concentration of
ammonia was low (<1 mg-N/L) and no corresponding increases in nitrate concentration were observed.
This trend (higher initial ammonia and total nitrogen concentrations for cultivations that successfully
produce OPGs) appears to hold for all five cultivations performed, as can be seen in Figure 4.
Figure4.Totalinitialnitrogen,ammoniaandnitrateconcentrationsarereportedbycultivationdate.Starsindicatesuccessfulcultivationdates.
Figure3Concentrationsofnitrite,nitrateandammoniaaswellaspHvaluesduringthecourseofbothasuccessfulandanunsuccessfulcultivation.
11
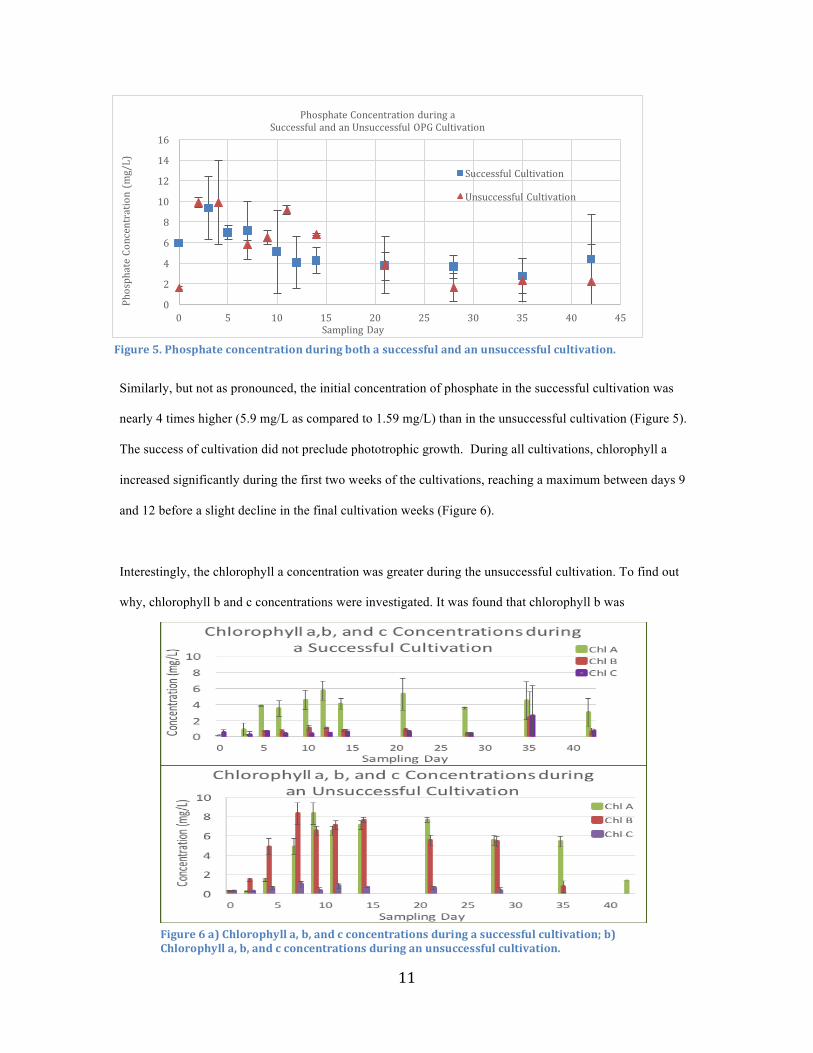
Similarly, but not as pronounced, the initial concentration of phosphate in the successful cultivation was
nearly 4 times higher (5.9 mg/L as compared to 1.59 mg/L) than in the unsuccessful cultivation (Figure 5).
The success of cultivation did not preclude phototrophic growth. During all cultivations, chlorophyll a
increased significantly during the first two weeks of the cultivations, reaching a maximum between days 9
and 12 before a slight decline in the final cultivation weeks (Figure 6).
Interestingly, the chlorophyll a concentration was greater during the unsuccessful cultivation. To find out
why, chlorophyll b and c concentrations were investigated. It was found that chlorophyll b was
0
2
4
6
8
10
12
14
16
0 5 10 15 20 25 30 35 40 45
PhosphateConcentration(mg/L)
SamplingDay
PhosphateConcentrationduringaSuccessfulandanUnsuccessfulOPGCultivation
SuccessfulCultivation
UnsuccessfulCultivation
Figure5.Phosphateconcentrationduringbothasuccessfulandanunsuccessfulcultivation.
Figure6a)Chlorophylla,b,andcconcentrationsduringasuccessfulcultivation;b)Chlorophylla,b,andcconcentrationsduringanunsuccessfulcultivation.

12
significantly greater during the unsuccessful cultivation. This indicates a greater abundance of chlorophyll
b producers such as algae, in the unsuccessful cultivation.Inthesuccessfulcultivation,thisisnotthe
case,indicatingagreaterabundanceofphototrophysthatproducechlorophyllabutnotchlorophyll
b,suchascyanobacteria.
In the successful cultivation performed in January, 2016, the total suspended solids (TSS) increased from
17.17 ± .3 g to 21.33 ± 1.2 g, an increase of 4.16 ± 1.5 g. Volatile suspended solids (VSS) increased from
14.86 ± .4 g to 18.1 ± .9 g, an increase of 3.24 ± 1.3 g over the course of the cultivation (Figure 7). This
represents an overall 26.8% increase in total and a 21.8% increase in volatile suspended solids seen during
the successful cultivation. In unsuccessful cultivations, on the other hand, an overall decrease in both TSS
and VSS were observed, in one case equaling a decrease from 22.4 ± 0 g to 18.75 ± 1.6 g, an overall
decrease of 3.65 ± 1.6 g, and a VSS decrease from 19.05 ± 0.2 g to 16.75 ± 1.6 g, an overall decrease of 2.3
± 1.6 g, a 16.3% decrease in total and a 12.1% decrease in volatile suspended solids. This indicates overall
assimilatory metabolic processes in the successful cultivation, such as through carbon fixation during
photosynthesis, that is greater than mass loss through the conversion of nitrogenous compounds to
dinitrogen gas and other similar metabolic processes resulting in gas production, such as fermentation and
0
5
10
15
20
25
0 5 10 15 20 25 30 35 40 45
Mass(g)
SamplingDay
VSSinaSuccessfulandanUnsuccessfulOPGCultivation
Successful
Unsuccessful
0
100
200
300
400
0 5 10 15 20 25 30 35 40 45
COD(mg/L)
SamplingDay
SolubleCODinaSuccessfulandanUnsuccessfulCultivationSuccessful
Unsuccessful
Figure7.a)SolubleCODconcentrationsduringbothasuccessfulandanunsuccessfulcultivation,b)VolatileSuspendedSolids(VSS)duringbothasuccessfulandanunsuccessfulcultivation.
b)
a)

13
methanogenesis. Soluble COD increased for both cultivations (Figure 7), but the successful cultivation
shown reached a maximum at day 12 and then decreased while the unsuccessful cultivation realized a
gradual and continual increase during the entire cultivation period. The day 12 increase corresponds to a
steep decline in the phosphate concentrations during the first weeks of each cultivation. This indicates an
initial die-off as populations within the communities shift.
The potential for multiple microbial metabolisms was considered in a mature OPG (age = 42 days) by
measuring oxygen profiles with respect to depth into the granule. Oxic and anoxic zones were found
(Figure 8) in a mature cultivation granule, with the outermost, phototrophic layer of the OPG most
saturated, and a steep decline in saturation with increasing depth towards the center of the granule. This is
significant as it is commensurate with the presence of simultaneous nitrification and denitrification within a
single granule. While denitrifiers require a maximum DO concentration of 2 mg/L to perform
denitrification, nitrifiers are not tolerant of low DO concentrations, consuming approximately 4.6 g O2/g
NH4+-N transformed (Rittman & McCarty, 2001). Microprofiling investigation of the DO profile of the
loose biomass during an unsuccessful cultivation reveals generally constant DO concentrations circa 8.5
mg/L throughout the cultivation period once phototrophic communities develop (circa day 5-10), with
some local areas of increased oxygenation near clumps of concentrated biomass, but no anoxic zones,
Figure8.ArepresentativeexampleofaDOmicroprofiledepictingasaturatedzonejustinsidethesurfaceofthegranulewherelightpenetratesallowingforthegreatestamountphotosynthesistooccur.Asdepthincreases,lightpenetrationandthusphotosynthesisdecreases,andtheoxygenconcentrationcorrespondinglydecreases,eventuallytozero.
14
except perhaps in areas of densely settled biomass. We were unable to acquire DO profiles of settled
biomass due to danger of breaking the probe on the vial bottom. The bulk liquid was also tested for the
presence of nitrous oxide during granule development. These measurements remained below detectable
levels.
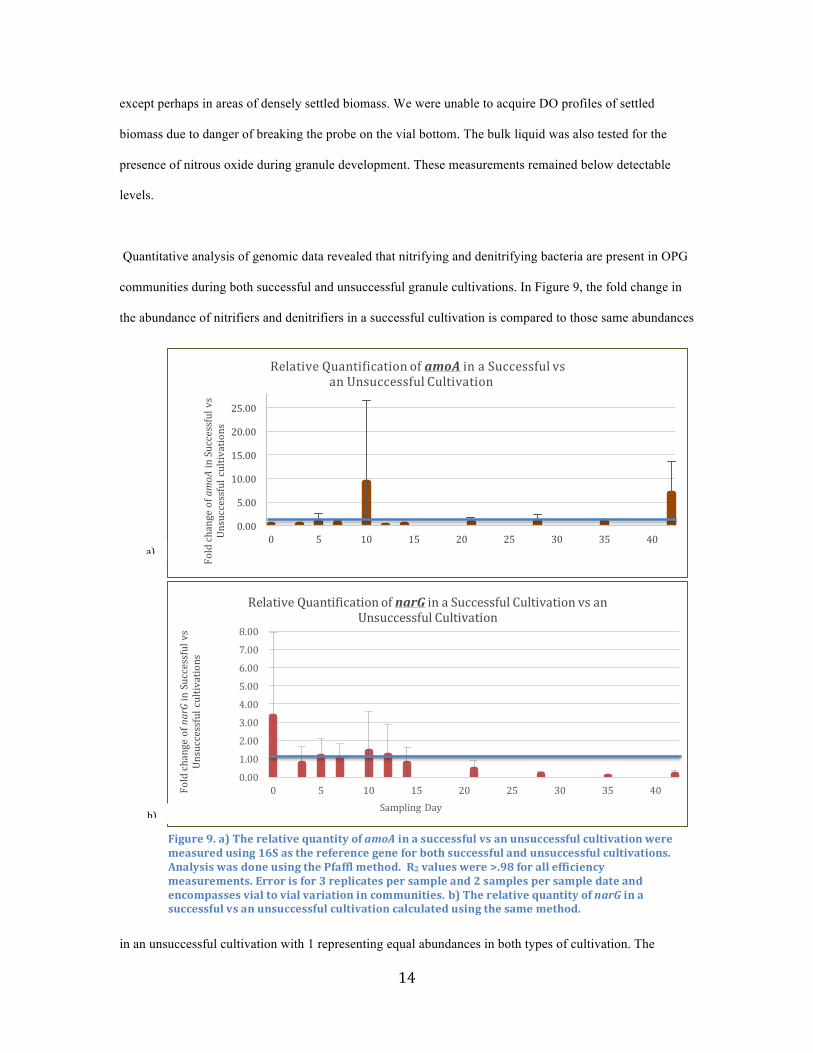
Quantitative analysis of genomic data revealed that nitrifying and denitrifying bacteria are present in OPG
communities during both successful and unsuccessful granule cultivations. In Figure 9, the fold change in
the abundance of nitrifiers and denitrifiers in a successful cultivation is compared to those same abundances
in an unsuccessful cultivation with 1 representing equal abundances in both types of cultivation. The
0.00
5.00
10.00
15.00
20.00
25.00
0 5 10 15 20 25 30 35 40
FoldchangeofamoA
inSuccessfulvs
Unsuccessfulcultivations
RelativeQuantificationofamoA inaSuccessfulvsanUnsuccessfulCultivation
0.00
1.00
2.00
3.00
4.00
5.00
6.00
7.00
8.00
0 5 10 15 20 25 30 35 40FoldchangeofnarGinSuccessfulvs
Unsuccessfulcultivations
SamplingDay
RelativeQuantificationofnarG inaSuccessfulCultivationvsanUnsuccessfulCultivation
Figure9.a)TherelativequantityofamoAinasuccessfulvsanunsuccessfulcultivationweremeasuredusing16Sasthereferencegeneforbothsuccessfulandunsuccessfulcultivations.AnalysiswasdoneusingthePfafflmethod.R2valueswere>.98forallefficiencymeasurements.Errorisfor3replicatespersampleand2samplespersampledateandencompassesvialtovialvariationincommunities.b)TherelativequantityofnarGinasuccessfulvsanunsuccessfulcultivationcalculatedusingthesamemethod.
a)
b)

15
community of nitrifiersare represented by the genomic marker amoA for Betaproteobacteria ammonia
monoxygenase, and was higher in the successful vs. the unsuccessful cultivation on day 10 with a >9 fold
copy number normalized to the 16S community (Figure 9a). This increase interestingly corresponded to a
peak in ammonia concentration around the same day. The initial population of denitrifiers, as represented
by the genomic marker for narG, nitrate reductase, is significantly greater (>3 fold) in the successful
cultivation relative to the unsuccessful cultivation (Figure 9b). This difference in abundance decreases
slightly throughout the cultivation period, with, again, an increase around day 10.
The cyanobacterial population follows a similar trend with a nearly 6 fold difference in abundance in the
successful over the unsuccessful cultivation on day 10 (Figure 10). This circa day 10 increase in
communities of nitrifiers, denitrifiers, and cyanobacteria in the successful cultivation corresponds to an
increase in ammonia, COD, and phosphate, also at or near that sampling date, and follows closely on an
increase in nitrate around day 7. A conformational change begins to take place during the successful
granulations around this time (Figure 2), as the biomass aggregates and begins to conform to a spherical
morphology (C. Park et al., 2016). Interestingly, chlorophyll a was greater in the unsuccessful cultivation
than it was in the successful cultivation, particularly on day 9 and later (Figure 6). This might indicate a
greater abundance of non-cyanobacterial chlorophyll a producers, such as green algae, supported by
0.00
1.00
2.00
3.00
4.00
5.00
6.00
7.00
8.00
0 3 5 7 10 12 14 21 28 35 42
FoldchangeofCYANinSuccessfulvs
Unsuccessfulcultivations
SamplingDay
RelativeQuantificationofCyanobacteriainaSuccessfulvsanUnsuccessfulCultivation
Figure10.TherelativequantityofCYANinasuccessfulvsanunsuccessfulcultivationweremeasuredusing16Sasthereferencegeneforbothsuccessfulandunsuccessfulcultivations.AnalysiswasdoneusingthePfafflmethod.R2valueswere>.98forallefficiencymeasurements.

16
chlorophyll b concentrations and further suggesting that a predominance of cyanobacteria contributes
greatly to the success of OPG formation.
The potential for nitrogen fixation was also investigated with two nitrogenase reductase (nifH) marker gene
primers, but with negative results, indicating either a lack of nitrogen fixation, or poor primer specificity.
This line of testing was not pursued further in this study, as the presence and capacity for nitrification and
denitrification are more critical to wastewater treatment.
17
Discussion
The symbiotic growth of oxygenic algae and bacteria are currently used to treat wastewater in some
wastewater treatment facilities in the U.S. and worldwide (J. Park, Craggs, & Shilton, 2011), but the
effectiveness of this practice is limited by poor settleability, which affects the ability to decouple biomass
and liquid retention times. Dense, spherical OPGs used to treat wastewater in the lab have been shown to
effectively remove organic nutrients including COD (Abouhend et al., 2016; C. Park et al., 2016).
Therefore, the use of OPGs may significantly advance the implementation of microalgae-based wastewater
treatment.
Oxygenic photogranules have been under investigation by the Park and Butler Labs at the University of
Massachusetts, Amherst since 2012 (C. Park et al., 2016). Since that time, many cultivations have been
successfully performed under a variety of conditions and from a variety of waste streams from around the
world (C. Park et al., 2016). In some cultivations, granulation occurs quickly and a majority of vials
produce granules, while in other cultivations, only disc-shaped sedimentation or loosely clumped algae-
based biomass forms. In successful cultivations, a common factor has been the presence of motile,
filamentous cyanobacteria such as Oscillatoria, Microcoleus, Pseudoanabaena, and Leptolyngbya (C. Park
et al., 2016). The described investigations involving chemical analyses, microsensing, and qPCR
population studies were undertaken in an attempt to link factors that might affect successful OPG
cultivation.
In all the described population studies involving genomics, such as qPCR studies, the first step is the
extraction of DNA. Challenges in making sure extracted DNA was representative of the source
communities and free of PCR inhibitors that would bias downstream population analysis results became
apparent. Initially a MoBio PowerSoil kit was used, according to the manufacturers protocol. Challenges
first presented themselves as PCR inhibitions in the form of poor PCR amplification efficiency, high
baselines indicating autofluorescence, non-linear dilution-amplification curves, and non-repeatability from
run to run. OPGs contain many potential PCR inhibitors such as humic acids, chlorophyll, and other

18
pigments. Many of these were persisting in the DNA solution even after inhibition removal steps during the
extraction process. Another challenge was finding unlysed algae and cyanobacteria cells in the extraction
pellet after the cell lysing stage of the process. In order to meet these challenges, sixteen protocols,
including variations on the original protocol, alternate extraction kits, and non-kit protocols were tried
(Table A.1). In the end, the best solution proved to be simply the use of the originally-tested MoBio
PowerSoil kit, modified to use a severely decreased mass of source material, 0.08g rather than the
prescribed 0.25g. This had the desired effect of increasing the stringency of the DNA lysing step and
decreasing the concentration of inhibitors present in the resulting eluted DNA solution.
Dissolved oxygen microsensor data indicates that the outer circumference of the photogranules are
supersaturated, but DO concentration drops rapidly with respect to depth (Figure 8). The outermost strata is
vibrant green, due to photosynthesis and the innermost layer, where light cannot penetrate, is black (Figure
11). These disparate environmental conditions provide ecological niches within the OPG biomass to
support diverse microbial community functions and symbiosis, including the potential to support both
nitrification and denitrification processes. While the genomic quantification of the nitrate reductase marker
gene, narG, tells us there are abundant denitrifiers present during successful cultivations and unsuccessful
Figure11a)AmaturecultivatedOPG,slicedinhalf.Strataofalgaeandbacterialayerscanbeseen.Thesecorrespondtomeasuredoxygenic,oxicandanoxicredoxzoneswithinthegranule.b)Amodeldepictingtheosygenic,oxic,andanoxiczoneswithinatypicalmatureOPG,aftercultivation.
a)
b)
19
cultivations, denitrifiers themselves are facultative and may not be transforming nitrate to nitrogen gas,
especially in the presence of oxygenic conditions. In successful cultivations, the presence of denitrifiers in
conjunction with the presence of anoxic redox zones within mature granules is a greater indicator of active
denitrification processes. Additional evidence of nitrate transformation is indicated by a decrease in nitrate
concentration.
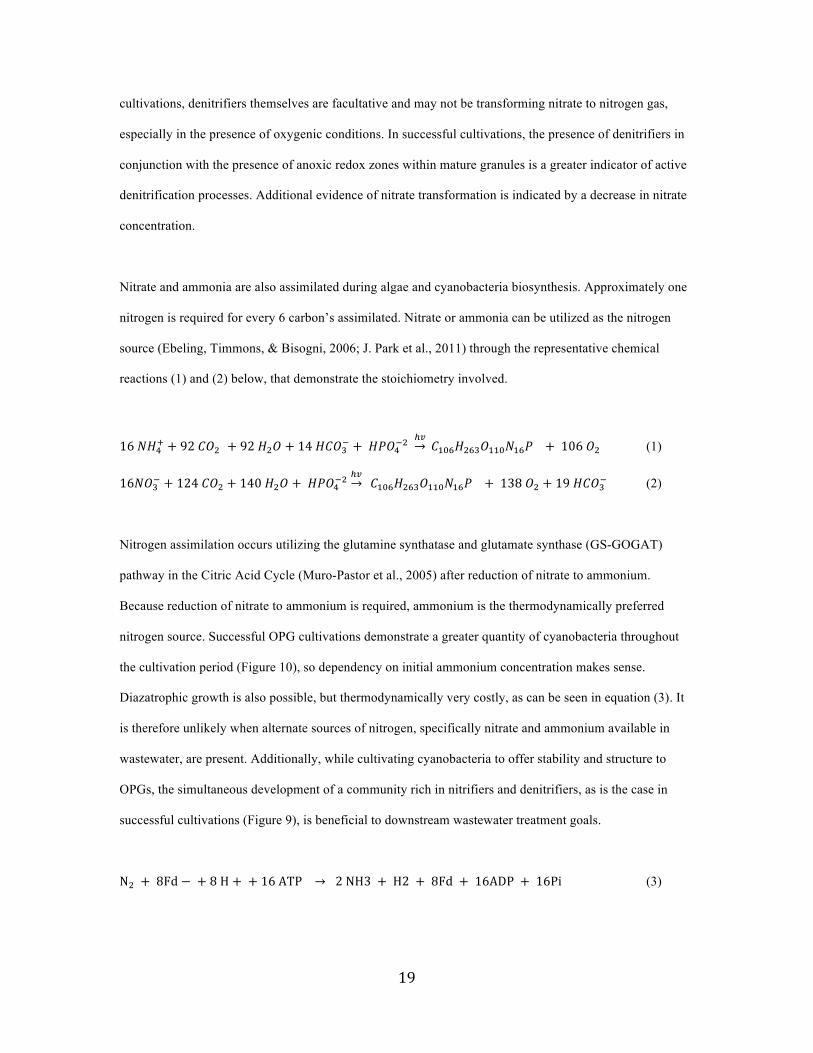
Nitrate and ammonia are also assimilated during algae and cyanobacteria biosynthesis. Approximately one
nitrogen is required for every 6 carbon’s assimilated. Nitrate or ammonia can be utilized as the nitrogen
source (Ebeling, Timmons, & Bisogni, 2006; J. Park et al., 2011) through the representative chemical
reactions (1) and (2) below, that demonstrate the stoichiometry involved.
16𝑁𝐻&' + 92𝐶𝑂- + 92𝐻-𝑂 + 14𝐻𝐶𝑂/0 +𝐻𝑃𝑂&0- 23𝐶456𝐻-6/𝑂445𝑁46𝑃 + 106𝑂- (1)
16𝑁𝑂/0 + 124𝐶𝑂- + 140𝐻-𝑂 +𝐻𝑃𝑂&0-23 𝐶456𝐻-6/𝑂445𝑁46𝑃 + 138𝑂- + 19𝐻𝐶𝑂/0 (2)
Nitrogen assimilation occurs utilizing the glutamine synthatase and glutamate synthase (GS-GOGAT)
pathway in the Citric Acid Cycle (Muro-Pastor et al., 2005) after reduction of nitrate to ammonium.
Because reduction of nitrate to ammonium is required, ammonium is the thermodynamically preferred
nitrogen source. Successful OPG cultivations demonstrate a greater quantity of cyanobacteria throughout
the cultivation period (Figure 10), so dependency on initial ammonium concentration makes sense.
Diazatrophic growth is also possible, but thermodynamically very costly, as can be seen in equation (3). It
is therefore unlikely when alternate sources of nitrogen, specifically nitrate and ammonium available in
wastewater, are present. Additionally, while cultivating cyanobacteria to offer stability and structure to
OPGs, the simultaneous development of a community rich in nitrifiers and denitrifiers, as is the case in
successful cultivations (Figure 9), is beneficial to downstream wastewater treatment goals.
N- + 8Fd −+8H ++16ATP → 2NH3 + H2 + 8Fd + 16ADP + 16Pi (3)

20
The successful cultivation and use of OPGs presents the possibility of a phototrophic granular sludge
process in which the multiple redox conditions allow for both nitrification and denitrification to occur
concurrently (Figures 8, 11). Granular wastewater treatment processes have become possible in recent
years through engineering the morphology of microbial communities. These granular processes offer the
potential to minimize energy requirements by offering multiple redox conditions within each granule and
thus eliminating the need for multiple treatment phases (Van Loosdrecht & Brdjanovic, 2014). Because
OPGs harness the energy of the sun to power the transformation of carbon dioxide into much-needed
oxygen, energy requirements are further minimalized.
In this study, the cultivation sets were designed to determine the contribution of initial nitrogen
concentration in source activated sludge and the subsequent nitrification and denitrification processes that
follow. This line of reasoning could suggest how to ensure cultivation success and to cultivate granules
with rich communities of nitrifying and denitrifying bacteria necessary for downstream wastewater
treatment goals. Furthermore, understanding the environmental conditions within the granules that favor
nitrification and denitrification, specifically oxic and anoxic redox zones, is necessary to conclude the
presence of these nitrogen transformations (Van Loosdrecht & Brdjanovic, 2014). Of the five cultivations
performed, initial nitrogen concentration strongly correlated with the success of OPG cultivation (Figure 4).
Additionally, a surge in nitrogen concentrations around day 10 corresponded with increases in COD,
chlorophyll a, and the populations of nitrifiers, denitrifiers and cyanobacteria during a successful
cultivation.
Of the five cultivations performed, initial nitrogen concentration was strongly correlated with the success of
OPG cultivation (Figure 4). Moreover, the presence of concurrent nitrification and denitrification processes
is supported by extant oxic and anoxic redox zones within successfully cultured mature granules as they
provide ecological niches for both of these processes (Figure 8). To further support the idea that successful
cultivations support greater nitrification and denitrification process, qPCR studies of the communities
within the granules was undertaken. It was found that there are abundant nitrifiers, denitrifiers and
cyanobacteria during successful cultivations (Figures 9, 10), with cyanobacteria being more abundant

21
during successful cultivations. While looking for evidence of nitrogen transformations during cultivations,
another interesting phenomena was observed to occur only during successful cultivations. A surge in
ammonia and nitrate concentrations around day 10 corresponded with increases in COD, chlorophyll a, and
the populations of nitrifiers, denitrifiers and cyanobacteria during a successful cultivation. Future research
should be aimed at understanding successful OPG cultivation requirements and maximization of bacterial
communities most helpful in wastewater treatment and should focus on finding the minimum and optimal
initial nitrogen conditions for granule formation.

22
References Abed, R. M. M. (2010). Interaction between cyanobacteria and aerobic heterotrophic bacteria in the
degradation of hydrocarbons. International Biodeterioration and Biodegradation, 64(1), 58–64. https://doi.org/10.1016/j.ibiod.2009.10.008
Abouhend, A., Park, C., Butler, C., & El-Moselhy, K. M. (2016). The Oxygenic Photogranule ( OPG ) for Aeration- Free and Energy - Recovery Wastewater Treatment Process. In WEFTEC (pp. 9–11).
APHA. (2005). Standard methods for the examination of water and wastewater (21st ed.). Washington D.C.: American Public Health Association, American Water Works Association, Water Environment Federation.
Baker, G. C., Smith, J. J., & Cowan, D. A. (2003). Review and re-analysis of domain-specific 16S primers. Journal of Microbiological Methods, 55(3), 541–555. https://doi.org/10.1016/j.mimet.2003.08.009
Biller, S. J., Berube, P. M., Lindell, D., & Chisholm, S. W. (2014). Prochlorococcus: the structure and function of collective diversity. Nature Reviews Microbiology, 13(1), 13–27. https://doi.org/10.1038/nrmicro3378
Bru, D., Sarr, A., & Philippot, L. (2007). Relative abundances of proteobacterial membrane-bound and periplasmic nitrate reductases in selected environments. Applied and Environmental Microbiology, 73(18), 5971–5974. https://doi.org/10.1128/AEM.00643-07
Cary, S. C., Chishold, S., & National Science Foundation. (2000). Workshop on Marine Microbial Genomics to Develop Recommendations for the National Science Foundation. Ecological genomics: the application of genomic sciences to understanding the structure and function of marine ecosystems. Arlington, Va: National Science Foundation.
Correa-Galeote, D., Marco, D. E., Tortosa, G., Bru, D., Philippot, L., & Bedmar, E. J. (2013). Spatial distribution of N-cycling microbial communities showed complex patterns in constructed wetland sediments. FEMS Microbiology Ecology, 83(2), 340–351. https://doi.org/10.1111/j.1574-6941.2012.01479.x
Denman, S. E., & McSweeney, C. S. (2006). Development of a real-time PCR assay for monitoring anaerobic fungal and cellulolytic bacterial populations within the rumen. FEMS Microbiology Ecology, 58(3), 572–582. https://doi.org/10.1111/j.1574-6941.2006.00190.x
Ebeling, J., Timmons, M., & Bisogni, J. (2006). Engineering analysis of the stoichiometry of photoautotrophic, autotrophic and heterotrophic removal of ammonia-nitrogen in aquaculture. Aquaculture, 257, 346–358.
Fiałkowska, E., & Pajdak-Stós, A. (2002). Dependence of cyanobacteria defense mode on grazer pressure. Aquatic Microbial Ecology, 27(2), 149–157. https://doi.org/10.3354/ame027149
Henry, S., Baudoin, E., López-Gutiérrez, J. C., Martin-Laurent, F., Brauman, A., & Philippot, L. (2004). Quantification of denitrifying bacteria in soils by nirK gene targeted real-time PCR. Journal of Microbiological Methods, 59(3), 327–335. https://doi.org/10.1016/j.mimet.2004.07.002
IPCC, Climate Change 2001; The Scientific Basis; Cambridge University Press. (2001). Cambridge. Kandeler, E., Deiglmayr, K., Tscherko, D., Bru, D., & Philippot, L. (2006). Abundance of narG, nirS, nirK,
and nosZ genes of denitrifying bacteria during primary successions of a glacier foreland. Applied and Environmental Microbiology, 72(9), 5957–5962. https://doi.org/10.1128/AEM.00439-06
Klawonn, I., Bonaglia, S., Brüchert, V., & Ploug, H. (2015). Aerobic and anaerobic nitrogen transformation processes in N2-fixing cyanobacterial aggregates. The ISME Journal, 1456–1466. https://doi.org/10.1038/ismej.2014.232
Kloos, K., Mergel, A., Rosch, C., & Bothe, H. (2001). Denitrification within the genus Azospirillum and other associative bacteria. International Journal, 28.
Leininger, S., Urich, T., Schloter, M., Schwark, L., Qi, J., Nicol, G. W., … Schleper, C. (2006). Archaea predominate among ammonia-oxidizing prokaryotes in soils. Nature, 442(August), 806–809. https://doi.org/10.1038/nature04983
Liu, X. W., Sheng, G. P., & Yu, H. Q. (2009). Physicochemical characteristics of microbial granules. Biotechnology Advances, 27(6), 1061–1070. https://doi.org/10.1016/j.biotechadv.2009.05.020
López-Gutiérrez, J. C., Henry, S., Hallet, S., Martin-Laurent, F., Catroux, G., & Philippot, L. (2004). Quantification of a novel group of nitrate-reducing bacteria in the environment by real-time PCR. Journal of Microbiological Methods, 57(3), 399–407. https://doi.org/10.1016/j.mimet.2004.02.009
Martins, A., & Vasconcelos, V. (2011). Use of qPCR for the study of hepatotoxic cyanobacteria population dynamics. Archives of Microbiology, 193(9), 615–627. https://doi.org/10.1007/s00203-011-0724-7
23
Muro-Pastor, M. I., Reyes, J. C., & Florencio, F. J. (2005). Ammonium assimilation in cyanobacteria. Photosynthesis Research, 83(2), 135–150. https://doi.org/10.1007/s11120-004-2082-7
Park, C., Kuo-Dahab, C., Butler, C., Milferstedt, K., Hamelin, J., Abouhend, A., … Dolan, S. (2016). Formation of oxygenic photogranules for energy efficient wastewater treatment. In Process.
Park, J., Craggs, R., & Shilton, A. (2011). Wastewater treatment high rate algal ponds for biofuel production. Bioresources Technology, 102, 35–42.
Pfaffl, M. W. (2001). A new mathematical model for relative quantification in real time RT-qPCR, 29(9), 16–21. https://doi.org/10.1093/nar/29.9.e45
Rittman, B., & McCarty, P. (2001). Environmental Biotechnology: Principles and Applications (1st ed.). New York, NY: McGraw-Hill.
Rösch, C., & Bothe, H. (2005). Improved Assessment of Denitrifying , N2 -Fixing , and Total-Community Bacteria by Terminal Restriction Fragment Length Polymorphism Analysis Using Multiple Restriction Enzymes. Applied and Environmental Microbiology, 71(4), 2026–2035. https://doi.org/10.1128/AEM.71.4.2026
Rotthauwe, J. J. H., Witzel, K. K. P., & Liesack, W. (1997). The Ammonia Monooxygenase Structural Gene amoA as a Functional Marker : Molecular Fine-Scale Analysis of Natural Ammonia-Oxidizing Populations. Applied and Environmental Microbiology, 63(12), 4704–4712. https://doi.org/10.1128/AEM.NA
Schauss, K., Focks, A., Leininger, S., Kotzerke, A., Heuer, H., Thiele-Bruhn, S., … Schleper, C. (2009). Dynamics and functional relevance of ammonia-oxidizing archaea in two agricultural soils. Environmental Microbiology, 11(2), 446–456. https://doi.org/10.1111/j.1462-2920.2008.01783.x
Schmittgen, T. D., & Livak, K. J. (2008). Analyzing real-time PCR data by the comparative CT method. Nature Protocols, 3(6), 1101–1108. https://doi.org/10.1038/nprot.2008.73
Segawa, T., Ishii, S., Ohte, N., Akiyoshi, A., Yamada, A., Maruyama, F., … Takeuchi, N. (2014). The nitrogen cycle in cryoconites: Naturally occurring nitrification-denitrification granules on a glacier. Environmental Microbiology, 16(10), 3250–3262. https://doi.org/10.1111/1462-2920.12543
Severin, I., & Stal, L. J. (2010). NifH expression by five groups of phototrophs compared with nitrogenase activity in coastal microbial mats. FEMS Microbiology Ecology, 73(1), 55–67. https://doi.org/10.1111/j.1574-6941.2010.00875.x
Smith, C. J., Nedwell, D. B., Dong, L. F., & Osborn, A. M. (2007). Diversity and abundance of nitrate reductase genes (narG and napA), nitrite reductase genes (nirS and nrfA), and their transcripts in estuarine sediments. Applied and Environmental Microbiology, 73(11), 3612–3622. https://doi.org/10.1128/AEM.02894-06
Stal, L. J. (1995). Physiological ecology of cyanobacteria in microbial mats. New Phytologist, 131, 1–32. Takeuchi, N., Kohshima, S., & Seka, K. (2016). Structure, formation and darkening process of albedo-
reducing material (Cryoconite) on a Himalayan glacier: A granular algal mat growing on the glacier. INSTARR, University of Colorado, 33(2), 115–122.
Tamulonis, C., & Kaandorp, J. (2014). A Model of Filamentous Cyanobacteria Leading to Reticulate Pattern Formation. Life, 4, 433–456. https://doi.org/10.3390/life4030433
Throbäck, I. N., Enwall, K., Jarvis, Å., & Hallin, S. (2004). Reassessing PCR primers targeting nirS, nirK and nosZ genes for community surveys of denitrifying bacteria with DGGE. FEMS Microbiology Ecology, 49(3), 401–417. https://doi.org/10.1016/j.femsec.2004.04.011
Tuomainen, J., Hietanen, S., Kuparinen, J., Martikainen, P. J., & Servomaa, K. (2006). Community structure of the bacteria associated with Nodularia sp. (cyanobacteria) aggregates in the Baltic Sea. Microbial Ecology, 52(3), 513–522. https://doi.org/10.1007/s00248-006-9130-0
Tuomainen, J. M., Hietanen, S., Kuparinen, J., Martikainen, P. J., & Servomaa, K. (2003). Baltic Sea cyanobacterial bloom contains denitrification and nitrification genes, but has negligible denitrification activity. FEMS Microbiology Ecology, 45(2), 83–96. https://doi.org/10.1016/S0168-6496(03)00131-4
U.S. Environmental Protection Agency. (2010). Evaluation of Energy Conservation Measures for Wastewater Treatment Facilities.
Urbach, E., Robertson, D., & Chisholm, S. (1992). Multiple evolutionary origins of prochlorophytes within the cyanobacterial radiation. Nature, 355, 242–244. https://doi.org/10.1038/355242a0
Van Loosdrecht, M. C. M., & Brdjanovic, D. (2014). Anticipating the next century of wastewater treatment. Science, 344(6191), 1452–1453. https://doi.org/10.1126/science.1255183
Wang, Y., & Qian, P. Y. (2009). Conservative fragments in bacterial 16S rRNA genes and primer design
24
for 16S ribosomal DNA amplicons in metagenomic studies. PLoS ONE, 4(10). https://doi.org/10.1371/journal.pone.0007401
Weber, S. D., Ludwig, W., Schleifer, K. H., & Fried, J. (2007). Microbial composition and structure of aerobic granular sewage biofilms. Applied and Environmental Microbiology, 73(19), 6233–6240. https://doi.org/10.1128/AEM.01002-07
Wright, J. J., Konwar, K. M., & Hallam, S. J. (2012). Microbial ecology of expanding oxygen minimum zones. Nature Reviews Microbiology, 10(6), 381–394. https://doi.org/10.1038/nrmicro2778
Zarsky, J. D., Stibal, M., Hodson, A., Sattler, B., Schostag, M., Hansen, L. H., … Psenner, R. (2013). Large cryoconite aggregates on a Svalbard glacier support a diverse microbial community including ammonia-oxidizing archaea. Environmental Research Letters, 8, 035044 (11pp). https://doi.org/10.1088/1748-9326/8/3/035044
25
Appendix
DNA Extraction Methods Testing Summary
26