Embed Size (px)
Citation preview

The Role of Monitoring Networksin the Management of the Nation'sAir Quality
National Science and Technology CouncilCommittee on Environment and Natural ResourcesAir Quality Research Subcommittee

Orderdinatevirtual”h andVice-
Agency
e androvingrch andage that
e andisinge ands andnd the
at
er theental
d policy,egy that
About the National Science and Technology Council
President Clinton established the National Science and Technology Council (NSTC) by Executiveon November 23, 1993. This cabinet-level council is the principal means for the President to coorscience, space, and technology policies across the Federal Government. The NSTC acts as a “agency for science and technology to coordinate the diverse parts of the Federal researcdevelopment enterprise. The NSTC is chaired by the President. Membership consists of thePresident, the Assistant to the President for Science and Technology, Cabinet Secretaries andHeads with significant science and technology responsibilities, and other White House officials.
An important objective of the NSTC is the establishment of clear national goals for Federal scienctechnology investments in areas ranging from information technology and health research, to imptransportation systems and strengthening fundamental research. The Council prepares reseadevelopment strategies that are coordinated across Federal agencies to form an investment packis aimed at accomplishing multiple national goals.
To obtain additional information regarding the NSTC, contact the NSTC Office of the ExecutiveSecretary at (202) 456-6100.On-line information is at http://www.whitehouse.gov/WH/EOP/OSTP/NSTC
About the Office of Science and Technology Policy
The Office of Science and Technology Policy (OSTP) was established by the National SciencTechnology Policy, Organization and Priorities Act of 1976. OSTP’s responsibilities include advthe President on policy formulation and budget development on all questions in which scienctechnology are important elements; articulating the President’s science and technology policieprograms; and fostering strong partnerships among Federal, State, and local governments, ascientific communities in industry and academia.
To obtain additional information regarding OSTP, please contact the OSTP Administrative Office (202) 395-7347.On-line information is at http://www.whitehouse.gov/OSTP
About the Committee on Environment and Natural Resources
The Committee on Environment and Natural Resources (CENR) is one of five committees undNSTC and is charged with improving coordination among Federal agencies involved in environmand natural resources research and development, establishing a strong link between science anand developing a Federal environment and natural resources research and development stratresponds to national and international issues.
To obtain additional information about the CENR, contact the CENR Executive Secretary at(202) 482-5181.On-line information is a http://www.nhic.noaa.gov/CENR/cenr.html


Committee on Environment and Natural Resources
D. James Baker, Co-ChairNational Oceanic and Atmospheric Administration
Rosina Bierbaum, Co-ChairOffice of Science and Technology Policy
Terrance FlanneryCentral Intelligence Agency
John LieberDepartment of Transportation
Kathleen McGintyCouncil on Environmental Quality
Lawrence Reiter (Acting)Environmental Protection Agency
Eileen KennedyDepartment of Agriculture
Craig WingoFederal Emergency Management Agency
Sherri GoodmanDepartment of Defense
Ghassem AsrarNational Aeronautics and Space Administration
Martha KrebsDepartment of Energy
Joseph BordognaNational Science Foundation
Kenneth OldenDepartment of Health and Human Services
Samuel WilliamsonOffice of the Coordinator for Meteorology
Mark SchaeferDepartment of the Interior
T.J. GlauthierOffice of Management and Budget
Roland DroitschDepartment of Labor
Thomas LovejoySmithsonian Institute
Melinda L. KimbleDepartment of State
Kathryn JacksonTennessee Valley Authority
Subcommittees
Air Quality ResearchMartha Krebs, DOE, ChairDan Albritton, NOAA, Vice ChairRobert Perciasepe, EPA, Vice Chair
Natural Disaster ReductionBill Hooke, NOAA, ChairJohn Filson, USGS, Vice ChairCraig Wingo, FEMA, Vice Chair
Ecological SystemsMark Schaefer, DOI, ChairMary Clutter, NSF, Vice ChairDonald Scavia, NOAA, Vice Chair
Toxics and RiskLynn Goldman, EPA, ChairKenneth Olden, NIEHS, Vice ChairAnna Johnson-Winegar, DOD, Vice Chair
Global Change ResearchRobert W. Corell, NSF, ChairGhassem Asrar, NASA, Vice ChairMike Dombeck, USDA, Vice Chair

1
Air Quality Research Subcommittee
Chair Martha Krebs, DOE
Vice Chair Daniel Albritton, NOAA
Vice Chair Robert Perciasepe, EPA
White House Liaison Frances Sharples, OSTP
MEMBER DEPARTMENTS AND AGENCIES
Department of Agriculture
Department of Energy
Department of Health and Human Services
Department of Housing and Urban Development
Department of State
Department of the Interior
Department of Transportation
Environmental Protection Agency
National Aeronautics and Space Administration
National Oceanic and Atmospheric Administration
National Science Foundation
Office of Management and Budget
Office of Science and Technology Policy
Tennessee Valley Authority

CONTENTS
CONTENTSIntroduction......................................................................................................1
Why monitor?...................................................................................................2
Current Air-Quality Monitoring Networks and the Pollutants Monitored.......3
IMPROVE.........................................................................................................4
SLAMS/NAMS..................................................................................................5
PAMS................................................................................................................6
NADP/NTN ......................................................................................................7
NADP/MDN .....................................................................................................8
CASTNet...........................................................................................................9
AIRMoN ...........................................................................................................10
Gaseous Pollutant Monitoring Program (GPMP) ...........................................11
How Important is the Current Monitoring Infrastructure in AddressingEmerging Issues?..........................................................................................12
The Role of the Committee on the Environment and Natural Resources,Air Quality Research Subcommittee .............................................................12

The Role of Monitoring Networksin the Management of the Nation’sAir Quality
National Science and Technology CouncilCommittee on Environment and Natural ResourcesAir Quality Research Subcommittee
y
das.
air
r
ald
d
INTRODUCTION
Nearly three decades ago, the country respondedto growing concerns over the quality of the air in theUnited States by adopting the landmark Clean Air Actin 1970. This Act established two types of national air-quality standards. Primary standards set limits toprotect public health, and secondary air quality stan-dards were set to protect public welfare, includingprotection against decreased visibility and damage toanimals, crops, vegetation, and buildings. In the mid-1970’s, there was growing awareness in the UnitedStates of the linkages found in Europe between airquality and impacts to aquatic and forest ecosystems.This awareness led to concern that atmospheric emis-sions and subsequent atmospheric deposition could becausing similar problems in the United States. In the1977 amendments to the Clean Air Act, Congress
established as a national goal the remediation of anexisting impairment in visibility resulting from airpollution in National Parks and Wilderness Areas anthe prevention of any future degradation in these are
The Clean Air Act Amendments of 1990(CAAA) built upon the original Act in initiating andexpanding programs to address acid rain and urbanpollution, and identified 189 "toxic" air pollutants forregulation. Air toxics are those pollutants that areknown or suspected to cause cancer, serious birth odevelopmental defects, or other adverse healthimpacts. The Amendments also established a nationpermits program to make the law more workable anan improved enforcement program to help ensurebetter compliance with the Act. The new law alsoencouraged the use of market-based principles andother innovative approaches, like performance-basestandards and emission banking and trading.
INTRODUCTION 1
PrevailingWinds
Photochemistry
Cloud Processes
Chemical Transformations
Fire
Ground Water
Drinking Water
AquaticEcosystem
CulturalResources
HumanHealth
Agricultural Products
Soils
Visibility
Lightning
Agriculture Industry
Wet DepositionDry
Deposition
Dispersion
VerticalMixing
Sources Transport / Transformation Removal
Effects
Forest Productivity
Transportation
Ocean
Air Pollution: Sources, Transport, Transformations, Removal, and Effects

l-t-
r-ir-
g
l
d
s,
ch-alae-
Why monitor?
“Air quality is the best it’s been in 30 years.”“Air quality in our wilderness areas is declining.”Conflicting headlines such as these and the oftenemotion-driven opinions that surround most environmental issues confound the emergence of a clearpicture of what is happening to the quality of the airwe breathe and depend on for a healthy environmenLong-term networks that monitor the levels of pollut-ants in the atmosphere provide important informatioto scientists and policymakers regarding the currentstatus of the chemical composition of and depositionfrom the atmosphere and how levels of pollutantsdiffer over time and space; these networks alsoprovide needed “hard data” for policy decisions.
Long-term changes in air quality and atmo-spheric deposition can be obscured by the large dayto-day, season-to-season, and year-to-year variationin winds, temperature, precipitation, and atmosphercirculation patterns that in turn affect dispersion, tranport, and deposition of pollution. In order to see thelarger picture, beyond these shorter term variations,is important to monitor for long periods of time, usingconsistent procedures and quality-assurance practicto observe long-term and significant changes in atmspheric composition.
Air-quality monitoring networks provide a vitalperformance measure to aid in determining and
2 The Role of Monitoring Networks in the Management of the Nation
-
t.
n
-s
ics-
it
eso-
reporting how effective current regulations are inimproving air quality as required under the Govern-ment Performance and Results Act (GPRA) andprovide the data needed to revise existing or promugate new regulations. For example, cumulative invesments in environmental controls by major UnitedStates power utilities are estimated at $63 billionthrough 1994, representing 12% of electric utilityplant investments. These costs are passed on to thepublic in the form of higher costs for energy, transpotation, and other goods and services. The Nation’s aquality monitoring networks provide the only nation-wide basis to determine if these actions are providinthe desired benefits, namely an improvement in airquality and a reduction in the adverse environmentaimpacts to our land and water resources from atmo-spheric deposition. Market-based incentives providein the CAAA, such as emission trading, banking ofemission reductions, and allowing industry to selectthe most cost-effective means for reducing emissionare revolutionary in nature. Proposals are underconsideration that would extend the use of these meanisms as an alternative approach to more traditionregulatory actions. The air-quality networks provide mechanism for determining the effectiveness of thesnew regulatory approaches in protecting the environment.
’s Air Quality

ric
re
es
CURRENT AIR-QUALITY MONITORINGNETWORKS AND THE POLLUTANTSMONITORED
Eight federally supported, national air-qualitymonitoring networks are operating currently in theUnited States. Other specialized regional and localresearch networks exist primarily to address local
CURRENT AIR-QUALITY MONI
NetworkLead Federal
agencyNumberof sites
IMPROVE NPS 108
SLAMS/NAMS EPA 3,200
PAMS EPA 83NADP/NTN USGS 215NADP/MDN None 36CASTNet EPA 80AIRMoN NOAA 23GPMP NPS 33
*Total funding approximately $0.6M, nearly all from State and
Air-qualitynetwork
VisibilityNitrogenspecies
Sulfurspecies
Lead
IMPROVE •SLAMS/NAMS** • • •PAMS •NADP/NTN*NADP/MDNCASTNet • • •AIRMoN • •GPMP •
*Atmospheric deposition constituents (SO4, NO3-N, NH4-N, Ca,**All pollutants are not monitored at each SLAMS/NAMS site
environmental issues. The following matrix relatesthe monitoring networks to the measured atmosphechemical constituents or properties. As many as10 chemical constituents in atmospheric deposition ameasured by the deposition networks. Each of theexisting networks described in this report utilizesextensive quality-assurance practices and procedurso that comparable data are available for detectingspatial and temporal trends in air quality.
TORING NETWORKS AND THE POLLUTANTS MONITORED 3
Estimated FY 99Federal funding
(millions $)
Nonfederalparticipation?
Initiated
$2.9 Yes 1987$114.0 Yes 1978
$12.1 Yes 1994$3.5 Yes 1978
* Yes 1996$4.5 No 1988$0.6 Yes 1984$1.5 Yes 1987
local sources.
Particulatematter
Carbonmonoxide
Ozoneand/or
precursors
Atmosphericdeposition
•• • •
•• wet
• wet mercury• • • dry & wet
• dry & wet•
Mg, Na, K, pH, specific conductance, and PO4)..

res
-.
d
ro-er
s-
IMPROVE
The Interagency Monitoring of Protected VisuaEnvironments (IMPROVE) is a collaborative moni-toring program to establish present visibility levels antrends and to identify sources of anthropogenicimpairment. The National Park Service and the U.SEnvironmental Protection Agency (USEPA) are thelead funding agencies for the IMPROVE Network.IMPROVE began with 20 long-term monitoringsites in 1987, and currently isexpanding to encompass108 sites in parks and wilder-ness areas across the Nation.The instrumentation and moni-toring protocols have beenadopted by organizations withcommon interests in air qualityand, as a result, additional sitesare operated by individualFederal, State, and local govern-ment agencies. Numerous addi-tional sites are operated in17 countries around the world.
Visibility is most oftenthought of in terms of visualrange or the farthest distance aperson can see a landscape feature. However, visibilis more than "how far" one can see; it also encom-passes visual contrast—a measure of how well scenlandscape features can be seen and appreciated. Vbility cannot be fully defined by a single parameter vimonitoring of only one atmospheric parameter. Rathethe objective of visibility monitoring is to understandthe effect that various types of particles, lightingconditions, and humidity have on the appearance ofscene. Therefore, the IMPROVE Network: (1) photographically documents the appearance of the scene
Figure 1. IMPR
4 The Role of Monitoring Networks in the Management of the Nation
l
d
.
ity
icisi-ar,
a-
under various levels of visibility, (2) optically recordsthe characteristics of the atmosphere, and (3) measuthe composition of visibility-reducing aerosols to helpidentify the source type and source strength of particles and gaseous precursors to secondary particlesOne of the principal purposes of the IMPROVENetwork is to gather enough data in order to identifysources of impairment on individual site, regional, annational scales.
When recent visibilitydata from monitoring networksare compared to estimates ofpre-industrial visibility, apicture emerges of “what we aremissing” due to impaired visi-bility. While the estimatednatural mean visibility in theWestern United States is 110–115 miles, the best current meanvisibility, at greater than 90miles, is found only in the innermountain West and Great Basinregions. Moving east or westfrom this area, the visibilitydecreases quite rapidly, toapproximately 10–20 milesalong the West Coast, and to
less than 10 miles in much of the Eastern UnitedStates. The estimated natural mean visibility in theEastern United States is 60–80 miles. Relativehumidity does not, by itself, cause visibility to bedegraded. Some particles, especially sulfates and aesols with polar organic constituents, accumulate watand grow to the size (0.3-µm to 0.7-µm diameter) thatis very efficient at scattering light. Poor visibility inthe Eastern United States during the summer monthis, in part, a result of the combination of high concentrations of these particles and high relative humidity.
OVE Network.
’s Air Quality
Additional information on the IMPROVE Networkis available via the Internet at
http://www2.nature.nps.gov/ard/vis/vishp.html

),
s
ze
AIR-QUALITY MONITORING AND HUMAN HEALTHNational Ambient Air Quality Standards (NAAQS) have been set for six air pollutants. Primary NAAQS are
designed to protect public health, and secondary NAAQS are designed to protect the public welfare such as ourcrops, visibility, and materials. In addition, indexes have been established for NAAQS pollutants, at graduatedlevels above the NAAQS, which describe differing degrees of alert or emergency that warrant different levels ofresponses, depending on daily pollution levels. At the time NAAQS are set, Federal Reference Methods areestablished for measuring air concentrations of the pollutant to determine changes in air quality and compli-ance with the standard. A network of roughly 5,000 air-monitoring sites distributed throughout the country andlocated primarily in and around high population centers is maintained to monitor NAAQS attainment. Thisnetwork consists of federally supported SLAMS (State and local air monitoring stations) and NAMS (NationalAir Monitoring Stations) as well as other State-supported Special Purpose Monitoring Stations (SPMS).
SLAMS/NAMS
Carbon monoxide (CO), lead, nitrogen dioxide(NO2), ozone, particulate matter (PM-10 and PM-2.5and sulfur dioxide (SO2) are monitored through theState and Local Air Monitoring Stations (SLAMS)and National Air Monitoring Stations (NAMS).Although most air-quality samples at SLAMS/NAMSsites are collected in urban areas where air quality iinfluenced primarily by local sources, some sites arelocated away from urban areas in order to characteriregional air quality.
nt
se,
-Figure 2. State and Local Air Monitoring Network.
Figure 3. National Air Monitoring Network.
The primary objectives of the SLAMS/NAMSNetwork are to:
• Judge compliance with ambient air-qualitystandards.
• Activate emergency control procedures that preveor alleviate air-pollution episodes.
• Observe pollution trends throughout the region,including nonurban areas.
• Provide a data base for research on urban, land-uand transportation planning; development andevaluation of abatement strategies; and development and validation of dispersion models.
SLAMS/NAMS 5

ns
hus,from
fir-lntrol
ofe
ac-and
g
ir-larlyla-s
Data from SLAMS/NAMS indicate air concen-trations of lead, CO, and SO2 have decreased signifi-cantly in the past 10 years, and emissions of all criterpollutants have shown improvement (decreased) asshown in the table below.
Additional information on the SLAMS/NAMSnetwork is available via the Internet at
http://www.epa.gov/oar/oaqps/qa/monprog.htmlData for each site in the network and the annual
trends report showing national and local air qualityare publicly available via the Internet at
http://www.epa.gov/airsdata/monitor.htmand http://www.epa.gov/oar/aqtrnd97/
The USEPA administers the SLAMS/NAMSnetworks.
Percent decrease in emissions and air concentrations(1986–1995), U.S. Environmental Protection AgencyNational Air Quality Status and Trends Report, 1995
Criteriapollutant
Percent decreasein emissions
Percent decreasein air concentrations
CO 16 37
Lead 32 78
NOx 3 14 (NO2)
Ozone -- 6
PM-10* 17 22
SO2 18 37*PM-10 measurements began in 1988.
6 The Role of Monitoring Networks in the Management of the Natio
ia
Additional information on PAMS is availablevia the Internet
at http://www.epa.gov/oar/oaqps/pams
Figure 4. Photochemical Assessment Monitoring Network.
PAMS
Photochemical Assessment Monitoring Statio(PAMS) measure ozone precursors (approximately60 volatile hydrocarbon and carbonyl compounds).The Clean Air Act requires a PAMS Network in eacozone nonattainment area that is designated seriosevere, or extreme. Each nonattainment area has two to five sites, depending on its population. Thecurrent PAMS Network has over 80 sites. The chieobjective of PAMS data collection is to provide an aquality data base that will assist air-pollution controagencies in assessing and, if necessary, refining costrategies for attaining the National Ambient AirQuality Standard for ozone. Ambient concentrationsozone and ozone precursors are measured to makattainment/nonattainment decisions, aid in trackingVOC and NOx emission inventory reductions, charterize the nature and extent of the ozone problem, identify air-quality trends. In addition, data fromPAMS provide an improved data base for evaluatinphotochemical model performance, especially forfuture control strategies as part of the continuing aquality management process. The data are particuuseful to States so that the most cost-effective regutory controls are implemented. The USEPA providefunding and oversight for the PAMS networks.
n’s Air Quality

I,
ain
f
es
ATMOSPHERIC DEPOSITION
The relation between air quality and the environmental impacts air pollutants have on land and waterresources is well recognized. The monitoring of wet and dry atmospheric deposition focuses attentionon the transfer of chemical substances from the atmosphere to terrestrial and aquatic ecosystems.Atmospheric deposition data furnish important information on chemical flux and are a performancemeasure for air-quality researchers and regulatory agencies. The same data provide essentialinformation for environmental studies by ecologists, foresters, hydrologists, and agricultural scientistsin assessing the influence of atmospheric inputs to the Earth’s surface.
NADP/NTN
Since 1978, when 18 sites were placed intooperation, the National Atmospheric DepositionProgram/National Trends Network (NADP/NTN) hasgrown and evolved. The network now provides a lonterm, high-quality data base that is useful for assessithe magnitude of the acid rain problem and for detemining spatial andtemporal trends inthe chemical compo-sition of the atmo-sphere and theremoval of atmo-spheric compoundsas deposition. TheNADP/NTNNetwork is the onlylong-term deposi-tion monitoringprogram in theUnited States withnational coverage.Today theNADP/NTN consistsof over 200 sites and iscooperatively funded and operated by over 100 orgazations, including 8 Federal agencies, State and locagencies, universities, and private industries. Thecombined funding supports program management, soperation and maintenance, chemical analysis, datamanagement, and quality assurance. The network hone of the longest multisite records of precipitationchemistry in the world and has maintained an effectivquality-assurance program throughout the years.
Figure 5. The NADP/NTN.
g-ngr-
ni-al
ite
as
e
Recently, an analysis of NADP/NTN data wasundertaken to examine the effects in 1995 of PhaseTitle IV of the Clean Air Act Amendments of 1990.The results indicate that Phase I has reduced acid rin the Eastern United States. Specifically,the analysis shows that, in the Northeastern UnitedStates, the dramatic reduction in SO2 emissions thatoccurred in 1995 resulted in a significant reduction o
the acidity and sulfateconcentration ofprecipitation. Thelargest reductions ofacidity and sulfateconcentration precipi-tation occurred in theOhio River Valleyregion, where manyof the affected TitleIV sources arelocated, as well as atsites to the east ofwhere the primaryreductions in emis-sion occurred. Unlikesulfate, nitrate depo-sition has showed
considerable variability. Deposition of ammonium,which along with nitrate is a significant contributor tonitrogen enrichment to ecosystems, has beenincreasing since the early 1980’s.
As principal NADP/NTN coordinator for theFederal agencies, the U.S. Geological Survey provida significant portion of the network’s funding.
Data and additional information from theNADP/NTN are available via the Internet at
http://nadp.sws.uiuc.edu/ andhttp://bqs.usgs.gov/acidrain/
NADP/NTN 7

Percent change in 1995nitrate concentration inprecipitation
Percent change in 1995sulfate concentration inprecipitation
-yanin
r-
e
nd
a--f
n
Figure 7. NADP/MDN.
Data and additional information from theNADP/MDN are available via the Internet at
http://nadp.sws.uiuc.edu/
Figure 6. Changes in precipitation chemistry, 1995.
NADP/MDN
In 1996, the Mercury Deposition Network(MDN) of NADP was established to develop aregional data base on the weekly concentrations oftotal mercury in precipitation and the seasonal andannual flux of total mercury in wet deposition. Atmospheric deposition is the prevalent source of mercurto aquatic ecosystems. The data are used to developinformation data base on spatial and seasonal trendsmercury deposited to surface waters, forested watesheds, and other sensitive receptors. Mercury is ofspecial concern to State and local governmentsbecause 37 States now post health advisories for thconsumption of gamefish with excessive mercurylevels. Most advisories are issued in areas lackingpoint sources of mercury. The MDN has grown to bethe largest network in the United States measuringtotal mercury in precipitation. More than 35 sites arecurrently in operation. The MDN utilizes a speciallydesigned collector, tested and proven for mercury aother trace metals.
Around 20 State, Federal, and private organiztions support the NADP/MDN. The Minnesota Pollution Control Agency and the Wisconsin Department oNatural Resources are the two largest participants ithe program.
8 The Role of Monitoring Networks in the Management of the Nation’s Air Quality

PS
PA
PE
WS
CTH
SP
KE
MK
DCP
AN
BELRL
CDR
VP
OXF
LY
UVL
CNDPNES
AR
BVL
MC
HOW
SAL
PR
AS
CK
COW
ST
BWRVI
BF
WS
LYE
ABWEL
AD CVLSND
GA
SU
ALH
SI
CDZ
QAK
LIV
CAT
EGB
SHN
EV
GRS
AC
05/18/99
ntss.t
ts.-r-
o-t
n
.
CASTNET EPA
CASTNET NPS
C
GTH
PND
CNT
BB
SE
JOT
YO
ME
ROM
CAN
MOR
LAV
GRB
DE
VO
PI
NCS
CHA
OLY
THR
GLR
GRC
YEL
CASTNET
The Clean Air Status and Trends Network(CASTNet) was developed to establish an effectivemonitoring and assessment network to determine thstatus and trends of air-pollution levels, to define thespatial distribution, to assess their environmentaleffects, and to develop a scientific data base for effetive evaluation of air-quality management. Thenetwork consists of approximately 80 monitoringstations across the United States. UnlikeSLAMS/NAMS, most CASTNet sites are locatedaway from local sources of pollution in order to assesbroad regional air-quality trends. In contrast to theNADP, which measures wet atmospheric depositionCASTNet focuses on dry deposition and, morerecently, has an additional component to address finparticles and visibility. CASTNet measures ambientconcentrations of gaseous phase pollutants and aersols along with meteorological parameters needed testimate deposition velocities and dry depositionfluxes of these constituents. Dry deposition fluxes
CASTNet
Figure 8. CAST
eir
c-
s
,
e
o-o
generally cannot be measured directly; measuremeare possible only under highly constrained conditionA number of investigations, however, have shown thafluxes can be reasonably inferred by coupling airconcentration data with meteorological measuremen
CASTNet is the only broad source of dry deposition data in the country. The data are used to detemine relations among emissions, air quality, anddeposition and to provide information necessary tounderstand the ecological effects of atmospheric depsition. With over a decade of data collected, CASTNeprovides critical information necessary in benchmarking and understanding the impact of pollution othe environment and the effectiveness of pollutionmanagement programs.
The USEPA administers the CASTNet programThe National Park Service, in cooperation with theUSEPA, operates 19 of these sites.
CASTNet 9
Net sites.
Data and additional information on CASTNetare available via the Internet at
http://www.epa.gov/acidrain/castnet/

der-
re
N
-
y
isg
AIRMoN DRY and WET DEPO
Sequoia NP7/01/86
Lost Dutchman SP12/10/91
Pawnee Grasslands 7/01/86 - 2/13/90
ANL CORE11/27/84
Bondville6/26/85
O81
O8
Dry Deposition Site
Wet Deposition Site
CORE Site
AIRMON
The Atmospheric Integrated Research Moni-toring Network (AIRMoN) is an array of stationsdesigned to provide an intensive, research-based fodation to support the routine operations of the Nationdeposition monitoring networks—the National Atmospheric Deposition Program (NADP) for wet deposi-tion, and the CleanAir Status andTrends Network(CASTNet) for drydeposition. Asubprogram is specif-ically designed todetect the benefits ofemissions controlsmandated by theClean Air ActAmendments of 1990and to quantify thesebenefits in terms ofdeposition to sensi-tive areas.
AIRMoNcombines two previ-ously existing depo-sition researchnetworks with relatedmeasurement charac-teristics (previously known as the MAP3S precipita-tion chemistry network and the CORE/satellite DryDeposition Inferential Method network). Thecombined sites operate in parallel, with consistentoperational and data aggregation protocols, thusenabling wet and dry deposition data to be incorpo-rated efficiently into on-line modeling and analysisapplications.
AIRMoN operating principles are designed toquantify the extent to which changes in emissionsaffect air quality and deposition at selected locationsAIRMoN sites are chosen to optimize the probabilityfor detecting projected changes and to serve relatedmeasurement needs of researchers studying the effeof atmospheric deposition. Specific sites are empha
Figure 9. AIRMoN.
AIRMoN
10 The Role of Monitoring Networks in the Management of the Nation
Additional informationare available v
http://www.arl.noaa.gov/reand http://nad
C
SITION MONITORING SITESWhiteface Mtn.8/07/84
Borden6/17/86 - 11/29/88
Howland Forest6/22/87
West Point8/04/84
Penn. State8/09/84 CORE10/92 Wet
Wye Res. & Ed. Ctr.12/01/92 Dry11/95 Wet
Shenandoah NP11/05/86 - 9/25/90
R/03/84 CORE0/92 Wet Panola SP
8/27/85R Tower/19/86
Proctor Maple RC8/04/92
Huntington Forest7/28/90
Tampa Bay8/96
Lewes10/92
Ithaca10/92
Oxford10/92
Smith Island11/95
Wet Deposition and CORE Site
Dry and Wet Deposition Site
un-'s-
.
cts-
sized where operations of different observing arrayscan be collocated. Such Collocated OperationalResearch Establishments ("CORE sites") serve twoadditional distinct purposes: (a) to provide linkagesamong network programs operating to addressdifferent needs with different protocols and (b) toprovide the detailed measurements necessary to unstand important processes. A strong linkage with the
emerging NationalEnvironmentalMonitoring Frame-work resulted.
The wet depo-sition component ofthe AIRMoNprogram(NADP/AIRMoN)was initiated in 1992as a network of theNational Atmo-spheric DepositionProgram.NADP/AIRMoNprovides precipita-tion chemistry datawith a greatertemporal resolutionthan what is avail-able from the
NADP/NTN. In 1999, the NADP/AIRMoN comprises10 monitoring stations where precipitation samples acollected every 24 hours. The daily samples areanalyzed for the same constituents as the NADP/NTweekly network. Daily monitoring data are used toprovide additional resolution to evaluate the effectiveness of air-quality regulations and emission tradingpractices. One of the primary applications of the daildata is identifying the source areas of atmosphericpollution via back-trajectory analyses. Also possiblethe calibration of models, which are used in estimatinchanges in atmospheric deposition, as a result ofchanging emissions.
The AIRMoN program is coordinated andfunded primarily through the National Oceanic andAtmospheric Administration (NOAA).
’s Air Quality
and data for AIRMoNia the Internet atsearch/programs/airmon.htmlp.sws.uiuc.edu/
lc-r
ed,
ky
the
ly
nd
d
r-
e
-
GASEOUS POLLUTANT MONITORINGPROGRAM (GPMP)
To meet its general responsibilities with respecto air resource management, the National Park Servi(NPS) has established a framework to protect,preserve, and enhance the air quality in units of theNational Park system, particularly Class I areas. Thframework is heavily dependent on comprehensivemonitoring programs to determine the levels ofgaseous pollutants, fine particles, and visual air qualioccurring or affecting National Parks. The gaseouspollutant monitoringprogram (GPMP) hashistorically concentrated ondetermining the levels oftwo air pollutants—ozone and sulfur dioxide.These pollutants are partic-ularly toxic to native vege-tative species found inNational Park Service unitsat levels at or below theNational Ambient AirQuality Standards estab-lished by the USEPA forthese two pollutants.
The primary moni-toring objectives for the gaseouspollutant-monitoring programare to:
• Establish existing or baseline concentrations andassess trends in air quality in NPS units.
• Determine compliance with national air-qualitystandards.
• Assist in the development and revision of nationaand regional air-pollution control policiesaffecting park resources.
• Provide data for atmospheric model developmentand evaluation.
• Identify those air pollutants with the potential toinjure or damage park natural resources, monitothese pollutants, and correlate observed effectson these resources to ambient levels of thesepollutants.
All gaseous pollutant monitoring stations areequipped with continuous ozone monitors, with somalso containing continuous sulfur dioxide monitors.
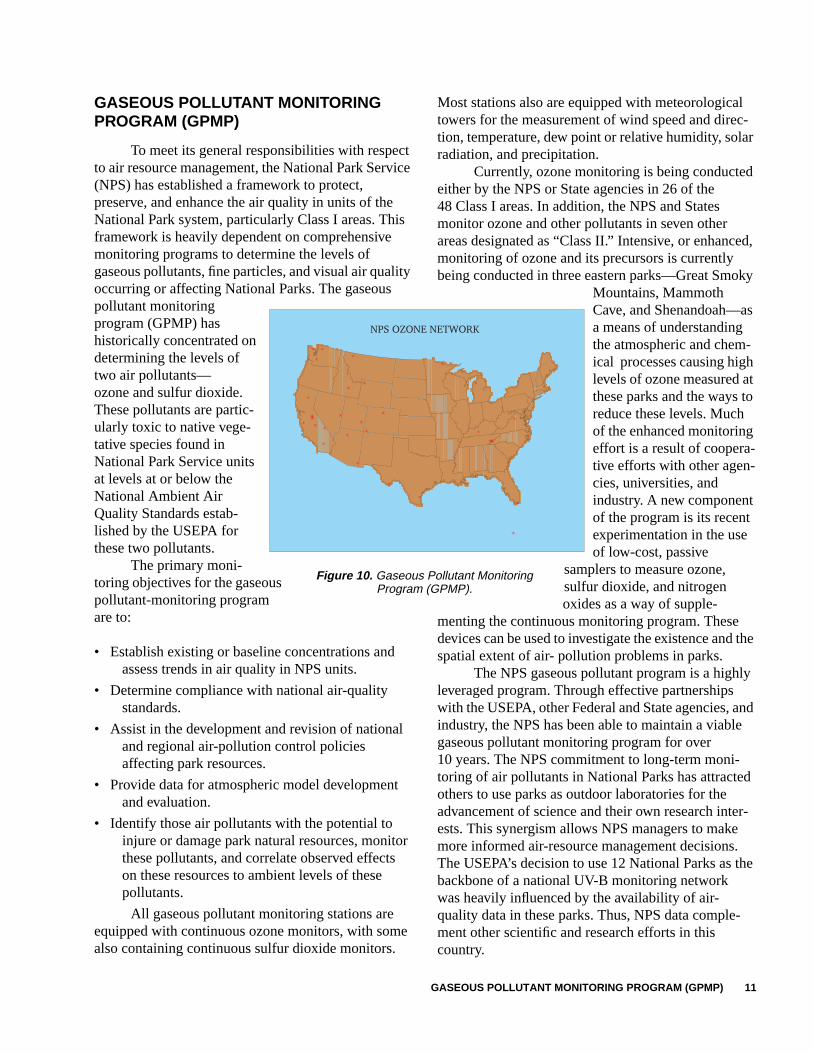
Figure 10. Gaseous Program
tce
is
ty
l
r
e
Most stations also are equipped with meteorologicatowers for the measurement of wind speed and diretion, temperature, dew point or relative humidity, solaradiation, and precipitation.
Currently, ozone monitoring is being conductedeither by the NPS or State agencies in 26 of the48 Class I areas. In addition, the NPS and Statesmonitor ozone and other pollutants in seven otherareas designated as “Class II.” Intensive, or enhancmonitoring of ozone and its precursors is currentlybeing conducted in three eastern parks—Great Smo
Mountains, MammothCave, and Shenandoah—asa means of understandingthe atmospheric and chem-ical processes causing highlevels of ozone measured atthese parks and the ways toreduce these levels. Muchof the enhanced monitoringeffort is a result of coopera-tive efforts with other agen-cies, universities, andindustry. A new componentof the program is its recentexperimentation in the useof low-cost, passive
samplers to measure ozone,sulfur dioxide, and nitrogenoxides as a way of supple-
menting the continuous monitoring program. Thesedevices can be used to investigate the existence andspatial extent of air- pollution problems in parks.
The NPS gaseous pollutant program is a highleveraged program. Through effective partnershipswith the USEPA, other Federal and State agencies, aindustry, the NPS has been able to maintain a viablegaseous pollutant monitoring program for over10 years. The NPS commitment to long-term moni-toring of air pollutants in National Parks has attracteothers to use parks as outdoor laboratories for theadvancement of science and their own research inteests. This synergism allows NPS managers to makemore informed air-resource management decisions.The USEPA’s decision to use 12 National Parks as thbackbone of a national UV-B monitoring networkwas heavily influenced by the availability of air-quality data in these parks. Thus, NPS data complement other scientific and research efforts in thiscountry.
Pollutant Monitoring(GPMP).
GASEOUS POLLUTANT MONITORING PROGRAM (GPMP) 11

ls
a-
,m-ial.
-
r
nt,
dsegel-r,
re
ses,
up
p
HOW IMPORTANT IS THE CURRENTMONITORING INFRASTRUCTURE INADDRESSING EMERGING ISSUES?
The existing network of air-quality monitoringsites provides a low-cost infrastructure that is readilmodified to include new atmospheric chemical specieof interest. The ability of emerging monitoringprograms to build on an established traditional infrastructure (e.g., trained site operators, secured and wedocumented sites, and field laboratories) has resultein lower start-up costs and quicker implementationschedules for new measurement objectives. Alsoimportant for new initiatives is the ability to access thsubstantial knowledge-based infrastructure associawith a monitoring network, such as trained data-management and quality-assurance specialists, sopticated data- and site-management tools, and datadissemination (e.g., interactive Internet-based servefor supplying air-quality data to a worldwide userbase).
One example of this synergy between new anexisting air-quality monitoring activities was therecent initiation of a monitoring program to measureatmospheric deposition of mercury in the UnitedStates and Canada. In this effort, the existing infra-structure of the long-established NADP/NTN facili-tated a quick and successful start-up for the newNADP Mercury Deposition Network (NADP/MDN).Although Federal agencies support only a few of thecurrently operated MDN sites, support via the speciized personnel, computer facilities, and networkmanagement tools enabled the MDN to come on linas a nearly 40-site operation in 3 years.
The importance of collocating air-quality moni-toring equipment at key sites throughout the UnitedStates is increasingly recognized as critical to understanding the relation between atmospheric air-qualitdata and deposition-flux measurements. Recently, tNational Park Service and the USEPA have designat14 park monitoring locations as Prime Net (ParkResearch and Intensive Monitoring of EcosystemsNetwork) sites. The 14 sites have monitors forIMPROVE, CASTNet, NADP/NTN, ozone, andUV-B. Sites at Penn State University and Bondville,Illinois, have monitors from NADP/NTN,NADP/AIRMoN, AIRMoN Dry, and CASTNET.
In 1997, the USEPA issued final revisions tostrengthen the particulate-matter standards by addinnew standards that provide more stringent goals for
12 The Role of Monitoring Networks in the Management of the Nation
ys
-ll-d
eted
his-
rs
d
al-
e
-yheed
g
fine particles in air (PM-2.5). The USEPA issued finarevisions to the primary (health-based) PM standardby adding a new annual and 24-hour standard. Thedeployment of a new monitoring network is a criticalcomponent of the PM-2.5 standard. New instrumenttion is being deployed, taking advantage of theexisting network infrastructure (i.e., IMPROVE andNAMS/SLAMS), coordinating and integrating theexisting visibility-monitoring requirements with thenew ambient air-quality monitoring programs. Theexpanded network will include compliance monitorscontinuous monitors, special purpose monitors, cheical speciation sampling and analysis sites, and specstudy sites to optimize the results for priority research
THE ROLE OF THE COMMITTEE ON THEENVIRONMENT AND NATURALRESOURCES (CENR), AIR QUALITYRESEARCH SUBCOMMITTEE (AQRS)
Over the past 25 years, support for the type ofmonitoring networks described in this document hasbeen sporadic. Support shifts with the political attention given to a particular environmental issue.Commonly, a phenomenon is asserted to be a majoenvironmental problem and the lack of informationthat would be needed to understand its nature, exteand impact is decried. A program of monitoring andresearch is instituted to gather the knowledge needeto develop an appropriate policy response. A responis fashioned and implemented, and frequently a pledis given to continue environmental monitoring to evauate the effectiveness of the policy actions. Howevethe monitoring program associated with the issueenters an almost immediate decline as new issues aidentified, and limited resources are demanded byother problems. In this phase, budget-driven changesuch as temporary shutdowns, site moves or closurchanges in sampling intervals, and reductions inquality assurance and quality control diminish thevalue of the long-term data set due to overall loss ofcontinuity in the historical record. The inefficiency ofthis approach imposes additional direct and hiddencosts on the Nation’s financial resources. The start-and shutdown costs of designing and implementingnetworks are significant. A lack of coordinationbetween existing and new monitoring efforts adds tothe delays in addressing emerging issues and to thecost of generating the information required to develo
’s Air Quality

or-r-
a
ni-ednd
u-
sound policy. Finally, the value of an extensive time-series record extends beyond the identification of aspecific problem. Long-term time series permits verifi-cation that decisions are effective; solutions are,indeed, working; and the ongoing costs and benefits ofthe given control program are assessed accurately.
The AQRS has identified the air-quality moni-toring networks deemed critical for baseline air-quality data in the United States and initiated action topromote research and development on approaches toensure that existing networks are adaptable to change.Agencies that fund existing core networks are encour-aged to consider enhancing the capabilities of thesenetworks through adding constituents and other capa-
bilities in response to emerging issues rather thanterminating support for one network in order tosupport another. Agencies will be encouraged to codinate quality-assurance efforts, network intercompaisons, and sampling equipment collocations. A one-stop shopping approach for air-quality monitoring datvia the Internet will be promoted. By increasing dataaccessibility for the academic and research commuties, the investment in these networks can be leveragby increasing the number of research applications ainterpretive studies. Finally the CENR, AQRS willencourage increased involvement and review ofexisting monitoring programs by the research commnity and help design more efficient and less costlyones as needed in the future.
THE ROLE OF THE COMMITTEE ON THE ENVIRONMENT AND NATURAL RESOURCES (CENR), 13AIR QUALITY RESEARCH SUBCOMMITTEE (AQRS)

For additional information, please contact:
Environment DivisionOffice of Science and Technology PolicyExecutive Office of the PresidentWashington, DC 20502Telephone: 202-456-6202Fax: 202-456-6025
Also available on the NSTC Home Page via link from the OSTP Home Page at:http://www.whitehouse.gov/WH/EOP/OSTP/NSTC/html/nstc_pubs.html

1Printed on recycled paper