Embed Size (px)
Citation preview

THE ROLE OF LEAN AND AGILE
LOGISTICS DURING PRODUCTION
RAMP-UP
Von der Fakultät für Ingenieurwissenschaften, Abteilung Maschinenbau und Verfahrenstechnik
der Universität Duisburg-Essen
zur Erlangung des akademischen Grades
eines
Doktors der Wirtschaftswissenschaften Dr. rer. pol.
Genehmigte Dissertation
von
Abdelrahim Alsoussi
aus Amman, Jordanien
Gutachter:
Prof. Dr. Rainer Leisten Prof. Dr.-Ing. Bernd Noche
Tag der mündlichen Prüfung: 04. November 2015


I
This dissertation is dedicated to
my mother Najah Rida;
my father Fathi Alsoussi;
the memory of my father-in-law Ziyad Abdelrazeq;
my wife Fatima Abdelrazeq;
my daughter Leen;
my son Hamzah;
and
my brothers Issam, Amjad, Ahmad, and Abdelhadi

II
ACKNOWLEDGMENTS
Firstly, I would like to express my sincere gratitude to my advisor for his
continuous support, patience, motivation, and immense knowledge. Besides my
advisor, I would like to thank the rest of my thesis committee for their insightful
comments and encouragement. My sincere thanks also goes to my colleagues in
the department of mechanical and process engineering in the University of
Duisburg-Essen.
My study in Germany was financed by a scholarship from the German
Jordanian University in Jordan; I would like to express my special gratitude for
their financial support.
Special thanks are due to my wife for her unwavering and unconditional
support and encouragement. Special thanks also to my parents, brothers, and
children for supporting me spiritually throughout writing this dissertation and
throughout my life in general.
Abdelrahim Alsoussi
Duisburg, Germany
November, 2015
III
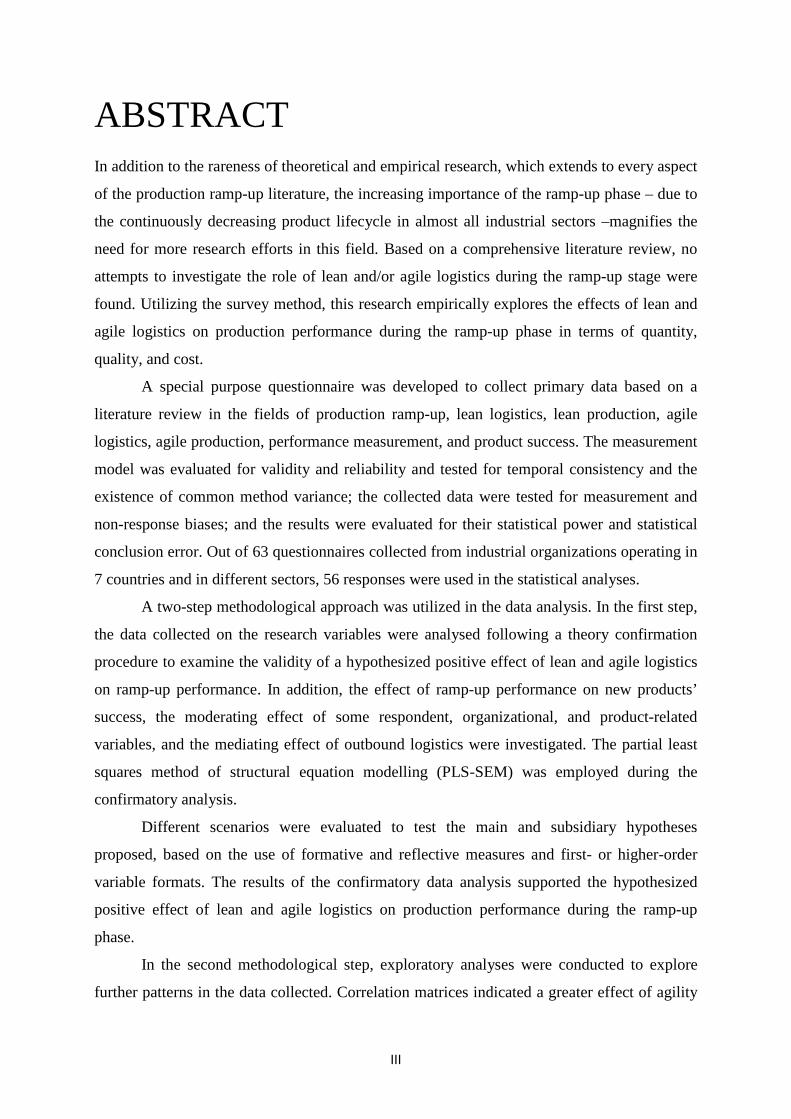
ABSTRACT In addition to the rareness of theoretical and empirical research, which extends to every aspect
of the production ramp-up literature, the increasing importance of the ramp-up phase – due to
the continuously decreasing product lifecycle in almost all industrial sectors –magnifies the
need for more research efforts in this field. Based on a comprehensive literature review, no
attempts to investigate the role of lean and/or agile logistics during the ramp-up stage were
found. Utilizing the survey method, this research empirically explores the effects of lean and
agile logistics on production performance during the ramp-up phase in terms of quantity,
quality, and cost.
A special purpose questionnaire was developed to collect primary data based on a
literature review in the fields of production ramp-up, lean logistics, lean production, agile
logistics, agile production, performance measurement, and product success. The measurement
model was evaluated for validity and reliability and tested for temporal consistency and the
existence of common method variance; the collected data were tested for measurement and
non-response biases; and the results were evaluated for their statistical power and statistical
conclusion error. Out of 63 questionnaires collected from industrial organizations operating in
7 countries and in different sectors, 56 responses were used in the statistical analyses.
A two-step methodological approach was utilized in the data analysis. In the first step,
the data collected on the research variables were analysed following a theory confirmation
procedure to examine the validity of a hypothesized positive effect of lean and agile logistics
on ramp-up performance. In addition, the effect of ramp-up performance on new products’
success, the moderating effect of some respondent, organizational, and product-related
variables, and the mediating effect of outbound logistics were investigated. The partial least
squares method of structural equation modelling (PLS-SEM) was employed during the
confirmatory analysis.
Different scenarios were evaluated to test the main and subsidiary hypotheses
proposed, based on the use of formative and reflective measures and first- or higher-order
variable formats. The results of the confirmatory data analysis supported the hypothesized
positive effect of lean and agile logistics on production performance during the ramp-up
phase.
In the second methodological step, exploratory analyses were conducted to explore
further patterns in the data collected. Correlation matrices indicated a greater effect of agility
IV
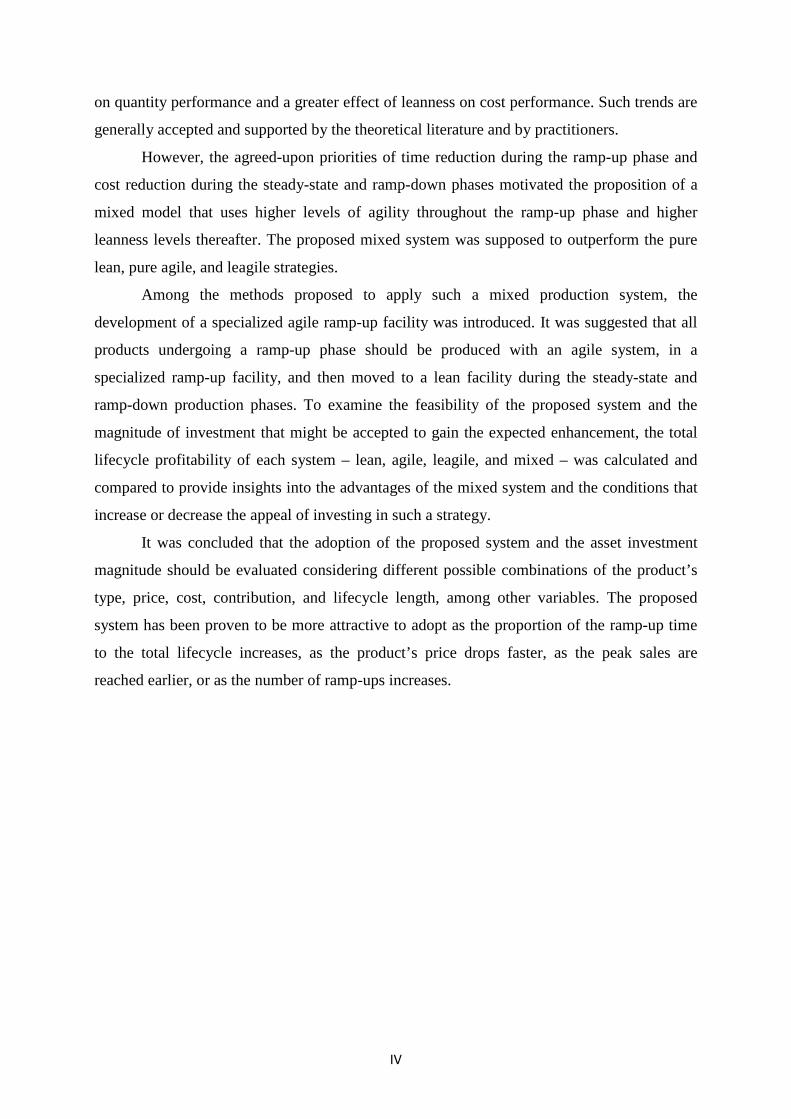
on quantity performance and a greater effect of leanness on cost performance. Such trends are
generally accepted and supported by the theoretical literature and by practitioners.
However, the agreed-upon priorities of time reduction during the ramp-up phase and
cost reduction during the steady-state and ramp-down phases motivated the proposition of a
mixed model that uses higher levels of agility throughout the ramp-up phase and higher
leanness levels thereafter. The proposed mixed system was supposed to outperform the pure
lean, pure agile, and leagile strategies.
Among the methods proposed to apply such a mixed production system, the
development of a specialized agile ramp-up facility was introduced. It was suggested that all
products undergoing a ramp-up phase should be produced with an agile system, in a
specialized ramp-up facility, and then moved to a lean facility during the steady-state and
ramp-down production phases. To examine the feasibility of the proposed system and the
magnitude of investment that might be accepted to gain the expected enhancement, the total
lifecycle profitability of each system – lean, agile, leagile, and mixed – was calculated and
compared to provide insights into the advantages of the mixed system and the conditions that
increase or decrease the appeal of investing in such a strategy.
It was concluded that the adoption of the proposed system and the asset investment
magnitude should be evaluated considering different possible combinations of the product’s
type, price, cost, contribution, and lifecycle length, among other variables. The proposed
system has been proven to be more attractive to adopt as the proportion of the ramp-up time
to the total lifecycle increases, as the product’s price drops faster, as the peak sales are
reached earlier, or as the number of ramp-ups increases.

V
Zusammenfassung Trotz der steigenden Bedeutung des Produktionsanlaufs in der Produktion existieren nur
relativ wenige theoretische und empirische Studien zu diesem Thema in der Literatur. Die
sich stetig verkürzenden Produktlebenszyklen in praktisch allen industriellen Bereichen
erzeugen einen wachsenden Forschungsbedarf in diesem Bereich. Da der Bereich der
„Lean/Agile Logistics“-Methoden während des Produktionsanlaufs in der Forschungsliteratur
kaum eine Rolle spielt, werden im Rahmen dieser Arbeit die Auswirkungen dieser Methoden
auf die Produktionsgüte untersucht, wobei insbesondere die Aspekte der Quantität, Qualität
und Kosten betrachtet werden.
In diesem Zusammenhang wurde ein Fragebogen zur Gewinnung von Informationen
aus den Bereichen Produktionsanlauf, lean logistics, lean production, agile logistics, agile
production, Performance-Messsung und Produkterfolg entwickelt. Das zugrundeliegende
Messmodell wurde unter Validität- und Zuverlässigkeitsaspekten sowie zeitlicher Konsistenz
und allgemeiner Methodenvarianz geprüft. Darüber hinaus wurden die extrahierten Daten
bezüglich ihrer Verwendbarkeit als Messgröße sowie zur Vermeidung von Abweichungen
aufgrund nicht gegebener Antworten geprüft. Die entsprechenden Ergebnisse wurden
anschließend hinsichtlich ihrer statistischen Aussagekraft sowie unter Berücksichtung
möglicher Schlussfolgerungsfehler ausgewertet. Hierdurch konnten 56 der 63 Fragebögen von
Industrieanlagen aus 7 Ländern in die statistische Analyse eingebunden werden.
Für die Datenanalyse wurde ein zweistufiger methodischer Ansatz gewählt, bei dem
im ersten Schritt der Einfluss einzelner Variablen auf einen hypothetischen positiven Effekt
der lean- und agile logistics auf die Performance des Anlaufverhaltens analysiert wurde und
im Anschluss daran der Einfluss des Produktionsanlaufs auf den Produkterfolg. In diesem
Zusammenhang wurde auch der moderierende Einfluss einiger Variablen bezüglich Personen,
Organisation und Produkten sowie der Einfluss auslaufender logistischer Prozesse
berücksichtigt. Für die entsprechende Analyse wurde die „Partial Least Square method of
Structural Equation Modeling (PLS-SEM)“-Methode verwendet.
Zur Überprüfung von Haupt- und Nebenhypothesen wurden verschiedene Szenarien
eingebunden, wobei formative und reflexive Prozessgrößen sowie Variablen erster und
höherer Ordnung eingebunden wurden. Die Ergebnisse bestätigten die Hypothese eines
positiven Effekts der lean and agile logistics auf die Produktionsgüte während der
Produktionsanlaufphase.

VI
Im zweiten methodischen Schritt wurden weitere Analysen durchgeführt, um weitere
Muster zu identifizieren. Mit Hilfe von Korrelationsmatrizen konnte ein starker
Zusammenhang zwischen Agilität und Quantität und zwischen Leanness und Kosten
gefunden werden, was tendentiell auch den Beschreibungen aus der Literatur und den
Erfahrungen der Produktion entspricht.
Für die beabsichtigte Zeitreduktion während des Anlaufs sowie eine Kostensenkung
während des stationären Betriebs wurde ein kombiniertes Modell mit einer höheren Agilität
während der Anlaufphase sowie einer höheren Leanness im stationären Betrieb verwendet.
Für dieses System wurde eine klare Verbesserung im Verglich zu den reinen lean, agile und
leagile Strategien erwartet.
Für die Anwendung eines derartigen kombinierten Produktionssystems wurde ein
spezielles agiles Produktionsanlaufsystem entwickelt, wobei für alle Produkte ein
Produktionsanlauf mit einem agilen System sowie einem spezialisierten System, empfohlen
wurde, um anschließend im stationären Betrieb zum Lean-Betrieb überzugehen und
anschließend die Produktion herunterzufahren. Um die Eignung des Systems und der damit
verbundenen Investitionen zu beurteilen, wurde die Profitabilität des Lebenszyklus bei jedem
Teilsystem (lean, agile, leagile, kombiniertes System) berechnet und die Vor- und Nachteile
des kombinierten Systems bewertet.
Es konnte gezeigt werden, dass für die Verwendung des vorgeschlagenen Systems und
die zugehörigen Güterinvestitionen verschiedene Kombinationen von Variablen zu
Produkten, Preisen, Kosten, Beiträge und Lebenszykluslängen sowie weitere Variablen
berücksichtigt werden müssen. Mit dem vorgeschlagenen System konnte der Anteil des
Produktanlaufs am kompletten Produktzyklus erhöht, eine schnellere Preissenkung sowie ein
früheres Erreichen der maximalen Verkaufszahlen erreicht werden und die Gesamtzahl an
Produktionsabläufen erhöht werden, was in vielen Fällen einen Einsatz definitiv sinnvoll
macht.

VII
TABLE OF CONTENTS
SECTION Page DEDECATION …………………………..………………….……………………… I ACKNOWLEDGMENTS ……………………..………….……………………… II ABSTRACT …………………………..……………………….……………………… III ZUSAMMENFASSUNG ……………………………….………………………. V TABLE OF CONTENTS ……………………………………….………………… VII LIST OF TABLES …………………………………………………………............. XII LIST OF FIGURES …………………………………………………...…………… XIII LIST OF ABBREVIATIONS ……………………………………….................... XV LIST OF NOTATIONS …………………………...………………….................... XVIII CHAPTER Page 1. GENERAL FRAMEWORK …………………………...…………….……. 1
1.1. Introduction ……………………….…………….…….......................... 1
1.2. Problem Statement ……………………......…………….……............. 5
1.3. Research Significance …………………….....…………….……........ 6
1.3.1. Significance of the Fields Investigated ………………………. 6
1.3.2. Research Contributions ……………………...……………..... 7
1.4. Objectives ……………….……...…………….…….............................. 9
1.5. Positioning ……………………....…………….……............................. 11
1.6. Methodological Approach ………...……………...……………........ 13
1.7. Layout ……………………...……………..……..................................... 15
2. BACKGROUND AND LITERATURE ………………...………………. 17
2.1. Introduction ……………………...…………….……............................ 17
2.2. Theoretical Background ……………………...…………….……...... 17
2.2.1. Production Ramp-Up ……………………...……………......... 18
Terminology and Chronology ……………………...…………....... 18
Ramp-Up Phase’s Start, End, and Outcomes …..…...…………....... 19
Time-to-Volume ……………………...…………….……............. 20
Ramp-Up Phase Categorization ……………………...…………... 21
Ramp-Up Phase Classification ………………….…….…….......... 24
Alternative Concepts ……………………...……………………... 25
Characteristics of the Ramp-Up Phase ……………………............ 26

VIII
Problems and Challenges during Ramp-Up ……………………..... 27
Importance of Enhancing Ramp-Up Performance ………………... 29
Ramp-Up and Learning ……………………...………………........ 31
2.2.2. Lean and Agile Logistics …………....…………….…….......... 32
Lean Logistics …………………………...…………….…….......... 34
Agile Logistics …………………………...…………….…….......... 36
2.3. Literature Review …………………….…...…………..….…….......... 38
2.3.1. Production Ramp-Up Literature ……..………….…….......... 38
Ramp-UP Research Directions …………….………….…….......... 39
Ramp-Up Management ………………....…………….…….......... 39
Ramp-Up Predictors ………………………...…….….…….......... 42
Variables Affected by Ramp-Up ……………………….…….......... 47
Researched Sectors and Industries …………………....…….......... 47
Service Ramp-Up ……………………....…………….…….......... 49
2.3.2. Lean and Agile Logistics Literature ……….…….…….......... 49
Leanness Literature ……………………...………………….......... 50
Agility Literature ……………………...……...……….…….......... 51
2.3.3. Research Linking Ramp-Up, Leanness, and Agility ….......... 52
Ramp-Up and Logistics ………………....…………….…….......... 52
Ramp-Up and Leanness ……………………...…………..….......... 53
Ramp-Up and Agility ……………………...…………..…….......... 54
Leanness and Agility ……………………...…………...…….......... 54
3. METHODOLOGY ……………………...…………..………….……............. 56
3.1. Introduction ……………………...……………………….……............ 56
3.2. Research Structure ……………………...…..………….……….......... 58
3.3. Data Collection Tool ……………………...…………….……............ 59
3.3.1. Questionnaire Design Characteristics …………...…….......... 61
3.3.2. Measures’ Quality …………...…………………….…….......... 63
Validity ……………………...………………..……….…….......... 63
Reliability …………………………..…...…………….…….......... 64
Common Method Variation ……………………......….…….......... 66
3.4. Data Collection Process ……………………...……..….……............ 67
3.4.1. Survey Population ……………………...………….…….......... 67
3.4.2. Sampling Issues ……………………...…………….…….......... 68
3.4.3. Survey Methods ……………………...………...….…….......... 70
3.4.4. Response Rate Issues ……………………......…….…….......... 70
3.5. Data Evaluation …………………..………………..…….……............ 71
3.6. Data Analysis ……………………...………………..…….……........... 72

IX
4. MEASUREMENT TOOL DEVELOPMENT ……………………….... 74
4.1. Introduction ………………………….……..……………...…….......... 74
4.2. Performance Measurement …………………..………….…….......... 75
4.3. Measuring Ramp-Up Performance …...…………….…….….......... 77
4.3.1. A Tailored Ramp-Up Performance Measure ……………...... 77
4.3.2. Categorization of Performance Indicators …………….......... 78
4.3.3. The Developed Measure ……………….………….…….......... 81
Quantity Performance …………………...………….…….......... 82
Productivity ………………………………………….…….......... 82
Cycle Time Reduction ……………………..………….…….......... 83
Learning Rate ………………………….…………….…….......... 84
Unplanned Production Stops ………………………….…….......... 84
Quality Performance ………………………….…….…….......... 85
Defective Products Rate …………………………...….…….......... 86
Returned Products Rate ………………...…………….…….......... 86
Quality Level Deviation ……….………..…………….…….......... 86
Cost Performance ……………..…………………….…….......... 87
Variable Costs ……………………………………….…….......... 87
Costs of Preparing the Production System …………….…….......... 88
Repair, Rework, and Scrap Costs ……..…………….……............. 88
Problems during the Ramp-Up Phase ……….…..…….…….......... 89
4.4. Measuring Logistics Performance ….……………….……….......... 90
4.4.1. Leanness Measurement …………………..……….…….......... 92
Leanness of Inbound Logistics ………..……………….…….......... 93
Leanness of Intra Logistics …………………………....…….......... 93
Leanness of Outbound Logistics ………...…………………........... 95
4.4.2. Agility Measurement ………………..…………….…….......... 95
Agility of Inbound Logistics …..……………………….…….......... 96
Agility of Intra Logistics ……………………...……….…….......... 97
Agility of Outbound Logistics …………...…………….…….......... 98
4.5. New Product Success ……………………………..…….……............ 99
4.6. The Moderating Variables ………………….………...…….............. 100
5. STATISTICAL ANALYSIS ………………………….………………….... 102
5.1. Introduction ………………………….…………..……….……............ 102
5.2. Descriptive Statistics and Preliminary Analysis …….….............. 102
5.2.1. Production Ramp-Up ………………….………….…….......... 103
5.2.2. Logistics ………………………...………………….…….......... 105
Lean Logistics ………………………...……………….…….......... 105

X
Agile Logistics ……..……….………………………….…….......... 106
5.2.3. Respondent-, Organization-, and Product-Related Variables 106
5.2.4. New Product Success ……..……………………….…….......... 108
5.3. Variables’ Correlations ………….......……………………...….......... 108
5.3.1. Ramp-Up Problems ……..……………………….……............ 109
5.3.2. Leanness and Agility Co-existence ……..…………................. 112
5.3.3. Respondent-, Organization-, and Product-Related Variables 114
5.4. Hypothesis Formulation and Testing ……………....……............... 115
5.4.1. Hypothesis Testing ……..……………………….………......... 119
Main Hypotheses ……………...……...……………….…….......... 120
Scenario 1: First-Order Reflective …………………….…….......... 120
Scenario 2: Second-Order Formative ………………….…............. 125
Scenario 3: Second-Order Formative Considering the Ramp-Up Problems …………………………………………….……..........
127
Scenario 4: First-Order Reflective Based on the General Evaluations 128
Scenario 5: Second-Order Formative Based on the General Evaluations …………………………….…………….……..........
129
Scenario Summary ……….…….…………………….…….......... 130
Sub-hypotheses ………...……...……...……………….…….......... 131
6. MIXED-STRATEGY INTRODUCTION ……...……..……….……….. 135
6.1. Introduction ………...………….……………………….……............... 135
6.2. Measures’ Relationships ……………………...…….……................. 137
6.2.1. The Direct Effect …….…..…………...………….………......... 138
6.2.2. The Mediating Effect ……..……….…………….………......... 142
6.3. Logistics, Production, and the Lifecycle ……………………......... 143
6.4. Literature Support ………...……..…………………….……............... 144
6.5. Applicability ………...………….………...…………….……............... 145
6.5.1. Developing a Ramp-Up Facility ……..……….……...…......... 147
7. LIFECYCLE PROFITABILITY COMPARISON ……...................... 149
7.1. Introduction …………...……………….……..………………….......... 149
7.2. Product Lifecycle Analysis Considerations …………….….......... 150
7.2.1. Lifecycle Demand ……..…………..…………….………......... 151
7.2.2. Lifecycle Production ……..…………..………….………......... 152
7.2.3. Lifecycle Profitability ……..……….……...…….………......... 154
7.3. Profitability Calculations …………………..………………….......... 157
7.4. Comparison and Analysis …………………….……………….......... 160
8. CONCLUSIONS, DISCUSSION, AND RECOMMENDATIONS 162
8.1. Introduction ……………………………...……………….……............ 162
8.2. Conclusions ………………………….……………...…….……........... 163

XI
8.3. Discussion ………………………….………………………….............. 164
8.3.1. Research Structure ……..…………..……..…….………......... 164
Research Variables Issues ……..……...……………….…….......... 164
Measurement Tool ………..…..……...……………….…….......... 165
Sampling …………………..…..……...……………….…….......... 166
8.3.2. Results’ Comparison ……...………..…………….……........... 166
8.4. Limitations …………...…………….………………………….............. 167
8.5. Recommendations ………………………….………..….……............ 169
8.5.1. Recommendations for Researchers ……………….……......... 169
8.5.2. Recommendations for Practitioners ……………...……......... 170
REFERENCES ……………………….………………………………….……......... 172 APPENDIXES ……………………….…………………………………….……...... 204 Appendix 1 Questionnaire Items ……...…….……….……….……..... 205
Appendix 2 Fragebogen Artikel ………….……..…...……….……..... 207
Appendix 3 Path Analysis Figures ……….……..…...……….……..... 210
Appendix 4 Calculated Score of Latent Variables ………....…...… 216
XII
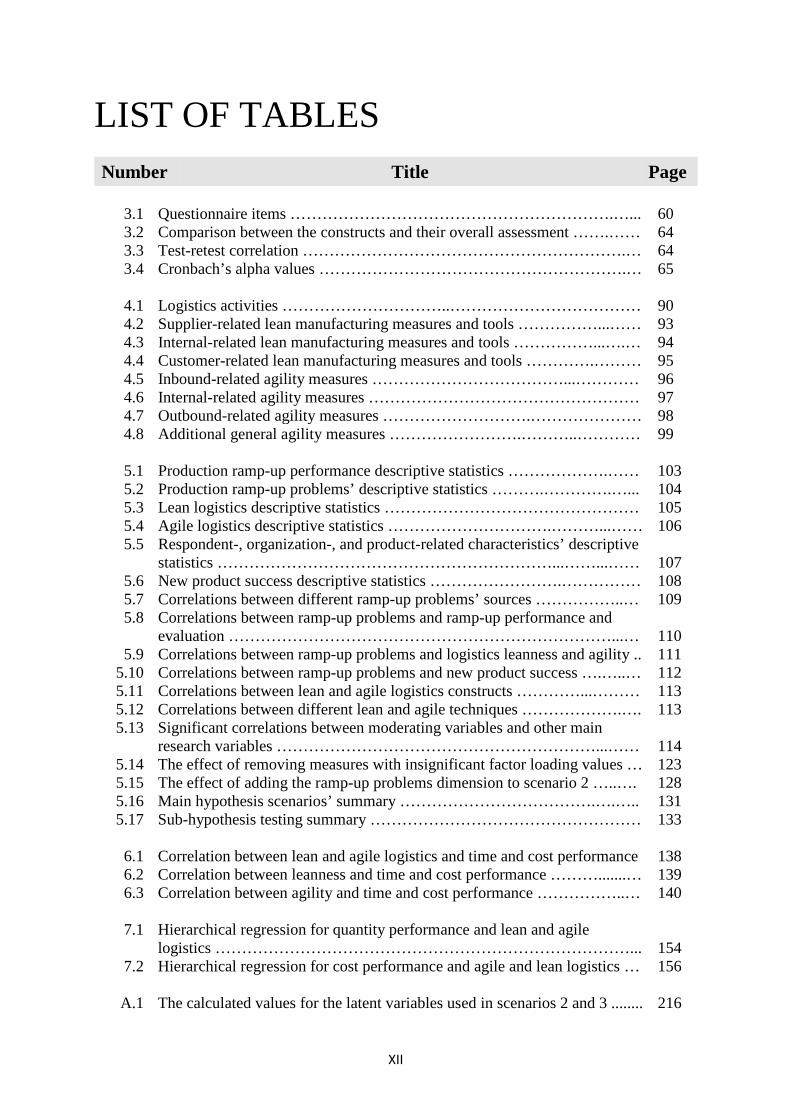
LIST OF TABLES Number Title Page
3.1 Questionnaire items …………………………………………………….…... 60 3.2 Comparison between the constructs and their overall assessment …….…… 64 3.3 Test-retest correlation …………………………………………………….… 64 3.4 Cronbach’s alpha values ………………………………………………….… 65
4.1 Logistics activities …………………………..……………………………… 90 4.2 Supplier-related lean manufacturing measures and tools ……………...…… 93 4.3 Internal-related lean manufacturing measures and tools ……………...….… 94 4.4 Customer-related lean manufacturing measures and tools ………….……… 95 4.5 Inbound-related agility measures ………………………………...………… 96 4.6 Internal-related agility measures …………………………………………… 97 4.7 Outbound-related agility measures ……………………….………………… 98 4.8 Additional general agility measures …………………….………..………… 99
5.1 Production ramp-up performance descriptive statistics ……………….…… 103 5.2 Production ramp-up problems’ descriptive statistics ……….………….…... 104 5.3 Lean logistics descriptive statistics ………………………………………… 105 5.4 Agile logistics descriptive statistics ………………………….………...…… 106 5.5 Respondent-, organization-, and product-related characteristics’ descriptive
statistics ………………………………………………………...……...…… 107
5.6 New product success descriptive statistics …………………….…………… 108 5.7 Correlations between different ramp-up problems’ sources ……………..… 109 5.8 Correlations between ramp-up problems and ramp-up performance and
evaluation ………………………………………………………………...… 110
5.9 Correlations between ramp-up problems and logistics leanness and agility .. 111 5.10 Correlations between ramp-up problems and new product success ….…..… 112 5.11 Correlations between lean and agile logistics constructs …………...……… 113 5.12 Correlations between different lean and agile techniques ……………….…. 113 5.13 Significant correlations between moderating variables and other main
research variables ……………………………………………………...…… 114
5.14 The effect of removing measures with insignificant factor loading values … 123 5.15 The effect of adding the ramp-up problems dimension to scenario 2 …..…. 128 5.16 Main hypothesis scenarios’ summary ……………………………….….….. 131 5.17 Sub-hypothesis testing summary …………………………………………… 133
6.1 Correlation between lean and agile logistics and time and cost performance 138 6.2 Correlation between leanness and time and cost performance ……….......… 139 6.3 Correlation between agility and time and cost performance ……………..… 140
7.1 Hierarchical regression for quantity performance and lean and agile
logistics ……………………………………………………………………... 154
7.2 Hierarchical regression for cost performance and agile and lean logistics … 156
A.1 The calculated values for the latent variables used in scenarios 2 and 3 ........ 216

XIII
LIST OF FIGURES Number Title Page
1.1 Production ramp-up phase …………………………………..……………… 3 1.2 Basic structural model ……………………………………………………… 10 1.3 Research positioning ……………………………………………………..… 13 1.4 Research steps ……………………………………………………………… 15
2.1 Simplified illustration of the ramp-up phase ……………………………..… 19 2.2 Time-to-market and time-to-volume ……………………………………..… 21 2.3 Ramp-up phase as illustrated by Scholz-Reiter et al. (2007) …………….… 22 2.4 Stages of development and production and ramp-up span …………………. 24 2.5 Logistics flows and divisions, adapted from Langley et al. (2008) ……...… 34 2.6 Lean logistics and lean manufacturing …………………………………...… 36 2.7 Ramp-up strategies according to Clark and Fujimoto (1991) ……………… 40 2.8 Ramp-up strategies according to Schuh et al. (2005a) …………………...… 41
3.1 Measures, sample, data, and analysis quality …………………………….… 59 3.2 Cronbach’s alpha values after adjusting the measurement model ………..… 66 3.3 Missing values summary of the pattern analysis …………………………… 72
4.1 Ramp-up temporal classification according to Doltsinis et al. (2013) …...… 80 4.2 Logistics performance measures and their relative importance according to
Fawcett and Cooper (1998) ………………………………………………… 92
4.3 Research model …………………………………………………………..… 101
5.1 Logistics/ramp-up hypothesized relationships …………………………...… 116 5.2 Ramp-up/success hypothesized relationships ……………………….....…… 116 5.3 Ramp-up, outbound logistics, and success relationships …………………… 118 5.4 Moderating effects of respondent-, organization-, and product-related
characteristics ……………………….……………………………………… 119
5.5 A First-order reflective variables’ path analysis results …………………….… 121 5.5 B First-order reflective variables’ path analysis significance ………………… 122
5.6 Adjusted first-order reflective variables path analysis results ……………… 124 5.7 Path model with second-order formative variables ………………………… 126 5.8 Path coefficients for the second-order formative model ……………….…... 127 5.9 Path coefficients for the first-order reflective model using general
evaluation dimensions ……………………………………………………… 129
5.10 Path coefficients for subsidiary hypothesis testing ………………………… 132 5.11 Significant path coefficients for the subsidiary hypotheses ………….…….. 134
6.1 Production phases and focuses of performance outcomes …………….…… 136 6.2 Internal flexibility measures’ correlations with time and cost performance .. 140 6.3 Correlation histograms for leanness and agility levels with quantity and
cost performance …………………………………………………………… 141
6.4 Path coefficients for examining outbound logistics’ role …………………... 142 6.5 Correlation charts for leanness, agility, quantity, and cost …………….…… 143

XIV
6.6 Leanness, agility, qualifier, and winner matrix according to Mason-Jones et al. (2000a) …………………………………………………………………...
145
6.7 Production system’s cost–flexibility relationships according to Hayes and Pisano (1996) ………………………………………………………………..
146
6.8 Ramp-up asset requirements, projected returns, and strategies according to Meyer (2007) ………………………………………………………………..
147
6.9 Specialized agile ramp-up facility ………………………………………….. 148
7.1 Demand and production during different product lifecycle stages ………… 150 7.2 Different demand curves due to product success uncertainty according to
Ramasesh et al. (2010) ………...…………………………………………… 151
7.3 Demand, agile production, and lean production curves ……………………. 153 7.4 Path model for quantity, cost, leanness, and agility ………………………... 155 7.5 Different price trends according to product type and price elasticity ……… 156 7.6 Cumulative profitability scenarios’ comparison ………………………..….. 161
8.1 Model integration at the organizational and supply chain levels ……...…… 165
A.1 p values for the path analysis results with ramp-up as a first-order
formative variable ………………………………………...………………… 210
A.2 Results of the path analysis for scenario 3 ……………………………….… 211 A.3 Results of the path analysis for scenario 4 after removing the cost
evaluation indicator ………………………………………………………… 211
A.4 Results of the path analysis for scenario 5 ……………………………….… 212 A.5 Sub-hypotheses path analysis with 𝑝 values ……...………………………... 213 A.6 𝑝 values for path analysis in the model examining outbound logistics role ... 214 A.7 Path analysis considering only quantity, quality, and cost performance …… 214 A.8 𝑝 values show insignificant effect for quantity and cost on quality
performance ………………………………………………………………… 215

XV
LIST OF ABBREVIATIONS Abbreviation Meaning
5 S Systematic arrangement, sort, shine, standardize, and sustain Acc. The null hypothesis is accepted
AccumProfitAgile Accumulated profit using the agile strategy AccumProfitLeagile Accumulated profit using the leagile strategy
AccumProfitLean Accumulated profit using the lean strategy AccumProfitMixed Accumulated profit using the mixed-strategy
AIBL Agility of inbound logistics AIBL1 The suppliers’ cooperation measure AIBL2 The measure of using IT to link the company with it’s suppliers AIBL3 The suppliers’ flexibility measure AIBL4 The measure of using vendor managed inventory technique
AIIL Agility of inbound and intra logistics AITL Agility of intra logistics
AITL1 The production’s flexibility measure AITL2 The adaptability to change measure AITL3 The measure of using modular product design technique AITL4 The measure of using reconfigurable manufacturing technique
AOE Agility overall evaluation AOL Agility of outbound logistics
AOL1 The adaptability to order’s change measure AOL2 The ability to predict market changes measure AOL3 The measure of using third-party logistics technique AVE Average variance extracted
CB Covariance based CP Cost performance
CP1 The variable cost measure CP2 The production system preparation measure CP3 The repair, rework, and scrap costs measure
CPOE Cost performance overall evaluation CSCMP Council of supply chain management professionals
D: P ratio Delivery lead time to production lead time ratio F. goods Finished goods
HRM Human resource management HTMT Heterotrait-monotrait
IT Information technology JIT Just in time
LIBL Leanness of inbound logistics LIBL1 The material inventory level measure LIBL2 The match between material supply and the actual requirements measure LIBL3 The material transportation cost measure LIBL4 The measure of using material requirement planning technique LIBL5 The measure of using supplier milk run technique
LIIL Leanness of inbound and intra logistics LITL Leanness of intra logistics
LITL1 The work-in-process inventory level measure LITL2 The standardization level measure LITL3 The measure of using just-in-time technique

XVI
LITL4 The measure of using Kanban technique LITL5 The measure of using cross-docking technique
LOE Leanness overall evaluation LOL Leanness of outbound logistics
LOL1 The finished goods inventory level measure LOL2 The finished goods transportation cost measure LOL3 The customer involvement level measure
M. handling Materials handling MPD Modular product design MRP Material requirement planning NPS New product success
NPS1 The sales return measure NPS2 The net profit measure NPS3 The market share measure NPS4 The customer satisfaction measure OEM Original equipment manufacturer OPM Operations and production management
P. Correlation Pearson correlation PCIs Process capability indices
PDMA Product development and management association PLS Partial least square
Prob.1 Problems related to the supply of material Prob.2 Problems related to the production machines Prob.3 Problems related to the equipment and tooling Prob.4 Problems related to the production employees Prob.5 Problems related to the mismatch between the design and the process Prob.6 Problems related to wrong product design Prob.7 Problems related to the use of inappropriate technology Prob.8 Problems related to the poor cooperation among departments Prob.9 Problems related to the information flow
QlP Quality performance QlP1 The defective products rate measure QlP2 The returned products rate measure QlP3 The quality level deviation measure
QlPOE Quality performance overall evaluation QnP Quantity performance
QnP1 The productivity measure QnP2 The cycle time reduction measure QnP3 The learning rate measure QnP4 The unplanned production stops measure
Rej. The null hypothesis is rejected RM Raw material
RMS Reconfigurable manufacturing system RUP Ramp-up performance
RUPOE Ramp-up performance overall evaluation Sce. Scenario SD Standard deviation
SEM Structural equation modeling Sig. Significance level
SMED Single minute exchange of die SMEs Small and medium-sized enterprises

XVII
SPSS Statistical package for the social sciences SRMS Standardized root mean square
St. error Standard error TPL (3PL) Third-party logistics
TPOE Time performance overall evaluation TPS Toyota production system
TQM Total quality management VIF Variance inflation factor
VMI Vendor managed inventory VPOE Volume performance overall evaluation
WIP Work in process
XVIII
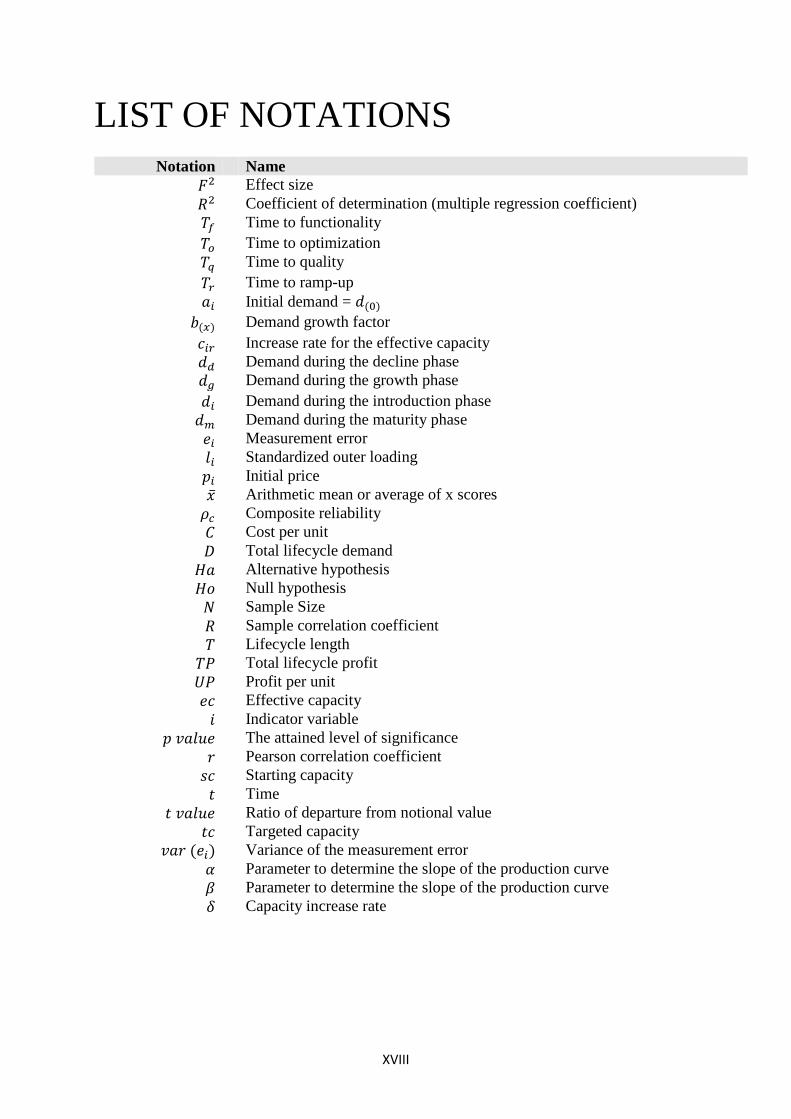
LIST OF NOTATIONS Notation Name
𝐹2 Effect size 𝑅2 Coefficient of determination (multiple regression coefficient) 𝑇𝑓 Time to functionality 𝑇𝑜 Time to optimization 𝑇𝑞 Time to quality 𝑇𝑟 Time to ramp-up 𝑎𝑖 Initial demand = 𝑑(0)
𝑏(𝑥) Demand growth factor 𝑐𝑖𝑟 Increase rate for the effective capacity 𝑑𝑑 Demand during the decline phase 𝑑𝑔 Demand during the growth phase 𝑑𝑖 Demand during the introduction phase 𝑑𝑚 Demand during the maturity phase 𝑒𝑖 Measurement error 𝑙𝑖 Standardized outer loading 𝑝𝑖 Initial price �̅� Arithmetic mean or average of x scores 𝜌𝑐 Composite reliability 𝐶 Cost per unit 𝐷 Total lifecycle demand 𝐻𝑎 Alternative hypothesis 𝐻𝐻 Null hypothesis 𝑁 Sample Size 𝑅 Sample correlation coefficient 𝑇 Lifecycle length 𝑇𝑇 Total lifecycle profit 𝑈𝑇 Profit per unit 𝑒𝑐 Effective capacity 𝑖 Indicator variable
𝑝 𝑣𝑎𝑙𝑣𝑒 The attained level of significance 𝑟 Pearson correlation coefficient 𝑠𝑐 Starting capacity 𝑡 Time
𝑡 𝑣𝑎𝑙𝑣𝑒 Ratio of departure from notional value 𝑡𝑐 Targeted capacity
𝑣𝑎𝑟 (𝑒𝑖) Variance of the measurement error 𝛼 Parameter to determine the slope of the production curve 𝛽 Parameter to determine the slope of the production curve 𝛿 Capacity increase rate

Chapter One General Framework
1
CHAPTER 1
GENERAL FRAMEWORK
1.1. Introduction Among the important characteristics of current marketplaces, increasing levels of competition
– particularly in the manufacturing sector (Chenhall, 1997) – and rapidly changing customer
needs and requirements are agreed-upon predominant characteristics (Pufall et al., 2007;
Winkler et al., 2007; Cedergren et al., 2010; Schmitt and Schmitt, 2013; Roh et al., 2014).
These two characteristics, in addition to the huge technological advances (Da Silveira et al.,
2001; Kontio and Haapasalo, 2005) and the accompanying increased variety of products
(Fleischer et al., 2003), are the main causes of the continuously diminishing product lifecycle
(Terwiesch and Bohn, 2001). Iwaarden and Wiele (2012) indicated that increasing product
variety and shortening product lifecycles are important trends in the current business climate.
Sturm et al. (2003) indicated that the product lifecycle is decreasing in almost every industrial
sector. For automotive original equipment manufacturers (OEM), as an example, Schuh et al.
(2005a) argued that products’ lifecycles have decreased by 60% during a time period of 4
decades.
The shorter product lifecycle has increased the importance of continually developing
new products (Winkler et al., 2007; Surbier et al., 2010; Surbier et al., 2014), which has been

Chapter One General Framework
2
considered, for most modern companies, as the only way to survive (Mallick and Schroeder,
2005). Audretsch (1991) mentioned the importance of innovation to the survival of new
entrants to the market. Furthermore, Olson et al. (1997) indicated that 49% of sales in the
best-performing firms are from new products, while in less successful firms, this percentage
drop to only 22%.
In response, the frequency of new product introductions in manufacturing firms has
increased (Eisenhardt and Brown, 1998; Wan et al., 2005) and is expected to grow even more
in the future (Schuh et al., 2005b). A continuously increasing rate of innovation can be
captured in almost all industrial sectors. In addition, shrinking lifecycles force organizations
to pay the same amount of attention to cutting the time-to-volume as to cutting the time-to-
market of new products (Terwiesch and Bohn, 2001).
The shorter product lifecycles, more frequent new product development, and increasing
importance of reducing time-to-volume shed more light on the phase of production ramp-up
(Berg and Säfesten, 2006; Winkler et al., 2007; Du et al., 2008; Simon et al., 2008; Fjällström
et al., 2009; Schmitt and Schmitt, 2013).
As shown in figure 1.1, production ramp-up takes place after completing the
development process of a certain product and continues until the product is being produced in
a steady-state manner (Abernathy and Baloff, 1973), with which the targeted levels of
quantity, cost, and quality are reached (Wheelwright and Clark, 1992). In addition to each
new product, ramp-up is experienced with new production processes (Terwiesch and Xu,
2004), new factories (Willmann et al., 2014), or even new technology introduction (Gross and
Renner, 2010). However, some authors have referred to cases of new lines or factories as
production start-up (Terwiesch et al., 2001).
Reducing the ramp-up duration can be as beneficial as reducing the development time,
since the ultimate goal is to make the product available on the market within the smallest
possible time period. In addition, Terwiesch et al. (2001) argued that the timing of revenue
depends more on time-to-volume than on time-to-market. Furthermore, House and Price
(1991) reported striking figures showing that companies might lose 3.5% of the after-tax
profit when they overspend by 50% during product development, but they might lose as much
as 33% when their shipments are 6 months late.
Ramp-up greatly influences cost structures (Terwiesch and Bohn, 2001). Concerning the
automotive industry as an example, Schuh et al. (2005a) showed that production ramp-up is
one of the major cost drivers. Consequently, more control over the production ramp-up phase
will greatly affect profitability in terms of both revenues and costs.

Chapter One General Framework
3
Figure 1.1: Production ramp-up phase
Despite the great importance of production ramp-up, as well as the magnificent
benefits that might be gained from better performance during this period, little or – at the very
least – insufficient research efforts have been directed toward this area. Terwiesch et al.
(2001) indicated that less attention has been paid in the literature to time-to-volume reduction
than to time-to-market reduction. In addition, Schuh et al. (2005a) declared that ‘no or only
less meaningful’ information for the ramp-up phase exists in the scientific literature. Many
other authors have indicated the lack of sufficient literature and research attempts concerning
production ramp-up (e.g. Almgren, 2000; Terwiesch et al., 2001; Berg and Säfesten, 2006;
Juerging and Milling, 2006; Ball et al., 2011; Doltsinis et al., 2013).
Some researchers have attributed the scarcity of research in this area to the complexity
of the ramp-up phase. Kuhn et al. (2002), van der Merwe (2004), Schuh et al. (2005a),
Doltsinis et al. (2013), Schmitt and Schmitt (2013), and others mentioned the complexity of
this production phase. Reuter et al. (2014) also stressed this fact and referred to ramp-up as a
non-linear socio-technical system.
Among the research efforts exploring the factors that affect ramp-up performance (e.g.
Terwiesch and Bohn, 2001; Kuhn et al., 2002; Fjällström et al., 2009; Glock et al., 2012;
Niroomand et al., 2014), few researchers have highlighted the role of logistics during this
phase (e.g. Bowersox et al., 1999; Pfohl and Gareis, 2000; Risse, 2003; Filla and Klingebiel,
2014); despite the appreciation of the role of logistics during production ramp-up in some
research, these studies targeted limited logistical dimensions and lacked a detailed analysis of
a wide range of logistics activities. Studying limited logistics activities and generalizing the
Production Ramp-Up Targeted Production
Levels
Vol
ume
Time
Start of Production
Chapter One General Framework
4
results to include the entire logistics system represent oversimplification of the complex role
that logistics might play during this phase.
Logistics thinking and practice have developed rapidly (Gundlach et al., 2006). Two
currently popular paradigms in logistics are lean and agile logistics. With lean logistics, waste
should be minimized, but this strategy might not be able to respond quickly to high volatility
in the marketplace. On the other hand, an agile strategy improves the responsiveness but may
ultimately increase the total cost (Naylor et al., 1999). Researchers have explored the
contributions and potentials of lean and agile logistics to improve firms’ performance and
competitiveness (e.g. Damen, 2001; Wu, 2002; Jirsák and Holman, 2012). However, the
efforts to compare the two doctrines and evaluate how performance differs when utilizing
either of them seem to be very limited. Christopher and Towill (2001) argued that lean and
agile are not mutually exclusive paradigms and that they might be combined to advantage in a
number of different ways.
This research aims to explore empirically the roles of lean and agile logistics in
enhancing production ramp-up performance. Exploring the role of logistics system leanness
and agility during the ramp-up phase could be of great importance for reducing the cost and
time needed to reach full capacity utilization. Unlike research that attempted to use general
concepts, this research aims to study the effect of certain logistics trends and practices on
certain ramp-up performance measurement criteria. In addition, it intends to explore how
ramp-up performance affects different indicators of new product success. To achieve the main
objective of this research, the theory confirmation methodology was basically utilized, since
research hypotheses that propose the existence of significant relationships between ramp-up
performance’s constructs and lean/agile logistics were formulated based on the theoretical
literature trends and practitioners’ opinions. However, the magnitude of the effect and the
correlations between sub-variables are more exploratory in nature.
While companies typically aim to minimize their production cost to be price
competitive (Heizer and Render, 2008), this focus might change significantly during the
production ramp-up phase. The main focus during the ramp-up phase is on reducing the time
period needed to reach full-scale production with the aim of making the highest possible
profits from early introduction to the market (Almgren, 1999a; Terwiesch and Bohn, 2001;
Niroomand et al., 2014). Shortly after introducing a new product to the market, similar
products will be made available and the competition will be more on the base of price than on
the base of novelty (Terwiesch et al., 2001). Consistent with these facts, and building on the
investigated relationships between lean/agile logistics and production ramp-up, this research

Chapter One General Framework
5
introduces a model proposing that companies require different levels of leanness or agility
according to the specific phase of the lifecycle and that phase’s goals. Hence, different
combinations of lean and/or agile logistics might be employed in different lifecycle phases.
The most suitable levels of leanness and agility for the ramp-up phase will be tested and
compared with the steady-state and ramp-down production phases.
Some researchers (e.g. Naylor et al., 1999; Mason-Jones et al., 2000a; Mason-Jones et
al., 2000b) have traded off and combined the lean and agile paradigms to achieve a balanced
level of flexibility and cost control. However, due to the different goals involved in different
production stages, companies might require a switch or a move between the lean and the agile
paradigm rather than a combination of the two. Production ramp-up could serve as a typical
example of such a situation, since its goals might differ significantly from those of the steady-
state or ramp-down production stages. Due to the increasing importance of the lean and agile
paradigms, linking these concepts to the ramp-up phase, and building a model of relationships
between lean and agile logistics on the one hand and production ramp-up performance
parameters on the other, might be of great importance as a decision-making support tool.
1.2. Problem Statement Possessing more control over the outcomes of the production ramp-up phase largely contributes
to the profitability and the success of a newly developed product. In their attempts to achieve
such a purpose, researchers have examined the prospective effect of many variables on ramp-up
performance. Among these research efforts, a limited number of researchers have emphasized the
role of logistics, in most cases using a naive and simplified view of logistics activities. Detailed
classifications of logistics activities and special logistics behaviours have largely been ignored in
the context of the ramp-up phase. In addition, despite their unquestionable importance, lean and
agile logistics have never been linked to the ramp-up phase.
This research aims to explore the effect of lean and agile logistics on production ramp-up
performance with the aim of evaluating how each sub-variable under the constructs of lean and
agile logistics affects the performance of production ramp-up in terms of quantity, quality, and
cost. In addition to the type of the effect – specifically positive or negative – of each sub-variable
under the lean and agile logistics constructs, the magnitude of these effects are considered; thus,
the relative importance of each dimension of lean and agile logistics to the ramp-up phase can be
evaluated. With limited abilities and resources available to enhance the logistics system, the
results of this research can guide the decision maker regarding the aspects that are most worthy of
consideration. In addition, the moderating role of some respondent-, organization-, and product-

Chapter One General Framework
6
related variables are analysed. Therefore, variation according to these variables should be taken
into consideration while using the research results.
Ultimately, the results of the analysis enhance our understanding of the relationship
between the research variables in terms of the most influential dimensions of lean and agile
logistics on certain performance parameters during the ramp-up phase and the moderating
variables that might significantly affect this relationship.
1.3. Research Significance This section sheds light on two types of significance related to the current research: (1) the
importance of the topic and the variables investigated and (2) the significance of the current
research for the already-existing literature. The importance of the topic under study is
supported and clarified using research addressing the issues of production ramp-up, lean
logistics, and agile logistics from different organizational perspectives.
On the other hand, the current research’s significance is demonstrated by the unique
contributions and addition of this research to the available knowledge and the main research
gaps that it helps to fill.
1.3.1. Significance of the Fields Investigated Production ramp-up, lean logistics, and agile logistics are worthy of consideration in their
own right. Almgren (1999a) pointed to a case of consensus among industrial managers
regarding the importance of the ramp-up phase. The literature has elucidated the importance
of the ramp-up phase for organizational performance (Ball et al., 2011), revenues and profits
(Ulrich et al., 1993), the timing of returns (Terwiesch et al., 2001), product quality (Almgren,
2000), and many other pivotal aspects. Moreover, Schmitt and Schmitt (2013) deemed the
ramp-up phase to be a central point of a product’s entire lifecycle. Due to high demand and
premium product selling prices during the initial introductory phase, reducing the ramp-up
time can produce extraordinarily higher financial compensation. However, Du et al. (2008)
pointed out that the current industrial practice in reducing the ramp-up phase’s duration is ‘far
less than satisfactory’.
The importance of production ramp-up varies from one industry to another based on
many factors, including the level of competition, technological content, lifecycle length,
customer preferences, and so on. Section 2.2.1 discusses the importance of the production
ramp-up phase in more detail. In addition, section 2.2.2 highlights the importance of lean and
agile logistics activities.
Chapter One General Framework
7
1.3.2. Research Contributions According to Doltsinis et al. (2013), significant potential for improvement is possible in the
production ramp-up phase. Zeugträger (1998) argued that the fundamental chances to reduce
the efforts exerted during the ramp-up phase are unemployed. Bischoff (2007) showed that –
unlike serial production – enormous potential to enhance goal achievement during ramp-up
still exists. Although – and in comparison with steady-state production – Ball et al. (2011)
indicated less availability of literature on non-steady-state production, such as production
ramp-up, the authors also indicated the absence of ‘a commonly accepted body of knowledge’
regarding production ramp-up. Since most researchers have concentrated on product
development (for a review see Krishnan and Ulrich, 2001; Ernst, 2002; Kuwashima, 2012;
Kuwashima, 2013; Majava et al., 2013) and steady-state production (Neely et al., 1995;
Neely, 2005; Taticchi et al., 2010 provided comprehensive reviews of research on
performance measurement issues in steady-state production), a focus on the gap between
these two bodies of literature is necessary (Terwiesch et al., 2001; Juerging and Milling,
2005; Juerging and Milling, 2006).
This research contributes to a more comprehensive view of production ramp-up
through the exploration of previously unresearched possible driving factors and unrevealed
potential contributions of lean and agile logistics practices during this important production
stage. A thorough review of the production ramp-up literature was conducted to provide a
comprehensive reference for future research efforts in this critical field.
While the lack of research on production ramp-up is largely agreed upon, the other
variables in this research are – to different extents – characterized by a similar status.
Narasimhan et al. (2006) and Hallgren and Olhager (2009) noted a lack of clarity in the extant
literature regarding what constitutes leanness and agility, how they differ, and when to
employ each one. Shah and Ward (2003) mentioned relatively little published empirical
evidence about the implementation of lean practices and the factors that can influence their
implementation.
As regards logistics in general, while many studies have acknowledged the role of
logistics and supply chain management in improving production (see Cooper, 1993a; Gustin
et al., 1994; Stank et al., 2001; Gimenez and Ventura, 2003), very few studies have analysed
this role empirically (Gimenez and Ventura, 2005; Christopher, 2011). This research
empirically links the three important – but sketchily researched and formerly unlinked –
concepts of lean logistics, agile logistics, and production ramp-up, therefore providing a wider

Chapter One General Framework
8
and more integrated view of these constructs with, however, a greater focus on production
ramp-up.
In addition, Terwiesch et al. (2001) stated that more research is needed to overcome
the problem of the single-company research approach that hinders the ability of other
companies with different operational environments to benefit from it. While very limited
research has been conducted in multi-company settings (e.g. Langowitz, 1988; Clark and
Fujimoto, 1991; Di Benedetto, 1999; Li et al., 2014), the single-company approach has been
followed by the vast majority of researchers in this field (e.g. Adler and Clark, 1991; Merwe
and Frizelle, 2003; Scholz-Reiter et al., 2007; Du et al., 2008; Fjällström et al., 2009). The
current research collected and analysed data from different companies operating in different
industrial sectors and investigated possible variations according to the differences in sector,
product type, country, and other variables.
Furthermore, this research contributes to the efforts devoted to developing a
measurement tool for ramp-up performance. Per se, developing and employing measurement
methods of logistical leanness/agility levels and ramp-up performance are helpful in
providing appropriate feedback for employees in the corresponding areas, which should be
positively reflected in their performance. In an empirical study, Stansfield and Longenecker
(2006) recorded an approximate 10% productivity improvement as a result of providing
feedback on performance. Doltsinis et al. (2013) mentioned the role of feedback and goal-
setting clarity in supporting decision making during ramp-up and, consequently, in reducing
the time required.
However, instead of the traditional generic view of logistics, this research considers
two streams of logistics activities linked to the significant objectives of waste elimination and
flexibility, namely lean logistics and agile logistics. A logistics system with unknown or
undetermined levels of flexibility and cost control is less relevant to the current business
environment. Any logistics activity should be judged according to its ability to achieve certain
levels of leanness and/or agility. In addition, logistics activities are classified into three
categories: inbound, intra, and outbound logistics.
Furthermore, this research takes a further step forward by analysing the effect of ramp-
up performance on the overall success of the product being ramped up. Such an analysis
provides an additional insight regarding which ramp-up performance criterion leads to more
desirable outcomes in terms of the product’s performance after introduction.
Beside the theoretical and practical contributions of this research, a methodological
contribution is also made through the use of two methodological approaches, confirmatory
Chapter One General Framework
9
and exploratory, in addition to the complexity of the model used, which includes mediating
and moderating variables as well as the dependent and independent variables. Furthermore,
the data analysis utilizes a wide variety of statistical tools to test the measurement model, the
structural model, and the proposed hypotheses.
1.4. Objectives In addition to enhancing our theoretical understanding of the production ramp-up phase, this
research aims to enhance practically the phase control and outcomes by evaluating the
relationship between the production performance during this phase and the key activities of
lean and agile logistics, which are increasingly considered as the most influential paradigms
in the logistics literature. Exploring and analysing the effect of lean and/or agile logistics on
production ramp-up performance parameters could substantially affect ramp-up phase
performance. This major objective and the other objectives of the current research are detailed
in the following goals:
• Providing a comprehensive review of the production ramp-up literature, which is
becoming increasingly necessary.
• Contributing to the available research efforts with the aim of constructing a
measurement tool for ramp-up performance.
• Exploring the effect of lean logistics and its sub-variables on production ramp-up
performance in terms of quantity, quality, and cost.
• Exploring the effect of agile logistics and its sub-variables on ramp-up’s quantity,
quality, and cost performance.
• Exploring the direct effect of the variation in ramp-up performance on new product
success in terms of sales return, net profit, market share, and customer satisfaction.
• Clarifying the moderating effect of selected respondent-, organization-, and product-
related variables on the strength of the relationship between lean and agile logistics on
the one hand and production ramp-up performance on the other.
• Investigating the mediating role of outbound lean and agile logistics activities on the
relationship between production ramp-up and new product success (since outbound
logistics take place after the end of production and studying their effect on ramp-up is
irrelevant).
• Proposing a model that employs lean and agile logistics during the ramp-up phase and
afterwards during the steady-state production phase in a way that supports the
different goals of these different phases.

Chapter One General Framework
10
• Validating the proposed model using lifecycle profitability analysis.
Forza (2002) indicated the importance of identifying the unit of analysis while forming
the research questions and objectives. Flynn et al. (1990) indicated that the unit of analysis in
OPM research could be individuals, groups, plants, divisions, companies, projects, systems,
and so on. In the current research, the unit of analysis is the ramp-up process for a single
product; this might include different divisions, time periods, and systems. Some researchers
(e.g. Gross and Renner, 2010) have considered the ramp-up process as a distinctive time-
limited project; therefore, the unit of analysis could be considered as the ramp-up project for a
specific product. The data collection process and concluding results and findings should
consider the same reference level. However, since the use of the ramp-up process as a unit of
analysis comprises different divisions, activities, organizational levels, and even supply
chains together, cross-level inference becomes more relevant, as explained by Babbie (1990).
Figure 1.2 provides a simplified research model that illustrates the proposed
relationships between the research variables, including the direct relationships between
dependent and independent variables and the moderating effect of the respondent-,
organization-, and product-related variables. The research’s sub-variables and the detailed
research model were identified and formed based on a comprehensive literature review and
are presented in figure 4.3 on page 101. The research’s main and sub-hypotheses were
formulated according to the proposed model of relationships (see section 5.3.1).
Figure 1.2: Basic structural model
Direct effect
New product success
Production ramp-up
Lean logistics Agile logistics
Moderating variables Moderating effect

Chapter One General Framework
11
Building on the results obtained from testing the hypotheses and on the examination of
the strength of the relationships between variables, constructs, and single measures, a mixed
production model was introduced (see chapter 6) to support higher levels of flexibility during
the ramp-up phase and higher levels of cost control during the steady-state and ramp-down
phases. These are achieved through the employment of different lean and/or agile logistics
activities during the different production stages. The proposed preliminary model was further
validated using lifecycle profitability analysis. The cumulative lifecycle profitability for the
mixed production system will be compared with those of the lean system, agile system, and
leagile system.
Consequently, the results of this research help to create an elementary model for a
logistics system that switches between lean and agile logistics according to the requirements
of the production phase, rather than combining lean and agile logistics in one system, which
might produce a level of flexibility lower than that required by the ramp-up phase and a level
of waste reduction lower than that required by the steady-state and ramp-down production
phases. Such a strategy might maximize the overall product lifecycle profitability and success.
1.5. Positioning To position the current research in the related body of literature, a review of the literature in
the fields of production ramp-up, lean logistics, and agile logistics was carried out and a
graphical illustration of the researched variables is introduced to simplify the detection of this
research position within the existing literature and to explore more points of research and
gaps.
Enhanced performance during production ramp-up might be accomplished through
enhancing the production ramp-up activities themselves or, alternatively, through enhancing
other activities that can directly affect ramp-up performance. In accordance with these two
ways, two main streams of research have arisen in the literature. The first stream, which aims
to enhance ramp-up performance internally, has focused on such variables as ramp-up
patterns and strategies (Terwiesch and Bohn, 2001; Schuh et al., 2005a), ramp-up
management and control (Nyhuis and Winkler, 2004; Lee and Matsuo, 2012), and key ramp-
up success factor identification (Di Benedetto, 1999). On the other hand, the research stream
that has focused rather on the variables affecting ramp-up performance has included many
aspects, such as the type and source of information (Fjällström et al., 2009); product
complexity, newness, and novelty (Frizelle and Gregory, 2000; Pufall et al., 2007; and Merwe
and Frizelle, 2003, respectively); product change (Scholz-Reiter et al., 2007); tooling and
Chapter One General Framework
12
equipment (Almgren, 2000; Haller et al., 2003); lot size (Sturm et al., 2003); work
organization (Almgren, 1999b); space requirements (Ball et al., 2011); and many other
factors. Section 2.3.1 provides a more detailed review of the wide range of factors affecting
ramp-up performance.
Among the factors affecting ramp-up performance, logistics has frequently been
mentioned; however, only a limited set of logistics variables or activities have actually been
researched. Such variables include logistics facilities and the design of logistics (Pufall et al.,
2007), material flow (Almgren, 2000), parts supply (Almgren, 1999a), material quality
(Fjällström et al., 2009), and supplier network collaboration (Li et al., 2014).
This research investigated a wider range of logistics activities that are related to the
specific practices of lean and agile logistics and divided the underlying logistics activities into
inbound, intra, and outbound logistics, as shown in the detailed research model (figure 4.3,
page 101). The direct effect of inbound and intra logistics activities on ramp-up performance
and the mediating role of outbound logistics in the relationship between ramp-up performance
and new product success were considered.
In addition to the two previously mentioned streams of research, many researchers
have indicated the effect of ramp-up on other variables or outcomes, such as the learning rate
(Haller et al., 2003; Ball et al., 2011), reconfiguration time (Matta et al., 2007; Niroomand et
al., 2012), yields (Schuh et al., 2005a), timing of revenue (Terwiesch et al., 2001),
profitability (Carrillo and Franza, 2006), cost of lost sales (Cantamessa and Valentini, 2000),
and total costs (Glock et al., 2012). The current research empirically investigates the effect of
production ramp-up performance on new product success in terms of sales return, net profit,
market share, and customer satisfaction.
The inclusion of moderating variables in the analysis of the relationships between
ramp-up and other variables is greatly lacking in the literature. Moderating variables affect the
strength of the relationships between dependent and independent variables (Baron and Kenny,
1986; Krishnaswamy et al., 2009). Including respondent-, organization-, and product-related
variables as moderating variables can be helpful for understanding the variation in the results
from one situation to another and identifying organizations that can benefit more from the
research results.
Figure 1.3 identifies the current research’s position in and contributions to the related
literature. Beside those mentioned in figure 1.3, other streams of research within the ramp-up
literature include conceptual frameworks aiming to enhance the understanding of this phase

Chapter One General Framework
13
(e.g. Lenfle and Midler, 2009; Schmitt and Schmitt, 2013) and literature reviews (Elstner and
Krause, 2013; Surbier et al., 2014).
Figure 1.3: Research positioning
1.6. Methodological Approach This empirical research followed the survey research methodology (Malhotra and Grover,
1998; Forza, 2002; Groves et al., 2009; Fowler, 2014). The importance of conducting
empirical research to bridge the gap between theory and practice in the operations and
production management (OPM) field was highlighted by Flynn et al. (1990), and the
Previous research
Production ramp-up
Moderating variables
Enhancing ramp-up internally
Enhancing ramp-up through external factors
Factors affected by ramp-up Product lifecycle
Profitability Market share
Yields Revenue timing Learning rates Agility levels Lost sales
Factors affecting ramp-up Product/process complexity
Deliberate learning Technology Lot size Tooling/equipment Product/process newness
Product/process development Product/process change
Logistics Management-related factors
Employee-related factors Collaboration
Logistics facility Design of logistics
Material flow Parts supply
Ramp-up management Ramp-up control
Ramp-up strategies Ramp-up patterns
Lean logistics
Agile logistics
Current research

Chapter One General Framework
14
significance of survey research in OPM was indicated by Flynn et al. (1990) and Malhotra
and Grover (1998). The starting point was to identify gaps and research points in the
literature; prolonged reading in the fields of production ramp-up and logistics revealed an
important gap representing the absence of any attempt in the literature to link production
ramp-up to lean and/or agile logistics. Beside this gap, additional gaps could be identified as
follows:
• The lack of sufficient understanding of the production ramp-up phase.
• The lack of comprehensive reviews of the ramp-up literature.
• The lack of sufficient attempts to compare and combine the lean and agile logistics
paradigms.
• The absence of a model that encompasses leanness and agility in analysing the total
product lifecycle performance and considers the three phases of ramp-up, steady-state,
and ramp-down.
• Relatively little empirical research is available in the fields of production ramp-up,
lean logistics, and agile logistics.
• The employment of both mediating and moderating variables in the ramp-up research
is limited.
• Researches targeting multiple companies and considered different environments are
very rare.
To investigate the role of lean and agile logistics empirically during ramp-up, a survey
questionnaire was formed, based on the literature, to measure each of the research variables.
Each item used in the questionnaire was supported by the literature and the entire
questionnaire was tested for its validity and reliability. The next step was to use the survey
questionnaire in primary data collection, then the collected data were analysed using many
qualitative and quantitative statistical techniques. Both confirmative and explorative
methodologies were utilized. The confirmative methodology was used to test the proposed
hypotheses, based on the relational model suggested, and further explorative analyses were
conducted to examine the additional potentials of the data collected.
The results of the explorative data analysis were used to develop a preliminary model
to employ lean and agile logistics during and after the ramp-up phase to enhance the total
product lifecycle performance. This model was tested and verified using lifecycle profitability
analysis. Finally, the conclusions and recommendations were developed and the limitations
mentioned. Figure 1.4 illustrates the steps followed in the research’s construction. These steps
Chapter One General Framework
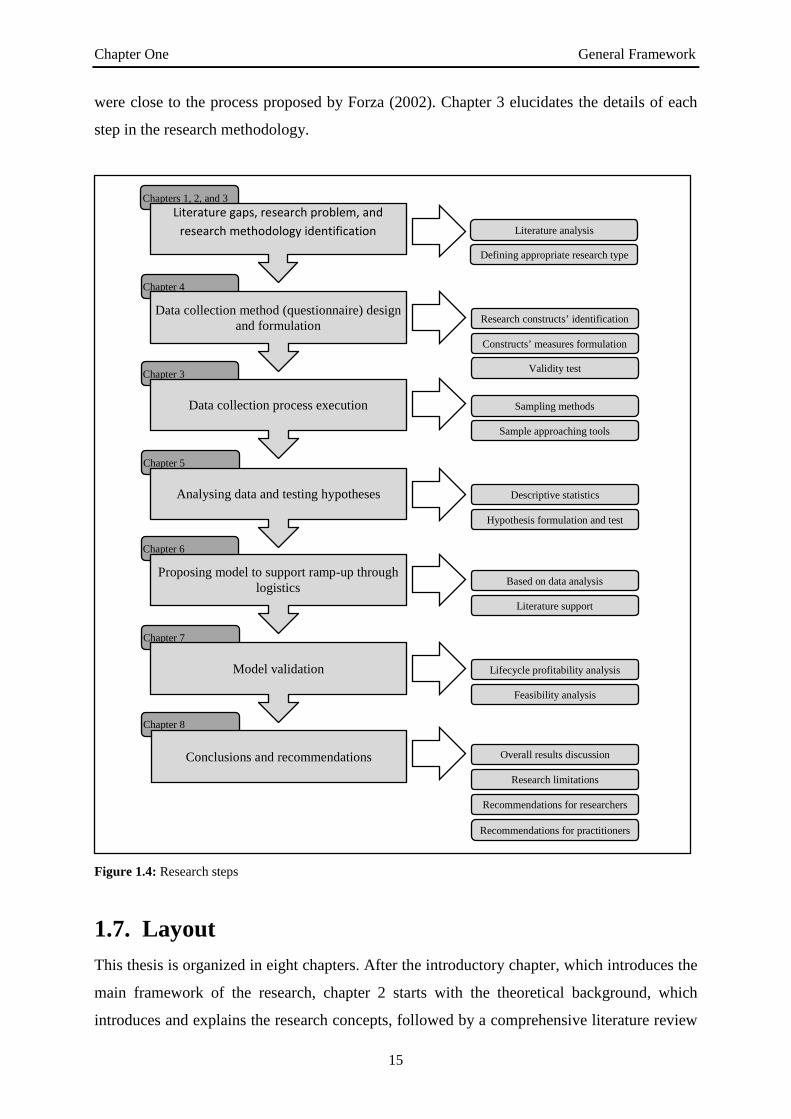
15
were close to the process proposed by Forza (2002). Chapter 3 elucidates the details of each
step in the research methodology.
Figure 1.4: Research steps
1.7. Layout This thesis is organized in eight chapters. After the introductory chapter, which introduces the
main framework of the research, chapter 2 starts with the theoretical background, which
introduces and explains the research concepts, followed by a comprehensive literature review
Chapter 8
Chapters 1, 2, and 3
Literature analysis Literature gaps, research problem, and
research methodology identification
Defining appropriate research type
Conclusions and recommendations
Chapter 4
Research constructs’ identification Data collection method (questionnaire) design and formulation
Constructs’ measures formulation
Chapter 3
Sampling methods Data collection process execution Sample approaching tools
Chapter 5
Descriptive statistics Analysing data and testing hypotheses Hypothesis formulation and test
Chapter 6
Based on data analysis Proposing model to support ramp-up through logistics
Literature support
Chapter 7
Lifecycle profitability analysis Model validation Feasibility analysis
Overall results discussion Research limitations
Recommendations for researchers
Validity test
Recommendations for practitioners

Chapter One General Framework
16
of the field of production ramp-up – as the main research variable – and a limited review of
the fields of lean logistics, agile logistics, and product success. Research investigating the
interaction between different research variables is also considered. In chapter 3, the
methodology of research is completely clarified, including the steps followed and the
rationale behind each step. More focus was directed to the data collection tool, the data
collection process, and the statistical analyses conducted. The statistical tests used to examine
the quality of the measurement model, the collected data, and the data analysis are presented
in this chapter.
The development of the data collection tool and the dimensions used to measure each
research variable are the focus of chapter 4, which aims to show how the literature supports
the use of the selected measurement tools. The results of the statistical analysis are presented
in chapter 5, including descriptive statistics, correlations between research variables, and
testing of the main and subsidiary hypotheses. Different scenarios are used and compared
according to certain statistical parameters.
Chapter 6 provides a model based on the results of the hypothesis testing and further
statistical analysis, aiming to utilize different lean and agile logistics tools considering the
ramp-up phase’s special environment. A mixed production model with greater agility during
ramp-up and greater leanness thereafter is introduced, and the tools required to apply such a
model are discussed, with a special focus on the idea of investing in a specialized agile ramp-
up facility.
This model is further tested and validated using profitability analysis over the entire
product lifecycle in chapter 7. Additionally, different strategies are compared according to
their overall lifecycle profitability. In chapter 8, the research results are discussed and
compared with the existing literature; in addition, the concluding limitations and
recommendations for researchers and practitioners are presented.

Chapter Two Background and Literature
17
CHAPTER 2
BACKGROUND AND LITERATURE
2.1. Introduction This chapter is divided into two main sections. The first section introduces the main research
variables, namely production ramp-up, lean logistics, and agile logistics. The second section
provides a review of the related literature that considers the ramp-up process, lean logistics,
and agile logistics and the attempts to link the research variables together. In both sections,
more attention is devoted to production ramp-up as the main research variable due to the lack
of sufficient understanding and research efforts in this field, as noted by most researchers in
the field.
2.2. Theoretical Background This section aims to help readers from different backgrounds to become more familiar with
the terms and concepts used throughout this research. This, in turn, helps to reduce the
misunderstandings, misconceptions, and probable confusion caused by the multifaceted
nature of the fields researched. In addition, a concrete theoretical background helps to make
the research – to some extent – more self-contained. This research draws on three strands of
research, as it considers the role of lean logistics and agile logistics during production ramp-

Chapter Two Background and Literature
18
up. Ramp-up is primarily the dependent variable. However, the effect of ramp-up
performance (here as an independent variable) on product success is also considered. While
the effect of ramp-up performance on new product success is measured, developing a
theoretical background or a literature review for the dimensions of product success is beyond
the scope of this research.
2.2.1. Production Ramp-Up In any factory, every new product introduced must undergo a ramp-up process (Terwiesch
and Bohn, 2001). However, production ramp-up is not restricted to new products. Modified
products (Gross and Renner, 2010; Doltsinis et al., 2014), new production processes
(Terwiesch and Xu, 2004), new manufacturing facilities (Terwiesch and Bohn, 2001; Simon
et al., 2008; Willmann et al., 2014), new production lines (Terwiesch et al., 2001), new
production technology (Salomon and Martin, 2008; Gross and Renner, 2010), the
reintroduction of old products (Chatzimichali and Tourassis, 2008), or even a sudden increase
in the demand for an existing product require a ramp-up process. In general, the concept of
production ramp-up implies a steep increase in the production curve followed by a relatively
stable production phase called the stead-state production phase (see figure 2.1).
Wheelwright and Clark (1992) elucidated the start of commercial production at
relatively low levels of volume and the increase in these levels as the manufacturer develops
confidence in its manufacturing (as well as its suppliers’) abilities. During the ramp-up phase,
production builds up its output levels to the targeted quantities (Woodcock et al., 2000) and
reaches a steady-state or serial production (Abernathy and Baloff, 1973).
Terminology and Chronology The literature has provided several definitions of production ramp-up. In general, authors
have agreed on the inclusion of the sharp increase in production rates in the ramp-up phase.
However, they have disagreed about its chronological limits (Ball et al., 2011). The definition
of the ramp-up phase is frequently linked to its temporal boundaries, the phase into which it
should be categorized, and the outcomes that should be achieved by its end. Researchers have
presented different arguments regarding all the variables related to the definition of the ramp-
up phase, including the starting point, the ending point, the categorization, and the outcomes.
The current research considers a similar approach by adopting the definition of ramp-
up as the production phase starting with the preparations to produce the first lot intended for

Chapter Two Background and Literature
19
sale and ending with the attainment of the targeted stable production level. This definition
excludes pilot production and steady-state production from being part of the ramp-up phase.
Figure 2.1: Simplified illustration of the ramp-up phase
Some researchers have followed different alternatives to define production ramp-up.
Doltsinis et al. (2013) defined ramp-up in terms of a sequence of adaptations and adjustments
applied to a production system in which: (1) each adjustment changes the system’s condition;
(2) the system remains stable between adjustments; and (3) a short time period elapses
between one adjustment and another. Gustmann et al. (1989) referred to ramp-up as the
process of integrating innovation and industrial production. Concentrating on the auto
industry, Gross and Renner (2010) stated that the ramp-up phase includes all the developing
and improving activities taking place after product development or product modification.
Different arguments on the ramp-up phase’s start, end, expected outcomes, time (time-to-
volume) consideration, categorization, and alternative concepts are explained in the following
sections.
Ramp-Up Phase’s Start, End, and Outcomes Many different points have been mentioned by different researchers as the start of the ramp-
up phase, including the completion of the new product development process (Bohn and
Terwiesch, 1999); the end of the designing and building of the production system (Doltsinis et
al., 2013); the end of the prototyping phase (Sturm et al., 2003); the release of pilot
Production ramp-up Steady-state production
Vol
ume
Time
Start of production
Reach of production targets
End of maturity phase
Production ramp-down

Chapter Two Background and Literature
20
production (Buescher et al., 2012); the zero production point (Terwiesch et al., 2001); low-
level production (Ball et al., 2011); the start of production, the first item produced, or the first
lot produced (Fjällström et al., 2009; Simon et al., 2008; Haller et al., 2003, respectively);
small laboratory-like production (Terwiesch and Xu, 2004); the reconfiguration of the
manufacturing system (Koren et al., 1999; Matta et al., 2008); and the start of commercial
production (Surbier et al., 2014). In addition to the actual execution of ramp-up activities,
Romberg and Haas (2005) considered the ramp-up planning process and stated that it might
start as early as the beginning of a new product development process, since the ramp-up
planning needs to take place long before the actual production starts.
Similarly, the ending point of the ramp-up phase has been reported differently as
reaching full capacity utilization (Terwiesch and Bohn, 2001), full operation (Doltsinis et al.,
2013), peak production (Schmitt and Schmitt, 2013), high-volume production (Terwiesch and
Xu, 2004), full-volume production (Sturm et al., 2003), production maturity (Surbier et al.,
2014), a steady-state output rate (Simon et al., 2008), the initial production targets (Fjällström
et al., 2009), or the required production rate (Ball et al., 2011).
By the end of the ramp-up phase and the reaching of the targeted volume, the
production system should be at or near the targeted levels of cost and quality (Terwiesch et
al., 2001; Säfsten et al., 2006), meet the predetermined production lead time (Juerging and
Milling, 2006), achieve the targeted operational characteristics (Doltsinis et al., 2013), and
reach the targeted levels of yields (Säfsten et al., 2006). Additionally, Almgren (1999a)
elucidated that by reaching the steady-state production phase: (1) the output rate is uniform,
(2) the workforce is stabilized, (3) knowledge and skills are developed, (4) machines and
equipment are debugged, and (5) support systems are fine-tuned. However, the end of the
ramp-up process does not necessarily imply the achievement of all these targets. Clark and
Fujimoto (1991) showed, with a practical example from the auto industry, that achieving the
targeted quality might take more or less time than needed to achieve the targeted volume of
production. In addition, Salomon and Martin (2008) mentioned the dynamic nature of yields
and indicated that yields may take a long time, after achieving the targeted capacity, to
improve.
Time-to-Volume While the duration of the development time is labelled as time-to-market (Terwiesch et al.,
2001), the duration of the ramp-up phase is frequently labelled as time-to-volume (Sturm et
al., 2003). However, some researchers (e.g. Juerging and Milling, 2005) have indicated that
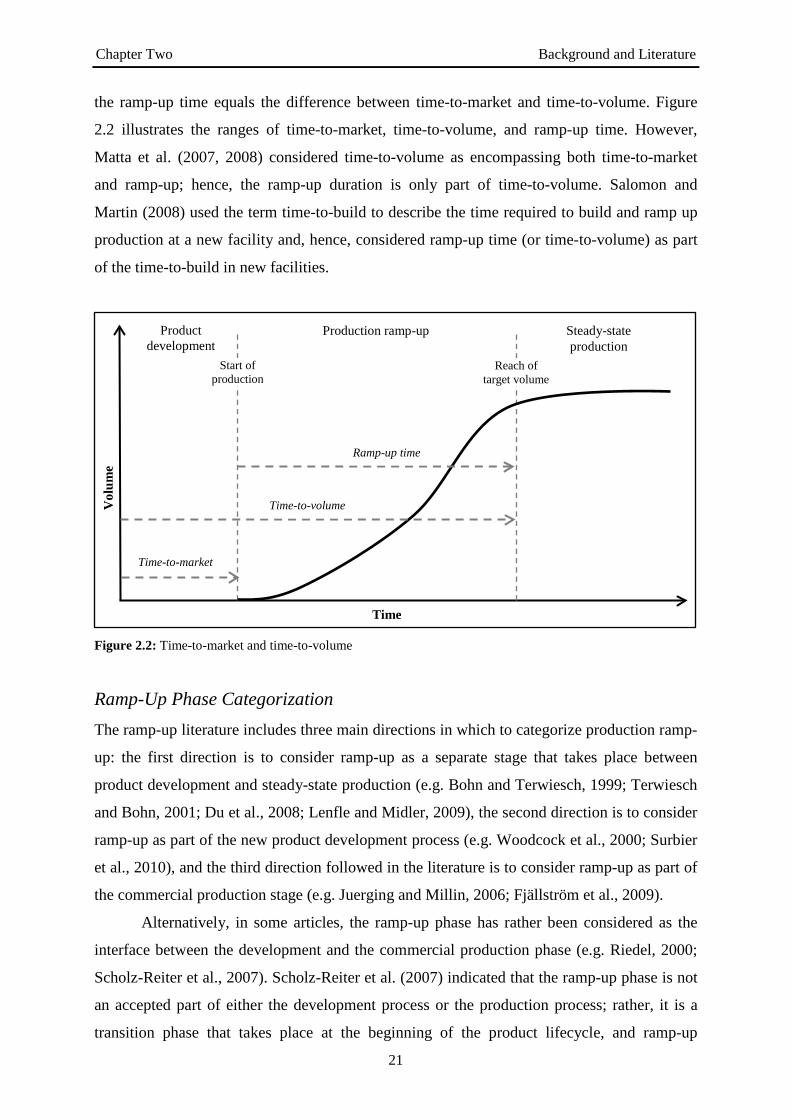
Chapter Two Background and Literature
21
the ramp-up time equals the difference between time-to-market and time-to-volume. Figure
2.2 illustrates the ranges of time-to-market, time-to-volume, and ramp-up time. However,
Matta et al. (2007, 2008) considered time-to-volume as encompassing both time-to-market
and ramp-up; hence, the ramp-up duration is only part of time-to-volume. Salomon and
Martin (2008) used the term time-to-build to describe the time required to build and ramp up
production at a new facility and, hence, considered ramp-up time (or time-to-volume) as part
of the time-to-build in new facilities.
Figure 2.2: Time-to-market and time-to-volume
Ramp-Up Phase Categorization The ramp-up literature includes three main directions in which to categorize production ramp-
up: the first direction is to consider ramp-up as a separate stage that takes place between
product development and steady-state production (e.g. Bohn and Terwiesch, 1999; Terwiesch
and Bohn, 2001; Du et al., 2008; Lenfle and Midler, 2009), the second direction is to consider
ramp-up as part of the new product development process (e.g. Woodcock et al., 2000; Surbier
et al., 2010), and the third direction followed in the literature is to consider ramp-up as part of
the commercial production stage (e.g. Juerging and Millin, 2006; Fjällström et al., 2009).
Alternatively, in some articles, the ramp-up phase has rather been considered as the
interface between the development and the commercial production phase (e.g. Riedel, 2000;
Scholz-Reiter et al., 2007). Scholz-Reiter et al. (2007) indicated that the ramp-up phase is not
an accepted part of either the development process or the production process; rather, it is a
transition phase that takes place at the beginning of the product lifecycle, and ramp-up
Production ramp-up
Reach of target volume
Vol
ume
Time
Start of production
Product development
Steady-state production
Time-to-market
Time-to-volume
Ramp-up time

Chapter Two Background and Literature
22
process activities are included in the development and manufacturing processes (see figure
2.3).
Figure 2.3: Ramp-up phase as illustrated by Scholz-Reiter et al. (2007)
Concerning research that has considered ramp-up as a separate phase, instead of
referring to the entire time period between the end of development and the achievement of full
capacity utilization as the production ramp-up phase, Almgren (2000) considered ramp-up as
one of the different components of this phase, which was referred to as the ‘final verification
phase’. According to Almgren (1999c) and Almgren (2000), the final verification phase
includes pilot production and production starts-up. The latter is further divided into low-
volume and high-volume or ramp-up phases. In this classification, the concept of ramp-up
refers to the sharp rise in the production volume during the unit of time in relation to a target.
Alternatively, Lenfle and Midler (2009) considered ramp-up and the commercial launch of a
new product as two different processes, together composing the product launch phase.
Winkler et al. (2007) stated that the development phase ends with the approval for production
ramp-up and proposed an initial classification of the development, production ramp-up, and
production phases.
Regular productivity
Process development
Delimitation of the phases
Product development
Milestones Customer compliant
product (job no.1)
Handover – series tools
Release – ramp-up
phase
Release – design
drawings
New product development phase Product phase
Production ramp-up phase
Production change management
Equipment Planning
Setting up equipment
Process testing
Zero series Production ramp-up
Confirmation production
Part design
Part integration
Pre-production model

Chapter Two Background and Literature
23
Considering the second direction, in which many researchers have attempted to
mention production ramp-up as part of the development phase (e.g. Fujimoto, 1989; Clark and
Fujimoto, 1991; Cooper, 1993b; Krishnan and Ulrich, 2001), Fujimoto (1989) inserted pilot
production and manufacturing start-up into the rubric of manufacturing engineering. Clark
and Fujimoto (1991) attempted to consider pilot production and production start-up as the
final steps in the new product development process. Cooper (1993b) indicated that new
product development consists of four stages: (1) concept and development, (2) product
planning, (3) product and process engineering, and (4) pilot production and ramp-up.
Krishnan and Ulrich (2001) included production ramp-up and product launch within the same
phase when they divided the product development project decisions into four categories:
concept development, supply chain design, product design, and production ramp-up and
launch. Furthermore, Surbier et al. (2014) indicated that the ramp-up issue stems from the
new product development literature and defined the ramp-up phase as the last step of the new
product development process.
On the other hand, regarding the third direction, which refers to ramp-up as an
inseparable part of the commercial production phase, Juerging and Milling (2006) considered
production ramp-up as part of series production and including only the stage of a steep
increase in the production curve. The authors referred to the starting process with a flatter
shape of the production curve as production start-up. Furthermore, Fjällström et al. (2009)
considered production ramp-up as the initial period of commercial production that takes place
after finishing the product development phase.
Regardless of the categorization approach, Doltsinis et al. (2013) mentioned the dearth
of such a clear separation between the phases in the real world. Figure 2.4 illustrates the
product lifecycle stages and shows the different spans of ramp-up activities according to the
different studies in the literature.
The division of the production lifecycle into different stages should be based on the
characteristics of each stage. Therefore, the classification of production ramp-up within a
certain stage should be consistent with the agreed-upon characteristics of the ramp-up process
(see page 26). The existence of many specific characteristics of production ramp-up supports
the attempt to classify ramp-up as a separate stage. In addition, while the units produced
during ramp-up are intended for sale, the units produced during pilot production are not.
Furthermore, while considering ramp-up as part of the development process, the sketchy
analysis of ramp-up in Wheelwright and Clark (1992) and Ulrich and Eppinger (2008)
compared with other product development stages (this was mentioned by Surbier, 2010 and

Chapter Two Background and Literature
24
Surbier et al., 2014) supports the argument to consider ramp-up as a separate stage rather than
as part of the development process.
Figure 2.4: Stages of development and production and ramp-up span
Ramp-Up Phase Classification Winkler et al. (2007) indicated that a generally accepted classification of the ramp-up phase
does not exist. Similarly, Schmitt and Schmitt (2013) stated that the stages of the production
ramp-up are not described consistently in the literature. However, few attempts to classify
production ramp-up can be found in the literature. Winkler et al. (2007) proposed a division
of the ramp-up phase into the two stages of preparation and run-up. The preparation phase is
further divided into the phases of start-up and pilot production. Lee and Matsuo (2012)
mentioned that the ramp-up process usually consists of two phases; while in the first phase
frequent experimental batches are interspersed with regular production batches, few such
experimental batches are run in the second phase. Basse et al. (2014b) stated that ramp-up
encompasses three different phases: pre try-out serial, try-out serial, and serial production
start-up.
Product/process design
Production ramp-up Steady-state production
Production ramp-down
New product idea V
olum
e
Time
Pilot production
Start of production
testing
Start of commercial production
Reach of production
targets Start of product
withdrawal Production
stop
Low volume
High volume
e.g. Almgren (2000)
e.g. Terwiesch et al. (2001)
e.g. Romberg and Haas (2005)
End of product design
e.g. Doltsinis et al. (2013)
Production ramp-up span
e.g. Winkler et al. (2007)

Chapter Two Background and Literature
25
Doltsinis et al. (2013) proposed a three-stage division of the ramp-up phase. The focus
of the first ramp-up stage is on the functionality of the process, the focus of the second stage
is on the output quality, and the focus of the third stage is on performance optimization.
Scholz-Reiter et al. (2007) described the components or processes involved during the ramp-
up period of the manufacturing process. The authors stated that three chronological processes
encompass the ramp-up process: testing, pre- and zero-series production (producing the
product for the first time), and production ramp-up. Further details of the testing process were
mentioned by the authors, indicating the sub-processes of development, production facility
planning and construction, and production planning.
Alternative Concepts In addition to different definitions of ramp-up, different labels have been used in the literature
to study this production phase. Beside production ramp-up (e.g. Schuh et al., 2005b; Surbier
et al., 2009; Stauder et al., 2014) and product ramp-up (e.g. Pufall et al., 2007; Willmann et
al., 2013; Willmann et al., 2014), the following labels can be found in the literature: initial
commercial manufacturing (e.g. Langowitz, 1988), manufacturing start-up (e.g. Baloff, 1966;
Abernathy and Baloff, 1973; Clawson, 1985; Almgren, 2000), manufacturing scale-up
(Meyer, 2007), product launch (e.g. Di Benedetto, 1999; Cantamessa and Valentini, 2000),
product transfer (Terwiesch et al., 2001), and industrialization (Bassetto et al., 2011).
Slamanig and Winkler (2012) used the term ‘product change’ and stated that product change
combines the phasing out and ramping up of two consecutive product generations.
Nevertheless, studies using the rubric of production ramp-up are more numerous, more
detailed, and more popular.
Terwiesch et al. (2001) distinguished between ramp-up and start-up by connecting
ramp-up to the production of new products and start-up to the production process in new
production lines and new factories. Terwiesch and Bohn (2001) indicated the case of ramping
up production using a new process or a new plant. The authors clarified the additional
difficulties and challenges in such a situation, due to the need to learn about many traditional
variables, which might be much more obvious in an already-existing process or facility. Ball
et al. (2011) stated that in spite of using the terms ramp-up and start-up interchangeably in
some cases, start-up should be used to represent the whole phase of output rate increase, while
ramp-up represents the phase of a steep rise in the output rate. Ball et al. (2011) further
detailed that sometimes the earlier part of start-up is very short so that the two terms coincide.
Chapter Two Background and Literature
26
Some researchers, however, have considered ramp-up and start-up as the same
concept. For example, Juerging and Milling referred to the time span that represents the
difference between time-to-market and time-to-volume as production ramp-up in Juerging and
Milling (2005) and as production start-up in Juerging and Milling (2006). Haller et al. (2003)
differentiated between ramp-up and the ‘initial ramp-up’ and stated that, while ramp-up
reoccurs with each new product and product generation during the lifecycle of a factory, the
initial ramp-up – which takes place at the start of the factory lifecycle – remains the most
difficult and challenging. Witt (2006) considered ramp-up as a phase (the production phase)
among the four phases composing the product launch process.
Characteristics of the Ramp-Up Phase Many features that characterize the ramp-up period can be directly connected to performance
indicators, such as production volume, product quality, yields, time, and costs. The production
volume and total production time are functions of the cycle time, which is typically reduced in
a constant manner over time during the ramping up of the production (Abernathy and Baloff,
1973; Sturm et al., 2003). However, this contributes to the difficulty of output rate prediction
(Sturm et al., 2003). Constant cycle time reduction, along with other factors, leads to
increased production rates. In a study conducted in the steel industry, Baloff (1966) indicated
that the steady-state production rate was around ten times more than the first month’s average
production rate.
In addition to the production volume, Matta et al. (2007) indicated an increased rate of
product quality. While the existence of low but continuously increasing yields was mentioned
by Salomon and Martin (2008) and Hatch and Mowery (1998), respectively, other features
related to the manufacturing performance include sensitivity to time and cost (Bischoff,
2007), cost intensity (Winkler et al., 2007), a reduction in the unit production cost (Glock et
al., 2012), instable production processes (Fleischer et al., 2003), and constrained capacity
(Bohn and Terwiesch, 1999).
Other characteristics of the ramp-up phase are related to the nature of the phase. This
nature is frequently characterized by the originality of the product, the uninhabited production
process, and the limited employee experience. The ramp-up characteristics resulting from this
nature include: complexity (Schuh et al., 2005a; Doltsinis et al., 2013); dynamics (Juerging
and Milling, 2006); variability (Haller et al., 2003; Sturm et al., 2003; Pufall et al., 2007);
instability (Basse et al., 2014a); uncertainty (Haller et al., 2003; Sturm et al., 2003); being
non-recurring, non-repetitive, and unique (Gross and Renner, 2010; Doltsinis et al., 2013);
Chapter Two Background and Literature
27
fuzzy states of information (Scholz-Reiter et al., 2007); interdependencies of processes
executed in parallel (Juerging and Milling, 2006); and interdisciplinarity (von Cube and
Schmitt, 2014). Almgren (1999a) indicated that the complexity during ramp-up increases
even more when new technology is introduced into the production process. Winkler and
Slamanig (2011) mentioned greater complexity and more ramp-up challenges when multi-
variant serial production exists. Pufall et al. (2007) stated that greater complexity is
experienced when more facilities, and more supply chains, are engaged. Furthermore, Leitão
et al. (2013) indicated higher levels of uncertainty and instability in ramping up complicated
and highly customized products.
In general, production ramp-up is a phase of continuous change and high process
variability. Equipment capacity, yields, rework, work-in-process, dispatch policies, and other
production parameters are subject to considerable change during ramp-up (Sturm et al., 2003).
On the technical side, Haller et al. (2003) stated that, during ramp-up, the production line is
characterized by being highly unbalanced, and variation in the utilization rate among different
steps usually appears. Furthermore, Doltsinis et al. (2013) stated that production ramp-up is
characterized by trial and error decision making, which, in turn, results in frequent reiterations
and unnecessary repetition.
Initiatives to improve the production process and the installation of new tools,
equipment, and technology in addition to extensive engineering experiments, more
measurement, more analysis, and even more production stops are all sources of variation
during ramp-up (Haller et al., 2003). Such variation in production makes the ramp-up process
more difficult to plan and structure in advance (Doltsinis et al., 2013).
While some of the features characterizing the ramp-up phase are considered to be – to
some extent – controllable, such as those related to cost, quality level, and yields, many other
features are not – or are less – controllable, such as time pressure (Gross and Renner, 2010),
which is produced mainly by the customer demand levels.
Problems and Challenges during Ramp-Up Unlike the steady-state production phase, during which the production lines are balanced, the
flows of hardware and paperwork are smooth, and no major changes in product design are
assumed (Clawson, 1985), the ramp-up phase is complicated by many factors that cause more
frequent production problems and a more complicated managerial decision-making process.
The production challenges combined with the previously mentioned characteristics of the
ramp-up phase might produce production problems, such as machine breakdowns (Terwiesch

Chapter Two Background and Literature
28
and Bohn, 2001; Haller et al., 2003), process stops (Haller et al., 2003), a long setup time
(Terwiesch and Bohn, 2001), mismatch between the new product characteristics and the
production process (Langowitz, 1988), and more frequent production disturbances (Almgren,
1999b).
In addition, engineering changes are critical issue that interrupt ramp-up and hinder
efforts to reduce the time that it takes (Ball et al., 2011). These changes aim to align the
product design with the production process to guarantee the manufacturability of new
products (Chatzimichali and Tourassis, 2008). Ball et al. (2011) indicated that the majority of
engineering changes are made during production ramp-up. More engineering changes lead to
a lower production yield, more scrap, and more delays (Li et al., 2014). In general, production
problems during ramping up processes include more and greater delays (Winkler et al., 2007;
Doltsinis et al., 2013), higher requirements and special operations to correct wrong processes
or output products (Terwiesch and Bohn, 2001), and the generation of more quality issues
(Winkler et al., 2007).
Other problems mentioned in the literature include less accurate capacity forecasting
(Haller et al., 2003), less than optimal decisions (Doltsinis et al., 2013), poor cooperation and
information exchange (Surbier et al., 2009), miscommunication between employees from
different disciplines (Scholz-Reiter et al., 2007), and supply delay and material quality
problems (Langowitz, 1988; Terwiesch et al., 2001).
Schmitt and Schmitt (2013) indicated that most ramp-up problems are not solved.
Pufall et al. (2007) also mentioned that the planned targets for production volume, cost, and
quality are frequently not achieved. The research conducted by Schuh et al. (2005c) in the
auto industry showed that around 47% of ramp-ups were neither technically nor economically
successful. Also concerning the auto industry, Straube and Fitzek (2004) stated that 60% of
all ramp-ups conducted by European manufacturers missed their technological and/or
economic goals. Furthermore, in the study conducted by Kuhn et al. (2002), the authors
mentioned that not even a single company claimed that the ramp-up process was under
control.
The sources of ramp-up problems have frequently been discussed in the literature;
such problems include a poor understanding of the production process during ramp-up
(Terwiesch and Bohn, 2001; Doltsinis et al., 2013), many of the produced items or designed
systems not working properly the first time (Terwiesch and Bohn, 2001), the process
frequently being driven by trial and error rather than an overall systematic strategy (Doltsinis
et al., 2013), fast transfer from research to commercial production (Zangwill and Kantor,

Chapter Two Background and Literature
29
1998), immaturity of production lines (Nyhuis and Winkler, 2004), and time pressure (Gross
and Renner, 2010). Both Terwiesch and Bohn (2001) and Haller et al. (2003) agreed that
ramping up production in a new facility is more difficult, more complicated, and more
challenging.
Additional sources of ramp-up problems include the two conflicting factors that
usually appear during production ramp-up: the high customer demand caused by the newness
of the product and the low production levels (Terwiesch and Bohn, 2001; Terwiesch et al.,
2001). The conflict between high demand and low production causes well-known two-sided
pressure called the nutcracker effect (Mclvor et al., 1997).
Importance of Enhancing Ramp-Up Performance Most often, the importance of enhancing ramp-up performance is linked in the literature to the
reduction of ramp-up time. An agreement on the importance of reducing ramp-up time and
increasing yields and production rates as rapidly as possible exists among researchers (e.g.
Almgren, 1999b; Terwiesch and Bohn, 2001; Doltsinis et al., 2013; Li et al., 2014) and
industrial managers (Almgren, 1999a). Quick volume ramp-up is important for many reasons
(Pisano and Wheelwright, 1995). Quick ramp-up enhances the financial indicators and affects
the financial success of a product (Haller et al., 2003). For instance, quicker ramp-up leads to
higher returns (Terwiesch et al., 2001; Haller et al., 2003), higher net present value (Ball et
al., 2011), maximized profits (Doltsinis et al., 2013), shorter time-to-revenue (Li et al., 2014),
less investment payback time (Ball et al., 2011), lower lost sales costs (Schuh et al., 2005a),
and lower opportunity costs (Ball et al., 2011). Additionally, the timing of the sales return
depends highly on the length of the ramp-up period (Terwiesch et al., 2001). Furthermore, a
delay in ramp-up might lead to substantial damage claims by customers (Elstner and Krause,
2014).
Beside the financial aspects, Pisano and Wheelwright (1995) illustrated that rapid
ramp-up leads to faster market penetration, broader market acceptance, an earlier start in
accumulating experience with high-volume production, and quicker freeing up of resources to
support other development projects. Furthermore, rapid ramp-up is a source of competitive
advantage (Almgren, 2000; Glock et al., 2012) and maintaining a leading market position (Li
et al., 2014). In addition, the market value of the firm will be significantly affected if the
announced launch dates are not met (Hendricks and Singhal, 1997), exerting additional
pressure on production to cut the ramp-up time.

Chapter Two Background and Literature
30
The importance of ramp-up time reduction might also be promoted by certain cases,
such as when the season is approaching in the case of seasonal products (Li et al., 2014),
when the differentiation level of a product is low (Hatch and Mowery, 1998), when the
competition is strong (Ball et al., 2011), when the demand is high (Adler and Clark, 1991),
when the product price falls quickly (Terwiesch et al., 2001; Haller et al., 2003), and when the
lifecycle becomes shorter (Winkler et al., 2007).
In many sectors, such as electronics, the ramp-up phase itself might account for a
considerable proportion of the rapidly decreasing product lifecycle (Sturm et al., 2003). In
some cases, the entire product lifecycle might come to end before the full ramp-up has been
achieved. Haller et al. (2003) stated that in the wafer fabrication industry the full ramp-up of a
new product requires up to two years. However, Sturm et al. (2003) stated that the lifecycle
for such a product lasts for less than two years. According to Terwiesch and Bohn (2001), the
ramp-up phase might last for a quarter of the product lifecycle in the case of a hard disk drive.
Many other authors (e.g., House and Price, 1991; Matta et al., 2007; Gross and Renner, 2010)
have mentioned that the ramp-up phase constitutes a significant fraction of the total lifecycle
of a product, which renders it an essential component of the sales period.
Effective production ramp-up is vital for the success of new product introduction.
Frequently developing new products is considered as a key factor of leading companies’
success (Clark and Fujimoto, 1991; Carrillo and Franza, 2006). Many authors have
demonstrated the importance of introducing new products for any manufacturer. Ball et al.
(2011) stated that the quick introduction of new products is positively reflected in the
performance of a company. Terwiesch and Bohn (2001) showed that high-tech products’
launches are often either delayed or scaled back because of ramp-up problems. In addition,
the late introduction of new products affects a company’s ability to maintain its market share
(Niroomand et al., 2014). Furthermore, Scholz-Reiter et al. (2007) claimed that the ramp-up
phase plays an important role in the overall business success.
The overlap between time-to-market and time-to-volume represents another point of
significance for the ramp-up phase. Since the products produced during the pilot production
phase are not intended for sale, the initial lots produced during production ramp-up are the
first ones introduced to the market; hence, it is not only time-to-volume that depends on the
pace of the ramping up of the new product but also time-to-market. Strubelt and Zadek (2010)
indicated that ramp-up management aims to reduce both time-to-market and time-to-volume.
Scholz-Reiter et al. (2007) indicated that the management of technical product changes taking
place during ramp-up ultimately affects time-to-market.
Chapter Two Background and Literature
31
Ramp-Up and Learning Learning is one of the highly relevant fields that has frequently been mentioned in the ramp-
up literature (Almgren, 2000; Terwiesch and Bohn, 2001; Haller et al., 2003; Ball et al.,
2011). Terwiesch and Xu (2004) referred to learning during the ramp-up phase as the process
of reducing the discrepancies between the way in which the process is specified in the process
recipe and the way in which it is actually performed. Zangwill and Kantor (1998) referred to
this learning process as waste reduction. Ball et al. (2011) conveyed an agreement through the
literature on the existence of a strong correlation between ramp-up and learning curves. The
strength of the relationship between ramp-up and learning led Pegels (1976) to deal with the
start-up curve and the learning curve as the same thing. Almgren (1999a) stated that the
increase in manufacturing performance during start-up is frequently represented in terms of
learning curves. Abernathy and Baloff (1973) stated that, in producing a new product,
productivity increases significantly as employees gain familiarity with the new product and
process. Similarly, Glock et al. (2012) considered the ramp-up phase as a result of learning.
Researchers have continued to explain the learning effect during ramp-up. Terwiesch
et al. (2001) mentioned that with the learning process that takes place over time, the yields
and capacity utilization increase. Lenfle and Midler (2009) emphasized the effect of worker
learning on enhancing the ramp-up efficiency, and Juerging and Milling (2006) added that
efficiency enhancement during start-up is mostly based on learning effects that take place on
the individual, group, and organizational levels. Other learning effects include better
equipment utilization, more quality improvement, and fewer labour requirements (Glock et
al., 2012).
The effect of learning, however, might have another side. Terwiesch and Bohn (2001)
mentioned some drawbacks to learning (represented in experiments) during ramp-up,
including the consumption of capacity that should be used for regular production and
increased deviation from the optimal process control, which, in turn, reduces yields. This
effect necessitates a kind of balance or trade-off between experiments and production.
Beside the effect of learning on ramp-up performance, researchers have indicated the
opposite-direction effect of ramp-up on the learning process. While Carrillo and Gaimon
(2000) mentioned that change in the production process will reduce the production capacity in
the short term, Terwiesch and Xu (2004) claimed that change affects the learning process
itself and therefore should be delayed until an acceptable level of knowledge has been
accumulated. Terwiesch and Bohn (2001) indicated that learning might be driven by volume
or even by time, and they indicated the role of management in the learning process during
Chapter Two Background and Literature
32
ramp-up. Similarly, Almgren (1999a) stated that the output rate is used to measure the
experience levels. Considering the effect of the output rate on learning, Ball et al. (2011)
concluded that low-volume products involve slower learning than high-volume products.
While Haller et al. (2003) indicated that a shorter cycle time leads to a shorter learning
cycle, which ultimately affects the learning process positively, Ball et al. (2011) stated that
learning increases as the ramp-up time duration increases. A shorter cycle time duration will
definitely reduce the total ramp-up time; hence, a trade-off between the promising benefits of
the duration of the learning cycle and the frequency of these cycles might be helpful, taking
into account the opportunity cost of learning as a whole. This opportunity cost was mentioned
by Terwiesch and Bohn (2001).
Lenfle and Midler (2009) stressed the importance of the ramp-up phase for learning
and referred to it as a ‘key learning opportunity’. However, Chatzimichali and Tourassis
(2008) stated that in the case of new products, learning becomes more complex, unlike mature
products that have been reintroduced into the production line several times and for which the
difficulties of the ramp-up phase have already been overcome and the forecasting of future
quality using the learning curve is easier.
The consideration of different types of learning has been another point of interest in
the ramp-up literature. Pisano (1997) differentiated between learning by doing and learning
before doing in field research in the pharmaceutical industry; Terwiesch and Xu (2004)
illustrated that learning before doing takes place prior to the commercial production phase.
Alternatively, Terwiesch and Bohn (2001) differentiated between induced learning (such as
experimentation) and autonomous learning – that is, production experience. Alongside this,
Almgren (1999a) distinguished the learning curve from the function and experience curve,
and stated that the latter includes factors other than direct labour learning. Other researchers
have investigated the role of learning in production ramp-up, including Hatch and Mowery
(1998), Cantamessa and Valentini (2000), Säfsten et al. (2008a, 2008b), Scrimieri et al.
(2013), Doltsinis et al. (2014), and Hansen and Grunow (2015).
2.2.2. Lean and Agile Logistics Logistics means different things for different researchers with different backgrounds and
perspectives. Russell (2000) highlighted some of these perspectives, including the military,
engineering, business, events, and process perspectives. Many accepted definitions of
logistics exist (Rutner and Langley, 2000). Considering business logistics, the Council of
Supply Chain Management Professionals (CSCMP) defined logistics as ‘that part of the

Chapter Two Background and Literature
33
supply chain process that plans, implements, and controls the efficient and effective, forward
and reverse, flow and storage of goods, services, and related information between the point of
origin and the point of consumption in order to meet customers’ requirements’ (CSCMP,
2014). This definition has been utilized by many authors (e.g. Cooper et al., 1997; Bowersox
et al., 1999; Bardi et al., 2006; Langley et al., 2008; Sutherland, 2009; Simchi-Levi et al.,
2014).
Baudin (2004) indicated some issues that restrict the use of the previous definition,
including ignorance of monetary flows, negligence of inefficient and ineffective logistics, and
a focus on customers’ requirements, which can prevent enhancements to the logistics system
that might not be directly related to meeting these requirements. In addition to the points
mentioned by Baudin (2004), it is not worthwhile mentioning the points of origin and
destination since logistics includes any movement and storage activity regardless of the origin
and destination. Furthermore, using the word ‘inventory’ instead of ‘good’ might be more
obvious in considering the three types of inventory – namely raw materials, work in process,
and finished goods.
Taking all of these points into account and considering only the manufacturing
environment, logistics in this research will be defined as follows: the process of managing the
two directional movement and storage activities of inventory, related information, and funds.
More attention, however, will be dedicated to the inventory and information flows, since the
financial flow is frequently handled by the finance department rather than the logistics or
production department. Simply the movement and storage activities of physical inventory and
related information will be considered throughout this research. A similar, but abbreviated,
definition was provided by Delaney (1996), who stated that logistics refers to the management
of inventory in motion and at rest.
Figure 2.5 provides an overview of logistics flows, including inventory, information,
and money, and divisions, including inbound, intra, and outbound logistics. Only the first tier
of suppliers and distributers or customers is shown, since this research does not address the
supply chain management perspective (Houlihan, 1985; Stevens, 1989; Cooper and Ellram,
1993; Cooper et al., 1997). Alternative definitions of logistics have been provided by Shapiro
and Heskett (1984), Frazelle (2001), Baudin (2004), Gundlach et al. (2006), Heizer and
Render (2008), Christopher (2011), and others. A wide range of activities can be listed under
the logistics function; classifying a certain activity under logistics or other organizational
functions is considered to be problematic. The interfaces between logistics and each of

Chapter Two Background and Literature
34
operation and marketing have been discussed by Baudin (2004), Gimenez and Ventura
(2005), Langley et al. (2008), Christopher (2011), and many other researchers.
As for lean and agile logistics, the origins of the two disciplines can be tracked to their
manufacturing counterparts, namely lean and agile manufacturing (Jones et al., 1997; Damen,
2001). Consequently, the researching and analysing of lean and agile logistics cannot be
accomplished in isolation from lean and agile manufacturing systems. In the next sections, the
theoretical basis for leanness and agility is introduced.
Figure 2.5: Logistics flows and divisions, adapted from Langley et al. (2008)
Lean Logistics Jones et al. (1997) argued that many of the steps required in a factory to create a product
physically add little or no value for the customer. Furthermore, Womack and Jones (1994,
1996) stated that it is not uncommon to find that as few as 5% of all the activities actually add
value, 35% of the activities are necessary but also non-value-adding activities, and around
60% add no value at all. Therefore, eliminating these non-value-adding activities and the
Material flow
Supplier Manufacturer Distributer
Raw materials Work in process Finished goods
Information flow Capacity Promotion plans Delivery schedules
Funds flow Credits Consignment Invoices
Funds flow Credits Consignment Payments
Information flow Promotions Sales Orders
Material Flow Returns Repair Disposal
Intra logistics Outbound logistics
Inbound logistics

Chapter Two Background and Literature
35
costs related to them offers the biggest opportunity for performance improvement (Jones et
al., 1997). Such facts form a concrete base for adopting lean strategies.
Lean manufacturing, which was previously known as the Toyota Production System
(TPS) or the just-in-time (JIT) system, has attracted a great deal of attention (Wu, 2002), and
major manufacturers around the world have adopted this approach to enhance their
competitiveness (Zarei et al., 2011). Naylor et al. (1999) defined lean manufacturing as
developing a value stream to eliminate all waste, including time, and to ensure a level
schedule. Seven common forms of waste were defined by Taiichi Ohno: excess production,
excess processing, excess movement, excess transport, excess stock, waiting, and rectification
of mistakes (Japan Management Association, 1985; Monden, 1994).
Since many of the non-value-adding activities and waste are related to inventory
movement and storage, lean logistics contributes significantly to this process. Wu (2002)
demonstrated that the elimination of any waste in a firm’s logistics system will result in
substantial savings. Similarly, Alderton (1999) argued that between 55% and 60% of all
transport costs refer to unproductive transportation. In addition, lean manufacturing cannot be
enabled without a lean logistics system, because lean manufacturing is related to every aspect
of the logistics process (Wu, 2002).
Donald et al. (2002) defined lean logistics as the superior ability to design and
administer systems to control the movement and geographical positioning of raw materials,
work-in-process, and finished inventories at the lowest cost. Baudin (2004) stated that lean
logistics could be viewed as the logistics dimension of a lean manufacturing system (see
figure 2.6: A); this might be right but on different levels. For example, it might be more
acceptable for intra logistics activities than for external logistics activities, as the
manufacturing process takes place within the facility, and it is also more acceptable for
inbound logistics than for outbound logistics, since outbound logistics deals with finished
products. Therefore, it might be more precise to indicate that part of lean logistics is not
simply a dimension of lean manufacturing (see figure 2.6: B).
Figure 2.6: A proposes the containment of lean manufacturing to lean logistics. The
breadth of the interior shape is controversial and dependent on the boundaries between what is
considered as logistics activity and what is not. In the majority, the classification of activities
into logistics and operations categories is a theoretical matter, but practically it could rather be
a managerial decision (Baudin, 2004).
The lean concept can be extended from a single company to the entire supply chain.
Ilyas et al. (2008) argued that the lean supply chain process is a process in which the system is

Chapter Two Background and Literature
36
streamlined to reduce or eliminate waste or non-value-added activities. However, eliminating
waste as measured in time, inventory, and cost across the complete supply chain requires
continuous effort and improvement (Ilyas et al., 2007).
Figure 2.6: Lean logistics and lean manufacturing
Agile Logistics In the production and operation research literature, most of the attempts to consider agility
have highlighted the issues of linking together internal and external business environments,
knowledge-based strategies, and moving quickly in the continuously changing economy
(Katayama and Bennett, 1999; Sharifi and Zhang, 1999; Yusuf et al., 1999). Agility is a
business-wide capability that embraces organizational structures, information systems,
logistics processes, and – in particular – mindsets (Christopher and Towill, 2001). Naylor et
al. (1999) defined agility as ‘using market knowledge and a virtual corporation to exploit
profitable opportunities in a volatile marketplace’. Gunasekaran (1998) defined an agile
manufacturing enterprise in terms of four dimensions, among which cooperation and adapting
to change and uncertainty play a critical role.
Because of the volatile markets and the increasingly dynamic performance
requirements, agility is increasingly mentioned as one of the important challenges to the
international business world (van Hoek et al., 2001). Goldsby et al. (2006) found that agile
systems are often deployed in companies with short product lifecycles or very erratic demand.
Xu et al. (2003) stated that the elements behind the need for agility include complexity,
uncertainty, and heterogeneity. Agile systems rely more on actual demand than on
forecasting. Hallgren and Olhager (2009) indicated that agility is recommended for make-to-
order operations.
Damen (1994) indicated that conventional logistics systems lack the ability to react
quickly to the continuously changing environment. More intensified use of e-commerce,
Lean manufacturing
A B
Lean manufacturing Lean logistics
Lean logistics

Chapter Two Background and Literature
37
global sourcing and distribution, and many other factors (see Zhang and Sharifi, 2000)
necessitate the development of an agile logistics system. Harrison et al. (1999) introduced the
concept of agile supply chains. The idea of agility in the context of supply chain management
focuses on responsiveness (Lee and Lau, 1999; Christopher and Towill, 2000). An agile
supply chain is able to sense and respond quickly, predictably, and with high quality and
easily adapt to changes in demand.
Flexibility is a key characteristic of an agile system (Christopher and Towill, 2001). In
addition to an agile production system (Zhang, 2011) and agile logistics (Damen, 2001),
production and logistics system flexibility has been researched under a wide variety of titles,
including flexible manufacturing system (Elmaraghy, 2005), reconfigurable manufacturing
system (Niroomand et al., 2012), rapid/quick response manufacturing (Chen, 2001; Liang and
Guo, 2010; Luan et al., 2013), logistics flexibility (Zhang et al., 2005), supply chain
flexibility (Chuu, 2011; Merschmann and Thonemann, 2011; Thomé et al., 2014), transport
flexibility (Naim et al., 2006, 2010), manufacturing resilience (Ismail et al., 2011), supply
chain resilience (Christopher and Peck, 2004; Pettit et al., 2010), responsive supply chain
(Gunasekaran et al., 2008), and factory/production fitness (Ferdows and Thurnheer, 2011).
Niroomand et al. (2012) explained the features of flexible manufacturing systems,
including their ability to address changes in work orders, schedules, and tooling and their
ability to produce a variety of products within the one manufacturing system. In addition, the
authors indicated the drawbacks of such systems, including the high initial cost and the
investments required. Lee (2004) differentiated between agility, adaptability, and alignment in
the context of supply chain performance. Neely et al. (1995) stated that different authors use
the term ‘flexibility’ to represent different things, such as varying production volumes
(Wheelwright, 1984) or the ability to introduce new products rapidly (Tunälv, 1992).
Niroomand et al. (2012) affirmed that a reconfigurable manufacturing system has better
scalability than a flexible manufacturing system. In addition, a reconfigurable manufacturing
system combines the advantages of both dedicated and flexible manufacturing systems and
occupies the middle ground between their levels of quantity and variety.
More details about the concepts of lean and agile logistics can be viewed in section
4.4, page 90, which considers the development of measurement tools for lean and agile
logistics, including the inbound, intra, and outbound logistical activities.

Chapter Two Background and Literature
38
2.3. Literature Review Since production ramp-up is the main variable in this research, and due to the pressing need
for a comprehensive literature review in this field, greater emphasis is placed on reviewing its
related literature. A classification of ramp-up research was made according to the main
streams appearing in the literature. On the other hand, less attention was paid to lean and agile
logistics. However, more attention was dedicated to the attempts made in the literature to link
different research variables together, such as ramp-up and logistics, ramp-up and leanness,
ramp-up and agility, and leanness and agility. Due to the nature of this research, more
attention is paid to exploratory and empirical research.
2.3.1. Production Ramp-Up Literature In this section, the literature related to production ramp-up is reviewed to set a thorough
description of the current research situation, to establish a concrete foundation for the
concepts used as starting points for the current research, and to explore gaps that might be
bridged by the current research efforts. Although substantial research efforts have been
directed to production ramp-up, this phase has in general received less attention than its
preceding and following phases. Terwiesch et al. (2001) and Pufall et al. (2007) stressed this
fact and stated that the lack of understanding of this stage resulted from concentrating on the
product development and mass production stages and ignoring the link between them. In
addition, Doltsinis et al. (2013) mentioned that ramp-up is a stage with large potential for
further improvements, which in turn highlight the insufficient research efforts conducted in
this area; these improvement potentials were also mentioned by Pufall et al. (2007). Similarly,
Ball et al. (2011) indicated that, in comparison with the importance of ramp-up, the literature
provides insufficient information about this phase.
The lack of consensus on ramp-up’s definition and temporal ambit (as shown in
section 2.2.1) indicates the immaturity of the ramp-up literature. Schuh et al. (2005a) stated
that a complete overview of this complex phase does not exist. Furthermore, Doltsinis et al.
(2013) indicated that a systematic approach to ramp-up time reduction has yet not been
defined. In reviewing the ramp-up literature, Surbier et al. (2014) devoted more attention to
the most recent work, due to its greater impact on the domain and relevance to current issues.
However, older research should be considered since no previous reviews have been presented.
A great deal of overlapping exists between the production ramp-up literature and the
new product development literature. To a lesser extent, the ramp-up literature is related to
other fields of research, including new product commercialization (Ginn and Rubenstein,

Chapter Two Background and Literature
39
1986; Mu and Di Benedetto, 2011; Aarikka-Stenroos and Sandberg, 2012), product rollovers
(Lim and Tang, 2006; Koca et al., 2010; Billington et al., 2012), and product replacement
(Saunders and Jobber, 1994).
Ramp-Up Research Directions Research efforts in the field of production ramp-up have taken different directions and aimed
at different goals. Most research has aimed to enhance ramp-up performance by making
changes either to the ramp-up process itself or to other factors that directly affect the ramp-up
process. In this sense, the ramp-up literature can be classified into two main categories: ramp-
up management and ramp-up predictors. In addition to these two main categories, other
research directions can be identified, such as exploring the effect of ramp-up variation on
other organizational variables.
Ramp-Up Management Like other production phases, the management of ramp-up includes planning, organizing, and
controlling activities (Gross and Renner, 2010). Managing the ramp-up phase properly is an
important element to decrease the lead time and accelerate the target volume achievement
(Ball et al., 2011). Researchers have investigated the potential for enhancing ramp-up
performance through modelling the ramp-up process (Terwiesch and Bohn, 2001; Ball et al.,
2011), exploring ramp-up strategies (Clark and Fujimoto, 1991; Schuh et al., 2005a; Winkler
and Slamanig, 2011), ramp-up planning (Hüntelmann et al., 2007), enhancing the control of
the process (Winkler et al., 2007; Lee and Matsuo, 2012), or measuring the ramp-up
performance (Pufall et al., 2012b; Doltsinis et al., 2013) to enable more reliable evaluation.
However, Gross and Renner (2010) stated that ramp-up management has not been
investigated empirically in the literature and that only conceptual frameworks exist. Berg and
Säfesten (2006) noted a lack of sufficient knowledge and skills in the field of managing new
products’ ramp-up. Lee and Matsuo (2012) indicated that only a few researchers have
discussed the managerial issues related to production ramp-up. Schuh et al. (2005a) showed
that, in spite of the existence of some research efforts concerning ramp-up management in the
auto industry that utilized methods such as simultaneous engineering, project management,
and total quality management (TQM), each method provides only a limited view of ramp-up
management without actually addressing present or future problems. Basse et al. (2014a)
stressed the difficulties involved in managing the ramp-up process due to the high degree of
instability inherent in this phase.

Chapter Two Background and Literature
40
As a starting point, modelling the ramp-up process and describing its components are a
valuable tool to enhance the realization of this important phase. Ball et al. (2011) mentioned
that only a few examples of ramp-up modelling can be found in the literature and stated that a
better understanding of the ramp-up process requires the consideration of the equipment
requirement, space requirement, recurring and non-recurring costs, production plan, and
learning curve. Van der Merwe and Frizelle (2003) presented a framework based on the three
dimensions of novelty, learning, and performance. Terwiesch and Bohn (2001) highlighted
the importance of yields, production speed, and output quality in evaluating the progress of
the ramp-up process.
Concerning ramp-up strategies and planning, Clark and Fujimoto (1991) mentioned
three different ramp-up strategies that link the ramp-up process to the production of the
previous products. As shown in figure 2.7, these strategies are complete shutdown, block
introduction, or a step-by-step change.
Figure 2.7: Ramp-up strategies according to Clark and Fujimoto (1991)
Schuh et al. (2005a) introduced a holistic approach to production ramp-up that
includes the three stages of ramp-up strategy, ramp-up planning, and finally ramp-up
evaluation and benchmarking. The authors used the parameters of variety, decoupling level,
time, and utilization to express four different ramp-up strategies, namely dedication, step-by-
step, volume first, and slow motion (see figure 2.8). Slamanig and Winkler (2011) proposed
two ramp-up strategies (high-volume-low mix and low-volume-high mix) for manufacturers
with mass customization operations.
Researchers have investigated the development of decision models that enhance the
control of the ramp-up process (Glock et al., 2012). Among those, Winkler et al. (2007)
Shut down strategy
Vol
ume
Tim
Vol
ume
Vol
ume
Time Time
Block introduction strategy
Step-by-step strategy
Old product New product

Chapter Two Background and Literature
41
proposed a prognosis system based on cause-and-effect relationships aiming to exercise more
control over the ramp-up phase and reduce the potential disturbances in the process. Haller et
al. (2003) presented a methodology to enhance ramp-up performance through managing the
cycle time by monitoring work in process. Lee and Matsuo (2012) proposed a non-stationary
statistical process control that combine the learning model and statistical process control for
the ramp-up process in the semiconductor industry.
Figure 2.8: Ramp-up strategies according to Schuh et al. (2005a)
Rapid identification of the root causes of manufacturing errors is required to enhance
quality, increase productivity, and reduce the time consumed during ramp-up (Du et al.,
2008). Accordingly, Du et al. (2008) evaluated the potential role of the stream of variation
methodology (a mathematical analysis tool used in complex manufacturing systems) in this
field. Similarly, Ceglarek et al. (2004) and Barhak et al. (2005) shed light on the utilization of
the stream of variation methodology in the context of production ramp-up. Willmann et al.
(2014) proposed a knowledge-based system that examines the available parts and current
Cap
acity
Cap
acity
Cap
acity
Cap
acity
Time Time
Time Time
Dedication Step-by-step
Volume first Slow motion
Product variety
Ramp-up time
Decoupling level Utilization
Turning profits into scale strategy Turning scale into profits strategy

Chapter Two Background and Literature
42
production steps to recommend reusable parts and steps that fit the requirements of the new
ramp-up process. Other researchers interested in controlling the ramp-up period include
Nyhuis and Winkler (2004), Schuh et al. (2005b), and Du et al. (2015).
Due to its importance in evaluating the ramp-up phase’s outcomes, considerable work
has been dedicated to measuring ramp-up performance. Doltsinis et al. (2013) developed a
framework for measuring performance during production ramp-up. In this framework, the
authors tried to formalize a ramp-up index that includes functionality-, quality-, and
performance-based metrics. This ramp-up index aims to guide and support human decision
making. Two ramp-up processes were emulated and the comparison used to evaluate the
resulting measurement framework. Wheelwright and Clark (1992) mentioned the important
measures of development projects’ performance. Of these, many can be linked directly to the
ramp-up of new products, such as the time from concept to introduction (which includes both
development and ramp-up), production rate, and frequency of new product introductions.
Section 4.3 provides more details on ramp-up performance measurements.
In addition to the previously mentioned managerial aspects, many management
approaches have been utilized to enhance ramp-up management, including project
management (Gross and Renner, 2010), knowledge management (Slamanig and Winkler,
2010), lean management (Dombrowski and Hanke, 2009; Scholz-Reiter and König, 2010;
Dombrowski and Hanke, 2011), change management (Adler and Clark, 1991; Scholz-Reiter
et al., 2007), and risk management (Filla and Klingebiel, 2014; von Cube and Schmitt, 2014).
Other researchers who have considered ramp-up management include Szulanski (1996),
Basse et al. (2014a), and Steiner (2014).
Ramp-Up Predictors Salomon and Martin (2008) mentioned the limited knowledge available about the factors that
determine the performance of the ramp-up process. Similarly, Juerging and Milling (2006)
pointed out the scarcity of research exploring the factors affecting efficiency during ramp-up.
However, Fjällström et al. (2009) indicated that many factors affecting production ramp-up in
different ways have been studied in the literature.
Categorization of the factors affecting ramp-up is common in the literature. The aim is
to facilitate firms’ ability to deal with these factors (Fjällström et al., 2009). For example,
Clark and Fujimoto (1991) revealed four essential categories affecting the ramp-up phase:
strategy choice, manufacturing capabilities, production pattern, and workforce policy. In
addition, Pufall et al. (2007) presented a conceptual framework supported by a case study in a

Chapter Two Background and Literature
43
cell phone manufacturing company, showing that the factors that determine production ramp-
up performance can be categorized according to one of the following characteristics: the
product architecture, the product development process, the logistics system, the
manufacturing capability, and the external environment. Furthermore, Kuhn et al. (2002)
mentioned that the factors that affect ramp-up can be tracked to one of the following main
categories: the development process, the production process, the organizational
characteristics, the employees, the logistics system, the information flow, the cooperation
level, and the managerial methods used. Similar categorization attempts have also been made
by Almgren (1999a, 1999b, 2000), van der Merwe (2004), Fjällström et al. (2009), and others.
Due to the multitude of unanticipated problems that can occur during production
ramp-up, scarcity of a stable ramp-up phase is experienced in the real world (Winkler et al.,
2007). Thus, researchers have focused on identifying and analysing failure, disturbances, and
problems during this phase (Simola et al., 1998; Burmer and Görlisch, 2006; Surbier et al.,
2009). Almgren (2000) indicated the role of early identification of the sources of disturbances
in the success of the start-up process. In addition, Glock et al. (2012) proposed that costs can
be minimized through the elimination of interruptions during the ramp-up period.
Almgren (1999a) investigated the start-up phase in an advanced manufacturing system
and diagnosed three internal (workforce policy, organization design, and information) and one
external (material supply) sources of disturbances. These sources cause three types of
disturbances (breakdown, idling, and minor stoppage), which in turn produce down time and
speed losses that ultimately affect the overall effectiveness of the equipment. However,
Almgren (2000) studied different types of disturbances in the auto industry and concluded
that performance during the final verification process in terms of time and efficiency was
affected by four types of disturbances, specifically materials supply, machinery and
equipment, personnel, and the product concept. Kuhn et al. (2002) identified different sources
of ramp-up problems, including a lack of sufficient inter-functional knowledge, late
recognition of disturbances, and depending solely on employees’ experience – which is in
many cases insufficient – in solving ramp-up problems. Stauder et al. (2014) mentioned the
insufficient process capabilities as one of the main sources of disturbances during ramp-up,
and Schmitt and Schmitt (2013) indicated that quality-related issues are one of the important
causes of delay during production ramp-up and hence introduced a quality-oriented approach
to handle the ramp-up phase.
Many factors affecting production ramp-up performance belong to the product
development process. The relationship between the development process and the ramp-up

Chapter Two Background and Literature
44
performance is unquestionable in the literature (Clark and Fujimoto, 1991; Apilo, 2003;
Juerging and Milling, 2006). The development’s phase-related dimensions that affect ramp-up
include incomplete development (Almgren, 2000), the levels of investment in development
(Pisano and Wheelwright, 1995), the development lead time (Pufall et al., 2012b), the
development team’s experience level (Pufall et al., 2007), and concurrent execution of the
development tasks (Juerging and Milling, 2005). Other development-related factors that affect
ramp-up significantly are the complexity of product design (Frizelle and Gregory, 2000;
Pufall et al., 2012a), the process design (Schuh et al., 2005a), and the technology used
(Langowitz, 1988; Schuh et al., 2005a). Additionally, the developed product’s newness
(Juerging and Milling, 2005), novelty (Merwe and Frizelle, 2003), and maturity (Pufall et al.,
2007) all affect the ramp-up process.
Incomplete or incorrect product or process design during the development phase is
reflected in the form of subsequent product or process change (Almgren, 2000; Terwiesch and
Xu, 2004; Scholz-Reiter et al., 2007). Such change causes higher costs (Matta et al., 2008),
excessive downtime (Carrillo and Franza, 2006), reduced yields (Almgren, 2000), and short-
term disruptions and reduced capacity (Carrillo and Gaimon, 2000). Fewer engineering
changes and less debugging lower the uncertainty during ramp-up (Pufall et al., 2007).
Additionally, Langowitz (1988) attributed most problems that appear during the initial
production of the product, such as production process and work schedule deviations, to
mismatching the new product characteristics to the manufacturing process. Furthermore,
Terwiesch and Xu (2004) examined Intel’s ‘copy exactly’ ramp-up strategy, which
recommends a delay in process change that hinders the learning process until a sufficient level
of knowledge is developed in the process. This was imperially proved by McDonald (1998).
Based on mathematical modelling, the authors proved that such a strategy is considered
beneficial with a low initial level of knowledge, short lifecycle, steep demand growth, and
difficult learning process.
The major consequences of change for ramp-up have motivated researchers to present
tools to facilitate coping with these changes. In this context, and considering its importance
for accelerating the ramp-up process, process reconfiguration has been investigated in many
ramp-up-focused studies (e.g. Koren et al., 1999; Matta et al., 2008). Similarly, Xu and Albin
(2002) considered process adjustment during ramp-up. Niroomand et al. (2014) stressed the
effect of manufacturing process configuration characteristics on ramp-up duration, and
Scholz-Reiter et al. (2007) showed the significance of fast product change implementation for
the pace of the ramp-up process.

Chapter Two Background and Literature
45
Another aspect of investigating the relationship between product development and
production ramp-up is to explore the interaction between time-to-market and time-to-volume.
In their two papers in 2005 and 2006, Juerging and Milling highlighted the relationships
between time-to-market and time-to-volume and showed that shorter time-to-market might
negatively affect time-to-volume and, hence, the financial performance of the new product.
The authors concluded that minimum time-to-volume should be the goal. With some
similarities, the mathematical model proposed by Carrillo and Franza (2006) linked time-to-
market and ramp-up time together and concluded that the optimal ramp-up time is the
minimum time required to reach the production volume that matches the peak demand. They
also proposed that a company should invest to the maximum in production capacity until this
intended production level is reached. The model proposed by Carrillo and Franza (2006)
could be more relevant since the capacity utilization should be linked to the actual demand
rather than to the system’s capabilities.
Beside the development-relevant variables, the effect of many process-related
variables and technical issues regarding ramp-up have been investigated in the literature,
including process capability (Ball et al., 2011), process development (Pisano and
Wheelwright, 1995), process standardization (Juerging and Milling, 2005), system robustness
(Schuh et al., 2005a), work organization (Almgren, 1999b), system capacity (Carrillo and
Franza, 2006), tooling, equipment, and equipment qualification time (Haller et al., 2003;
Pufall et al., 2007; Fjällström et al., 2009), dispatch rank policy and lot size (Sturm et al.,
2003), materials flow (Almgren, 2000), and space requirements (Ball et al., 2011).
The information availability and flow during ramp-up have captured considerable
research efforts. The research conducted by Säfsten et al. (2008a) on the critical events
emerging during production ramp-up showed the need to develop an information strategy to
support decision making and proactive behaviour. In this context, Surbier et al. (2010)
developed diagnosis tools aimed at a better understanding, identification, and analysis of the
information exchange among different stakeholders in the ramp-up process, which proposed
to be helpful in problem solving and process enhancement. Fjällström et al. (2009) explored
how different types of information from different sources affect 30 different critical events
during production ramp-up. The authors studied the effect of information on the factors that
affect ramp-up performance, while the direct effect of information on ramp-up performance
parameters was beyond the research’s scope. However, some of the quality-related critical
events investigated by Fjällström et al. (2009) have widely been considered in the literature as
a performance parameter or output of the ramp-up process rather than a mediating factor

Chapter Two Background and Literature
46
affecting the process. Willmann et al. (2013) introduced an information exchange and
knowledge management approach aiming to shorten the product ramp-up time.
Due to the interdependency and interdisciplinary nature of the ramp-up phase, the
roles of collaboration between different organizational departments, suppliers’ involvement,
and the use of cross-functional teams have also been investigated. Woodcock et al. (2000)
indicated the importance of involving the production department personnel in the design
process for enhancing ramp-up quality and time performance. Cantamessa and Valentini
(2000) highlighted the importance of considering the interface between production and
marketing by explaining the relationship between the new product launch and the product
diffusion effect. Apilo (2003) showed the importance of suppliers’ collaboration for ensuring
the new product’s manufacturability and the speed of the ramp-up. Similarly, Li et al. (2014)
proved that – in the case of their specific research sample – the ramp-up time can be reduced
through more collaborative relationships with the inter-company manufacturing supply
network. In addition to the collaboration with suppliers and distributers, Gross and Renner
(2010) indicated the importance of interaction with the customers for a successful ramp-up
process. Schuh et al. (2005a) mentioned that constructing a ramp-up team with members from
different departments enhances communication and coordination during the ramp-up phase.
The importance of developing a cross-functional ramp-up team was also mentioned by Di
Benedetto (1999) and Pufall et al. (2007). While most researchers have considered
collaboration in the context of in-house production ramp-up, Witt (2006) investigated the
collaboration issues in the context of outsourcing the production activities of auto
manufacturing parts.
Some researchers have paid more attention to factors related to human resources
during production ramp-up, such as employee development (Goerke and Gehrmann, 2014),
employee training (Kampker et al., 2014), personnel planning (Lanza and Sauer, 2012), and
workforce policy (Almgren, 1999a). The employee-related factors affecting ramp-up include
education (Fjällström et al., 2009), knowledge (Terwiesch and Xu, 2004), skills (Ball et al.,
2011), worker requirements (Winter et al., 2014), recurring costs (Ball et al., 2011), the
number of employees (Glock et al., 2012), and the attendance and work rotation levels
(Almgren, 2000). Bassetto et al. (2011) focused on the issue of teaching ramp-up for
engineers and proposed a game-based tool that combines lessons and exercises to allow
participants to experience the production ramp-up phase in a controlled environment.
Other factors investigated in the literature in relation to their potential effects on
production ramp-up include accurate forecasting (Pufall et al., 2007), organizational design

Chapter Two Background and Literature
47
(Almgren, 1999a), logistics (Pfohl and Gareis, 2000; Filla and Klingebiel, 2014), customer
requirements (Bischoff, 2007), and industry experience (Salomon and Martin, 2008). Hatch
and Mowery (1998) stated that even the geographical proximity between development and
production facilities affects the ramp-up process. However, Terwiesch et al. (2001) reported
an example that questions such a relationship; the different sectors researched by the two
studies might partially explain the contrary results and observations. Carrillo and Franza
(2006) mentioned some factors that further motivate the reduction of ramp-up time, such as
the decrease in demand and revenue from older products and the increase in revenue
associated with the new product’s sales. Blum et al. (2014) considered different quality and
demand policies during ramp-up. Additionally, Glock et al. (2012) noted the importance of
synchronizing the levels of production and demand for cost minimization during production
ramp-up; to achieve synchronization, the authors proposed that the learning rate or
alternatively the number of employees should be adjusted. Furthermore, Apilo (2003)
considered the use of contract manufacturers to shorten the ramp-up period.
Variables Affected by Ramp-Up Production ramp-up has also been researched in relation to its effect on other organizational
variables. Almgren (2000), Winkler and Slamanig (2011), Elstner and Krause (2014), and
others confirmed the effect of ramp-up on the success of new products. Niroomand et al.
(2012) stated that the ramp-up duration affects the agility level promised by a reconfigurable
manufacturing system through its impact on the reconfiguration time. Steiner (2014)
investigated the role of ramp-up management in mitigating the negative effects of instabilities
arising in the high-variant business environment.
Strubelt and Zadek (2010) empirically proved that ramp-up management affects the
controllability of customer order processing. Terwiesch et al. (2001) indicated that suppliers’
ramp-up duration affects not only a single company but the entire supply chain. In addition,
the authors mentioned the role of fast ramp-up in enhancing the lifetime sales of the new
product. More details about the effect of ramp-up on the company’s financial indicators were
mentioned in section 2.2.1 on page 18.
Researched Sectors and Industries The vast majority of ramp-up research has focused on manufacturing operations. The
industrial sectors that have received more attention are auto manufacturers and electronics
producers; this is due to many reasons, including the special characteristics of these industries

Chapter Two Background and Literature
48
that make production ramp-up a remarkably critical phase. Both industries depend heavily on
new technologies and are described as complex multistage manufacturing systems (Du et al.,
2008). The auto industry is also characterized by increasing competition and market
fluctuation (Niroomand et al., 2014) along with the increasing speed of innovations and
product differentiation efforts (Schuh et al., 2005a). In addition, auto producers have been
reported in the literature to be more open to the research community, which provides a better
chance of a higher response rate and collaboration. The short and continuously declining
product lifecycle in the electronics industries sector has motivated greater emphasis from
researchers. Terwiesch and Bohn (2001) mentioned that the lifecycle for products such as disk
drives and telecommunications has shrunk to less than a year. In addition, Li et al. (2014)
stated that the short lifecycle – less than nine months – in the optical storage industry enabled
the observation of the ramp-up process for many new models or generations of products
within the research time span. Furthermore, the prices of electronic products generally fall
very rapidly (Matta et al., 2007); therefore, in the electronics industry, obtaining the highest
financial payoffs during the early phases of the product lifecycle acquires great importance
(Hatch and Macher, 2004).
Regarding electronics and high-tech products, researchers have investigated
manufacturers of semiconductors and wafer fabrication (Hatch and Mowery, 1998; Sturm et
al., 2003; Lee and Matsuo, 2012; Chang and Chen, 2014), cell phones (Pufall et al., 2007;
Pufall et al., 2012a), hard disk drives (Bohn and Terwiesch, 1999; Terwiesch et al., 2001),
optical storage devices (Li et al., 2014), wire harnesses (Kontio and Haapasalo, 2005), and
other undefined electronics (Adler and Clark, 1991; Apilo, 2003; Surbier et al., 2010). On the
other hand, a significant number of researchers have investigated the auto manufacturing
sector, including auto manufacturers (e.g. Fujimoto, 1989; Clark and Fujimoto, 1991;
Almgren, 2000), OEM (e.g. Schuh et al., 2005a), and automotive suppliers (e.g. Held, 2010).
Additional studies have been conducted in other industrial sectors, such as engineering
products (Ball et al., 2011), aerospace and aviation (Clawson, 1985; von Gleich et al., 2012),
the steel industry (Baloff, 1966), the pharmaceutical industry (Pisano and Wheelwright, 1995;
Pisano, 1997; Hansen, 2013), and medical injection pens (Scrimieri et al., 2013).
Most researchers have considered a single-company case, which has generally been
mentioned as a research limitation that impedes the generalization of the findings. Fewer
studies have been conducted on a multi-company base (e.g. Di Benedetto, 1999; Salomon and
Martin, 2008; Gross and Renner, 2010; Winkler and Slamanig, 2011). Li et al. (2014) tried to
overcome the disadvantages of limiting the research scope to the intra-company level and
Chapter Two Background and Literature
49
considered the inter-company manufacturing supply network. Since most researchers have
adopted a case study methodology focusing on a single company, research conducted in
different countries simultaneously has been very limited (e.g. Slamanig and Winkler, 2012; Li
et al., 2014).
While most research efforts have targeted large and multinational companies (Ball et
al., 2011), usually producing high-volume products, such as auto and electronics
manufacturers, Woodcock et al. (2000) and Meier and Homuth (2006) directed their research
toward small and medium-size enterprises (SMEs). In addition, Leitão et al. (2013)
concentrated on companies that produce small lots. Some researchers have focused on special
production systems and production environments. For example, Nau et al. (2011), Klocke et
al. (2012), and Basse et al. (2014b) investigated ramp-up with hybrid manufacturing
technologies and Nugroho et al. (2011) concentrated on built-to-order supply chains.
Service Ramp-Up Lenfle and Midler (2009) attempted to use the ramp-up concept in the field of product-related
service launch concentrating on the service characteristics, including the simultaneous
production and consumption of the service, which drive two types of learning – technical and
sales – to occur simultaneously. Due to the impossibility of separating service production and
marketing (Grönroos, 1990), the separation between production ramp-up and commercial
launch cannot be made in the case of services. Similarly, Winter et al. (2014) investigated
ramping up the service provided by contract logistics firms. Enz et al. (2014) considered
hotels’ performance ramp-up.
2.3.2. Lean and Agile Logistics Literature In a review of the literature, studies related to lean and agile logistics cannot be separated
from the lean and agile manufacturing literature. Conducting a comprehensive review of
leanness and agility is beyond the scope of this research. However, Kisperska-Moron and de
Haan (2011) indicated that, despite the wide consideration of mass, lean, and agile production
systems in the literature, these philosophies still cause confusion for academics and
practitioners. While considerable research efforts have been dedicated to the fields of leanness
and agility, limited efforts have been directed toward investigating these paradigms
empirically. Empirical research focusing on lean or agile logistics is very scarce. In this
preliminary literature review, more focus was placed on the factors affecting lean and agile

Chapter Two Background and Literature
50
logistics, in addition to the factors affected by the implementation of lean and agile logistics
strategies; finally, the supply chain perspective was also considered.
Leanness Literature Many researchers have investigated how lean strategies and lean logistics affect the
production process and the company as a whole. Wu (2002) stated that any reduction of waste
in the logistics systems can produce substantial savings. Wincel (2004) showed that lean
strategies lead to higher levels of customer satisfaction. The role of lean logistics in
improving customer service was also mentioned by Fynes and Ennis (1994). Wu (2002)
indicated some tools that support the lean logistics system, including third-party logistics;
transportation consolidation; consistent transportation; close carrier relationships; milk runs or
compound deliveries; and the use of returnable, reusable, and standardized container sizes.
Other factors influenced by leanness include manufacturing performance (Flynn et al.,
1995b), inventory turnover (Demeter and Matyusz, 2011), and competitive advantage (Flynn
et al., 1995a).
Other research streams have been concerned with the factors that affect the
implementation and the results of lean strategies. Definitely the main factor affecting lean
logistics is the existence or absence of a lean manufacturing system (Wu, 2002). Fynes and
Ennis (1994) discussed the interface between lean manufacturing and lean logistics and
considered logistics from a marketing perspective. Lewis (2000) found that the success of the
lean system is dependent upon contextual factors, such as the type of market, dominant
technology, and supply chain structure. Shah and Ward (2003) argued that several
organizational factors may enable or inhibit the implementation of lean practices among
manufacturing plants. Sakakibara et al. (1997) showed that JIT practices affect manufacturing
performance only when combined with infrastructure practices.
In addition, many researchers have investigated leanness within the context of supply
chain management. Rathje et al. (2009) indicated that lean tools and techniques aim to reduce
waste not only within the plant but also along the entire supply chain. Jones et al. (1997)
argued that the optimization of each piece of the supply chain in isolation does not produce
the lowest-cost solution. Consequently, it is necessary to look at the entire sequence of events
in the supply chain as a whole. The study conducted by Liker and Wu (2000) showed that
buyers’ lean logistics practices can support suppliers’ ability to improve their operations.
Kisperska-Moron and de Haan (2011) mentioned the environmental characteristics required
for a lean supply chain to operate, including stability, controllability, and predictability. In

Chapter Two Background and Literature
51
addition, due to the important role that logistics plays in linking suppliers and customers, lean
logistics provide a means to achieve total system improvements (Wu, 2002).
A comprehensive review of the lean literature was conducted by Stone (2012) and
Gupta and Jain (2013). Hasle et al. (2012) reviewed the literature on the effect of lean on the
employees and on the work environment, and Zhang et al. (2012) reviewed the literature
related to lean six sigma practices.
Agility Literature Naim et al. (2010) indicated that, instead of the well-documented flexible manufacturing in
the literature, aspects such as definition, role, and measurement considering the whole supply
chain are less understood. Van Hoek et al. (2001) stated that the existing literature mainly
presents agility as a general management or a strongly manufacturing-biased concept. Damen
(2001) stated that the current logistics systems’ ability to react quickly to changes in the
business environment is restricted and mentioned the importance of implementing agile
logistics strategies.
Miao and Xi (2008) highlighted the effect of uncertainty and the importance of agile
forecasting of demand to enhance logistics performance and customer service levels. In
addition, Miao and Xi (2008) indicated that providing agile and quick delivery will force
competitors to increase their inventory levels to enhance their ability to reduce their delivery
time. This increase is usually reflected in higher costs and, hence, higher prices. Inman et al.
(2011) and Merschmann and Thonemann (2011) investigated the effect of agility on firms’
performance. Zhang et al. (2005) proved a significant effect of lean logistics on the customer
satisfaction level, and Ismail et al. (2011) investigated the role of agility in achieving
resilience.
Yusuf et al. (1999) indicated that change is the major driving force behind agility.
Gunasekaran (1998) illustrated the enablers of an agile system, including a virtual enterprise,
rapid partnership, concurrent engineering, integrated information systems, rapid prototyping,
and electronic commerce. Undoubtedly, the use of information technology to share data
between buyers and suppliers is crucial to achieve an agile supply (Harrison et al., 1999).
Evers et al. (2000) and Damen (2001) focused on the service sectors and researched
the concepts of service-oriented and service-controlled agile logistics, respectively. Ismail et
al. (2011) highlighted the terms of agility and resilience in the context of SMEs. Oloruntoba
and Gray (2006) and Scholten et al. (2010) explored the role of agility in humanitarian aid
supply chains. Similarly, Barahona (2013) highlighted the role of agility in disaster response

Chapter Two Background and Literature
52
and relief supply distributions. Ramesh and Devadasan (2007) and Huang and Li (2009)
provided a literature review on agility. Gligor and Holcomb (2012) reviewed the agility
literature to investigate the role of logistics capabilities in achieving supply chain agility.
2.3.3. Research Linking Ramp-Up, Leanness, and Agility In this section, the research that has linked different research variables together is briefly
introduced to identify the nature of the interactions between the constructs under
consideration. A direct investigation of the role of lean or agile logistics during the ramp-up
phase cannot be found in the literature. Instead, the links between ramp-up and logistics,
leanness, and agility were reviewed. However, research linking production ramp-up, lean
logistics, or agile logistics to new product success was not mentioned.
Ramp-Up and Logistics Bowersox et al. (1999) mentioned the scarcity of research efforts to investigate the effect of
‘place capabilities’, such as logistics and supply chain relationships, on the launch
performance. In addition, Pfohl and Gareis (2000) asserted that logistics has been frequently
overlooked in the ramp-up literature and indicated the ignorance regarding the testing of the
logistics system best suited to this phase. Moreover, few attempts to investigate the role of
logistics during ramp-up empirically can be found.
Based on survey research, Di Benedetto (1999) indicated that successful new product
launches attempt to involve logistics early in the planning phase. Di Benedetto asserted the
important role of logistics in developing a successful strategy and mentioned the importance
of involving logistics personnel in strategy development. Similarly, Pfohl and Gareis (2000)
conducted survey research that revealed an important role for operational and administrative
logistics activities for the ramp-up process. Due to logistics’ interfaces with other functions
and supply chains’ and the ramp-up process’s interfaces with other activities, the results
highlighted the importance of integration and coordination. Interfaces are represented in the
interaction, communication, and collaboration between different functions (Koike et al.,
2005). Scholz-Reiter et al. (2007) mentioned the role of logistics in influencing production
ramp-up among other factors, such as production and assembly processes, instruments and
tolls, product development, and networking and cooperation. In addition, Filla and Klingebiel
(2014) considered the pre-series logistics activities in analysing the risk involved in the ramp-
up process. While Risse (2003) introduced a logistics-oriented approach to ramp-up
management, Hüntelmann et al. (2007) proposed a logistics- and cost-oriented cross-company

Chapter Two Background and Literature
53
ramp-up planning model. Pufall et al. (2007) considered the issues of logistics facilities and
the design of logistics, and Almgren (2000) elucidated how disturbances in the material
supply, such as a lack of materials or materials of a quality lower than required, affect ramp-
up in terms of both quantity and quality performance.
Surbier et al. (2014) highlighted the importance of considering the supply chain
perspective in treating the ramp-up process and mentioned a gap in the literature in this
regard; they stated that many problems might occur due to internal and external logistics in
addition to the lack of cooperation with suppliers. Ragatz et al. (2002) indicated the
importance of having suppliers within the ramp-up team. In addition, the importance of parts
supply, material quality, and supplier collaboration were discussed by Almgren (1999a),
Fjällström et al. (2009), and Li et al. (2014), respectively.
With a different research direction, Winkler and Slamanig (2008) indicated that the
ramping up of new products leads to changes and adjustments within the production and
logistics systems of the firm. Reuter et al. (2014) also discussed the challenges produced by
the complexity of the ramp-up process for logistics.
Ramp-Up and Leanness Limited attempts to explore the role of agility during the ramp-up phase can be traced in the
literature. Bowersox et al. (1999) proposed a ‘lean launch’ approach based on the principles
of response-based logistics. While traditional logistics’ support for the product launch process
is based on the demand forecast, the lean launch approach is based on the pull strategy and the
postponement principle. Dombrowski and Hanke (2009) and Dombrowski and Hanke (2011)
tried to apply the lean principles to enhancing the ramp-up phase’s performance. Similarly,
Scholz-Reiter and König (2010) used lean principles to achieve a faster ramp-up process, von
Cube and Schmitt (2014) commented that the work by Scholz-Reiter and König (2010) is
better regarding usability and focused strongly on reducing delays, while the work of
Dombrowski and Hanke pursued the advantages of the first mover and neglected quality
issues.
Regarding the material flow, Haller et al. (2003) indicated that the pull rather than the
push principle is more suitable for the uncertain nature of the ramp-up process. The authors
indicated that the material flow during ramp-up is not homogeneous and that the early
processes in the production line have higher throughput than the later processes. In addition,
during ramp-up and due to the constantly increasing production rates for normal and for

Chapter Two Background and Literature
54
bottleneck operations, the WIP caps (see Liberopoulos and Dallery, 2002) have to be adjusted
through time. According to Haller et al. (2003), these caps should by updated weekly.
Ramp-Up and Agility Ball et al. (2011) stated that the criticality of the ramp-up phase is mostly related to the
flexibility required. Lee (2004) argued that the concept of agility is of particular importance
during changing market conditions (e.g. during ramp-ups). Niroomand et al. (2014) pointed
out the importance of ramp-up time reduction to enhancing the responsiveness of
reconfigurable manufacturing systems by affecting the reconfiguration time. More details
about research linking agility to production ramp-up are available in section 6.4 on page 144.
Leanness and Agility As mentioned before, there is a lack of clarity in the literature concerning what constitutes
leanness and agility, how leanness and agility differ, and when to employ each concept
(Narasimhan et al., 2006). However, some researchers have compared and/or combined the
two paradigms (Naylor et al., 1999; Christopher and Towill, 2000; Bruce et al., 2004; Ilyas et
al., 2008; Hallgren and Olhager, 2009; Huang and Li, 2010; Naim and Gosling, 2011).
Kisperska-Moron and de Haan (2011) claimed that both leanness and agility aim to achieve
flexibility and competitiveness but in different ways.
Naylor et al. (1999) showed that agility is best suited to satisfying a fluctuating
demand (in terms of volume and variety) and lean manufacturing requires, and promotes, a
level schedule. Similarly, Christopher (2000) argued that lean concepts work well when the
demand is stable and predictable and when the variety is low, while agility is required when
the demand is volatile and when the variety in customer requirement is high. Van Hoek et al.
(2001) argued that agility requires specific capabilities, in addition to those capabilities that
can be achieved using lean thinking. Christopher and Towill (2001) connected the ideas of
order qualifiers and order winners to the concepts of leanness and agility. They mentioned
that the lean paradigm is most powerful when the winning criterion is cost, while agility is
required more when service and customer value enhancement are prime requirements for
market winning.
Within the context of supply chains, some researchers (e.g. Mason-Jones and Towill,
1999; Mason-Jones et al., 2000a; Agarwal et al., 2006) have found that lean and agile
paradigms can be and have been combined within successfully designed and operated total
supply chains. Pfohl and Buse (2000), Elkins et al. (2004), and Lee (2004) explained that to
Chapter Two Background and Literature
55
cope with the escalating fluctuation in both supply and demand, most supply chains trade off
the speed of response with the accompanying costs. However, agile supply chains can
respond quickly and – at the same time – in a cost-efficient manner. Beside the supply chain
view, this ability to combine speed and efficiency was also argued by Zhang et al. (2005)
considering the flexibility of a single company’s logistical system.
Some authors have used the concept ‘leagile’ to combine the lean and agile paradigms
(Naylor et al., 1999; Mason-Jones et al., 2000a, 2000b; van Hoek, 2000; Aitken et al., 2002;
Bruce et al., 2004; Krishnamurthy and Yauch, 2007). Naylor et al. (1999) stated that the
required levels of agility and leanness are determined according to the total supply chain
strategy. The authors stressed the importance of combining lean and agile strategies by
placing a ‘decoupling point’ appropriately in the supply chain.

Chapter Three Methodology
56
CHAPTER 3
METHODOLOGY
3.1. Introduction This research empirically investigates the role of lean and agile logistics during production
ramp-up based on survey methods (Groves et al., 2009; Fowler, 2014) and utilizes a two-step
methodology consisting of the use of a deductive-based approach (Swamidass, 1991) to
examine the hypothesized relationships model followed by an exploratory analysis aiming to
explore further trends in the survey data.
Flynn et al. (1990) indicated that surveys are a commonly used research method in
empirical OPM research. In addition, field-based empirical research in OPM is gaining
increasing recognition, as it provides an important alternative to other traditional
methodologies, such as simulation and modelling (Malhotra and Grover, 1998). More
recently, in an analysis of operations and supply chain management research, with a focus on
the health care sector, Dobrzykowski et al. (2014) showed that the empirical research
methodology encompasses around 27% of all research attempts. Furthermore, a review
undertaken by Craighead et al. (2011) revealed that around 28% of the articles published in
the journals reviewed were based on the survey methodology. However, the frequent calls for

Chapter Three Methodology
57
more relevance and rigour in conducting survey research and the researchers’ response by
conducting more deductive-based research were mentioned by Barratt et al. (2011).
Compared with the case study methodology, surveys have the advantages of greater
controllability, repeatability, and generalizability (Gable et al., 1994). A review of the
empirical research in OPM, conducted by Scudder and Hill (1998), reported the existence of
more survey research than case studies. A similar figure showing more use of the survey
methodology than the case methodology in OPM research was reported by Pannirselvam et al.
(1999). However, the production ramp-up literature includes many more case studies than
surveys.
The use of the deductive approach to theory testing in OPM fields has been discussed
thoroughly in the literature (see Flynn et al., 1990; Meredith, 1998; Wacker, 1998). The
procedures followed in this research were close to those described by Forza (2002), starting
with choosing research constructs and formulating hypotheses, passing through data
collection and analysis, and ending with model rejection or confirmation.
In addition, mediation has become significantly popular among OPM researchers
(Malhotra et al., 2014). Mediation refers to the existence of a significant intervening effect of
an antecedent variable on a consequent variable (Venkatraman, 1989) or, as stated by Baron
and Kenny (1986), it is the ability of an exogenous independent variable to affect its
dependent consequence. In the current research, the outbound logistics activities were
considered as a mediating variable between production ramp-up (as an independent variable)
and new product success (as a dependent variable).
Since the production ramp-up field is still new (Surbier et al., 2014), immature (Schuh
et al., 2005a), and insufficiently explored (Berg and Säfesten, 2006), most research in this
field is exploratory in nature (e.g. Salomon and Martin, 2008; Pufall et al., 2012a, 2012b; Li
et al., 2014). Ball et al. (2011) stated that the disparate nature of the ramp-up literature
necessitates more exploratory research. In addition, Sturm et al. (2003) indicated that, due to
the change in almost every production parameter during production ramp-up, predicting the
production process’s operational behaviour during this period through conventional static
planning models is not sufficient. Furthermore, Li et al. (2014) mentioned the importance of
the qualitative data obtained from empirical research for building the ramp-up literature.
Koufteros (1999) stated that exploratory techniques are essential when strong theory may not
be available. Such a nature characterizing the ramp-up phase – combined with the absence of
any attempts in the literature to investigate the role of logistics’ leanness or agility during this
phase – motivated the use of the empirical research approach.
Chapter Three Methodology
58
3.2. Research Structure The urgent need for research on production ramp-up can be easily identified through a quick
review of the latest work in this field. Sections 1.2, 1.3, and 1.4 explain the rationale behind
carrying out the current research and highlight its contributions to the available knowledge.
The main research variables are proposed as shown in figure 1.2 (page 10). Thereafter, and
based on a literature review in the fields of production ramp-up, lean logistics, agile logistics,
and new product success, the research sub-variables and the relationships’ directions are
identified, as shown in figure 4.3 (page 101). To operationalize the specified sub-variables,
the 59 questionnaire items (see appendix 1) were formulated to compose a special-purpose
data collection tool, to be used for primary data gathering.
After collecting the data using different tools, including interviews, personal contacts,
and mailing, many qualitative and quantitative analyses were conducted to describe the data
and to examine the proposed relationships. The data analysis mainly utilized the SmartPLS
software (Hair et al., 2014; Lowry and Gaskin, 2014) and the IBM Statistical Package for the
Social Sciences (SPSS) program (Bryman and Cramer, 1997; Field, 2013; Pallant, 2013). In
addition, and based on the proposed research model, research hypotheses were formulated and
tested. The results of the exploratory data analysis and the hypothesis testing were used to
propose a model to employ lean and agile logistics practices during the ramping up of a new
product and thereafter during the following steady-state and ramp-down production phases.
Basically, the model suggests more enabling for agile logistics activities during the ramp-up
phase and a greater focus on lean logistics activities during steady-state production.
The proposed model was is then validated and tested through lifecycle profitability
analysis. The results of the profitability analyses for different scenarios were compared to
evaluate the possible gains of the proposed system. Such analyses enhance the ability to
evaluate the feasibility of investing resources in a new mixed system that switches between
leanness and agility during different lifecycle stages. Finally, the research results were
summarized, discussed, and compared with the results of the closely related research, the
research limitations mentioned, and recommendations for researchers and practitioners
introduced. Figure 1.4 (page 15) illustrates the steps followed in the research. The following
sections in this chapter provide details of the data collection tool, data collection process,
statistical analyses, and validation methods. Figure 3.1 illustrates the procedures followed to
examine statistically the quality of the data collection and processing methods, focusing on
(1) the measurement tool used, (1) the sample targeted, (3) the data collected, and (4) the
statistical analysis conducted.

Chapter Three Methodology
59
Figure 3.1: Measures, sample, data, and analysis quality
3.3. Data Collection Tool A questionnaire was the main tool used to capture the data from the targeted industrial
companies. A total of 59 questions were developed to measure the research variables, as
shown in table 3.1. The production ramp-up questions measured the three performance
dimensions of quantity, quality, and cost; the main problems occurring during this phase; and
the overall assessment of ramp-up performance. On the other hand, inbound, intra, and
outbound logistics activities were measured as the sub-variables for lean and agile logistics.
The existence of a degree of overlapping between some lean and agile logistics dimensions
(Hallgren and Olhager, 2009) motivated more concentration on the characteristics that can be
associated with one paradigm but not the other. An overall assessment of lean and agile
Literature support Validity
Test the measurement model
Experts’ arbitration
Test the sample targeted
Test the data collected
Test the statistical analysis conducted
Measurement error
Test-retest reliability Reliability
Cronbach’s alpha Path analysis
Common method variation Marker variable technique
Sample size
Sample quality
Representativeness Statistical power Selection method
Sampling error Sample-related errors
Selection error Non-response error
Non-response bias Data quality
Response rate Missing data
Formative constructs
Relationship direction
Reflective constructs Factor analysis
PLS approach
Tools used
Correlation analysis Data reduction
Comparison with literature Analysis results
Statistical conclusion error
Construct-assessment correlation
Psychological separation

Chapter Three Methodology
60
logistics was also undertaken. Finally, the questionnaire measured new products’ success
evaluation to be linked to the ramp-up performance and selected respondent-, organization-,
and product-related characteristics to be examined for a potential moderating role.
Table 3.1: Questionnaire items
Variables Sub-variables Questionnaire items
Production ramp-up performance
Quantity performance 9, 10, 11, 41 Quality performance 29, 30, 31 Cost performance 32, 33, 34 Ramp-up problems 42, 43, 44, 45, 46, 47, 48, 49, 50
Ramp-up overall assessment
Volume 19 Time 20 Quality 21 Cost 22
Lean logistics Inbound logistics 12, 35a, 36, 54, 55 Intra logistics 35b, 38, 51, 52, 53
Lean logistics overall assessment 23
Agile logistics Inbound logistics 13, 14, 15, 58 Intra logistics 16, 40, 56, 57
Agile logistics overall assessment 24
New product success
Sales return 25 Net profit 26 Market share 27 Customer satisfaction 28
Mediating variables Lean outbound logistics 35c, 37, 39 Agile outbound logistics 17, 18, 59
Moderating variables Respondent 1, 2 Organization 3, 4, 5 Product 6, 7, 8
By asking the respondents to provide an overall evaluation of ramp-up performance as
well as the logistics system’s leanness and agility, the questionnaire aims to compare sub-
dimensions’ evaluation with the overall evaluation. A high level of variation between the two
might imply biased responses and a higher measurement error may occur when the
respondents are unable or unwilling to provide accurate answers (Dillman et al., 2014).
Alternatively, the variation can be explained in terms of the differences between the
operational definitions provided for ramp-up, lean logistics, and agile logistics and the
respondents’ actual understanding of these variables.
While the survey questions measured the variables of ramp-up, lean logistics, agile
logistics, and new product success, in addition to the moderating variables, the questions were
organized according to the evaluation scale rather than the variable measured to reduce the
time required to respond. This organization method did not affect the logical sequence of the
questions, since the research variables appeared in a common context. In addition, organizing

Chapter Three Methodology
61
the questions around the research variables sometimes drives respondents to answer according
to a certain pattern, which in turn might produce an unreal strong correlation between the
research variables and consequently a higher probability of type I error occurrence. Attention
was paid to the sequence and organization of the questionnaire due to their significance for
attaining reliable, unbiased responses (Rea and Parker, 2014).
3.3.1. Questionnaire Design Characteristics Survey characteristics such as the formulation, length, scaling, respondent identification, and
number of responses can all affect the data collection, the data quality, and even the results of
the data analysis (Forza, 2002; Apilo, 2003; Lozano et al., 2008; Peng and Lai, 2012). Apilo
(2003) indicated the importance of keeping the questionnaire as simple as possible. Forza
(2002) mentioned that the wording of the questions should be consistent with the respondents’
levels of understanding. Furthermore, Stern et al. (2014) presented evidence to prove the
significant effect of the questionnaire’s visual layout on the responses. In the current research,
limited interviews were conducted prior to finalizing the questionnaire development. One of
the aims of these interviews was to ensure the highest level of simplicity to enhance
respondents’ understanding of each item.
Another important survey characteristic is the number of questions. Peng and Lai
(2012) noted that researchers face a trade-off between questionnaire length and response rate
and that more items per study variable will affect the response rate adversely. The relatively
large number of questions in the current research was one of the factors that negatively
affected the response rate. Of course, the multifaceted nature of the research variables
enforced the use of many sub-variables to cover as many dimensions as possible.
While different sectors and industries have different measurement tools for
performance, the current questionnaire items were formed to be more general, to suit different
industrial environments, and to concentrate on common measurements with which most
manufacturers are familiar. The use of common variables aimed to enhance the
generalizability of the research results and to overcome the disadvantage of limiting ramp-up
research to a single manufacturer or one sector, as recommended by Terwiesch and Xu
(2004); this might also be more useful for general theory building and theory testing attempts.
However, such an approach comprises the disadvantages of less precise results and a higher
probability of application failure in special industrial environments. A pilot or preliminary
survey to identify variables that are relevant to a certain industry is commonly undertaken in
the operations management literature (Flynn et al., 1990) and in ramp-up research as well

Chapter Three Methodology
62
(e.g. Fjällström et al., 2009). However, conducting a pilot study is more suitable for research
that targets a specified industry or a particular environment.
The questionnaire was also directed to personnel with sufficient engagement with the
ramp-up process, such as production or project managers. However, more precise responses
might require participation from other personnel on the supervisory level or the non-
managerial level. In quite similar research, Fjällström et al. (2009) collected data from
managers responsible for planning and realization, engineers executing preparatory work and
supervising the process, and employees directly executing the ramp-up. Since collecting data
from multiple resources might complicate the data collection process extremely and place
further restrictions on the achievement of an acceptable response rate, the general evaluation
required in the questionnaire collects the data from a single, well-acquainted person, who is
close enough to the real situation of the process investigated.
Some items in the questionnaire were measured in comparison with competitors or
with the firm’s steady-state production phase to solve the conflict between different rating
systems and to avoid the questionnaire touching on confidential data and using numbers or
pure values for performance evaluation. In general, the questions’ formulation focused greatly
on confidentiality issues and asked for general evaluation and judgemental-based situation
assessment; this was believed to contribute positively to a higher response rate.
The scaling technique has received considerable interest from researchers due to its
importance and effect on responses (Flynn et al., 1990; Lozano et al., 2008). Except for the
first part of the questionnaire, an 11-point Likert-type scale was used. Flynn et al. (1990)
mentioned the advantages of using a Likert-type scale, including more flexibility, a greater
ability to measure general constructs, and ease of analysis and interpretation. In addition to
the increased levels of sensitivity, Lozano et al. (2008) showed that the reliability of the
Likert-type scale increases as the number of response options increases. Leung (2011)
investigated the normality and psychometric properties of 4-, 5-, 6-, and 11-point Likert scales
and concluded the following: (1) reduced skewness results from using more scale points; (2)
an 11-point scale ranging from 0 to 10 comes with the smallest amount of kurtosis and is
closest to normal; and (3) using the Kolmogorov–Smirnov and Shapiro–Wilk statistics, only
the 6- and 11-point scales follow normal distributions. However, research conducted by
Jacoby and Matell (1971) showed that 11-point Likert scales achieve lower values of the test-
retest reliability coefficient. Nevertheless, the test-retest reliability coefficient values were
satisfactory in this research, as shown in table 3.3.

Chapter Three Methodology
63
3.3.2. Measures’ Quality For an operationally defined concept, the measurement tool should be both valid and reliable
(Bryman and Cramer, 1997). Validity means measuring what intended to be measured,
whereas reliability is about consistency (Myrtveit and Stensrud, 2012). In addition to validity
and reliability, other statistical tools can be used to evaluate the quality of the data collection
tool, such as common method variance (Craighead et al., 2011), measurement error evaluation
(Forza, 2002), and correlation statistics.
Crawford and Di Benedetto (2011) indicated that the data collected typically become
more valid and reliable as the new product development project moves through the process
toward commercialization. The current research investigated products that had already been
ramped up; thus, more valid and reliable actual data were expected.
Validity Content validity should be assessed to prove that the constructs used actually measure the
variables that they were originally designed to measure (Field, 2013). The questionnaire items
were tested for content validity through a jury of arbitrators. The items used in the
questionnaire have been assessed by specialized researchers and expert practitioners, whose
knowledge and experiences in the fields of production ramp-up and logistics were sufficient
to ensure the validity of the measures used. In addition, the construction of the research
questionnaire was originally based on a comprehensive literature review, and the rationale
behind each item’s use was mentioned, as shown in chapter 4. This also helps to reduce
measurement error, as clarified by Forza (2002).
In addition, to validate the research measures further, the correlation between the
ramp-up performance’s constructs and the overall assessment of ramp-up performance was
examined to evaluate how accurately the items are measured. The same procedure was
followed regarding lean and agile logistics. The correlation values are presented in table 3.2.
As shown in the table, high correlation values exist between the respondents’ evaluations of
the measures used and their evaluation of the overall variables, revealing a high level of
consistency between the items used and the respondents’ understanding of the constructs.
While the mean differences between measures and evaluation were small, these differences
were higher for the standard deviation values. However, it was noted that the overall
evaluation has higher mean values and higher standard deviations as well.
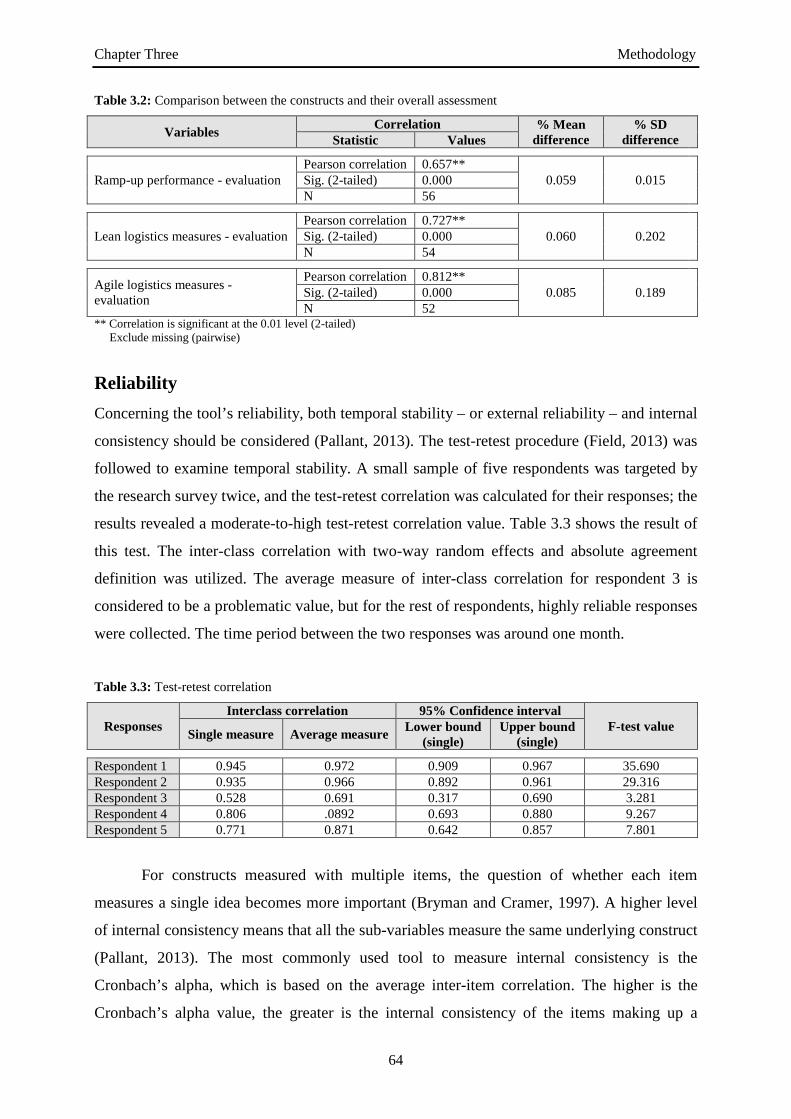
Chapter Three Methodology
64
Table 3.2: Comparison between the constructs and their overall assessment
Variables Correlation % Mean difference
% SD difference Statistic Values
Ramp-up performance - evaluation Pearson correlation 0.657**
0.059 0.015 Sig. (2-tailed) 0.000 N 56
Lean logistics measures - evaluation Pearson correlation 0.727**
0.060 0.202 Sig. (2-tailed) 0.000 N 54
Agile logistics measures - evaluation
Pearson correlation 0.812** 0.085 0.189 Sig. (2-tailed) 0.000
N 52 ** Correlation is significant at the 0.01 level (2-tailed) Exclude missing (pairwise)
Reliability Concerning the tool’s reliability, both temporal stability – or external reliability – and internal
consistency should be considered (Pallant, 2013). The test-retest procedure (Field, 2013) was
followed to examine temporal stability. A small sample of five respondents was targeted by
the research survey twice, and the test-retest correlation was calculated for their responses; the
results revealed a moderate-to-high test-retest correlation value. Table 3.3 shows the result of
this test. The inter-class correlation with two-way random effects and absolute agreement
definition was utilized. The average measure of inter-class correlation for respondent 3 is
considered to be a problematic value, but for the rest of respondents, highly reliable responses
were collected. The time period between the two responses was around one month.
Table 3.3: Test-retest correlation
Responses Interclass correlation 95% Confidence interval
F-test value Single measure Average measure Lower bound (single)
Upper bound (single)
Respondent 1 0.945 0.972 0.909 0.967 35.690 Respondent 2 0.935 0.966 0.892 0.961 29.316 Respondent 3 0.528 0.691 0.317 0.690 3.281 Respondent 4 0.806 .0892 0.693 0.880 9.267 Respondent 5 0.771 0.871 0.642 0.857 7.801
For constructs measured with multiple items, the question of whether each item
measures a single idea becomes more important (Bryman and Cramer, 1997). A higher level
of internal consistency means that all the sub-variables measure the same underlying construct
(Pallant, 2013). The most commonly used tool to measure internal consistency is the
Cronbach’s alpha, which is based on the average inter-item correlation. The higher is the
Cronbach’s alpha value, the greater is the internal consistency of the items making up a

Chapter Three Methodology
65
composite measure (Sekaran and Bougie, 2013). However, Pallant (2013) indicated that
Cronbach’s alpha values are dependent on the number of items in the scale. Table 3.4 presents
the calculated Cronbach’s alpha values, which indicate an acceptable level of internal
consistency.
Table 3.4: Cronbach’s alpha values
Main and sub-variables
Cro
nbac
h’s
alph
a
Num
ber
of
item
s
Cas
es Bar graph
Production ramp-up 0.531 3 56 Quantity performance 0.736 4 56 Quality performance 0.803 3 56 Cost performance 0.853 3 56
Lean logistics 0.812 3 54 Inbound 0.526 5 55 Intra 0.794 5 55 Outbound 0.790 3 56
Agile logistics 0.945 3 53 Inbound 0.795 4 55 Intra 0.848 4 55 Outbound 0.642 3 56
Product success 0.916 4 56
As shown in the previous table, only three variables have Cronbach’s alpha values less
than 0.70 (the value proposed by Nunnally and Bernstein, 1994). In the cases of lean inbound
logistics and agile outbound logistics, the relatively low Cronbach’s alpha values might be
due to the inclusion of measures and techniques in the same construct. While the measures are
highly agreed upon, some techniques might or might not necessarily be used. The test for
these two constructs was repeated but excluding the techniques of MRP, supplier milk run,
and 3PL. The new Cronbach’s alpha values were 0.711 and 0.740 for lean inbound logistics
and agile outbound logistics, respectively.
With regard to production ramp-up performance, to treat the low value of Cronbach’s
alpha, other measures representing the ramp-up problems were added, and the Cronbach’s
alpha was recalculated. The new value was 0.717. As illustrated in figure 3.2, all the values
represent an acceptable level of reliability after adjusting the measurement model. However,
the low Cronbach’s alpha value for the ramp-up construct might be due to the formative
nature of the construct. Freeze and Raschke (2007) indicated the importance of examining the
significance of the path from the indicator to the construct to evaluate the validity of the
formative constructs. The PLS path analysis is illustrated in chapter 5.
0 0,7
Ramp-up
Quantity
Quality
Cost
Leanness
L. inbound
L. intra
L. outbound
Agility
A. inbound
A. intra
A. outbound
Success

Chapter Three Methodology
66
Figure 3.2: Cronbach’s alpha values after adjusting the measurement model
Common Method Variation As stated by Lindell and Whitney (2001), common method variation measures the existence
of spurious correlations between research variables arising from the use of the same method
to measure both independent and dependent variables in the investigated relationship.
Common method variation leads to incorrect conclusions and unreliable research results
(Rungtusanatham et al., 2003). A limited review conducted by Craighead et al. (2011) showed
that around 87% of OPM research has not addressed the common method variation issue.
While some researchers have used methodological, psychological, or temporal separation to
reduce or eliminate common method variation, others have used statistical tools. According to
the current research’s type, and the nature of the data collection tool employed,
methodological and temporal separations are not the appropriate tools to utilize. Nevertheless,
the questionnaire’s item organization according to the measurement scale rather than the
variables measured contributed to minimizing the possible effect of common method
variation, as a type of psychological separation, as indicated by Ba and Johansson (2008).
In addition, the marker variable technique proposed by Lindell and Whitney (2001)
was utilized to identify and treat common method variation statistically. A marker variable
construct that theoretically has no relationship with other variables was added to the model,
and the correlation between the marker variable and all the other variables was tested. Low
0
0,7
Chapter Three Methodology
67
and satisfactory correlations values, ranging from 0.006 to 0.163, resulted. However, there are
some disadvantages of the marker variable tool, as discussed by Podsakoff et al. (2012).
3.4. Data Collection Process After formulating the research questionnaire, the following issues should be considered:
identifying the targeted population, determining the sample, defining the tools and methods
used to reach the respondents, and explaining the response rate and the representativeness of
the responses.
3.4.1. Survey Population Manufacturing firms were targeted in this empirical research due to the increasing importance
of ramp-up enhancement in these firms (Almgren, 1999a; Sturm et al., 2003). In addition, the
overwhelming majority of ramp-up research has been conducted in manufacturing settings.
Limited attempts to consider service ramp-up have been made in the literature (e.g. Lenfle
and Midler, 2009; Enz et al., 2014). The literature on lean and agile logistics is also
predominantly considered in the context of manufacturing processes.
While many ramp-up-related survey studies have been restricted to a certain industrial
sector (e.g. Salomon and Martin, 2008; Gross and Renner, 2010), region (e.g. Winkler and
Slamanig, 2011), company size (e.g. Woodcock et al., 2000), or other dimension (e.g. Di
Benedetto, 1999), other surveys have targeted less clearly defined populations (e.g.
Langowitz, 1988). For research conducted in different industrial sectors, possible differences
between the researched sectors have never been investigated. In this research, industrial
companies in different sectors, different countries, and with different sizes were targeted to
explore the existence of any statistically significant differences in the research results
according to these dimensions.
The researched companies were targeted based on the availability of access to these
companies to obtain as many responses as possible. While such an approach might imply
disadvantages, such as higher sampling and non-observation errors (Scheaffer et al., 2011)
and a lower ability to generalize the research results, a similar approach was followed by
Langowitz (1988) in investigating production ramp-up problems.
A survey population is a collection of all the elements – people, firms, plants, or things
– that the researcher wishes to investigate or to make inferences about (Forza, 2002; Scheaffer
et al., 2011). The identification of the survey population aims to determine the elements’
parameters and, hence, the measurement specifications (Scheaffer et al., 2011). The results of

Chapter Three Methodology
68
the survey can then be used by other population elements, due to the similarity of
characteristics. The current research variables, and the questionnaire items used to measure
these variables, are commonly used and understood by almost all manufacturing companies.
Nevertheless, the targeted firms were not contacted randomly. Each contacted firm produces
new products continuously and employs some of the lean and/or agile logistics activities.
In the production ramp-up literature, the achievement of the intended goals of
identifying the research population is somewhat questionable. For example, Clark and
Fujimoto (1991) investigated the auto manufacturers in the US, Europe, and Japan. However,
the use of such a population does not mean that auto manufacturers outside these three
regions have different characteristics. Moreover, manufacturing companies utilize similar
production systems and strategies, but operating in different sectors might represent a more
homogeneous population than manufacturing companies that operate within the same sector
and employ different production systems or strategies. Di Benedetto (1999) identified his
research population as all being practitioner members of the Product Development and
Management Association (PDMA). Again, being members of the PDMA does not necessarily
reflect common characteristics of the population.
While the current research population was not clearly identified, this was strongly
believed to have only a limited effect on the reliability of the research results due to: (1) the
nature of the variables used and (2) the similarities in the basic features of the production
systems used all around the world because of increased globalization, growing transnational
organizations, and the extensive IT revolution worldwide.
3.4.2. Sampling Issues In addition to the survey population, statisticians have concentrated on identifying the survey
sample to determine how representative the sample is for the entire population. Taking into
consideration the dependency of the sample size on the population size, and the limited
amount of survey research conducted in the production ramp-up field, many researchers have
not mentioned their study’s population size (e.g. Langowitz, 1988; Clark and Fujimoto, 1991;
Hatch and Mowery, 1998; Winkler and Slamanig, 2011). In a review of survey research in
operations management, Rungtusanatham et al. (2003) reported that only 53% of the reviewed
articles provided sufficient information about the target population. In addition, many ramp-
up survey studies have been based on small sample sizes. For example, Langowitz (1988)
analysed a sample of 15 new products produced by 7 facilities in 4 companies; Clark and
Fujimoto’s (1991) sample included 22 auto manufacturers in 3 regions; Woodcock et al.

Chapter Three Methodology
69
(2000) used a sample of only 6 British SMEs; and the studies by Winkler and Slamanig
(2011), Slamanig and Winkler (2011), and Slamanig and Winkler (2012) were based on the
same sample of 21 SBUs of manufacturing companies with multi-variant serial production.
De Beuckelaer and Wagner (2012) indicated that a small sample size might lead to
lower statistical power, greater representativeness bias, the impossibility of sampling error
identification, and a higher probability of unstable results. In the context of production ramp-
up, Langowitz (1988) and Li et al. (2014) indicated the limited ability to generalize their
research results due to the use of a small sample size (the populations of the research were not
mentioned). However, De Beuckelaer and Wagner (2012) indicated that small samples
comprise 30 observations or fewer.
The sample size of the current research is considered to be sufficient. Ramp-up
research using sizable samples is limited: Salomon and Martin (2008) used a sample size of
265 semiconductor manufacturing plants, Di Benedetto’s (1999) sample included 183 usable
responses, and Gross and Renner (2010) analysed responses from 71 manufacturers. While
other surveys in the ramp-up literature have used much smaller samples, as previously
explained, the majority of empirical research in this field has followed the case study
methodology and targeted a single company (e.g. Kontio and Haapasalo, 2005; Miguel, 2008;
Lenfle and Midler, 2009; Pufall et al., 2012b; Basse et al., 2014b). In addition, the partial least
squares (PLS) approach will be utilized in the structural equation modelling (SEM) tool
employed in the statistical analysis of the research model. This method has an advantage over
the covariance-based SEM (CB-SEM) method regarding the use of a small sample size.
According to the ‘10 times’ rule mentioned frequently in the literature for calculating the
appropriate sample size for the PLS method (see Peng and Lai, 2012), a sample size of 40 is
sufficient for analysing the current research’s proposed model. Furthermore, Flynn et al.
(1990) indicated that, in theory verification, large samples are not necessarily required.
This research used judgement sampling (Forza, 2002), since the information needed
can be provided only by experts with sufficient knowledge about the researched variables.
Sampling error is related to the representativeness of the sample for the selected population
(Malhotra and Grover, 1998). Sampling error’s importance increases when generalization
becomes the main focus of the research. In addition, Flynn et al. (1990) connected the
importance of using a large sample size to generalization issues. For the current research,
generalization to the entire population could not be among the main aims, since this research
was the first attempt to investigate the relationships between ramp-up performance and lean
Chapter Three Methodology
70
and agile logistics. Further research is required to provide verification of the proposed
preliminary model.
3.4.3. Survey Methods Many methods have been used to reach respondents, including personal contacts, telephone
calls, mailing, and web-based methods. An evaluation of the different data collection methods
used in the field of operations management was provided by Forza (2002), Dillman et al.
(2014), and others. In addition to the conventional hard and soft copies, the questionnaire was
made available online using Google Forms to facilitate completion, submission, and even data
processing activities. Cook et al. (2000) stated that: ‘the potentials of the electronic survey are
too great to be ignored’. In most cases, multiple contacts were made with the respondents,
who included operations managers, authors in the ramp-up field with a practical background,
researchers who had used a similar methodology, colleagues occupying managerial positions
in industrial companies, and other persons who had personal contact with targeted
practitioners. Dillman et al. (2014) stressed the importance of using a social exchange
approach to motivate the respondents. Such an approach was utilized mainly through pre-
contacts and other tools.
Since each questionnaire considers the ramp-up process for only a single product,
some companies provided more than one response. The questionnaires from the same
company were tested for similarities in responses to evaluate the existence of differences
between the production systems of different products in addition to differences between the
related logistics systems. Companies were asked to fill in only one questionnaire if different
products or product types are produced within the same operational and logistical
environment. Since contact information was provided by most of the respondents, additional
contact was made with the respondent when further information was required, when some
missing values existed, or even when an item seemed to have been misunderstood.
3.4.4. Response Rate Issues The importance of the response rate for survey research success was discussed by Cook et al.
(2000) and Frohlich (2002). De Beuckelaer and Wagner (2012) indicated the increased
difficulties in attaining a high response rate and a sufficiently large sample. However, Cook et
al. (2000) stated that the representativeness of the responses in survey research is more
important than the response rate. Furthermore, the authors mentioned that concern about the
response rate is important only if the sample’s representativeness is questioned. In addition,

Chapter Three Methodology
71
little or no relationship between the response rate and non-response bias was expected due to
the nature of the research and the lack of exposure to confidential data.
A meta-analysis conducted by Cook et al. (2000) showed that the number of contacts,
personalized contacts, and pre-contacts are the most influential factors in enhancing the
response rate in survey research. These issues, in addition to other techniques discussed by
Frohlich (2002), were used to enhance the response rate. However, the response rate cannot
be calculated precisely for this research, since the respondents and colleagues were asked to
submit the questionnaire to other potential respondents. Therefore, the total number of
contacts made is difficult to specify. Nevertheless, the calculated response rate was around
23.35%, which is generally accepted in the operations management literature (see Malhotra
and Grover, 1998). However, the actual rate is expected to be lower.
3.5. Data Evaluation Finn and Wang (2014) highlighted the importance of distinguishing between formative and
reflective measurement for the entire theory testing process. Diamantopoulos et al. (2008)
mentioned the negative consequences of incorrectly specifying formative constructs as
reflective ones. Freeze and Raschke (2007) explained some differences between formative
and reflective variables in terms of identification, validation, and properties. The current
research model mainly used reflective constructs, since the direction of the relationships is
from the indicators or constructs toward the measures. However, the direction of the
relationships with some measures might be more formative in nature. Identifying the nature of
the constructs used is particularly important for explaining the results of the statistical
analysis employed.
A review of the data used for the statistical analysis revealed that no pattern in
responses could be identified and, thus, non-response error was not expected to exist in such a
way that affects the results of the analysis. The importance of examining the non-response
bias to determine the quality of the survey results was discussed by Clottey and Benton
(2013); two questionnaires were eliminated from the statistical analysis due to clearly
identifiable biased completion patterns. Some researchers have indicated that a lower
response rate might be related to the non-respondent bias (Flynn et al., 1990). However, the
response rate was not considered to be problematically low. In addition, the response rate can
be explained by the length of the questionnaire, rather than by non-response bias.
Furthermore, the importance of response bias minimization is more relevant to the
generalization issues, as explained by Forza (2002).

Chapter Three Methodology
72
Another aspect of data quality concerns the existence and handling of missing data.
Forza (2002) explained the importance of preventing the existence of missing data and
discussed some methods to enhance the completeness of the data, including respondent
involvement, questionnaire design, and clear instruction availability. The online format of the
current questionnaire contributed to minimizing the missing values by providing a progress
bar that showed the percentage of questions completed. In addition, some respondents were
re-contacted when missing values were identified, especially when these values were related
to the main research variables rather than to the moderating variables. While van Buuren
(2012) recommended the treatment of missing values with regression methods, this was
considered to provide less reliable analysis results. In this research, the cases with missing
values were excluded, since fewer than 5% of the values were missing, which was considered
to be acceptable and to require no further interference. The results of the pattern analysis in
SPSS show that missing values were identified only for 14 variables, 12 cases, and 15 values,
as figure 3.3 illustrates.
Incomplete data Complete data
Variables Cases Values
Figure 3.3: Missing values summary of the pattern analysis
3.6. Data Analysis Preliminary or descriptive methods, including frequencies, percentages, means, and standard
deviations, were used to organize, describe, and summarize the data. These provide a general
view of the sample characteristics and help to compare these characteristics with those of
different industrial environments to evaluate the applicability of the research’s findings and
recommendations.
Quantitative methods were used to test the proposed model and draw conclusions.
Mainly, the PLS methods of SEM were used. Freeze and Raschke (2007) indicated that by
using SEM, the researcher can assess the measurement model and the path model
0,212
0,788
0,214
0,786
0,004
0,996
Chapter Three Methodology
73
simultaneously. While the measurement model refers to the relationship between the
constructs and their measures, the path model refers to the relationship between different
constructs. Peng and Lai (2012) illustrated the advantages of using the PLS method, including
the ability to estimate a model using a small sample without strict distribution assumptions,
handle models that include both reflective and formative constructs, and avoid the
inadmissible solutions and factor indeterminacy of covariance-based SEM (CB-SEM).
Furthermore, Peng and Lai (2012) stated that PLS considers both common and unique
variances, while CB-SEM focuses on common factor variances only. The authors also
indicated that CB-SEM lacks the ability to estimate models with formative constructs.
Hair et al. (2012) indicated that PLS-SEM requires critical choices that can lead to
improper findings, interpretations, and conclusions if not made correctly. Further details about
the PLS methods utilized are included in chapter 5. The models’ reliability and fitness were
evaluated using different statistical indicators including:
• Items’ standardized factor loadings, which should have values above 0.5 to indicate
sufficient convergent validity (Bagozzi and Yi, 1988).
• Fornell and Larcker’s (1981) rule for discriminate validity, whereby the average
variance extracted (AVE) for a construct should be higher than its shared variance
with any other construct.
• The standardized root mean square (SRMS) should be less than 0.060, as
recommended by Hu and Bentler (1999).
• The variance inflation factor (VIF) should be less than 5 (Hair et al., 2011).
• The maximum heterotrait–monotrait (HTMT) ratio should be less than one (Henseler
et al., 2011).

Chapter Four Measurement Tool Development
74
CHAPTER 4
MEASUREMENT TOOL
DEVELOPMENT
4.1. Introduction Developing valid measures for the research’s constructs is an important condition for theory
building and testing (Finn and Wang, 2014). Empirically investigating the role of lean and
agile logistics practices during the production ramp-up phase requires appropriate measures
for each of the study variables. This measurement tool was structured as a questionnaire
developed specifically for the purpose of the current research as a primary data gathering
method. As explained by Flynn et al. (1990), in empirical or field-based research, data are
collected from naturally occurring situations, rather than within laboratory or simulation
research settings in which the researchers experience more control over the researched events.
Special attention was paid to the development of the data collection questionnaire, since its
validity, accuracy, and reliability determine the value of the concluding results and
recommendations.
While the measures of the dependent variable – production ramp-up – are considered
as performance measurement tools that capture the variation in performance during

Chapter Four Measurement Tool Development
75
production ramp-up, this is not the case for each measure of the independent variables – lean
and agile logistics. Some dimensions used to measure lean and agile logistics could be
considered as leanness or agility performance measurement tools, but other items aim only to
measure the existence of lean or agile logistics practices and not to measure the variation in
their performance levels. However, a general view of the variation in the performance in the
three main areas of investigation (ramp-up, lean, and agile logistics), in addition to a general
evaluation of new product success, is possible using the data collection method constructed.
The following sections provide a preface for the performance measurement of a
manufacturing process and evaluate the measurement tools developed and employed in the
related literature to reach acceptable, valid, and comprehensive measures of ramp-up
performance and levels of leanness and agility in the logistics system beside the new
product’s success evaluation and the moderating variables.
4.2. Performance Measurement The success of any project is judged through the achievement of its predetermined goals (Lim
and Mohamed, 1999). Accordingly, organizational performance can be seen as the outputs
actually achieved compared with the ones planned (Richard et al., 2009; Yang et al., 2014).
The cornerstone in achieving organizational goals lies in the level of efficiency and
effectiveness of the actions taken within the organization. Therefore, measuring performance
can be defined as the process of quantifying these levels of efficiency and effectiveness of an
organizational action (Neely et al., 1995). This process can be used to compare the current
system with alternative systems (Beamon, 1999) and to drive improvement programmes
(Hon, 2005).
Organizations employ several types of performance measures that deal with different
functions and activities. In this research, only measurement criteria related to the
manufacturing performance were considered. In addition, the specific settings, requirements,
and objectives of the ramp-up process were addressed. However, this phase’s specific
characteristics were not stressed while measuring the logistics system performance, since the
same logistics activities were assumed to take place before and after ramp-up. Performance
measurement is considered as an integral part of the management process (Chenhall, 1997).
Furthermore, levels of performance cannot be improved without measuring the current
performance and comparing it with the planned levels or benchmarks. Dixon et al. (1990)
indicated the importance of performance improvement for manufacturing companies’
financial well-being.

Chapter Four Measurement Tool Development
76
The literature has shown that considerable efforts have been devoted to clarifying the
issues required to develop successful performance measurement systems (Folan and Browne,
2005). More consideration of these issues and characteristics enhances the effectiveness and
the validity of the measure. Furthermore, these issues determine the usability, adaptability,
and relevance of the measure (Hon, 2005); such characteristics include:
• Simplicity, which concentrates on the ease of data collection (Hon, 2005).
• Inclusiveness, which insists on the consideration of all the related aspects (Beamon,
1999).
• Consistency with the organizational goals (Dixon et al., 1990); this enables the
alignment of goals and actions (Hon, 2005). Without such a property, the specific
actions proposed by the measurement results cannot affect the overall goal
achievement (Fry and Cox, 1989), and, more specifically, Maskell (1991) stressed the
importance of being consistent with the manufacturing strategy.
• Pervasiveness (Hon, 2005) or integration (Neely et al., 1995), allowing the use of the
measure vertically and horizontally in the organization.
• Adaptability; the measurement framework should be adaptable to the consistently
changing external environment (Ghalayini and Noble, 1996) and vary between
locations and over time (Maskell, 1991).
• Universality, which enhances consistent comparison abilities with varying conditions
(Beamon, 1999).
• Measurability, so unmeasurable items should be ignored (Beamon, 1999).
• Credibility; Kaydos (1991) stated that a creditable measurement is able to explain 80%
of the variation in performance.
Some of these characteristics are less related to the context of the current research,
since the aim of this research is not to develop a performance measurement system for a
certain company; rather, it aims to develop a general system that can be used in a multi-
company environment. The consistency with organizational goals, as an example, was
considered in a general form since different companies have different goals, but common
goals that are usually shared by different organizations, such as profitability and customer
satisfaction, were relevant. Similarly, inclusiveness is more related to a single-company
performance measurement system, and the achievement of such a property could not be
possible using a common system designed for multiple companies. Furthermore, adaptability
issues are connected to a continuous measurement process, which is also beyond the scope of

Chapter Four Measurement Tool Development
77
the current research and is regarded as a single-time measure. Doltsinis et al. (2013) explained
that the measurement tool design and implementation depend on the purpose of measurement.
4.3. Measuring Ramp-Up Performance The positive contributions of performance measurement to any manufacturing process are
indubitable (Hon, 2005). The importance of developing and using accurate performance
measurement tools and methods is increasing for both researchers and practitioners (Bourne et
al., 2000; Folan and Browne, 2005). Like other manufacturing phases, an appropriate measure
of efficiency and effectiveness is required throughout the phase of production ramp-up. In
their holistic approach to production ramp-up, Schuh et al. (2005a) stressed the importance of
ramp-up evaluation through benchmarking techniques, which include the determination of the
relevant qualitative and quantitative performance measurement parameters. Furthermore,
Gross and Renner (2010) stated that ramp-up’s success should be reinterpreted using
performance-related concepts.
Despite the importance of measurement issues and the availability of sufficient
research efforts for measuring performance during steady-state production (for a review see
Folan and Browne, 2005; Neely, 2005; Nudurupati et al., 2011), a comprehensive
measurement of production ramp-up performance is lacking. Doltsinis et al. (2013) confirmed
that sufficient research literature on measuring performance in mature manufacturing settings
is available. Similarly, Bourne et al. (2000) indicated the existence of multidimensional
performance measurement systems for steady-state production. On the other hand, Doltsinis
et al. (2013) asserted that the ramp-up literature is lacking sufficient efforts to develop such a
measurement system. In addition, a focus on the financial perspective as a predominant single
dimension characterized the ramp-up literature (e.g. Bohn and Terwiesch, 1999; Terwiesch
and Bohn, 2001; Terwiesch and Xu, 2004; Carrillo and Franza, 2006). Neely (2002) indicated
the increasing importance of developing non-financial measures of performance. However,
special characteristics of the ramp-up phase limited the prospect of using conventional
performance measures for a mature production process.
4.3.1. A Tailored Ramp-Up Performance Measure The differences between the ramp-up and the steady-state phase take many forms and rage
from general goals and objectives to specific technical issues. These differences should be
reflected in the measurement of the manufacturing performance during these two phases. For
example, in measuring ramp-up performance, more attention should be directed toward the

Chapter Four Measurement Tool Development
78
time-based performance, since ramp-up success has always been linked to reducing the time-
to-volume duration (Terwiesch and Bohn, 2001; Doltsinis et al., 2013; Schmitt and Schmitt,
2013; Li et al., 2014). In other words, the ramp-up performance measure should concentrate
more on effectiveness and time-related goal achievements, while in the steady-state phase
following ramp-up, more attention is usually directed toward cost-related aspects and process
efficiency, since mature products compete more on the base of price than on the base of
differentiated attributes (for more details see chapter 6). This should be linked to the price fall
experienced by new products as competitors introduce similar products, turning the new
innovative product into a commodity that customers judge through price rather than features.
Terwiesch et al. (2001) highlighted this fact with a focus on the hard disk drive industry.
On the technical side, while the cycle time is considered to be stable during the mature
production process, it experiences a continuous drop throughout the ramping up of the
production process (Baloff, 1966; Terwiesch and Bohn, 2001) due to learning and other
factors. Therefore, the rate of the cycle time decrease is critical for evaluating the ramp-up
process. However, in addition to the high level of fluctuation, Chen et al. (2009) mentioned
some sudden increases in the lot cycle time in the semiconductor industry. Another point
made by Chen et al. (2009) regarding the ramp-up process was the rapid increase in the work-
in-process and the utilization levels.
Measuring performance during production ramp-up without considering the
differences between ramp-up and other production stages might produce misleading results
that in turn provide the wrong materials for making managerial decisions during this critical
phase.
4.3.2. Categorization of Performance Indicators Instead of developing narrow and constantly specified measures, authors have frequently
tended to group performance measurement indicators into wider and more general categories.
This tendency can be noted in the performance measurement literature on both ramp-up and
steady-state production. One of the most famous categorization attempts is the balanced
scorecard (Kaplan and Norton, 1992; Kaplan and Norton, 1996), whereby performance
measures are differentiated into categories with four perspectives: financial, customer,
internal business, and innovation and learning. Leong et al. (1990) argued that manufacturing
tasks, and consequently the key performance dimensions in a manufacturing process, fall into
one of the following categories: quality, delivery speed, delivery reliability, price (cost), and
flexibility. In addition, Bourne et al. (2000) distinguished between measures derived from
Chapter Four Measurement Tool Development
79
strategy and measures aiming to challenge the strategy. On the other hand, De Toni and
Tonchia (2001) differentiated between cost-related measures, such as production cost and
productivity, and non-cost measures, such as quality, time, and flexibility. Hon (2005)
categorized 442 individual measures collected by Hon and Serna (2005) into the following 5
categories: cost, quality, productivity, time, and flexibility measures. With a service-oriented
view, Fitzgerald et al. (1991) considered the dimensions of resource utilization, quality,
innovation, and flexibility.
With regard to the production ramp-up literature, most researchers, while developing
their measurement tools, have concentrated on performance indicators that fall within one of
the following categories: time, quantity, quality, and cost (Surbier et al., 2014). Likewise,
Gross and Renner (2010) showed that the dimensions of quality, time, and cost dominate the
ramp-up literature (e.g. Urban and Seiter, 2004; Scholz-Reiter et al., 2007; Winkler et al., 2007;
Herrmann et al., 2009). In many cases, time and quantity have been considered as one
construct, and indicators used to measure time performance have also been used to measure
quantity performance. This could be due to the excessive dependence of the ramp-up time on
the production rate and cycle time, which are, at the same time, the major indicators of
quantity performance. The length of the ramp-up time, however, might depend on factors
other than productivity-related factors, such as quality loss, tooling, experimentation rate, and
so forth.
In three studies published in 1999 and 2000, Almgren used three different
measurement tools for production ramp-up performance (as part of the final verification
process). While in Almgren (1999a) the author used the overall equipment effectiveness –
which was defined by Nakajima (1989) as the value-added through the use of equipment –
and divided the construct into the three variables of availability, operation performance, and
quality performance, in Almgren (1999b) he used capacity, quality, and cost to measure ramp-
up performance. However, in Almgren (2000) he argued that performance during production
ramp-up is subject to two parameters: throughput time and efficiency. Juerging and Milling
(2006) used the dimensions of process conformance, product conformance, quantitative
ratios, and quality to describe the outcomes of the production ramp-up process. Apilo (2003)
measured ramp-up performance through yield, supplier performance (number of missing
items), process cycle time, and delivery accuracy. In addition, Scholz-Reiter et al. (2007) and
Elstner and Krause (2014) indicated the dimensions of time, cost, and quality in dealing with
production ramp-up. Winkler et al. (2007) linked ramp-up performance indicators to the goals
pursued during this phase (which was regarded as a time-defined project). The main three

Chapter Four Measurement Tool Development
80
goals mentioned by the authors were effectivity, efficiency, and deadline goals. A similar
attempt to study ramp-up from the project perspective was undertaken by Kontio and
Haapasalo (2005). Alternatively, Ball et al. (2011) considered learning, capacity, and cost to
measure ramp-up performance.
Another direction in studying ramp-up variation was taken by Langowitz (1988), who
measured 18 ordinal and dummy variables to represent the variation in the performance
during initial commercial manufacturing; some of these variables could be linked to the
system productivity, such as production process deviation, work schedule deviation, and
output and delivery target achievement; others were related to the quality, such as supplier
quality mismatch and quality target achievement; and other factors were related to the
workers and the equipment used, such as worker errors, poor documentation, and new tooling,
material, or software mismatch. All of these might affect cost, quality, or quantity
performance. Similarly, Fjällström et al. (2009) categorized 30 empirically deduced critical
events during production ramp-up into 6 categories: process, supply, quality, technique,
education, and organizational actions.
Doltsinis et al. (2013) argued that the aims of performance measurement should vary
according to the specific stage during ramp-up. According to a three-stage classification,
Doltsinis et al. (2013) proposed that the focus on the early ramp-up stage should be on the
functionality of the process; this focus shifts in the second stage to the output quality, while
performance optimization is the focus of the final ramp-up stage (see figure 4.1). The authors
referred to the process with all of the cycle time, cycle time phase, and duration within
acceptable ranges as an optimized process.
Figure 4.1: Ramp-up temporal classification according to Doltsinis et al. (2013)
Ramp-up process stages
Total ramp-up process
Optimization
Perf
orm
ance
met
ric
Time
Quality
Functionality
Tf Tq To Time
Perf
orm
ance
mea
sure
Tr

Chapter Four Measurement Tool Development
81
Such a temporal classification lacks further support in the literature. In addition, the
generalization of this model is greatly restricted due to the nature of the underlying research
that considered the environment of an assembly station. Furthermore, the duration of each
stage could not be easily defined. For example, while dysfunctional process starts require a
prolonged initial stage, a smooth start with minimum functional failures might greatly shorten
this stage. However, a similar classification was used in one of the quantity-related
measurement items in the current research to examine the validity of such clarification.
4.3.3. The Developed Measure The current research considered three performance measurement categories, consisting of
quantity performance, quality performance, and cost performance. These categories reflect the
most important aspects that should be considered in any activity taking place during the
production ramp-up phase. Time-related performance was included in the quantity
performance, which is composed of a comprehensive measure that includes productivity
aspects, in addition to factors that affect the total quantity produced during the ramp-up period
(and consequently the total time consumed). Mallick and Schroeder (2005) argued that time
could be viewed more as a resource than as an outcome. This was supposed to support the
consideration of quantity rather than time for this dimension.
A distinction between economic measures and technical measures that is more
relevant to the shop floor and the operating departments was presented by de Ron (1995).
Doltsinis et al. (2013) elucidated the two main trends noted in the literature to focus on
performance measures that aim either at supporting managerial decisions taken at high
organizational levels or at enhancing lower levels’ performance. Di Benedetto (1999)
differentiated between strategic and tactical activities in a new product launch. The ramp-up
performance indicators used concentrated more on the operational level, which was in line
with the explorative nature of the research. Doltsinis et al. (2013) argued that the control loop
performance approach, based on the work of Harris (1989), which is used to control the
performance variation at the process level, can be linked to production ramp-up through
combining process measurements in a higher-level index. This direction is also characterized
not only by being company-specific but also by being process-specific; the general measure
sought by this research cannot be derived from a specific process control technique. However,
since data were also collected on the overall success of the product undergoing the ramp-up
process, the results could also support higher levels of the decision-making process.

Chapter Four Measurement Tool Development
82
The details of ramp-up’s performance measurement tool developed according to the
three categories of quantity, quality, and cost are the following. In addition to the specific
items used to measure each dimension, an overall assessment of the ramp-up goal attainment
regarding volume, time, quality, and cost was employed to evaluate the consistency of the
responses and to cover other facets of performance that were missed in the current
questionnaire or that were specific to the respondents’ company environment. Furthermore,
this would help to explore how respondents distinguish – if at all – between quantity-related
and time-related performance.
Quantity Performance As mentioned above, the quantity dimension of the performance measure contains time-
related variables in addition to productivity-related variables. The arguments regarding which
variable should be mentioned (time or quantity) are less related to the final aim of the
measurement tool. Quantity and time dimensions are the most important during production
ramp-up, since they are more related to the highly stressed goal of this stage. Scholz-Reiter et
al. (2007) affirmed that the primary goal of the ramp-up phase lies in the fast achievement of
secure production. Many other authors (e.g. Almgren, 1999a; Terwiesch and Bohn, 2001;
Niroomand et al., 2014) have also emphasized this goal.
Many dimensions can be employed to measure this performance dimension, including
productivity, capacity utilization, cycle time, D:P ratio – that is, the delivery lead time to
production lead time ratio (Maskell, 1991), setup time, and others. Each one of these major
categories can be measured using different tools and sub-dimensions. As an example, Hon
(2005) indicated some variables used to measure the productivity of a production system,
including assembly line effectiveness, machine effectiveness, network effectiveness,
equipment effectiveness, direct labour productivity, total productive maintenance, value-
added per employee, and so on. Specific measures and dimensions are more related to the
cases in which a certain case or system is under consideration. Therefore, more general
measures that fit most cases were considered.
Productivity Regardless of the case or system being investigated, productivity measures are of great
importance and should be considered. Researchers in the ramp-up field have used different
tools to capture this dimension. Pufall et al. (2007) measured operational performance through
the ratio of actual sales to planned sales. Collecting sales data as well as production data

Chapter Four Measurement Tool Development
83
requires a comprehensive view that might not be available to all respondents. Furthermore,
the ramp-up phase is generally characterized by a high demand rate and a relatively lower
production rate (Terwiesch et al., 2001). Consequently, the sales volume and production
volume are supposed to be the same during the ramp-up period. Hence, a measure that deals
directly with the production rates is more appropriate. Terwiesch and Bohn (2001)
concentrated on production starts rather than production time and measured the number of
starts per hour, which represents the speed of production. Almgren (2000) measured the rate
of actual production to planned production as a representative of quantity performance.
Almgren (2000) considered both quantity and quality performance as an operationalization of
the throughput time measure, which measures the speed of performing activities required to
attain the output targets. Instead of measuring the actual production to planned production
ratio, Terwiesch and Bohn (2001) and Terwiesch et al. (2001) measured the actual production
to available resources ratio, which is frequently referred to as the utilization rate.
The direct measure of the actual to the planned production rate was employed with an
attempt to classify the ramp-up phase into three stages to explore whether significant
differences in the rate of production and deviation from targets can be noted among the
different stages of ramp-up. Doing so might provide empirical evidence to support or oppose
the classification approach developed by Doltsinis et al. (2013).
Cycle Time Reduction Another quantity-related performance measure is the cycle time (Hon, 2005). Haller et al.,
(2003) indicated that the cycle time is the main control parameter of the ramp-up process and
explained the effect of the cycle time’s length on the learning process, start and output rates,
and process yields. The dynamic nature of the ramp-up phase (Chen et al., 2009), side by side
with the crucial effect of learning (Terwiesch and Bohn, 2001), contributes to the continuous
decrease in the production cycle time throughout the ramp-up process. By the end of the
ramp-up phase, the cycle time tends to be more stable and further reductions in the cycle time
require significant efforts and changes in the production system. The production rate might be
an insufficient measure of the ramp-up process, especially during the early stages of
production (Doltsinis et al., 2013); a measure of the change in the production rate over time is
more consonant with the characteristics of this phase. Therefore, measuring the rate of
reduction in the production cycle time can represent the progress of the process well. A
similar attempt to measure the progress of the process considering the dynamic nature of the
ramp-up process was made by Flaherty (1992), who focused on the capacity development

Chapter Four Measurement Tool Development
84
rate, which represents the ability of the firm to increase the rate of output to the design
capacity.
Alternatively, Doltsinis et al. (2013) used the term ‘functionality’ to measure the
deviation from the targeted cycle time and linked this term to assembly line operations. No
further research has supported the use of this measure within other manufacturing
environments. In addition, the forecasting of the cycle time during ramp-up to develop the
production plan or to identify the target cycle time is a challenging process (Chen et al.,
2009).
Learning Rate Learning is one of the most influential variables during the ramp-up process. The duration of
this period depends heavily on the learning process (Terwiesch and Bohn, 2001; Terwiesch
and Xu, 2004). Terwiesch and Bohn (2001) indicated the effect of the experimentation rate
aimed to enhance induced learning on production rates during ramp-up. In addition, Haller et
al. (2003) explained that the production rate and the experiments designed contribute to
enhancing learning. In other words, induced learning affects the production rate, which in turn
affects autonomous learning.
A restricted consideration of learning as a separate measure of ramp-up in the
literature was attributed to the tendency noted in some research to link learning solely with
production volume. On the other hand, some researchers have measured the entire ramp-up
performance through learning (e.g. Lee and Matsuo, 2012). However, Juerging and Milling
(2006) stated that variation in ramp-up times cannot be based only on the learning curve,
especially in auto manufacturing.
Unplanned Production Stops Layovers in the production process affect the duration of the ramp-up phase and occur for
many reasons, such as machine downtime (Hon, 2005), design experiments (Terwiesch and
Bohn, 2001; Haller et al., 2003), a lack of materials (Almgren, 2000), and equipment-related
problems (Fjällström et al., 2009). In some cases, production stops are planned and aim to
enhance the overall performance of the system, such as in the case of designed experiments
that contribute to enhanced induced learning levels. Thus, only unplanned stops that increase
the deviation from the targeted production and timing goals were considered.
In addition to the main objective of exploring the effects of lean and agile logistics
activities on the frequency of production stops, further analysis of the data collected might

Chapter Four Measurement Tool Development
85
provide an insight into the co-existence of other problems with unplanned production halts
and, hence, reveal other non-logistics reasons for production stops.
Other quantity- and time-related measures were mentioned by Hon (2005), including
the average batch processing setup time, takt time, and throughput time. Woodcock et al.
(2000) focused on the time needed to reach full productivity. Almgren (1999a) measured the
overall equipment effectiveness. Carrillo and Franza (2006) mentioned the importance of
design-related knowledge to ramp-up. In addition, famous quantity-related performance
measures are the utilization rate (Schuh et al., 2005a) and the effective utilization rate
(Terwiesch and Bohn, 2001; Pufall et al., 2007), which are related to capacity and effective
capacity, respectively. Terwiesch et al. (2001) listed different components of effective
capacity, including takt time, downtime, and yields. To avoid duplication of measurement that
might confuse the respondents, no items were dedicated to measuring the utilization; inputs
that construct the utilization measure, such as output rate, yields (under different quality-
related terms), and cycle time, were considered through other items in the questionnaire.
Quality Performance Producing quality products has been considered by some authors (e.g. Cooper and
Kleinschmidt, 1987; Führer, 2008) as the main objective to be achieved while introducing a
new product. Schmitt and Schmitt (2013) stressed the effect of quality requirements’
fulfilment on production ramp-up delay. It is worth noting that quality objectives can vary
among different products (Doltsinis et al., 2013) and wrongly setting quality standards might
produce a high rejection rate and, consequently, more revisions and additional costs
(Clawson, 1985). However, Doltsinis et al. (2013) indicated that the low production rate
during the early production stages hinders the applicability of quality-related performance
parameters, since quality measurement requires relatively large test runs and time.
Nevertheless, quality measurements have been used by several researchers. In addition,
reaching the required levels of quality is an indicator of the end of the ramp-up phase.
While de Ron (1995) indicated that the types of quality should include the quality of
the product and the quality of the process, in the current research, only the product quality
was considered. High process quality can be linked to other product-related outcomes, such as
cost and quality. In measuring product quality performance, two important perspectives
should be considered: the company perspective and the customer perspective. The first one
was measured through the rate of defective products to total production, and the latter was
measured through the rate of returned products to total sales.

Chapter Four Measurement Tool Development
86
Defective Products Rate This measure is related to the degree to which the produced unit matches the predetermined
specifications and description. Researchers have measured product quality, from an internal
perspective, under different rubrics, such as conformance to specifications (Harveya and
Green, 1993; Juran and Godfrey, 1999), product quality (Almgren, 2000), and yield (van der
Merwe and Frizelle, 2003; Terwiesch and Xu, 2004), and using different tools, including the
rework and scrap percentage (Hon, 2005), rate of products without known defects (Almgren,
2000), proportion of output with sufficient quality to sell (Salomon and Martin, 2008), faults
per unit (van der Merwe and Frizelle, 2003), rejection rate (Schuh et al., 2005a), and process
capability indices (PCIs), which numerically measure whether a manufacturing process meets
the quality requirement (Lin and Pearn, 2005). In the current research, an evaluation of the
relative number of defective outputs from low to high was used. Since product specifications
are usually developed to meet customer requirements, this quality measure can also contribute
to the customer perspective of quality. However, when it comes to new products, the actual
and the forecasted customer requirements might vary significantly.
Returned Products Rate Customer-perceived quality is important for reducing lost sales and enhancing customer
retention (Pufall et al., 2007). Many tools can be employed to measure this dimension, such as
the return rate (Hon, 2005), reliability (Neely et al., 1995), conformance (Neely et al., 1995;
Almgren, 2000), and satisfaction with quality (Gross and Renner, 2010). To capture
customer-perceived quality without collecting data directly from customers or end-users, the
rate of returned products might be an appropriate measure. Defective units are supposed to
remain in the company for scrap or rework, not to be sold to the customer. Therefore, the
returned products rate is supposed to represent further quality problems that are not
discovered within the manufacturing facility.
Quality Level Deviation Some of the quality troubles may not be related to the nature of the ramp-up process and as
such continue after the end of this stage. Therefore, measuring the acceptable deviation in
quality level in comparison with steady-state production is helpful in concentrating the
investigation on the ramp-up-specific parameters. The measurement of the deviation of
quality level from the targeted levels has received a great deal of interest in the process
control literature. Deviation of quality from planned targets was mentioned by Winkler et al.

Chapter Four Measurement Tool Development
87
(2007). Another important quality-related measure during production ramp-up is yields
(Terwiesch and Xu, 2004; Lee and Matsuo, 2012). Yields significantly affect process
economics (Mclvor et al., 1997). Yields have been used as an indicator of product maturity
(Haller et al., 2003). Doltsinis et al. (2013) mentioned the importance of the production yield,
as it combines both production volume and output. Likewise, Bohn and Terwiesch (1999)
showed that a 3% increase in yields can produce about a 6% increase in gross revenue and
around a 17% increase in contribution.
Cost Performance A considerable debate on the use of the cost dimension to measure ramp-up performance has
taken place in the literature. Doltsinis et al. (2013) argued that the production cost is already
predetermined during the development process and that additional costs might be encountered
during ramp-up only if additional resources are used. Doltsinis et al. (2013) also stated that
cost metrics are mainly used for managerial decision support rather than for technical
decisions, as they are not connected directly to performance. In addition, Möller (2005)
indicated that data related to costs are usually available too late. Furthermore, Pufall et al.
(2007) clarified that the short-term impact of the cost during production ramp-up is minor
compared with the impact of lost sales resulting from delays.
On the opposite side, cost performance has been considered by many researchers (e.g.
Terwiesch and Bohn, 2001; van der Merwe and Frizelle, 2003; Hüntelmann et al., 2007;
Meyer, 2008; Gross and Renner, 2010; Ball et al., 2011) due to its relevance and importance.
Among the frequently mentioned characteristics for the ramp-up phase are fluctuation (Chen
et al., 2009) and deviation from plans (Schuh et al., 2005a). Gross and Renner (2010)
indicated that cost objectives are less predictable than timing and quality objectives during
ramp-up. Even if the ramp-up costs are pre-planned, the deviation from the targeted cost
levels should be captured. In addition, while the exact cost figures require a long time to
prepare, a general evaluation of these costs is possible even during the ramp-up process.
Furthermore, managerial decisions regarding cost should be translated into lower-level
technical strategies. Almgren (2000) measured the ratio of standard costs to actual costs. The
actual costs include the extra costs incurred during production.
Variable Costs The per-unit cost represents a wide array of variable manufacturing costs that vary as the
quantity produced changes. Hon (2005) and Neely et al. (1995) used the unit manufacturing
Chapter Four Measurement Tool Development
88
cost to measure performance. Beside the unit manufacturing cost, Hon (2005) mentioned
other variables to be measured, including the overhead cost, setup cost, tooling cost, unit
labour cost, and unit material cost. Almgren (2000) used the rate of standard costs to actual
costs as a measure of system efficiency during the final verification process, and Terwiesch
and Bohn (2001) considered the cost per production start in their mathematical analysis of the
ramp-up period.
Other researchers have considered variable costs during production ramp-up, including
Ball et al. (2011), who focused on recurring costs that arise with every unit produced, and van
der Merwe and Frizelle (2003), who used labour hours. Similarly, Almgren (1999b) employed
an engineering cost model based on Kilbridge and Wester (1966) to determine the cost
associated with start-up. He operationalized the deviation of output from planned levels as
quantity or quality loss. Both quantity and quality loss were considered as sources of
additional manufacturing costs; these costs were captured through the additional labour hours
(which are a deviation from the planned labour hours) required to achieve the targeted goals.
In this case, costs were considered as an indicator of both the output quantity and the output
quality. To investigate the trends in the production cost that might be relevant to the ramp-up
phase, the unit production costs were compared with the unit production costs during the
steady-state production phase.
Costs of Preparing the Production System The ramping up of new products requires substantial modification to the production system;
otherwise, the production process might be inefficient (Matta et al., 2008). Thus, preparing
the production system for the ramp-up process requires a high level of investment (Ball et al.,
2011). Intensified investment in process modification increases the pressure to ramp up the
production successfully to repay the fixed costs quickly.
Considering production ramp-up, Ball et al. (2011) investigated the non-recurring
costs that arise at the beginning of the product lifecycle. Preparing the production system for
producing a new product might include installing different machines, tools, and technologies,
providing training programmes, and investing in testing capabilities.
Repair, Rework, and Scrap Costs In addition to the fixed costs related to preparing the system for new products and the variable
costs related to the volume produced, other costs that might be of significance during the
ramp-up process are the costs of repair, rework, and scrap. These costs are more related to

Chapter Four Measurement Tool Development
89
failures and deviation in the production process from planned targets. Unlike fixed and
variable costs, repair, rework, and scrap costs can be significantly reduced as the production
process is enhanced. Hon (2005) used the scrap cost to measure the manufacturing
performance. Such a type of cost could be an excellent indicator of the smoothness of the
ramp-up process, which is characterized by fluctuation, variation, and high failure rates.
However, Gross and Renner (2010) used an overall evaluation of cost performance by
measuring satisfaction with costs and the achievement of cost targets.
Problems during the Ramp-Up Phase In addition to the dimensions of quantity, quality, and cost, ramp-up performance has been
measured through the frequency of occurrence of production trouble. Some researchers (e.g.
Almgren, 1999b; Terwiesch and Bohn, 2001; van der Merwe, 2004) have indicated that late
engineering changes and other difficulties, such as production disturbances, a lack of training,
and problems with material supply, seem to be very common during production ramp-up.
Each problem occurring during the ramp-up process will affect one or more of the three
performance parameters used. For instance, Terwiesch and Bohn (2001) indicated the delay
occurring in the launch of technology products due to ramp-up problems. Combining the two
measurement tools brings additional insights into the overall process performance. Beside its
performance indication, data on ramp-up problems were analysed to explore their effect on
the overall success of the process as well as its relations with lean and agile logistics
activities. The investigation of ramp-up problems is supported by the literature. Researchers
who have focused on this matter include Langowitz (1988), Simola et al. (1998), Almgren
(2000), Terwiesch and Bohn (2001), Fjällström et al. (2009), and others.
Problems that appear during the ramp-up phase can be classified according to their
sources; problems can be linked, for example, to the material supply quantity, quality, or
timing (Almgren, 2000); machines (Fjällström et al., 2009); equipment and tooling
(Langowitz, 1988); employees’ attendance, rotation, or skills (Almgren, 2000); or mismatch
between the new product and the current production process (Langowitz, 1988).
In this research, common problems with the probability of occurrence within different
industries and different environments were measured, including problems related to the
material supply, production machines, equipment and tooling, production employees,
production process, product design, technology employed, cooperation among departments,
and information flow.
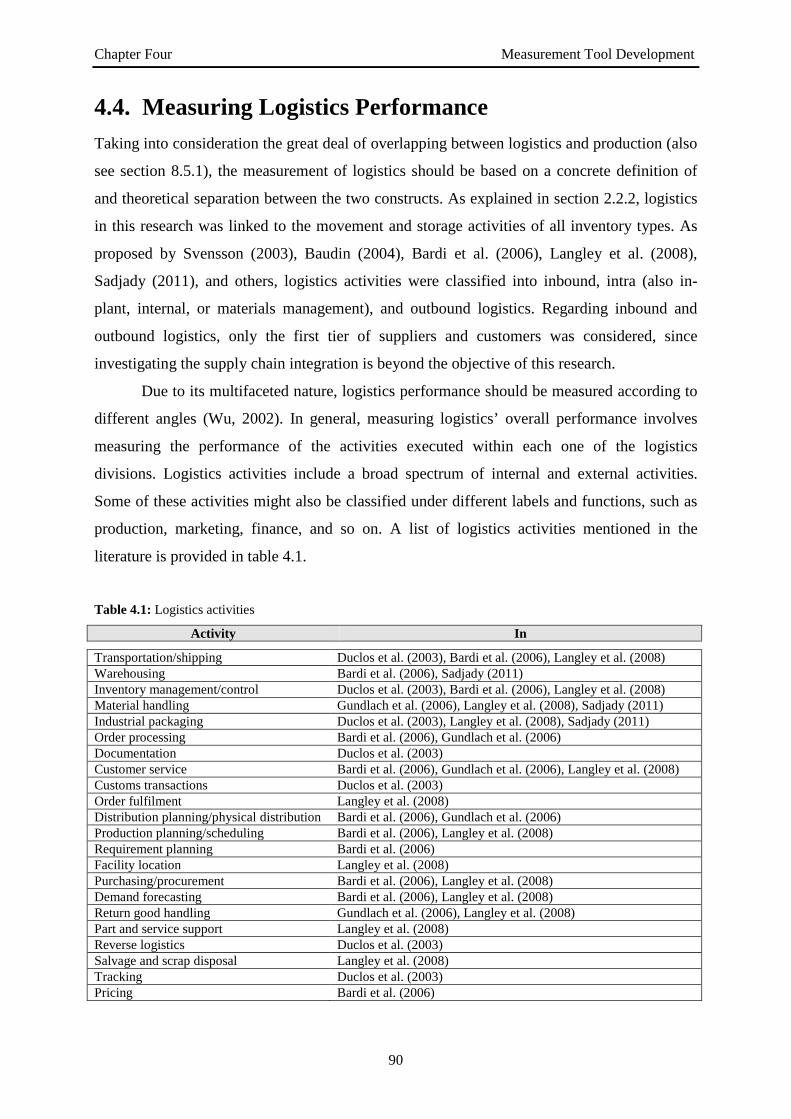
Chapter Four Measurement Tool Development
90
4.4. Measuring Logistics Performance Taking into consideration the great deal of overlapping between logistics and production (also
see section 8.5.1), the measurement of logistics should be based on a concrete definition of
and theoretical separation between the two constructs. As explained in section 2.2.2, logistics
in this research was linked to the movement and storage activities of all inventory types. As
proposed by Svensson (2003), Baudin (2004), Bardi et al. (2006), Langley et al. (2008),
Sadjady (2011), and others, logistics activities were classified into inbound, intra (also in-
plant, internal, or materials management), and outbound logistics. Regarding inbound and
outbound logistics, only the first tier of suppliers and customers was considered, since
investigating the supply chain integration is beyond the objective of this research.
Due to its multifaceted nature, logistics performance should be measured according to
different angles (Wu, 2002). In general, measuring logistics’ overall performance involves
measuring the performance of the activities executed within each one of the logistics
divisions. Logistics activities include a broad spectrum of internal and external activities.
Some of these activities might also be classified under different labels and functions, such as
production, marketing, finance, and so on. A list of logistics activities mentioned in the
literature is provided in table 4.1.
Table 4.1: Logistics activities
Activity In
Transportation/shipping Duclos et al. (2003), Bardi et al. (2006), Langley et al. (2008) Warehousing Bardi et al. (2006), Sadjady (2011) Inventory management/control Duclos et al. (2003), Bardi et al. (2006), Langley et al. (2008) Material handling Gundlach et al. (2006), Langley et al. (2008), Sadjady (2011) Industrial packaging Duclos et al. (2003), Langley et al. (2008), Sadjady (2011) Order processing Bardi et al. (2006), Gundlach et al. (2006) Documentation Duclos et al. (2003) Customer service Bardi et al. (2006), Gundlach et al. (2006), Langley et al. (2008) Customs transactions Duclos et al. (2003) Order fulfilment Langley et al. (2008) Distribution planning/physical distribution Bardi et al. (2006), Gundlach et al. (2006) Production planning/scheduling Bardi et al. (2006), Langley et al. (2008) Requirement planning Bardi et al. (2006) Facility location Langley et al. (2008) Purchasing/procurement Bardi et al. (2006), Langley et al. (2008) Demand forecasting Bardi et al. (2006), Langley et al. (2008) Return good handling Gundlach et al. (2006), Langley et al. (2008) Part and service support Langley et al. (2008) Reverse logistics Duclos et al. (2003) Salvage and scrap disposal Langley et al. (2008) Tracking Duclos et al. (2003) Pricing Bardi et al. (2006)

Chapter Four Measurement Tool Development
91
In developing the measurement tool, more attention was paid to transportation and
inventory activities than other activities due to their importance. Langley et al. (2008)
indicated that transportation is the source of the largest variable logistics cost. Bardi et al.
(2006) stressed the importance of transportation–inventory trade-offs for total logistics cost
minimization. The importance of transportation and inventory as major cost centres was also
shown by Christopher (2011).
The manufacturing process significantly affects the logistics activities (Wu, 2002).
Thus, using a certain manufacturing technique, such as lean or agile manufacturing, will
influence inbound, intra, and outbound logistics activities. Furthermore, many aspects of lean
and agile manufacturing cannot be enabled without logistics support. Baudin (2004), as an
example, argued that lean logistics can be considered entirely as part of the lean
manufacturing system. Therefore, the measurement of the existence and the performance of
lean or agile logistics cannot be detached from the measurement of lean or agile
manufacturing. Consequently, many items used in the current measurement tool to evaluate
lean and agile logistics might also be used, and in many cases were originally used, to
measure lean and agile manufacturing. Similarly, some items used to measure logistics might
have originated to measure supply chain performance, since logistics is frequently considered
in the context of the supply chain (Bardi et al., 2006; Langley et al., 2008; Christopher, 2011;
CSCMP, 2014).
In an attempt to measure logistics performance, Fawcett and Cooper (1998) conducted
a longitudinal empirical study in which they highlighted 10 of the most important cost-related
measures listed according to their importance score. These measures, along with their relative
importance score, are shown in figure 4.2. Other attempts include the four-dimensional
measure proposed by Wu (2002) that evaluates performance in three fields, consisting of
quality, customer satisfaction, and cost. Stank et al. (2001) measured logistics performance
from a customer service point of view using seven questionnaire items focused directly on
customer satisfaction with logistics activities. Gimenez and Ventura (2003) and Gimenez and
Ventura (2005) used the factors of transport cost, order processing cost, stockout, and lead
time, among other items, to measure logistics performance. The Nevem Working Group
(1989), Chow et al. (1994), Caplice and Sheffi (1995), and Gunasekaran and Kobu (2007)
provided a review of the literature regarding logistics performance measurement. In addition,
Akyuz and Erkan (2010) reviewed the literature on supply chain performance measurement.
The following are the measures developed to evaluate the leanness and agility of the logistics
system.

Chapter Four Measurement Tool Development
92
Figure 4.2: Logistics performance measures and their relative importance according to Fawcett and Cooper
(1998)
4.4.1. Leanness Measurement The measurement of logistics system leanness was classified into three dimensions, and the
leanness of inbound, intra, and outbound logistics was measured separately to the greatest
extent possible. The raw material inventory was linked to inbound logistics, the work-in-
process inventory was linked to intra-logistics, and the finished goods inventory was linked to
outbound logistics. Other logistics activities related to the three inventory types were linked to
the corresponding categories as well.
While many researchers have explored lean production practices (e.g. Shah and Ward,
2003; Li et al., 2005; Mehta and Shah, 2005; Shah and Ward, 2007; Pool et al., 2011), other
researchers have investigated similar practices aimed at waste elimination but under different
labels, such as JIT practices (e.g. Sakakibara et al., 1997; Koufteros and Vonderembse, 1998;
White et al., 1999; Ahmad et al., 2003), TQM practices (e.g. Flynn et al., 1995a, 1995b; Black
and Porter, 1996), total productive maintenance (e.g. Mckone and Weiss, 1998; Cua et al.,
2001), and time-based manufacturing (e.g. Koufteros et al., 1998). Shah and Ward (2007)
proposed a conceptual definition of lean production from which they derived ten
measurement items classified into three categories: supplier-related, customer-related, or
internal-related. Overboom et al. (2010) adapted the measurement developed by Shah and
Ward (2007) to suit the logistics service environment. The classification of lean practices into
supplier-, internal-, and customer-related activities is in line with the classification of logistics
activities into inbound (supplier-related), intra (internal-related), and outbound (customer-
related) activities.
4,05 4,1 4,15 4,2 4,25 4,3 4,35 4,4 4,45 4,5
Delivery consistencyCost per unit
Inventory turnsInventory levels
Customer complaintsStockout
Actual versus budgetCustomer satisfaction
Cost trend analysisOn-time delivery
Total logistics cost

Chapter Four Measurement Tool Development
93
Leanness of Inbound Logistics Measuring the leanness of inbound logistics activities concentrates on inventory and
transportation of materials in addition to the evaluation of supplier relationships. As well as
the levels of material inventory, the fitness of the materials delivered by suppliers in terms of
quantity, quality, and timing to the real needs of the manufacturing process was also
measured. This measure represents the JIT supply of material and was supported by the work
of Flynn et al. (1999), Cua et al. (2001), Ahmad et al. (2003), and Shah and Ward (2007).
The materials’ transportation costs were considered as another indicator of inbound
logistics’ leanness level. In addition, the use of material requirement planning (MRP) was
measured as an indicator of a push system rather than the pull system provided by JIT (Brar
and Saini, 2011). The supplier milk run was considered due to its importance for JIT
implementation (Benton and Shin, 1998) and its relatedness to inbound logistics. Other
supplier-related lean manufacturing tools are mentioned in table 4.2. All of these tools can be
considered as lean logistics tools, since the relationship with suppliers implies the movement
and storage of raw material inventory.
Table 4.2: Supplier-related lean manufacturing measures and tools
Measure In
Supplier relationship Flynn et al. (1995a), Slack et al. (2013) Supplier involvement Ahmad et al. (2003), Olsen (2004) Supplier partnership Black and Porter (1996) Supplier quality management Sakakibara et al. (1993), Cua et al. (2001) Supplier development Shah and Ward (2007) Supplier feedback Olsen (2004), Shah and Ward (2007) Dependable suppliers Koufteros et al. (1998), Olsen (2004)
JIT supplier relationship Sakakibara et al. (1997), Flynn et al. (1999), Cua et al. (2001), Ahmad et al. (2003), Shah and Ward (2007)
JIT purchasing White et al. (1999), Olsen (2004) Material requirement planning (Negative) Benton and Shin (1998) Supplier milk run Brar and Saini (2011)
Leanness of Intra Logistics Shah and Ward (2003) categorized lean manufacturing practices into four ‘bundles’
incorporating inter-related lean practices: JIT, TQM, total preventive maintenance, and human
resource management (HRM). Based on a quick review of the literature on ‘in-plant’ lean
manufacturing, some of the most important measures and tools of lean manufacturing with an
abbreviated list of authors are mentioned in table 4.3.

Chapter Four Measurement Tool Development
94
Table 4.3: Internal-related lean manufacturing measures and tools
Measure In
Just-in-time (JIT) Japan Management Association (1985), Monden (1994), de Haan and Yamamoto (1999), Shah and Ward (2003)
JIT scheduling Flynn et al. (1995b)
Setup time reduction Chan et al. (1990), Flynn et al. (1995b), Sakakibara et al. (1997), White et al. (1999), Cua et al. (2001), Ahmad et al. (2003), Li et al. (2005), Shah and Ward (2007)
Lot size reduction Chan et al. (1990), Flynn et al. (1995b), Li et al. (2005)
Kanban/pull production
Chan et al. (1990), Sakakibara et al. (1993), Flynn et al. (1995b), Sakakibara et al. (1997), Koufteros et al. (1998), Koufteros and Vonderembse (1998), Flynn et al. (1999), Cua et al. (2001), Ahmad et al. (2003), Li et al. (2005), Shah and Ward (2007)
Equipment layout Sakakibara et al. (1997), Cua et al. (2001), Ahmad et al. (2003) Continuous flow Shah and Ward (2007) Daily schedule adherence Cua et al. (2001), Ahmad et al. (2003) Production smoothing Chan et al. (1990) Standardization Chan et al. (1990), Mehta and Shah (2005), Stahl et al. (2015)
Cellular manufacturing Koufteros et al. (1998), Koufteros and Vonderembse (1998), Rouhollahi (2011), Chiarini (2014)
Cross-functional teams Chan et al. (1990) Re-engineering setup Koufteros et al. (1998), Koufteros and Vonderembse (1998) Focused factory White et al. (1999) Uniform workload White et al. (1999) Stock reduction Pool et al. (2011) Cross-docking Rouhollahi (2011) Resource reduction Stahl et al. (2015)
Total quality management (TQM) Shah and Ward (2003) Statistical process control Flynn et al. (1995b), Ahmad et al. (2003), Shah and Ward (2007) Quality improvement Koufteros et al. (1998) Quality assurance Koufteros and Vonderembse (1998) Product design Flynn et al. (1995a), Flynn et al. (1995b) Process management/improvement Flynn et al. (1995a), Cua et al. (2001), Pool et al. (2011) Total quality control White et al. (1999) Visual control Stahl et al. (2015) Cross-functional product design Cua et al. (2001) Quality circles White et al. (1999)
Human resource management Flynn et al. (1995a), Shah and Ward (2003) Training Chan et al. (1990), Mckone and Weiss (1998) Top management support Flynn et al. (1995a) Multifunction workers White et al. (1999) Employee involvement Koufteros et al. (1998), Shah and Ward (2007) Employee commitment Dow et al. (1999) Work attitudes Flynn et al. (1995a)
Maintenance Sakakibara et al. (1997) Total preventive maintenance Koufteros et al. (1998), Koufteros and Vonderembse (1998), Shah
and Ward (2003), Shah and Ward (2007) Total productive maintenance Shah and Ward (2007), White et al. (1999), Rouhollahi (2011) Planned maintenance Mckone and Weiss (1998), Cua et al. (2001) Autonomous maintenance Mckone and Weiss (1998), Cua et al. (2001) Single Minute Exchange of Die
(SMED) Chiarini (2014)
Value stream mapping Chiarini (2014), Dal Forno et al. (2014), Stahl et al. (2015) 5 S Rouhollahi (2011), Chiarini (2014), Stahl et al. (2015) Six Sigma Rouhollahi (2011)

Chapter Four Measurement Tool Development
95
As regards inbound logistics, levels of work-in-process inventory were measured,
since inventory reduction (or elimination if possible) is one of the main aims of the lean
system (de Haan and Yamamoto, 1999). Another dimension was the standardization and
smoothing of the materials and parts flow in the manufacturing process, which also represent
production levelling; similar constructs were employed by Chan et al. (1990), Mehta and
Shah (2005), Shah and Ward (2007), and Stahl et al. (2015). Additionally, lean manufacturing
techniques that affect the storage and movement of inventory, such as JIT, Kanban/pull
system, and cross-docking, were used to measure the leanness levels of intra logistics.
Leanness of Outbound Logistics Outbound logistics deals with finished goods and, hence, takes place after the production
process has already been completed. Therefore, its effect on the ramp-up process was not
analysed. Conversely, the possible effect of ramp-up performance variation on outbound
logistics could be investigated. In addition, the effect of outbound logistics on the overall
success of the new product can be examined; however, the mediating role of outbound
logistics between ramp-up performance as an independent variable and new product success
as a dependent variable was included in the research model. For this purpose, the levels of
finished goods inventory, the finished goods transportation costs, and the customer
involvement level were measured and analysed. Table 4.4 provides some of the customer-
related lean practices.
Table 4.4: Customer-related lean manufacturing measures and tools
Measure In
Customer involvement Cua et al. (2001), Olsen (2004), Shah and Ward (2007)
Customer focus Black and Porter (1996), Dow et al. (1999), Flynn et al. (1995b), Ahmad et al. (2003)
JIT links with customers Ahmad et al. (2003) Customer feedback Olsen (2004)
4.4.2. Agility Measurement Compared with lean measures and practices, much less literature is available regarding agility
in production or in logistics. Ilyas et al. (2008) argued that agile systems are built around
flexibility. Consequently, measuring logistics system agility levels might utilize measures
used in different fields that concentrate on flexibility and adaptability, such as a flexible
manufacturing system, reconfigurable manufacturing system, supply chain flexibility, supply
chain agility, and so on (see section 2.2.2 for more details).
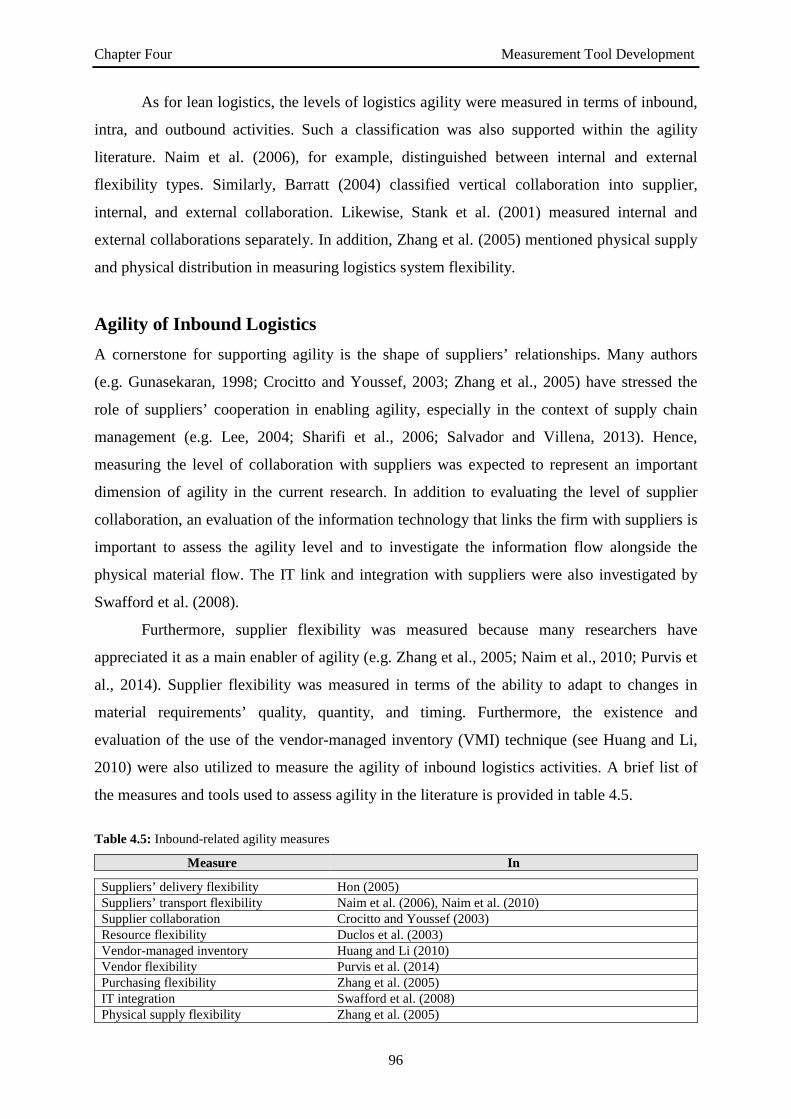
Chapter Four Measurement Tool Development
96
As for lean logistics, the levels of logistics agility were measured in terms of inbound,
intra, and outbound activities. Such a classification was also supported within the agility
literature. Naim et al. (2006), for example, distinguished between internal and external
flexibility types. Similarly, Barratt (2004) classified vertical collaboration into supplier,
internal, and external collaboration. Likewise, Stank et al. (2001) measured internal and
external collaborations separately. In addition, Zhang et al. (2005) mentioned physical supply
and physical distribution in measuring logistics system flexibility.
Agility of Inbound Logistics A cornerstone for supporting agility is the shape of suppliers’ relationships. Many authors
(e.g. Gunasekaran, 1998; Crocitto and Youssef, 2003; Zhang et al., 2005) have stressed the
role of suppliers’ cooperation in enabling agility, especially in the context of supply chain
management (e.g. Lee, 2004; Sharifi et al., 2006; Salvador and Villena, 2013). Hence,
measuring the level of collaboration with suppliers was expected to represent an important
dimension of agility in the current research. In addition to evaluating the level of supplier
collaboration, an evaluation of the information technology that links the firm with suppliers is
important to assess the agility level and to investigate the information flow alongside the
physical material flow. The IT link and integration with suppliers were also investigated by
Swafford et al. (2008).
Furthermore, supplier flexibility was measured because many researchers have
appreciated it as a main enabler of agility (e.g. Zhang et al., 2005; Naim et al., 2010; Purvis et
al., 2014). Supplier flexibility was measured in terms of the ability to adapt to changes in
material requirements’ quality, quantity, and timing. Furthermore, the existence and
evaluation of the use of the vendor-managed inventory (VMI) technique (see Huang and Li,
2010) were also utilized to measure the agility of inbound logistics activities. A brief list of
the measures and tools used to assess agility in the literature is provided in table 4.5.
Table 4.5: Inbound-related agility measures
Measure In
Suppliers’ delivery flexibility Hon (2005) Suppliers’ transport flexibility Naim et al. (2006), Naim et al. (2010) Supplier collaboration Crocitto and Youssef (2003) Resource flexibility Duclos et al. (2003) Vendor-managed inventory Huang and Li (2010) Vendor flexibility Purvis et al. (2014) Purchasing flexibility Zhang et al. (2005) IT integration Swafford et al. (2008) Physical supply flexibility Zhang et al. (2005)

Chapter Four Measurement Tool Development
97
Agility of Intra Logistics The intra logistics agility measures were derived from the manufacturing agility and
flexibility measures, including the flexibility provided by production machines, the
production process, material handling, and the production equipment. Some of these
dimensions can be related more to production than to logistics, but the great interaction,
overlapping, and interdependencies between the two fields made the use of such measures
essential for evaluating logistics agility. These and other similar measures have been used
extensively to evaluate the production system, logistics, or supply chain flexibility (e.g.
Paixão and Marlow, 2003; Hon, 2005; Naim et al., 2006; Inman et al., 2011).
Many design-related techniques can be used to enable agility, including concurrent
engineering, modular design, design for postponement, and rapid prototyping. The use of a
modular design was used to measure the agility of the system due to its importance in
enhancing the ability to cope with changes in demand (Salvador and Villena, 2013). All
design-related activities affect the subsequent production and logistics activities. Additionally,
the use of a reconfigurable manufacturing system (see Koren et al., 1999; Matta et al., 2008;
Niroomand et al., 2012) and the ability of the internal logistics system to cope with changes in
the production mix were considered to measure the internal levels of agility. Table 4.6
illustrates some tools and measures of internal-related activities’ levels of agility.
Table 4.6: Internal-related agility measures
Measure In
Machine flexibility Hon (2005), Naim et al. (2006)
Process/operation flexibility Vokurka and Fliedner (1998), Hon (2005), Naim et al. (2006), Inman et al. (2011)
Quick changeovers Ilyas et al. (2008) Capacity flexibility Naim et al. (2006) Routing flexibility Paixão and Marlow (2003), Naim et al. (2006) Manufacturing lead time reduction Vokurka and Fliedner (1998), Merschmann and Thonemann (2011) Cross-functional teams Huang and Li (2010) Development cycle reduction Merschmann and Thonemann (2011) Rapid prototyping Gunasekaran (1998) Rapid reconfiguration Naylor et al. (1999) Concurrent engineering Gunasekaran (1998) Material handling flexibility Paixão and Marlow (2003) Virtual enterprise Gunasekaran (1998) Multi-product production systems Carvalho and Azevedo (2014) Design for postponement Lee (2004)
Low production cost Vokurka and Fliedner (1998), Crocitto and Youssef (2003), Ren et al. (2003)
Product quality Vokurka and Fliedner (1998), Crocitto and Youssef (2003), Ren et al. (2003), Ramesh and Devadasan (2007), Inman et al. (2011)
Contingency planning Lee (2004) Volume flexibility Vokurka and Fliedner (1998), Helo (2004) Design quality/improvement Vokurka and Fliedner (1998), Ramesh and Devadasan (2007)

Chapter Four Measurement Tool Development
98
Agility of Outbound Logistics The agility of the outbound logistics is of great importance, since a focal point of agility is the
ability to keep pace with the changing customer requirements (Gunasekaran, 1998; Yusuf et
al., 1999; Carlson and Yao, 2008). Therefore, the ability of the logistics system to respond
quickly to changes in customers’ orders in terms of size, type, or delivery was used to
measure the physical distribution system’s agility. This was supported by the work of Zhang
et al. (2005), who considered the physical distribution and demand management flexibility
and focused on the ability to adjust inventory, packaging, warehousing, and transportation in
addition to the ability to cope with changes in customer needs for service level, delivery time,
or even price. While many firms can enhance their responsiveness but with higher
accompanying costs, agile firms respond quickly and efficiently (Pfohl and Buse, 2000; Lee,
2004); this makes it necessary to take into consideration the related cost and efficiency levels
when measuring the previously mentioned dimension.
The ability to predict changes in the marketplace is a core competence for agile
organizations; some authors, such as Bardi et al. (2006) and Langley et al. (2008), have
argued that demand forecasting is also a logistics activity. Similar constructs were used by
Ramesh and Devadasan (2007), Scholten et al. (2010), and Inman et al. (2011) to measure
agility. The use of outsourcing can bring agility to the system (Christopher and Towill, 2000;
Ramesh and Devadasan, 2007), and the use of third-party logistics (3PL) as a popular source
of outsourcing can be helpful in measuring the outbound logistics’ ability to match changes in
demand. For a view of other measures of agility for customer-related activities see table 4.7.
Table 4.7: Outbound-related agility measures
Measure In
Physical distribution flexibility Zhang et al. (2005) Responsiveness to customers' needs Ilyas et al. (2008), Stank et al. (2001)
Delivery time flexibility/reliability Vokurka and Fliedner (1998), Hon (2005), Merschmann and Thonemann (2011), Inman et al. (2011)
Transport flexibility Naim et al. (2006), Naim et al. (2010)
Customer service levels Vokurka and Fliedner (1998), Mason-Jones et al. (2000a), Merschmann and Thonemann (2011)
Market sensitivity van Hoek et al. (2001), Scholten et al. (2010), Inman et al. (2011) Order size flexibility Stank et al. (2001) Product mix flexibility Vokurka and Fliedner (1998), Helo (2004) Customer response adoption Ramesh and Devadasan (2007)
Other general measures, tools, and techniques used in the literature to assess or enable
agility are listed in table 4.8. Those methods can be used for internal as well as external
logistics activities.
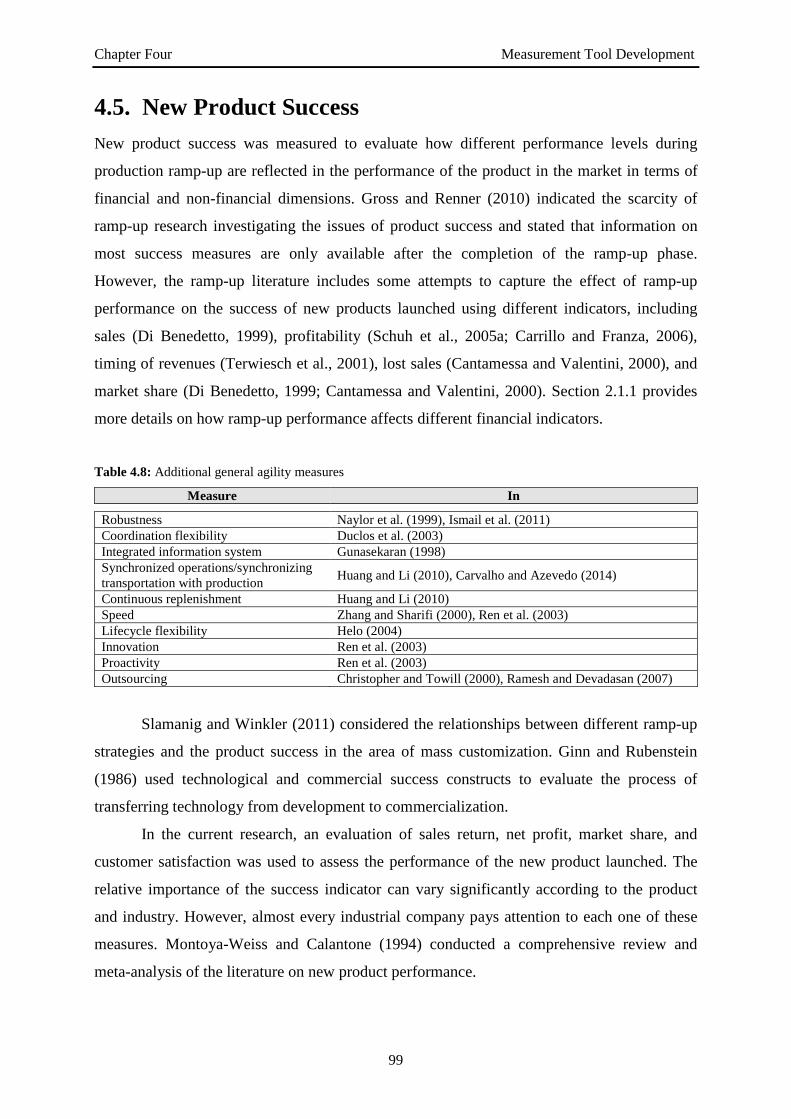
Chapter Four Measurement Tool Development
99
4.5. New Product Success New product success was measured to evaluate how different performance levels during
production ramp-up are reflected in the performance of the product in the market in terms of
financial and non-financial dimensions. Gross and Renner (2010) indicated the scarcity of
ramp-up research investigating the issues of product success and stated that information on
most success measures are only available after the completion of the ramp-up phase.
However, the ramp-up literature includes some attempts to capture the effect of ramp-up
performance on the success of new products launched using different indicators, including
sales (Di Benedetto, 1999), profitability (Schuh et al., 2005a; Carrillo and Franza, 2006),
timing of revenues (Terwiesch et al., 2001), lost sales (Cantamessa and Valentini, 2000), and
market share (Di Benedetto, 1999; Cantamessa and Valentini, 2000). Section 2.1.1 provides
more details on how ramp-up performance affects different financial indicators.
Table 4.8: Additional general agility measures
Measure In
Robustness Naylor et al. (1999), Ismail et al. (2011) Coordination flexibility Duclos et al. (2003) Integrated information system Gunasekaran (1998) Synchronized operations/synchronizing transportation with production Huang and Li (2010), Carvalho and Azevedo (2014)
Continuous replenishment Huang and Li (2010) Speed Zhang and Sharifi (2000), Ren et al. (2003) Lifecycle flexibility Helo (2004) Innovation Ren et al. (2003) Proactivity Ren et al. (2003) Outsourcing Christopher and Towill (2000), Ramesh and Devadasan (2007)
Slamanig and Winkler (2011) considered the relationships between different ramp-up
strategies and the product success in the area of mass customization. Ginn and Rubenstein
(1986) used technological and commercial success constructs to evaluate the process of
transferring technology from development to commercialization.
In the current research, an evaluation of sales return, net profit, market share, and
customer satisfaction was used to assess the performance of the new product launched. The
relative importance of the success indicator can vary significantly according to the product
and industry. However, almost every industrial company pays attention to each one of these
measures. Montoya-Weiss and Calantone (1994) conducted a comprehensive review and
meta-analysis of the literature on new product performance.

Chapter Four Measurement Tool Development
100
4.6. The Moderating Variables The first section of the questionnaire requested general information about the respondent, the
organization, and the product. The respondent was asked about his/her position and field of
experience, work position, and job responsibilities, which revealed the extent to which the
respondents are engaged with the ramp-up process and possess information and knowledge
about it. Experience affects employees’ sources and types of information; this was also
proven by Fjällström et al. (2009), who discussed the role of information in ramp-up
performance enhancement.
With regard to organizational characteristics, only size and place of organization were
considered. Both size and place affect the organizational structure and work environment and,
thus, might have an impact on every aspect of the production or logistical processes. Many
comparative studies have shown significant differences between companies operating in
different countries in terms of performance, work tools, and other variables. For example,
Japanese firms showed an interest in new product manufacturing lead time reduction earlier
than US firms (Flaherty, 1992). Furthermore, Bohn and Terwiesch (1999) indicated that
differences in the infrastructure among countries might affect the ramp-up process. In
addition, organizational size has frequently been configured to be positively related to the
levels of innovating new products (Klepper, 1996) and consequently to more ramp-up
exposure; Audretsch (1991), however, deduced that technology and knowledge determine
small companies’ innovation levels. Company size was measured using the number of
employees. This number was represented through ranges rather than a mere figure to keep the
respondent comfortable regarding confidentiality issues. In addition, the number of ramp-ups
experienced within the last three years was considered. This dimension might reflect the
importance of the cumulative experience with the ramp-up process.
In terms of the product itself, the product type and lifecycle length were mentioned
due to the very frequent indications in the literature on the relation between these factors and
production ramp-up recurrence and, hence, performance. The product type and lifecycle are
related to each other, since similar products share an approximate lifecycle length.
Nonetheless, the study of these variables as moderating variables is limited in the literature.
Different levels of product/process newness were also measured to distinguish between ramp-
up processes that involve new products, modified products, new processes, modified
processes, or a combination of these options.
Figure 4.3 illustrates the research model, in which production ramp-up performance is
the dependent variable for lean and agile logistics and the independent variable for new
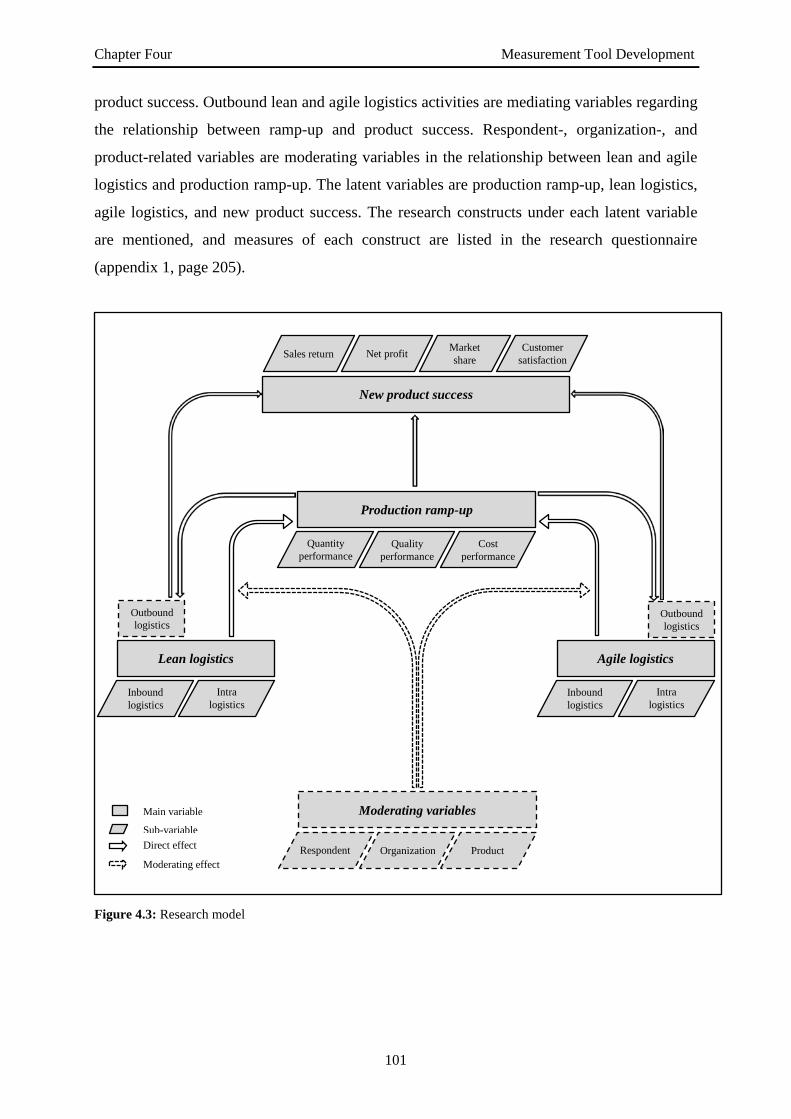
Chapter Four Measurement Tool Development
101
product success. Outbound lean and agile logistics activities are mediating variables regarding
the relationship between ramp-up and product success. Respondent-, organization-, and
product-related variables are moderating variables in the relationship between lean and agile
logistics and production ramp-up. The latent variables are production ramp-up, lean logistics,
agile logistics, and new product success. The research constructs under each latent variable
are mentioned, and measures of each construct are listed in the research questionnaire
(appendix 1, page 205).
Figure 4.3: Research model
Sales return Net profit Market share
Customer satisfaction
New product success
Quantity performance
Quality performance
Cost performance
Production ramp-up
Inbound logistics
Intra logistics
Agile logistics
Inbound logistics
Intra logistics
Lean logistics
Respondent Organization Product
Moderating variables
Main variable Sub-variable Direct effect Moderating effect
Outbound logistics
Outbound logistics

Chapter Five Statistical Analysis
102
CHAPTER 5
STATISTICAL ANALYSIS
5.1. Introduction This chapter presents the results of the statistical analysis carried out and includes the
following: the distribution of the research sample and a description of the sample
characteristics in terms of the respondent-, organization-, and product-related variables; the
determination of the statistical relationships between the research variables; the testing of the
research hypotheses regarding the direct relationships between the dependent and the
independent variables, in addition to the indirect effect of the moderating variables; and
finally a graphically summary of the analysis results, as a prelude to presenting a model that
employs lean and agile logistics during the production ramp-up phase and afterwards during
steady-state and ramp-down production. The rationale behind the statistical methods used in
the analysis was detailed in section 3.5. The statistical analyses were conducted mainly using
the SmartPLS (V. 3.2.0) and IBM SPSS (V. 21) programs.
5.2. Descriptive Statistics and Preliminary Analysis Out of 63 questionnaires collected, 56 questionnaires were used for statistical analysis. Due to
missing influential data, clearly biased completing patterns, or irrelevance to the researched

Chapter Five Statistical Analysis
103
population, 7 questionnaires were excluded. Section 3.5 highlighted the status and treatment
of the missing values. Compared with the complexity of the research model (see figure 4.3,
page 101), the sample size is considered to be small but statistically sufficient to explore the
investigated trends, especially utilizing the PLS-SEM tools.
5.2.1. Production Ramp-Up Table 5.1 describes the respondents’ evaluation of production ramp-up performance. The
descriptive results show a moderate evaluation for ramp-up performance. Quality
performance accounted for the highest performance level, followed by quantity performance,
while cost performance during ramp-up showed the worst indicator.
Table 5.1: Production ramp-up performance descriptive statistics
No significant differences were found between the initial, the middle, and the final
ramp-up phase in terms of matching actual productivity to planned productivity. The inter-
Performance dimension Measures and constructs Mean SD Diagrams (mean)
Quantity performance
1- Actual to planned
Initial phase 5.14
5.12
2.71
1.99
Middle phase 4.95 2.13 Final phase 5.29 1.95
2- Cycle time reduction 5.61 2.229 3- Learning 5.48 2.351 4- Unplanned stops 5.57 2.743
Construct 5.446 1.752
1- Volume-related goals 5.79 1.846
2- Time-related goals 5.91 1.975
Composite evaluation 5.845 1.823
Quality performance
1- Defective products 5.59 2.255
2- Returned products 5.79 2.506 3- Quality deviation 5.48 2.320
Construct 5.619 2.001
Quality-related goals 5.71 1.833
Cost performance
1- Per unit cost 4.5 2.501
2- Preparation costs 4.79 2.627 3- Repair costs 5.39 2.349
Construct 4.893 2.193
Cost-related goals 5.25 1.975
Production ramp-up performance construct 5.332 1.400
Overall ramp-up evaluation 5.667 1.377
4 4,5 5 5,5 6
4321
4 4,5 5 5,5 6
21
4 4,5 5 5,5 6
321
4 4,5 5 5,5 6
321
4 4,5 5 5,5 6
21
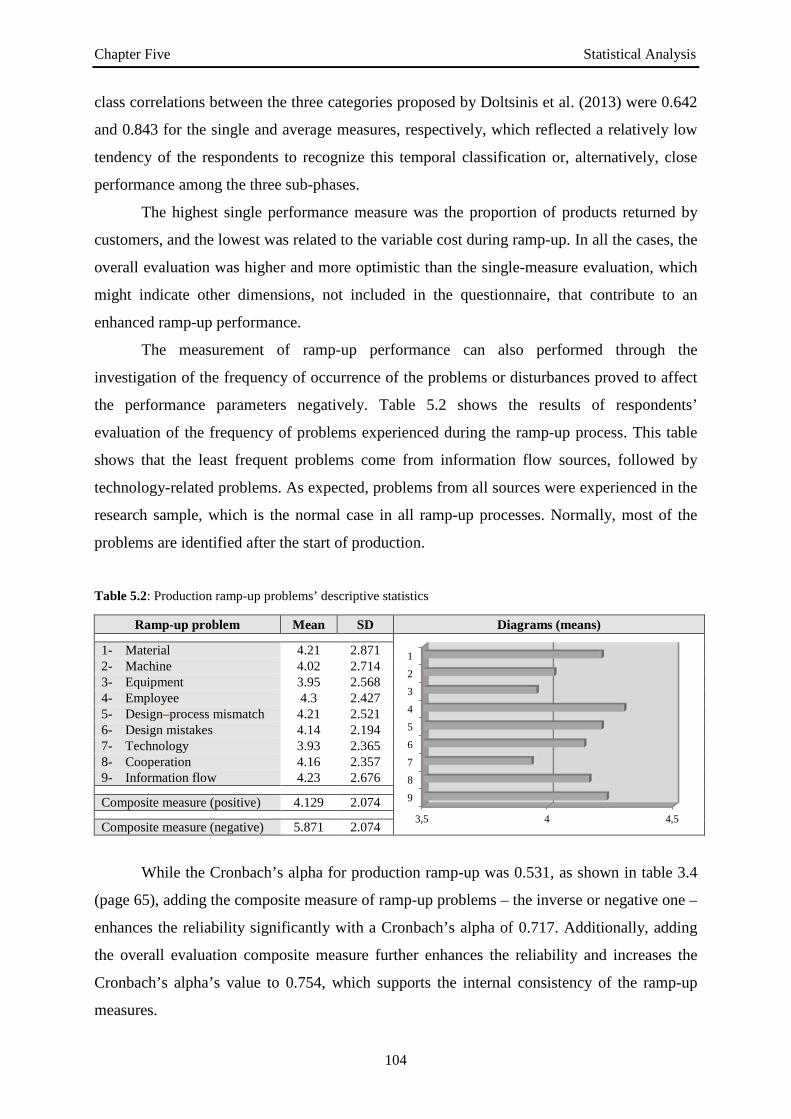
Chapter Five Statistical Analysis
104
class correlations between the three categories proposed by Doltsinis et al. (2013) were 0.642
and 0.843 for the single and average measures, respectively, which reflected a relatively low
tendency of the respondents to recognize this temporal classification or, alternatively, close
performance among the three sub-phases.
The highest single performance measure was the proportion of products returned by
customers, and the lowest was related to the variable cost during ramp-up. In all the cases, the
overall evaluation was higher and more optimistic than the single-measure evaluation, which
might indicate other dimensions, not included in the questionnaire, that contribute to an
enhanced ramp-up performance.
The measurement of ramp-up performance can also performed through the
investigation of the frequency of occurrence of the problems or disturbances proved to affect
the performance parameters negatively. Table 5.2 shows the results of respondents’
evaluation of the frequency of problems experienced during the ramp-up process. This table
shows that the least frequent problems come from information flow sources, followed by
technology-related problems. As expected, problems from all sources were experienced in the
research sample, which is the normal case in all ramp-up processes. Normally, most of the
problems are identified after the start of production.
Table 5.2: Production ramp-up problems’ descriptive statistics
While the Cronbach’s alpha for production ramp-up was 0.531, as shown in table 3.4
(page 65), adding the composite measure of ramp-up problems – the inverse or negative one –
enhances the reliability significantly with a Cronbach’s alpha of 0.717. Additionally, adding
the overall evaluation composite measure further enhances the reliability and increases the
Cronbach’s alpha’s value to 0.754, which supports the internal consistency of the ramp-up
measures.
Ramp-up problem Mean SD Diagrams (means)
1- Material 4.21 2.871 2- Machine 4.02 2.714 3- Equipment 3.95 2.568 4- Employee 4.3 2.427 5- Design–process mismatch 4.21 2.521 6- Design mistakes 4.14 2.194 7- Technology 3.93 2.365 8- Cooperation 4.16 2.357 9- Information flow 4.23 2.676
Composite measure (positive) 4.129 2.074
Composite measure (negative) 5.871 2.074 3,5 4 4,5
9
8
7
6
5
4
3
2
1

Chapter Five Statistical Analysis
105
5.2.2. Logistics The collected data support the division of logistics activities into inbound, intra, and outbound
logistics. The outbound logistics seems to be less lean than the inbound logistics. It can be
noted that the general leanness and agility measures have higher means than the lean and agile
techniques. The fluctuation, reflected in the relatively high SD values, could be due to the use
of certain techniques but not others.
Lean Logistics Table 5.3 illustrates the results of the evaluation of lean logistics practices. Inbound logistics
had the highest mean values and the lowest SD at the same time. Intra and outbound logistics
were rated a little below the average. The lowest evaluation was for the customer involvement
levels. The respondent as the single source of information might have little interaction with
the customer, contributing to the lower evaluation of this dimension. On the other hand, the
research sample seemed to perform well in aligning the material supply with the actual needs
of the production process. Again, the overall evaluation of the logistics’ leanness was higher
than the evaluation of the measures.
Table 5.3: Lean logistics descriptive statistics
Category Measures and constructs Mean SD Diagrams (means)
Inbound
1- Material inventory levels 5.20 2.305
2- Supply matches process needs 5.80 2.127 3- Material transportation cost 5.11 2.349 4- MRP (negative) 5.05 2.700 5- Supplier milk run 5.11 2.807
Construct 5.251 1.448
Intra
1- WIP inventory levels 5.52 2.224
2- Standardization 5.13 2.516 3- JIT 4.84 3.014 4- Kanban 4.77 2.966 5- Cross-docking 4.82 3.001
Composite measure 4.964 2.037
Outbound
1- F. goods inventory levels 5.13 2.313
2- F. goods transportation costs 5.54 2.366 3- Customer involvement 4.30 2.256
Composite measure 4.988 1.940
Overall leanness measure 5.071 1.556
Overall leanness evaluation 5.390 1.951
4 4,5 5 5,5 6
54321
4 4,5 5 5,5 6
54321
4 4,5 5 5,5 6
321
4 4,5 5 5,5 6
21

Chapter Five Statistical Analysis
106
Agile Logistics
The results for the agile logistics evaluation are reported in table 5.4, which shows relatively
lower performance on the inbound side of logistics but higher performance on the intra and
outbound sides. While notable problems with suppliers’ flexibility were identified, a high
level of ability to predict market changes appeared. As for ramp-up performance and lean
logistics, a higher overall evaluation was also the case for agile logistics.
Table 5.4: Agile logistics descriptive statistics
5.2.3. Respondent-, Organization-, and Product-Related
Variables Table 5.5 shows the distribution of the sample’s units according to different respondent-,
organization-, and product-related characteristics. Two more pieces of information were
collected through the research questionnaire about the respondent’s job position and the
product type. These two dimensions produced a wide variety of responses, making it difficult
to contribute significantly to the data analysis process due to the relatively small sample size
of the research.
Category Measures and constructs Mean SD Diagrams (means)
Inbound
1- Supplier cooperation 5.70 2.190
2- IT link with supplier 5.27 2.876 3- Supplier flexibility 4.45 2.635 4- Vendor-managed inventory 4.95 2.921
Composite measure 5.064 2.108
Intra
1- Flexibility of Machine 5.0
5.07
3 2.6 2.
496
System 5.2 2.7 M. handling 5.3 2.8 Equipment 5.0 2.4
2- Adaptability to change 5.46 2.397 3- Modular product design 5.07 2.922 4- Reconfigurable manufacturing 4.70 3.092
Composite measure 5.077 2.266
Outbound
1- Adaptability to orders’ change 5.20 2.475
2- Predictability of market change 5.62 2.415 3- 3PL 4.54 3.051
Composite measure 5.142 2.030
Overall agility measure 5.127 2.052
Overall agility evaluation 5.600 2.528
4 4,5 5 5,5 6
4321
4 4,5 5 5,5 6
4321
4 4,5 5 5,5 6
321
4 4,5 5 5,5 6
21

Chapter Five Statistical Analysis
107
As shown in table 5.5, more responses came from large companies, and the largest
experience range was five to eight years. Regarding the newness levels, one point was
assigned to a slightly modified product or a slightly modified process, two points to a
significantly modified product or process, and three points to a completely new product or
production process. The points for product newness and system or process newness were
summed to calculate the overall newness level.
Table 5.5: Respondent-, organization-, and product-related characteristics’ descriptive statistics
Cat
egor
y
Measures and constructs
Freq
uenc
ies
Perc
enta
ge
Val
id
perc
enta
ge
Pie charts (valid percentage)
Res
pond
ent
Expe
rienc
e
A- Less than 2 years 13 23.2 23.6
B- 2 to less than 5 years 13 23.2 23.6 C- 5 to less than 8 years 17 30.4 30.9 D- 8 to less than 11 years 8 14.3 14.5 E- More than 11 years 4 7.1 7.3 Missing 1 1.8 0 Total 56 100 100
Firm
Num
ber o
f w
orke
rs
A- Less than 50 4 7.1 7.3
B- 50 to less than 250 8 14.3 14.5 C- 250 to less than 500 14 25.0 25.5 D- 500 to less than 1000 13 23.2 23.6 E- More than 1000 16 28.6 29.1 Missing 1 1.8 0 Total 56 100 100
Cou
ntry
A- China 9 16.1 16.1
B- Germany 9 16.1 16.1 C- India 5 8.9 8.9 D- Jordan 13 23.2 23.2 E- Turkey 3 5.4 5.4 F- U.A.E 7 12.5 12.5 G- U.S.A 10 17.9 17.9 Missing 0 0 0 Total 56 100 100
Num
ber o
f ra
mp-
ups
A- 3 or less 15 26.8 27.3
B- 4 to 6 15 26.8 27.3 C- 7 to 15 12 21.4 21.8 D- 16 to 30 2 3.6 3.6 E- More than 30 11 19.6 20.0 Missing 1 1.8 0 Total 56 100 100
Prod
uct N
ewne
ss
A- 6 new product + process 4 7.1 7.1
B- 5 6 10.7 10.7 C- 4 19 33.9 33.9 D- 3 14 25.0 25.0 E- 2 9 16.1 16.1 F- 1 lowest modification 4 7.1 7.1 Missing 0 0 0 Total 56 100 100
Expe
cted
lif
ecyc
le
A- Less than 6 months 5 8.9 9.1
B- 6 to less than 12 months 9 16.1 16.4 C- 1 to less than 3 years 14 25.0 25.5 D- 3 to less than 6 years 13 23.6 23.6 E- 6 years or more 14 25.0 25.5 Missing 1 1.8 0 Total 56 100 100
A
B C
D E
A B
C D
E
A B
C D E
F G
A
B C
D E
A
B
C D
E F
A B
C D
E

Chapter Five Statistical Analysis
108
New Product Success An evaluation of new product success is illustrated in table 5.6. The mean for overall success
evaluation shows that the targeted sample experienced acceptable levels of product after-
launch performance. A very high level of customer satisfaction can be identified. Products
that performed highly in one success dimension were most probably high performers in other
dimensions. Both sales return and net profit were measured to identify the consistency of the
responses, rather than to capture both figures. A normal situation of close performance in the
two dimensions appeared.
Table 5.6: New product success descriptive statistics
5.3. Variables’ Correlations Analysing the correlations enhances the understanding of the direction and the significance of
the relationships between research variables, constructs, and measures. The Pearson
correlation coefficient (𝑟, 𝑟𝑥𝑥) was used to evaluate these relationships. The 𝑟 calculation is
dependent on the values of the covariance between variable x and variable y and the standard
deviation using the following equation:
𝑟 = 𝑟𝑥𝑥 =∑ (𝑥𝑖𝑛𝑖=1 − �̅�)(𝑦𝑖 − 𝑦�)
�∑ (𝑥𝑖𝑛𝑖=1 − �̅�)2 �∑ (𝑦𝑖 − 𝑦�)2𝑛
𝑖=1
The problems occurring during production ramp-up construct an important point of
consideration. The concurrence of these problems, their relationships with ramp-up
performance, their relationships with logistics activities, and their relationships with product
success were investigated. In addition, the correlations between leanness and agility that
might represent the use of a combination of lean and agile tools in logistics were analysed.
Furthermore, the relationships between respondent-, organization-, and product-related
variables on the one hand and selected constructs on the other were illustrated.
Dimension Mean SD Diagrams (means)
1- Sales return 5.98 1.931
2- Net profit 6.09 1.900 3- Market share 5.84 1.817 4- Customer satisfaction 6.43 2.223
Construct 6.085 1.764 5 5,5 6 6,5
4321

Chapter Five Statistical Analysis
109
5.3.1. Ramp-Up Problems A very high probability of the occurrence of different ramp-up problems can be derived from
table 5.7. In most cases, a high frequency of problems from all sources (or the opposite) was
experienced. Only problems related to the mistaken product design were not significantly
linked to the material-related problems, which had a relatively small relationship with the
occurrence of the problems related to cooperation and coordination between production and
other organizational departments. The highest correlation was between machine and
equipment sources of problems, followed by employees and the mismatch between the
product design and the production process.
Table 5.7: Correlations between different ramp-up problems’ sources
Mat
eria
ls
Mac
hine
Equi
pmen
t
Empl
oyee
s
Des
ign–
proc
ess
mis
mat
ch
Des
ign
mis
take
s
Tech
nolo
gy
Coo
pera
tion
Info
rmat
ion
flow
Materials P. Correlation 1 Sig. (2-tailed)
N 56
Machine P. Correlation 0.674** 1 Sig. (2-tailed) 0.000 N 56 56
Equipment P. Correlation 0.677** 0.916** 1 Sig. (2-tailed) 0.000 0.000 N 56 56 56
Employees P. Correlation 0.614** 0.872** 0.866** 1 Sig. (2-tailed) 0.000 0.000 0.000 N 56 56 56 56
Design–process mismatch
P. Correlation 0.637** 0.829** 0.842** 0.911** 1 Sig. (2-tailed) 0.000 0.000 0.000 0.000 N 56 56 56 56 56
Design mistakes P. Correlation 0.249 0.537** 0.511** 0.593** 0.652** 1 Sig. (2-tailed) 0.064 0.000 0.000 0.000 0.000 N 56 56 56 56 56 56
Technology P. Correlation 0.554** 0.742** 0.730** 0.742** 0.850** 0.636** 1 Sig. (2-tailed) 0.000 0.000 0.000 0.000 0.000 0.000 N 56 56 56 56 56 56 56
Cooperation P. Correlation 0.328* 0.483** 0.371** 0.401** 0.490** 0.713** 0.517** 1 Sig. (2-tailed) 0.014 0.000 0.005 0.002 0.000 0.000 0.000 N 56 56 56 56 56 56 56 56
Information flow
P. Correlation 0.514** 0.760** 0.700** 0.688** 0.688** 0.384** 0.623** 0.470** 1 Sig. (2-tailed) 0.000 0.000 0.000 0.000 0.000 0.003 0.000 0.000 N 56 56 56 56 56 56 56 56 56
** Correlation is significant at the 0.01 level (2-tailed) * Correlation is significant at the 0.05 level (2-tailed) Exclude missing (pairwise)
Another point of interest is the relationships between different ramp-up problems on
the one hand and performance indicators and overall performance evaluation on the other.
The corresponding correlation values are listed in table 5.8. In general, the performance
indicators seemed to have higher correlation values with ramp-up problems than the general
evaluation of different ramp-up goal attainment. All the correlations were negative in value,

Chapter Five Statistical Analysis
110
as expected. Quality performance was the most closely related to the ramp-up problems,
especially in the cases of employees’ mistakes and a poor information flow.
Regarding the performance indicators, only one correlation value was statistically
insignificant – between quantity performance and material-related problems. Material-related
problems were insignificantly related to the volume and time goal achievement evaluation.
Unlike the cost performance indicator, the financial and cost-related goal achievement
evaluation was barely significantly related to a few ramp-up problems.
Table 5.8: Correlations between ramp-up problems and ramp-up performance and evaluation
Performance
Evaluation Quantity Quality Cost Quantity Time Quality Cost
Materials P. Correlation - 0.180 - 0.457** - 0.536** - 0.149 - 0.074 - 0.368** - 0.273* Sig. (2-tailed) 0.185 0.000 0.000 0.273 0.591 0.006 0.042 N 56 56 56 56 55 55 56
Machine P. Correlation - 0.437** - 0.530** - 0.354** - 0.424** - 0.377** - 0.387** - 0.160 Sig. (2-tailed) 0.001 0.000 0.007 0.001 0.005 0.003 0.238 N 56 56 56 56 55 55 56
Equipment P. Correlation - 0.352** - 0.471** - 0.309* - 0.317* - 0.320* - 0.303* - 0.047 Sig. (2-tailed) 0.008 0.000 0.021 0.017 0.017 0.024 0.728 N 56 56 56 56 55 55 56
Employees P. Correlation - 0.350** - 0.651** - 0.408** - 0.318* - 0.333* - 0.417** - 0.194 Sig. (2-tailed) 0.008 0.000 0.002 0.017 0.013 0.002 0.151 N 56 56 56 56 55 55 56
Design–process mismatch
P. Correlation - 0.279* - 0.612** - 0.434** - 0.334* - 0.343* - 0.461** - 0.267* Sig. (2-tailed) 0.038 0.000 0.001 0.012 0.010 0.000 0.047 N 56 56 56 56 55 55 56
Design mistakes P. Correlation - 0.418** - 0.342** - 0.297 - 0.360** - 0.307* - 0.281* - 0.109 Sig. (2-tailed) 0.001 0.010 0.026 0.006 0.023 0.037 0.424 N 56 56 56 56 55 55 56
Technology P. Correlation - 0.214 - 0.523** - 0.381** - 0.328* - 0.360** - 0.451** - 0.234 Sig. (2-tailed) 0.112 0.000 0.004 0.013 0.007 0.001 0.083 N 56 56 56 56 55 55 56
Cooperation P. Correlation - 0.367** - 0.354** - 0.300* - 0.493** - 0.417** - 0.290* - 0.267* Sig. (2-tailed) 0.005 0.007 0.025 0.000 0.002 0.032 0.047 N 56 56 56 56 55 55 56
Information flow
P. Correlation - 0.378** - 0.643** - 0.376** - 0.417** - 0.394** - 0.406** - 0.297* Sig. (2-tailed) 0.004 0.000 0.004 0.001 0.003 0.002 0.026 N 56 56 56 56 55 55 56
** Correlation is significant at the 0.01 level (2-tailed) * Correlation is significant at the 0.05 level (2-tailed) Exclude missing (pairwise)
The analysis of the correlation between ramp-up problems and lean/agile logistics is
related to the core purpose of the current research. Poor lean performance is expected to result
in more frequent problems during the ramp-up period (as compared with poor agile logistics),
since the overall problems construct had correlation coefficients of 0.521 and 0.455 with lean
logistics and agile logistics, respectively. While most values were statistically significant,
mistaken product design showed no relationship with leanness or agility levels. Such values
were expected, since logistics have nothing to do with the product design.
Surprisingly, an insignificant relationship was configured between agile logistics and
material-related problems. Furthermore, the relationships between the problems and the
outbound side of both lean and agile logistics require further investigation concerning the

Chapter Five Statistical Analysis
111
direction of the relationships. Since outbound logistics takes place after the end of the
production process, the logical relationship direction is from the ramp-up problems to the
outbound logistics. Table 5.9 shows these correlation coefficients’ values.
Table 5.9: Correlations between ramp-up problems and logistics leanness and agility
Lean Logistics
Agile Logistics Inbound Intra Outbound Inbound Intra Outbound
Materials P. Correlation - 0.529** - 0.451** - 0.358** - 0.113 - 0.145 - 0.080 Sig. (2-tailed) 0.000 0.001 0.007 0.410 0.290 0.563 N 55 55 56 55 55 54
Machine P. Correlation - 0.413** - 0.412** - 0.270* - 0.501** - 0.481** - 0.444** Sig. (2-tailed) 0.002 0.002 0.044 0.000 0.000 0.001 N 55 55 56 55 55 54
Equipment P. Correlation - 0.346** - 0.314* - 0.260 - 0.422** - 0.379** - 0.358** Sig. (2-tailed) 0.010 0.020 0.053 0.001 0.004 0.008 N 55 55 56 55 55 54
Employees P. Correlation - 0.439** - 0.385** - 0.367** - 0.409** - 0.373** - 0.332* Sig. (2-tailed) 0.001 0.004 0.005 0.002 0.005 0.014 N 55 55 56 55 55 54
Design–process mismatch
P. Correlation - 0.467** - 0.350** - 0.390** - 0.393** - 0.360** - 0.319* Sig. (2-tailed) 0.000 0.009 0.003 0.003 0.007 0.019 N 55 55 56 55 55 54
Design mistakes P. Correlation - 0.222 - 0.140 - 0.335* - 0.304* - 0.265 - 0.264 Sig. (2-tailed) 0.103 0.309 0.011 0.024 0.051 0.054 N 55 55 56 55 55 54
Technology P. Correlation - 0.367** - 0.278* - 0.435** - 0.367** - 0.380** - 0.312* Sig. (2-tailed) 0.006 0.040 0.001 0.006 0.004 0.022 N 55 55 56 55 55 54
Cooperation P. Correlation - 0.324** - 0.442** - 0.349** - 0.257 - 0.306* - 0.280* Sig. (2-tailed) 0.016 0.001 0.008 0.058 0.023 0.040 N 55 55 56 55 55 54
Information flow
P. Correlation - 0.342* - 0.460** - 0.240 - 0.480** - 0.398** - 0.448** Sig. (2-tailed) 0.011 0.000 0.075 0.000 0.003 0.001 N 55 55 56 55 55 54
** Correlation is significant at the 0.01 level (2-tailed) * Correlation is significant at the 0.05 level (2-tailed) Exclude missing (pairwise)
Another worthy step is to consider the effect of different problems occurring during
the ramp-up phase on the overall new product success. As shown in table 5.10, all the success
indicators are affected by problems occurring during production ramp-up and, hence, by
ramp-up performance. No unexpected positive values were detected. According to an analysis
conducted between success indicators and a composite measure of ramp-up problems, more
frequent ramp-up difficulties lead to a more negative effect on customer satisfaction and
market share than on sales and profits.
Problems related to materials’ unavailability or inappropriateness had no statistically
significant effect on either success indicator. Referring to tables 5-8 and 5-9, the same
construct seems to have a special – and inconsequential – trend with outbound logistics’
agility and with quantity performance, revealing a sort of measurement problem related to this
measure that requires further analysis and statistical treatment.
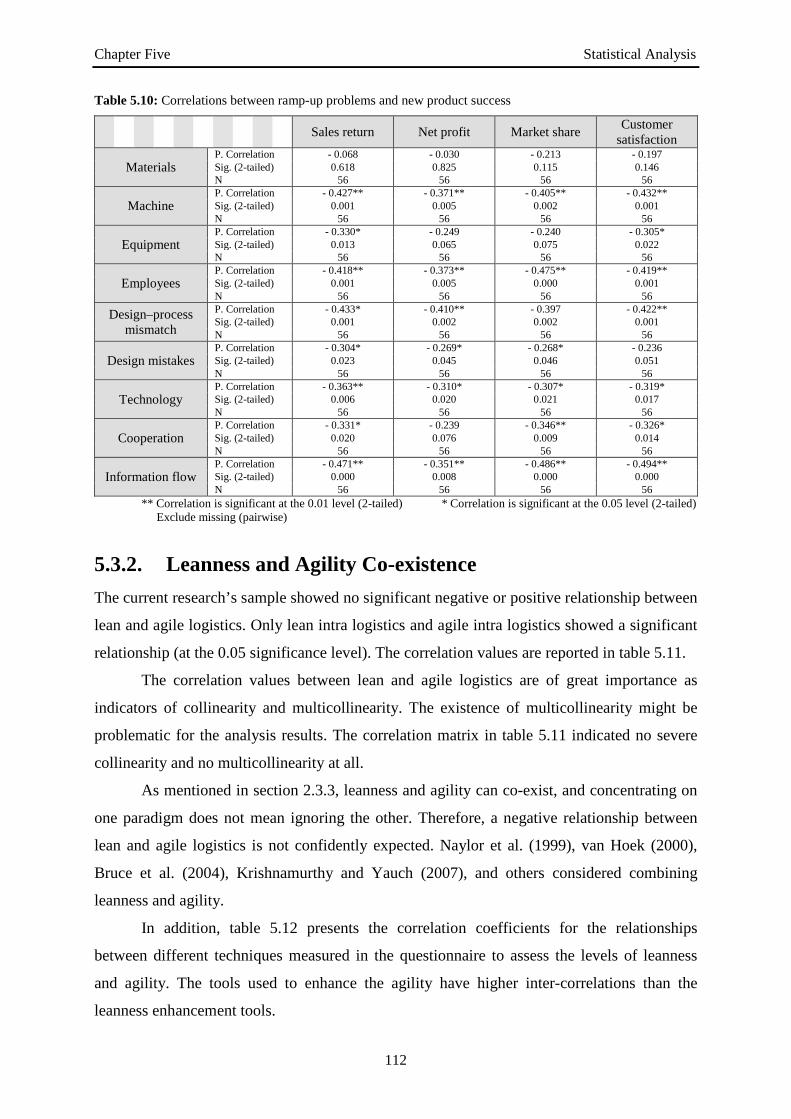
Chapter Five Statistical Analysis
112
Table 5.10: Correlations between ramp-up problems and new product success
Sales return Net profit Market share Customer satisfaction
Materials P. Correlation - 0.068 - 0.030 - 0.213 - 0.197 Sig. (2-tailed) 0.618 0.825 0.115 0.146 N 56 56 56 56
Machine P. Correlation - 0.427** - 0.371** - 0.405** - 0.432** Sig. (2-tailed) 0.001 0.005 0.002 0.001 N 56 56 56 56
Equipment P. Correlation - 0.330* - 0.249 - 0.240 - 0.305* Sig. (2-tailed) 0.013 0.065 0.075 0.022 N 56 56 56 56
Employees P. Correlation - 0.418** - 0.373** - 0.475** - 0.419** Sig. (2-tailed) 0.001 0.005 0.000 0.001 N 56 56 56 56
Design–process mismatch
P. Correlation - 0.433* - 0.410** - 0.397 - 0.422** Sig. (2-tailed) 0.001 0.002 0.002 0.001 N 56 56 56 56
Design mistakes P. Correlation - 0.304* - 0.269* - 0.268* - 0.236 Sig. (2-tailed) 0.023 0.045 0.046 0.051 N 56 56 56 56
Technology P. Correlation - 0.363** - 0.310* - 0.307* - 0.319* Sig. (2-tailed) 0.006 0.020 0.021 0.017 N 56 56 56 56
Cooperation P. Correlation - 0.331* - 0.239 - 0.346** - 0.326* Sig. (2-tailed) 0.020 0.076 0.009 0.014 N 56 56 56 56
Information flow P. Correlation - 0.471** - 0.351** - 0.486** - 0.494** Sig. (2-tailed) 0.000 0.008 0.000 0.000 N 56 56 56 56
** Correlation is significant at the 0.01 level (2-tailed) * Correlation is significant at the 0.05 level (2-tailed) Exclude missing (pairwise)
5.3.2. Leanness and Agility Co-existence The current research’s sample showed no significant negative or positive relationship between
lean and agile logistics. Only lean intra logistics and agile intra logistics showed a significant
relationship (at the 0.05 significance level). The correlation values are reported in table 5.11.
The correlation values between lean and agile logistics are of great importance as
indicators of collinearity and multicollinearity. The existence of multicollinearity might be
problematic for the analysis results. The correlation matrix in table 5.11 indicated no severe
collinearity and no multicollinearity at all.
As mentioned in section 2.3.3, leanness and agility can co-exist, and concentrating on
one paradigm does not mean ignoring the other. Therefore, a negative relationship between
lean and agile logistics is not confidently expected. Naylor et al. (1999), van Hoek (2000),
Bruce et al. (2004), Krishnamurthy and Yauch (2007), and others considered combining
leanness and agility.
In addition, table 5.12 presents the correlation coefficients for the relationships
between different techniques measured in the questionnaire to assess the levels of leanness
and agility. The tools used to enhance the agility have higher inter-correlations than the
leanness enhancement tools.

Chapter Five Statistical Analysis
113
Table 5.11: Correlations between lean and agile logistics constructs
Agility Leanness Inbound Intra Outbound Total Evaluation
(flexibility)
Inbound logistics P. Correlation 0.022 0.124 - 0.016 0.039 - 0.028 Sig. (2-tailed) 0.874 0.373 0.908 0.783 0.839 N 55 54 54 53 54
Intra logistics P. Correlation 0.131 0.285* 0.102 0.189 0.111 Sig. (2-tailed) 0.344 0.037 0.468 0.179 0.425 N 54 54 53 52 54
Outbound logistics P. Correlation - 0.060 0.098 - 0.081 - 0.018 0.006 Sig. (2-tailed) 0.662 0.477 0.562 0.900 0.965 N 55 55 54 53 55
Total P. Correlation 0.034 0.196 0.001 0.083 0.043 Sig. (2-tailed) 0.805 0.159 0.997 0.560 0.761 N 54 53 53 52 53
Evaluation (waste reduction)
P. Correlation 0.057 0.136 - 0.055 0.050 0.143 Sig. (2-tailed) 0.679 0.324 0.695 0.721 0.298 N 55 55 54 53 55
** Correlation is significant at the 0.01 level (2-tailed) * Correlation is significant at the 0.05 level (2-tailed) Exclude missing (pairwise)
As shown in table 5.12, a very strong relationship was found between the use of third-
party logistics (3PL) in distribution and the use of vendor-managed inventory (VMI)
techniques, which means that firms relying on outsourcing of their inbound logistics activities
attempt to outsource their outbound logistics as well.
Table 5.12: Correlations between different lean and agile techniques
MR
P (-
)
Supp
lier
milk
runs
JIT
Kan
ban
Cro
ss-
dock
ing
VM
I
Mod
ular
de
sign
RM
S
3PL
MRP (-) P. Correlation 1 Sig. (2-tailed)
N 56
Supplier milk runs
P. Correlation 0.258 1 Sig. (2-tailed) 0.055 N 56 56
JIT P. Correlation 0.057 0.320* 1 Sig. (2-tailed) 0.676 0.016 N 56 56 56
Kanban P. Correlation 0.112 0.610** 0.632** 1 Sig. (2-tailed) 0.411 0.000 0.000 N 56 56 56 56
Cross-docking
P. Correlation 0.153 0.600** 0.668** 0.819** 1 Sig. (2-tailed) 0.265 0.000 0.000 0.000 N 55 56 55 55 55
VMI P. Correlation 0.223 0.170 0.209 0.246 0.104 1 Sig. (2-tailed) 0.101 0.214 0.126 0.070 0.454 N 55 55 55 55 54 55
Modular design
P. Correlation 0.178 0.398** 0.204 0.354** 0.200 0.673** 1 Sig. (2-tailed) 0.189 0.002 0.132 0.007 0.142 0.000 N 56 56 56 56 55 55 56
RMS P. Correlation 0.333* 0.442** 0.307* 0.365** 0.335* 0.806** 0.795** 1 Sig. (2-tailed) 0.012 0.001 0.021 0.006 0.012 0.000 0.000 N 56 56 56 56 55 55 56 56
3PL P. Correlation 0.227 0.110 0.116 0.126 0.004 0.923** 0.658** 0.763** 1 Sig. (2-tailed) 0.093 0.420 0.393 0.353 0.980 0.000 0.000 0.000 N 56 56 56 56 55 55 56 56 56
** Correlation is significant at the 0.01 level (2-tailed) * Correlation is significant at the 0.05 level (2-tailed) Exclude missing (pairwise)

Chapter Five Statistical Analysis
114
Another high correlation was detected between the evaluation of the Kanban system
and the evaluation of the cross-docking activities. Significant correlations also existed
between some lean techniques and agility tools, such as the use of suppliers’ milk runs and
the use of the Kanban system.
5.3.3. Respondent-, Organization-, and Product-Related
Variables A full correlation matrix between respondent-, organization-, and product-related variables on
the one hand and all the constructs used in the research on the other hand was constructed.
The results indicated very limited significant values. Table 5.13 shows only the statistically
significant correlation values.
Table 5.13: Significant correlations between moderating variables and other main research variables
Organization-related Product-related Size Ramp-up frequency Lifecycle
Organizational size P. Correlation 1 0.578**
Sig. (2-tailed) 0.000 N 55 54
Ramp-up frequency P. Correlation 0.578** 1 Sig. (2-tailed) 0.000 N 54 55
Lean intra logistics P. Correlation 0.402** 0.420** Sig. (2-tailed) 0.003 0.002 N 54 54
Logistics leanness P. Correlation 0.322* 0.314* Sig. (2-tailed) 0.019 0.022 N 53 53
Logistical waste reduction evaluation
P. Correlation
0.325* Sig. (2-tailed) 0.16 N 55
Agile intra logistics P. Correlation 0.464**
Sig. (2-tailed) 0.000 N 54
Agile outbound logistics P. Correlation 0.373** Sig. (2-tailed) 0.006 N 53
Logistics agility P. Correlation 0.396** Sig. (2-tailed) 0.004 N 52
Flexibility evaluation P. Correlation 0.275* Sig. (2-tailed) 0.044 N 54
Ramp-up’s quality goal achievement
P. Correlation
0.401** Sig. (2-tailed) 0.003 N 54
Ramp-up’s problems P. Correlation 0.366** Sig. (2-tailed) 0.006 N 55
Overall ramp-up evaluation
P. Correlation 0.339* Sig. (2-tailed) 0.013 N 53
Market share P. Correlation 0.273*
Sig. (2-tailed) 0.044 N 55
** Correlation is significant at the 0.01 level (2-tailed) * Correlation is significant at the 0.05 level (2-tailed) Exclude missing (pairwise)

Chapter Five Statistical Analysis
115
Job position and product type were measured but led to a very wide range of
alternatives that could not produce any meaningful statistical figures due to the small size of
the sample. Therefore, these two dimensions were ignored.
As shown in the table, companies with more employees – as a measure of the
company size – had a higher innovation rate reflected by the number of new product ramp-
ups experienced. Lean intra logistics was significantly correlated with both size and ramp-up
frequency. The agility of the intra logistics activities was positively related to the company
size. The researched sample also showed that the product lifecycle was significantly related to
the overall evaluation of ramp-up quantity goal achievement, ramp-up problems (the inverse
scale of problems’ frequency), and the overall respondents’ evaluation of the ramp-up
performance.
5.4. Hypothesis Formulation and Testing Following the articulation of the constructs and their potential relationships, the propositions
describing the relationships between constructs must be translated into hypotheses (Forza,
2002). Based on the research model introduced in figure 4.3 on page 101 and on the literature
review presented in section 2.3, the research’s main and sub-hypotheses (in their null forms)
were formed to illustrate the nature and the direction of the relationships between the research
variables.
With regard to the research’s main focus concerning the relationship between
lean/agile logistics activities and production ramp-up performance, the hypotheses were
formed as directional hypotheses that suggest a positive relationship between the levels of
leanness/agility and the levels of production performance during the ramp-up phase. Forza
(2002) mentioned that non-directional hypotheses might be formed on the relationship
between variables that have never been explored previously or when conflicting results exist.
While lean and agile logistics have never been investigated during the ramp-up phase,
researchers have appreciated the role of logistics in general during this phase. Based on the
results of these studies, the direction of the relationship can be confidently proposed. Figure
5.1 and the following null hypotheses illustrate these relationships:
H0:1 More leanness in the logistics does not lead to better ramp-up performance.
H0:1.1 More leanness in the logistics activities does not enhance ramp-up quantity performance.
H0:1.2 More leanness in the logistics activities does not enhance ramp-up quality performance.
H0:1.3 More leanness in the logistics activities does not enhance ramp-up cost performance.

Chapter Five Statistical Analysis
116
H0:2 More agility in the logistics does not lead to better ramp-up performance.
H0:2.1 More agility in the logistics activities does not enhance ramp-up quantity performance.
H0:2.2 More agility in the logistics activities does not enhance ramp-up quality performance.
H0:2.3 More agility in the logistics activities does not enhance ramp-up cost performance.
Figure 5.1: Logistics/ramp-up hypothesized relationships
The direct relationship between ramp-up performance and new product success (figure
5.2) was also formulated in terms of directional hypotheses, since the literature supports the
hypothesized effect. The null hypotheses concerning this relationship are:
H0:3 Better ramp-up performance does not enhance new product success.
H0:3.1 Better ramp-up quantity performance does not enhance new product success.
H0:3.2 Better ramp-up quality performance does not enhance new product success.
H0:3.3 Better ramp-up cost performance does not enhance new product success.
Figure 5.2: Ramp-up/success hypothesized relationships
Quantity performance
Quality performance
Cost performance
Production ramp-up
Inbound logistics
Intra logistics
Agile logistics
Inbound logistics
Intra logistics
Lean logistics
H1 H2
Sales return Net profit Market share
Customer satisfaction
New product success
Quantity performance
Quality performance
Cost performance
Production ramp-up
H3
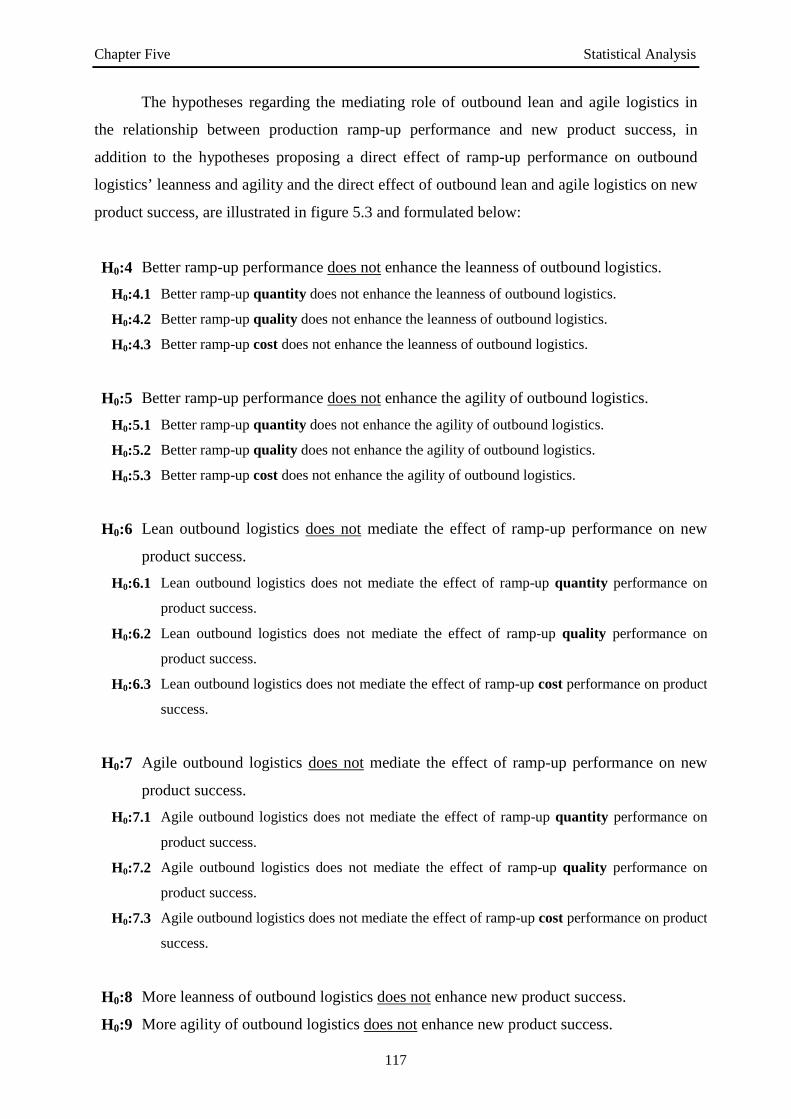
Chapter Five Statistical Analysis
117
The hypotheses regarding the mediating role of outbound lean and agile logistics in
the relationship between production ramp-up performance and new product success, in
addition to the hypotheses proposing a direct effect of ramp-up performance on outbound
logistics’ leanness and agility and the direct effect of outbound lean and agile logistics on new
product success, are illustrated in figure 5.3 and formulated below:
H0:4 Better ramp-up performance does not enhance the leanness of outbound logistics.
H0:4.1 Better ramp-up quantity does not enhance the leanness of outbound logistics.
H0:4.2 Better ramp-up quality does not enhance the leanness of outbound logistics.
H0:4.3 Better ramp-up cost does not enhance the leanness of outbound logistics.
H0:5
Better ramp-up performance does not enhance the agility of outbound logistics.
H0:5.1 Better ramp-up quantity does not enhance the agility of outbound logistics.
H0:5.2 Better ramp-up quality does not enhance the agility of outbound logistics.
H0:5.3 Better ramp-up cost does not enhance the agility of outbound logistics.
H0:6
Lean outbound logistics does not mediate the effect of ramp-up performance on new
product success.
H0:6.1 Lean outbound logistics does not mediate the effect of ramp-up quantity performance on
product success.
H0:6.2 Lean outbound logistics does not mediate the effect of ramp-up quality performance on
product success.
H0:6.3 Lean outbound logistics does not mediate the effect of ramp-up cost performance on product
success.
H0:7
Agile outbound logistics does not mediate the effect of ramp-up performance on new
product success.
H0:7.1 Agile outbound logistics does not mediate the effect of ramp-up quantity performance on
product success.
H0:7.2 Agile outbound logistics does not mediate the effect of ramp-up quality performance on
product success.
H0:7.3 Agile outbound logistics does not mediate the effect of ramp-up cost performance on product
success.
H0:8 More leanness of outbound logistics does not enhance new product success.
H0:9 More agility of outbound logistics does not enhance new product success.

Chapter Five Statistical Analysis
118
Figure 5.3: Ramp-up, outbound logistics, and success relationships
Figure 5.4 illustrates the hypothesized moderating effect of respondent-, organization-,
and product-related characteristics on the relationship between lean logistics and ramp-up
performance and between agile logistics and ramp-up performance. The related null
hypotheses are H0:10 and H0:11.
Job position, country, and product type were removed from the analysis, since these
categories have a wide range of respondents’ answers and, hence, may not produce any
significant indications with such a small sample size. Therefore, the sub-hypothesis related to
the respondent-related variable was represented only by the length of working experience.
The organization-related variable was represented by the company size and the number of
ramp-ups, and the product-related variable was represented by the newness of the product and
the expected lifecycle length.
H0:10 Respondent-, organization-, and product-related characteristics do not moderate the
relationship between ramp-up performance and lean logistics.
H0:10.1 Experience does not moderate the relationship between ramp-up performance and lean
logistics.
H0:10.2 Organizational size does not moderate the relationship between ramp-up performance and
lean logistics.
H0:10.3 Ramp-up frequency does not moderate the relationship between ramp-up performance
and lean logistics.
H0:10.4 Product/process newness does not moderate the relationship between ramp-up
performance and lean logistics.
New product success
Production ramp-up
Outbound lean logistics
Outbound agile logistics
H4 H5
H6 H7
H8 H9

Chapter Five Statistical Analysis
119
H0:10.5 Product Lifecycle length does not moderate the relationship between ramp-up
performance and lean logistics.
H0:11 Respondent-, organization-, and product-related characteristics do not moderate the
relationship between ramp-up performance and agile logistics.
H0:11.1 Experience does not moderate the relationship between ramp-up performance and agile
logistics.
H0:11.2 Organizational size does not moderate the relationship between ramp-up performance and
agile logistics.
H0:11.3 Ramp-up frequency does not moderate the relationship between ramp-up performance
and agile logistics.
H0:11.4 Product/process newness does not moderate the relationship between ramp-up
performance and agile logistics.
H0:11.5 Product lifecycle length does not moderate the relationship between ramp-up
performance and agile logistics.
Figure 5.4: Moderating effects of respondent-, organization-, and product-related characteristics
5.4.1. Hypothesis Testing Similar to the situation illustrated by Calvo-Mora et al. (2013), the attempt to predict
dependent variables, the complexity of the research model, and the use of a small sample size
motivated the use of the PLS method. In addition, PLS is more appropriate for testing models
Production ramp-up
Agile logistics Lean logistics
Respondent Organization Product
Moderating variables
H10 H11

Chapter Five Statistical Analysis
120
with formative and reflective constructs (Lowry and Gaskin, 2014). In the following sub-
sections, the results of testing the main and sub-hypotheses are presented and discussed.
Main Hypotheses Different scenarios were used to test the main hypotheses based on whether the variables were
considered to be in the first- or second-orders and, hence, to be formative or reflective. These
modelling scenarios were then compared and evaluated based on the statistical indicators and
the fitness of each model. While the formative and reflective perspectives of the research
variables have already been identified, the use of a first- or higher-order model should be
deliberated. In addition, the use of different indicators might provide further insights into the
research’s results.
Scenario 1: First-Order Reflective All ramp-up performance and problem measures were set as direct reflective measures for the
overall ramp-up construct; the same was applied to the inbound and intra logistics measures.
Figure 5.5 (A and B) shows the result of the path analysis conducted for this model. Figure
5.5 A illustrates the coefficient of determination (𝑅2) values for the dependent variables. The
values between the constructs and their measures – the outer model – represent the outer
loadings, while the values between different dependent and independent variables – the inner
model – represent the path coefficients. In figure 5.5 B, all the values in the inner and the
outer models represent the 𝑡 values. The values of the 𝑡 statistic, composite reliability (𝜌𝑐),
and average variance extracted (AVE) indicated some reliability and fitness issues and
necessitated further modifications.
While the measures of ramp-up problems were added and the three measures related to
3PL, MRP, and suppliers’ milk run were removed, standardization, cycle time reduction,
employees’ learning levels, and the costs of preparing the system for the ramp-up all had
lower loading values than were acceptable according to this model. Therefore, the removed
items were reinstalled and then eliminated one by one and the model was retested after each
adjustment was made. The following changes were made to the reflective model:
• The measures of cycle time reduction, learning, and MRP were removed due to low
𝑡 values; as indicated by Hair et al. (2014), 𝑡 values lower than 1.960 and 𝑝 values
lower than 0.050 are statistically insignificant.
• The measures of system preparation costs and standardization were removed to
enhance the AVE values.
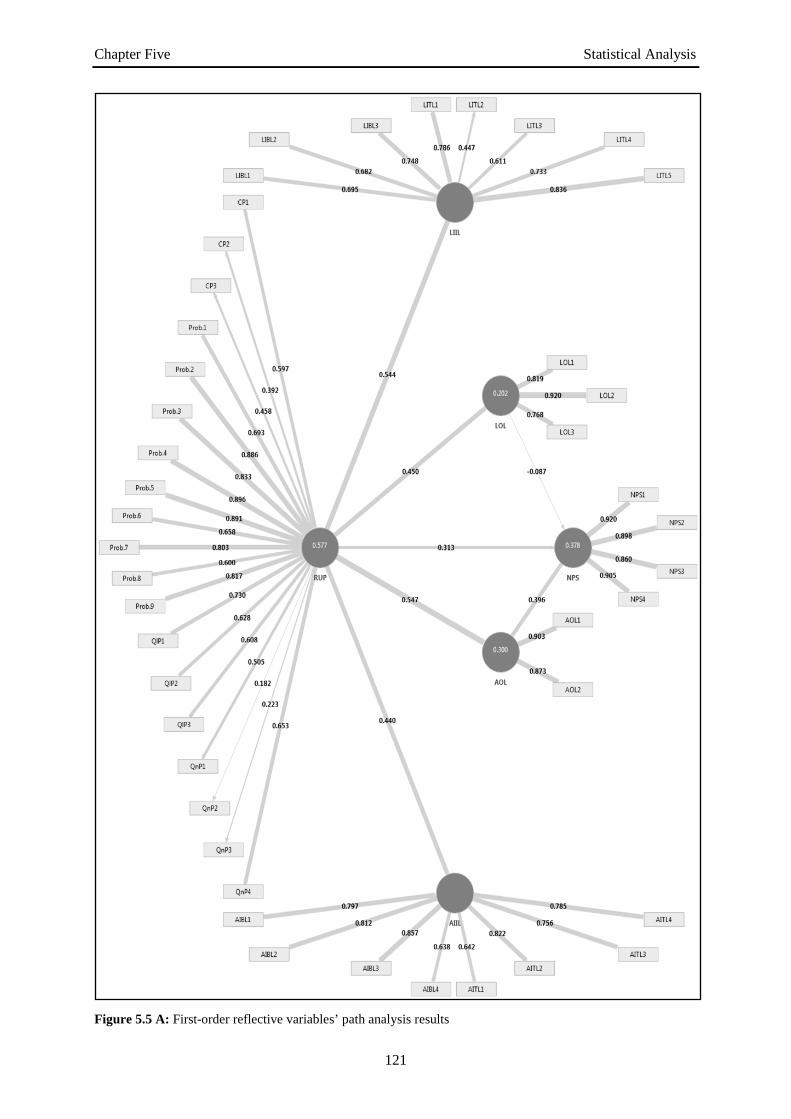
Chapter Five Statistical Analysis
121
Figure 5.5 A: First-order reflective variables’ path analysis results
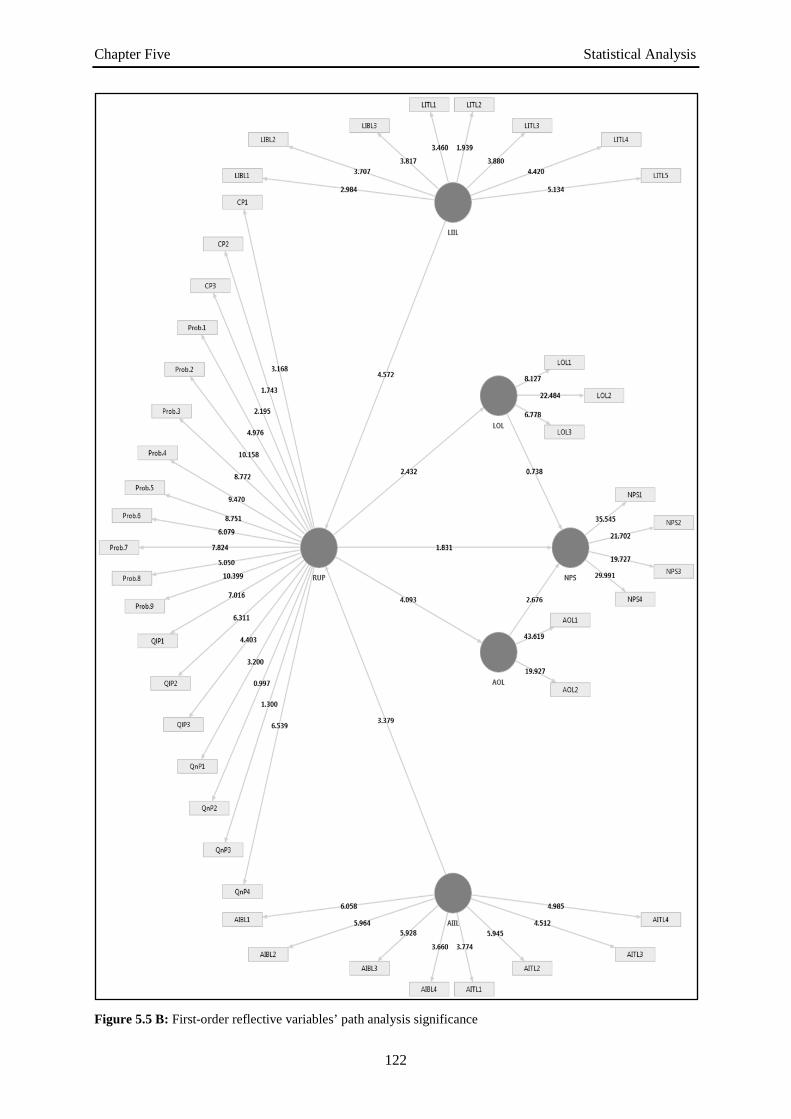
Chapter Five Statistical Analysis
122
Figure 5.5 B: First-order reflective variables’ path analysis significance

Chapter Five Statistical Analysis
123
• The measure of 3PL activities was removed again to enhance the ρc value for the
outbound agile logistics construct.
Table 5.14 illustrates the differences between the original model shown in the previous
figure and the adjusted model shown in figure 5.6. While no significant change occurred due
to this adjustment, the resulting model was considered to be more reliable. The effect of
agility on ramp-up was decreased from 0.440 to 0.399, the effect of leanness on ramp-up
performance increased slightly, and the effect of ramp-up performance on new product
success decreased and remained insignificant.
Table 5.14: The effect of removing measures with insignificant factor loading values
Path Path coefficient 𝒕 value 𝒑 value St. error
Old New Old New Old New Old New Lean (inbound and intra) >>>> Ramp-up 0.544 0.550 4.947 6.470 0.000 0.000 0.117 0.085 Agile (inbound and intra) >>> Ramp-up 0.440 0.399 3.465 3.704 0.000 0.000 0.122 0.108 Ramp-up >>>>>>>>>> Product success 0.313 0.304 1.845 1.766 0.075 0.078 0.175 0.172 Ramp-up >>>>>>>>>> Lean (outbound) 0.450 0.462 2.364 3.628 0.016 0.000 0.186 0.127 Ramp-up >>>>>>>>> Agile (outbound) 0.547 0.537 3.912 4.519 0.000 0.000 0.134 0.119 Lean (outbound) >>>>> Product success - 0.087 - 0.087 0.711 0.693 0.471 0.488 0.121 0.126 Agile (outbound) >>>>> Product success 0.396 0.404 2.635 2.799 0.010 0.005 0.153 0.144
Lean logistics and agile logistics significantly and positively affect the ramp-up
performance levels. According to the model presented in figure 5.6, 55.7% of the variation in
ramp-up performance can be explained by the variation in the inbound and intra logistics’
levels of leanness and agility.
The direct effect of ramp-up performance on new product success is insignificant. As
mentioned by Hair et al. (2014), once the path between the dependent and the independent
variables is basically insignificant, further investigation of the mediating effect on this path is
not needed, and the mediation effect should also be considered to be insignificant. In addition,
the ramp-up was shown to affect the levels of outbound logistics leanness and agility levels
significantly.
The moderating role of the respondent-, organization-, and product-related
characteristics was evaluated by adding an interactive variable to the path model. The results
showed no significant moderating effect for the relationship between leanness and ramp-up
performance with a path coefficient equal to -0.092, 𝑡 = 1.080, and 𝑝 = 0.280. Similarly, no
significant moderating effect was detected for the relationship between agility and ramp-up
performance; the path coefficient equalled -0.002, the 𝑡 value was 0.021, and the 𝑝 value was
very high (0.983).

Chapter Five Statistical Analysis
124
Figure 5.6: Adjusted first-order reflective variables path analysis results
Chapter Five Statistical Analysis
125
Scenario 2: Second-Order Formative Lean logistics, agile logistics, and product success were all considered as reflective variables.
The results of the constructs’ reliability test using Cronbach’s alpha supported this argument
(see table 3.4, page 65). Using a first-order format for ramp-up performance as a formative
variable leads to insignificant outer loadings and weights for most of the model measures, in
addition to other reliability and fitness issues (see Appendix 3, figure A.1). The measurement
of production problem occurrences during the ramp-up phase was originally added to the
structural model to enhance the reliability and to raise the Cronbach’s alpha to an acceptable
level – all as reflective indicators. Diamantopoulos et al. (2008) mentioned that reliability, in
terms of internal consistency, is not meaningful for formative indicators, since the correlation
values between different formative indicators could be negative, positive, or zero
(Diamantopoulos and Winklhofer, 2001). Consequently, the model was formed with ramp-up
performance as a second-order formative variable and the measures of ramp-up problems
were eliminated. In addition, the constructs combining inbound and intra logistics for both
lean and agile cases should be formed as formative second-order variables.
In this model, the 3PL measure was removed to enhance the 𝜌𝑐 value, and the MRP
measure was eliminated to raise the AVE value of the lean inbound logistics to 0.562. While
the construct combining inbound and intra logistics’ leanness and the ramp-up performance
construct have AVE values less than 0.500, these were ignored since both are formative
variables. The final components and the relationship directions for the model are shown in
figure 5.7.
To calculate the accurate path coefficients for this model, a two-step procedure was
applied. First, the path model coefficients for the model in figure 5.7 were calculated. In this
case, the second-order dependent latent variables’ variation is completely explained by their
corresponding first-order reflective variables and nothing is left for the other independent
variables. Therefore, the second step was to use the calculated scores of the latent variables
(see table A.1 A, in appendix 4) as individual indicators for the dependent and independent
variables included in the main hypotheses. The path coefficients for this model are illustrated
in figure 5.8.
According to the analysis results of this model, the 𝑝 values indicated insignificant
relationships between lean outbound logistics and product success (𝑝 = 0.756) and between
ramp-up performance and product success (𝑝 = 0.123); the coefficient for the indirect effect
of ramp-up on success had the value of 0.228 with 𝑝 = 0.000.

Chapter Five Statistical Analysis
126
Figure 5.7: Path model with second-order formative variables
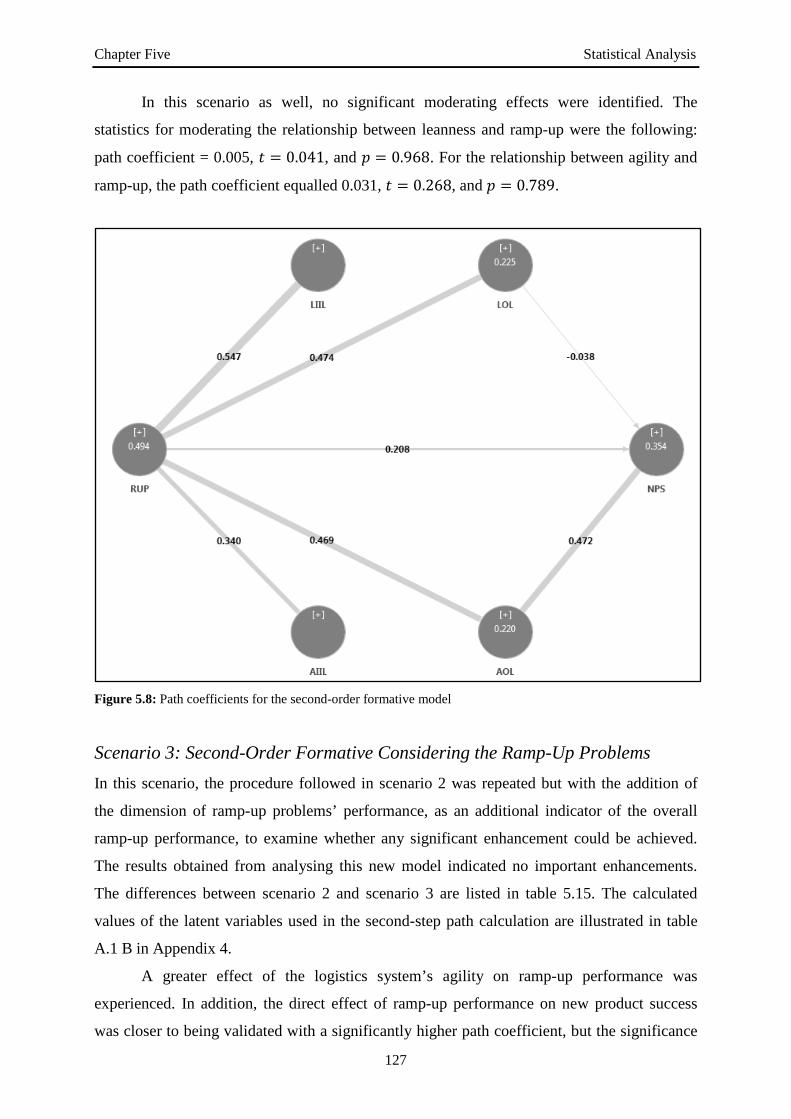
Chapter Five Statistical Analysis
127
In this scenario as well, no significant moderating effects were identified. The
statistics for moderating the relationship between leanness and ramp-up were the following:
path coefficient = 0.005, 𝑡 = 0.041, and 𝑝 = 0.968. For the relationship between agility and
ramp-up, the path coefficient equalled 0.031, 𝑡 = 0.268, and 𝑝 = 0.789.
Figure 5.8: Path coefficients for the second-order formative model
Scenario 3: Second-Order Formative Considering the Ramp-Up Problems In this scenario, the procedure followed in scenario 2 was repeated but with the addition of
the dimension of ramp-up problems’ performance, as an additional indicator of the overall
ramp-up performance, to examine whether any significant enhancement could be achieved.
The results obtained from analysing this new model indicated no important enhancements.
The differences between scenario 2 and scenario 3 are listed in table 5.15. The calculated
values of the latent variables used in the second-step path calculation are illustrated in table
A.1 B in Appendix 4.
A greater effect of the logistics system’s agility on ramp-up performance was
experienced. In addition, the direct effect of ramp-up performance on new product success
was closer to being validated with a significantly higher path coefficient, but the significance
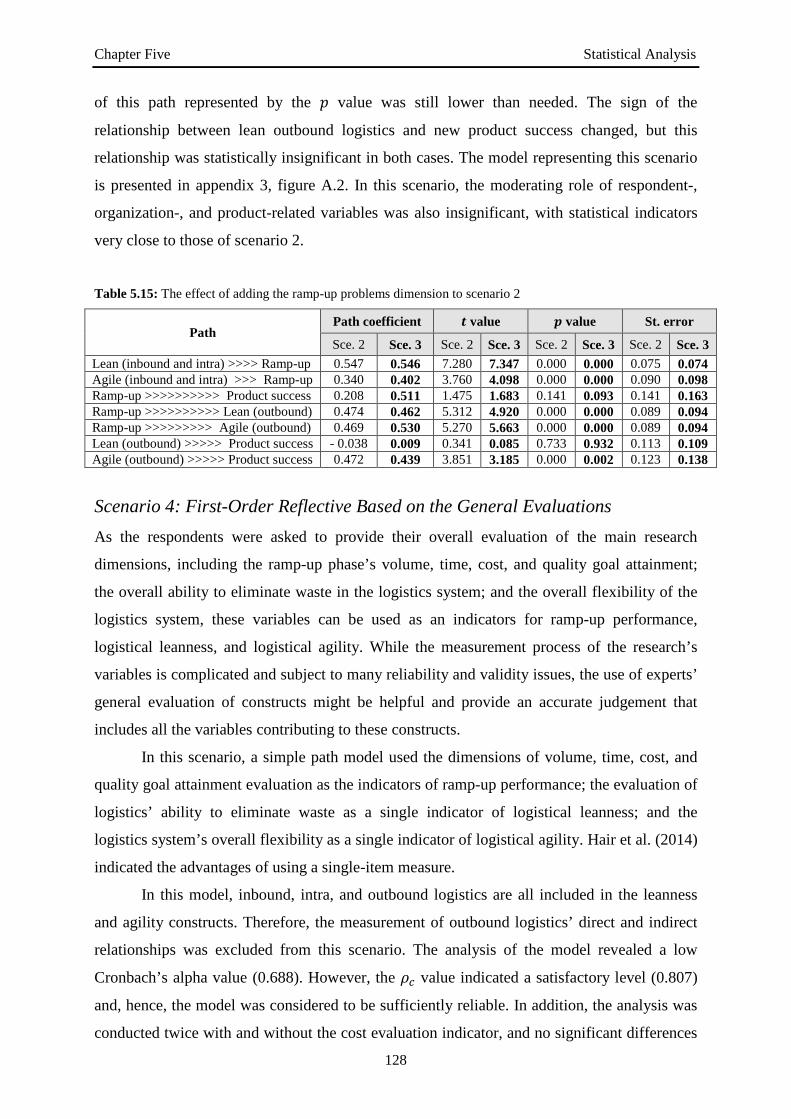
Chapter Five Statistical Analysis
128
of this path represented by the 𝑝 value was still lower than needed. The sign of the
relationship between lean outbound logistics and new product success changed, but this
relationship was statistically insignificant in both cases. The model representing this scenario
is presented in appendix 3, figure A.2. In this scenario, the moderating role of respondent-,
organization-, and product-related variables was also insignificant, with statistical indicators
very close to those of scenario 2.
Table 5.15: The effect of adding the ramp-up problems dimension to scenario 2
Path Path coefficient 𝒕 value 𝒑 value St. error
Sce. 2 Sce. 3 Sce. 2 Sce. 3 Sce. 2 Sce. 3 Sce. 2 Sce. 3 Lean (inbound and intra) >>>> Ramp-up 0.547 0.546 7.280 7.347 0.000 0.000 0.075 0.074 Agile (inbound and intra) >>> Ramp-up 0.340 0.402 3.760 4.098 0.000 0.000 0.090 0.098 Ramp-up >>>>>>>>>> Product success 0.208 0.511 1.475 1.683 0.141 0.093 0.141 0.163 Ramp-up >>>>>>>>>> Lean (outbound) 0.474 0.462 5.312 4.920 0.000 0.000 0.089 0.094 Ramp-up >>>>>>>>> Agile (outbound) 0.469 0.530 5.270 5.663 0.000 0.000 0.089 0.094 Lean (outbound) >>>>> Product success - 0.038 0.009 0.341 0.085 0.733 0.932 0.113 0.109 Agile (outbound) >>>>> Product success 0.472 0.439 3.851 3.185 0.000 0.002 0.123 0.138
Scenario 4: First-Order Reflective Based on the General Evaluations As the respondents were asked to provide their overall evaluation of the main research
dimensions, including the ramp-up phase’s volume, time, cost, and quality goal attainment;
the overall ability to eliminate waste in the logistics system; and the overall flexibility of the
logistics system, these variables can be used as an indicators for ramp-up performance,
logistical leanness, and logistical agility. While the measurement process of the research’s
variables is complicated and subject to many reliability and validity issues, the use of experts’
general evaluation of constructs might be helpful and provide an accurate judgement that
includes all the variables contributing to these constructs.
In this scenario, a simple path model used the dimensions of volume, time, cost, and
quality goal attainment evaluation as the indicators of ramp-up performance; the evaluation of
logistics’ ability to eliminate waste as a single indicator of logistical leanness; and the
logistics system’s overall flexibility as a single indicator of logistical agility. Hair et al. (2014)
indicated the advantages of using a single-item measure.
In this model, inbound, intra, and outbound logistics are all included in the leanness
and agility constructs. Therefore, the measurement of outbound logistics’ direct and indirect
relationships was excluded from this scenario. The analysis of the model revealed a low
Cronbach’s alpha value (0.688). However, the 𝜌𝑐 value indicated a satisfactory level (0.807)
and, hence, the model was considered to be sufficiently reliable. In addition, the analysis was
conducted twice with and without the cost evaluation indicator, and no significant differences

Chapter Five Statistical Analysis
129
were noted. Figure 5.9 represents the path model of this scenario with the path coefficients
and 𝑅2 values.
The model in which the cost evaluation indicator was eliminated is represented in
figure A.3 in appendix 3. Higher path coefficients for the relationships between agile logistics
and ramp-up and between ramp-up and success were identified, and a lower coefficient for the
relationship between lean logistics and ramp-up performance was also noted. In this model,
no significant moderating effects were identified for the proposed moderating variables.
Figure 5.9: Path coefficients for the first-order reflective model using general evaluation dimensions
Scenario 5: Second-Order Formative Based on the General Evaluations The same model used in scenario 2 was employed again, but instead of using the normal
measures as indicators of the second-order formative variables, these measures were replaced
by the general evaluation measures used in the previous scenario. The model was also
adjusted to enhance the 𝜌𝑐, AVE, and heterotrait–monotrait (HTMT) ratio indications. All the
coefficients for this scenario are illustrated in figure A.4 in appendix 3. The results showed an
insignificant effect of lean logistics on ramp-up performance, of ramp-up on outbound
logistical leanness, and of both lean and agile outbound logistics on new product success.

Chapter Five Statistical Analysis
130
However, the results indicated a significant effect of ramp-up performance on product
success, which required further investigation of the possible mediation role of outbound
logistics. In the case of lean logistics, while the path between ramp-up and success was
significant with 𝑝 = 0.014, the significance of the paths between ramp-up and outbound lean
logistics and between outbound lean logistics and success should also be significant (Hair et
al., 2014).
This condition was not achieved, since the 𝑝 values for both were insignificant (the 𝑝
values were 0.207 and 0.230, respectively). In addition, in the case of agile logistics, the 𝑝
value for the path coefficient between outbound agile logistics and success was insignificant,
with a value of 0.197. Consequently, the moderating effects of both lean and agile logistics
were considered to be insignificant. The moderating roles of respondent-, organization-, and
product-related variables were insignificant in this scenario as well.
Scenario Summary The five scenarios explained in the previous sections are summarized in table 5.16. These
scenarios were compared according to the different statistical indicators contributing to the
model fitness. In addition, the scenarios were judged according to the similarity to the original
proposed model.
While the Cronbach’s alpha represents the internal consistency of the construct, the
use of 𝜌𝑐 should also be considered. Hair et al. (2014) indicated that 𝜌𝑐 can be calculated
according to the following formula:
𝜌𝑐 =(∑ 𝑙𝑖𝑖 )2
(∑ 𝑙𝑖𝑖 )2 + ∑ 𝑣𝑎𝑟(𝑒𝑖)𝑖
in which, for an indicator variable 𝑖 of a specific construct:
𝑙𝑖: is the standardized outer loading
𝑒𝑖: is the measurement error
𝑣𝑎𝑟 (𝑒𝑖): is the variance of the measurement error
According to table 5.16, and considering the values of AVE, 𝜌𝑐, VIF, HTMT, and
SRMR, scenarios 2 and 3 were considered to be the most powerful. In addition, scenario 2
was considered to be the closest one to the original model.

Chapter Five Statistical Analysis
131
Table 5.16: Main hypothesis scenarios’ summary M
ain
hypo
thes
is
Path
Scen
ario
1
Scen
ario
2
Scen
ario
3
Scen
ario
4
Scen
ario
5
H0:1 Lean (inbound and intra) >>>>>>>>>>> Ramp-up Rej. Rej. Rej. Acc. Acc. H0:2 Agile (inbound and intra) >>>>>>>>>>> Ramp-up Rej. Rej. Rej. Rej. Rej. H0:3 Ramp-up >>>>>>>>>>>>>>>>>> Product success Acc. Acc. Acc. Rej. Rej. H0:4 Ramp-up >>>>>>>>>>>>>>>>> Lean (outbound) Rej. Rej. Rej. - Acc. H0:5 Ramp-up >>>>>>>>>>>>>>>>> Agile (outbound) Rej. Rej. Rej. - Rej. H0:6 Ramp-up >>> lean (outbound) >>> Product success Acc. Acc. Acc. - Acc. H0:7 Ramp-up >> agile (outbound) >>> Product success Acc. Acc. Acc. - Acc. H0:8 Lean (outbound) >>>>>>>>>>>>> Product success Acc. Acc. Acc. Acc. Acc. H0:9 Agile (outbound) >>>>>>>>>>>> Product success Rej. Rej. Rej. Rej. Acc.
H0:10 Moderators >>>>> Leanness /ramp-up relationship Acc. Acc. Acc. Acc. Acc. H0:11 Moderators >>>>>>> Agility /ramp-up relationship Acc. Acc. Acc. Acc. Acc.
Statistics
𝑅2 (ramp-up performance) 0.557 0.494 0.542 0.433 0.608 𝑅2 (product success) 0.376 0.354 0.397 0.467 0.444 𝐹2 (lean >>> ramp-up) 0.650 0.564 0.629 0.159 0.018 𝐹2 (agile >>> ramp-up) 0.342 0.217 0.340 0.507 0.172 𝐹2 (ramp-up >>> success) 0.068 0.035 0.058 0.156 0.216
Path coefficient (lean >>> ramp-up) 0.550 0.547 0.546 0.303 0.106 Path coefficient (agile >>> ramp-up) 0.399 0.340 0.402 0.542 0.334
Path coefficient (ramp-up >>> success) 0.304 0.208 0.511 0.383 0.526 Average variance extracted (AVE)
Composite reliability (𝜌𝑐) Highest variance inflation factor (VIF)/inner model 2.181 1.929 2.149 1.763 2.866
Maximum heterotrait-monotrait ratio (HTMT) 0.982 0.812 0.814 0.763 1.087 Maximum HTMT confidence intervals up 1.116 0.877 0.884 0.911 1.272
Standardized root mean square residual (SRMR) 0.150 0.000 0.000 0.140 0.157
Sub-hypotheses The research sub-hypotheses were tested according to the model illustrated in figure 5.10. The
figure also includes the path coefficients and the 𝑅2 values. Only two constructs were
eliminated to enhance the 𝜌𝑐 value to the acceptable levels in the case of inbound lean
logistics and outbound agile logistics. Figure A.5 in appendix 3 shows the model with all the
𝑝 values to investigate the significance of the relationships.
Table 5.17 illustrates the results of testing the subsidiary hypotheses using the model
presented in figure 5.10. However, the sub-hypotheses related to the moderating effect of
respondent-, organization-, and product-related variables were tested using the model
developed in scenario 2 for the main hypothesis testing (see figure 5.8).

Chapter Five Statistical Analysis
132
Figure 5.10: Path coefficients for subsidiary hypothesis testing

Chapter Five Statistical Analysis
133
Table 5.17: Sub-hypothesis testing summary Su
b H
ypot
hesi
s
Path
Res
ult
𝒕 V
alue
𝒑 V
alue
𝒇𝟐
VIF
H0:1.1 Lean (inbound and intra) >>>>>>>>>>>> Quantity Acc. 0.127 0.899 0.000 1.030 H0:1.2 Lean (inbound and intra) >>>>>>>>>>>>> Quality Rej. 4.410 0.000 0.289 1.030 H0:1.3 Lean (inbound and intra) >>>>>>>>>>>>>>> Cost Rej. 15.592 0.000 1.856 1.030 H0:2.1 Agile (inbound and intra) >>>>>>>>>>> Quantity Rej. 12.876 0.000 0.182 1.030 H0:2.2 Agile (inbound and intra) >>>>>>>>>>>> Quality Rej. 3.654 0.000 1.185 1.030 H0:2.3 Agile (inbound and intra) >>>>>>>>>>>>>> Cost Rej. 2.780 0.006 0.195 1.030 H0:3.1 Quantity >>>>>>>>>>>>>>>>>> Product success Acc. 0.454 0.650 0.004 1.665 H0:3.2 Quality >>>>>>>>>>>>>>>>>>> Product success Acc. 0.935 0.350 0.015 1.864 H0:3.3 Cost >>>>>>>>>>>>>>>>>>>>> Product success Acc. 0.641 0.522 0.008 2.494 H0:4.1 Quantity >>>>>>>>>>>>>>>>>>> Lean outbound Acc. 1.364 0.173 0.037 1.148 H0:4.2 Quality >>>>>>>>>>>>>>>>>>>> Lean outbound Acc. 1.227 0.220 0.028 1.382 H0:4.3 Cost >>>>>>>>>>>>>>>>>>>>>> Lean outbound Rej. 10.035 0.000 0.861 1.238 H0:5.1 Quantity >>>>>>>>>>>>>>>>>> Agile outbound Rej. 6.228 0.000 0.410 1.148 H0:5.2 Quality >>>>>>>>>>>>>>>>>>> Agile outbound Rej. 4.626 0.000 0.322 1.382 H0:5.3 Cost >>>>>>>>>>>>>>>>>>>>> Agile outbound Rej. 2.589 0.010 0.146 1.238 H0:6.1 Quantity >>> Lean outbound >>>> Product success Acc. - - - - H0:6.2 Quality >>>> Lean outbound >>> Product success Acc. - - - - H0:6.3 Cost >>>>>> Lean outbound >>>> Product success Acc. - - - - H0:7.1 Quantity >>> Agile outbound >>> Product success Acc. - - - - H0:7.2 Quality >>>> Agile outbound >>> Product success Acc. - - - - H0:7.3 Cost >>>>> Agile outbound >>>> Product success Acc. - - - - H0:8.1 Experience >>>>> Leanness /ramp-up relationship Acc. 0.337 0.736 0.003 1.095 H0:8.2 Size >>>>>>>>>> Leanness /ramp-up relationship Acc. 1.592 0.112 0.056 1.051 H0:8.3 Ramp-ups no. >>> Leanness /ramp-up relationship Acc. 1.017 0.310 0.018 1.140 H0:8.4 Newness >>>>>>> Leanness /ramp-up relationship Acc. 1.319 0.188 0.038 1.011 H0:8.5 Lifecycle >>>>>>> Leanness /ramp-up relationship Acc. 0.621 0.535 0.007 1.167 H0:9.1 Experience >>>>>>> Agility /ramp-up relationship Acc. 0.618 0.537 0.005 1.035 H0:9.2 Size >>>>>>>>>>>> Agility /ramp-up relationship Acc. 0.692 0.489 0.009 1.077 H0:9.3 Ramp-ups no. >>>>> Agility /ramp-up relationship Acc. 0.091 0.927 0.000 1.128 H0:9.4 Newness >>>>>>>> Agility /ramp-up relationship Acc. 1.068 0.286 0.021 1.061 H0:9.5 Lifecycle >>>>>>>> Agility /ramp-up relationship Acc. 0.179 0.858 0.001 1.102
As shown in the previous table, only nine null hypotheses were rejected and the rest of
the null hypotheses were supported by the analysis. Figure 5.11 shows the model with only
significant paths that indicate rejection of the related null hypothesis. The significant path
between agile outbound logistics and product success was excluded, since it was related to a
main hypothesis and not to a subsidiary one.

Chapter Five Statistical Analysis
134
Figure 5.11: Significant path coefficients for the subsidiary hypotheses

Chapter Six Mixed-Strategy Introduction
135
CHAPTER 6
MIXED-STRATEGY
INTRODUCTION
6.1. Introduction As can be noted from the results of testing the research hypotheses, both lean and agile
logistics significantly affect production performance during the ramp-up phase. The effect of
variation in the logistics system’s leanness and agility levels on the composite ramp-up
performance measure were investigated to test the proposed hypotheses. However, the three
constructs constituting the ramp-up performance parameters do not have the same importance
during the ramp-up phase.
Kontio and Haapasalo (2005), Lee and Matsuo (2012), Niroomand et al. (2014), and
other researchers indicated that time reduction – and, hence, quantity performance
enhancement – is the main focus during the ramp-up phase. Consequently, companies might
be willing to enhance their quantity performance during production ramp-up even at the
expense of lowering the cost – and sometimes quality – performance. However, in most cases,
shortly after new product introduction, similar products will be introduced by competitors and
the customers’ willingness to pay a premium price, due to the product’s novelty, will decrease

Chapter Six Mixed-Strategy Introduction
136
dramatically. At this point, price rather than features can lead the customers’ purchasing
decision. Consequently, manufacturing firms have to change their production strategy to
focus more on production cost reduction to be able to price their products competitively.
In this sense, manufacturing firms face the situation of switching their focus from time
reduction (quantity performance enhancement) during the ramp-up phase to cost reduction
(cost performance enhancement) during the steady-state phase. This phenomenon re-occurs
with each new product development and introduction process. As mentioned previously,
numerous organizational and environmental variables enforce more frequent re-occurrence of
new product development, introduction, and ramp-up (see section 1.2).
In addition, the steady-state production process is followed by a production ramp-
down phase (Schuh et al., 2005a), also called the product phase-out (Elbert, 2011) or
production run-down phase (Milehamet al., 2004). The ramp-down phase takes place as the
demand for the product drops. During this phase, cost control becomes even more important
and is essential for the product’s survival. As the operating revenues fall under the production
variable costs, production shutdown should take place (McDonald and Siegel, 1985). Figure
6.1 illustrates how the manufacturing process’s focus differs according to the different
production lifecycle phases.
Figure 6.1: Production phases and focuses of performance outcomes
Leanness and agility play key roles in determining the quantity and cost performance
levels. While leanness affects the cost performance significantly through waste elimination,
the flexibility provided by an agile system positively affects the quantity-related – or time-
related – performance. Whilst many researchers have assumed that systems that combine lean
and agile concepts achieve the highest possible levels of both flexibility and cost control (see
Cost reduction focus
Time
Previous Product Current Product New Product
Cost reduction focus
Time reduction focus
Time reduction focus
Vol
ume
Chapter Six Mixed-Strategy Introduction
137
Naylor et al., 1999; Christopher and Towill, 2000; Ilyas et al., 2008; Huang and Li, 2010), the
pressing need for ramp-up’s time reduction necessitates a higher flexibility level than can be
provided by the composite (or leagile) systems proposed. Furthermore, the criticality of cost
control during the steady-state and ramp-down production phases might require more rigorous
application of the lean paradigm, especially in the ramp-down phase.
Consequently, this research proposes that employing different levels of leanness and
agility – rather than one traded-off level – during different production phases might produce
better overall lifecycle performance than using the lean system only, the agile system only, or
even a fixed combined system. In serving this objective, the logistics part of the lean and agile
systems was further investigated as part of an exploratory data analysis of the data collected
to examine the role of lean and agile logistics during the ramp-up phase.
The relationships between each measure of the lean and agile logistics constructs and
the ramp-up performance measures were analysed to determine which components are more
desirable for quantity performance enhancement and which are more coveted for better cost
performance. Basically, this analysis shows that agile logistics possessed a higher correlation
with quantity performance, while lean logistics had a higher correlation with cost
performance, as detailed in the coming sections.
Undoubtedly, reducing both the time-to-volume duration and the ramp-up cost
simultaneously could be achieved, but to a certain traded-off level that produces the optimum
levels of both time and cost that maximize the overall ramp-up performance or the overall
success of the new product during the introductory period. However, taking the entire product
lifecycle into account, this trade-off level might not be the best option; rather, varying levels
of time and cost reduction might lead to higher product lifecycle performance.
6.2. Measures’ Relationships While all the performance indicators were investigated in testing the research hypotheses,
only the time- and cost-related performance constructs will be considered now. Achieving the
targeted levels of quality is a precondition for all the production phases. Führer (2008)
mentioned the production of quality products as the main aim to consider in introducing new
products. In addition, after the introductory period, lower quality level than expected will
motivate the customer to switch to another producer. Furthermore, the effect of producing
products with lower than the requisite quality level will be directly reflected in the time and
cost performance indicators. Schmitt and Schmitt (2013), for example, mentioned the

Chapter Six Mixed-Strategy Introduction
138
importance of quality issues for delays experienced in the ramp-up phase; quality issues will
increase the costs of rework and scrap as well.
Similar to the proposed hypotheses, only the measures of inbound and intra logistics
were investigated for their direct effects on time- and cost-related performance during ramp-
up. In addition, the effect of outbound logistics measures was evaluated as mediators in the
effect of ramp-up time and cost performance measures in the new product success indicators.
In other words, outbound logistics’ leanness and agility reflect how the quantity- and cost-
related performances are translated into actual product success.
6.2.1. The Direct Effect Table 6.1 provides a general view of the correlation values between the composite constructs
of inbound and intra logistics’ leanness and agility and the constructs of time and cost
performance. As shown in the table, lean logistics’ relationship with cost-related performance
is more significant than its relation with quantity-related performance, and agile logistics’
relationship with time-related performance is more significant than its relationship with cost-
related performance, empirically supporting the previously proposed relationships.
Table 6.1: Correlation between lean and agile logistics and time and cost performance
Quantity performance
Cost performance Lean logistics Agile logistics
Quantity performance
Pearson Correlation 1 Sig. (2-tailed)
N 56
Cost performance Pearson Correlation 0.053 1 Sig. (2-tailed) 0.696 N 56 56
Lean logistics Pearson Correlation 0.131 0.677** 1 Sig. (2-tailed) 0.345 0.000 N 54 54 54
Agile logistics Pearson Correlation 0.667** - 0.112 0.161 1 Sig. (2-tailed) 0.000 0.420 0.249 N 54 54 53 54
** Correlation is significant at the 0.01 level (2-tailed) Exclude missing (pairwise)
For a more detailed and comprehensive investigation of the relationship between the
leanness of inbound and intra logistics measures and the ramp-up time and cost performance
indicators, table 6.2 illustrates the correlation values for these measures and constructs. MRP
was originally measured as an indicator of the existence of a push production and logistics
system (Benton and Shin, 1998), which is considered as a negative indicator of leanness
levels since a lean system should be based on a pull rather than a push philosophy. However,
the level of standardization required by the lean system might legitimate the use of MRP

Chapter Six Mixed-Strategy Introduction
139
techniques. Therefore, MRP failed to represent any clear pattern related to leanness levels. All
the other measures of leanness in inbound and intra logistics showed strong positive
relationships with the cost performance levels.
Table 6.2: Correlation between leanness and time and cost performance
Inbound logistics Quantity Cost Intra logistics Quantity Cost
RM inventory levels Pearson Correlation 0.153 0.702** WIP inventory
levels 0.108 0.775**
Sig. (2-tailed) 0.265 0.000 0.430 0.000 N 55 55 56 56
Supply–production synchronization
Pearson Correlation 0.146 0.449** Standardization
0.064 0.310* Sig. (2-tailed) 0.283 0.001 0.637 0.020 N 56 56 56 56
Material transportation costs
Pearson Correlation - 0.082 0.715** JIT
0.286* 0.288* Sig. (2-tailed) 0.547 0.000 0.033 0.031 N 56 56 56 56
MRP (-) Pearson Correlation - 0.249 0.050
Kanban 0.163 0.305*
Sig. (2-tailed) 0.065 0.714 0.230 0.023 N 56 56 56 56
Supplier milk run Pearson Correlation 0.061 0.315*
Cross-docking 0.191 0.454**
Sig. (2-tailed) 0.655 0.018 0.164 0.001 N 56 56 55 55
** Correlation is significant at the 0.01 level (2-tailed) * Correlation is significant at the 0.05 level (2-tailed) Exclude missing (pairwise)
While some leanness–quantity performance correlation values had a minus sign, this
sign is not a strong indicator since the relationships were statistically insignificant. Only JIT
showed a positive and statistically significant (at the 0.05 level) relationship with quantity
performance. The RM and WIP inventory levels in addition to the material transportation
costs as compared with those of competitors can contribute the highest possible enhancement
to production cost reduction. Except for MRP, inbound logistics activities are more influential
in enhancing the cost performance during the ramp-up phase.
Similarly, table 6.3 shows the correlation values between the inbound and intra agile
logistics and the time and cost performance indicators. All the agility measures were
significantly (at the 0.01 level) correlated with the quantity performance levels. The special
role of suppliers’ flexibility and cooperation in enhancing the quantity performance during
production ramp-up is quite straightforward. Li et al. (2014) and Ralston (2014) stressed the
important role of suppliers’ collaboration during ramp-up. Similarly, table 5.8 on page 110
illustrates the significant effect of material-related problems on ramp-up quantity
performance, in terms of both the performance measured and the general evaluation provided.
Negative, but insignificant, relationships between the agility levels in inbound and
intra logistics on the one hand and the ramp-up cost performance on the other were identified
(except for employing an RMS). In other words, greater flexibility in the production system
during the ramp-up phase can enhance quantity and time performance and is not related – if

Chapter Six Mixed-Strategy Introduction
140
not negatively related – to cost performance. Such clear figures of a greater relationship
between flexibility and time performance and between leanness and cost performance are not
surprising and have frequently been supported in the theoretical and empirical literature.
Table 6.3: Correlation between agility and time and cost performance
Inbound logistics Quantity Cost Intra logistics Quantity Cost
Supplier cooperation Pearson Correlation 0.623** - 0.109 Internal
flexibility 0.470** - 0.123
Sig. (2-tailed) 0.000 0.423 0.000 0.370 N 56 56 55 55
Producer–supplier IT link
Pearson Correlation 0.496** - 0.008 Adaptability to change
0.454** - 0.101 Sig. (2-tailed) 0.000 0.954 0.000 0.459 N 56 56 56 56
Supplier flexibility Pearson Correlation 0.711** - 0.137 Modular
product design 0.412** - 0.116
Sig. (2-tailed) 0.000 0.313 0.002 0.394 N 56 56 56 56
Vendor managed inventory
Pearson Correlation 0.486** - 0.158 Reconfigurable manufacturing
0.452** 0.021 Sig. (2-tailed) 0.000 0.250 0.000 0.878 N 55 55 56 56
** Correlation is significant at the 0.01 level (2-tailed) Exclude missing (pairwise)
Regarding the component measures of the internal flexibility construct, figure 6.2
shows their correlation values with the time and cost indicators. More flexibility in the
machinery, the production system, the material handling system, or the tools and equipment is
significantly and positively correlated with ramp-up quantity performance and negatively –
but insignificantly – correlated with cost performance.
Figure 6.2: Internal flexibility measures’ correlations with time and cost performance
Further support can be provided using the path analysis direct effect (equal to the path
coefficient) histograms. As shown in figure 6.3, comparing the agile–quantity path with the
lean–quantity path, and the agile–cost path with the lean–cost path, can simply and directly
lead to the proposed idea that enhancing quantity performance during the production ramp-up
phase and, hence, reducing the ramp-up time require more agility in the inbound and intra
logistics activities.
-0,3 -0,2 -0,1 0 0,1 0,2 0,3 0,4 0,5 0,6
Equipment
Materials Handling
System
Machine
Quantity
Cost

Chapter Six Mixed-Strategy Introduction
141
Agility >>>>> Quantity
Leanness >>>>> Quantity
Agility >>>>> Cost
Leanness >>>>> Cost
Figure 6.3: Correlation histograms for leanness and agility levels with quantity and cost performance
Correlation
Correlation
Correlation
Correlation
Freq
uenc
y
Freq
uenc
y
Freq
uenc
y
Freq
uenc
y

Chapter Six Mixed-Strategy Introduction
142
6.2.2. The Mediating Effect To examine the role of outbound logistics in mediating the relationship between quantity and
cost performance on the one hand and new product success on the other, the model shown in
figure 6.4 was developed. The constructs of inbound and intra logistics were removed to
explore any possible change in the relationship between ramp-up performance and product
success from the patterns noted in chapter 5.
Figure 6.4: Path coefficients for examining outbound logistics’ role
While the Cronbach’s alpha for the agile outbound logistics was lower than 0.070, the
3PL measure was not removed, since the 𝜌𝑐 value was acceptable (0.814 for agile outbound
logistics). The AVE and VIF values for all the constructs were also acceptable. Figure A.6 in
appendix 3 illustrates the 𝑝 values for all the paths in figure 6.4. Since no significant
relationships were found between quantity performance and success or between cost
performance and success, no mediating effects were expected for lean or agile outbound
logistics.
However, this analysis revealed a significant effect for cost performance on lean
outbound logistics and for quantity performance on agile outbound logistics. In addition, a
significant direct effect for the agility of outbound logistics on the new product success levels

Chapter Six Mixed-Strategy Introduction
143
was identified with a path coefficient equal to 0.557. On the other hand, lean outbound
logistics seemed to have no significant effect on new product success.
6.3. Logistics, Production, and the Lifecycle As can be noted from the correlation values shown in the previous section, more agility in the
inbound and intra logistics activities contributes to higher quantity performance, while more
leanness is preferable for cost performance improvement. Figure 6.5 illustrates these
relationships and the corresponding trend lines.
Lean
Agile
Qua
ntity
Cos
t
Figure 6.5: Correlation charts for leanness, agility, quantity, and cost
While the cost performance data used in this analysis pertain to the ramp-up phase,
similar relationships between leanness and cost performance are expected to continue during
the steady-state and production ramp-down phases. Considering the production ramp-up
phase, which is the main focus of the current research, the use of agile logistics is highly
recommended. However, the use of a certain logistical strategy cannot be separated from the
production system, and the ramp-up phase cannot be isolated from the other production
phases. Instead, the production system and the entire product lifecycle should be considered.
The overall profitability during the entire product lifecycle should be the main focus, rather
R² = 0,0001 0
2
4
6
8
10
0 2 4 6 8 10
R² = 0,2925 0
2
4
6
8
10
0 2 4 6 8 10
R² = 0,2039 0
2
4
6
8
10
0 2 4 6 8 10
R² = 0,0062 0
2
4
6
8
10
0 2 4 6 8 10LIIL
LIIL
AIIL
AIIL
QnP
QnP
CP
CP
Chapter Six Mixed-Strategy Introduction
144
than the profitability during the ramp-up phase, the steady-state phase, or the ramp-down
phase separately. While in this chapter different levels of leanness and agility are proposed
based on the lifecycle phase, chapter 7 provides further support for this idea and discusses the
product lifecycle issues in more details. In addition, the involvement of production will be
discussed thoroughly in the following sections.
6.4. Literature Support Many researchers have stressed the importance of time reduction during the ramp-up phase
(e.g. Terwiesch and Bohn, 2001; Doltsinis et al., 2013; Winter et al., 2014). Bohn and
Terwiesch (1999) stated that ramp-up management is intended to speed up learning and that,
by the end of this phase, cost becomes the main decision criterion. Pufall et al. (2007)
mentioned the limited impact of cost during the ramp-up phase compared with the lost sales
that could result from delays. In addition, Ramasesh et al. (2010) mentioned the possible
benefits of being the ‘first mover’ in the market, including the relative ease of market share
gaining, less price pressure, better experience curve effects, higher buyer switching costs, and
deterrence of late entrants. Hansen (2013) indicated the consequences of poor performance
during the ramp-up phase using the ‘Apple iPhone 5’ example, when the available quantities
were sold out during the opening weekend and sales of 1 million extra units were missed. The
response was a 1.4% decrease in the stock price.
Scholz-Reiter et al. (2007) discussed the interdependency existing between the factors
affecting ramp-up and the phase goals. In addition to the high demand experienced during
production ramp-up due to the novelty of the product and the willingness of the customer to
pay a premium price, another increase in the demand might follow the ramp-up period
because of the reduced sales from the company’s old products, as well as those of competitors
(Li et al., 2014). Hence, reducing the ramp-up time and lead time gains additional importance
for manufacturers (Li et al., 2003).
Mason-Jones et al. (2000a) used the terms market qualifier and market winner to
highlight the differences between leanness and agility and mentioned the importance of
leanness when cost is the market winner and the need for agility when the market winner is
the service level (see figure 6.6). Although Mason-Jones et al. (2000a) distinguished between
service levels and lead time, many other authors (e.g. Ray and Jewkes, 2004) have mentioned
the importance of lead time reduction as a service. In this sense, reducing the ramp-up time –
by the means of agility – is at the core of customer service enhancement.

Chapter Six Mixed-Strategy Introduction
145
The flexibility advantage that an agile system has over a lean system has also been
strongly supported in the literature. A lean system provides some levels of flexibility, but it
prevents the development of extra flexibility that might be required in a dynamic workplace.
Paixão and Marlow (2003) highlighted this fact considering the port operations environment.
Kisperska-Moron and de Haan (2011) clarified the importance of agility to competing in a
volatile environment and explained that ‘overly expensive’ agility is undesirable in mature
markets, in which leanness becomes the right decision. The urgent need for agility during the
ramp-up phase was discussed by Niroomand et al. (2012), Li et al. (2014), and other authors.
Figure 6.6: Leanness, agility, qualifier, and winner matrix according to Mason-Jones et al. (2000a)
The inverse relationship between flexibility and cost, on which the proposed model is
based, has also been supported in the literature. Hayes and Pisano (1996) illustrated the extra
costs incurred due to the acquisition of greater flexibility, as shown in figure 6.7.
As shown in the previous figure, and as frequently discussed in the literature, the
flexibility of a manufacturing system has been attached to the production of a wide variety of
products. However, when a single product is considered, flexibility is also required according
to the variation in the demand, customers’ preferences, the technology used, and many other
variables. In addition, the trade-off between time and cost performance and goals has
frequently been discussed in the project management literature (see Atkinson, 1999; Yang,
2005; Tareghian and Taheri, 2006).
6.5. Applicability The idea of changing the production strategy during the product lifecycle has already been
investigated in the literature. In an early work, Hayes and Wheelwright (1979) discussed the
Leanness
Agility
Market Qualifier
Quality Lead time
Service level
Quality Cost
Lead time
Market Winner
Cost
Service level

Chapter Six Mixed-Strategy Introduction
146
importance of aligning the production process and the product lifecycle stage. Ramasesh et al.
(2010) mentioned the mixed-process strategy, in which a flexible process is used in the early
lifecycle stages and a dedicated process is used later to gain cost economies. In addition,
Jaikumar and Bohn (1992) considered the importance of developing a dynamic approach to
operations characterized by continuous change and instability. Basse et al. (2014b)
emphasized the importance of designing a manufacturing system that is scalable and able to
match changes during production ramp-up. Furthermore, Ramasesh et al. (2010) explained the
first-mover advantage gained by companies that switch early to a low unit-cost process.
Figure 6.7: Production system’s cost–flexibility relationships according to Hayes and Pisano (1996)
Meyer (2007) mentioned that investing more assets in the ramp-up process is subject
to the magnitude of returns expected from this investment. Figure 6.8 illustrates the
relationship between assets investment and projected returns and mentions the alternative
strategies when the expected returns are not enough to cover the resources invested. These
strategies include leveraging the existing production line rather than investing in a new one,
using outsourcing through a contract manufacturer, or sharing a flexible scale-up line.
Similarly, Cantamessa and Valentini (2000) stressed the importance of trading off the two
options of enhancing capacity – and incurring higher costs – and losing part of the expected
demand.
Cos
t
Flexibility
Specialist
Broad range competitor
Lean competitor

Chapter Six Mixed-Strategy Introduction
147
Different options might be considered to apply the concept of switching between lean
and agile production systems during different product lifecycle phases, including the use of
reconfigurable manufacturing systems (Mehrabi et al., 2000; Elmaraghy, 2005; Niroomand et
al., 2014), using outsourcing and contract manufacturers (Plambeck and Taylor, 2005), and
the use of a specialized agile manufacturing plant (Meyer, 2007).
Niroomand et al. (2014) explained how a reconfigurable manufacturing system
combines the advantages of both a dedicated manufacturing system and a flexible
manufacturing system and provides a mechanism to trade off production volume and variety.
A reconfigurable manufacturing system provides customized flexibility to adapt to variation
on demand within a short time period (Elmaraghy, 2005); the main evaluation parameter for
the agility level of the RMS is the length of the reconfiguration period and the ramp-up phase
(Niroomand et al., 2014).
Figure 6.8: Ramp-up asset requirements, projected returns, and strategies according to Meyer (2007)
6.5.1. Developing a Ramp-Up Facility Another important option for applying the proposed model is to construct a special ramp-up
facility characterized by the maximum rate of agility in terms of the manufacturing system
Mass-market products
Proj
ecte
d an
nual
sale
s fir
st 2
yea
rs o
f lau
nch
Yes
Yes
No
5 20
80
20
Niche products
Manufacturing assets
• Leverage an existing line • Use contract manufacturer • Share a flexible scale-up line

Chapter Six Mixed-Strategy Introduction
148
and the logistics system as well. All ramp-ups are carried out in the ramp-up facility (see
figure 6.9). The viability of constructing such a facility might depend on many factors,
including the type of product, innovation levels and number of ramp-ups, severity of the
competition, nature of the demand, and many other factors. Ramasesh et al. (2010) illustrated
how critical and sensitive the decision on switching the production system is from one
strategy to another. The development of a specialized flexible ramp-up facility might be
significantly beneficial in such a situation.
While agility is more supportive of ramp-up time reduction, and leanness is more
desirable during the steady-state and ramp-down phases, the switch between the two
paradigms requires extensive analysis for the production system, the nature of demand, the
lifecycle price trend, the accompanying costs, the investment required, and the opportunity
cost. An ad hoc comprehensive strategy is required to implement the model proposed.
Figure 6.9: Specialized agile ramp-up facility
Production ramp-up Steady-state production
Vol
ume
Time
Start of production
Reach of production
targets
End of maturity phase
Production ramp-down
Agile ramp-up facility
Products A B C
Lean facilities
Product A
Product B
Product C

Chapter Seven Lifecycle Profitability Comparison
149
CHAPTER 7
LIFECYCLE PROFITABILITY
COMPARISON
7.1. Introduction The model presented in the previous chapter proposed more enabling for agile tools during
the production ramp-up phase and more enabling for lean tools during the steady-state and
ramp-down production phases. Further validation of this model is required. This can be
achieved through an investigation of the effect of using the proposed system on the overall
lifecycle performance and comparing the proposed system performance with the fully lean
system, the fully agile system, and the leagile system. For this purpose, the results of the
statistical analysis were used to evaluate the possible enhancement of time performance using
agile logistics and the possible enhancement of cost performance using lean logistics. The
magnitude of enhancement was utilized as an input to analyse the lifecycle performance in
terms of overall profitability.

Chapter Seven Lifecycle Profitability Comparison
150
The effects of the different dimensions should be considered, including the product
type, the competitive rivalry, the price trends, the demand nature, the expected lifecycle
length, the profit margins, and many other factors. Mathematical tools were utilized to imitate
the lifecycle cumulative productivity of each scenario applied and to evaluate the limitations
of each scenario according to different products’ types and characteristics.
7.2. Product Lifecycle Analysis Considerations To analyse the profitability over different product lifecycle stages, many factors should be
considered, including the demand curve, the price curve, and the lifecycle cost trends. The
lifecycle stages were connected to different production phases (see figure 7.1). Production
ramp-up is considered to take place during the introduction and growth stages of the lifecycle,
steady-state production is considered to be within the maturity stage, and ramp-down should
be started with the decline phase of the cycle.
Figure 7.1: Demand and production during different product lifecycle stages
However, this is not the case for all types of products. In addition, different
manufacturers might experience different combinations of product and production lifecycles.
For example, considering the research conducted by Haller et al. (2003) and Sturm et al.
(2003) in the wafer fabrication industry, the entire product lifecycle can consist of ramp-up
and ramp-down phases only without experiencing a steady-state production phase.
Maturity
Vol
ume
Time
Introduction Decline Growth
Demand
Production
Ramp-up
Steady-state
Ramp-down

Chapter Seven Lifecycle Profitability Comparison
151
The analysis of the product lifecycle has frequently been considered in the literature to
support a variety of purposes, including evaluating the production strategy (Hayes and Pisano,
1996; Luna and Aguilar-Savén, 2004), evaluating the stages’ characteristics (Chang and
Chang, 2003), exploring the price trends (Lilien and Yoon, 1988; Melser and Syed, 2014),
analysing the lifecycle cost (Asiedu and Gu, 1998; Kleyner and Sandborn, 2008; Folgado et
al., 2010), and analysing the lifecycle inventory (Suh and Huppes, 2005; Hsueh, 2011).
7.2.1. Lifecycle Demand Ramasesh et al. (2010) mentioned that most researchers agreed about the general shape of the
lifecycle demand (as shown in figure 7.1), which starts from an initial demand greater than
zero and increases slightly during the introduction stage, then a sharp increase distinguishes
the growth stage, followed by a constantly declining demand indicating the final stage of the
product lifecycle. However, the author indicated that the uncertainty surrounding new product
success requires the consideration of different possible demand curves (see figure 7.2).
Figure 7.2: Different demand curves due to product success uncertainty according to Ramasesh et al. (2010)
To model the lifecycle demand mathematically, the approach followed by Hsueh
(2011) was used. In this approach, the total demand was calculated through a separate
equation for each lifecycle stage that reflects the agreed-upon demand trends during each
f (t)
Time
f1 (t)
f2 (t)
f3 (t)
f4 (t)
f(0)

Chapter Seven Lifecycle Profitability Comparison
152
stage; considering the different time periods (𝑡) shown in figure 7.3, the following equations
were used:
• Introduction stage: 𝑑𝑖 = 𝑣1 + 𝑏1𝑡 𝑣1 > 0, 𝑏1 > 0
• Growth stage: 𝑑𝑔 = 𝑣2 + 𝑏2𝑡 𝑏2 > 𝑏1, 𝑣2 = 𝑣1 + (𝑏1 − 𝑏2)𝑡1
• Maturity stage: 𝑑𝑚 = 𝑣3 𝑣3 = 𝑣2 + 𝑏2𝑡2
• Decline stage: 𝑑𝑑 = 𝑣4−𝑏4𝑡 𝑏4 > 0, 𝑏4 = 𝑣3(𝑇−𝑡3) , 𝑣4 = 𝑏4𝑇
• Demand according to time period (𝑡):
𝑑(𝑡) = �
𝑣1 + 𝑏1𝑡 0 ≤ 𝑡 ≤ 𝑡1𝑣2 + 𝑏2𝑡 𝑡1 ≤ 𝑡 ≤ 𝑡2𝑣3 𝑡2 ≤ 𝑡 ≤ 𝑡3𝑣4−𝑏4𝑡 𝑡3 ≤ 𝑡 ≤ 𝑇
• Total lifecycle demand:
𝐷 = � (𝑣1 + 𝑏1𝑡)
𝑡1
0
+ � (𝑣1 + 𝑏2𝑡)
𝑡2
𝑡1
+ � (𝑣3)
𝑡3
𝑡2
+ �(𝑣4−𝑏4𝑡)𝑇
𝑡3
(1)
where: 𝑎1 is the initial demand at time 𝑡 = 0
𝑏1,𝑏2,𝑏3,𝑎𝑎𝑑 𝑏4 are the demand growth factor during the introduction, growth,
maturity and decline stages respectively
𝐷 is the total lifecycle demand
𝑇 is the lifecycle length
7.2.2. Lifecycle Production Considering the demand functions during different lifecycle stages, the production function
can be divided into two sections. The first one includes the ramp-up curve and the second
moves with the demand function. Once the production curve reaches the demand level at a
certain time point, only the required quantities will be produced thereafter (see figure 7.3).
Different observations to describe the ramp-up curve are available in the literature, including
the power curve observed by Risse (2003) in the automobile industry, in which the effective
capacity (𝑒𝑐) – or production volume – is expressed as follows:
𝑒𝑐 = 𝛼 ∙ 𝑡𝛽 (2)

Chapter Seven Lifecycle Profitability Comparison
153
where 𝛼 and 𝛽 are parameters to identify the steepness of the ramp-up curve’s slope. Hansen
(2013) provided a sigmoid function to describe an s-shaped ramp-up curve as follows:
𝑒𝑐 =𝑡𝑐
(1 + 𝑐 ∙ 𝑒−𝑏∙𝑡) (3)
where 𝑡𝑐 represents the targeted capacity and 𝑐 and 𝑏 are parameters that determine the slope
of the ramp-up curve. Alternatively, Glock et al. (2012) used an exponential formula to
represent the ramp-up curve as follows:
𝑒𝑐 = 𝑠𝑐 + 𝑐𝑖𝑟 ∙ (1 − 𝑒−𝑡 𝛿⁄ ) (4)
where 𝑠𝑐 represents the starting capacity, 𝑐𝑖𝑟 is the increase rate for effective capacity, and the
𝛿 value determines the rate of capacity increase.
Figure 7.3: Demand, agile production, and lean production curves
This research considered the power function (equation number 2) to represent the
ramp-up curve. The enhancement level during the ramp-up phase due to the use of an agile
logistics system depends on many factors: (1) the contribution of logistics to the ramp-up
performance should be identified and (2) the 𝑅2 value’s change due to the enhanced agility of
Vol
ume
Time
0 t1 t2 t
3 T
𝑣1
Introduction Growth Maturity Decline
tAgile
tLean
𝑣3
Demand Production (Agile) Production (Lean)
𝑑 = 𝑣1 + 𝑏1𝑡 𝑑 = 𝑣1 + 𝑏2𝑡 𝑑 = 𝑣3 𝑑 = 𝑣4 − 𝑏4𝑡
𝑣2
𝜶 ∙ 𝒕𝜷𝑨𝑨𝑨𝑨𝑨
𝜶 ∙ 𝒕𝜷𝑳𝑨𝑳𝑳
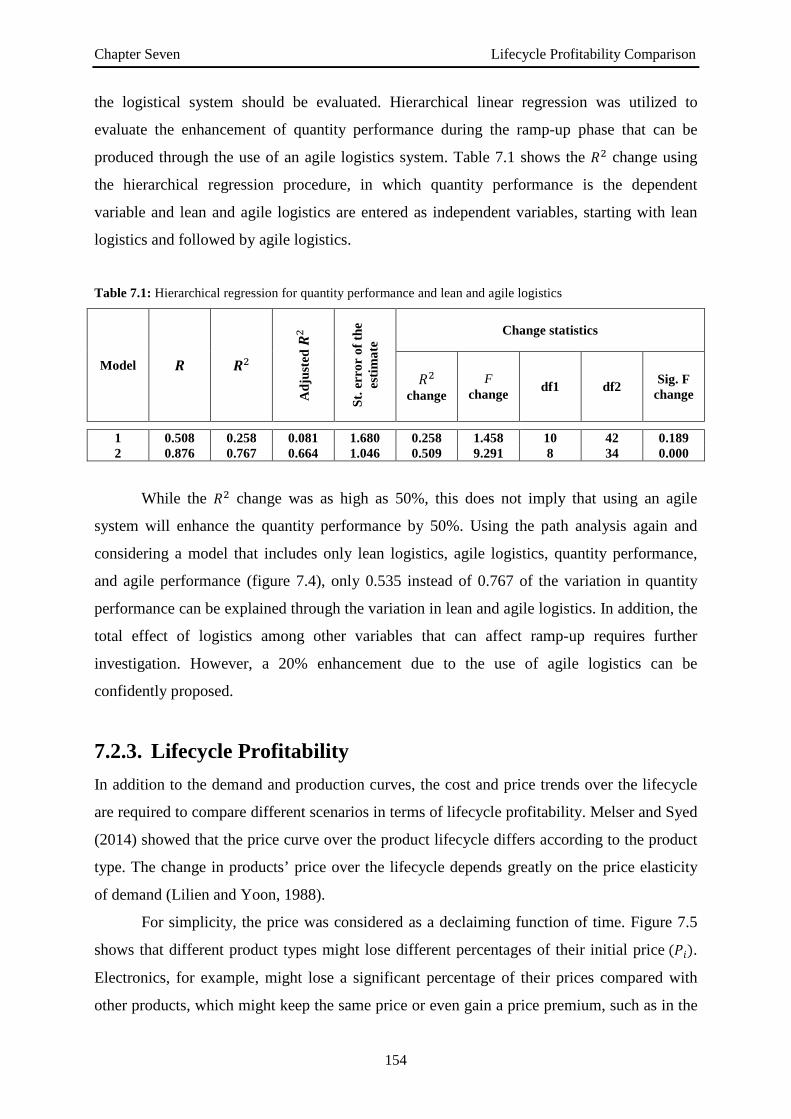
Chapter Seven Lifecycle Profitability Comparison
154
the logistical system should be evaluated. Hierarchical linear regression was utilized to
evaluate the enhancement of quantity performance during the ramp-up phase that can be
produced through the use of an agile logistics system. Table 7.1 shows the 𝑅2 change using
the hierarchical regression procedure, in which quantity performance is the dependent
variable and lean and agile logistics are entered as independent variables, starting with lean
logistics and followed by agile logistics.
Table 7.1: Hierarchical regression for quantity performance and lean and agile logistics
Model 𝑹 𝑹2
Adj
uste
d 𝑹2
St. e
rror
of t
he
estim
ate
Change statistics
𝑅2 change
F change df1 df2 Sig. F
change
1 0.508 0.258 0.081 1.680 0.258 1.458 10 42 0.189 2 0.876 0.767 0.664 1.046 0.509 9.291 8 34 0.000
While the 𝑅2 change was as high as 50%, this does not imply that using an agile
system will enhance the quantity performance by 50%. Using the path analysis again and
considering a model that includes only lean logistics, agile logistics, quantity performance,
and agile performance (figure 7.4), only 0.535 instead of 0.767 of the variation in quantity
performance can be explained through the variation in lean and agile logistics. In addition, the
total effect of logistics among other variables that can affect ramp-up requires further
investigation. However, a 20% enhancement due to the use of agile logistics can be
confidently proposed.
7.2.3. Lifecycle Profitability In addition to the demand and production curves, the cost and price trends over the lifecycle
are required to compare different scenarios in terms of lifecycle profitability. Melser and Syed
(2014) showed that the price curve over the product lifecycle differs according to the product
type. The change in products’ price over the lifecycle depends greatly on the price elasticity
of demand (Lilien and Yoon, 1988).
For simplicity, the price was considered as a declaiming function of time. Figure 7.5
shows that different product types might lose different percentages of their initial price (𝑇𝑖).
Electronics, for example, might lose a significant percentage of their prices compared with
other products, which might keep the same price or even gain a price premium, such as in the

Chapter Seven Lifecycle Profitability Comparison
155
case of medicines and cigarettes. The price curve will be represented using the following
equation:
𝑇(𝑡) = 𝑎𝑝𝑡 + 𝑏𝑝 𝑏𝑝 > 0,𝑎𝑏 < 0 (5)
Figure 7.4: Path model for quantity, cost, leanness, and agility

Chapter Seven Lifecycle Profitability Comparison
156
Figure 7.5: Different price trends according to product type and price elasticity
The product lifecycle cost depends on many factors, including the volume of
production, since higher production rates provide the advantage of greater economies of scale,
resulting in a lower per-unit price. Moreover, the cost decreases with time due to the effect of
experience and learning curves. However, only the cost variation resulting from employing
different leanness and agility combinations will be considered. Other factors will affect all the
scenarios in similar directions.
To evaluate the possible enhancement in cost performance due to higher levels of
leanness, the 𝑅2 change should be considered. Table 7.2 shows the results of a hierarchical
regression model in which cost performance was set as the dependent variable and agility and
leanness were entered into the model starting with agile logistics and followed by lean
logistics. The results indicated significant opportunities for cost reduction using a leaner
logistics system with an 𝑅2 change with a value of 0.575.
Table 7.2: Hierarchical regression for cost performance and agile and lean logistics
Model 𝑹 𝑹2
Adj
uste
d 𝑹2
St. e
rror
of t
he
estim
ate
Change statistics
𝑅2 change
F change df1 df2 Sig. F
change
1 0.487 0.237 0.098 2.054 0.237 1.707 8 44 0.124 2 0.901 0.812 0.713 1.160 0.575 10.406 10 34 0.000
Pric
e
Time T
Pi Pi
0.25*Pi
0.50*Pi
0.75*Pi

Chapter Seven Lifecycle Profitability Comparison
157
7.3. Profitability Calculations Three scenarios were compared with the proposed mixed system: lifecycle lean, lifecycle
agile, and lifecycle leagile. In all the cases, once the ramped-up production touches the
demand curve, only the demanded quantity will be produced. Consequently, the production –
or sales, since all production is proposed to be sold – over the lifecycle can be divided into
two sections, ramp-up and demand, as follows:
Production for the lean scenario:
𝑇𝑙𝑙𝑙𝑛(𝑡) = �𝛼𝑙𝑙𝑙𝑛𝑡𝛽𝑙𝑙𝑙𝑙 0 ≤ 𝑡 ≤ 𝑡𝑙𝑙𝑙𝑛
𝑑(𝑡) 𝑡 ≥ 𝑡𝑙𝑙𝑙𝑛 (6)
Production for the agile scenario:
𝑇𝑙𝑔𝑖𝑙𝑙(𝑡) = �
𝛼𝑙𝑔𝑖𝑙𝑙𝑡𝛽𝑙𝑎𝑎𝑙𝑙 0 ≤ 𝑡 ≤ 𝑡𝑙𝑔𝑖𝑙𝑙𝑑(𝑡) 𝑡 ≥ 𝑡𝑙𝑔𝑖𝑙𝑙
(7)
The quantity produced during different stages of the product lifecycle, in addition to
the related costs and prices, was used to calculate the lifecycle profitability for each scenario.
For the lifecycle lean scenario, the per-unit profitability was calculated by:
𝑈𝑇𝑙𝑙𝑙𝑛(𝑡) = 𝑎𝑝𝑡 + 𝑏𝑝 − 𝐶𝑙𝑙𝑙𝑛𝑏𝑝 > 0, 𝑎𝑝 < 0 (8)
where 𝑈𝑇 is the per-unit profitability and 𝐶𝑙𝑙𝑙𝑛 is the per-unit cost of using the lean system.
The profitability equation during different periods in the case of the lean system (𝑇𝑟𝐻𝑃𝑖𝑡𝑙𝑙𝑙𝑛)
is calculated by:
𝑇𝑟𝐻𝑃𝑖𝑡(𝑡)𝑙𝑙𝑙𝑛 = �𝑎𝑝𝑡 + 𝑏𝑝 − 𝐶𝑙𝑙𝑙𝑛��𝛼𝑙𝑙𝑙𝑛𝑡𝛽𝑙𝑙𝑙𝑙 0 ≤ 𝑡 ≤ 𝑡𝑙𝑙𝑙𝑛, 𝛼𝑙𝑙𝑙𝑛 > 0, 𝛽𝑙𝑙𝑙𝑛 > 1𝑣3, 𝑡𝑙𝑙𝑙𝑛 ≤ 𝑡 ≤ 𝑡3, 𝑣3 = 𝑣2 + 𝑏2𝑡2𝑣4 − 𝑏4𝑡, 𝑡3 ≤ 𝑡 ≤ 𝑇, 𝑏4 > 0, 𝑣4 = 𝑣3 + 𝑏4𝑡3
(9)
𝑇𝑟𝐻𝑃𝑖𝑡(𝑡)𝑙𝑙𝑙𝑛 = �𝑎𝑝𝛼𝑙𝑙𝑙𝑛𝑡𝛽𝑙𝑙𝑙𝑙+1 + 𝑏𝑝𝛼𝑙𝑙𝑙𝑛𝑡𝛽𝑙𝑙𝑙𝑙 − 𝑐𝑙𝑙𝑙𝑛𝛼𝑙𝑙𝑙𝑛𝑡𝛽𝑙𝑙𝑙𝑙 𝑣3𝑎𝑝𝑡 + 𝑣3𝑏𝑝 − 𝑣3𝑐𝑙𝑙𝑙𝑛 �𝑣4𝑎𝑝 − 𝑏4𝑏𝑝 + 𝑏4𝑐𝑙𝑙𝑙𝑛�𝑡 + 𝑣4𝑏𝑝 − 𝑣4𝑐𝑙𝑙𝑙𝑛 − 𝑏4𝑎𝑝𝑡2
(10)
The total lifecycle profitability using the lean system (𝑇𝑇𝑙𝑙𝑙𝑛) equals:

Chapter Seven Lifecycle Profitability Comparison
158
𝑇𝑇𝑙𝑙𝑙𝑛 = ∫ �𝑎𝑝𝛼𝑙𝑙𝑙𝑛𝑡𝛽𝑙𝑙𝑙𝑙+1 + �𝑏𝑝𝛼𝑙𝑙𝑙𝑛 − 𝐶𝑙𝑙𝑙𝑛𝛼𝑙𝑙𝑙𝑛�𝑡𝛽𝑙𝑙𝑙𝑙�𝑑𝑡𝑡𝑙𝑙𝑙𝑙0 + ∫ �𝑣3𝑎𝑝𝑡 + 𝑣3𝑏𝑝 −
𝑡3𝑡𝑙𝑙𝑙𝑙
𝑣3𝐶𝑙𝑙𝑙𝑛� 𝑑𝑡 + ∫ ��𝑣4𝑎𝑝 − 𝑏4𝑏𝑝 + 𝑏4𝐶𝑙𝑙𝑙𝑛�𝑡 + 𝑣4𝑏𝑝 − 𝑣4𝐶𝑙𝑙𝑙𝑛 − 𝑏4𝑎𝑝𝑡2�𝑑𝑡𝑇𝑡3
(11)
𝑇𝑇𝑙𝑙𝑙𝑛 = 𝑙𝑝𝛼𝑙𝑙𝑙𝑙𝑡𝑙𝑙𝑙𝑙𝛽𝑙𝑙𝑙𝑙+2
𝛽𝑙𝑙𝑙𝑙+2+ �𝑏𝑝𝛼𝑙𝑙𝑙𝑙−𝐶𝑙𝑙𝑙𝑙𝛼𝑙𝑙𝑙𝑙�𝑡𝑙𝑙𝑙𝑙𝛽𝑙𝑙𝑙𝑙+1
𝛽𝑙𝑙𝑙𝑙+1+ 𝑣3𝑙𝑝−2𝑣4𝑙𝑝+2𝑏4𝑏𝑝−2𝑏4𝑐𝑙𝑙𝑙𝑙𝑡32
2+
�𝑣3𝑏𝑝 − 𝑣3𝐶𝑙𝑙𝑙𝑛 − 𝑣4𝑏𝑝 + 𝑣4𝐶𝑙𝑙𝑙𝑛�𝑡3 −𝑣3𝑙𝑝𝑡22
2− �𝑣3𝑏𝑝 − 𝑣3𝐶𝑙𝑙𝑙𝑛�𝑡2 + �𝑣4𝑎𝑝 − 𝑏4𝑏𝑝 +
𝑏4𝐶𝑙𝑙𝑙𝑛�𝑇2 + �𝑣4𝑏𝑝 − 𝑣4𝐶𝑙𝑙𝑙𝑛�𝑇 −𝑏4𝑙𝑝𝑇3
3+ 𝑏4𝑙𝑝𝑡33
3 (12)
Similarly, considering equation (7), the total lifecycle profit for the agile scenario can
be calculated as follows:
𝑈𝑇𝑙𝑔𝑖𝑙𝑙(𝑡) = 𝑎𝑝𝑡 + 𝑏𝑝 − 𝐶𝑙𝑔𝑖𝑙𝑙 𝑏𝑝 > 0, 𝑎𝑝 < 0 (13)
where 𝑈𝑇𝑙𝑔𝑖𝑙𝑙 is the per-unit profit using the agile system and 𝐶𝑙𝑔𝑖𝑙𝑙 is the per-unit cost using
the agile system. The profitability equation in different lifecycle stages using the agile system
(𝑇𝑟𝐻𝑃𝑖𝑡𝑙𝑔𝑖𝑙𝑙) was calculated by:
𝑇𝑟𝐻𝑃𝑖𝑡(𝑡)𝑙𝑔𝑖𝑙𝑙 =
�𝑎𝑝𝑡 + 𝑏𝑝 − 𝐶𝑙𝑔𝑖𝑙𝑙�
⎩⎪⎨
⎪⎧𝛼𝑙𝑔𝑖𝑙𝑙𝑡
𝛽𝑙𝑎𝑎𝑙𝑙
𝑣2 + 𝑏2𝑡 0 ≤ 𝑡 ≤ 𝑡𝑙𝑔𝑖𝑙𝑙 ,𝛼𝑙𝑔𝑖𝑙𝑙 > 0, 𝛽𝑙𝑔𝑖𝑙𝑙 > 1𝑡𝑙𝑔𝑖𝑙𝑙 ≤ 𝑡 ≤ 𝑡2,𝑏2 > 0, 𝑣2 = 𝑣1 + (𝑏1 − 𝑏2)𝑡1
𝑣3 𝑡2 ≤ 𝑡 ≤ 𝑡3,𝑣3 = 𝑣2 + 𝑏2𝑡2 𝑣4 − 𝑏4𝑡 𝑡3 ≤ 𝑡 ≤ 𝑇, > 0, 𝑣4 = 𝑣3 + 𝑏4𝑡3
(14)
𝑇𝑟𝐻𝑃𝑖𝑡(𝑡)𝑙𝑔𝑖𝑙𝑙 =
⎩⎪⎨
⎪⎧𝑎𝑝𝑡.𝛼𝑙𝑔𝑖𝑙𝑙𝑡
𝛽𝑙𝑎𝑎𝑙𝑙 + 𝑏𝑝.𝛼𝑙𝑔𝑖𝑙𝑙𝑡𝛽𝑙𝑎𝑎𝑙𝑙 − 𝐶𝑙𝑔𝑖𝑙𝑙 .𝛼𝑙𝑔𝑖𝑙𝑙𝑡𝛽𝑙𝑎𝑎𝑙𝑙
𝑣2𝑎𝑝𝑡 + 𝑣2𝑏𝑝 − 𝑣2𝐶𝑙𝑔𝑖𝑙𝑙 + 𝑏2𝑡�𝑎𝑝𝑡 + 𝑏𝑝 − 𝐶𝑙𝑔𝑖𝑙𝑙�
𝑣3𝑎𝑝𝑡 + 𝑣3𝑏𝑝 − 𝑣3𝐶𝑙𝑔𝑖𝑙𝑙 𝑣4𝑎𝑝𝑡 + 𝑣4𝑏𝑝 − 𝑣4𝐶𝑙𝑔𝑖𝑙𝑙 − 𝑏4𝑡 (𝑎𝑝𝑡 + 𝑏𝑝 − 𝐶𝑙𝑔𝑖𝑙𝑙)
(15)
The total lifecycle profitability using the agile system (𝑇𝑇𝑙𝑔𝑖𝑙𝑙) equals:
𝑇𝑇𝑙𝑔𝑖𝑙𝑙 = ∫ �𝑎𝑝𝛼𝑙𝑔𝑖𝑙𝑙𝑡𝛽𝑙𝑎𝑎𝑙𝑙+1 + �𝑏𝑝𝛼𝑙𝑔𝑖𝑙𝑙 − 𝐶𝑙𝑔𝑖𝑙𝑙𝛼𝑙𝑔𝑖𝑙𝑙�𝑡𝛽𝑙𝑎𝑎𝑙𝑙�𝑑𝑡𝑡𝑙𝑎𝑎𝑙𝑙0 + ∫ ��𝑣2𝑎𝑝 +𝑡2
𝑡𝑙𝑎𝑎𝑙𝑙
𝑏2𝑏𝑝 − 𝑏2𝐶𝑙𝑔𝑖𝑙𝑙�𝑡 + 𝑣2𝑏𝑝 − 𝑣2𝐶𝑙𝑔𝑖𝑙𝑙 + 𝑏2𝑎𝑝𝑡2� 𝑑𝑡 + ∫ �𝑣3𝑎𝑝𝑡 + 𝑣3𝑏𝑝 − 𝑣3𝐶𝑙𝑔𝑖𝑙𝑙 � 𝑑𝑡𝑡3𝑡2
+
∫ ��𝑣4𝑎𝑝 − 𝑏4𝑏𝑝 + 𝑏4𝐶𝑙𝑔𝑖𝑙𝑙�𝑡 + 𝑣4𝑏𝑝 − 𝑣4𝐶𝑙𝑔𝑖𝑙𝑙 − 𝑏4𝑎𝑝𝑡2 � 𝑑𝑡𝑇𝑡3
(16)

Chapter Seven Lifecycle Profitability Comparison
159
𝑇𝑇𝑙𝑔𝑖𝑙𝑙 =
𝑙𝑝𝛼𝑙𝑎𝑎𝑙𝑙𝑡𝑙𝑎𝑎𝑙𝑙𝛽𝑙𝑎𝑎𝑙𝑙+2
𝛽𝑙𝑎𝑎𝑙𝑙+2+
�𝑏𝑝𝛼𝑙𝑎𝑎𝑙𝑙−𝐶𝑙𝑎𝑎𝑙𝑙𝛼𝑙𝑎𝑎𝑙𝑙�𝑡𝑙𝑎𝑎𝑙𝑙𝛽𝑙𝑎𝑎𝑙𝑙+1
𝛽𝑙𝑎𝑎𝑙𝑙+1+
�𝑣2𝑙𝑝+𝑏2𝑏𝑝−𝑏2𝐶𝑙𝑎𝑎𝑙𝑙−𝑣3𝑙𝑝�𝑡22
2+
�𝑣2𝑏𝑝 − 𝑣2𝐶𝑙𝑔𝑖𝑙𝑙 − 𝑣3𝑏𝑝 + 𝑣3𝐶𝑙𝑔𝑖𝑙𝑙�𝑡2 + 𝑏2𝑙𝑝𝑡23
3−
�𝑣2𝑙𝑝+𝑏2𝑏𝑝−𝑏2𝑐𝑙𝑎𝑎𝑙𝑙�𝑡𝑙𝑎𝑎𝑙𝑙2
2− �𝑣2𝑏𝑝 −
𝑣2𝑐𝑙𝑔𝑖𝑙𝑙�𝑡𝑙𝑔𝑖𝑙𝑙 −𝑏2𝑙𝑝𝑡𝑙𝑎𝑎𝑙𝑙3
3+ �𝑣3𝑙𝑝
2− 𝑣4𝑎𝑝 + 𝑏4𝑏𝑝 − 𝑏4𝐶𝑙𝑔𝑖𝑙𝑙� 𝑡32 + �𝑣3𝑏𝑝 − 𝑣3𝐶𝑙𝑔𝑖𝑙𝑙 −
𝑣4𝑏𝑝 + 𝑣4𝐶𝑙𝑔𝑖𝑙𝑙�𝑡3 + �𝑣4𝑎𝑝 − 𝑏4𝑏𝑝 + 𝑏4𝐶𝑙𝑔𝑖𝑙𝑙�𝑇2 + �𝑣4𝑏𝑝 − 𝑣4𝐶𝑙𝑔𝑖𝑙𝑙�𝑇 − 𝑏4𝑙𝑝𝑇3
3+
𝑏4𝑙𝑝𝑡33
3 (17)
Similar calculations were made to determine the profitability of the third scenario,
which represents the leagile system, combining leanness and agility, to provide a traded off
level of flexibility and leanness. In this scenario, the cost enhancement was calculated as an
average level between the lean and the agile system and the time performance enhancement
was also considered as an average between leanness and agility. The cost was considered to
be an average between the lean and the agile system, and the enhancement in the production
curve was also calculated as an average between the lean and the agile system. The equations
were omitted to eliminate unnecessary repetition.
The last scenario represents the proposed system that switches between the agile and
the lean system. The agile system is considered until the actual demand is matched and the
lean system will be considered thereafter. The profit per unit of production was calculated as:
𝑈𝑇𝑚𝑖𝑥𝑙𝑑(𝑡) = �𝑎𝑝𝑡 + 𝑏𝑝 − 𝐶𝑙𝑔𝑖𝑙𝑙 𝑡 ≤ 𝑡𝑙𝑔𝑖𝑙𝑙𝑎𝑝𝑡 + 𝑏𝑝 − 𝐶𝑙𝑙𝑙𝑛 𝑡 > 𝑡𝑙𝑔𝑖𝑙𝑙
(18)
The profit over time periods (𝑡) for the mixed system 𝑇𝑟𝐻𝑃𝑖𝑡𝑚𝑖𝑥𝑙𝑑 is:
𝑇𝑟𝐻𝑃𝑖𝑡(𝑡)𝑚𝑖𝑥𝑙𝑑
=
⎩⎪⎨
⎪⎧(𝑎𝑝𝑡 + 𝑏𝑝 − 𝐶𝑙𝑔𝑖𝑙𝑙)𝛼𝑙𝑔𝑖𝑙𝑙𝑡𝛽𝑙𝑎𝑎𝑙𝑙 ,�𝑎𝑝𝑡 + 𝑏𝑝 − 𝐶𝑙𝑙𝑙𝑛�(𝑣2 + 𝑏2𝑡),
0 ≤ 𝑡 ≤ 𝑡𝑙𝑔𝑖𝑙𝑙 ,𝛼𝑙𝑔𝑖𝑙𝑙 > 0, 𝛽𝑙𝑔𝑖𝑙𝑙 > 1 𝑡𝑙𝑔𝑖𝑙𝑙 < 𝑡 ≤ 𝑡2, 𝑏2 > 0, 𝑣2 = 𝑣1 + (𝑏1 − 𝑏2)𝑡1
(𝑎𝑝𝑡 + 𝑏𝑝 − 𝐶𝑙𝑙𝑙𝑛)𝑣3, 𝑡2 ≤ 𝑡 ≤ 𝑡3, 𝑣3 = 𝑣2 + 𝑏2𝑡2 (𝑎𝑝𝑡 + 𝑏𝑝 − 𝐶𝑙𝑙𝑙𝑛)(𝑣4 − 𝑏4𝑡), 𝑡3 ≤ 𝑡 ≤ 𝑇, 𝑏4 > 0, 𝑣4 = 𝑣3 + 𝑏4𝑡3
(19)
𝑇𝑟𝐻𝑃𝑖𝑡(𝑡)mixed =
⎩⎪⎨
⎪⎧𝑎𝑝𝑡.𝛼𝑙𝑔𝑖𝑙𝑙𝑡
𝛽𝑙𝑎𝑎𝑙𝑙 + 𝑏𝑝.𝛼𝑙𝑔𝑖𝑙𝑙𝑡𝛽𝑙𝑎𝑎𝑙𝑙 − 𝐶𝑙𝑔𝑖𝑙𝑙 .𝛼𝑙𝑔𝑖𝑙𝑙𝑡𝛽𝑙𝑎𝑎𝑙𝑙
𝑣2𝑎𝑝𝑡 + 𝑣2𝑏𝑝 − 𝑣2𝐶𝑙𝑙𝑙𝑛 + 𝑏2𝑡�𝑎𝑝𝑡 + 𝑏𝑝 − 𝐶𝑙𝑙𝑙𝑛�
𝑣3𝑎𝑝𝑡 + 𝑣3𝑏𝑝 − 𝑣3𝐶𝑙𝑙𝑙𝑛 𝑣4𝑎𝑝𝑡 + 𝑣4𝑏𝑝 − 𝑣4𝐶𝑙𝑙𝑙𝑛 − 𝑏4𝑡 (𝑎𝑝𝑡 + 𝑏𝑝 − 𝐶𝑙𝑙𝑙𝑛)
(20)

Chapter Seven Lifecycle Profitability Comparison
160
The total lifecycle profit using this system (𝑇𝑇𝑚𝑖𝑥𝑙𝑑) can be calculated using the following
equations:
𝑇𝑇𝑚𝑖𝑥𝑙𝑑 = ∫ �𝑎𝑝𝛼𝑙𝑔𝑖𝑙𝑙𝑡𝛽𝑙𝑎𝑎𝑙𝑙+1 + �𝑏𝑝𝛼𝑙𝑔𝑖𝑙𝑙 − 𝐶𝑙𝑔𝑖𝑙𝑙𝛼𝑙𝑔𝑖𝑙𝑙�𝑡𝛽𝑙𝑎𝑎𝑙𝑙�𝑑𝑡𝑡𝑙𝑎𝑎𝑙𝑙0 + ∫ ��𝑣2𝑎𝑝 +𝑡2
𝑡𝑙𝑎𝑎𝑙𝑙
𝑏2𝑏𝑝 − 𝑏2𝐶𝑙𝑒𝑎𝑎�𝑡 + 𝑣2𝑏𝑝 − 𝑣2𝐶𝑙𝑒𝑎𝑎 + 𝑏2𝑎𝑝𝑡2� 𝑑𝑡 + ∫ �𝑣3𝑎𝑝𝑡 + 𝑣3𝑏𝑝 − 𝑣3𝐶𝑙𝑒𝑎𝑎�𝑑𝑡𝑡3𝑡2
+
∫ ��𝑣4𝑎𝑝 − 𝑏4𝑏𝑝 + 𝑏4𝐶𝑙𝑒𝑎𝑎�𝑡 + 𝑣4𝑏𝑝 − 𝑣4𝐶𝑙𝑒𝑎𝑎 − 𝑏4𝑎𝑝𝑡2� 𝑑𝑡𝑇𝑡3
(21)
𝑇𝑇mixed =𝑙𝑝𝛼𝑙𝑎𝑎𝑙𝑙𝑡𝑙𝑎𝑎𝑙𝑙
𝛽𝑙𝑎𝑎𝑙𝑙+2
𝛽𝑙𝑎𝑎𝑙𝑙+2+
�𝑏𝑝𝛼𝑙𝑎𝑎𝑙𝑙−𝐶𝑙𝑎𝑎𝑙𝑙𝛼𝑙𝑎𝑎𝑙𝑙�𝑡𝑙𝑎𝑎𝑙𝑙𝛽𝑙𝑎𝑎𝑙𝑙+1
𝛽𝑙𝑎𝑎𝑙𝑙+1+ �𝑣2𝑙𝑝+𝑏2𝑏𝑝−𝑏2𝐶𝑙𝑒𝑎𝑎−𝑣3𝑙𝑝�𝑡22
2+
�𝑣2𝑏𝑝 − 𝑣2𝐶𝑙𝑒𝑎𝑎 − 𝑣3𝑏𝑝 + 𝑣3𝐶𝑙𝑒𝑎𝑎�𝑡2 + 𝑏2𝑙𝑝𝑡23
3−
�𝑣2𝑙𝑝+𝑏2𝑏𝑝−𝑏2𝐶𝑙𝑒𝑎𝑎�𝑡𝑙𝑎𝑎𝑙𝑙+12
2− �𝑣2𝑏𝑝 −
𝑣2𝐶𝑙𝑒𝑎𝑎�𝑡𝑙𝑔𝑖𝑙𝑙+1 −𝑏2𝑙𝑝𝑡𝑙𝑎𝑎𝑙𝑙+13
3+ �𝑣3𝑙𝑝
2− 𝑣4𝑎𝑝 + 𝑏4𝑏𝑝 − 𝑏4𝐶𝑙𝑒𝑎𝑎� 𝑡32 + �𝑣3𝑏𝑝 − 𝑣3𝐶𝑙𝑒𝑎𝑎 −
𝑣4𝑏𝑝 + 𝑣4𝐶𝑙𝑒𝑎𝑎�𝑡3 + �𝑣4𝑎𝑝 − 𝑏4𝑏𝑝 + 𝑏4𝐶𝑙𝑒𝑎𝑎�𝑇2 + �𝑣4𝑏𝑝 − 𝑣4𝐶𝑙𝑒𝑎𝑎�𝑇 −𝑏4𝑙𝑝𝑇3
3+ 𝑏4𝑙𝑝𝑡33
3 (22)
7.4. Comparison and Analysis The aim of comparing different systems was not to reach a stable conclusion regarding which
system is better. Rather, the magnitude of enhancement in the total lifecycle profitability
produced using the mixed system under certain conditions was evaluated. The amount of
enhancement provides an insight into the feasibility of investing resources in such a system.
Different scenarios were compared using the following parameters:
• The introduction stage constitutes 20% of the total lifecycle.
• The growth stage constitutes 25% of the lifecycle.
• 30% of the lifecycle is consumed by the maturity stage.
• The decline stage lasts for 25% of the lifecycle length.
• The lifecycle length is given the value 100.
• The time required for the production system to reach the actual demand levels using
the agile system is 15% less than in the case of using the lean system with 𝑡𝑙𝑔𝑖𝑙𝑙 =
35 𝑎𝑎𝑑 𝑡𝑙𝑙𝑙𝑛 = 50.
• The cost saving using the lean system is as much as 20% with
𝐶𝑙𝑙𝑙𝑛 = 2.5 𝑎𝑎𝑑 𝐶𝑙𝑔𝑖𝑙𝑙 = 3.

Chapter Seven Lifecycle Profitability Comparison
161
• Other parameters were proposed as follows: 𝑣1 = 10, 𝑏1 = 0.1, 𝛽𝑙𝑙𝑙𝑛 = 1.1,
𝛽𝑙𝑔𝑖𝑙𝑙 𝑖𝑠 1% ℎ𝑖𝑖ℎ𝑒𝑟 𝑡ℎ𝑎𝑎 𝛽𝑙𝑙𝑙𝑛.
Figure 7.6 represents the results obtained from comparing the cumulative lifecycle
profitability for all the scenarios. Except for the proposed mixed system, the lean system will
produce higher lifecycle profitability. However, around 4.046% of the total profit increase can
be achieved using the mixed system. This percentage will increase as the lifecycle is
shortened, the agility is enhanced, the initial price is increased, the product contribution is
increased, or the leanness performance is decreased. Based on this level of enhancement, the
evaluation of the investment decision will be more reliable.
Figure 7.6: Cumulative profitability scenarios’ comparison
Chapter Eight Conclusions, Discussions, and Recommendations
162
CHAPTER 8
CONCLUSIONS, DISCUSSION, AND
RECOMMENDATIONS
8.1. Introduction In section 8.2 in this chapter, the final conclusions that integrate various research issues are
presented, answers to the research questions are provided, and the attainment of the stated
research objectives is evaluated. In addition, a discussion of the major points that manifest the
contributions and additions of the research, as well as a comparison of the current research’s
findings and conclusions with similar research’s findings, is presented in section 8.3.
Comparing the results of similar research conducted in different environments or using
different methodologies helps to explain possible variations and raises further research points.
The limitations of the research are discussed in section 8.4, with an attempt to self-
criticize and evaluate the research quality and shed light on the mistakes made during the
research to avoid similar procedures in subsequent research in this field. Finally, section 8.5
provides recommendations for researchers and practitioners to maximize the potential to
benefit from the research’s findings.

Chapter Eight Conclusions, Discussions, and Recommendations
163
8.2. Conclusions Researchers have agreed on the urgent need for empirical research on production ramp-up.
Berg and Säfesten (2006) indicated the importance of considering the critical factors affecting
production ramp-up in developing a comprehensive framework for ramp-up management.
The scarcity of empirical research extends to the lean and agile logistics literature as well.
Furthermore, Bowersox et al. (1999) mentioned that integrating logistics into the new product
development process has not been considered in the logistics literature.
While the type of the relationship between ramp-up performance and logistics – as a
general concept – has been determined and researched previously, the paradigms of lean and
agile logistics have barely been touched. In addition, the relative magnitude of the effect that a
specific logistics activity has on the ramp-up performance indicators provided in this research
could be of particular importance for decision making. Under the constraints of limited
resources that exist in almost every enterprise, the resources should be directed toward
enhancing the processes that are likely to lead to the most preferable results. In this direction,
the current research’s results provide guidelines for the decision maker regarding which
logistical tool to employ and in which activity to invest. For example, the statistical analysis
revealed that WIP inventory and RM transportation are of special importance for ramp-up
cost performance and that supplier collaboration is more relevant to ramp-up problems with
machine and information flow sources.
Both lean and agile logistics were proved to have a statistically significant effect on
the production performance during the ramp-up phase. A detailed analysis of each single
measure’s effect on the time and cost performance indicators led to the proposal that higher
levels of logistics agility are required during the ramp-up phase, during which time reduction
is the most important determinant of performance, and more logistical leanness is demanded
during the steady-state and ramp-down production phases, in which cost reduction might play
a critical role in the survival of the product. Switching from agile to lean (and sometimes
backward) during different stages of the product lifecycle might enhance the overall lifecycle
performance, success, and profitability.
While the theoretical literature has provided a sort of support for such a proposition,
further validation was needed. Different scenarios were built to calculate the cumulative profit
during the entire product lifecycle. The lean, agile, leagile, and mixed models were compared
with each other. The results show that using a mixed model that switches between lean and
agile paradigms produces the highest lifecycle profits. The use of this comparison, however,
is subject to many factors, including the length of the product lifecycle, the price, the cost, the

Chapter Eight Conclusions, Discussions, and Recommendations
164
type of demand, the success of the product, and the length of each lifecycle stage, among
other factors.
The applicability of the proposed model requires multifaceted research and analysis,
since the logistics system cannot be separated from other divisions and activities, for which
the proposed system might or might not be suitable. This preliminary model also requires
further testing through multiple-case research in different environments and settings. As
explained by Naim et al. (2010), exploratory research that constitutes the initial step in
examining the validity and credibility of a model requires more research efforts to be
validated and enhanced.
8.3. Discussion In this section, some aspects of the research structure, steps, and procedures are
supplementarily explained and discussed and the results are compared with the results of
similar research to enhance their validity and to explain the variations appearing between
current and future research.
8.3.1. Research Structure Further explanation of some debatable points might be helpful for providing further support
for the current research and potential guidelines for future research. Such points include the
research stimulus, the variables investigated, the formulation and usability of the
measurement tool, and the analytical tools utilized.
Research Variable Issues While this research considered logistics activities for a focal company, two levels of
integration (figure 8.1) should be considered: the internal integration with other organizational
functions and the external integration through considering the entire supply chain. Logistical
processes should be viewed in light of the overall strategy and logistics should be employed
to support the achievement of the aggregate objectives of the company and of the supply
chain. Jones et al. (1997) indicated that an attempt to optimize each part of the supply chain
separately does not provide the optimal cost solution. They stressed the need to look at the
sequence of activities, from the raw materials to the final customer.
A great deal of debate has taken place around the classification of many activities as
being logistics or operations. Investigating the role of some logistics activities might seem –

Chapter Eight Conclusions, Discussions, and Recommendations
165
to many researchers – like studying the effect of operation activities on operation
performance. However, this overlapping is more apparent in the case of intra logistics than in
the cases of inbound and – certainly – outbound logistics. However, considering a certain
practice and techniques such as lean and agile tools might be more rational. Even concerning
operations themselves, studying the role of lean manufacturing practices, for example, in the
operational performance is highly acceptable.
The lean approach aims to eliminate waste resulting from no-value-added activities.
This is related more to logistics than to production, since it is difficult to identify a
manufacturing activity that adds no value to the product. In addition, many researchers have
mentioned logistics activities as cost centres that add no value. Therefore, lean logistics
actually represents the most crucial part of the lean manufacturing concept.
Figure 8.1: Model integration at the organizational and supply chain levels
Measurement Tool The use of the three items of quantity, quality, and cost was sufficiently comprehensive and
consistent with the general body of literature. The three dimensions of duration, which was
measured by the quantity variable in the current research, quality, and cost accounted for most
research efforts. Matta (2007) indicated that most research in the ramp-up field has
concentrated on managing the ramp-up phase through investigating the factors affecting
ramp-up’s duration and its related costs or investigating issues related to reducing the duration
through speeding up the enhancement of product quality. Witt (2006) used a similar approach
to measure the outputs of the new product launch phase through time, cost, and quality
dimensions.
Logistics Activities
Other Organizational Functions
Supply Chain

Chapter Eight Conclusions, Discussions, and Recommendations
166
While the ramp-up performance measurement tool used aims mainly to support the
current research purposes, it can be modified to measure the ramp-up performance in a
particular company. However, since the measurement method developed ignored adaptability
issues, which are considered to be important for a successful measurement system (Ghalayini
and Noble, 1996), the use of the proposed tool by a certain company should be preceded by
adaptation to the company’s internal and external environment. In addition, due to frequent
target changes, the performance metrics should be periodically reviewed and updated
(Doltsinis et al., 2013). Medori and Steeple (2000) proposed a framework for the auditing and
updating of performance metrics.
Some variables were measured through questions that compared the ramp-up process
with the steady-state production. Sometimes poor performance is not attributed to the special
characteristics of the ramp-up process, but rather to factors that continue even after the ramp-
up’s end. Therefore, comparing some indicators and measuring them relative to the steady-
state production might be helpful in analysing and understanding the study’s results. Such a
direction has been supported in the literature. Langowitz (1988), for example, measured
output, quality, and delivery target achievement for both the new product and the existing
product to clarify the deviation of the performance during the new product’s initial
manufacturing process.
Sampling The focus on strictly defining the research population and sample arose from the desire to
affirm that the sample is a representative one and that the results can be generalized to the
entire population. However, this is not the exact case of the current research due to the
numerous factors that make every system a unique one.
8.3.2. Results’ Comparison The effect of lean and/or agile logistics on ramp-up performance has never been empirically
investigated. However, Bowersox et al. (1999) contributed a theoretical framework utilizing
the ‘effect-based’ logistics – pull approach – for a lean product launch strategy. Pfohl and
Buse (2000) indicated the importance of accelerating the learning process to reduce the ramp-
up time. The authors concluded that the focus should be directed toward promoting the
transfer of logistics-related knowledge.
Motivated by the lack of information regarding the design of logistics during the new
product launch phase, Pfohl and Gareis (2000) studied the role of logistics, represented by the

Chapter Eight Conclusions, Discussions, and Recommendations
167
material flow and the logistics process, throughout the production run. The authors focused on
the problems occurring and the issues of coordination between logistics and other chains,
other phases, other projects, and other functions. They classified logistics into operative and
administrative activities. Data were collected from 13 companies (4 auto manufacturers, 7
auto suppliers, and 2 other firms from different sectors) through a questionnaire. Selected
results were presented because some questions were not answered.
Differing from what the literature has frequently reported, the researched sample
showed a moderate-to-high evaluation for ramp-up performance. Most of the research that
reported insufficient or unsatisfactory ramp-up performance concentrated on the auto
industry. The extremely high competition in this sector is reflected in higher targets and
specifications. Higher targets for the ramp-up phase should be reflected in the perception of
this phase’s outcomes. The potential negative effect of time-to-market on overall product
quality mentioned by Carrillo and Franza (2006) should be extended to time-to-volume as
well. However, the results of the statistical analysis showed a positive effect for both quantity
and cost performance on quality performance, if only the three constructs were considered
(see figure A.7 in appendix 3). If all the paths were considered, as in the model used to test
the subsidiary hypotheses, the relationships were insignificant, as shown figure A.8 in
appendix 3.
While some researchers have considered the switch from one process strategy to
another during the product lifecycle, such a switch will not take place if a high level of
uncertainty regarding product success or failure exists (Ramasesh et al., 2010). However, the
proposed application method of using special and separate ramp-up and steady-state facilities
might enhance this switching ability even with higher levels of uncertainty.
8.4. Limitations The scarcity of research on ramp-up and – to a lesser extent – on lean and agile logistics, in
addition to the preliminary nature of the proposed model of switching between the lean and
agile paradigms, imposed some limitations on the current research.
Logistics in this research refers to the process of managing the two-directional
movement and storage activities of inventory and related information and funds. Only one
direction of inventory and information was considered in this research. Logistics, however,
includes the reverse flow of inventory and information as well. Nonetheless, collecting data
on backward logistics flows as well requires contributions from different entities, and perhaps
different organizations, which might greatly complicate the data collection process and reduce

Chapter Eight Conclusions, Discussions, and Recommendations
168
the response rate dramatically. In addition, the consideration of information flows was limited
to a few measures in the questionnaire. The funds flow was not investigated due to the
reasons previously mentioned (section 2.2.2).
In addition, the management process mentioned in the definition includes the activities
of planning, organizing, leading, and controlling. These components were not thoroughly
distinguished and investigated. A greater focus on implementation dominated the research.
However, the attempt to focus on implementation activities rather than on planning, leading,
organizing, and controlling activities can be noted in the operation management literature.
Furthermore, multidimensional-focused research investigating more than one managerial
dimension is lacking.
While this research intensively utilized flexibility measures to capture levels of agility,
some authors (e.g. Vokurka and Fliedner, 1998; Zhang and Sharifi, 2000) have argued that
flexibility is only one component of agility along with other components, such as cost,
quality, and dependability. Elkins et al. (2004) distinguished between agile and flexible
manufacturing systems in the automotive industry.
The use of the frequency of occurrence of some ramp-up problems was not
sufficiently representative of the severity of the problem. For example, a mismatch between
the product design and the production process might occur only once for one ramp-up process
but can hinder the entire ramp-up process. Repair, rework, and scrap costs were used to
measure cost performance during production ramp-up; the reduction of these costs is one of
the main goals of lean manufacturing practices. Therefore, these costs can be used to measure
ramp-up and leanness levels alike.
The different levels of performance measurement proposed by many authors were not
considered in the current research. Merchant (1961), Peklenik (1971), and Wiendahl Lutz
(2002) supported the division of performance measurement into five levels that cover
machine, cell, line, factory, and network. This five-level approach was employed by Hon
(2005). The inclusion of all these levels requires a prolonged questionnaire that might
substantially reduce the response rate. However, case studies – rather than survey research –
are more suitable for investigating different levels of production performance.
The model, which proposed to employ lean and agile logistics during different
production phases, was based on exploring the effects of leanness and agility on performance
indicators during production ramp-up only. The results might vary if the performance
indicators during the steady-state or ramp-down phases were included in the analysis. More
comprehensive research efforts are required to verify the model proposed. In addition, the

Chapter Eight Conclusions, Discussions, and Recommendations
169
conventional models – which employ strategies other than lean, agile, or leagile strategies –
were not included in the comparison.
8.5. Recommendations The results and conclusions of this research should be reflected in particular contributions to
the field investigated. Specific guidance and directions are introduced for both researchers and
practitioners in the following two sections.
8.5.1. Recommendations for Researchers Using the case study methodology to provide verification for the proposed model is worthy of
consideration. Flynn et al. (1990) mentioned the importance of using multiple cases to verify
theories. Koufteros (1999) indicated that exploratory studies’ results serve as stepping stones
for further analysis using confirmatory approaches. In addition, more investigation is required
to explore the possible impact of the switching between lean and agile logistics on other
functions in the manufacturing facility and on other partners in the supply chain. A need for
survey research in the field of production ramp-up could be easily identified. Rungtusanatham
et al. (2003) mentioned the general direction in the OPM literature toward conducting more
survey research instead of the traditionally followed modelling-based approach that utilizes
optimization or simulation methodologies. Furthermore, in the current research, only a single-
product case was considered. The analysis of production systems with multi-product cases is
an important field of research.
Outbound logistics takes place after the completion of the production process.
Therefore, it is beyond the scope of this research. However, outbound logistics of the
suppliers might affect production ramp-up. Furthermore, suppliers’ level of leanness or agility
could be indicative, but including this requires a closer view of operations and a multi-
organizational analysis, thus necessitating different data collection and analysis tools, which
constitute another worthy research point.
In addition, production ramp-up’s pace, resulting quality, and costs can be researched
as an independent variable contributing to the prediction of outbound logistics’ performance.
Studying this mediating role might be helpful in enhancing certain aspects of customer
service, taking into consideration the major importance of distribution management for
customer service and satisfaction. The developed measurement tool of ramp-up performance
might be utilized for this purpose.
Chapter Eight Conclusions, Discussions, and Recommendations
170
One problem in measuring the study variable was the overlapping between research
variables. For example, ramp-up performance was measured through time-related variables,
and high performance leads to reduced time-to-volume; however, the ability to reduce the
manufacturing lead time was used by Merschmann and Thonemann (2011) to measure the
supply chain flexibility. Additionally, setup time reduction will definitely contribute to ramp-
up time reduction, but it has also frequently been considered as a lean tool (White et al., 1999;
Cua et al., 2001; Ahmad et al., 2003; Li et al., 2005; Shah and Ward, 2007). Furthermore, the
ability to launch new or revised products has been considered, by some authors (e.g. Duclos et
al., 2003; Elkins et al., 2004), as an indicator of agility. Therefore, for researchers who
consider ramp-up as part of the new product development process, the entire process
performance indicating the agility levels of the system, organization, or the supply chain
should be considered. In addition, Helo (2004) mentioned product mix flexibility as an
indicator of agility and referred to the ability to change the expected lifecycle of a certain
product; this also leads to the consideration of production ramp-up as part of building product
mix flexibility.
Moving the production process from the ramp-up facility to the steady-state facility
will require another ramp-up phase within the steady-state facility; this ‘second ramp-up
phase’ requires more investigation and analysis.
8.5.2. Recommendations for Practitioners The measurement tool used was designed to be general and applicable to multiple
organizations operating in different environments. However, the design and implementation
of a performance measurement system in a certain facility should be based on strategy
(Goold, 1991; Kaplan and Norton, 1992; Bourne et al., 2000). Therefore, practitioners have to
take into account the adaptation of the measurement tool to the specific strategy and
environment of their organization. While the formation of the measurement tool considered
common parameters and activities practised by almost every manufacturing company, a more
detailed and company-specific tool might offer further advantages.
The following points can summarize the recommendations for practitioners regarding
the data analysis results:
• Lean logistics is recommended when quality or cost performance has the highest
priority or when all the performance indicators are equally important.
• Agile logistics is recommended as the importance of quantity performance
enhancement increases.

Chapter Eight Conclusions, Discussions, and Recommendations
171
• A mixed system, which switches from agility to leanness, should be evaluated
according to different dimensions, including the product type, price, cost, contribution,
demand, competition, industry, and environment.
• Multi-product cases and, hence, multi-ramp-ups should be considered in evaluating
the feasibility of the mixed system proposed.

172
REFERENCES

References
173
References
A Aarikka-Stenroos, L. and Sandberg, B. (2012). From new-product development to
commercialization through networks. Journal of Business Research, vol. 65/2, pp. 198-206
Abernathy, W. and Baloff, N. (1973). A methodology for planning new product start-ups. Decision Sciences, vol. 4/1, pp. 1-20
Adler, P. and Clark, K. (1991). Behind the learning curve: a sketch of the learning process. Management Science. vol. 37/3, pp. 267-281
Agarwal, A., Shankar, R. and Tiwari, M. (2006). Modeling the metrics of lean, agile and leagile supply chain: an ANP-based approach. European Journal of Operational Research, vol. 173, pp. 211-225
Ahmad, S., Schroeder, R. and Sinha, K. (2003). The role of infrastructure practices in the effectiveness of JIT practices: implication for plant competitiveness. Journal of Engineering Technology Management, vol. 20/3, pp. 161-191
Aitken, J., Christopher, M. and Towill, D. (2002). Understanding, implementing and exploiting agility and leanness. International Journal of Logistics: Research and Applications, vol.5/1, pp. 59-74
Akyuz, G. and Erkan, T. (2010). Supply chain performance measurement: a literature review. International Journal of Production Research, vol. 48/17, pp. 5137-5155
Alderton, P. (1999). Port management and operations. 1st Edition, Lloyds of London Press, London
Almgren, H. (1999a). Start-up of advanced manufacturing system - a case study. Integrated Manufacturing Systems, vol. 10/3, pp. 126-35
Almgren, H. (1999b). Towards a framework for analyzing efficiency during start-up: an empirical investigation of a Swedish auto manufacturer. International Journal of Production Economics, vol. 60/61, pp. 79-86
Almgren, H. (1999c). Pilot production and manufacturing startup in the automotive industry principles for improved performance. Ph.D. Thesis, Chalmers University of Technology, Sweden
Almgren, H. (2000). Pilot production and manufacturing start-up: the case of Volvo S80. International Journal of Production Research, vol. 38/17, pp. 4577-4588
Apilo, T. (2003). New product introduction in the electronics industry. The 17th International Conference on Production Research, Blacksburg, USA
Asiedu, Y. and Gu, P. (1998). Product lifecycle cost analysis: state of the art review. International Journal of Production Research, vol. 36/4, pp. 883-908

References
174
Atkinson, R. (1999). Project management: cost, time and quality, two best guesses and a phenomenon, its time to accept other success criteria. International Journal of Project Management, vol. 17/6, pp. 337-342
Audretsch, D. (1991). New-firm survival and the technological regime. The Review of Economics and Statistics, vol. 73/3, pp. 441-450
B Ba, S. and Johansson, W. (2008). An exploratory study of the impact of e‐service process on
online customer satisfaction. Production and Operations Management, vol. 17/1, pp. 107-119
Babbie, E. (1990). Survey research methods. 2nd Edition, Wadsworth, Cengage Learning, Belmont, CA
Bagozzi, R.and Yi, Y. (1988). On the evaluation of structural equation models. Journal of the Academy of Marketing Science, vol. 16/1, pp. 74-94
Ball, P., Roberts, S., Natalicchio, A. and Scorzafave, C. (2011). Modelling production ramp-up of engineering products. Journal of Engineering Manufacture, vol. 225/6, pp. 959-971
Baloff, N. (1966). Startups in machine-intensive production systems. Journal of Industrial Engineering, vol. 17/1, pp. 25-32
Barahona, F., Ettl, M., Petrik, M. and Rimshnick, P. (2013). Agile logistics simulation and optimization for managing disaster responses. The 2013 Winter Simulation Conference: Simulation: Making Decisions in a Complex World, IEEE Press, pp. 3340-3351
Bardi, E., Coyle, J. and Novack, R. (2006). Management of transportation. Thomson/South-Western
Barhak, J., Djurdjanovic, D., Spicer, P. and Katz, R. (2005). Integration of reconfigurable inspection with stream of variations methodology. International Journal of Machine Tools and Manufacture, vol. 45/4, 407-419
Baron, R. and Kenny, D. (1986). The moderator-mediator variable distinction in social psychological research: conceptual, strategic, and statistical considerations. Journal of Personality and Social Psychology, vol. 51/6, pp. 1173-1182
Barratt, M. (2004). Understanding the meaning of collaboration in the supply chain. Supply Chain Management: An International Journal, vol. 9/1, pp. 30-42
Barratt, M., Choi, T. and Li, M. (2011). Qualitative case studies in operations management: trends, research outcomes, and future research implications. Journal of Operations Management, vol. 29/4, pp. 329-342
Basse, I., Sauer, A. and Schmitt, R. (2014b). Scalable ramp-up of hybrid manufacturing systems. The 2nd International Conference on Ramp-Up Management, Aachen, Germany

References
175
Basse, I., Schmitt, S., Gartzen, T. and Schmitt, R. (2014a). Solution principles for managing instabilities in ramp-up. The 2nd International Conference on Ramp-Up Management, Aachen, Germany
Bassetto, S., Fiegenwald, V., Cholez, C. and Mangione, F. (2011). Experiencing production ramp-up education for engineers. European Journal of Engineering Education, vol. 36/4, pp. 313-326
Baudin, M. (2004). Lean logistics - the nuts and bolts of delivering materials and goods. Productivity Press, New York, New York
Beamon, B. (1999). Measuring supply chain performance. International Journal of Operations and Production Management, vol. 19/3, pp. 275-292
Benton, W. and Shin, H. (1998). Manufacturing planning and control: The evolution of MRP and JIT integration. European Journal of Operational Research, vol. 110/3, pp. 411-440
Berg, M. and Säfesten, K. (2006). Managing production ramp-up: requirement on strategy content. Production and Operation Management Society 2006 International Conference, Shanghai, China
Billington, C., Lee, H. and Tang, C. (2012). Successful strategies for product rollovers. Sloan Management Review, vol. 39/3
Bischoff, R. (2007). Anlaufmanagement: Schnittstelle zwischen Projekt und Serie. HTWG Konstanz (in German)
Black, S. and Porter, L. (1996). Identification of the critical factors of TQM. Decision Sciences, vol. 27/1, pp. 1-21
Blum, M., Runge, S., Groten, M. and Stiller, S. (2014). Interrelationships between product quality and different demand cases in ramp-up scenarios. The 2nd International Conference on Ramp-Up Management, Aachen, Germany
Bohn, R. and Terwiesch, C. (1999). The economics of yield-driven processes. Journal of Operations Management, vol. 18/1, pp. 41-59
Bourne, M., Mills, J., Wilcox, M., Neely, A. and Platts, K. (2000). Designing, implementing and updating performance measurement systems. International Journal of Operations and Production Management, vol. 20/7, pp. 754-771
Bowersox, D., Stank, T. and Daugherty, P. (1999). Lean launch: managing product introduction risk through response-based logistics. Journal of Product Innovation Management, vol. 16, pp. 557-568
Brar, G. and Saini, G. (2011). Milk run logistics: literature review and directions. The International Association of Engineers 2011 World Congress on Engineering Conference, pp. 6-8
Bruce, M., Daly, L. and Towers, N. (2004). Lean or agile: a solution for supply chain management in the textiles and clothing industry?. International Journal of Operations and Production Management, vol. 24/2, pp. 151-170
Bryman, A. and Cramer, D.,(1997). Quantitative data analysis with SPSS for Windows. Routledge, London and New York

References
176
Buescher, C., Hauck, E., Schilberg, D. and Jeschke, S. (2012). Key performance indicators for the impact of cognitive assembly planning on ramp-up process. Hindawi Publishing Corporation, Advances in Decision Sciences
Burmer, C. and Görlisch, S. (2006). Failure analyses for debug and ramp-up of modern IC’s. Microelectronics Reliability, vol. 46, pp. 1486-1497
C Calvo-Mora, A., Picón, A., Ruiz, C. and Cauzo, L. (2013). The relationships between soft-
hard TQM factors and key business results. International Journal of Operations and Production Management, vol. 34/1, pp. 115-143
Cantamessa, M. and Valentini, C. (2000). Planning and managing manufacturing capacity when demand is subject to diffusion effects. International Journal of Production Economics, vol. 66, pp. 227-240
Caplice, C. and Sheffi, Y. (1995). A review and evaluation of logistics performance measurement systems. International Journal of Logistics Management, vol. 6/1, pp. 61-74
Carlson, J. and Yao, A. (2008). Simulating an agile, synchronized manufacturing system. International Journal of Production Economics, vol. 112/2, pp. 714-722
Carrillo, J. and Franza, R. (2006). Investing in product development and production capabilities: the crucial linkage between time-to-market and ramp-up time. European Journal of Operational Research, vol. 171, pp. 536-556
Carrillo, J. and Gaimon, C. (2000). Improving manufacturing performance through process change and knowledge creation. Management Science, vol. 46/2, pp. 265-288
Carvalho, H. and Azevedo, S. (2014). Trade-offs among lean, agile, resilient and green paradigms in supply chain management: a case study approach. The 7th International Conference on Management Science and Engineering Management, Philadelphia, Pennsylvania, USA
Cedergren, S., Wall, A. and Norström, C. (2010). Evaluation of performance in a product development context. Business Horizons, vol. 53, pp. 359-369
Ceglarek, D., Huang, W., Zhou, S., Ding, Y., Kumar, R. and Zhou, Y. (2004). Time based competition in multistage manufacturing: stream-of-variation analysis (SOVA) methodology—review. International Journal of Flexible Manufacturing Systems, vol. 16/1, pp. 11-44
Chan, J., Samson, D. and Sohal, A. (1990). An integrative model of Japanese manufacturing techniques. International Journal of Operations and Production Management, vol. 10/9, pp. 37-56
Chang, P. and Chang, C. (2003). A stage characteristic—preserving product lifecycle modeling. Mathematical and Computer Modelling, vol. 37/12, pp. 1259-1269

References
177
Chang, Y. and Chen, C. (2014). Prioritizing 5S activities by Kano model with modified CS coefficient for a semiconductor wafer fabrication during ramp-up stage. The TQM Journal, vol. 26/2, pp. 109-124
Chatzimichali, A. and Tourassis, V. (2008). Towards a learning curve theory for batch production. The IEEE International Conference on Industrial Engineering and Engineering Management, Singapore
Chen, I. (2001). Rapid response manufacturing through a rapidly reconfigurable robotic workcell. Robotics and Computer-Integrated Manufacturing, vol. 17/3, pp. 199-213
Chen, T., Wang, Y. and Tsai, H. (2009). Lot cycle time prediction in a ramping-up semiconductor manufacturing factory with a SOM-FBPN-ensemble approach with multiple buckets and partial normalization. The International Journal of Advanced Manufacturing Technology, vol. 42, pp. 1206-1216
Chenhall, R. (1997). Reliance on manufacturing performance measures, total quality management and organizational performance. Management Accounting Research, vol. 8/2, pp.187-206
Chiarini, A. (2014),Sustainable manufacturing-greening processes using specific lean production tools: an empirical observation from European motorcycle component manufacturers. Journal of Cleaner Production, vol. 85, pp. 226-233
Chow, G., Heaver, T. and Henriksson, L. (1994). Logistics performance: definition and measurement. International Journal of Physical Distribution and Logistics Management, vol. 24/1, pp. 17-28
Christopher, M. (2000). The agile supply chain: competing in volatile markets. Industrial Marketing Management, vol. 29/1, pp. 37-44
Christopher, M. (2011). Logistics and supply chain management, Pearson, UK
Christopher, M. and Peck, H. (2004). Building the resilient supply chain. The International Journal of Logistics Management, vol. 15/2, pp. 1-14
Christopher, M. and Towill, D. (2000). Supply chain migration from lean to agile and customized. Supply Chain Management, vol. 5/4, pp. 206-213
Christopher, M. and Towill, D. (2001). An integrated model for the design of agile supply chains. International Journal of Physical Distribution and Logistics Management, vol. 31/4, pp. 235-246
Chuu, S. (2011). Interactive group decision-making using a fuzzy linguistic approach for evaluating the flexibility in a supply chain. European Journal of Operational Research, vol. 213, pp. 279-289
Clark, K. and Fujimoto, T. (1991). Product Development Performance: Strategy, Organization, and Management in the World Automotive Industry. Boston, MA: Harvard Business School Press
Clawson, R. (1985). Controlling the manufacturing start-up. Harvard Business Review, vol. 63/3, pp. 6-20
References
178
Clottey, T. and Benton, W. (2013). Guidelines for improving the power values of statistical tests for nonresponse bias assessment in OM research. Decision Sciences, vol. 44/4, pp. 797-812
Cook, C., Heath, F. and Thompson, R. (2000). A meta-analysis of response rates in web-or internet-based surveys. Educational and Psychological Measurement, vol. 60/6, pp. 821-836
Cooper, M. (1993a). International supply chain management: implications for the bottom line. The Society of Logistics Engineers Conference, Hyattsville, MD
Cooper, M. and Ellram, L. (1993). Characteristics of supply chain management and the implications for purchasing and logistics strategy. International Journal of Logistics Management, vol. 4/2, pp. 13-24
Cooper, M., Douglas M. and Janus D. (1997). Supply chain management: more than a new name for logistics. International Journal of Logistics Management, vol. 8/1, pp. 1-14
Cooper, R. (1993b). Winning at new products - accelerating the process from idea to launch. Perseus Books, Cambridge, MA
Cooper, R. and Kleinschmidt, E. (1987). New products: what separates winners from losers?. Journal of Product Innovation Management, 4/3, pp. 169-184
Craighead, C., Ketchen, D., Dunn, K. and Hult, G. (2011). Addressing common method variance: guidelines for survey research on information technology, operations, and supply chain management. Engineering Management, IEEE Transactions, vol. 58/3, pp. 578-588
Crawford, C. and Di Benedetto, C. (2001). New products management. 10th Edition, McGrow-Hill
Crocitto, M. and Youssef, M. (2003). The human side of organizational agility. Industrial Management and Data Systems, vol. 103/6, pp. 388-397
CSCMP and Gibson, B., Hanna, J., Defee, C. and Chen, H. (2014). The definitive guide to integrated supply chain management: optimize the interaction between supply chain processes, tools, and technologies. Council of Supply Chain Management Professionals, Pearson Education Inc., Upper Saddle River, New Jersey
Cua, K., McKone, K. and Schroeder, R. (2001). Relationships between implementation of TQM, JIT, and TPM and manufacturing performance. Journal of Operations Management, vol. 19/2, pp. 675-694
D Da Silveira, G., Borenstein, D. and Fogliatto, F. (2001). Mass customization: Literature
review and research directions. International Journal of Production Economics, vol. 72, pp. 1-13
Dal Forno, A., Pereira, F., Forcellini, F. and Kipper, L. (2014). Value Stream Mapping: a study about the problems and challenges found in the literature from the past 15 years

References
179
about application of Lean tools. The International Journal of Advanced Manufacturing Technology, vol. 72/5-8, pp. 779-790
Damen, J. (1994). Flexible mail processing: an application of integral postal engineering. Ph.D. Thesis, Delft University of Technology, Netherlands
Damen, J. (2001). Service-controlled agile logistics. Logistics Information Management, vol. 14/3, pp. 185-195
De Beuckelaer, A. and Wagner, S. (2012). Small sample surveys: increasing rigor in supply chain management research. International Journal of Physical Distribution and Logistics Management, vol. 42/7, pp. 615-639
de Haan, J. and Yamamoto, M. (1999). Zero inventory management: facts or fiction? Lessons from Japan. International Journal of Production Economics, vol. 59, pp. 65-75
de Ron, A. (1995). Measure of manufacturing performance in advanced manufacturing systems. International Journal of Production Economics, vol. 41, pp. 147-160
De Toni, A. and Tonchia, S. (2001). Performance measurement systems: Models, characteristics and measures. International Journal of Operations and Production Management, vol. 21/1-2, pp. 46-70
Delaney, R. (1996). Seventh annual state of logistics report. Cass Information Systems, pp. 9-10
Demeter, K. and Matyusz, Z. (2011). The impact of lean practices on inventory turnover. International Journal of Production Economics, vol. 133/1, pp. 154-163
Di Benedetto, C. (1999). Identifying the key success factors in new product launch. Journal of Product Innovation Management, vol. 16, pp. 530-544
Diamantopoulos, A. and Winklhofer, H. (2001). Index construction with formative indicators: An alternative to scale development. Journal of marketing research, vol. 38/2, pp. 269-277
Diamantopoulos, A., Riefler, P. and Roth, K. (2008). Advancing formative measurement models. Journal of Business Research, vol. 61/12, pp. 1203-1218
Dillman, D., Smyth, J. and Christian, L. (2014). Internet, phone, mail, and mixed-mode surveys: the tailored design method. John Wiley and Sons
Dixon, J., Nanni, A. and Vollmann, T. (1990). The new performance challenge: measuring operations for world-class competition. Business One Irwin, Burr Ridge, Illinois
Dobrzykowski, D., Deilami, V., Hong, P. and Kim, S. (2014). A structured analysis of operations and supply chain management research in healthcare (1982-2011). International Journal of Production Economics, vol. 147, pp. 514-530
Doltsinis, S., Ferreira, P. and Lohse, N. (2014). An MDP model-based reinforcement learning approach for production station ramp-up optimization: Q-learning analysis. IEEE Transactions on Systems, Man, and Cybernetics: Systems, vol. 44/9, pp. 1125-1138
Doltsinis, S., Ratchev, S. and Lohse, N. (2013). A framework for performance measurement during production ramp-up of assembly stations. European Journal of Operational Research, vol. 229, pp. 85-94

References
180
Dombrowski U. and Hanke T. (2009). Lean Ramp-up: Ein Organisationsmodell für den effizienten Serienanlauf in KMU. Zeitschrift für wirtschaftlichen Fabrikbetrieb, vol. 104/10, pp. 877-883 (in German)
Dombrowski U. and Hanke T. (2011). Lean Ramp-up: Handlungs und Gestaltungsfelder, Von Anfang an die richtigen Dinge richtig tun. Zeitschrift für wirtschaftlichen Fabrikbetrieb vol. 106/5, pp. 332-336 (in German)
Dombrowski, U. and Hanke, T. (2009). Lean ramp-up. Ein Organisationsmodell für den effizienten Serienanlauf in KMU. Zeitschrift für wirtschaftlichen Fabrikbetrieb ZWF, vol. 104/10, pp. 877-883
Dombrowski, U. and Hanke, T. (2011). Lean ramp-up: Handlungs und Gestaltungsfelder. Von Anfang an die richtigen Dinge richtig tun. Zeitschrift für wirtschaftlichen Fabrikbetrieb ZWF, vol. 106/5, pp. 332-336
Donald, B., Closs, D. and Cooper, M. (2002). Supply chain logistics management. McGraw Hill, New York
Dow, D., Samson, D. and Ford, S. (1999). Exploding the myth: do all quality management practices contribute to superior quality performance?. Production and Operations Management, 8/1, pp. 1-27
Du, S., Xi, L., Ni, J., Ershun, P. and Liu, C. (2008). Product lifecycle-oriented quality and productivity improvement based on stream of variation methodology. Computers in Industry, vol. 59/2-3, pp. 180-192
Du, S., Yao, X. and Huang, D. (2015). Engineering model-based Bayesian monitoring of ramp-up phase of multistage manufacturing process. International Journal of Production Research, (ahead-of-print), 1-20
Duclos, L., Vokurka, R. and Lummus, R. (2003). A conceptual model of supply chain flexibility. Industrial Management and Data Systems, vol. 103/6, pp. 446-456
E Eisenhardt, K. and Brown, S. (1998). Time pacing: competing in markets that won’t stand
still. Harvard Business Review, Reprint No. 98202, March-April
Elbert, N. (2011). Auslaufmanagement in der Logistik: Untersuchung der Pfadabhängigkeit im Produktlebenszyklus am Beispiel der Automobilindustrie. Ph.D. Thesis, University of Pannonia, Hungary (in German)
Elkins, D., Huang, N. and Alden, J. (2004). Agile manufacturing systems in the automotive industry. International Journal of Production Economics, vol. 91/3, pp. 201-214
Elmaraghy, H. (2005). Flexible and reconfigurable manufacturing systems paradigms. International Journal of Flexible Manufacturing Systems, vol. 17/4, pp. 261-276
Elstner, S. and Krause, D. (2013). From product development to market introduction: a co-citation analysis in the field of ramp-up. The 19th International Conference on Engineering Design (ICED13), Design for Harmonies, Seoul

References
181
Elstner, S. and Krause, D. (2014). Methodical approach for consideration of ramp-up risks in the product development of complex products. The 2nd International Conference on Ramp-Up Management, Aachen, Germany
Enz, C., Peiró-Signes, Á. and Segarra-Oña, M., (2014). How fast do new hotels ramp up performance?. Cornell Hospitality Quarterly, vol. 55/2, pp. 141-151
Ernst, H. (2002). Success factors of new product development: a review of the empirical literature. International Journal of Management Reviews, vol. 4/1, pp. 1-40
Evers, J., Loeve, L. and Lindeijer, D. (2000). The service-oriented agile logistic control and engineering system: SERVICES. Logistics Information Management, vol. 13/2, pp. 77-90
F Fawcett, S. and Cooper, M. (1998). Logistics performance measurement and customer
success. Industrial Marketing Management, vol. 27, pp. 341-357
Ferdows, K. and Thurnheer, F. (2011). Building factory fitness. International Journal of Operations and Production Management, vol. 31/9, pp. 916-934
Field, A. (2013). Discovering statistics using IBM SPSS statistics. 4th Edition, SAGE Publications Ltd.
Filla, P. and Klingebiel, K. (2014). Risk profiles for the pre-series logistics in automotive ramp-up processes. The 2nd International Conference on Ramp-Up Management, Aachen, Germany
Finn, A. and Wang, L. (2014). Formative vs. reflective measures: facets of variation. Journal of Business Research, vol. 67/1, pp. 2821-2826
Fitzgerald, L., Johnston, R., Brignall, S., Silvestro, R. and Voss, C. (1991). Performance measurement in service businesses. CIMA, London
Fjällström, S, Säfsten, K., Harlin, U. and Stahre, J. (2009). Information enabling production ramp-up. Journal of Manufacturing Technology Management, vol. 20/2, pp. 178-196
Flaherty, M. (1992). Manufacturing and firm performance in technology-intensive industries: U.S. and Japanese DRAM experience. Review of Industrial Organisation, vol. 7/4, pp. 273-294
Fleischer, J., Spath D. and Lanza, G. (2003). Quality simulation for fast ramp-up. 36th CIRP International Seminar on Manufacturing Systems, 3-5 June, Saarland, Germany
Flynn, B., Sakakibara, S. and Schroeder, R. (1995b). Relationship between JIT and TQM: practices and performance. Academy of Management Journal, vol. 38/5, pp. 1325-1360
Flynn, B., Sakakibara, S., Schroeder, R., Bates, K. and Flynn, E. (1990). Empirical research methods in operations management. Journal of Operations Management, vol. 9/2, pp. 250-284

References
182
Flynn, B., Schroeder, R. and Flynn, E. (1999). World class manufacturing: an investigation of Hayes and Wheelwright’s Foundation. Journal of Operations Management, vol. 17/2, pp. 249-269
Flynn, B., Schroeder, R. and Sakakibara, S. (1995a). The impact of quality management practices on performance and competitive advantage. Decision Sciences, vol. 26/5, pp. 659-691
Folan, P. and Browne, J. (2005). A review of performance measurement: Towards performance management. Computers in Industry, vol. 56, pp. 663-680
Folgado, R., Peças, P. and Henriques, E. (2010). Lifecycle cost for technology selection: a case study in the manufacturing of injection moulds. International Journal of Production Economics, vol. 128/1, pp. 368-378
Fornell, C. and Larcker, D. (1981). Evaluating structural equation models with unobservable variables and measurement error. Journal of Marketing Research, vol. 18/1, pp. 39-50
Forza, C. (2002). Survey research in operations management: a process-based perspective. International Journal of Operations and Production Management, vol. 22/2, pp. 152-194
Fowler, F. (2014). Survey research methods. 5th Edition, SAGE Publications Inc.
Frazelle, E. (2001). Supply chain strategy. McGraw Hill Professional
Freeze, R. and Raschke, R. (2007). An assessment of formative and reflective constructs in IS research. European Conference on Information Systems, pp. 1481-1492
Frizelle, G. and Gregory, M. (2000). Complexity and the impact of introducing new products. In: Complexity and Complex Systems in Industry. University of Warwick, Warwick, UK, pp. 247-259
Frohlich, M. (2002). Techniques for improving response rates in OM survey research. Journal of Operations Management, vol. 20/1, pp. 53-62
Fry, T. and Cox, J. (1989). Manufacturing performance: local versus global measures. Production and Inventory Management Journal, vol. 30/2, pp. 52-57
Führer, K. (2008). Qualitätsbasiertes Anlaufmanagement von Dienstleistungen: Theoretische und empirische Modellanalyse des Anlaufs einer Dienstleistungsproduktion mit hohem Outputvolumen. Verlag Dr. Kovac, Hamburg (in German)
Fujimoto, T. (1989). Organization for effective product development. The case of the global automobile industry. Ph.D. Thesis, Harvard University, USA
Fynes, B. and Ennis, S. (1994). From lean production to lean logistics: the case of Microsoft Ireland. European Management Journal, vol. 12/3, pp. 322-331
G Gable, G. (1994). Integrating case study and survey research methods: an example in
information systems. European Journal of Information Systems, vol. 3/2, pp. 112-126
References
183
Ghalayini, A. and Noble, J. (1996). The changing basis of performance measurement. International Journal of Operations and Production Management, vol. 16/8, pp. 63-80
Gimenez, C. and Ventura, E. (2003). Supply chain management as a competitive advantage in the Spanish grocery sector. International Journal of Logistics Management, Vol.14/1, pp. 77-88
Gimenez, C. and Ventura, E. (2005). Logistics-production, logistics-marketing and external integration: Their impact on performance. International Journal of Operations and Production Management. Vol.25/1, pp. 20-38
Ginn, M. and Rubenstein, A. (1986). The R&D/production interface: a case study of new product commercialization. Journal of Product Innovation Management, vol. 3/3, pp.158-170
Gligor, D. and Holcomb, M. (2012). Understanding the role of logistics capabilities in achieving supply chain agility: a systematic literature review. Supply Chain Management: An International Journal, vol. 17/4, pp. 438-453
Glock, C., Jaber, M. and Zolfaghari, S. (2012). Production planning for a ramp-up process with learning in production and growth in demand. International Journal of Production Research, vol. 50/20, pp. 5707-5718
Goerke, M. and Gehrmann, J. (2014). The Harada method-a method for employee development during production ramp-up. International Journal of Social, Management, Economics and Business Engineering, vol. 8/11, pp. 3294-3299
Goldsby, J., Griffis, S. and Roath, A. (2006). Modeling lean, agile, and leagile supply chain strategies. Journal of Business Logistics, vol. 27/1, pp. 57-80
Goold, M. (1991). Strategic control in the decentralised firm. Sloan Management Review, vol. 32/2, pp. 69-81
Grönroos, C. (1990). Service management and marketing: managing the moments of truth in service competition. Lexington Books, New York
Gross, U. and Renner, T. (2010). Coordination and cooperation during production ramp-up: an empirical study of the European manufacturing industry. Production and Operations Management Society (POMS) 21st Annual Conference, Vancouver, Canada, 7-10 May
Groves, R., Fowler F., Couper, M., Lepkowski, J., Singer, E. and Tourangeau, R. (2009). Survey methodology. 2ed Edition, John Wiley and Sons
Gunasekaran, A. (1998). Agile manufacturing: enablers and an implementation framework. International Journal of Production Research,vol. 36/5, pp.1223-1247
Gunasekaran, A. and Kobu, B. (2007). Performance measures and metrics in logistics and supply chain management: a review of recent literature 1995-2004 for research and applications. International Journal of Production Research, vol. 45/12, pp. 2819-2840
Gunasekaran, A., Lai, K. and Cheng, T. (2008). Responsive supply chain: a competitive strategy in a networked economy. Omega, The International Journal of Management Science, vol. 36/4, pp. 549-564

References
184
Gundlach, G., Bolumole, Y., Eltantawy, R. and Frankel, R. (2006). The changing landscape of supply chain management, marketing channels of distribution, logistics and purchasing. Journal of Business and Industrial Marketing, vol. 21/7, pp. 428-438
Gupta, S. and Jain, S. (2013). A literature review of lean manufacturing. International Journal of Management Science and Engineering Management, vol. 8/4, pp. 241-249
Gustin, C., Stank, T. and Daugherty, P. (1994). Computerization: supporting integration. International Journal of Physical Distribution and Logistics Management. Vol.24/1, pp. 11-16
Gustmann, K., Rettschlag, G. and Wolff, H. (1989). Produktionsanlauf neuer Erzeugnisse und Anlagen. 1. Berlin: Die Wirtschaft (in German)
H Hair, J. Hult, G. Ringle, C. and Sarstedt, M. (2014). A primer on partial least squares
structural equation modeling (PLS-SEM). Sage Publications, Inc., U.S.A
Hair, J., Ringle, C. and Sarstedt, M. (2011). PLS-SEM: indeed a silver bullet. The Journal of Marketing Theory and Practice, vol. 19/2, pp. 139-152
Hair, J., Sarstedt, M., Ringle, C. and Mena, J. (2012). An assessment of the use of partial least squares structural equation modeling in marketing research. Journal of the Academy of Marketing Science, vol. 40/3, pp. 414-433
Haller, M., Peikert, A. and Thoma, J. (2003). Cycle time management during production ramp-up. Robotics and Computer-Integrated Manufacturing, vol. 19/1-2, pp.183-188
Hallgren, M. and Olhager, J. (2009). Lean and agile manufacturing: external and internal drivers and performance outcomes. International Journal of Operations and Production Management, Vol.29/10, pp. 976-999
Hansen, K. (2013). New product introduction in the pharmaceutical industry. Ph.D.Thesis, Technical University of Denmark, Denmark
Hansen, K. and Grunow, M. (2015). Modelling ramp-up curves to reflect learning: improving capacity planning in secondary pharmaceutical production. International Journal of Production Research
Harris, T. (1989). Assessment of control loop performance. Canadian Journal of Chemical Engineering, vol. 67, pp. 856-861
Harrison, A., Christopher, M. and van Hoek, R. (1999). Creating the agile supply chain. Institute of Logistics and Transport, UK
Harveya, L. and Green, D. (1993). Defining quality. Assessment and Evaluation in Higher Education, vol. 18/1, pp. 9-34
Hasle, P., Bojesen, A., Langaa Jensen, P. and Bramming, P. (2012). Lean and the working environment: a review of the literature. International Journal of Operations and Production Management, vol. 32/7, pp. 829-849

References
185
Hatch, N. and Macher, J. (2004). Knowledge management in developing new technologies: mitigating the trade-off between time-to-market and manufacturing performance. The 2nd World Conference on Production and Operations Management, Cancun
Hatch, N. and Mowery, D. (1998). Process innovation and learning by doing in semiconductor manufacturing. Management Science, vol. 44/11, pp. 1461-1477
Hayes, R. and Pisano, G. (1996). Manufacturing strategy: at the intersection of two paradigm shifts. Production and Operations Management, vol. 5/1, pp. 25-41
Hayes, R. and Wheelwright, S. (1979). Link manufacturing process and product lifecycles. Harvard Business Review, vol. 57/1, pp. 133-140
Heizer, J. and Render, B. (2008). Operations management. 9th Edition, Pearson Education Inc., Upper Saddle River, New Jersey
Held, T. (2010). Managing production ramp-ups in the European automotive supply chain - the supplier´s view. In: Blecker, T., Kersten, W. and Lüthje, C., Innovative process optimization methods in logistics: emerging trends, concepts and technologies. Erich Schmidt Verlag, Berlin, pp. 99-112
Helo, P. (2004). Managing agility and productivity in the electronics industry. Industrial Management and Data Systems, vol. 104/7, 567-577
Hendricks, K. and Singhal, V. (1997). Delays in new product introductions and the market value of the firm: The consequences of being late to the market. Management Science, vol. 43/4, pp. 422-436
Henseler, J., Ringle, C. and Sarstedt, M. (2014). A new criterion for assessing discriminant validity in variance-based structural equation modeling. Journal of the Academy of Marketing Science, pp. 1-21
Herrmann, C., Wenda, A. and Bruns, H. (2009). Ramp-up Failure Rate: Einführung einer Qualitätskennzahl für den Produktanlauf. ZWF - Zeitschrift für wirtschaftlichen Fabrikbetrieb, vol. 104/6, pp. 454-458 (in German)
Hon, K. (2005). Performance and evaluation of manufacturing systems. CIRP Annals - Manufacturing Technology, vol. 54/2, pp. 139-154
Hon, K. and Serna, G. (2005). Measures for manufacturing systems. Manufacturing Systems Research Group Internal Report
Houlihan, J. (1985). International supply chain management. International Journal of Physical Distribution and Logistics Management, vol. 15/1, pp. 22-38
House, C. and Price, R. (1991). The return map: tracking product teams. Harvard Business Review, January – February
Hsueh, C. (2011). An inventory control model with consideration of remanufacturing and product lifecycle. International Journal of Production Economics, vol. 133/2, pp. 645-652
Hu, L. and Bentler, P. (1999). Cutoff criteria for fit indexes in covariance structure analysis: conventional criteria versus new alternatives. Structural Equation Modeling: A Multidisciplinary Journal, vol. 6/1, pp. 1-55

References
186
Huang, Y. and Li, S. (2009). Tracking the evolution of research issues on agility. Asia Pacific Management Review, vol. 14/1, pp. 107-129
Huang, Y. and Li, S. (2010). How to achieve leagility: A case study of a personal computer original equipment manufacturer in Taiwan. Journal of Manufacturing Systems, vol. 29/2, pp. 63-70
Hüntelmann, j., Reinsch, S. and Märtens, A. (2007). Logistic- and cost-oriented cross-company ramp-up planning. In: Cunha, P. and Maropoulos, P. Digital enterprise technology: perspectives and future challenges. Springer Science, pp 115-122
I Ilyas, R., Shankar, R. and Banwet, D. (2007). A study of the relative efficiency of value chain
relationships in the Indian steel industry using DEA. International Journal of Value Chain Management, vol. 1/3, pp. 239 - 265
Ilyas, R., Shankar, R. and Banwet, D. (2008). Creating flex-lean-agile value chain by outsourcing: an ISM-based interventional roadmap. Business Process Management Journal, vol. 14/3, pp. 338-389
Inman, R., Sale, R., Green Jr, K. and Whitten, D. (2011). Agile manufacturing: relation to JIT, operational performance and firm performance Journal of Operations Management, vol. 29/4, pp. 343-355
Ismail, H., Poolton, J. and Sharifi, H. (2011). The role of agile strategic capabilities in achieving resilience in manufacturing-based small companies. International Journal of Production Research, vol. 49/18, pp. 5469-5487
Iwaarden, J. and Wiele, T. (2012). The effects of increasing product variety and shortening product lifecycles on the use of quality management systems. International Journal of Quality and Reliability Management, vol. 29/5, pp. 470-500
J Jacoby, J. and Matell, M. (1971). Three-point Likert scales are good enough. Journal of
Marketing Research, vol. 8/4, pp. 495-500
Jaikumar, R. and Bohn, R. (1992). A dynamic approach to operations management: An alternative to static optimization. International Journal of Production Economics, vol. 27/3, pp. 265-282
Japan Management Association, (1985). Kanban: Just-in-Time at Toyota. Productivity Press, Cambridge, MA
Jirsák, P. and Holman, D. (2012). Productivity of lean logistics system. Logistics and Sustainable Transport, vol. 3/1, 30-40
Jones, D., Hines, P. and Rich, N. (1997). Lean logistics. International Journal of Physical Distribution and Logistics Management, vol. 27 No. 3/4, pp. 153-173
References
187
Juerging, J. and Milling, P. (2005). Interdependencies of product development decisions and the production ramp-up. The 23rd International Conference of the System Dynamics Society, Boston, MA, USA
Juerging, J. and Milling, P. (2006). Manufacturing starts-up in the automobile industry. The 24th International Conference of the System Dynamics Society, Nijmegen, The Netherlands
Juran, J. and Godfrey, A. (1999). Juran’s quality handbook. 5th Edition, McGraw-Hill, New York
K Kampker, A., Deutskens, C., Deutschmann, K., Maue, A. and Haunreiter, A, (2014).
Increasing ramp-up performance by implementing the Gamification approach. The 2nd International Conference on Ramp-Up Management, Aachen, Germany
Kaplan, R. and Norton, D. (1992). The balanced scorecard - measures that drive performance. Harvard Business Review, January/February, pp. 71-9
Kaplan, R. and Norton, D.,(1996). The balanced scorecard: translating strategy into action. Harvard Business School Press, Boston
Katayama, H. and Bennett, D. (1999). Agility, adaptability and leanness: a comparison of concepts and a study of practice. International Journal of Production Economics, vol. 60-61/1, pp. 43-51
Kaydos, W. (1991). Measuring, managing, and maximizing performance: What every manager needs to know about quality and productivity to make real improvements in performance. Productivity Press
Kilbridge, M. and Wester, L. (1966). An economic model for the division of labor. Management Science, vol. 12/6, pp. 255-269
Kisperska-Moron, D. and de Haan, J. (2011). Improving supply chain performance to satisfy final customers: “Leagile” experiences of a polish distributor. International Journal of Production Economics, Vol, 133/1, pp. 127-134
Klepper, S. (1996). Entry, exit, growth, and innovation over the product lifecycle. The American Economic Review, vol. 86/3, pp. 562-583
Kleyner, A. and Sandborn, P. (2008). Minimizing lifecycle cost by managing product reliability via validation plan and warranty return cost. International Journal of Production Economics, vol. 112/2, pp. 796-807
Klocke, F., Nau, B., Roderburg, A. and Park, H. (2012). Risk assessment of hybrid manufacturing technologies for ramp-up projects. CIRP Journal of Manufacturing Science and Technology, vol. 5, pp. 228-234
Koca, E., Souza, G. and Druehl, C. (2010). Managing product rollovers, Decision Sciences, vol. 41/2, pp. 403-423

References
188
Koike, T., Blanco, E. and Penz, B. (2005). Interface issues into lifecycle engineering agenda: evidences from the relationships between design engineering and logistics. 12th CIRP Lifecycle Engineering Seminar, Grenoble, France
Kontio, J. and Haapasalo, H. (2005). A project model in managing production ramp-up - a case study in wire harness industry. International Journal of Innovation and Technology Management, vol. 2/1, pp. 101-107
Koren, Y., Heisel, U., Jovane, F., Moriwaki, T., Pritschow, G., Ulsoy, G. and Van Brussel, H. (1999). Reconfigurable manufacturing systems. Annals. CIRP, vol. 48, pp. 527-540
Koufteros, X. (1999). Testing a model of pull production: a paradigm for manufacturing research using structural equation modeling. Journal of Operations Management, vol. 17/4, pp. 467-488
Koufteros, X. and Vonderembse, M. (1998). The impact of organizational structure on the level of JIT attainment. International Journal of Production Research, vol. 36/10, pp. 2863-2878
Koufteros, X., Vonderembse, M. and Doll, W. (1998). Developing measures of time based manufacturing. Journal of Operations Management, vol. 16/1, pp. 21-41
Krishnamurthy, R. and Yauch, C. (2007). Leagile manufacturing: a proposed corporate infrastructure. International Journal of Operations and Productions Management, Vol.27/6, pp. 588-604
Krishnan, V. and Ulrich, K. (2001). Product development decisions: a review of the literature. Management Science, vol. 47/1, pp. 1-21
Krishnaswamy, K., Sivakumar, A. and Mathirajan, M. (2009). Management research methodology: integration of methods and techniques. Pearson Education India
Kuhn, A., Wiendahl, H., Eversheim W. and Schuh, G. (2002). Fast ramp up - schneller produktionsanlauf von serienprodukten. Verlag Praxiswissen, Dortmund (in German)
Kuwashima, K. (2012). Product development research cycle: a historical review 1960s-1980s. Annals of Business Administrative Science, vol. 11, pp. 11-23
Kuwashima, K. (2013). Followers of Harvard study: a review of product development research 1990s-2000s. Annals of Business Administrative Science, vol. 12, pp. 31-44
L Langley, C., Coyle, J., Gibson, B., Novack, R. and Bardi, E. (2008). Managing supply chains:
a logistics approach. 8th Edition, South-Western, Cengage Learning, Canada
Langowitz, N. (1988). An exploration of production problems in the initial commercial manufacture of products. Research Policy, vol. 17, pp. 43-54
Lanza, G. and Sauer, A. (2012). Simulation of personnel requirements during production ramp-up. Production Engineering Research and Development, vol. 6/4-5, pp. 395-402
Lee, H. (2004). The triple-A supply chain. Harvard Business Review, vol. 82/10, pp. 102-113

References
189
Lee, W. and Lau, H. (1999). Factory on demand: the shaping of an agile production network. International Journal of Agile Management Systems, Vol.1/2, pp. 83-7
Lee, W. and Matsuo, H. (2012), “Managing Production Ramp-up in Semiconductor Manufacturing” Production and Operations Management Conference, Amsterdam, Holland
Leitão, P., Barbosa, J., Vrba, P., Skobelev, P., Tsarev, A. and Kazanskaia, D. (2013). Multi-agent system approach for the strategic planning in ramp-up production of small lots. IEEE 2013 International Conference on Systems, Man, and Cybernetics, Manchester, UK
Lenfle, S. and Midler, C. (2009). The launch of innovative product-related services: Lessons from automotive telematics. Research Policy, vol. 38/1, pp. 156-169
Leong, G., Snyder, D. and Ward, P. (1990). Research in the process and content of manufacturing strategy. OMEGA International Journal of Management Science, vol. 18/2, pp. 109-22
Leung, S. (2011). A comparison of psychometric properties and normality in 4-, 5-, 6-, and 11-point Likert scales. Journal of Social Service Research, vol. 37/4, pp. 412-421
Lewis, M. (2000). Lean production and sustainable competitive advantage. International Journal of Operations and Production Management, vol. 20/8, pp. 959-978
Li, H., Shi, Y. and Gregory, M. (2003). Rapid new product volume ramp-up manufacturing: a collaborative supply network perspective. European Operations Management Association, POM International Conference, Como Lake, Italy
Li, H., Shi, Y., Gregory, M. and Tan, K. (2014). Rapid production ramp-up capability: a collaborative supply network perspective. International Journal of Production Research, vol. 52/10, pp. 2999-3013
Li, H., Tan, K. and Hida, A. (2011). Sustaining growth in electronic manufacturing sector: lessons from overseas Japanese mid-size EMS providers. International Journal of Production Research, vol. 49/18, pp. 5414-5430
Li, S., Rao, S., Ragu-Nathan, T. and Ragu-Nathan, B. (2005). Development and validation of a measurement instrument for studying supply chain management practices. Journal of Operations Management, vol. 23/6, pp. 618-641
Liang, L. and Guo, B. (2010). The optimization method of quick response manufacturing system based on the genetic algorithm. The 3rd International Conference on Business Intelligence and Financial Engineering (BIFE), IEEE Computer society, pp. 20-23
Liberopoulos, G. and Dallery, Y. (2002). Base stock versus WIP cap in single-stage make-to-stock production-inventory systems. IIE Transactions, Vol.34/7, pp. 627-636
Liker, J. and Wu, Y. (2000). Japanese automakers, US suppliers and supply chain superiority. Sloan Management Review, vol. 42/1, pp. 81-93
Lilien, G. and Yoon, E. (1988). An exploratory analysis of the dynamic behavior of price elasticity over the product lifecycle: an empirical analysis of industrial chemical products. Issues in Pricing, pp. 261-87

References
190
Lim, C. and Mohamed, M. (1999). Criteria of project success: an exploratory reexamination. International Journal of Project Management, vol. 17/4, pp. 243-248
Lim, W. and Tang, C. (2006). Optimal product rollover strategies, European Journal of Operational Research, vol. 174/2, pp. 905-922
Lin, P. and Pearn, W. (2005). Testing manufacturing performance based on capability index Cpm. International Journal of Advanced Manufacturing Technology, vol. 27, pp. 351-358
Lindell, M. and Whitney, D. (2001). Accounting for common method variance in cross-sectional research designs. Journal of Applied Psychology, vol. 86/1, pp. 114-121
Lowry, P. and Gaskin, J. (2014). Partial least squares (PLS) structural equation modeling (SEM) for building and testing behavioral causal theory: when to choose it and how to use it. IEEE Transactions on Professional Communication, vol. 57/2, pp. 123-146
Lozano, L., García-Cueto, E. and Muñiz, J. (2008). Effect of the number of response categories on the reliability and validity of rating scales. Methodology: European Journal of Research Methods for the Behavioral and Social Sciences, vol. 4/2, 73-79
Luan, S., Jia, G. and Kong, J. (2013). A model approach to POLCA system for quick response manufacturing. Journal of Computational Information Systems, vol. 9/3, pp. 1167-1174
Luna, E. and Aguilar-Savén, R. (2004). Manufacturing strategy linked to product lifecycle. The 15th Annual POM Conference, Cancun, Mexico
M Majava, Y., Haapasalo, H., Belt, P. and Mottonen, M. (2013). Product development drivers in
literature and practice. International Journal of Product Development, vol. 18/6, pp. 512-530
Malhotra, M. and Grover, V. (1998). An assessment of survey research in POM: from constructs to theory. Journal of Operations Management, vol. 16, pp. 407-425
Malhotra, M., Singhal, C., Shang, G. and Ployhart, R. (2014). A critical evaluation of alternative methods and paradigms for conducting mediation analysis in operations management research. Journal of Operations Management, vol. 32, pp. 127-137
Mallick, D. and Schroeder, R. (2005). An integrated framework for measuring product development performance in high technology industries. Production and Operations Management, Vol.14/2, pp. 142-158
Maskell, B. (1991). Performance measurement for world class manufacturing. Productivity Press, Portland, Oregon
Mason-Jones, R. and Towill, D. (1999). Total cycle time compression and the agile supply chain. International Journal of Production Economics, Vol.62, pp. 61-73
Mason-Jones, R., Naylor, B., Towill, D. (2000a). Engineering the leagile supply chain. International Journal of Agile Management Systems, vol. 2/1, pp. 54-61

References
191
Mason-Jones, R., Naylor, B., Towill, D. (2000b). Lean, agile or leagile? Matching your supply chain to the marketplace. International Journal of Production Research, vol. 38/17, pp. 4061-4070
Matta, A., Tomasella, M. and Valente, A. (2007). Impact of ramp-up on the optimal capacity-related configuration policy. International Journal of Flexible Manufacturing Systems, vol. 19/3, pp. 173-194
Matta, A., Tomasella, M., Clerici, M. and Sacconi, S. (2008). Optimal reconfiguration policy to react to product changes. International Journal of Production Research, vol. 46/10, pp. 2651-2673
McDonald, C. (1998). The evolution of Intel’s copy exactly! Technology transfer method. Intel Technology Journal, Q4’98
McDonald, R. and Siegel, D. (1985). Investment and the valuation of firms when there is an option to shut down. International Economic Review, vol. 26/2, pp. 331-349
McIvor, R., Martin, J., Matsuo, H. and Ng, J. (1997). Profiting from process improvements in the new semiconductor manufacturing environment. Technology and Operations Review, vol. 1/2, pp. 1-16
Mckone, K. and Weiss, E. (1998). TPM: planned and autonomous maintenance: bridging the gap between practice and research. Production and Operations Management, vol. 7/4, pp. 335-351
Medori, D. and Steeple, D. (2000). A framework for auditing and enhancing performance measurement systems. International Journal of Operations and Production Management, vol. 20/5, pp. 520-533
Mehrabi, M., Ulsoy, A. and Koren, Y. (2000). Reconfigurable manufacturing systems: key to future manufacturing. Journal of Intelligent Manufacturing, vol. 11/4, pp. 403-419
Mehta, V. and Shah, H. (2005). Characteristics of a work organization from a lean perspective. Engineering Management Journal, vol. 17/2, pp. 14-20
Meier, H. and Homuth, M. (2006). Holistic ramp-up management in SME networks. 16th CIRP International Design Seminar, Kananaskis, Canada
Melser, D. and Syed, I. (2014). Lifecycle price trends and product replacement: implications for the measurement of inflation. UNSW Business School Research Paper
Merchant, M. (1961). The manufacturing system concept in production engineering research. Annals of the CIRP, vol. 10/1, pp. 77-83
Meredith, J. (1998). Building operations management theory through case and field research. Journal of Operations Management, vol. 16/4, pp. 441-454
Merschmann, U. and Thonemann, U. (2011). Supply chain flexibility, uncertainty and firm performance: an empirical analysis of German manufacturing firms. International Journal of Production Economics, vol. 130, pp. 43-53
Meyer, M. (2007). The fast path to corporate growth: leveraging knowledge and technologies to new market applications. Oxford University Press
References
192
Meyer, T. (2008). Selection criteria: assessing relevant trends and indicators. in Abele, E., Meyer, T., Näher, U., Strube, G. and Sykes, R. (2008). Global Production: a handbook for strategy and implementation. Springer-Verlag Berlin Heidelberg
Miao, X. and Xi, B. (2008). Agile forecasting of dynamic logistics demand. Transport, vol. 23/1, pp. 26-30
Miguel, P. (2008). Portfolio management and new product development implementation: A case study in a manufacturing firm. International Journal of Quality and Reliability Management, Vol.25/1, pp. 10-23
Mileham, A., Culley, S., Owen, G., Newnes, L., Giess, M. and Bramley, A. (2004). The impact of run-up in ensuring rapid changeover. CIRP annals-manufacturing technology, vol. 53/1, pp. 407-410
Möller, K. (2005). Anlaufkosten in der Serienfertigung - Management und Controlling im Rahmen eines Lebenszykluskonzepts. in Wildemann, H. (ed.) Synchronisation von Produktentwicklung und Produktionsprozess: Produktreife - Produktneuanläufe - Produktionsauslauf, Tagungsband der Kommission Produktionswirtschaft im Verband der Hochschullehrer für Betriebswirtschaft, pp. 137-171, München 2005 (in German)
Monden, Y. (1994). Toyota Production System: An Integrated Approach to Just-In-Time. 2nd Edition, Industrial Engineering and Management Press, Norcross, GA
Montoya-Weiss, M. and Calantone, R. (1994). Determinants of new product performance: A review and meta-analysis. Journal of Product Innovation Management, vol. 11/5, pp. 397-417
Mu, J. and Di Benedetto, C. (2011). Strategic orientations and new product commercialization: mediator, moderator, and interplay. R&D Management, vol. 41/4, pp. 337-359
Myrtveit, I. and Stensrud, E. (2012). Validity and reliability of evaluation procedures in comparative studies of effort prediction models. Empirical Software Engineering, vol. 17/1-2, pp. 23-33
N Naim, M. and Gosling, J. (2011). On leanness, agility and leagile supply chains. International
Journal of Production Economics, vol. 131/1, pp. 342-354
Naim, M., Aryee, G. and Potter, A. (2010). Determining a logistics provider’s flexibility capability. International Journal of Production Economics, vol. 127, pp. 39-45
Naim, M., Potter, A., Mason, R. and Bateman, N. (2006). The role of transport flexibility in logistics provision. International Journal of Logistics Management, vol. 17/3, pp. 297-311
Nakajima, S. (1989). Introduction to TPM: Total Productive Maintenance. Productivity Press, Cambridge, MA
Narasimhan, R., Swink, M. and Kim, S. (2006). Disentangling leanness and agility: an empirical investigation. Journal of Operations Management, vol. 24/5, pp. 440-457

References
193
Nau, B., Roderburg, A. and Klocke, F. (2011). Ramp-up of hybrid manufacturing technologies. CIRP Journal of Manufacturing Science and Technology, vol. 4/3, pp. 313-316
Naylor, J., Naim, M. and Berry, D. (1999). Leagility: integrating the lean and agile manufacturing paradigm in the total supply chain. International Journal of Production Economics, vol. 62, pp. 107-18
Neely, A. (2002). Business performance measurement: theory and practice. Cambridge University Press
Neely, A. (2005). The evolution of performance measurement research: developments in the last decade and aresearch agenda for the next. International Journal of Operations and Production Management, vol. 25/12, pp. 1264-1277
Neely, A., Gregory, M. and Platts, K. (1995). Performance measurement system design: A literature review and research agenda. International Journal of Operations and Production Management, vol. 15/4 pp. 80-116
Nevem Working Group, (1989). Performance indicators in logistics. IFS Publications, Bedford
Niroomand, I., Kuzgunkaya, O. and Bulgak, A. (2012). Impact of reconfiguration characteristics for capacity investment strategies in manufacturing systems. International Journal of Production Economics, vol. 139/1, pp. 288-301
Niroomand, I., Kuzgunkaya, O. and Bulgak, A. (2014). The effect of system configuration and ramp-up time on manufacturing system acquisition under uncertain demand. Computers and Industrial Engineering, Vol, 73, pp. 61-74
Nudurupati, S., Bititci, U., Kumar, V. and Chan, F. (2011). State of the art literature review on performance measurement. Computers and Industrial Engineering, vol. 60/2, pp. 279-290
Nugroho, Y. (2011). Production ramp up in built-to-order supply chains. Journal of Modelling in Management, vol. 6/2, 143-163
Nunnally, J. and Bernstein, I. (1994). Psychometric theory, 3ed Edition, McGraw-Hill, New York
Nyhuis, P. and Winkler, H. (2004). Development of a controlling system for the ramp-up of production systems. International Conference on Competitive Manufacturing, Hanover, Germany
O Oloruntoba, R. and Gray, R. (2006). Humanitarian aid: an agile supply chain?. Supply Chain
Management: An International Journal, vol. 11/2, pp. 115-120
Olsen, E. (2004). Lean manufacturing management: the relationship between practice and firm level financial performance. Ph.D. Thesis, Ohio State University, USA

References
194
Olson, D., Markham, S., Page, A., Belliveau, P., Griffin, A. and McDonough, E. (1997). Drivers of NPD success: the 1997 PDMA report. Product Development and Management Association, Chicago, IL
Overboom, M., Naus, F. and Haan, J. (2010). Measuring the degree of leanness in logistics service providers: development of a measurement tool. the 17th International Annual EurOMA Conference: Managing Operations in Service Economies, Porto
P Paixão, A. and Marlow, P. (2003). Fourth generation ports - a question of agility?.
International Journal of Physical Distribution and Logistics Management, vol. 33/4, pp. 355-376
Pallant, J. (2013). SPSS survival manual. 5th Edition, McGraw-Hill International
Pannirselvam, G., Ferguson, L., Ash, R. and Siferd, S. (1999). Operations management research: an update for the 1990s. Journal of Operations Management, vol. 18/1, pp. 95-112
Pegels, C. (1976). Start up or learning curves - some new approaches. Decision Science, vol. 7/4, pp.705-713
Peklenik, J. (1971). Advances in manufacturing systems: research and development. Pergamon Press
Peng, D. and Lai, F. (2012). Using partial least squares in operations management research: A practical guideline and summary of past research. Journal of Operations Management, vol. 30, pp. 467-480
Pettit, T., Fiksel, J. and Croxton, K. (2010). Ensuring supply chain resilience: development of a conceptual framework. Journal of Business Logistics, vol. 31/1, pp. 1-21
Pfohl, H. and Buse, H. (2000). Inter-organizational logistics systems in flexible production networks: an organizational capabilities perspective. International Journal of Physical Distribution and Logistics Management, vol. 30/5, pp. 388-408
Pfohl, H. and Gareis, K. (2000). Die Rolle der logistik in der anlaufphase. Zeitschrift für Betriebswirtschaft, vol. 70/11, pp. 1189-1214 (in German)
Pisano, G. (1997). The development factory. Harvard Business School Press
Pisano, G. and Wheelwright, S. (1995). The new logic of high-tech R&D. Harvard Business Review, September-October, pp. 93-105
Plambeck, E. and Taylor, T. (2005). Sell the plant? The impact of contract manufacturing on innovation, capacity, and profitability. Management Science, vol. 51/1, pp. 133-150
Podsakoff, P., MacKenzie, S. and Podsakoff, N. (2012). Sources of method bias in social science research and recommendations on how to control it. Annual Review of Psychology, vol. 63, pp. 539-569

References
195
Pool, A., Wijngaard, J. and van der Zee, D. (2011). Lean planning in the semi-process industry: a case study. International Journal of Production Economics, vol. 131, pp. 194-203
Pufall, A., Fransoo, J. and de Kok, A. (2007). What determines product ramp-up performance? A review of characteristics based on a case study at Nokia Mobile Phones. BETA Publicatie: Working Paper No. 228. Technische Universiteit Eindhoven
Pufall, A., Fransoo, J., de Jong, A. and de Kok, A. (2012a). The impact of product complexity on ramp-up performance. BETA Publication: Working Paper No. 389. Technische Universiteit Eindhoven
Pufall, A., Fransoo, J., de Jong, A. and de Kok, A. (2012b). How does development lead time affect performance over the ramp-up lifecycle? Evidence from the consumer electronics industry. BETA Publicatie: Working Paper No. 390. Technische Universiteit Eindhoven
Purvis, L., Gosling, J. and Naim, M. (2014). The development of a lean, agile and leagile supply network taxonomy based on differing types of flexibility. International Journal of Production Economics, vol. 151, pp. 100-111
R Ragatz, G., Handfield, R. and Petersen, K. (2002). Benefits associated with supplier
integration into new product development under conditions of technology uncertainty. Journal of Business Research, vol. 55/5, pp. 389-400
Ralston, P. (2014). Supply chain collaboration: A literature review and empirical analysis to investigate uncertainty and collaborative benefits in regards to their practical impact on collaboration and performance. Ph.D. Thesis, Iowa State University, USA
Ramasesh, R., Tirupati, D. and Vaitsos, C. A. (2010). Modeling process-switching decisions under product lifecycle uncertainty. International Journal of Production Economics, vol. 126/2, pp. 236-246
Ramesh, G. and Devadasan, S. (2007). Literature review on the agile manufacturing criteria. Journal of Manufacturing Technology Management, vol. 18/2, pp. 182-201
Rathje, M., Boyle, T. and Deflorin, P. (2009). Lean, take two! Reflections from the second attempt at lean implementation. Business Horizons, vol. 52, pp. 79-88
Ray, S. and Jewkes, E. (2004). Customer lead time management when both demand and price are lead time sensitive. European Journal of Operational Research, vol. 153/3, pp. 769-781
Rea, L. and Parker, R. (2014). Designing and conducting survey research: a comprehensive guide. 4th Edition, John Wiley and Sons
Ren, J., Yusuf, Y. and Burns, N. (2003). The effects of agile attributes on competitive priorities: a neural network approach. Integrated Manufacturing Systems, vol. 14/6, pp. 489-497

References
196
Reuter, S., Ewert, D. and Jeschke, S. (2014). Facing ramp-up challenges in the RoboCup logistics league. The 4th International Conference on Industrial Engineering and Operations Management Bali, Indonesia
Richard, P., Devinney, T., Yip, G. and Johnson, G. (2009). Measuring organizational performance: towards methodological best practice. Journal of Management, vol. 35/3, pp. 718-804
Riedel, D. (2000). Standortverteiltes Änderungsmanagement: explorative Analyse zur Gestaltung Standortübergreifender Produktänderungen. 1st Edition, Gabler, Wiesbaden (in German)
Risse, J. (2003). Time-to-Market-Management in der Automobilindustrie: ein Gestaltungsrahmen für ein logistikorientiertes Anlaufmanagement. Bern : Haupt (in German)
Roh, J., Hong, P. and Min, H. (2014). Implementation of a responsive supply chain strategy in global complexity: The case of manufacturing firms. International Journal of Production Economics, Vol, 147, pp. 198-210
Romberg, A. and Haas, M. (2005). Der Anlaufmanager: Effizient arbeiten mit Führungssystem und Workflow; von der Produktidee bis zu Serie. LOG_X, Stuttgart (in German)
Rouhollahi, Z. (2011). Logistics philosoohies. in: Farahani, R., Rezapour, S. and Kardar, L. (2001). Logistics operations and management: concepts and models. Elsevier Inc.
Rungtusanatham, M., Choi, T., Hollingworth, D., Wu, Z. and Forza, C. (2003). Survey research in operations management: historical analyses. Journal of Operations Management, vol. 21/4, pp. 475-488
Russell, S. (2000). A general theory of logistics practice. Air Force Journal of Logistics, vol. 24/2, pp. 13-17
Rutner, S. and Langley, C. (2000). Logistics Value: Definition, Process and Measurement. The International Journal of Logistics Management, vol. 11/2, pp. 73 – 82
S Sadjady, H. (2011). Physical flows. in: Farahani, R., Rezapour, S. and Kardar, L. (2001).
Logistics operations and management: concepts and models. Elsevier Inc.
Säfsten, K., Berglund, M., Gustavsson, M. and Harlin, U. (2008b). Learning and competence driven product introduction. 2nd Swedish Production Symposium, Stockholm, Sweden
Säfsten, K., Fjällström, S. and Berg, M. (2006). Production ramp-up in the manufacturing industry - experiences from a project under extreme time pressure. The 39th CIRP ISMS, Ljubljana
Säfsten, K., Harlin, U., Fjällström, S. and Berglund, M. (2008a). Proactive and reactive ways of managing product introduction. 2nd Swedish Production Symposium, Stockholm, Sweden
References
197
Sakakibara, S., Flynn, B. and Schroeder, R. (1993). A framework and measurement instrument for just‐in‐time manufacturing. Production and Operations Management, vol. 2/3, pp. 177-194
Sakakibara, S., Flynn, B., Schroeder, R. and Morris, W. (1997). The impact of just-in-time manufacturing and its infrastructure on manufacturing performance. Management Science, vol. 43/9, pp. 1246-1257
Salomon, R. and Martin, X. (2008). Learning, knowledge transfer, and technology implementation performance: a study of time-to-build in the global semiconductor industry. Management Science, vol. 54/7, pp. 1266-1280
Salvador, F. and Villena, V. (2013). Supplier integration and NPD outcomes: conditional moderation effects of modular design competence. Journal of Supply Chain Management, vol. 49/1, pp. 87-113
Saunders, J. and Jobber, D. (1994). Product replacement: strategies for simultaneous product deletion and launch. Journal of Product Innovation Management, vol. 11/5, pp. 433-450
Scheaffer, R., III, W., Ott, R. and Gerow, K. (2011). Elementary survey sampling. 7th Edition, Cengage Learning
Schmitt, S. and Schmitt, R. (2013). Lifecycle oriented ramp-up - conception of a quality- oriented process model. 20th CIRP International Conference on Lifecycle Engineering, Singapore
Scholten, K., Scott, P. and Fynes, B. (2010). (Le) agility in humanitarian aid (NGO) supply chains. International Journal of Physical Distribution and Logistics Management, vol. 40/8,9, pp. 623-635
Scholz-Reiter, B. and König F. (2010). Entwicklung der Kernkompetenz Anlaufmanagement: Mit der Adaption von ‘lean’ Prinzipien den ‘Fast Ramp-up’ erreichen. Productivity Management, vol. 15/4, pp. 42-45 (in German)
Scholz-Reiter, B. and König, F. (2010). Entwicklung der Kernkompetenz Anlaufmanagement. Mit der Adaption von "lean" Prinzipien den "Fast Ramp-up" erreichen. Productivity Management, Berlin: GITO, vol. 15/4, pp. 42-45
Scholz-Reiter, B., Krohne, F., Leng, B. and Höhns, H. (2007). Technical product change teams: an organizational concept for increasing the efficiency and effectiveness of technical product changes during ramp-up phases. International Journal of Production Research, vol. 45/7, pp. 1631-1642
Schuh, G., Desoi, J. and Tücks, G. (2005a). Holistic approach for production ramp-up in automotive industry. Advances in Integrated Design and Manufacturing in Mechanical Engineering, pp. 255-268
Schuh, G., Kampker, A., Franzkoch, B. and Tücks, G. (2005b). Implementation of a maturity measurement model for planning and monitoring of production ramp-ups. The 3rd International Conference on Reconfigurable Manufacturing, CIRP. Ann Arbor, MI
Schuh, G., Kampker, B. and Franzkoch, B. (2005c). Anlaufmanagement: Kosten senken - Anlaufzeit verkürzen - Qualität sichern. wt Werkstattstechnik online, Ausgabe 05-2005, pp. 405-409 (in German)
References
198
Scrimieri, D., Oates, R. and Ratchev, S. (2013). Learning and reuse of engineering ramp-up strategies for modular assembly systems. Journal of Intelligent Manufacturing, 1-14
Scudder, G. and Hill, C. (1998). A review and classification of empirical research in operations management. Journal of Operations Management, vol. 16/1, pp. 91-101
Sekaran, U. and Bougie, R. (2013). Research methods for business: a skill-building approach. 6th Edition, John Wiley and Sons, New York
Shah, R. and Ward, P. (2003). Lean manufacturing: context, practice bundles, and performance. Journal of Operations Management, vol. 21/2, pp. 129-149
Shah, R. and Ward, P. (2007). Defining and developing measures of lean production. Journal of Operations Management, vol. 25/, pp. 785-805
Shapiro, R. and Heskett, J. (1984). Logistics strategy: cases and concepts. West Publishing
Sharifi, H. and Zhang, Z. (1999). A methodology for achieving agility in manufacturing organizations: an introduction. International Journal of Production Economics, vol. 62/1-2, pp. 7-22
Sharifi, H., Ismail, H. and Reid, I. (2006). Achieving agility in supply chain through simultaneous “design of” and “design for” supply chain. Journal of Manufacturing Technology Management, vol. 17/8, pp. 1078-1098
Simchi-Levi, D., Chen, X. and Bramel, J. (2014). The logic of logistics: theory, algorithms, and applications for logistics management. 3rd Edition, Springer Science and Business Media
Simola, A., Hakonen, M., Rantamäki, T., Hakonen, N., Hulkko, K. and Vartiainen, M. (1998). Disturbances in the boundary of product development and production ramp-up - a case study. Project Management, vol. 4/1, pp. 46-49
Simon, S., Dervisopoulos, M., Jacob, F. and Näher, U. (2008). Implementation: ramping up new facilities for top performance. In: Abele, E., Meyer, T., Näher, U., Strube, G. and Sykes, R.. Global Production: a handbook for strategy and implementation. Springer-Verlag Berlin Heidelberg
Slack, N., Brandon-Jones, A. and Johnston, R. (2013). Operations management. 7th Edition, Pearson Education Limited
Slamanig M. and Winkler, H. (2010). Wissensmanagement bei Produktwechselprojekten. Zeitschrift für wirtschaftlichen Fabrikbetrieb ZWF, vol. 105/10, pp. 893-900
Slamanig, M. and Winkler, H. (2011). An exploration of ramp-up strategies in the area of mass customisation. International Journal of Mass Customisation, vol. 4/1, pp. 22-43
Slamanig, M. and Winkler, H. (2012). Management of product change projects: a supply chain perspective. International Journal of Services and Operations Management, vol. 11/4, pp. 481-500
Stahl, A., Gustavsson, M., Karlsson, N., Johansson, G. and Ekberg, K. (2015). Lean production tools and decision latitude enable conditions for innovative learning in organizations: a multilevel analysis. Applied Ergonomics, 47, pp. 285-291
References
199
Stank, T., Keller, S. and Daugherty, P. (2001). Supply chain collaboration and logistical service performance. Journal of Business Logistics, Vol.22/1, pp. 29-48
Stansfield, T. and Longenecker, C. (2006). The effects of goal setting and feedback on manufacturing productivity: afield experiment. International Journal of Productivity and Performance Management, vol. 55, pp. 346-358
Stauder, J., Buchholz, S., Klocke, F. and Mattfeld, P. (2014). A new framework to evaluate the process capability of production technologies during production ramp-up. The 2nd International Conference on Ramp-Up Management, Aachen, Germany
Steiner, F. (2014). Ramp-up management as an approach to mitigating instability in the adaptation of solution spaces in high-variety business environments. The 2nd International Conference on Ramp-Up Management, Aachen, Germany
Stern, M., Bilgen, I. and Dillman, D. (2014). The state of survey methodology: challenges, dilemmas, and new frontiers in the era of the tailored design. Field Methods, vol. 26/3, pp. 284-301
Stevens, G. (1989). Integrating the supply chain. International Journal of Physical Distribution and Logistics Management, vol. 19/8, pp. 3-8
Stone, K. (2012). Four decades of lean: a systematic literature review. International Journal of Lean Six Sigma, vol. 3/2, pp. 112-132
Straube, F. and Fitzek, D. (2004). Logistikorientierung optimiert Serienanläufe. in Branchenreport Automobilzulieferer, Stadecken-Elsheim, Verlag E.Klock (in German)
Strubelt, H. and Zadek, H. (2010). Ramp-up management a chance for job production? In: Blecker, T., Kersten, W. and Lüthje, C., Innovative process optimization methods in logistics: emerging trends, concepts and technologies. Erich Schmidt Verlag, Berlin, pp. 403-416
Sturm, R., Dorner, J., Reddig, K. and Seidelmann, C. (2003). Simulation-based evaluation of the ramp-up behavior of waferfabs. Advanced Semiconductor Manufacturing Conference and Workshop, IEEEI/SEMI, pp. 111-117
Suh, S. and Huppes, G. (2005). Methods for lifecycle inventory of a product. Journal of Cleaner Production, vol. 13/7, pp. 687-697
Surbier, L. (2010). Problem and interface characterization during ramp-up in the low volume industry. Ph.D. Thesis, University of Grenoble, France
Surbier, L., Alpan, G. and Blanco, E. (2009). Identification of problem types during production ramp-up. International conference on Industrial Engineering and Systems Management, IESM '09, Montreal, Canada
Surbier, L., Alpan, G. and Blanco, E. (2010). Interface modeling and analysis during production ramp-up. CIRP Journal of Manufacturing Science and Technology, vol. 2, pp. 247-254
Surbier, L., Alpana, G. and Blancoa, E. (2014). A comparative study on production ramp-up: state-of-the-art and new challenges. Production Planning and Control: The Management of Operations, vol. 25/15, pp. 1264-1286

References
200
Sutherland, J. (2009). Logistics from a historical perspective. in Taylor, G., Introduction to logistics engineering, CRC Press, Taylor and Francis Group, USA
Svensson, G. (2003). Sub-contractor and customer sourcing and the occurrence of disturbances in firms’ inbound and outbound logistics flows. Supply Chain Management: an International Journal, vol. 8/1, pp. 41-56
Swafford, P., Ghosh, S. and Murthy, N. (2008). Achieving supply chain agility through IT integration and flexibility. International Journal of Production Economics, vol. 116/2, pp. 288-297
Swamidass, P. (1991). Empirical science: new frontier in operations management research. Academy of management review, vol. 16/4, pp. 793-814
Szulanski, G. (1996). Exploring internal stickiness: impediments to the transfer of best practice within the firm. Strategic Management Journal, vol. 17(Winter Special Issue), pp. 27-43
T Tareghian, H. and Taheri, S. (2006). On the discrete time, cost and quality trade-off problem.
Applied Mathematics and Computation, vol. 181/2, pp. 1305-1312
Taticchi, P., Tonelli, F. and Cagnazzo, L. (2010). Performance measurement and management: a literature review and a research agenda. Measuring Business Excellence, vol. 14, pp. 4-18
Terwiesch, C. and Bohn, R. (2001). Learning and process improvement during production ramp-up. International Journal of Production Economics, vol. 70/1, pp. 1-19
Terwiesch, C. and Xu, Y. (2004). The copy-exactly ramp-up strategy: trading-off learning with process change. IEEE Transactions on Engineering Management, vol. 51/1, pp. 70-84
Terwiesch, C., Bohn, R. and Chea, K. (2001). International product transfer and production ramp-up: A case study from the data storage industry. R and D Management, vol. 31/4, pp. 435-451
Thomé, A., Scavarda, L., Pires, S., Ceryno, P. and Klingebiel, K. (2014). A multi-tier study on supply chain flexibility in the automotive industry. International Journal of Production Economics, vol. 158, pp. 91-105
Tunälv, C. (1992). Manufacturing strategy - plans and business performance. International Journal of Operations and Production Management, vol. 12/3, pp. 4-24
U Ulrich, K. and Eppinger, S. (2008). Product design and development. 4th Edition, McGraw-
Hill, New York

References
201
Ulrich, K., Sartorius, D., Pearson, S. and Jakiela, M. (1993). Including the value of time in design-for-manufacturing decision making. Management Science, vol. 39/4, pp. 429-447
Urban, G. and Seiter, M. (2004). Fragestellungen zum Produktionsanlauf. Industrie Management, vol. 20/4, pp. 57-59 (in German)
V van Buuren, S. (2012). Flexible imputation of missing data. CRC Press, Taylor and Francis
Group
van der Merwe, E. (2004). A conceptual framework for ramp-up manufacturing. Ph.D. Thesis, Cambridge University, England
van der Merwe, E. and Frizelle, G. (2003). A framework for manufacturing Ramp-Up. Portland International Conference on Management of Engineering and Technology, Portland, Oregon, USA
van Hoek, R. (2000). The thesis of leagility revisited. International Journal of Agile Management Systems, vol. 2/3, pp. 196-201
van Hoek, R., Harrison, A. and Christopher, M. (2001). Measuring agile capabilities in the supply chain. International Journal of Operations and Production Management, Vol.21/1,2, pp. 126-147
Venkatraman, N. (1989). The concept of fit in strategy research: toward verbal and statistical correspondence. Academy of Management Review, vol. 14/3, pp. 423-444
Vokurka, R. and Fliedner, G. (1998). The journey toward agility. Industrial Management and Data Systems, vol. 98/4, pp. 165-71
von Cube, J. and Schmitt, R. (2014). Execution of ramp-up projects in day-to-day operations through a quantitative risk management approach. The 2nd International Conference on Ramp-Up Management, Aachen, Germany
von Gleich, C., Schütt, A. and Isenberg, R. (2012). SMART ramp-up: methods to secure production ramp-up in the aircraft industry. CEAS Aeronautical Journal, vol. 3/2-4, pp. 125-134
W Wacker, J. (1998). A definition of theory: research guidelines for different theory-building
research methods in operations management. Journal of Operations Management, vol. 16/4, pp. 361-385
Wan, F., Wang, D. and Fung, R. (2005). New product introduction planning using a 0-1 semi-infinite programming model. Production Planning and Control, vol. 16/1, pp. 12-20
Wheelwright, S. (1984). Manufacturing strategy - defining the missing link. Strategic Management Journal, vol. 5, pp. 77-91

References
202
Wheelwright, S. and Clark, K., (1992). Revolutionizing product development: Quantum leaps in speed, efficiency, and quality. The Free Press, New York
White, R., Pearson, J. and Wilson, J. (1999). JIT Manufacturing: a survey of implementation in small and large US manufacturers. Management Science, vol. 45/1, pp. 1-15
Wiendahl, H. and Lutz, S. (2002). Production in networks. Annals of the CIRP, vol. 51/2, pp. 573-586
Willmann, R., Biffl, S. and Serral, E. (2014). Determining qualified production processes for new product ramp-up using semantic web technologies. The 14th International Conference on Knowledge Technologies and Data-driven Business, ACM
Willmann, R., Serral, E., Kastner, W. and Biffl, S. (2013). Shortening of product ramp-up by using a centralized knowledge base. Industrial Informatics (INDIN), the 11th IEEE International Conference, pp. 516-522
Wincel, J. (2004). Lean supply chain management: a handbook for strategic procurement. Productivity Press, New York
Winkler, H. and Slamanig, M. (2008). Konzeption eines aktivitätsorientierten Instruments zur Anlaufkostenplanung. Zeitschrift für Planung und Unternehmenssteuerung, vol. 19/1, pp. 85-106 (in German)
Winkler, H. and Slamanig, M. (2011). Product change projects in companies with multi-variant serial production. The 21st International Conference on Production Research, Stuttgart, Germany
Winkler, H., Heins, M. and Nyhuis, P. (2007). A controlling system based on cause-effect relationships for the ramp-up of production systems. Production Engineering Research and Development, vol. 1/1, pp. 103-111
Winter, K., Geiger, C. and Clausen, U. (2014). Enhancing the ramp-up of a new contract logistics business by developing a workers requirements matrix. The Transport Research Arena (TRA) 5th Conference: Transport Solutions from Research to Deployment
Witt, C. (2006). Interorganizational new product launch management: an empirical investigation of the automotive industry. Ph.D. Thesis, University of St. Gallen, Switzerland
Womack, J. and Jones, D. (1994). From lean production to the lean enterprise. Harvard Business Review, March-April
Womack, J. and Jones, D. (1996),Beyond Toyota: how to root out waste and pursue perfection. Harvard Business Review, September-October
Woodcock, D., Mosey, S. and Wood, T. (2000). New product development in British SMEs. European Journal of Innovation Management Vol.3/4, pp. 212-221
Wu, Y. (2002). Effective lean logistics strategy for the auto industry. The International Journal of Logistics Management, Vol.13/2, pp. 19-38

References
203
X Xu, D. and Albin, S. (2002). Manufacturing start-up problem solved by mixed-integer
quadratic programming and multivariate statistical modelling. International Journal of Production Research, vol. 40/3, pp. 625-640
Xu, H., Besant, C. and Ristic, M. (2003). System for enhancing supply chain agility through exception handling. International Journal of Production Research, Vol.41/6, pp. 1099-1114
Y Yang, I. (2005). Impact of budget uncertainty on project time-cost tradeoff. Engineering
Management, IEEE Transactions, vol. 52/2, pp. 167-174
Yang, L., Huang, C. and Hsu, T. (2014). Knowledge leadership to improve project and organizational performance. International Journal of Project Management, vol. 32, pp. 40-53
Yusuf, Y., Sarhadi, M. and Gunasekaran, A. (1999). Agile manufacturing: the drivers, concepts and attributes. International Journal of Production Economics, vol. 62/1-2, pp. 33-43
Z Zangwill, W. and Kantor, P. (1998). Toward a theory of continuous improvement and the
learning curve. Management Science, vol. 44/7, pp. 910-920
Zarei, M., Fakhrzad, M. and Paghaleh, M. (2011). Food supply chain leanness using a developed QFD model. Journal of Food Engineering, vol. 102, pp. 25-33
Zeugträger, K. (1998). Anlaufmanagement für Großanlagen. Fortschritt-Berichte VDI. Reihe 2, Fertigungsstechnik, 470, VDI-Verlag, Düsseldorf
Zhang, D. (2011). Towards theory building in agile manufacturing strategies: Case studies of an agility taxonomy. International Journal of Production Economics, vol. 131, pp. 303-312
Zhang, Q., Irfan, M., Khattak, M., Zhu, X. and Hassan, M. (2012). Lean Six Sigma: a literature review. Interdisciplinary Journal of Contemporary Research in Business, vol. 3/10, pp. 599-605
Zhang, Q., Vonderembse, M. and Lim, J. (2005). Logistics flexibility and its impact on customer satisfaction. International Journal of Logistics Management, vol. 16/1, pp. 71-95
Zhang, Z. and Sharifi, H. (2000). A methodology for achieving agility in manufacturing organisations. International Journal of Operations and Production Management, vol. 20/4, pp. 496-512

204
APPENDICES

Appendices
205
Appendix 1: Questionnaire Items Firm: Contact Information:
A- For multiple choice items, please highlight the number that represents the case for you, your firm and the product:
Respondent
1- Your job title or position
2- Experience 1 Less than 2 years 2 From 2 to less than 5 years
3 From 5 to less than 8 years 4 From 8 to less than 11 years
5 More than 11 years
Firm 3- Number of workers in the firm 1 Less than 50 2 From 50 to less than 250
3 From 250 to less than 500 4 From 500 to less than 1000
5 More than 1000
4- Country
5- Number of production ramp-ups experienced within the last 3 years
The product undergoes ramp-up process
6- Product type
7- Degree of product/process newness
1 Slightly modified product 2 Significantly modified product
3 Completely new product 4 Production process slightly modified
** more than one option can be chosen (for example, new product and new process)
5 Production process significantly modified
6 Completely new production process or new production facility
8- Estimated product lifecycle 1 Less than 6 months 2 From 6 months to less than 1 year
3 From 1 to less than 3 years 4 From 3 to less than 6 years
5 More than 6 years
B- Please highlight the number that represents your personal assessment for the following dimensions:
Very Poor <<< >>> Excellent
9- Actual to planned production rate during: the initial stages of ramp-up -------- 0 1 2 3 4 5 6 7 8 9 10
the middle stages of ramp-up ------ 0 1 2 3 4 5 6 7 8 9 10
the final stages of ramp-up --------- 0 1 2 3 4 5 6 7 8 9 10
10- The ability to reduce production cycle time throughout the ramp-up period ------- 0 1 2 3 4 5 6 7 8 9 10
11- Employees' learning rate during the ramp-up period ---------------------------------- 0 1 2 3 4 5 6 7 8 9 10
12- The match between material deliveries in term of quantity, quality and timing and the real needs of the manufacturing process ---------------------------------------
0 1 2 3 4 5 6 7 8 9 10
13- Cooperation with suppliers ---------------------------------------------------------------- 0 1 2 3 4 5 6 7 8 9 10
14- The use of information technology to link the company with suppliers ------------ 0 1 2 3 4 5 6 7 8 9 10
15- Suppliers' flexibility and ability to adapt to changes in material requirements in term of quality, quantity and timing -----------------------------------------------------
0 1 2 3 4 5 6 7 8 9 10
16- The ability of the firm’s internal logistics system to cope with changes in production mix ------------------------------------------------------------------------------
0 1 2 3 4 5 6 7 8 9 10
17- The ability of the firm’s logistics system to respond, with a cost efficient manner, to the changes in customers' orders in term of size, type or delivery time
0 1 2 3 4 5 6 7 8 9 10
18- Firm’s ability to predict market changes ------------------------------------------------ 0 1 2 3 4 5 6 7 8 9 10
Please provide your overall assessment for: Very Poor <<< >>> Excellent
19- Attainment of goals related to production volume during the ramp-up phase ------ 0 1 2 3 4 5 6 7 8 9 10
20- Attainment of time-related goals during the ramp-up phase --------------------------- 0 1 2 3 4 5 6 7 8 9 10
21- Attainment of quality-related goals during the ramp-up phase ------------------------ 0 1 2 3 4 5 6 7 8 9 10
22- Attainment of financial and cost-related goals during the ramp-up phase ----------- 0 1 2 3 4 5 6 7 8 9 10
23- Overall ability of the logistics system to eliminate waste and save resources ------ 0 1 2 3 4 5 6 7 8 9 10
24- Overall flexibility of the logistics system ------------------------------------------------ 0 1 2 3 4 5 6 7 8 9 10

Appendices
206
Please provide your overall assessment for the success of the new product been ramped-up in term of:
Very Poor <<< >>> Excellent
25- Sales return ---------------------------------------------------------------------------------- 0 1 2 3 4 5 6 7 8 9 10
26- Net profit ------------------------------------------------------------------------------------- 0 1 2 3 4 5 6 7 8 9 10
27- Market share --------------------------------------------------------------------------------- 0 1 2 3 4 5 6 7 8 9 10
28- Customer satisfaction ----------------------------------------------------------------------- 0 1 2 3 4 5 6 7 8 9 10
C- Please highlight the number that represents your personal assessment in the following dimensions:
Very Low <<< >>> Very High
29- The proportion of defective products during the ramp-up ------------------------------ 0 1 2 3 4 5 6 7 8 9 10
30- The proportion of products returned by customers -------------------------------------- 0 1 2 3 4 5 6 7 8 9 10
31- Acceptable deviation in quality level as compared to steady-state production ------ 0 1 2 3 4 5 6 7 8 9 10
32- Unit production cost during ramp-up as compared to steady-state production ------ 0 1 2 3 4 5 6 7 8 9 10
33- Costs incurred by preparing for the ramp-up process ----------------------------------- 0 1 2 3 4 5 6 7 8 9 10
34- Repair, rework and scrap costs during ramp-up as compared to steady-state production -------------------------------------------------------------------------------------
0 1 2 3 4 5 6 7 8 9 10
35- Levels of: raw material inventory ----------------------------------------------------- 0 1 2 3 4 5 6 7 8 9 10
work in process (WIP) inventory ----------------------------------------- 0 1 2 3 4 5 6 7 8 9 10
finished goods inventory -------------------------------------------------- 0 1 2 3 4 5 6 7 8 9 10
36- Materials' transportation costs compared to competitors ------------------------------- 0 1 2 3 4 5 6 7 8 9 10
37- Finished goods' transportation costs compared to competitors------------------------- 0 1 2 3 4 5 6 7 8 9 10
38- The degree of standardization and smoothing in materials and parts flow in the manufacturing process -----------------------------------------------------------------------
0 1 2 3 4 5 6 7 8 9 10
39- Levels of customer involvement ----------------------------------------------------------- 0 1 2 3 4 5 6 7 8 9 10
40- Levels of flexibility provided by: the production machines ------------------------ 0 1 2 3 4 5 6 7 8 9 10
the production system --------------------------- 0 1 2 3 4 5 6 7 8 9 10
the material handling ---------------------------- 0 1 2 3 4 5 6 7 8 9 10
the production tools and equipment ----------- 0 1 2 3 4 5 6 7 8 9 10
D- Please mention the frequency of occurrences for the following situations during the ramp-up phase:
Never <<< >>> Very Often
41- Unplanned stops in the production process ----------------------------------------------- 0 1 2 3 4 5 6 7 8 9 10
42- Materials unavailable, defective, or does not match requirements -------------------- 0 1 2 3 4 5 6 7 8 9 10
43- Machines are not suitable for the new product ------------------------------------------- 0 1 2 3 4 5 6 7 8 9 10
44- Equipment or tools are unavailable or inappropriate ------------------------------------ 0 1 2 3 4 5 6 7 8 9 10
45- Committing mistakes by production employees ----------------------------------------- 0 1 2 3 4 5 6 7 8 9 10
46- Mismatch between product design and production process ---------------------------- 0 1 2 3 4 5 6 7 8 9 10
47- Mistakes in product design ------------------------------------------------------------------ 0 1 2 3 4 5 6 7 8 9 10
48- Inappropriate technology was used -------------------------------------------------------- 0 1 2 3 4 5 6 7 8 9 10
49- Poor cooperation and coordination between production and other departments ----- 0 1 2 3 4 5 6 7 8 9 10
50- Poor flow of information -------------------------------------------------------------------- 0 1 2 3 4 5 6 7 8 9 10
E- Please mention your evaluation for the application of the following tools (if used) in your firm:
Not used Used, and my evaluation is Very Poor <<< >>> Excellent
51- Just in time (JIT) ------------------------------------------------------------------------ 0 1 2 3 4 5 6 7 8 9 10
52- Kanban/pull system --------------------------------------------------------------------- 0 1 2 3 4 5 6 7 8 9 10
53- Lean warehousing/cross-docking ----------------------------------------------------- 0 1 2 3 4 5 6 7 8 9 10
54- Material requirement planning (MRP) ----------------------------------------------- 0 1 2 3 4 5 6 7 8 9 10
55- Supplier milk run ------------------------------------------------------------------------ 0 1 2 3 4 5 6 7 8 9 10
56- Modular product design ---------------------------------------------------------------- 0 1 2 3 4 5 6 7 8 9 10
57- Reconfigurable manufacturing system ---------------------------------------------- 0 1 2 3 4 5 6 7 8 9 10
58- Vendor managed inventory (VMI) --------------------------------------------------- 0 1 2 3 4 5 6 7 8 9 10
59- Third party logistics (3PL) in distribution ------------------------------------------- 0 1 2 3 4 5 6 7 8 9 10

Appendices
207
Appendix 2: Fragebogen Artikel Firma: Kontaktinformationen:
A- Persönliche Angaben: Teilnehmer
1- Ihre Berufsbezeichnung oder Position
2- Arbeitserfahrung 1 Weniger als 2 Jahre 2 Von 2 bis weniger als 5 Jahre
3 Von 5 bis weniger als 8 Jahre 4 Von 8 bis weniger als 11 Jahre
5 Mehr als 11 Jahre
Firma 3- Mitarbeiterzahl 1 Weniger als 50 2 Von 50 bis weniger als 250
3 Von 250 bis weniger als 500 4 Von 500 bis weniger als 1000
5 Mehr als 1000
4- Land
5- Anzahl der durchgeführten Produktionsanläufe in den letzten 3 Jahren
Das Produkt in der Anlaufphase
6- Produkttyp
7- Innovationsgrad des Produktes/des Prozesses
1 Leicht modifiziertes Produkt 2 Deutlich modifiziertes Produkt
3 Komplett neuentwickeltes Produkt 4 Produktionsprozess leicht modifiziert
** Mehrfachauswahl möglich (zum Beispiel neue Produkte und neuer Prozess)
5 Produktionsprozess wesentlich verändert
6 Komplett neues Produktionsverfahren oder neue Produktionsstätte
8- Geschätzter Produktlebenszyklus 1 Weniger als 6 Monate 2 Von 6 Monaten bis unter 1 Jahr
3 Von 1 bis unter 3 Jahre 4 Von 3 bis unter 6 Jahren
5 Mehr als 6 Jahre
B- Bitte geben Sie Ihre persönliche Einschätzung für die folgenden Bereiche an:
sehr schlecht <<< >>> sehr gut
9- Effektiv zu planende Produktionsrate während:
des Beginns des Produktionsanlaufs ---------------- 0 1 2 3 4 5 6 7 8 9 10
der mittleren Phase des Produktionsanlaufs ------- 0 1 2 3 4 5 6 7 8 9 10
der Abschlussphase des Produktionsanlaufs ------ 0 1 2 3 4 5 6 7 8 9 10
10- Die Möglichkeit, die Produktionsdurchlaufzeit während der gesamten Anlaufzeit zu reduzieren ----------------------------------------------------------------------------------
0 1 2 3 4 5 6 7 8 9 10
11- Die Lernrate der Mitarbeiter während der Anlaufphase -------------------------------- 0 1 2 3 4 5 6 7 8 9 10
12- Die Übereinstimmung zwischen Materiallieferungen und den tatsächlichen Anforderungen während des Herstellungsprozesses ------------------------------------
0 1 2 3 4 5 6 7 8 9 10
13- Zusammenarbeit mit Lieferanten ---------------------------------------------------------- 0 1 2 3 4 5 6 7 8 9 10
14- Die Verwendung von Informationstechnologie, für die Kommunikation des Unternehmens mit Lieferanten -------------------------------------------------------------
0 1 2 3 4 5 6 7 8 9 10
15- Flexibilität des/der Lieferanten sowie die Möglichkeit sich auf Änderungen der Materialanforderungen (Qualität, Menge und Laufzeit) anzupassen ------------------
0 1 2 3 4 5 6 7 8 9 10
16- Die Fähigkeit des internen Logistiksystems des Unternehmens, sich auf Veränderungen im Produktionsmix einzustellen ----------------------------------------
0 1 2 3 4 5 6 7 8 9 10
17- Die Fähigkeit des Unternehmenslogistiksystems kosteneffizient auf die Veränderungen bei Kundenaufträgen (Größe, Art oder Lieferzeit) zu reagieren ---
0 1 2 3 4 5 6 7 8 9 10
18- Die Möglichkeiten der Firma, künftige Marktveränderungen einzuschätzen -------- 0 1 2 3 4 5 6 7 8 9 10
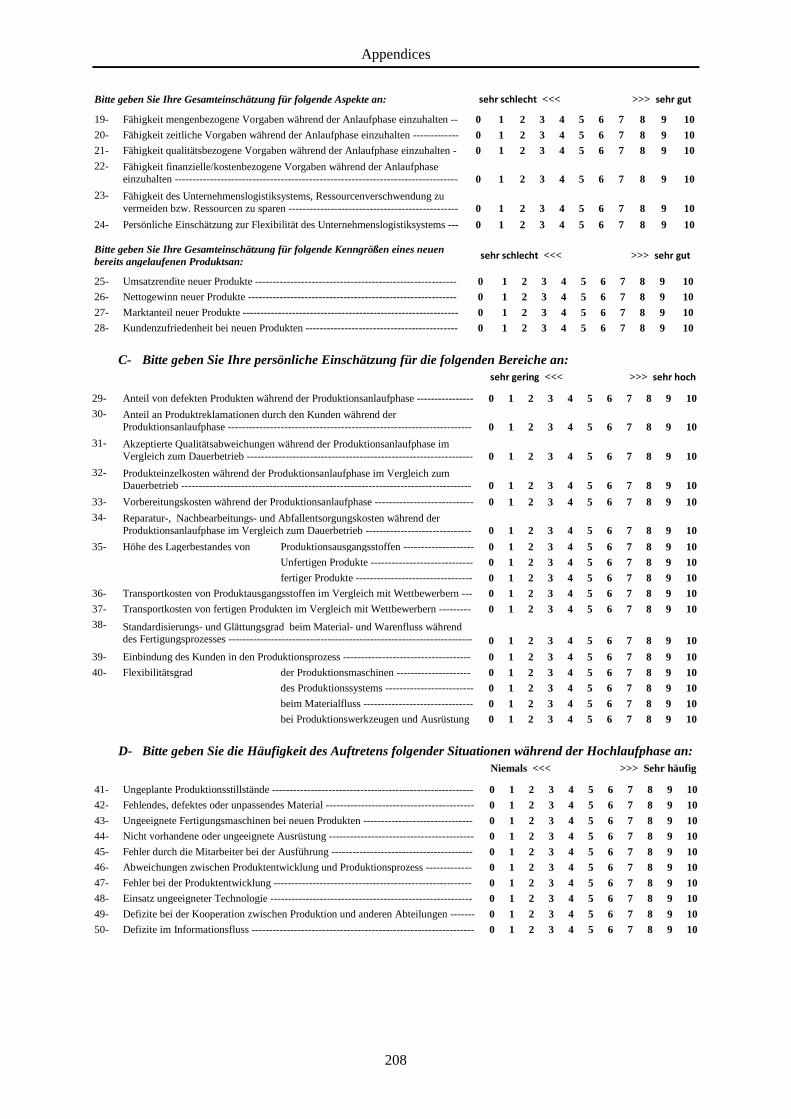
Appendices
208
Bitte geben Sie Ihre Gesamteinschätzung für folgende Aspekte an: sehr schlecht <<< >>> sehr gut
19- Fähigkeit mengenbezogene Vorgaben während der Anlaufphase einzuhalten -- 0 1 2 3 4 5 6 7 8 9 10
20- Fähigkeit zeitliche Vorgaben während der Anlaufphase einzuhalten ------------- 0 1 2 3 4 5 6 7 8 9 10
21- Fähigkeit qualitätsbezogene Vorgaben während der Anlaufphase einzuhalten - 0 1 2 3 4 5 6 7 8 9 10
22- Fähigkeit finanzielle/kostenbezogene Vorgaben während der Anlaufphase einzuhalten --------------------------------------------------------------------------------
0 1 2 3 4 5 6 7 8 9 10
23- Fähigkeit des Unternehmenslogistiksystems, Ressourcenverschwendung zu vermeiden bzw. Ressourcen zu sparen ------------------------------------------------
0 1 2 3 4 5 6 7 8 9 10
24- Persönliche Einschätzung zur Flexibilität des Unternehmenslogistiksystems --- 0 1 2 3 4 5 6 7 8 9 10 Bitte geben Sie Ihre Gesamteinschätzung für folgende Kenngrößen eines neuen bereits angelaufenen Produktsan:
sehr schlecht <<< >>> sehr gut
25- Umsatzrendite neuer Produkte --------------------------------------------------------- 0 1 2 3 4 5 6 7 8 9 10
26- Nettogewinn neuer Produkte ----------------------------------------------------------- 0 1 2 3 4 5 6 7 8 9 10
27- Marktanteil neuer Produkte ------------------------------------------------------------- 0 1 2 3 4 5 6 7 8 9 10
28- Kundenzufriedenheit bei neuen Produkten ------------------------------------------- 0 1 2 3 4 5 6 7 8 9 10
C- Bitte geben Sie Ihre persönliche Einschätzung für die folgenden Bereiche an: sehr gering <<< >>> sehr hoch
29- Anteil von defekten Produkten während der Produktionsanlaufphase ---------------- 0 1 2 3 4 5 6 7 8 9 10
30- Anteil an Produktreklamationen durch den Kunden während der Produktionsanlaufphase ---------------------------------------------------------------------
0 1 2 3 4 5 6 7 8 9 10
31- Akzeptierte Qualitätsabweichungen während der Produktionsanlaufphase im Vergleich zum Dauerbetrieb ----------------------------------------------------------------
0 1 2 3 4 5 6 7 8 9 10
32- Produkteinzelkosten während der Produktionsanlaufphase im Vergleich zum Dauerbetrieb ----------------------------------------------------------------------------------
0 1 2 3 4 5 6 7 8 9 10
33- Vorbereitungskosten während der Produktionsanlaufphase ---------------------------- 0 1 2 3 4 5 6 7 8 9 10
34- Reparatur-, Nachbearbeitungs- und Abfallentsorgungskosten während der Produktionsanlaufphase im Vergleich zum Dauerbetrieb ------------------------------
0 1 2 3 4 5 6 7 8 9 10
35- Höhe des Lagerbestandes von Produktionsausgangsstoffen -------------------- 0 1 2 3 4 5 6 7 8 9 10
Unfertigen Produkte ----------------------------- 0 1 2 3 4 5 6 7 8 9 10
fertiger Produkte --------------------------------- 0 1 2 3 4 5 6 7 8 9 10
36- Transportkosten von Produktausgangsstoffen im Vergleich mit Wettbewerbern --- 0 1 2 3 4 5 6 7 8 9 10
37- Transportkosten von fertigen Produkten im Vergleich mit Wettbewerbern --------- 0 1 2 3 4 5 6 7 8 9 10
38- Standardisierungs- und Glättungsgrad beim Material- und Warenfluss während des Fertigungsprozesses ---------------------------------------------------------------------
0 1 2 3 4 5 6 7 8 9 10
39- Einbindung des Kunden in den Produktionsprozess ------------------------------------ 0 1 2 3 4 5 6 7 8 9 10
40- Flexibilitätsgrad der Produktionsmaschinen --------------------- 0 1 2 3 4 5 6 7 8 9 10
des Produktionssystems ------------------------- 0 1 2 3 4 5 6 7 8 9 10
beim Materialfluss ------------------------------- 0 1 2 3 4 5 6 7 8 9 10
bei Produktionswerkzeugen und Ausrüstung 0 1 2 3 4 5 6 7 8 9 10
D- Bitte geben Sie die Häufigkeit des Auftretens folgender Situationen während der Hochlaufphase an: Niemals <<< >>> Sehr häufig
41- Ungeplante Produktionsstillstände --------------------------------------------------------- 0 1 2 3 4 5 6 7 8 9 10
42- Fehlendes, defektes oder unpassendes Material ------------------------------------------ 0 1 2 3 4 5 6 7 8 9 10
43- Ungeeignete Fertigungsmaschinen bei neuen Produkten ------------------------------- 0 1 2 3 4 5 6 7 8 9 10
44- Nicht vorhandene oder ungeeignete Ausrüstung ----------------------------------------- 0 1 2 3 4 5 6 7 8 9 10
45- Fehler durch die Mitarbeiter bei der Ausführung ---------------------------------------- 0 1 2 3 4 5 6 7 8 9 10
46- Abweichungen zwischen Produktentwicklung und Produktionsprozess ------------- 0 1 2 3 4 5 6 7 8 9 10
47- Fehler bei der Produktentwicklung -------------------------------------------------------- 0 1 2 3 4 5 6 7 8 9 10
48- Einsatz ungeeigneter Technologie --------------------------------------------------------- 0 1 2 3 4 5 6 7 8 9 10
49- Defizite bei der Kooperation zwischen Produktion und anderen Abteilungen ------- 0 1 2 3 4 5 6 7 8 9 10
50- Defizite im Informationsfluss --------------------------------------------------------------- 0 1 2 3 4 5 6 7 8 9 10

Appendices
209
E- Bitte geben Sie Ihre Bewertung für die Anwendung der folgenden Tools (falls verwendet) in Ihrer Firma an:
nicht verwendet
Bewertung, falls verwendet sehr schlecht <<< >>> sehr gut
51- Just in time (JIT) ----------------------------------------------------------------------- 0 1 2 3 4 5 6 7 8 9 10
52- Kanban/pull system -------------------------------------------------------------------- 0 1 2 3 4 5 6 7 8 9 10
53- Lean warehousing/cross-docking ---------------------------------------------------- 0 1 2 3 4 5 6 7 8 9 10
54- Material requirement planning (MRP) ---------------------------------------------- 0 1 2 3 4 5 6 7 8 9 10
55- Supplier milk run ----------------------------------------------------------------------- 0 1 2 3 4 5 6 7 8 9 10
56- Modulare Produktentwicklung ------------------------------------------------------- 0 1 2 3 4 5 6 7 8 9 10
57- Rekonfigurierbares Fertigungssystem ----------------------------------------------- 0 1 2 3 4 5 6 7 8 9 10
58- Vendor managed inventory (VMI) --------------------------------------------------- 0 1 2 3 4 5 6 7 8 9 10
59- Drittanbieterlogistik (3PL) in distribution ------------------------------------------ 0 1 2 3 4 5 6 7 8 9 10

Appendices
210
Appendix 3: Path Analysis Figures
Figure A.1: 𝑝 values for the path analysis results with ramp-up as a first-order formative variable

Appendices
211
Figure A.2: Results of the path analysis for scenario 3
Figure A.3: Results of the path analysis for scenario 4 after removing the cost evaluation indicator

Appendices
212
Figure A.4: Results of the path analysis for scenario 5

Appendices
213
Figure A.5: Sub-hypotheses path analysis with 𝑝 values
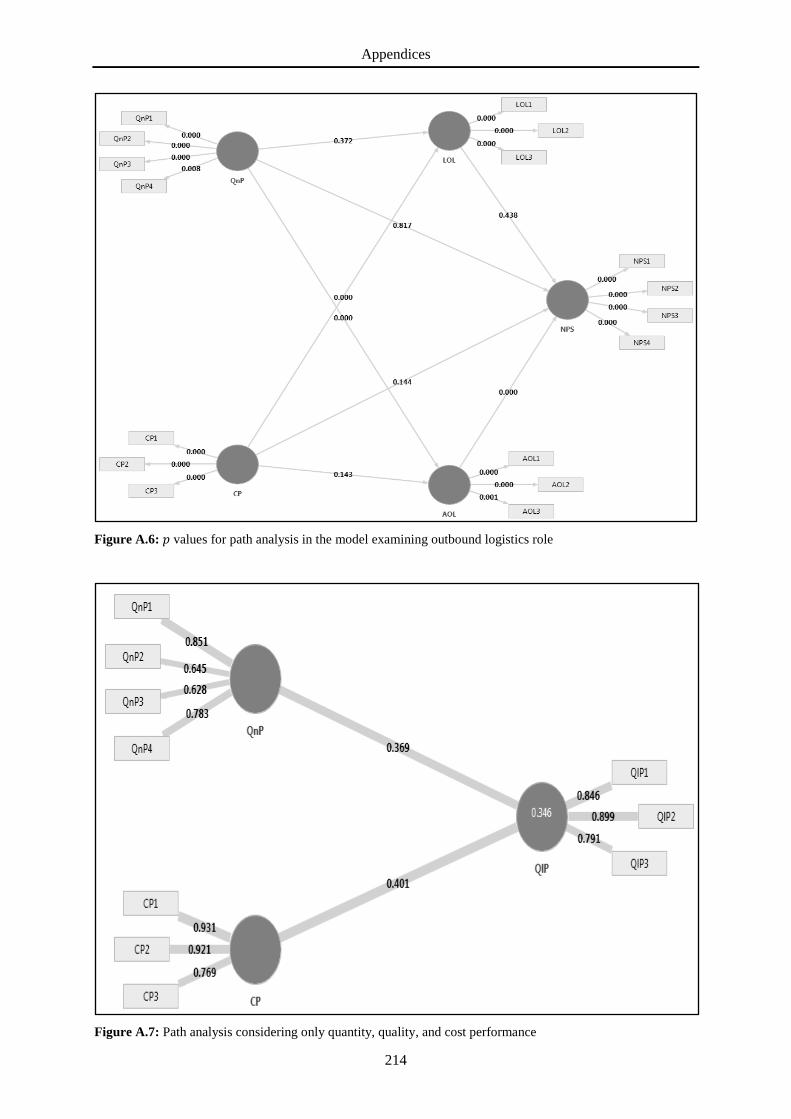
Appendices
214
Figure A.6: 𝑝 values for path analysis in the model examining outbound logistics role
Figure A.7: Path analysis considering only quantity, quality, and cost performance

Appendices
215
Figure A.8: 𝑝 values show insignificant effect for quantity and cost on quality performance

Appendices
216
Appendix 4: Calculated Score of the Latent Variables Table A.1: The calculated values for the latent variables used in scenarios 2 and 3
Cas
e nu
mbe
r
A B
Ramp-up’s problems not considered Ramp-up’s problems considered
Agi
le in
boun
d an
d in
tra
Agi
le in
boun
d an
d in
tra
Ram
p-up
pe
rfor
man
ce
Prod
uct
succ
ess
Lea
n ou
tbou
nd
Agi
le
outb
ound
Agi
le in
boun
d an
d in
tra
Agi
le in
boun
d an
d in
tra
Ram
p-up
pe
rfor
man
ce
Prod
uct
succ
ess
Lea
n ou
tbou
nd
Agi
le
outb
ound
1 0.538 0.356 0.758 0.510 0.510 1.013 0.557 0.431 0.961 0.511 0.502 1.023 2 -1.103 -1.771 -1.525 -1.919 -2.090 -1.816 -1.093 -1.617 -2.011 -1.920 -2.090 -1.811 3 -0.067 0.494 2.122 -0.605 0.790 0.037 -0.061 0.986 1.981 -0.605 0.779 0.035 4 1.628 1.649 0.751 0.817 1.289 1.197 1.621 1.547 1.308 0.818 1.293 1.192 5 1.175 1.307 1.341 0.803 0.759 0.953 1.193 1.564 1.286 0.800 0.758 0.945 6 0.121 -0.683 1.757 0.827 0.330 0.684 0.109 -0.552 1.450 0.828 0.331 0.692 7 -1.302 -0.337 0.242 -0.615 -0.033 -1.348 -1.315 -0.067 -0.393 -0.615 -0.032 -1.343 8 -0.609 0.116 1.054 0.055 -0.158 0.301 -0.601 0.155 1.307 0.055 -0.160 0.308 9 1.327 0.652 -0.844 1.670 -1.190 1.481 1.323 0.604 -1.372 1.671 -1.192 1.491
10 0.376 -1.260 -1.109 0.640 -0.603 0.281 0.402 -1.300 -1.594 0.640 -0.601 0.282 11 1.574 1.525 2.498 1.814 1.726 0.953 1.573 1.516 2.125 1.813 1.727 0.945 12 -0.398 -1.237 -1.593 -0.793 -0.686 0.037 -0.427 -1.267 -1.713 -0.792 -0.687 0.035 13 -0.892 -1.563 0.009 -1.047 0.340 -0.003 -0.891 -1.484 -0.469 -1.049 0.346 -0.018 14 -1.703 -2.026 -2.629 -2.330 -1.199 -1.368 -1.702 -1.969 -2.176 -2.330 -1.200 -1.369 15 1.629 1.502 1.902 1.239 0.908 1.461 1.621 1.361 1.504 1.236 0.908 1.465 16 -1.576 0.785 -0.032 -0.323 -0.035 -1.328 -1.575 0.698 -0.668 -0.326 -0.040 -1.317 17 1.574 -2.050 -0.214 0.827 -1.421 1.685 1.565 -2.049 0.038 0.828 -1.420 1.686 18 -1.264 1.482 -0.123 -1.765 1.139 -1.592 -1.265 1.700 -0.966 -1.765 1.135 -1.590 19 1.371 -1.547 -0.815 0.415 -1.288 0.993 1.370 -1.550 0.092 0.422 -1.285 0.997 20 1.414 -1.872 0.057 1.249 -2.231 0.953 1.405 -1.913 0.107 1.248 -2.232 0.945 21 -0.354 0.362 0.659 -0.476 -1.148 -0.024 -0.360 0.447 0.072 -0.476 -1.142 -0.044 22 0.791 0.710 0.286 0.357 1.445 1.013 0.799 0.558 0.612 0.356 1.442 1.023 23 -0.113 0.163 -0.125 -0.779 -0.331 0.261 -0.116 0.305 -0.762 -0.780 -0.331 0.256 24 1.317 -0.532 0.530 -0.615 -0.843 1.441 1.313 -0.516 -0.032 -0.615 -0.844 1.439 25 -1.186 0.239 -1.421 -0.745 0.114 -1.816 -1.186 0.135 -0.732 -0.744 0.110 -1.811 26 -1.832 1.536 -0.040 0.817 1.280 -1.124 -1.816 1.415 0.120 0.816 1.278 -1.122 27 -1.584 -1.664 -1.449 -0.745 -1.207 -1.124 -1.582 -1.541 -1.836 -0.744 -1.207 -1.122 28 0.790 0.363 -0.079 0.099 -0.843 0.458 0.801 0.290 -0.163 0.098 -0.844 0.477 29 -1.422 -0.021 -0.948 -0.462 -0.406 -1.592 -1.434 0.064 -0.969 -0.463 -0.410 -1.590 30 -0.638 0.042 0.017 0.055 -0.613 0.525 -0.629 0.065 0.919 0.055 -0.616 0.529 31 -0.938 -0.579 -1.158 0.664 0.240 -1.124 -0.951 -0.561 -0.746 0.663 0.246 -1.122 32 0.402 1.261 1.204 0.535 2.082 -0.431 0.388 1.064 0.764 0.535 2.083 -0.433 33 0.077 -0.263 -0.769 0.664 -0.413 -1.144 0.070 -0.221 0.051 0.661 -0.409 -1.148 34 0.132 -0.521 -0.750 -1.344 -0.041 0.281 0.131 -0.475 -0.584 -1.343 -0.039 0.282 35 0.363 0.314 0.498 0.793 -0.976 0.281 0.377 0.374 0.629 0.792 -0.979 0.282 36 -0.525 -0.779 -0.287 -1.741 0.538 -1.368 -0.550 -0.867 -1.361 -1.741 0.545 -1.369 37 0.831 0.841 0.241 0.817 0.991 1.257 0.848 0.955 0.549 0.818 0.994 1.271 38 -0.902 0.039 0.114 -0.615 0.397 -1.348 -0.902 -0.085 0.333 -0.615 0.403 -1.343 39 0.614 0.772 1.166 -0.333 -0.182 0.261 0.610 0.649 0.849 -0.332 -0.181 0.256 40 0.496 0.772 0.985 -0.180 -0.190 0.017 0.492 0.649 0.788 -0.179 -0.189 0.009 41 1.577 1.388 0.751 0.817 -0.182 1.197 1.579 1.253 1.044 0.818 -0.181 1.192 42 1.303 0.961 0.584 0.260 0.694 0.525 1.303 0.798 0.158 0.263 0.694 0.529 43 -1.656 0.041 0.172 0.827 0.263 -0.431 -1.660 0.067 0.242 0.828 0.260 -0.433 44 -0.308 0.781 -0.028 -0.615 1.875 -1.144 -0.330 0.945 0.427 -0.615 1.876 -1.148 45 -0.984 -0.725 -1.270 0.055 -1.058 0.086 -0.976 -0.542 -0.743 0.055 -1.057 0.084 46 0.959 -0.353 -0.068 1.670 -0.843 0.281 0.963 -0.166 0.306 1.671 -0.844 0.282 47 -0.292 -1.262 -0.298 0.640 0.041 -1.368 -0.300 -1.361 -1.338 0.640 0.039 -1.369 48 0.031 0.728 0.557 1.814 -0.630 1.257 0.061 0.889 0.676 1.813 -0.616 1.271 49 -0.179 0.435 -1.041 -0.793 1.131 -1.348 -0.189 0.113 0.106 -0.792 1.128 -1.343 50 -0.092 0.779 0.806 -1.047 2.082 0.261 -0.100 0.801 0.800 1.049 2.083 0.256 51 0.354 -0.243 -0.560 -2.330 -0.115 0.017 0.344 -0.500 0.065 -2.330 -0.110 0.009 52 0.481 -0.110 -0.235 1.239 -0.041 1.197 0.477 -0.009 0.721 1.236 -0.039 1.192 53 -0.428 0.292 0.351 -0.323 0.138 0.301 -0.412 0.191 0.004 -0.326 0.132 0.308 54 0.411 -1.058 -0.954 -0.040 -1.504 0.301 0.411 -1.452 -0.826 -0.040 -1.506 0.308 55 -0.555 0.343 0.127 0.085 0.834 0.017 -0.538 0.257 -0.270 0.087 0.837 0.009 56 -0.754 -0.573 -1.175 -0.490 0.546 -0.452 -0.742 -0.779 -0.869 -0.488 0.552 -0.459