Embed Size (px)
Citation preview

THE ROLE OF Kv3.3 VOLTAGE-GATED POTASSIUM CHANNEL
EXPRESSION IN CEREBELLAR PURKINJE CELLS IN MOTOR
COORDINATION
APPROVED BY SUPERVISORY COMMITTEE
Rolf H. Joho, Ph.D.
David W. Self, Ph.D.
Ege T. Kavalali, Ph.D.
Joachim Herz, M.D.

DEDICATION
I would like to dedicate this work to those who have suffered with depression,
addictions, or intractable pain and inspired me to devote my career, of which this
work is a part, to eventually elucidate with precision the neural reward/aversion
circuitry that underlies these afflictions to allow rational development of potent,
specific, innovative molecular therapeutics to abolish them -and the societal ills
that result. Liberated from these impediments, humanity can turn its attention to
peacefully reaching its entelechy and enjoy life to the fullest.

ACKNOWLEDGMENTS
I thank my committee members, Drs. Joho, Kavalali, Self and Herz, previous
Joho Lab members and those listed as coauthors or acknowledged in
publications arising from this work. I also thank my first laboratory mentor at
Columbia, Dr. Gareth Tibbs, for my initial training in electrophysiology, as well as
Drs. Jay Gibson and Felipe Espinosa for further training at Southwestern. I thank
Drs. Arvind Kumar, Gandham Mahendra, Richard Lu and Mr. Tao Yue for
training in molecular biology. I thank my parents for their unerring, generous
support of a high quality education as well as nurturing my interests in science,
technological innovation and nature. I thank Annemarie and George Roeper for
founding the humanistic Roeper School, which gave my education a solid
foundation along with an equally important sense of responsibility to use that
education to resolve challenging problems facing humanity.
THE ROLE OF Kv3.3 VOLTAGE-GATED POTASSIUM CHANNEL
EXPRESSION IN CEREBELLAR PURKINJE CELLS IN MOTOR
COORDINATION
by
EDWARD CLIFTON HURLOCK IV
DISSERTATION / THESIS
Presented to the Faculty of the Graduate School of Biomedical Sciences
The University of Texas Southwestern Medical Center at Dallas
In Partial Fulfillment of the Requirements
For the Degree of
DOCTOR OF PHILOSOPHY
The University of Texas Southwestern Medical Center at Dallas
Dallas, Texas
December, 2008

v
THE ROLE OF Kv3.3 VOLTAGE-GATED POTASSIUM CHANNEL
EXPRESSION IN CEREBELLAR PURKINJE CELLS IN MOTOR
COORDINATION
Edward Clifton Hurlock IV, Ph.D.
The University of Texas Southwestern Medical Center at Dallas, 2008
Rolf Hans Joho, Ph.D.
I examined the role of the Kv3.3 voltage-gated potassium channel (Kv) subunit
encoded by the Kcnc3 gene in cerebellar Purkinje cells in determining the
properties of complex spikes and in motor coordination. Kv3 channels (Kv3.1-
Kv3.4) enable high-frequency firing by activating and deactivating rapidly during
and after action potentials, respectively. Kv3.3 subunits are expressed in distinct
neuronal cell-types in regions throughout the CNS including the cerebellum, an
area important for motor control. Kcnc3-null mice exhibit a reduced frequency
and broadening of spikes in Purkinje cells as well as ataxia, as in spinocerebellar
ataxia type 13 (SCA13) patients who carry mutations in KCNC3. In contrast to
Purkinje cells, in other neuronal cell types Kv3.3 is co-expressed with

vi
considerable levels of other Kv3 subunits that potentially complement the loss of
Kv3.3, suggesting that Purkinje cellular Kv3.3 function may be important for
motor coordination. I restored expression of the Kv3.3b splice variant specifically
in Purkinje cells by crossing transgenic mice that express Kv3.3b under the
control of the tetracycline transactivator with a line expressing the latter
exclusively in Purkinje cells on a Kcnc3-null background. Whole-cell recordings in
slices at the resting potential of complex spikes in Purkinje neurons revealed
weakened bursts but lengthened simple spike pauses thereafter in Kcnc3-null
mice. Restoration of Kv3.3 completely rescued all spike parameters and sufficed
to rescue motor coordination measured by counting slips traversing a 1-cm beam
and recording lateral deviation of gait on a force plate actometer. The Kcnc3-null
mice heterozygous for Kcnc1 were partially rescued. Gait analysis indicated the
ataxia arises from hypermetria not gait ataxia. When Kcnc1 alleles are
additionally ablated gait ataxia appears. Spikes in large, glutamatergic deep
cerebellar nuclear (DCN) neurons, which express all four Kv3 units, broaden
concurrently, but remain largely normal in Kcnc3-null mice, suggesting functional
redundancy here could underlie severe ataxia in Kcnc1/Kcnc3 double-null
mutants. Therefore, Kv3.3 function in Purkinje neurons is sufficient to account for
the hypermetric Kcnc3-null phenotype and impaired complex spiking represents
a potential underlying mechanism in addition to broadened, decelerated simple
spiking. The behavioral rescue, fast spiking in DCN neurons and normal gait
require Kcnc1.

vii
TABLE OF CONTENTS
DEDICATION .............................................................................................. i
ACKNOWLEDGEMENTS ............................................................................ ii ABSTRACT ................................................................................................ v
TABLE OF CONTENTS ............................................................................. vii
PUBLICATIONS ....................................................................................... xii
FIGURES ................................................................................................. xiii
ABBREVIATIONS ................................................................................... xviii
CHAPTER 1: INTRODUCTION ........................................................................ 1
1.1. KV3 CHANNELS
1.1.1. Kv3 Channel Properties ....................................................................... 7
1.1.1.1. Genes ............................................................................................ 7
1.1.1.2. Proteins ......................................................................................... 7
1.1.1.3. Biophysical Properties ................................................................... 9
1.1.1.4. Modulation ..................................................................................... 9
1.1.1.5. Pharmacology .............................................................................. 10
1.1.2. Expression Pattern ............................................................................ 11
1.1.2.1. Kv3.1 ........................................................................................... 12
1.1.2.2. Kv3.2 ........................................................................................... 13
1.1.2.3. Kv3.3 ........................................................................................... 13
1.1.2.4. Kv3.4 ........................................................................................... 14
1.2. KV3 CHANNEL FUNCTION .................................................................... 14
1.2.1. Kv3.1 ................................................................................................. 15
1.2.2. Kv3.2 ................................................................................................. 16
1.2.3. Kv3.3 ................................................................................................. 17
1.2.4. Kv3.3 ................................................................................................. 18
1.3. PHYSIOLOGY OF CEREBELLAR CIRCUITRY ....................................... 18
1.3.1. Cerebellar Cortex ............................................................................... 21
1.3.1.1. Granule Cells ................................................................................ 21
1.3.1.2. Purkinje Cells ................................................................................ 22
1.3.1.3. Basket Cells .................................................................................. 25
1.3.1.4. Stellate Cells ................................................................................. 26
1.3.1.5. Golgi Cells .................................................................................... 26
1.3.2. Deep Cerebellar Nuclei ...................................................................... 26
1.3.2.2. Small Neurons .............................................................................. 26
1.3.3. Vestibular Nuclei ................................................................................ 27
1.4. KV3 CHANNELS IN THE CEREBELLUM ................................................ 28
1.4.1. Cerebellar Cortex ............................................................................... 29
1.4.1.1. Granule Cells ................................................................................ 29
1.4.1.2. Purkinje Cells ................................................................................ 29

viii
1.4.1.3. Basket Cells .................................................................................. 30
1.4.1.4. Stellate Cells ................................................................................. 30
1.4.1.5. Golgi Cells .................................................................................... 31
1.4.2. Deep Cerebellar Nuclei ...................................................................... 31
1.4.2.1. Large Neurons ............................................................................. 31
1.4.2.2. Small Neurons ............................................................................. 31
1.4.3. Vestibular Nuclei ................................................................................ 32
CHAPTER 2: REVIEW OF THE LITERATURE ................................................ 33
2.1. ATAXIA IN MUTANT MICE AND HUMANS ............................................ 33
2.1.1. Cerebellar Ataxia ............................................................................... 32
2.1.2. SCA13 ............................................................................................... 34
2.1.3. Kcnc1-Null Mutant Mice ..................................................................... 35
2.1.4. Kcnc3-Null Mutant Mice ..................................................................... 37
2.1.5. DKO Mice .......................................................................................... 37
2.2. OTHER MUTANT MOUSE MODELS OF CEREBELLAR ATAXIA .......... 38
2.2.1. Pcd Mice ............................................................................................ 38
2.2.2. Natural and Engineered Channelopathies .......................................... 39
2.2.2.1. Voltage-Gated Potassium Channels ............................................ 39
2.2.2.2. SK Channels ................................................................................ 40
2.2.2.3. BK Channels ................................................................................ 40
2.2.2.4. Calcium Channels ........................................................................ 41
2.2.2.5. Sodium Channels ........................................................................ 41
2.2.2.6. HCN Channels ............................................................................. 42
2.2.3. Calcium-Binding Protein Mutants ....................................................... 42
2.2.4. mGluR1 ............................................................................................. 43
2.2.5. ROR-α ............................................................................................... 43
2.2.6. SCA8 ................................................................................................. 43
CHAPTER 3: METHODS.................................................................................. 45
3.1. GENERATION OF NULL MUTANT AND TRANSGENIC MICE .............. 45
3.1.1. Null Mice ............................................................................................ 45
3.1.1.1. Generation and Genotyping of Kcnc1-null allele .......................... 45
3.1.1.2. Generation and Genotyping of Kcnc1-null allele .......................... 46
3.1.1.3. Generation of Kcnc1/Kcnc3-null allele .......................................... 47
3.1.2. Transgenic Mice ................................................................................ 48
3.1.2.1. Generation of pBIKcnc3b-eGFP transgenic mice ........................ 48
3.1.2.2. Generation of L7-tTA/pBIKcnc3b-eGFP bi-transgenic mice ........ 49
3.1.3 Breeding ............................................................................................ 50
3.2. CHARACTERIZATION OF GENE EXPRESSION ................................... 51
3.2.1. Western Blot Analysis ........................................................................ 51
3.2.1.1. Preparation of Protein Samples .................................................. 51
3.2.1.2. SDS-PAGE and Transfer to Blot ................................................. 51
3.2.1.3. Immunoblotting and Imaging ....................................................... 51
3.2.2. Immunofluorescence ......................................................................... 52
ix
3.2.2.1. Characterization of Kv3 Expression ............................................ 52
3.2.2.2. Post-Hoc Identification of Alexa488-filled Neurons from Patch-Clamp
Recordings .................................................................................. 53
3.3. BEHAVIORAL ANALYSIS ....................................................................... 53
3.3.1. Analysis of Motor Coordination .......................................................... 53
3.3.1.1. Force Plate Actometer ................................................................. 53
3.3.1.2. Beam Test ................................................................................... 54
3.3.1.3. Rotarod ........................................................................................ 56
3.3.2. Gait Analysis ...................................................................................... 56
3.3.2.1. DigiGait™ Analysis ...................................................................... 56
3.3.2.2. Footprint Analysis ........................................................................ 57
3.3.3. Other Motor Phenotypes .................................................................... 58
3.3.3.1. Twitching Score ........................................................................... 58
3.3.3.2. Electromyography (EMG) Recordings .......................................... 58
3.3.3.3. Grip Test ...................................................................................... 59
3.3.4.4. Rocking Ball Test ............................................................................ 59
3.3.4.5. Harmaline Tremor ........................................................................... 59
3.4. BRAIN SLICE ELECTROPHYSIOLOGY ................................................. 60
3.4.1. Purkinje Cells ..................................................................................... 60
3.4.1.1. Brain Slice Preparation ................................................................ 60
3.4.1.2. Whole-Cell Patch-Clamp Recording ............................................. 61
3.4.1.3. Spontaneous Simple Spike Recordings ....................................... 62
3.4.1.4. Spike Frequency As A Function of Injected Current (F-I) Relation 62
3.4.1.5. Climbing Fiber Stimulation ........................................................... 62
3.4.2. DCN Neurons .................................................................................... 63
3.4.2.1. Brain Slice Preparation ................................................................ 63
3.4.2.2. Intrinsic Firing Properties ............................................................. 64
3.4.2.3. Stimulation of Purkinje Cell Terminals in the DCN ........................ 64
3.4.2.4. IPSC Recordings ......................................................................... 65
3.4.2.5. Post-Hoc Identification ................................................................. 66
3.5. DATA ANALYSIS AND PRESENTATION ................................................ 67
3.5.1. Characterization of Gene Expression ................................................. 67
3.5.1.1. Imaging ........................................................................................ 67
3.5.2. Behavior ............................................................................................ 68
3.5.2.1. Analysis ....................................................................................... 69
3.5.2.2. Presentation ................................................................................. 70
3.5.3. Brain Slice Electrophysiology ............................................................. 70
3.5.3.1. Analysis ....................................................................................... 70
3.5.3.2. Presentation ........................................................................... 71
CHAPTER 4: RESULTS ................................................................................... 72
4.1. A TRANSGENIC APPROACH TO RESTORE KV3.3 EXPRESSION IN
PURKINJE CELLS OF MICE LACKING KCNC3 ...................................... 72
4.1.1. Characterization of Transgenic Lines ................................................. 72

x
4.1.1.1. Transgenic Construct Design ....................................................... 72
4.1.1.2. Sceening of Transgenic Founders ............................................... 73
4.1.1.3. The Transgenes Are Expressed Exclusively in Purkinje Cells
Throughout the Cerebellum .......................................................... 74
4.1.1.4. The Subcellular Localization of the Kv3.3b Splice Variant Used in the
Construct Matches That of Endogenous Kv3.3b in the Absence of the
Other Splice Variants ................................................................... 76
4.1.1.5. The tet-Regulated Transgene Construct Is Not Leaky and Kv3.3b Is
Absent Outside the Cerebellum ................................................... 76
4.2. KV3.3 EXPRESSION IN PURKINJE CELLS IS SUFFICIENT TO RESCUE
MOTOR COORDINATION IN KCNC3-NULL MICE ................................. 78
4.2.1. Motor Coordination ............................................................................ 80
4.2.1.1. Force Plate Actometer ................................................................. 81
4.2.1.2. Beam Test ................................................................................... 82
4.2.1.3. Rotarod (Pilot Study) .................................................................... 88
4.2.2. Gait .................................................................................................... 89
4.2.2.1. DigiGait™ Analysis ...................................................................... 92
4.2.2.2. Footprint Analysis ........................................................................ 94
4.2.3. Other Motor Phenotypes .................................................................. 100
4.2.3.1. Twitching ................................................................................... 100
4.2.3.2. EMG Recordings (Pilot Study) ................................................... 101
4.2.3.3. Grip Test .................................................................................... 104
4.2.3.4. Equilibrium and Postural Control: The Rocking Ball Test (Pilot
Test) .......................................................................................... 105
4.2.3.5. Harmaline .................................................................................. 106
4.3. RESTORATION OF KV3.3B EXPRESSION IN PURKINJE CELLS
RESCUES WILDTYPE OUTPUT TO DCN NEURONS WHICH EXHIBIT
KCNC-ALLELE DEPENDENT SPIKE BROADENING ............................ 107
4.3.1. Purkinje Cells ................................................................................... 108
4.3.1.1. Intrinsic Firing Properties ........................................................... 108
4.3.1.2. Response to Climbing Fiber Input .............................................. 111
4.3.2. DCN Neurons .................................................................................. 114
4.3.2.1. Post-Hoc Histology .................................................................... 116
4.3.2.2. Intrinsic Firing Properties ........................................................... 117
4.3.2.3. Depression of Input from Purkinje Cells to DCN Neurons (Pilot
Study) ........................................................................................ 122
4.3.2.4. Response to Input from Purkinje Cells ....................................... 127
4.4. REDUNDANT EXPRESSION OF KV3 CHANNELS IN CEREBELLAR
NEURONAL CELL TYPES ..................................................................... 136
4.4.1. Cerebellar Cortex ............................................................................. 137
4.4.1.1. Somata and Axons of Purkinje Neurons ..................................... 137
4.4.1.2. Granule Cells ............................................................................. 140
4.4.1.3. Basket Cells ............................................................................... 140

xi
4.4.1.4. Stellate Cells .............................................................................. 141
4.4.1.5. Golgi Cells ................................................................................. 142
4.4.2. DCN Neurons .................................................................................. 143
4.4.2.1. Large Glutamatergic Neurons .................................................... 145
4.4.2.2. Small Neurons ........................................................................... 146
CHAPTER 5: CONCLUSIONS AND RECOMENDATIONS ............................ 148
5.1. RESTORATION OF KV3.3 FUNCTION IN PURKINJE CELLS CORRECTS
HYPERMETRIA IN KCNC3-NULL MICE BUT NOT GAIT ABNORMALITIES APPEAR AS KCNC1 ALLELES ARE ADDITIONALLY LOST ................. 149
5.1.1. Expression of Kv3.3 Channels in Purkinje Cells Is Involved in
Coordination of Movement Velocity .................................................. 149
5.1.2. Kv3.3b Delivered by A Transgenic Line Is Sufficient to Rescue
Behavior .......................................................................................... 149
5.1.3. Hypermetria Is the Deficit Rescued in Kcnc3-Null Mice .................... 151
5.1.4. Additional Loss of Kcnc1 Leads to Gait Abnormalities ..................... 154
5.2. COMPLEX SPIKES ARE ALTERED IN KCNC3-NULL MICE AND
PURKINJE CELL FIRING IS RESTORED IN RESCUE MICE ................ 155
5.2.1. Complex Spikes Are Altered in Kcnc3-Null Mice ............................... 156
5.2.2. Normal Purkinje Cell Spiking Is Rescued by Restoring Kv3.3b to Purkinje
Cells ................................................................................................. 158
5.3. FIRING IN DCN NEURONS DOWNSTREAM IS ALTERED UPON
ADDITIONAL LOSS OF KCNC1 ............................................................. 159
5.3.1. Action Potential Properties of DCN Neurons Become Significantly
Altered As Kcnc1 Alleles Are Ablated ............................................... 160
5.3.2. High-Frequency Firing of DCN Neurons Becomes Significantly Altered
As Kcnc1 Alleles Are Ablated ............................................................ 161
5.4. INPUT TO DCN NEURONS FROM PURKINJE CELLS IS ALTERED IN KCNC3-NULL MICE ...................................................................................... 163
5.4.1. Synaptic Depression ......................................................................... 163
5.4.2. The Effect of Altered Purkinje Cell Input to the DCN on DCN Output 165
5.5. CO-EXPRESSION OF KV3 SUBUNITS DOES NOT IMPLY FUNCTIONAL
REDUNDANCY ...................................................................................... 170
5.5.1. Cerebellar Cortex .............................................................................. 171
5.5.2. DCN .................................................................................................. 171

xii
PUBLICATIONS
Hurlock EC, Bose M, Pierce G, Joho RH. Rescue of motor coordination by Purkinje cell-targeted restoration of Kv3.3 channels in Kcnc3-null mice requires Kcnc1. (in preparation)
Joho RH, Hurlock EC. The Role of Kv3-type Channels in Cerebellar Physiology and Behavior. Cerebellum (in press)
Hurlock EC, McMahon A, Joho RH. Purkinje-cell-restricted restoration of Kv3.3 function restores complex spikes and rescues motor coordination in Kcnc3 mutants. J Neurosci. 2008 Apr 30;28(18):4640-8.
Hurlock EC, McMahon A, McKay BE, Turner RW and Joho RH. Purkinje cell- restricted restoration of Kv3.3 channel function rescues complex spikes and motor coordination in Kv3.3-mutant mice. Proc. Soc. Neurosci. 2007.

xiii
FIGURES
1.1 The action potential 3
1.2 Coding regions of Kv3 channel genes and splice variants thereof 6
1.3 The Kv channel protein 8
1.4 Cerebellar circuitry and distribution of Kv3 subunit expression therein 19
1.5 Experimental setup for intracellular recording of climbing fiber responses
in parasagittal cerebellar acute slices in vitro 21
3.1 Mouse ambulating freely on the force plate actometer 53
3.2 Mouse traversing the 1-cm beam 55
3.3 Calculation of the lateral deviation index 68
4.1 Transgenic approach to restore Kv3.3 expression specifically in Purkinje
cells 73
4.2 Immunofluorescent detection of Kv3.3b using Alexafluor 568 and native
eGFP fluorescence in Purkinje cells in the cerebellar cortex 75
4.3 Western blot 77
4.4 Ability of Kv3.3b restoration in Purkinje cells to rescue normal lateral
deviation on the force plate actometer 81
4.5 Ability of Kv3.3b restoration in Purkinje cells to rescue motor coordination on
the narrow beam 83
4.6 Ability of Kv3.3b restoration in Purkinje cells to rescue motor coordination or
balance on the narrow beam 85
4.7 Kcnc3-null mice learn on the accelerating rotarod 88
4.8 The DigiGait™ apparatus 90
4.9 Results of DigiGait™ analysis 91

xiv
4.10 Kcnc3-null mice do not exhibit an impairment in running at high forced
speeds on the DigiGait™ treadmill 92
4.11 Self-paced gait patterns of mice lacking Kcnc3 and Kcnc1 alleles 95
4.12 Scatter plot of paw discordance data from figure 4.11 96
4.13 Results of footprint analysis 97
4.14 Restoration of Kv3.3b to Purkinje cells does not rescue increased muscle
twitches in +/-;-/- mice 100
4.15 Abnormal EMG activity but normal motor units in Kcnc3-null mice during
twitching 103
4.16 Mouse performing the grip test 104
4.17 The +/+;-/- mice are able to stay on the rocking ball suggesting posture and
balance are intact 105
4.18 Input resistance of Purkinje cells 108
4.19 Spike frequency parameters of Purkinje cells 110
4.20 Current steps to determine F-I relation 111
4.21 Purkinje-cell-targeted Kv3.3 expression restores normal action potentials
and complex spikes in Kcnc3-null mutants 113
4.22 Climbing fiber responses evoked from a hyperpolarized potential 113
4.23 Electrophysiological signature of weak and transient, strong bursting
neurons in the DCN 115
4.24 Alexafluor488-filled DCN neurons from whole-cell recordings 117
4.25 Input resistance of recorded large, glutamatergic DCN neurons 118
4.26 Action potential properties of large, glutamatergic DCN neurons 119
4.27 Intracellularly-recorded interspike interval at the resting potential in large,
glutamatergic DCN neurons 120

xv
4.28 Spike frequency as a function of injected current in large, glutamatergic
DCN neurons 121
4.29 Stimulation train with frequencies approximating wildtype Purkinje cell
spiking 124
4.30 Synaptic depression at the synapse made by Purkinje cells on DCN
neurons 125
4.31 Verification of the GABA-A-mediated nature of stimulated eIPSCs by puffer
application of the GABA-A anatagonist SR-95531 126
4.32 Annotated voltage trace of a DCN neuron in current clamp using a protocol
developed to explore the effects of Purkinje cell input to the DCN 128
4.33 Response of a DCN neuron to Purkinje cell stimulation at -55 mV 130
4.34 Response of a DCN neuron to Purkinje cell stimulation at -60 mV 130
4.35 Stimulation of Purkinje cell axons when the recorded DCN neuron is at a
hyperpolarized potential is capable of leading to eventual net depolarization
and time constant acceleration 132
4.36 GABAergic DCN neuron responds to eIPSPs elicited by short trains of
Purkinje cell axon stimulation from a hyperpolarized potential with bistable
shifts 133
4.37 Spontaneously bistable GABAergic DCN neuron responds to eIPSPs
elicited by short trains of Purkinje cell axon stimulation from a
hyperpolarized potential with bistable shifts 133
4.38 Comparable recordings of a DCN neuron responding to Purkinje cell
stimulation at the frequency characteristic of wildtype or mice lacking Kv3.3
in Purkinje cells 134
4.39 Kv3.2 is not detected in cerebellar cortex 137
4.40 Expression of Kv3.4 in Purkinje neurons, basket cell terminals, putative
stellate and Golgi cells in cerebellar cortex 138
4.41 Expression of Kv3.3b in the cerebellar cortex 139

xvi
4.42 Expression of Kv3.3 and Kv3.4 in Purkinje cell terminals in the DCN 140
4.43 Revised diagram of cerebellar circuitry incorporating new information
gleaned in this study 142
4.44 Kv3.3b and Kv3.2 are expressed in large, glutamatergic DCN
neurons 143
4.45 Kv3.1b and Kv3.3b consistently are co-expressed by large glutamatergic
neurons 143
4.46 Kv3.1b and Kv3.2 , Kv3.1b and Kv3.4 as well as Kv3.3b and Kv3.4 all are
co-expressed in large DCN neurons 146
5.1 The severity of gait ataxia correlates strikingly well with changes in the
intrinsic firing properties of large glutamatergic DCN neurons 159
5.2 Simple spikes following complex spikes in the same cell are remarkably
consistent in their phase 168

xvii

xviii
ABBREVIATIONS
+/+;+/+ Wildtype
+/+;+/- Kcnc3-null allele heterozygote
+/+;-/- Kcnc3-null mutant
+/-;-/- Kcnc3-null mutant additionally lacking one Kcnc1 allele
-/-;-/- Kcnc1/Kcnc3 double-null mutant
+/-;+/- Kcnc1/Kcnc3 double-null heterozygote
-/-;+/+ Kcnc1-null
aCSF Artificial cerebrospinal fluid
ANOVA Analysis of variance
4-AP 4-aminopyridine
BDS-I Blood-depressing substance I
BK channel Large conductance calcium-activated potassium channel
cM Centimorgan
cc Cubic centimeter
CMV Cytomegalovirus
CNS Central nervous system
COF Center of force
DAB Diaminobenzidine
D-AP5 D-(-)-2-amino-5-phosphonopentanoic acid
DCN Deep cerebellar nuclear or nuclei
DKO Kcnc1/Kcnc3 double-null mutant
DNA Deoxyribonucleic acid
DNQX 6,7-Dinitroquinoxaline-2,3-dione
DPBS Dulbecco‟s phosphate-buffered saline
eGFP Enhanced green fluorescent protein
ECl Chloride equilibrium potential
eIPSC Excitatory inhibitory postsynaptic current
eIPSP Excitatory inhibitory postsynaptic potential
EK+ Potassium equilibrium potential

xix
EMG Electromyography
ENa Sodium equilibrium potential
ER Endoplasmic reticulum
EPSP Excitatory postsynaptic potential
ES cells Embryonic stem cells
F–I Frequency as a function of injected current
GAD67 Glutamic acid decarboxylase 67
GAD65 Glutamic acid decarboxylase 65
GABA -aminobutyric acid decarboxylase
HCN Hyperpolarization-activated, cyclic-nucleotide gated, cation non-
selective channels
HEPES 4-(2-hydroxyethyl)-1-piperazineethanesulfonic acid
Hz Hertz
IC50 Median inhibition concentration at which 50% inhibition occurs
I.D. Inner diameter
IPSC Inhibitory postsynaptic current
IPSP Inhbitory postsynaptic potential
Kv Voltage-gated potassium [channel]
LDI Lateral deviation index
LTD Long-term depression
LTP Long-term potentiation
MΩ Megaohms
MDCK Madin-Darby canine kidney cells
mGluR1 Metabotropic glutamate receptor type-1
MiRP2 Mink-related peptide type 2
mOsm Milliosmole
mRNA Messenger ribonucleic acid
NBQX 2,3-dihydroxy-6-nitro-7-sulfamoyl-benzoquinoxaline-2,3-dione
NCBI National Center for Biotechnology Information
O.D. Outer diameter

xx
pBI pBIeGFP bicistronic vector
PCR Polymerase chain reaction
PKA Protein kinase A
PKC Protein kinase C
RNA Ribonucleic acid
ROR- Retinoid-related orphan receptor-
RT-PCR Reverse transcription-polymerase chain reaction
SCA Spinocerebellar ataxia
SCA13 Spinocerebellar ataxia type 13
SCA3 Spinocerebellar ataxia type 3
SCA6 Spinocerebellar ataxia type 6
SCA8 Spinocerebellar ataxia type 8
SDS Sodium dodecyl sulfate
SK channel Small-conductance calcium-activated potassium channel
TBS-T Tris-buffered saline with Tween20
TEA Tetraethylammonium
TRE Tetracycline-responsive element
tTA Tetracycline transactivator
3‟UTR 3‟ untranslated region
5‟UTR 5‟ untranslated region

1
CHAPTER ONE Introduction
1.1. KV3 CHANNELS
Ion channels are a diverse and vast class of proteins present across phylogeny
vital at the systems and even cellular levels. Whenever cells must passively
conduct ions through the plasma membrane ion channels are employed, with the
notable exception of connexins that form gap junctions between apposed plasma
membranes of adjacent cells for the direct exchange of ions and small organic
solutes. Cells of every mammalian tissue express ion channel genes of some
kind both for basic maintenance of a resting potential and ion exchange as well
as in numerous tissues specialized functions such as filtering in the kidney,
regulation of muscle contraction in myocytes, control of hormone secretion by
cells of glandular tissues such as pancreatic islet cells, maturation of T
lymphocytes and the flow of information in the nervous system.
In excitable tissues such as the nervous system and muscle ion channels
are especially critical for the rapid transmission of signals for animals to react
with agility either to avoid danger or procure resources essential for survival.
Speed can be a matter of life and death, exerting substantial evolutionary
pressure. Although muscle contraction itself is a relatively slow process not
requiring coding on a precision scale, the initial command to contract must often
be brisk. For the correct motor response to be selected, considerable
computation may be required involving communication between a plethora of
distant neurons, not to mention for the output to be coordinated finely in both
speed and timing relative to other movements. Rapid transduction of nerve
impulses into muscle contraction, rapid transmission of information from the brain
to the musculature, and rapid transmission of information in the brain are crucial.
The insulation of neuronal axons by myelin, or alternatively their substantial
width, attest to the evolutionary need for speed. Ion channels can be divided into
classes that include channels that are slowly modulated, ligand-gated ion

2
channels and voltage-gated ion channels, with some responding to a
combination of influences. Critical for speed are the ligand-gated and voltage-
gated channels. Ligand-gated channels allow for rapid neurotransmission and, at
the neuromuscular junction, depolarization of muscle in response to neural
commands. Voltage-gated ion channels are essential for the production of action
potentials which allow expedited transmission of signals between distant organs
on a millisecond timescale.
The ligand-gated and voltage-gated channels are mainly comprised of
huge superfamilies of related proteins. Pentameric ligand-gated channels include
nicotinic acetylcholine, GABA-A, glycine and 5-HT3 receptors. Glutamate
receptors belong to a smaller family composed of tetramers. TRP channels, IP3
receptors and ryanodine receptors make up still other families. Diversity is
increased by differential mRNA processing. In contrast, metabotropic, G protein-
linked receptors often for the same ligands mediate signals on the timescale of
seconds, minutes or even longer, often ultimately modulating ion channels as
their downstream effectors among other targets. Voltage-gated ion channels
largely appear to descend from a common ancestor, with calcium channels likely
the oldest. These channels comprise sodium, calcium and potassium channels,
as well as channels with mixed sodium-potassium conductances such as cyclic-
nucleotide gated (CNG) and hyperpolarization-activated, cyclic-nucleotide gated,
cation non-selective (HCN) channels.
Molecularly, sodium and calcium channels are composed of four
concatemerized transmembrane domains each containing six transmembrane
helices or segments, S1-S6. Potassium channels and close relatives such as
HCN channels exist instead as four separate subunits that are assembled
together as tetramers or, if they are from the same subfamily (Xu et al., 1995),
heterotetramers containing structurally different subunits. All three main families
are encoded by a number of genes, but the diversity is most vast by far in the
case of potassium channels, where further diversity results from extensive use of
differential mRNA processing into splice and other variants. Potassium channels

3
are the best characterized by molecular biology historically since they are
encoded by shorter sequences that lack the repeated domains of the other major
families that confounded subcloning as repeats are prone to DNA
rearrangement. The three fundamental voltage-gated channel families work
together to produce neuronal and myocyte action potentials.
Action potentials (Fig. 1.1) serve as discrete signals encoding information
in neurons at a high bandwidth so long as the postsynaptic cell, or presynaptic
terminal, can distinguish differences in frequency. These all-or-none signals
trigger presynaptic calcium influx through high-voltage activated calcium
channels that selectively respond to depolarization attained during action
potentials. Calcium influx in turn gates neurotransmitter release. The longer the
membrane potential dwells at a level that opens calcium channels, the more
transmitter is released, in proportion to the third to fifth power of the free calcium
concentration.
Figure 1.1. The action potential. Sodium channels open
during the upstroke as depolarization increases together
with, at a delay, potassium channels that repolarize the
action potential during the downstroke or decay. Both
channel types close once the membrane is repolarized.
Dissecting the ionic contributions to
action potentials, sodium channels passing
cation current inward initiate the
depolarization by progressively and
regeneratively recruiting still more sodium
channels as depolarization increases once
other factors allow the membrane potential to
approach a threshold value where a critical
number of sodium channels open to begin the chain reaction. The voltage-
dependence of the channel is such that the probability of opening increases with
depolarization. Channel behavior is stochastic, entailing that there is always
Kv3 Channels: Key Biophysical PropertiesTetrameric channel protein:
Kv3.1-4 encoded by Kcnc genes: Kcnc1-4
Membrane
Splice variation
in C terminus
K+
Na+ K+
Depolarized:HVCaCh activation
NaCh inactivation
Hyperpolarized:NaCh deinactivation
The Kv3 subfamily activates
and deactivates 10x faster than
other voltage-gated K+ channels
Kv3.3-null “SKO” +/+;-/-
Kv3.3-null heterozygous for Kv3.1 null “Triple” +/-;-/-
Kv3.1/Kv3.3-null “DKO” -/-;-/-

4
some percentage of channels in a given state based on the probability of that
state under certain conditions like voltage. As soon as the voltage is depolarized
enough to trigger a sufficient percentage of the channel population to enter the
open state to induce a collective conductance strong enough to augment the
depolarization further in a self-reinforcing manner threshold is reached. The
membrane potential then rises toward the equilibrium potential for sodium and
the conductance decreases as it is approached due to the diminishing driving
force. In addition, two factors also slow the rise as the peak is approached, the
opening of potassium channels mediating a repolarizing outward cation current
and the voltage-dependent inactivation of sodium channels. Potassium channels
of the delayed-rectifier type open with depolarization at a delay after the sodium
channels create it. Inactivation is a process separate physically and conceptually
from channel deactivation, the mere reverse of activation. Inactivated channels
cannot be activated again unless they are first deinactivated, a process that
accelerates with increasing hyperpolarization after action potentials. Some
potassium channels are only weakly voltage-sensitive and rather gated by the
calcium concentration, which increases rapidly near high-voltage activated
calcium channels opened by action potentials. Namely, large-conductance BK-
and small conductance SK-type potassium channels are weakly sensitive or
insensitive to voltage respectively but gated quite rapidly by calcium. The
downstroke of the spike occurs when potassium channels gain the upper hand
over sodium channels, aided by the strong driving force of potassium, far from its
hyperpolarized equilibrium potential (EK+). This action potential repolarization
continues toward EK+ often beyond the resting potential resulting in an
afterhyperpolarization, which can be divided into distinct fast and slow
components sometimes when delayed rectifiers are present with different
kinetics. Closer to EK+ the potassium conductance diminishes from both the
driving force reduction and closing of potassium channels due to deactivation or,
in the case of calcium-activated potassium channels, eventually calcium
extrusion and buffering. Many delayed rectifiers can also eventually enter an

5
inactivated state like sodium channels. In myocytes, which function on the slower
timescale of contraction, sodium channels only initiate the rising phase normally
while calcium channels, which have slower kinetics, activate to produce the
broad shoulder of depolarization that is not suppressed by fast potassium
channels.
Voltage-gated potassium channels also influence spike rate. Specialized
voltage-gated potassium channels can only open once the membrane potential
has hyperpolarized due to fast inactivation at the depolarized potentials that
initially activate them but deactivate slowly enough to exert an effect on the
membrane potential before closing that mediate the “A-type” current. Typically
channels of the Kv4 (Shal in fly) subfamily are the origin of this current. Such
channels contribute nominally to repolarization but greatly to setting the
interspike interval that determines spike frequency. Calcium-activated potassium
channels can also lengthen the interspike interval depending how long calcium
continues to flow through slow calcium channels yet to close or lingers after the
spike. Delayed rectifiers control the interspike interval based on how quickly they
make way for the next spike by deactivating. After repolarization Kv1 (Shaker in
fly) and Kv2 (Shab in fly) subfamily members remain open for milliseconds
whereas Kv3 (Shaw in fly) subfamily members deactivate, as well as activate,
faster than any other subfamily in fractions of a millisecond.
Kv3-type channels facilitate high-frequency firing of action potentials by
both rapid activation and deactivation because another determinant of the
interspike interval is the number of available sodium channels that have not
undergone inactivation. By keeping spikes brief through fast activation, less
sodium channels enter the inactivated state than otherwise if the membrane
potential dwelt longer in a depolarized range. A robust, deep
afterhyperpolarization induces more efficient recovery from inactivation because
deinactivation is faster at more hyperpolarized voltages. The large conductance
of Kv3 channels may help in this regard.

6
Kv3.1a
Kv3.1b
Kv3.2a
Kv3.2d
Kv3.2b
Kv3.2c
Kv3.3b
Kv3.3a
Kv3.3c
Kv3.4b
Kv3.4a
Kv3.4c
M
M
M
M
M
M
S1 S2 S3 S4 S5 P S6
S1 S2 S3 S4 S5 P S6
S1 S2 S3 S4 S5 P S6
S1 S2 S3 S4 S5 P S6
S1 S2 S3 S4 S5 P S6
S1 S2 S3 S4 S5 P S6
M
M
M
M
M
M
S1 S2 S3 S4 S5 P S6
S1 S2 S3 S4 S5 P S6
S1 S2 S3 S4 S5 P S6
S1 S2 S3 S4 S5 P S6
S1 S2 S3 S4 S5 P S6
S1 S2 S3 S4 S5 P S6
511
585
613
624
638
635
679
889
769
583
625
627
M
M
M
M
M
M

7
Figure 1.2. Coding regions of Kv3 channel genes and splice variants thereof, based on Rudy et al.,
1999. The methionines, including internal and alternative methionines, are indicated with an M.
Exons on which coding regions are present appear in different colors. Protein lengths are denoted
at right. The core transmembrane segments (S1-S6) and pore region (P) are in the first coding
exon.
1.1.1. Kv3 Channel Properties
1.1.1.1. Genes
The four Kv3 subunits are designated Kv3.1-4 and encoded by the genes Kcnc1-
4 in rodents or KCNC1-4 in humans (Fig. 1.2). Kcnc1 and Kcnc3 are located
within ~0.5-1 cM of one another on murine chromosome 7 syntenic with human
chromosome 11p15 and human 19q13.3-13.4. The Kcnc3 gene is very GC-rich
and contains elaborate, stable secondary structures in the long 3‟UTR. The DNA
is very prone to rearrangement and relatively recalcitrant to PCR. Kcnc2 is at
mouse 10qD2 syntenic with human 12q21.1, while Kcnc4 is at 3qF2.3 syntenic
with human 1p13.3. All of the Kcnc genes are subject to splice variation that is
likely not yet fully characterized. Variation mainly occurs at the 3‟ end of the gene
typically affecting the C terminus of the protein. 5‟ end variation has been
reported but only alters the 5‟UTR (Rudy et al., 1992, Weiser et al., 1994). Kcnc1
has at least two known variants that change the C terminus of the protein
designated Kv3.1a and Kv3.1b (Luneau et al., 1991a, Luneau et al., 1991b,
Ozaita et al., 2002, Perney et al., 1992). Kcnc2 has three variants and Kcnc4 has
four 4 known variants. Kcnc3 has 3 published and more unpublished variants
affecting the 3‟UTR (Pyle D. and McMahon A., unpublished).
1.1.1.2. Proteins
Like all of the delayed rectifier voltage-gated potassium channels, Kv3 channels
are tetramers composed of subunits (Fig. 1.3). Each canonical channel subunit of
these channels has a stereotyped topology where the N and C termini are
intracellular sandwiching six transmembrane segments, S1-S6. The fourth

8
segment has positively charged residues that move the alpha helix upward or
downward to control activation/deactivation responsible for voltage-dependent
gating. Inactivation is imparted by the N terminus blocking passage of ions
beyond the pore formed by the four S5-S6 linkers bearing polar amino acids at
the filter to attract and select potassium ions. Kv3.3 and Kv3.4 have alternative
initiator methionines that can
extend the N terminus and
render the otherwise non-
inactivating channels
inactivating (Desai et al.,
2008, Fernandez et al., 2003).
Also in the N terminus is the
T1 domain essential to
forming tetramers.
Figure 1.3. The Kv channel protein based on the structure of KcsA elucidated by Doyle et al.,
1998. Individual subunits comprising the tetramer are shown in different colors.
In Kv3 channels diversity is imparted by heterotetramerization and splice
variation impacting the C terminus. N and C termini provide a surface facing the
cytosol along which posttranslational modification can be applied to modulate the
channel. Also, the termini seem to be responsible for subcellular localization.
Kv3.3 in the weakly-electric fish requires certain C terminal residues to localize
properly in dendrites (Deng et al., 2005). C terminal splice variants of Kv3.1
exhibit differential subcellular localization (Ozaita et al., 2002) such that Kv3.1a
must heterotetramerize with Kv3.1b to enter axons in vitro (Xu et al., 1995).
Heterotetramerization has been shown to indeed exist by co-immunoprecipitation
in the rodent brain in the case of Kv3.1b and Kv3.3b (Chang et al., 2007), Kv3.1
and Kv3.4 (Baranauskas et al., 2003) as well as Kv3.1 and Kv3.2 (Rudy et al.,
1999). Kinetic properties can be affected such that they are intermediate
between homomers of the two subunits. Diversity is further enhanced by
Kv3 Channels: Key Biophysical PropertiesTetrameric channel protein:
Kv3.1-4 encoded by Kcnc genes: Kcnc1-4
Membrane
Splice variation
in C terminus
K+
Na+ K+
Depolarized:HVCaCh activation
NaCh inactivation
Hyperpolarized:NaCh deinactivation
The Kv3 subfamily activates
and deactivates 10x faster than
other voltage-gated K+ channels
Kv3.3-null “SKO” +/+;-/-
Kv3.3-null heterozygous for Kv3.1 null “Triple” +/-;-/-
Kv3.1/Kv3.3-null “DKO” -/-;-/-

9
association with auxiliary subunits like MiRP2 which alter biophysical properties
(McCrossan et al., 2003).
1.1.1.3. Biophysical Properties
The acute function on a millisecond timescale of Kv3 channels is in passing ions
it is generally safe to assume. Nonetheless many proteins are multifunctional.
Voltage-gated ion channels are known to participate in cell-cell interactions by
acting as adhesion molecules which can function in organizing nodes of Ranvier
(Chen et al., 2004, Kaczmarek, 2006). To date, however, the most parsimonious
explanation for the effect of Kv3 expression on neurons is however mediation of
the voltage-dependent flow of potassium in the voltage range pertaining to
spikes.
As explained in the above overview for section 1.1, the most notable
feature of Kv3 channels is rapid activation and deactivation. The voltage-
dependence of activation is high among the Kv subfamilies, restricting the
influence of the channels more to the domain of action potentials rather than on
subthreshold activity, at least directly. A high single-channel conductance may
support faster repolarization and a greater afterhyperpolarization if the number of
docking sites for channels at the membrane is limited, constraining how much
conductance can be obtained collectively by mere upregulation.
Inactivation is only present in Kv3.3 and Kv3.4 channels. It is contingent
upon the translation via an upstream alternative methionine of an extended N
terminus (Fernandez et al., 2003). A structurally-distinct mechanism, inactivation
is very slow for Kv3.3 compared to other potassium channels. Sustained, high-
frequency firing might be necessary for a significant fraction of Kv3.3 channels to
enter the inactivated state. Kv3.4 however inactivates in tens of milliseconds
during constant depolarizing voltage steps (Martina, Yao and Bean, 2003,
Martina, Metz and Bean, 2007).
1.1.1.4. Modulation

10
Voltage-gated ion channels are known to be modulated by a plethora of
molecules both soluble and in the membrane as well as posttranslational
modifications. Through these routes neurotransmitters can modulate the
excitability of neurons, synaptic plasticity and neurotransmitter release at
terminals. By delimiting spike width at terminals Kv3 channels have been shown,
using the Calyx of Held synapse where presynaptic recording is possible, to
regulate neurotransmitter release (Nakamura and Takahashi, 2007, Ishikawa et
al., 2003, Nakamura and Takahashi, 2007, Ishikawa et al., 2003, Ishikawa et al.,
2003). Kv3.1 is modulated negatively by PKC (Critz et al., 1993, Kanemasa et
al., 1995, Macica et al., 2003, Song et al., 2005). An exception is Kv3.3, the
current of which is facilitated by PKC (Desai et al., 2008). Protein kinase A also
modulates Kv3 channels (Moreno et al., 1995). The channels are in addition
sensitive to oxidative stress (Rudy et al., 1992, Rettig et al., 1992, Duprat et al.,
1995). Less acute modulation also is exerted through association with auxiliary
subunits (McCrossan et al., 2003).
1.1.1.5. Pharmacology
First, it should be noted that the IC50 may differ between channels of different
composition among neuronal cell-types. The classic blocker for Kv3 channels
has been tetraethylammonium (TEA), which blocks ~90% of Kv3 current at 1 mM
where it has weak effects on calcium-activated potassium channels. ~0.2 mM
TEA is selective for Kv3 channels (McKay and Turner, 2004) but only blocks a
fraction of the current. 4-aminopyridine (4-AP) is fairly selective for Kv3 at 20-600
μM however the variable responsiveness due to complex interactions with
different channel states undermines its utility (Rudy et al., 1999). The sea
anemone toxin blood-depressing substance I (BDS-I) specifically blocks the Kv3
subfamily at ~500 nM (Yeung et al., 2005). Originally it was believed to be
selective for Kv3.4 (Diochot et al., 1998) with a 47 nM IC50 however other groups
failed to replicate the result (Yeung et al., 2005). The drugs riluzole at an IC50 of
121 μM (Ahn et al., 2005), bupivacaine at 46 μM (Nilsson et al., 2008, Friederich,

11
Benzenberg and Urban, 2002), streptomycin (Liu and Kaczmarek, 2005),
Sibutramine at 33 μM (Kim et al., 2007), flouxetine (Prozac™) at 13 μM and its
metabolite norflouxetine at 0.8 μM (Choi et al., 2001, Sung et al., 2008) also
block human Kv3.1 channels. Block by therapeutically relevant concentrations of
the latter two drugs is intriguing in light of the hyperactivity of Kcnc1-null mice
and classification of fluoxetine as an “activating” antidepressant capable of
inducing iatrogenic hypomania as well as akisthesia (a type of restlessness
characterized by an urge to incessantly move; spelling in medical literature varies
also akasthisia) (Akagi and Kumar, 2002, Messiha, 1993, Vanderhoff and Miller,
1997). PKC, which inhibits these channels, has been implicated in mania, where
a blocker had an anti-manic effect (Einat et al., 2007, Zarate et al., 2007).
1.1.2. Expression Pattern
Kv3 channels occur across the CNS. A general theme naturally is expression in
fast-spiking neurons, which attain frequencies in excess of ~300 Hz at
physiological temperature, near 37˚C. A lot of fast-spiking neurons in the brain
express the calcium-binding protein parvalbumin and develop perineuronal nets
that unfortunately render patch-clamping in mature animals difficult (Morales et
al., 2004, Hartig et al., 1999, Hartig et al., 2001). Most of these populations are
GABAergic, expressing either GAD67, GAD65 or both, including projection and,
more commonly, GABAergic interneurons. A few populations of glutamatergic
projection neurons are fast-spiking. Among the subunits, Kv3.2 tends to be
found rostrally in large part in forebrain structures. Kv3.3 and Kv3.4 are more
often found in cells in caudal structures such the hindbrain, which includes the
cerebellum (for the cerebellum see also section 1.4). Kv3.1 is distributed more
evenly across structures from the forebrain to the hindbrain. Outside the CNS
Kcnc4, and possibly at low levels Kcnc1 and Kcnc3, are found in sympathetic
ganglia. Skeletal muscle expresses some Kcnc1 and substantial Kcnc4 (Dixon
and McKinnon, 1996). Cardiac muscle may express all subunits albeit at low
levels. Kcnc3 is also found in lung and kidney. T lymphocytes at least express
12
Kcnc1 (Grissmer et al., 1992). Finally, Kv3.4 has been verified at the protein level
(Veh et al., 1995) and received some attention in myocytes where interactions
with MiRP2 have been best studied that may also generalize to the CNS
(McCrossan et al., 2003, Abbott et al., 2001).
Subcellularly Kv3 subunits differ in their localization, sometimes by splice
variant (Ozaita et al., 2002, Xu et al., 2007). Kv3 subunits can be found in all
neuronal compartments, with the least expression in distal dendrites normally. In
given types of neurons a particular subunit may prefer a certain compartment. It
remains unknown exactly how different subunits determine the distribution of
each other in different compartments via heterotetramerization although this
seems to occur (Xu et al., 2007). A preparation used to study this is Madin-Darby
canine kidney (MDCK) cells, a polarized cell-type that models trafficking to
axonal and dendritic compartments fairly reliably by their apical and basolateral
membranes, respectively.
1.1.2.1. Kv3.1
Kcnc1 mRNA is expressed at high levels in forebrain and certain cerebellar
neurons primarily. Forebrain structures with Kv3.1 include the cortex,
hippocampus, and striatum, where GABAergic interneurons account for
expression. In monkey at least Kv3.1b is found in cortical pyramidal neurons
(Ichinohe et al., 2004), which ought to express Kv3 channels in some cases such
as the chattering cells recorded in ferret that burst at a gamma frequency (~30-80
Hz) with intraburst frequencies of hundreds of Hertz (Brumberg, Nowak and
McCormick, 2000). GABAergic neurons of the reticular thalamic nucleus are rich
in Kv3.1. Ventral to this nucleus Kv3.1 is found in the zona incerta. GABAergic
neurons co-mingled with cholinergic neurons in cholinergic nuclei in the basal
forebrain on through the medial septum express Kv3.1 as well (Chang et al.,
2007), along with pallidal GABAergic neurons. Apparently glutamatergic neurons
pervasive in the subthalamic nucleus and, perhaps at low levels, some
glutamatergic thalamocortical relay neurons also express Kcnc1. Midbrain

13
structures including the substantia nigra reticulata, red nucleus and very
prominently the inferior colliculus contain the subunit. Several brainstem nuclei
have Kcnc1 mRNA including the medial nucleus of the trapezoid body (MNTB)
and the vestibular nuclei (for cerebellar detail see section 1.4). In the olfactory
bulb mitral cells express Kcnc1 (Weiser et al., 1994).
Kcnc1 represents a unique case among the subunit genes where the
differential distribution of splice variants has been mapped (Ozaita et al., 2002,
Perney et al., 1992). Kv3.1a is enriched in axons and terminals (Ozaita et al.,
2002, Xu et al., 2007). Kv3.1b is present throughout the cell albeit less so in
distal dendrites. Kv3.1b, but not Kv3.2 or Kv3.3b concentrates at nodes of
Ranvier (Chang et al., 2007) and co-immunoprecipates with ankyrin G, a
constituent of nodes (Devaux et al., 2003).
1.1.2.2. Kv3.2
Kv3.2 is most prominent in glutamatergic thalamic relay nuclei and GABAergic
interneurons that express parvalbumin throughout the cortex and in the
hippocampus (Chow et al., 1999, Lau et al., 2000). Kcnc2 mRNA is expressed in
the forebrain also like Kv3.1 in the zona incerta, subthalamic nucleus and in
pallidal neurons. In the midbrain Kv3.2 mirrors Kv3.1 except it is additionally
found in a layer of the superior colliculus. Unlike Kv3.1, Kv3.2 is very sparse in
the brainstem (for cerebellar detail see section 1.4;Weiser et al., 1994). Kv3.2
does not appear to concentrate at nodes of Ranvier (Chang et al., 2007). Splice
variants have yet to be explored at the protein level since antibodies recognize
the invariant N terminus however in polar MDCK cells Kv3.2a and b distribute
differentially in subcellular compartments (Rudy et al., 1999).
1.1.2.3. Kv3.3
Kv3.3 expression in the midbrain resembles Kv3.1 in most respects except the
level is lower in structures other than the thalamic reticular nucleus and
subthalamic nucleus. Expression is pronounced in posterior areas such as the

14
brainstem and cerebellum (for cerebellar detail see section 1.4). Like Kv3.1 it is
in mitral cells of the olfactory bulb. Where assessed, Kv3.3b expression is mainly
restricted to all areas except distal dendrites where in Purkinje cells it is present
at a low level. A Northern blot suggested Kcnc3b was highest in the cerebellum
(Goldman-Wohl et al., 1994). Kv3.3 does not appear to concentrate at nodes of
Ranvier (Chang et al., 2007).
1.1.2.4. Kv3.4
Of all the subunits Kv3.4 remains the least understood. It is mostly expressed in
skeletal muscle. mRNA levels even detected by radiolabeling (Weiser et al.,
1994) are low and difficult to detect. The Allen Brain Atlas using non-radioactive
methods barely detects it at all (for cerebellar detail see section 1.4). Weiser et
al. 1994 using radioactivity detected Kcnc4 mRNA in scattered pallidal neurons,
the dentate gyrus, the subthalamic nucleus and pontine nuclei. It should be noted
that antibodies used in different studies either detected all splice variants
(Martina, Yao and Bean, 2003) or potentially Kv3.4a preferentially (Veh et al.,
1995, Laube et al., 1996) given divergence in the epitope (Vullhorst, Jockusch
and Bartsch, 2001).
1.2. KV3 CHANNEL FUNCTION
With the exception of one recently described human disease, Kv3 channels have
only been explored functionally at the behavioral level by null mutant mouse
models. At the cellular level many insights have been gained from TEA but there
are as of yet no specific drugs that can really probe function in vivo non-
invasively without toxicity. Prior to this thesis work, I developed a dominant
negative Kv3.1 subunit that will be useful in the future. This approach works in Kv
channels capable of heterotetramerization, and has been fruitful in unraveling the
function of other potassium channels in vivo (Shakkottai et al., 2004, Peters et

15
al., 2005) potentially in select cell-types, ablating the function of all Kv3 subunits
simultaneously. Null mutants are available for all subunits except Kv3.4. By virtue
of being subtle historically null phenotypes were not immediately obvious for
Kcnc1 and Kcnc3 however the creation of double-knockout (DKO or -/-;-/-) mice
with more severe phenotypes made the affected parameters more apparent
(Espinosa et al., 2001). Kcnc1 and Kcnc2 double mutants have only been
analyzed in vitro based on published work (Goldberg et al., 2005). As a
subfamily, the range of functions channels in essence tend to be involved in
include sleep/arousal, activity levels (related to the latter), preventing epileptiform
activity, and motor function.
1.2.1. Kv3.1
The most profound abnormality of the Kcnc1-null mice (or -/-;+/+) is reduced total
slow wave sleep duration and fragmentation of slow wave sleep, a phenotype
even more marked in Kcnc1/Kcnc3 double-null (-/-;-/-) mutants which also have
less delta power. -/-;-/- mice have a 40% decrease in total sleep during the light
phase, which is perhaps the greatest reduction seen to date among null-mutant
mouse models with sleep phenotypes. Moreover rebound sleep after sleep
deprivation is impaired in mice just lacking Kcnc1 and abolished in -/-;-/- mice
(Espinosa et al., 2001, Espinosa et al., 2004a, Espinosa et al., 2008, Joho, Ho
and Marks, 1999, Joho et al., 2006). Together with decreased slow wave sleep,
outbred -/-;+/+ mice and -/-;-/- mice are hyperactive as indexed by ambulatory
and stereotypic activity in the open field especially during the light phase
(Espinosa et al., 2004b). 129Sv null mice did not display hyperactivity (Ho,
Grange and Joho, 1997) probably because they have low activity levels and are
considered generally a poor strain for behavioral testing. The hyperactivity can
also readily be observed by eye and likely is not strictly a result of less time spent
sleeping. There is an apparent attenuation of the circadian distribution of sleep
and overall activity that is corroborated by other recent preliminary data.

16
The +/-;+/- and -/-;-/- mice lacking Kcnc1 alleles additionally tend to spend
more time in the center of the open field compared to wildtype controls,
suggesting decreased anxiety. The mice just lacking Kcnc1 have been described
qualitatively by observers as feisty, emotional and sometimes agitated with a
greater tendency to vocalize when handled or jump. Parenting is somewhat
impaired and even mice heterozygous for the null allele display these traits, at
least on some genetic backgrounds. Null mice are more sensitive to the
disruptive effect of alcohol on coordination or balance such that they have an
increase in sideways falls (Joho R.H., unpublished) that is more severe in DKO
mice (Espinosa et al., 2001).
An effect of Kv3.1 on high-frequency firing has been described in the
medial nucleus of the trapezoid body that functions in sound localization (Macica
et al., 2003). Modulation of the channel here by PKC adjusts the firing frequency
according to the acoustic milieu (Song et al., 2005). Further, a role for Kv3.1 in
high-frequency spiking was shown in the thalamic reticular nucleus which may
contribute to sleep deficits that worsens in parallel in -/-;-/- mice (Espinosa et al.,
2008, Porcello et al., 2002). Spikes were broadened 20% in mice just lacking
Kcnc1 and 60% in -/-;-/- mice, measuring halfway between the threshold and the
peak.
1.2.2. Kv3.2
The only clear phenotype discovered in Kcnc2-null mice was an increased
susceptibility to phenylenetetrazole-induced seizures (Rudy et al., 1999).
Spontaneous seizures occurred rarely and seizures were only induced during
procedures in <20% of mice on a congenic C57/BL/6 inbred background but not
during routine handling. Decreased power in low frequency ranges (~3.25-6 Hz)
using fast Fourier analysis was reported during sleep however the durations of
total sleep or sleep phases were normal in Kcnc2-null mice (Vyazovskiy et al.,
2002) . The battery of tests used to first characterize the mutant (Rudy et al.,
1999) included a general neurological screen for severe sensory and motor

17
abnormalities, the open field test for exploratory activity and anxiety-related
responses, the light-dark test for anxiety-related responses, the rotarod test for
motor coordination and skill learning, acoustic startle and prepulse inhibition of
the acoustic startle response for sensorimotor gating, habituation of the acoustic
startle response for sensorimotor adaptation, contextual and auditory-cued
freezing to assess conditioned fear, and the hotplate test for analgesia-related
responses.
1.2.3. Kv3.3
Kv3.3 is related primarily to cerebellar functions such as motor coordination
based both on a null-mutant mouse model and a human disease, spinocerebellar
ataxia type 13 (SCA13) (Waters et al., 2006). The role of Kv3.3 in motor
coordination will be explored in detail in section 2.1.4 below. Congruent with
disturbed cerebellar function, harmaline-induced tremor, thought to reflect intact
function of the olivo-cerebellar loop, is virtually abolished in the null mutant
(McMahon et al., 2004). Sleep phenotypes of Kcnc1-null are worsened by loss of
Kcnc3, as discussed in section 1.2.1 above (Espinosa et al., 2004a, Espinosa et
al., 2008). The +/+;-/- mice also displayed lethal seizures when excited by being
transported in a cart on the 129Sv inbred background (Chan, 1997). Breeding
onto an outbred background eliminated the seizures. Interestingly a null mouse
from a recently derived congenic line on the 129Sv background in the lab was
reported to have had seizures. At one point in the laboratory -/-;-/- mice started
having similar seizures induced by transport on an outbred background that was
becoming inbred. Crossing the breeding stock with outbred ICR, C57/BL/6 and
129Sv mice on a regular basis from the vendor alleviated and prevented this
(Espinosa F., unpublished). Another Kcnc3-null phenotype is myoclonus
(Espinosa F., unpublished) which like ataxia is markedly worse in -/-;-/- mice
(Espinosa et al., 2001). Myoclonus is of intermediate severity in Kcnc3-null mice
additionally lacking a Kcnc1 allele (or +/-;-/-; Espinosa et al., 2004b). A tendency
toward hyperexcitability when suspended by the tail that might be described

18
more aptly as dyskinesia and hyperactivity has also been observed (Chan,
1997).
A role for Kv3.3 in high-frequency firing has been evidenced in Purkinje
cells where spike width is sensitive to 150 µM TEA, a dose specific for Kv3
channels (McKay and Turner, 2004) and broadens 100% in +/+;-/- mice
(McMahon et al., 2004). Block by TEA triggers strong sodium-calcium spike
bursts, which raised the possibility that Kv3.3 suppressed bursts in general
(McKay and Turner, 2004) although the channel deactivates rapidly at
subthreshold voltages. The effect, if attributable to Kv3, would result from
increased calcium influx during broader spikes perhaps.
1.2.4. Kv3.4
Essentially nothing is known about the actual function of Kv3.4 in vivo. One study
(Baranauskas et al., 2003) attempted to elucidate the role of this subunit using
the ostensibly specific toxin BDS-I that was subsequently shown not to be
specific (Yeung et al., 2005).
1.3. PHYSIOLOGY OF CEREBELLAR CIRCUITRY
Synthesizing the literature, the role of the cerebellum at large in a general sense
it seems is to smooth, pace and coordinate information processing and
behavioral output based on continuous, rapid feedback while serving as an
associative substrate where a progressive fine-tuning of these processes for
repeated tasks can reside. The cerebellum is not solely dedicated to motor
function and posture; it modulates cognitive and emotional processing as well
(Schmahmann, 2002). What is special and unique about the cerebellum is how it
processes information rather than exactly what specific information it processes.
The deficits seen in patients with cerebellar damage outside the motor realm
(see section 2.1.1) are in keeping with this conception.

19
The cerebellum consists of an exquisitely structured, highly organized
repetition of the same fundamental circuit connected to different afferent and
efferent input concerned with respective modalities and related information.
Complete loops are formed between the cerebellum and connected structures in
the brainstem. To understand how just one loop performs related to one specific
function, such as motor coordination, might then be to uncover the essence of
how the other loops modulate other functions, such as working memory.
Though the beauty of Purkinje cells and remarkable organization of the
relatively expansive cerebellar cortex have garnered much attention since the
time of Ramon y Cajal, it is actually the more irregularly organized and difficult to
study deep cerebellar nuclei that form the essential, primordial core of the
cerebellum (Fig. 1.4). In phylogenetically older animals the cerebellar cortex is
relatively small and rudimentary (Ito, 2000). The cerebellum began with the deep
Figure 1.4. Cerebellar circuitry and distribution of Kv3 subunit expression therein.

20
nuclei, and the cortex evolved later perhaps to support more complex, finer
processing and provided a vast number of additional connections for learned
associations. Alongside the deep nuclei are the vestibular nuclei which
hodologically, genetically and physiologically mirror the deep cerebellar nuclei
(DCN) in most respects but are located in the dorsal brainstem. Importantly, to
influence the rest of the brain and behavior the output of the cerebellar cortex,
conveyed exclusively by Purkinje cells, must impinge on the deep or vestibular
nuclei, for there are no other efferent structures. Without these nuclei there is no
cerebellar output.
Just like the cerebellar cortex, the more primitive DCN receive input in
parallel from mossy and climbing fibers that emanate from pontine nuclei, mainly,
and neurons of the inferior olive, respectively. These excitatory inputs both drive
DCN neurons simultaneously along with separate populations of cortical
neurons. Specifically, mossy fibers drive only granule cells, while climbing fibers
drive Purkinje cells, stellate cells and basket cells. The latter two are local-circuit
inhibitory interneurons that in turn synapse on Purkinje cells. The climbing fiber
synapse made onto Purkinje cells is a unique structure from which the fiber
derives its name. Numerous synaptic contacts are made as the fiber ascends
along around the Purkinje cell proximal dendrites providing collectively one of the
most reliable synapses known, producing a robust excitatory postsynaptic
potential (EPSP) that is crowned with a composite spike burst called the complex
spike that attains a high intraburst frequency exceeding ~600 Hz (Fig. 1.5).
Mossy fiber input is graded and fairly continuous whereas climbing fiber input
occurs sporadically at rest or in rhythmic bouts at low frequencies around 1 Hz
when the cortex is engaged by processing relevant to the local circuitry. Climbing
fibers emanate in a fan-like formation in the sagittal plane from topographically
organized segments of the olive to innervate cortical areas along the plane
(Fukuda, Yamamoto and Llinas, 2001). Granule cells convey the mossy fiber
input to Purkinje cells via parallel fibers that extend hundreds of microns in the

21
coronal plane perpendicular to the climbing fiber ramification in the molecular
layer that houses the extensive, highly ramified, spiny Purkinje cell dendrites. In
addition, Golgi cells (not shown in figure) are contacted by parallel fibers that
provide inhibitory feedback onto mossy fiber terminals to gate excitation of
granule cells, as well as stellate and basket cells. Finally, Purkinje cells integrate
input from climbing fibers, mossy fibers and interneurons, providing GABAergic
output to the DCN neurons which in turn generate cerebellar output evoked by
mossy and climbing fibers with cortical processing taken into account. Purkinje
cell output also feeds back to other Purkinje cells. The loops are closed by
GABAergic projections back to the olive and pontine nuclei. In vivo, the
cerebellum receives innervation from several diffuse, paracrine neuromedulatory
systems including cholinergic, noradrenergic, serotonergic and histaminergic but
not dopaminergic systems.
Figure 1.5. Experimental setup for intracellular recording of climbing fiber responses in parasagittal
cerebellar acute slices in vitro. Purkinje cell illustrations adapted from those of D.P. van Lieshout.
1.3.1. Cerebellar Cortex
1.3.1.1. Granule Cells

22
The firing of granule cells is frequency-modulated by mossy fiber input. Recently
burst firing has been described but not a high intraburst spike frequency (Steuber
et al., 2007). The narrow action potentials of granule cells excite Purkinje cell
dendritic spines throughout the dendrite, basket cells, stellate cells and
GABAergic Golgi cells in the granule cell layer that in turn exert an inhibitory
feedback effect on the mossy fibers presynaptically in synaptic glomeruli. Golgi
cells also appear to be fast-spiking, extrapolating to physiological temperature
from data collected at room temperature (Forti et al., 2006).
1.3.1.2. Purkinje Cells
The input to Purkinje cells from the parallel fibers of granule cells undergoes
short-term plasticity in the form of paired-pulse facilitation as well as long-term
depression (LTD) and long-term potentiation (LTP). Synapses are made by
parallel fibers onto a profusion of spines that are thought to be the substrate of
learned associations. Eyeblink conditioning and motor skill learning have
received much scrutiny with regard to this synapse based on the Marr-Albus-Ito
model of cerebellar learning (Albus, 1971, Ito, 1984, Kleim et al., 1998, Marr,
1969). In this model calcium influx triggered by the climbing fiber input, and in
recent adaptations, from local, calcium-permeable AMPA receptors postsynaptic
to parallel fiber terminals, elicits LTD at synapses that are inappropriately strong
to weaken them in order to improve motor output (Denk, Sugimori and Llinas,
1995, Jorntell and Ekerot, 2002, Tempia et al., 1996). Climbing fibers fire in
relation to motor errors according to this model. The precise role of LTD remains
unresolved despite decades of work (Welsh et al., 1995), and some reports
suggest complex spiking is more prominent after acquisition rather than before
learning (Catz, Dicke and Thier, 2005).
At the resting potential even devoid of input Purkinje cells are
spontaneously active. In addition to the complex spikes elicited by climbing fiber
input, ~50-200 Hz tonic spikes christened simple spikes in early in vivo
extracellular unit recordings produce a canvas of veritably constant activity upon

23
which complex spikes are painted. The frequency of simple spikes is modulated
continuously by mossy fiber input by way of granule cells. Occasionally pauses in
simple spike activity are observed (Steuber et al., 2007) of unknown significance
that may be elicited by the inhibitory interneurons. Pauses in simple spikes also
occur after each complex spike, and there is much cross-talk between the
occurrence of simple spikes and complex spikes (Barmack and Yakhnitsa, 2003,
Yakhnitsa and Barmack, 2006, Heck, Boughter and and Bryant, 2006, Miall et al.,
1998, Sato et al., 1992, Servais et al., 2004). In some bistable neurons and in
acute brain slices in vitro, complex spikes can toggle the cell between active up
states and quiescent, silent down states (McKay and Turner, 2004). Whether
bistability happens in vivo is controversial (Schonewille et al., 2006). Recent data
suggest it is only seen in a subset of Purkinje cells in vivo (Yartsev et al., 2007).
Furthermore, synchronized fast oscillations have been recently described that
appear to depend on the interconnections between Purkinje cells and gap
junctions (Cheron et al., 2004, Cheron et al., 2005, de Solages et al., 2008,
Middleton et al., 2008). Since the DCN can facilitate such high-frequency,
synchronized oscillations in forebrain structures (Timofeev and Steriade, 1997)
and might enhance the impact of input to the DCN through synchronizing simple
spikes (Shin et al., 2007a) the oscillations in Purkinje cells may be of great
physiological significance, especially given the hypothesized role of fast
oscillations in higher functions including attention and conscious perception
(Engel and Singer, 2001, Llinas et al., 1998).
The function of the complex spike output has been a topic of great
interest eluding explanation for over 40 years since their discovery by Eccles et
al., 1966 (Eccles, Llinas and and Sasaki, 1966). Motor coordination, eyeblink
conditioning and vestibular reflexes have proven the most amenable to study. A
plethora of studies have been published correlating Purkinje cell activity to
behavior in awake or anesthetized animals yet few conclusive cause-and-effect
studies have emerged.

24
While some investigators have contended complex spikes appear
randomly and just provide some modulatory influence (Miall et al., 1998) others
have emphasized their temporal organization over spatial domains,
synchronizing related ensembles in a meaningful way in relation to behavior
(Welsh et al., 1995), as reviewed by Kitazawa and Wolpert (Kitazawa and
Wolpert, 2005). Timothy Ebner‟s group has explored a role in correcting ongoing
errors in motor speed or velocity even after a task has been acquired while
simple spikes directly encode velocity (Coltz, Johnson and Ebner, 1999, Ebner,
1998, Ojakangas and Ebner, 1994). Velocity denotes movement in a certain
direction, which is sensible if Purkinje cells are connected in such a way
ultimately by several synapses to the musculature that output favors movement
in a particular direction. Others have seen a similar relation between complex
spikes, acute behavior and learning (Kitazawa, Kimura and Yin, 1998). Extensive
interactions between complex and simple spikes as well as other effects
(Balaban, 1985, Benedetti, Montarolo and Rabacchi, 1984) confound
interpretation of simple lesion experiments removing the olivary input. Such
studies nevertheless support a role for complex spikes in motor coordination.
Axonal propagation of complex spike spikelets remains enigmatic since it
is difficult to study in vitro where curved axons are nearly always severed.
Studies to date recording cell-attached from thin myelination after the first node
of Ranvier in the cerebellar cortex suggest that some spikelets propagate at high
frequencies but in a stochastic manner determined by rise time and amplitude
(Khaliq and Raman, 2005, Monsivais et al., 2005). Converging, synchronized
input to DCN neurons may allow the low percentage of axons propagating
spikelets to nonetheless exert strong effects on DCN neurons.
Simple spikes have been posited to play roles similar to complex spikes
in regulating the basic function of motor parts of the cerebellum to smoothly
accelerate and decelerate movements of an appropriate steady speed. Simple
spike rate seems related to speed (Coltz, Johnson and Ebner, 1999, Yamamoto

25
et al., 2007), directly or inversely, presumably, for a given cell depending on
whether extensor or flexor muscles are controlled.
Whether simple spikes fire in synchrony like complex spikes under certain
conditions and what it entails is unclear. Theoretically precise temporal
coherence of simple spike activity might create windows in between IPSPs
during which DCN neurons could fire in turn, and DCN neurons are capable of
responding in this way in vitro (Gauck and Jaeger, 2000). Alternatively,
asynchronous simple spikes across Purkinje cells converging on DCN neurons
would result simple in tonic inhibition, decreasing the firing rate of DCN neurons.
There is some in vivo evidence that at times, more than previously thought,
Purkinje cells fire quite regularly with a very consistent interspike interval as seen
in slices (Shin et al., 2007b).
The synapse made by Purkinje cells onto DCN neurons is subject to
synaptic depression thought to stem from transmitter depletion (Pedroarena and
Schwarz, 2003, Telgkamp and Raman, 2002). Higher-frequency output would
depress faster to a lower steady state level of inhibition. The net effect of
depression is to render postsynaptic neurons less sensitive to tonic, invariant
input and conversely more acutely sensitive to changes in the frequency of input.
Purkinje cell collaterals also would be expected to inhibit interneurons
along with other nearby Purkinje cells. Little is known about this output.
1.3.1.3. Basket Cells
All the cerebellar interneurons remain far less characterized than Purkinje or
granule cells and basket cells are no exception. Fast-spiking basket cells in the
Purkinje cell layer or vicinity receive input from granule cells and direct climbing
fiber innervation, providing inhibitory input to Purkinje neurons via pinceaux
contacts which are pericellular basket terminals concentrated around the axon
hillock, poised to powerfully gate Purkinje cell output, as well as to stellate cells
(Jorntell and Ekerot, 2002, Barmack and Yakhnitsa, 2008, Palay and Chan-
Palay, 1974).

26
1.3.1.4. Stellate Cells
Fast-spiking stellate cells are quite numerous in the molecular layer where they
innervate Purkinje cell dendrites, receiving input from the climbing fiber, Purkinje
cell collaterals and granule cells. They outnumber Purkinje cells by 10:1 in
rodents and 50:1 in humans (Suter and Jaeger, 2004). Stellate cells as well as
basket cells have been implicated in the antiphasic modulation of complex spikes
and simple spikes via Purkinje cell recurrent collaterals (Barmack and Yakhnitsa,
2008).
1.3.1.5. Golgi Cells
Golgi cells are fast-spiking interneurons that receive input from granule cells and
stellate cells. They are thought to be involved in filtering and attenuating mossy
fiber input by forming inhibitory presynaptic contacts (Marr, 1969, Gabbiani,
Midtgaard and Knopfel, 1994). Specific ablation of Golgi cells using a transgenic
approach in mice sufficed to cause ataxia (Watanabe et al., 1998).
1.3.2. Deep Cerebellar Nuclei
1.3.2.1. Large Neurons
The large DCN neurons refer to the spiny, glutamatergic projection neurons that
carry input out of the cerebellum primarily to motor centers, namely the red
nucleus, ventral thalamus, intralaminar thalamic nuclei and pontine nuclei. Each
large DCN neuron receives input from ~30 Purkinje cells (Chan-Palay, 1977), the
inferior olive, mossy fiber collaterals and interneurons. Action potentials occur
spontaneously and are modulated by rather constant inhibition from Purkinje
cells during simple spiking. Climbing fiber stimulation in vivo can lead to large
IPSPs and rebound excitation in the DCN in the form of fairly discrete bursts or
accelerated spiking that undergoes more gradual frequency adaptation
(Armstrong, Cogdell and Harvey, 1973, McCrea, Bishop and Kitai, 1977, Kitai et

27
al., 1977). A recent study just stimulating Purkinje cells in a circumscribed area
saw rebounds in only 15% of 109 DCN neurons recorded extracellularly (Alvina
and Khodakhah, 2008), probably because of diversity in cell types, such as weak
and strong burst large neurons (Molineux et al., 2006) or small neurons
(Uusisaari, Obata and Knopfel, 2007) however it suggests brief trains may not be
enough in large neurons. Climbing fiber input may recruit more Purkinje cells.
Perfusion of harmaline, which evokes synchronized olivary neuron firing, through
an acute explant of the cerebellum and brainstem induced strong, rhythmic
IPSPs in DCN neurons (Llinas and Muhlethaler, 1988). Recordings of awake
behaving monkeys confirm that DCN activity is reciprocal to tonic Purkinje cell
activity (Ghez and Thach, 2000). DCN neurons from genetically dystonic rats
exhibit bursts but little definitive data are available as to their exact function.
Removal of inhibition by the cerebellar cortex resulted in compensatory changes
in the strength of inhibition by glycinergic interneurons (Linnemann et al., 2004,
Sultan et al., 2002) suggesting homeostatic plasticity may occur chronically.
1.3.2.2. Small Neurons
The physiology of these neurons is almost totally unknown aside from a few
investigations of firing properties. They are comprised of GABAergic, glycinergic
and possibly dual GABAergic/glycinergic interneurons (Chan-Palay, 1977) and
GABAergic projection neurons closing the loop with the inferior olive. These
neurons receive input from Purkinje cells (De Zeeuw and Berrebi, 1995, Teune et
al., 1998). Based on the many analogous relationships with the vestibular nuclei,
where potentially cognate small and large neurons are found (Bagnall, Stevens
and du Lac, 2007, Gittis and du Lac, 2007), some of the glycinergic small
neurons may project to the contralateral DCN. Older intracellular recording
studies could only differentiate DCN neurons based on size and morphology via
biocytin fills. Since small neurons are more difficult to impale by sharp
microelectrodes or patch, data are relatively scant (Aizenman, Huang and
Linden, 2003, Czubayko et al., 2001). Recently Uusisaari et al., 2007 used mice
28
with green fluorescent protein (GFP) knocked-into the GAD67 locus to illuminate
GABAergic neurons. Both small GABAergic and non-GABAergic neurons
resembled each other but not large neurons in that these small neurons had
broader but still narrow action potentials and fired at relatively lower frequencies.
These neurons had larger input resistances, especially GABAergic ones, and
longer rebound depolarizations. They differed amongst themselves in the
duration of the depolarizations, with GABAergic neurons showing longer ones.
1.3.3. Vestibular Nuclei
Although these nuclei are not formally part of the cerebellum, hodologically and
functionally they are analogous to the DCN with the difference that they are
concerned with maintaining balance and eye movements rather than motor
coordination. The cellular electrophysiology has been explored by Sacha
DuLac‟s group (Bagnall, Stevens and du Lac, 2007, Gittis and du Lac, 2007,
Sekirnjak et al., 2003) and resembles that of DCN neurons.
1.4. KV3 CHANNELS IN THE CEREBELLUM
Cerebellar neurons are mostly fast-spiking in contrast to other brain areas
intersperced with a subset of fast-spiking neurons that are more the exception
not the rule. Afferents to the cerebellum, mossy and climbing fibers, lack Kv3
channels (Figure 1.1). Pontine nuclei that give rise to most mossy fibers do
however express them, just apparently not in axons. The neurons of the inferior
olive from which climbing fibers emanate does not express Kv3 channels. These
expression data are challenging to reconcile with physiological data in vitro
(Mathy et al., 2007) and in vivo (Ito and Simpson, 1971) citing high-frequency
transmission of action potentials in putative olivary axons. If spikes can be
initiated at the first node of Ranvier as claimed it cannot be argued based on
somatic protein expression that Kv3 channels are absent, however that no

29
mRNA was detected in the olive is still problematic. Thus far no empirical data
support high-frequency firing taking place independent of Kv3 channels. In all of
the cases below it should be borne in mind that in situ probes and antibodies do
not always detect all splice variants.
1.4.1. Cerebellar Cortex
1.4.1.1. Granule Cells
Kcnc1a and Kcnc1b mRNA has been detected in rodent granule cells (Weiser et
al., 1994, Perney et al., 1992). Kv3.1a and Kv3.1b proteins are accordingly
detected in parallel fibers (Ozaita et al., 2002, Sekirnjak et al., 1997) . Kv3.2 and
Kv3.4 are consistently absent using antibodies that detect all variants. Kcnc3
mRNA is reliably detected along with Kv3.3b protein mainly in parallel fibers
(Chang et al., 2007). In summary, granule cells and parallel fibers express
Kv3.1a, Kv3.1b and Kv3.3b, with Kv3.1 at a higher level.
1.4.1.2. Purkinje Cells
Purkinje cells can be distinguished by expression of the calcium binding protein
calbindin, which localizes near the membrane in these cells, and their very
distinctive morphology. Kcnc1 mRNA may have been present at low levels in the
work of Weiser et al. The authors felt that signal in the flocculus and
paraflocculus, ventrolateral lobes of the cerebellum involved in vestibular function
and eye movements, was real (Weiser et al., 1994). Perney reported Kv3.1a as
absent (Perney et al., 1992). Meanwhile the Allen Brain Atlas suggests it is
expressed in all Purkinje cells. Neither Kv3.1a nor Kv3.1b protein has ever been
detected (Ozaita et al., 2002, Sekirnjak et al., 2003). As with many cell-type
specific genes, the specific expression of Kv3.1 protein may be determined in
part at the RNA level by cell-type specific miRNAs that can suppress translation
(Mattick and Makunin, 2005).

30
Expression of Kv3.3b reaches its zenith in Purkinje cells. Kcnc3 mRNA is
present at high levels (Weiser et al., 1994, Goldman-Wohl et al., 1994) along with
the protein primarily in somata and proximal dendrites with lower levels in axons
and distal dendrites (Chang et al., 2007, Martina, Yao and Bean, 2003). Kv3.2 is
absent using antibodies detecting all variants (Rudy et al., 1999). Kcnc2 mRNA
likewise was absent in rat in Weiser et al. and a single-cell RT-PCR study but
detected in the Allen Brain Atlas in situ. Conversely, Kcnc4 mRNA was present at
low levels in Weiser et al. but essentially absent in the Allen Brain Atlas in situ. In
mice nonetheless Kv3.4 protein is expressed in Purkinje cells. Martina et al.,
2003 detected somatic and curiously rather punctate, discontinuous labeling in
the dendrite. An earlier study by Veh et al., 1995 evidenced weak labeling in their
figure using an antibody that may prefer certain splice variants. Together, data
suggest Kv3.3b and Kv3.4 are expressed in Purkinje cells.
1.4.1.3. Basket Cells
Because of their position in the cortex, the labeling of basket cells is difficult to
distinguish from granule cells, especially in the cases of Kv3.3 and Kv3.1.
Physiological data using the blockers 4-AP and TEA suggest Kv3 channels are
present in basket or stellate cells which are fast-spiking interneurons. The
absence of Kv3.2 is more readily asserted since no other cerebellar cortical
neurons express it. Kv3.4 immunolabeling revealed expression in the cerebellar
pinceaux, the form taken by the basket contact of basket cells in the cerebellum
which envelops the axon hillock along with part of the soma in GABAergic
contacts. To summarize, Kv3 expression in basket cells remains partially
obscure.
1.4.1.4. Stellate Cells
Definitive Kcnc1a mRNA (Perney et al., 1992) signal was seen in what could be
stellate cells in the molecular layer. Kcnc1b and Kcnc3 have not been detected in
the molecular layer. Kv3.1a and Kv3.1b proteins are in parallel fibers rendering it

31
difficult to exclude expression in stellate cells as with Kv3.3b (Weiser et al., 1994,
Luneau et al., 1991b, Chang et al., 2007, Sekirnjak et al., 1997, Weiser et al.,
1995). Holes can be seen likely corresponding to stellate cells in immunolabeled
sections but it cannot be determined whether channels might be present in the
periphery or at a low level not detected with the settings on the microscope
optimized to see cells with high expression levels using immunofluorescence
(Weiser et al., 1994). Kv3.2 expression can be excluded because antibodies
detect all variants and there is no signal throughout the cortex (Lau et al., 2000).
Kv3.4 however did appear weakly in the figure shown by Veh et al., 1995 though
they made no remarks on it. Thus, like basket cells stellate cells, which are fast-
spiking, may yet have Kv3 channels and likely have at least Kv3.4.
1.4.1.5. Golgi Cells
Kv3 subunit expression in Golgi cells has never been described, possibly
because they are immersed in granule cells expressing Kv3.3 and Kv3.1. Kv3.2
can be ruled-out based on its clear absence in the cortex. Kcnc4 mRNA by
contrast is virtually detected exclusively in what appear to be scattered Golgi
cells in the Allen Brain Atlas.
1.4.2. Deep Cerebellar Nuclei
1.4.2.1. Large Neurons
Kv3.1b and Kv3.1a have been found at both the protein and mRNA levels
(Weiser et al., 1994, Weiser et al., 1995) in large neurons. In stark contrast to the
cortex, Kv3.2 is detectable at the mRNA and protein levels. A low level of Kcnc4
mRNA has been detected possibly attributable to large neurons, however the
protein may not have been detected. Martina et al., 2003 did not examine the
DCN.
1.4.2.2. Small Neurons

32
Only one recent study (Alonso-Espinaco et al., 2008) has addressed Kv3
expression at the level of small neurons by assessing whether neurons were
GABAergic. Many GABAergic interneurons are highly variegated in their gene
expression within most brain structures. Results of Alonso-Espinaco et al., 2008
along these lines suggest heterogeneity. A subset of GABAergic neurons
expressed the subunit in the case of Kv3.1b and, evaluated separately, in the
case of Kv3.3b. These subpopulations could represent interneurons or those
supplying feedback to the olive. There are no data regarding Kv3.2 or Kv3.4
reported at a sufficient resolution to infer presence in small neurons.
1.4.3. Vestibular Nuclei
The physiologically and hodologically similar vestibular nuclei roughly parallel the
DCN in terms of Kcnc mRNA expression and protein.

33
CHAPTER TWO Review of the Literature
2.1. ATAXIA IN KCNC MUTANT MICE AND HUMANS
2.1.1. Cerebellar Ataxia
Ataxia is essentially incoordination, although it does not emphasize movement of
muscles in relation to one another. The nuance is that it is more general. It is
defined as disorder of movement without loss of strength or sensation. Gait
ataxia, though what most often comes to mind, is but one manifestation. As with
most of the nosology in neurology, the exact definitions of ataxia and cerebellar
ataxia are vague and inconsistent (Schlaggar and Mink, 2003).
Cerebellar ataxia is that which was originally described observing the
sequelae of cerebellar lesions. As Babinski described, “Rapid, exaggerated
movements maintain their directional orientation” (Barboi, 2000). The most
marked, general symptom is a dysregulation of the speed of movements that
typically does incorporate the relative timing and speeds of movements too.
Relative timing problems manifest as non-alternating gait. This facet of cerebellar
ataxia is believed to be dissociable from altered movement speed and has been
referred to as asynergia. Consequently movement is not smooth and rather
broken down into isolated movements. The excess speed that results in
exaggerated movements has been called hypermetria, under the umbrella term
of dysmetria. Hypometria, or excessively low velocity, is also seen. Hypermetria
can disrupt the speed of alternating movements as well, contributing to
alternating gait deficits along with asynergia. Alternating movement disturbances
of this kind have been called adiadochokinesia or dysdiadochokinesia. Both the
initiation and cessation of movements are delayed together with impairments in
smooth acceleration and deceleration of movement. The net result is for
movement to take on a jerky and oscillatory character. Oscillations result from
overshooting the target and then overly compensating by moving the limb back.
The cycle repeats until the target is reached as the amplitude progressively

34
diminishes. Cerebellar intention tremor results when patients with cerebellar
damage try to reach an object, and postural instability leading to oscillatory head
bobbing and difficulty standing known as titubation may occur. Saccadic
dysmetria also may be present causing difficulty maintaining a fixed gaze. In
keeping with the role of cerebellar processing in more than just motor function,
patients with cerebellar lesions also present with cognitive and psychiatric
symptoms (Schmahmann, 2002, Barboi, 2000, Mariotti, Fancellu and Di Donato,
2005, Stolze et al., 2002).
In addition to lesion-induced ataxia, several genetic diseases cause it as
well as autoimmune diseases such as paraneoplastic disorders when Purkinje
cell antigens are expressed ectopically by tumor cells. Others are metabolic in
etiology. Many act by causing progressive Purkinje cell degeneration. Some arise
from X-linked, mitochrondrial or recessive mutations but most are autosomal
dominant progressive ataxias classified as spinocerebellar ataxia (SCA). A
number of SCAs continue to be discovered and in nearly half of these cases the
gene responsible remains elusive. Most result from genetically unstable CAG
repeat expansions causing polyglutamine tracts as with the huntingtin gene in
Huntington‟s disease (Mariotti, Fancellu and Di Donato, 2005).
2.1.2. SCA13
SCA13 represents the first human disease linked definitely to a Kcnc gene
(Waters et al., 2006, Waters et al., 2005). Unlike most SCAs, SCA13 results from
dominant negative point mutations. Two affected pedigrees have been found
each with different mutations in KCNC3. A Filipino pedigree carried a R420H
mutation affecting one of the positively charged residues in the voltage sensing
(see section 1.1.1.3) S4 segment that acted as a potent dominant negative
eliminating all current when co-expressed with wildtype Kv3.3. The other F448L
mutation located in the pore-forming S5 segment at the cytoplasmic end involved
in translating changes in voltage detected by S4 into pore opening in a French
pedigree renders the gating similar to that of Kv1 channels. In particular fast

35
deactivation, essential for high-frequency firing, is removed. In fact, most voltage-
gated potassium channels that close more slowly than Kv3 channels have a
leucine at that position; the mutation strikes at the very essence of what
distinguishes Kv3 channels that endows them with their unique physiological
role.
Patients display cerebellar ataxia and mild mental retardation in the
French family. Onset is in childhood in the Filipino family and adulthood in the
French family where progression is slower. The Filipino mutation further causes
cerebellar atrophy. Gait ataxia and dysmetria tended to be the most severe
among affected family members. Titubation was also present. It is interesting that
the mutation that abolishes all current results in earlier onset and cell death,
whereas the mutation that mainly just slows deactivation does not in theory
broaden spikes but just decreases spike frequency. The authors speculated that
neurodegeneration might result in the Filipino pedigree because spike
broadening would increase calcium influx. Assuming Kv3.3 heterotetramerizes
with all the other subunits, the dominant negative would eliminate all Kv3 current
in cells that express Kv3.3, leading to greater broadening than might be seen
ablating one or two subunit genes.
2.1.3. Kcnc1-Null Mutant Mice
Cerebellar ataxia might be anticipated in -/-;+/+ mice considering the abnormal
parallel fiber drive onto Purkinje cells that can be inferred from decreased paired-
pulse facilitation, which is thought to reflect higher baseline neurotransmitter
release closer to saturation. Action potentials monitored optically in parallel fibers
are significantly broadened. A mere 50% increase in spike width is capable of
inducing a 300% increase in postsynaptic current in Purkinje cells (Matsukawa et
al., 2003).
The most widely-used method to measure limb ataxia and motor skill
learning is the accelerating rotarod. In this test rodents are placed on a slowly-
rotating, horizontal, elevated rod in a narrow space between two walls that

36
gradually accelerates and latency to fall is measured. Typically the rod is ~3 cm
wide, and, unless the impairment is profound, most mice are able to remain on
the rod at the initial speed of 5 rpm. Ataxic mutants however fall at a reduced
latency compared to wildtype controls. Often the test is not extended beyond a
set, maximal duration.
Ataxia has been suggested for -/-;+/+ mice by the rotarod test (see
section 3.3.1.3) however the penetrance on different genetic backgrounds varied
(Ho, Grange and Joho, 1997, Sanchez et al., 2000). Subtle motor coordination
abnormalities were initially suggested using the sensitive force plate actometer
(see sections 3.3.1.1 and 3.5.2.1). The device measures lateral deviation as the
mouse ambulates across a plate mounted on force transducers to track the
center of gravity essentially, reflecting both the position of the mouse and forces
exerted by paws in contact with the plate at any given moment. Greater deviation
raises the area of triangles formed by every three consecutive measurements of
the center of gravity and this is indexed to the total distance traveled. Lateral
deviation tends to correlate to the total distance traveled. Even though it is
measured by indexing to the distance traveled, it could still be affected by motor
drive rather than coordination or gait pattern. Thus plotting the LDI itself against
the distance traveled to obtain a slope derives a more pure measure of lateral
deviation due to abnormal rather than merely heightened movement. Although
the raw LDI measure was significantly increased in -/-;+/+ mice (Espinosa et al.,
2001), this slope is not significantly different from wildtype mice (Joho et al.,
2006). The -/-;+/+ mice did not make significantly more slips traversing a 2-cm or
1-cm narrow beam. In this test mice traverse a 100-cm long beam five times a
day for five days (Joho et al., 2006; see sections 3.3.1.2 and 3.5.2.2). It is
interesting that these mutants have little or no ataxia indexed by the beam
despite the abnormally strong parallel fiber input to Purkinje cells (Matsukawa et
al., 2003). The observation suggests the synapse made by parallel fibers onto
Purkinje cells, highly subject to plasticity, may adjust with learning to compensate
for the excess excitatory drive. Overall data suggested that Kcnc1-null mice have

37
either mild cerebellar ataxia only evident on the rotarod with poor penetrance or
are free from ataxia if the criteria of detection in multiple behavioral assays is a
requisite.
2.1.4. Kcnc3-Null Mutant Mice
The +/+;-/- mice have broadened spikes in Purkinje cells despite co-expression
of Kv3.4 in these cells that do not broaden further upon loss of Kcnc1 in DKO
mice. Accordingly there is no broadening in -/-;+/+ mice (McMahon et al., 2004).
Parallel fiber input is inferred to resemble that of -/-;+/+ mice because loss of
Kcnc3 alleles intensifies the defect in paired-pulse facilitation suggesting more
glutamate release. The +/+;-/- mice make significantly more slips on the 1-cm
beam than wildtype mice even after five days of training that persists even if the
test is extended to 10 days and have significantly increased lateral deviation that
is true also examining the slope of area plotted against distance. On the less
challenging 2-cm beam +/+;-/- mice improve by day five to the performance level
of wildtype (Joho et al., 2006).
2.1.5. DKO Mice
Despite altered paired-pulse facilitation LTD is unaltered however in -/-;-/- mice
(Matsukawa et al., 2003). LTP induction is blocked possibly due to saturation
prior to slice preparation. One would expect alterations in LTD in -/-;-/- mice to be
if anything more severe than that of -/-;+/+ mice. That LTD was normal in -/-;-/-
mice suggests it is in Kcnc3 single-null mice, but whether LTP is blocked with
less glutamate release than in -/-;-/- mice is uncertain. The ability of parallel fibers
to sustain high-frequency firing was studied in -/-;-/- mice which have the greatest
broadening compared to the two single-null mice (deductively inferred or directly
measured). Axons were able to propagate sustained compound action potentials
at 100 Hz with mild attenuation but not at 200 Hz, however this is the upper
boundary of the range at which granule cells normally fire. Net effects of a
potentially decreased rate of firing in mutants in vivo with a given strength of

38
mossy fiber input and increased glutamate release may either increase or
decrease parallel fiber drive onto Purkinje cells.
The -/-;-/- mice cannot stay on the rotarod significantly to obtain
meaningful results (Espinosa et al., 2001). When compared by slope (see section
2.1.4), -/-;+/- mice have more lateral deviation than -/-;+/+ mice, while +/-;-/- mice
have more than +/+;-/-. Loss of both subunits leads to a much greater increase in
the LDI/distance traveled slope in -/-;-/- mice. On the 2-cm and 1-cm beams, the
aforementioned genotypes perform for the most part like +/+;-/- mice. The beam
test has not been performed with DKOs because they typically fell quite promptly,
as on the rotarod, on the genetic backgrounds tested. No effort was made to give
them repeated chances. Use of a 0.5-cm beam in contrast uncovers a difference
between the mice lacking three alleles and +/+;-/- mice. The former are much
worse. Here falls are counted because slips are too numerous (Joho et al.,
2006). These data reinforce the notion that Kv3.3 is most involved in coordination
but that a latent role for Kv3.1 is revealed in the absence of Kv3.3, suggesting
functional redundancy in functionally related neuronal cell-types.
2.2. OTHER MUTANT MOUSE MODELS OF CEREBELLAR ATAXIA
2.2.1. Pcd Mice
A natural mutation in the NnaI gene leads to quite selective Purkinje cell
degeneration in pcd mice. Granule cells are lost but are upstream of Purkinje
cells, and just a few thalamic neurons eventually. Indeed, a recent study
introduced wildtype NnaI in a cell-type specific manner to Purkinje cells and fully
rescued motor coordination (Chakrabarti et al., 2008, Wang et al., 2006).
Because Purkinje cells are necessary for cortical output, the mutant is essentially
decorticated in the cerebellum. Pcd mice surprisingly have relatively moderate
cerebellar ataxia compared to mice with alterations in DCN output discussed
below, as well as -/-;-/- mice (Joho RJ, unpublished observation). This

39
establishes the importance of the cortical output and Purkinje cells in motor
coordination, and suggests the DCN may only adapt to a loss of inhibition by
Purkinje cells to a limited extent.
Other natural mouse mutants exist where Purkinje cells are lost fairly
specifically albeit less than pcd. These include Lurcher mice. All have ataxia.
2.2.2. Natural and Engineered Channelopathies
Given the prominent, decisive role of ion channels in determining neuronal
excitability and transmitter release in a key downstream position in many signal
transduction cascades it is perhaps not surprising that ion channel genes form
the basis of a number of severe neurological disorders, referred to today
collectively as channelopathies (Cannon, 2006, Bernard and Shevell, 2008).
Ataxias are no exception.
2.2.2.1. Voltage-Gated Potassium Channels
The first channelopathy to be identified in humans was episodic ataxia type-1
resulting from a mutation in KCNCA1 encoding Kv1.1 (Browne et al., 1994).
Cerebellar cortical interneurons such as basket cells express the subunit. A
mouse model was generated and used to show that input from basket cells onto
Purkinje cells is abnormally strong, causing excess inhibition (Herson et al.,
2003). Blockade of Kv3 channels with TEA interestingly has similar augmenting
effects in vitro (Southan and Robertson, 2000).
SCA1 is caused by a repeat expansion affecting Ataxin-1, a protein
involved in transcriptional regulation (Emamian et al., 2003, Zoghbi and Orr,
2008). Recent data suggest Kv4 channels are upregulated in Purkinje cells
causing excessive A-type current to decelerate spontaneous simple spiking. The
deceleration was also seen in vivo and injection of the blocker 4-AP rescued
coordination in a mutant mouse model using the rotarod test. Oddly the
physiological abnormalities preceded symptoms, however this may reflect the

40
sensitivity of the rotarod in detecting subtle ataxia (Hourez et al., 2007). In a
similar vein, expression of Ataxin-3, the causative gene in SCA3, in PC12 cells
resulted in a hyperpolarizing shift in the activation curve of delayed-rectifier
potassium current (Jeub et al., 2006).
2.2.2.2. SK channels
Shakkottai et al., 2004 produced transgenic mouse lines using the Thy1.1
promoter where a dominant negative SK channel subunit was expressed in
circumscribed neuronal cell populations mainly in the red nucleus, pons and
DCN. Severe cerebellar ataxia including gait ataxia resulted that correlated best
with DCN expression. Balance based conjecturally on loss of equilibrium on a
stationary rod and grip strength based on the hanging wire test appeared to be
affected while ataxia was clear on the rotarod and in the footprint test. Firing was
accelerated in this case recording DCN neurons.
2.2.2.3. BK channels
A BK channel null mutant with ataxia was analyzed by Sausbier et al., 2004 that
had a reduced area and amplitude of the afterhyperpolarization of evoked
Purkinje cell spikes but not spike broadening at the soma in slice recordings.
Spontaneous spiking was abrogated. As expected at the Purkinje cell synapse in
the DCN if spikes are broadened at the terminal, paired-pulse depression was
enhanced (Sausbier et al., 2004). The overall mutant phenotype is consistent
with the notion that loss of fast repolarization in Purkinje cells leads to ataxia. In
vivo the lack of spontaneous activity should reduce overall Purkinje cell output
unless afferent input is much greater. Synaptic depression was also augmented
at DCN synapses.
Ataxia was measured by the footprint test, the rotarod and the beam test
measuring falls. Fore paws were inked blue to differentiate prints from those
made by hind paws inked red. Null mice performed worse on these tests than
wildtype mice, making shorter strides and showing paw discordance or abduction

41
referring to a failure to place the hind paw over the fore paw print as normal mice
do. Swimming speed was also reduced.
2.2.2.4. Calcium Channels
Several calcium channel mutations give rise to ataxia (Miki et al., 2008, Erickson
et al., 2007, Ovsepian and Friel, 2008). Cacna1a and Cacna2d, the auxiliary
subunit of the latter, are affected by the leaner and ducky mutations, respectively.
Cacna2a encodes Cav2.1. Mutations in the human gene form the basis of
episodic ataxia type 2 (Riant et al., 2008). The two above mouse mutants exhibit
increased simple spike irregularity in slices. More precisely, the coefficient of
variation of the interspike interval is increased. Enhancing calcium-activated
potassium currents in the cerebellum in vivo with an agonist drug alleviated the
ataxia along with the spike irregularity, leading the authors to conclude it was the
cause (Walter et al., 2006). Complex spikes, which P/Q type calcium channels
such as these help shape, were not examined.
The tottering mutant also harbors a mutation in the Cacna1a gene, as
well as the rocker, rolling Nagoya, and groggy mutants. SCA6, a CAG repeat
SCA, also results from mutations in this channel that cause excessive
accumulation with age sparing electrophysiological properties in a mouse model
(Watase et al., 2008).
2.2.2.5. Sodium Channels
Among the few experiments addressing the role of an ion channel in Purkinje
cells was the cell-type specific ablation of the sodium channel gene Scn8
encoding Nav1.6 that participates in action potential generation and contributes
to subthreshold excitability using the Cre-lox system (Levin et al., 2006). The
ablation was sufficient to elicit an ataxic phenotype as in the conventional Scn8-
null mutant (Raman et al., 1997) and humans carrying a loss-of-function mutation
(Trudeau et al., 2006). It was known from studies of dissociated cells that
spontaneous spiking is eliminated and bursts argued to be akin to complex

42
spikes triggered by current injection1 displayed fewer spikes and a lower
intraburst frequency (Raman et al., 1997). Cell-type specific ablation in granule
cells produced similar effects on behavior (Levin et al., 2006).
Ablation of the gene encoding Nav1.1, another sodium channel prominent
in Purkinje cells, also led to ataxia (Kalume et al., 2007). In this case
spontaneous spiking remained in dissociated Purkinje cells but was decelerated.
Here it is unclear if the loss of the channel in Purkinje cells is causative.
2.2.2.6. HCN channels
In Nolan et al., 2003, decreased performance on the rotarod only at high speeds
and altered timing of the conditioned eyelid response in Hcn1-null mice
suggested cerebellar pathology. Purkinje cell recordings revealed that
spontaneous activity in slices, with little or reduced inhibitory interneuron input,
was normal but subthreshold properties had changed. After hyperpolarization
below threshold and subsequent depolarization using a zig-zagging ramp
protocol, there was an increased latency to resume spiking. This suggested that
Purkinje cells might remain hyperpolarized after inhibition and not bounce back to
baseline readily, rendering the effect of subsequent inputs dependent on past
inputs that determined what state the cell was in (Nolan et al., 2003). The study
did not definitively link Purkinje cells per se to the phenotype causatively,
however the data are consonant with the idea that Purkinje cell firing must be
normal for normal motor coordination.
2.2.3. Calcium-Binding Protein Mutants
Calcium-binding proteins seem to serve as buffers of intracellular calcium which
may protect neurons and compartmentalize calcium entry into the cytosol.
Ultimately calcium levels can impact firing through calcium-activated potassium
channels, like the BK channels discussed above, among other routes. Ablation of
1 Dissociated Purkinje cells lack the enormous dendritic conductance and so have a high
input resistance, reacting dramatically to the slightest depolarizing current as it is essentially undiluted by the currents of the now reduced cell membrane area.

43
calretinin leads to electrical abnormalities in Purkinje cells and granule cells
accompanied by ataxia (Schiffmann et al., 1999). Restoration of calretinin
exclusively in granule cells yielded a rescue of motor coordination (Bearzatto et
al., 2006). Intriguingly, spiking phenotypes in Purkinje cells in vivo were rescued
cell non-autonomously as well. Complex spike burst and pause durations were
decreased and the simple spike frequency increased in null mice, presumably
due to altered parallel fiber input to Purkinje cells directly by way of interneurons.
2.2.4. MGluR1
The role of Purkinje-cell expression of mGluR1 metabotropic glutamate receptors
in motor coordination was shown by cell-type specifically restoring expression in
Purkinje cells using the tetracycline-regulated system (Nakao et al., 2007).
Conventional mGluR1 null mice which have ataxia were bred with mice carrying
an mGluR1 transgene that requires co-expression of the tetracycline
transactivator (tTA) in the same cell. The transactivator was expressed
selectively in Purkinje cells using the L7-tTA line, and rendered inducible by
using doxycycline to suppress expression in adulthood. Restoration only in
Purkinje cells rescued coordination in the footprint test as well as on the rotarod
and it could be reversed by doxycycline, suggesting it was through a fairly acute
effect of mGluR1 expression. There was no electrophysiological analysis.
2.2.5. ROR-α
Mutation of the retinoid orphan receptor-α also causes ataxia in mice in this case
by developmental effects (Steinmayr et al., 1998). Prior to identification of the
genetic etiology the mouse was known as the staggerer mutant. Though
expressed also in thalamus and hypothalamus these areas are morphologically
normal. Purkinje cells in contrast are multiply innervated by climbing fibers.
2.2.6. SCA8

44
Deletion of the Kelch-like 1 gene which may be suppressed by the dominant
mutation at the SCA8 locus either in the whole mouse or just in Purkinje cells
was sufficient to cause progressive ataxia detectable by the rotarod (He et al.,
2006). Expression levels of Kelch-like 1 can affect the level of P, Q-type calcium
channels (Aromolaran et al., 2007) implicated in ataxia as discussed above in
section 2.2.2.4. This mutant constitutes further evidence of the critical role of
Purkinje cells as established by the pcd mouse.

45
CHAPTER THREE Methods
3.1. GENERATION OF NULL MUTANT AND TRANSGENIC MICE
3.1.1. Null Mice
3.1.1.1. Generation and Genotyping of Kcnc1-null allele
Mice lacking Kcnc1 were generated by homologous recombination by the usual
methods in ES cells derived from mice of the 129Sv strain in the context of the
dissertation of Dr. Chi Shun Ho, where detailed methods can be found that led to
the initial report of the null mutant (Ho, Grange and Joho, 1997, Ho, 1996). The
targeting construct ablated codons 273-285 5‟ to those encoding the pore and
voltage gate essential to form a functional potassium channel subunit, leaving the
mRNA 5‟ to this portion intact. Indeed, a Northern blot indicated persistence of
the 5‟ sequence but not the sequence 3‟ to the deletion in null mice. It is unknown
whether the N terminal part of the protein is translated and, if so, if it is stable, for
all Kv3.1 antibodies target C termini. Using such antibodies a Western blot
confirmed the loss of Kv3.1 in null mice. The ablated region was replaced with a
pgk-neo cassette in the same orientation as Kcnc1 for screening ES cells for the
targeting construct, the correct targeting of which was confirmed by a Southern
blot. This cassette remains at the locus. Kcnc1-null alleles were subsequently
discriminated from wildtype alleles during genotyping routinely by a multiplex
PCR sharing a common forward primer,
5‟-GCGCTTCAACCCCATCGTGAACAAGACC-3‟. Reverse primers specific to
wildtype and null alleles were 5‟-GGCCACAAAGTCAATGATATTGAGGGAG-3‟
and 5‟-CTACTTCCATTTGTCACGTCCTGCACG-3‟, respectively. Wildtype mice
yield a 216 bp band, Kcnc1-null mice a 420 bp band and heterozygotes both
bands (see diagram in Appendix A). PCR was performed on a PTC-100
Programmable Thermal Controller (MJ Research) as follows: 95°C for 3 minutes,
followed by 35 cycles at 95°C for 1 min, 61°C for 1 min, and 72°C for 1.5 min,

46
and a final extension at 72°C for 3 min. Bands were observed on a 1.6% agarose
0.5 μg/ml ethidium bromide gel.
The Kcnc1-null allele was maintained on an outbred genetic background
for several years prior to this study. The initial characterization of Kcnc1-null mice
was performed on a 129Sv inbred genetic background.
3.1.1.2. Generation and Genotyping of Kcnc3-null allele
Mice lacking Kcnc3 were generated by homologous recombination by the usual
methods in ES cells derived from mice of the 129Sv strain in the context of the
dissertation of Dr. Emily Chan in the laboratory of Nathaniel Heintz at the
Rockefeller University, where detailed methods can be found that led to the initial
report of the null mutant (Chan, 1997). The targeting construct ablated ~3 kb of
the 5‟ promoter region along with the first two initiator methionines in the coding
region on the first exon. The deleted sequence was replaced with a pgk-neo
cassette in the opposite orientation with respect to Kcnc3. Correct targeting was
verified by a Southern blot and loss of expression was confirmed by a Western
blot. Subsequently mice were genotyped using a multiplex PCR sharing a
common reverse primer for wildtype and null mice, however, even after several
attempts at optimization, the DNA could not reliably be amplified without
laborious Phenol:Chloroform extraction. Even then, bands were often weak.
Therefore I redesigned the PCR.
I repositioned the genotyping primers to amplify sequences with less GC
content and other features likely to hinder PCR with which the Kcnc3 locus is
replete, especially in the CpG island encompassing the basal promoter region at
exon 1 where the deletion is located (see diagram Appendix A). I designed a
completely separate primer pair, 5‟- GCCCAGCAATGAGTGTCCTT -3‟ and 5‟-
TAGACCTGGGCGAAGAGGAT-3‟ to amplify a 227 bp band exclusively in
wildtype mice, placing it in the deleted promoter region 5‟ to the CpG island. I
retained the 5‟ null-specific genotyping primer in the pgk-neo sequence, 5‟-
TTCCATTTGTCACGTCCTGCACG-3‟ and moved the 3‟ primer, 5‟-

47
TGCGGTAGTAGTTGAGCACG-3‟ closer to the edge of the neo cassette,
producing a ~300 bp amplicon (the exact junction between the neo cassette and
genomic DNA is unclear using the Celera 129Sv genome now on NCBI; the
129Sv genome of ES cells is slightly different from that of other 129Sv lines.
Thus, the exact length is unknown). PCR was performed as with Kcnc1 above
except using 55 cycles. Further, I modified also the overall tail DNA preparation
protocol of Malumbres et. al. 1997 to include a 15-minute 95˚C incubation step
to immediately inactivate DNase prior to proteinase K digestion. This dramatically
improved subsequent PCR robustness and was a key innovation that enabled
me to circumvent DNA purification for all genotyping in the lab.
The Kcnc3-null allele was maintained on an outbred genetic background
for several years prior to this study. The initial characterization of Kcnc3-null mice
was performed on a 129Sv inbred genetic background. Maintenance on an
outbred background prevented seizures from occurring occasionally upon
handling of the null mice.
3.1.1.3. Generation of Kcnc1/Kcnc3-null allele
Because the Kcnc1 and Kcnc3 genes are closely linked within ~1 centimorgan
(cM) of one another, to obtain double-mutant mice it was necessary to first derive
recombinants among single-null mice acquiring the other nearby null allele
(Espinosa et al., 2001). After ~100 crosses, offspring were born of crosses
between mice lacking Kcnc1 and mice lacking one Kcnc3 together with one
Kcnc1 allele on separate chromosomes. Kcnc1-null offspring (~50%) also
carrying a Kcnc3-null allele were identified by genotyping as, by necessity,
carrying a double-null allele. These double-heterozygous mice, with both null
alleles now on the same chromosome, were maintained since around 1999 on a
mixed background. Specifically, on a roughly annual basis C57/Bl/6/J, 129SvJ
and ICR mice were obtained that were bred together to yield mice with 25% of
the genome from the inbred strains and 50% from the ICR background. This mix

48
promoted maximal fecundity and overall vigor that was particularly beneficial in
breeding -/-;-/- mice.
3.1.2. Transgenic Mice
3.1.2.1. Generation of pBIKcnc3b-eGFP transgenic mice
Mice that simultaneously express Kv3.3b and the fluorescent reporter enhanced
eGFP in the presence of the tetracycline transactivator were generated using the
pBI-EGFP bicistronic vector (Clontech). Here, two truncated CMV promoters are
oriented in opposite directions with a TRE sandwiched between them to impart
dependence on the tetracycline transactivator for expression. The murine Kcnc3b
mRNA sequence containing the native Kozak sequence 5‟ to the first initiator
methionine and ~0.4 kb of the 3‟UTR was obtained by RT-PCR subcloned into a
series of cloning vectors over a period of years and then transferred to pBI
between the PvuII and MluI sites in the polylinker. The integrity of Kcnc3b, which
is highly prone to recombination in E. coli, was confirmed by restriction digests
and SURE™ cells (Stratagene) were used to greatly reduce the incidence of
DNA rearrangement. The construct was linearized in the vector backbone and
purified using the Elutip-d kit (Whatman) and submitted to the transgenic core,
the UT Southwestern Medical Center Transgenic Technology Center. The
transgenic construct was introduced to the germline by microinjection into
C57/SJLF1 pronuclei. Dr. Anne McMahon screened the founders from the core
and performed all of the work up until this point.
For genotyping I devised a set of primers to detect the transgene via
the eGFP moiety, 5‟-TGCTCAGGTAGTGGTTGTCG-3‟ and 5‟-
ACGTAAACGGCCACAAGTTC-3‟, yielding a 546 kb band, that was amplified
directly from proteinase K digest using protocol I modified based on Malumbres
M et al. 1997 detailed in Appendix A in a PCR performed as with Kcnc1 above.
Bands were visualized by means of 1.6% agarose gel electrophoresis.

49
3.1.2.2. Generation of L7-tTA/pBIKcnc3b-eGFP bi-transgenic mice
pBIKcnc3b-eGFP founders were crossed with transgenic mice carrying the L7-
tTA construct obtained from Dr. Harry Orr at The University of Minnesota (Zu et
al., 2004) to initially screen for expression in Purkinje cells, potential leaky
transgene expression and ultimately assemble the transgenes necessary for the
Purkinje cell rescue experiment. L7-tTA mice are a driver of tetracycline
transactivator (tet-off) expression under the direction of the Purkinje-cell specific
L7/PcP2 promoter (Zhang et al., 2001). The line was generated on an inbred
FVB/N strain background where the L7-tTA transgene had been homozygosed,
as evidenced by test crosses. F1 offspring with the pBI construct, inevitably
hemizygous for the L7-tTA transgene, were detected by genotyping for eGFP as
described above. Double-transgenic F1 offspring were then crossed to mice
carrying only the L7-tTA transgene, often F1 siblings or from other F1 crosses, to
derive F2 offspring to screen for expression. I designed primers to amplify a 400
bp band from the tTA coding region of the transgene, 5‟-
GCTCGACGCCTTAGCCATTG-3‟ and 5‟- TGGCTCTGCACCTTGGTGAT-3‟, that
were multiplexed together with the pBI (eGFP) primers as described above.
Brains of double-transgenic F2 offspring were then screened for eGFP
expression because by the F2 generation most individual transgene integrants at
discrete chromosomal loci will have segregated. I screened acutely-dissected
brains by manually cutting ~1 mm-thick slices from ice-cold tissue with a razor
blade, placing them in Dulbecco‟s phosphate-buffered saline (1X DPBS, Sigma;
in mM: 1.5 KH2PO4, 8.1 Na2HPO4, 136.9 NaCl and 2.7 KCl, pH7.4), and
immediately assessing eGFP expression on a microscope equipped with a 40X
water-immersion lens used for acute brain slice recordings (see below) with
epifluorescence. Alternatively, I used immunofluorescence or highly-sensitive Ni-
enhanced DAB immunohistochemistry using the ABC kit (Vector Labs,
Burlingame, CA) following the manufacturer‟s instructions to detect eGFP using
rabbit anti-GFP (Molecular Probes). Several additional mice were screened for
eGFP expression to be sure the line used bred true and assess mosaicism which

50
can exhibit interindividual variability. Genotyping PCR proceeded directly from
proteinase K digest of tail DNA using protocol I devised as described above for
the null alleles detailed in Appendix A.
3.1.3. Breeding
Double-transgenic wildtype mice (50% FVB/N; 50% B6SJLF1) carrying the
pBIKcnc3b-eGFP (313 line) and L7-tTA transgenes were crossed with outbred
mice carrying the Kcnc3-null allele to obtain mice for restoration of Kv3.3
expression in Purkinje cells initially in Kcnc3-null mice and related controls. Next,
I bred mice to restore Kv3.3 to Purkinje cells on a maximally similar genetic
background that was Kcnc3-null and heterozygous for the Kcnc1-null allele by
crossing wildtype mice with the L7t-TA transgene from the above single-null
experiment with Kcnc1/Kcnc3-null double-heterozygous mice to obtain
Kcnc1/Kcnc3-null double-heterozygous mice with the L7t-TA transgene. These
mice were then crossed with pBIKcnc3b-eGFP+ (396 line), L7-tTA+ Kcnc3-null
mice to yield mice lacking Kcnc3 as well as one Kcnc1 allele, rescue mice with
the latter genotype except bearing both transgenes and mice heterozygous for
Kcnc3 as controls. Offspring of mice from this experiment and their parents were
used to derive mice double-heterozygous for Kcnc1 and Kcnc3 carrying the two
transgenes were bred together to generate -/-;-/- mice, -/-;-/- rescue and wildtype
control mice. Mice were bred and maintained on 4% fat chow (Harlan) unless
otherwise specified.
Separate control groups were used for each mutant because it is
essentially impossible to derive all three types of mutants from the same
breeding pairs along with either wildtype or Kcnc3-null allele heterozygote
controls. I however minimized the genetic distance between these groups by
deriving them from breeders largely culled from the other groups.
3.2. CHARACTERIZATION OF GENE EXPRESSION

51
3.2.1. Western Blot Analysis
3.2.1.1 Preparation of Protein Samples
Brains were dissected from adult mice anesthetized with avertin (1.25%
tribromoethanol in t-amyl alcohol) and separated into cerebellum, brainstem and
forebrain/midbrain (tissue anterior to the pons). Frozen tissue was homogenized
rapidly in cold lysis buffer (in mM: 1.5 KH2PO4, 8.1 Na2HPO4, 136.9 NaCl and 2.7
KCl, pH7.4, 1% Triton X-100) to which 1 Mini Protease Inhibitor™ cocktail tablet
(Roche, Indianapolis, IN) per 10 ml lysis buffer was added. Tissue was deemed
homogenized upon obtaining an even opacity and centrifuged at 13,000 rpm in a
microfuge for 5 minutes at 4˚C. The BCA kit (Pierce, Rockford, IL) was used to
measure protein concentrations. Supernatant was stored as aliquots at -80˚C.
3.2.1.2 SDS-PAGE and Transfer to Blot
Protein samples were separated by electrophoresis in 8.0% SDS-polyacrylamide
at 100V in a BioRad Mini Protean apparatus (BioRad, Hercules, CA) and
transferred to nitrocellulose membranes. The transfer was performed in the
apparatus at 30V overnight at 4˚C.
3.2.1.3 Immunoblotting and Imaging
Blots were blocked in 0.1% TBS-T (100 mM Tris, 1.5 M NaCl, 0.5% MgCl, 1%
Tween-20, pH 7.4) with 5% dry milk (Sanalac, Conagra, Irvine, CA) for 3-4 hours
with gentle agitation. Kv3.3b protein was detected with rabbit anti-Kv3.3b
antibody (Alomone Labs, Jerusalem, Israel) at 1:1200 and mouse anti-actin
(Sigma) at 1:800 in 0.1% TBST-T with 1% dry milk overnight at 4˚C with gentle
agitation. Blots were given five 10-minute washes in 0.1% TBST-T followed by
peroxidase-conjugated goat anti-rabbit IgG antibody at 1:1500 (Pierce, Rockford,
IL) in 0.1% TBS-T with 0.1% dry milk. After four 10-minute washes blots were
treated for enhanced chemiluminescence according to the manufacturer‟s

52
instructions (Pierce, Rockford, IL).
3.2.2. Immunofluorescence
3.2.2.1. Characterization of Kv3 Expression
Adult mice anesthetized with avertin were transcardially perfused with cold
Dulbecco‟s phosphate-buffered saline (1X DPBS, Sigma; in mM: 1.5 KH2PO4, 8.1
Na2HPO4, 136.9 NaCl and 2.7 KCl, pH7.4) followed by 4% paraformaldehyde in
1X DPBS. Brains were dissected, post-fixed for 1 hour at 4oC, followed by
cryoprotection in 40% sucrose in DPBS at 4oC. The tissue was embedded in
OCT, sectioned at 20 µm coronally or sagittally, stored at -20˚C in storage buffer
(80 mM DPBS, 30% glycerol and 30% ethylene glycol) until free-floating
immunohistochemistry was performed. Sections were protected from light
whenever quenchable fluors were present.
Frozen sections in storage buffer were first given three 10-min washes in
1X DPBS followed by a 2-3 hour incubation with blocking solution (4% goat
serum, 5% BSA, 0.3% Triton X-100, 0.05% Tween-20 in 1X DPBS). Gentle
agitation was used during all incubations. Primary antibodies including rabbit
anti-Kv3.3b (1:650; Alomone), mouse anti-Kv3.1b (1:50; Antibodies Inc., Davis,
CA), rabbit anti-Kv3.2 (1:500; Alomone), rabbit anti-Kv3.4 (1:200; Alomone),
mouse anti-Kv3.4 (1:50; Antibodies Inc.), mouse anti-SMI-32 (1:1000; Covance,
Princeton, NJ), mouse (IgG2a) anti-GAD67 (1:2000; Chemicon/Millipore,
Temecula, CA), mouse anti-calbindin (1:750; Swant, Switzerland) were applied
overnight in blocking solution at 4oC with gentle agitation followed by four 10-
minute washes in 1X DPBS. Goat anti-rabbit Alexa568-, Alexa488- or Alexa633,
or anti-mouse Alexa568-, Alexa488- or Alexa647-conjugated secondary
antibodies (Molecular Probes/Invitrogen, Eugene, OR) were applied in blocking
solution at 1:400 at room temperature for 3-4 hours followed by three 10-min
rinses in PBS Sections were mounted on Probe-On™ Slides (Fisher) and dried.
Slides were dried in graded ethanols and defatted in xylene.

53
3.2.2.2. Post-Hoc Identification of Alexa488-filled Neurons from Patch-Clamp
Recordings
Transcardial perfusion of mice with aCSF before slice preparation (see section
3.4.1.1) was necessary to eliminate autofluorescence from blood vessels for
post-hoc immunofluorescence. Slices were placed in 4% paraformaldehyde in 1X
DPBS on ice within 2 minutes of seal loss for 1-1.5 hours until stored in 40%
sucrose in 1X DPBS with sodium azide at 4˚C protected from light at least
overnight to several weeks. Slices were resectioned at 40 µm or processed
without sectioning. The above immunohistochemistry protocol in section 3.2.2.1
was used except unsectioned slices were incubated in the blocking solution with
the Triton X-100 elevated to 10%.
3.3. BEHAVIORAL ANALYSIS
3.3.1. Analysis of Motor Coordination
3.3.1.1. Force Plate Actometer
Individual, naïve mice were allowed to freely explore a lightweight, rigid platform
(28 x 28 cm) resting on four sensitive force transducers covered by a Plexiglas
enclosure suspended just above the plate (Fig. 3.1). The walking trajectory
during epochs of linear ambulation on the plate is represented by connections of
temporally consecutive centers of force (COFs), which are essentially the center
of gravity determined by which paws are on the plate, how far paw placements
are from each other and how much force is applied during stepping. COFs are
Figure 3.1. (Below) Mouse ambulating freely on the force plate actometer. Normally the plate is
covered with a plexiglass box that has been removed here for better visualization. Force
transducers can be seen in each corner.

54
sampled at 20 ms intervals at
high spatial resolution ( < 1
mm). The total distance
traveled is the sum of the linear
distances (Σdi) between
consecutive COFs. The area
measure corresponds to the
sum of all triangular areas (Σai)
defined by every three
consecutive COF
measurements (Joho et al., 2006, Fowler et al., 2001). For a quantitative
measure of lateral deviation from the main walking trajectory, the summed areas
(Σai) generated during the 6-min test are divided by the total distance traveled
(Σdi) to obtain the lateral deviation index (LDI = Σai/Σdi). The LDI would equal
zero if the walking trajectory were a straight line (area measure equals zero). The
LDI (in mm) increases with increasing lateral deviation of the COFs from the
main trajectory of movement and corresponds to the „relative amplitude‟ of
deviation from the mean path, representing an operational measure for motor
coordination during ambulation.
For the force plate experiment, mice were maintained on a 12/12
light/dark cycle and tested during the latter half of the light phase. Males and
females were used because the lab did not observe gender differences in
previous work (Joho et al., 2006). In the DKO rescue experiment mice were kept
on 11% fat chow (Harlan) from weaning onwards to reduce mortality and better
equalize body size to that of wildtype controls by the time age-matched control
groups were tested at 3-6 months of age. Testing occurred on the first day of the
beam test (see below) for a duration of 6 minutes.
3.3.1.2. Beam Test
The same mice used on the plate above were on the same day started on the 5-

55
day beam test (see section 3.3.1.1 above for age, photoperiod and other subject
parameters). Males and females were used because we did not observe gender
differences (Joho et al., 2006).
Figure 3.2. Mouse traversing the 1-cm
beam in the midst of making a slip with
its right hind limb.
The protocol was based on that
of Goldowitz et al., 2006
(Goldowitz, Moran and Wetts,
1992). Mice were placed at the
end of a narrow (2-cm, 1-cm or
0.5-cm wide) 100-cm long Plexiglas beam with a smooth, flat surface and 1-cm
tall vertical sides suspended 10 cm above a surface and allowed to traverse the
beam five times per day on five consecutive days. Forelimb and hind limb slips
on the 1-cm beam and sideway falls on the 0.5-cm beam were counted by two
observers on each side blind to genotype (nearly all slips were by hind legs),
namely Dr. Joho and myself consistently. In the -/-;-/- rescue experiment the 2-
cm beam was used and falls were counted because of the severe ataxia of -/-;-/-
mice virtually precludes counting of slips. After falling mice were placed back on
the beam where they fell and released once they regained their footing. If -/-;-/-
mice fell promptly after 15 attempts to place them on the beam they were
deemed unable to perform. When mice lacking one Kcnc1 allele as well as
Kcnc3 were tested on both the 1 and 0.5-cm beams, a 2-day hiatus separated
the two tests. Process NPD, and ammonium quat disinfectant (Steris), was used
to clean the beam between mice. The average numbers of slips and sideway
falls per 100 cm traveled each day were used for data presentation and analysis.
3.3.1.3. Rotarod

56
Largely the same mice used in the above studies were tested on an Economex
(Columbus Instruments, Columbus, Ohio) accelerating rotarod at 8-11 months of
age. Mice were kept on a 12/12 light/dark cycle, tested during first half of dark
phase in very dim light. The width of the rod covered in a longitudinally-grooved
plastic casing was ~3 cm and it rotated such that mice must move forward to
remain on in the orientation they are initially placing, facing away from the
experimenter. I gave the mice 4 trials separated by ~1-hour intervals on each of 4
days, based on the method of Nolan et al., 2003. Rotation began at 5 rpm and
accelerated at 10 rpm/minute. The latency to fall was noted for each mouse.
Obese mice and mice not remaining on the rod on day 4 for >10 seconds on
average over the last 4 trials were excluded from the analysis. The maximal
latency to fall among all mice was nearly 7 minutes.
3.3.2. Gait Analysis
3.3.2.1. DigiGait™ Analysis
Mice used for DigiGait™ analysis largely overlapped those used for the above
tests. For the pilot Kcnc3-null experiment, mice were 10-12 months old and the
same mice used for the rotarod test, where most wildtypes were albino and most
agouti mice were pigmented. All mice used in the experiment examining +/-;-/-
mice were agouti males, and 3-6 months of age, with the majority 4-6 months. In
this experiment, mice heterozygous for the Kcnc3-null allele served as normal
controls.
Data were acquired by first painting the paws of mice with a red, and
extraneous reddish parts of the mice with a blue Betty Crocker Easy Writer cake
decorating marker and placing the mice on the stationary DigiGait™ treadmill
(Mouse Specifics, Boston, Massachusetts). Paws are detected as red color
contacting the belt and blue is ignored. The treadmill is equipped with a Plexiglas
chamber mounted over the area monitored by the camera to keep the mouse
running in place and in view. I removed the curved bumper accessories and

57
added a dropped ceiling made of Scotch tape to prevent rearing. The belt was
turned on at an initial speed of 5-10 cm/second to keep the mouse from
grooming away the red coloring from its paws as well as acclimate the mouse to
the treadmill. Excess food coloring that came off at first on the belt was wiped
away as the belt moved past the Plexiglas box. The speed was then increased in
increments of 5 cm/seconds, and each stepwise increase lasted for ~5 seconds
until the speed was increased again. Recordings for gait analysis were made
once the mouse was able to reach 25 cm/second consistently to produce 10
suitable consecutive strides uninterrupted by pauses causing backward drifting
on the belt. Using the DigiGait imager (Mouse Specifics), .XVF video files were
acquired of 1000-3000 frames from which smaller .AVI video clips could be
selected for analysis.
3.3.2.2. Footprint Analysis
The paws of adult mice largely overlapping those used in the above studies were
dipped in India ink and the mice were allowed to ambulate at will on bench paper
to the end of a one-liter graduated cylinder laid horizontally that was covered in
tin foil. When Kcnc3-null compared to wildtype control mice were tested, a longer
cardboard poster tube with an autoclave glove over the end was used. Both
tunnels were ~3.5 inches in diameter. Fore paws were inked blue while hind
paws were inked red. Mice were held in one hand along the entire scruff while
the other hand was used to press the overturned cap of the India ink containing a
puddle of ink held firmly against the bottom of a paw. The most regular,
consistent samples of gait uninterrupted by pauses spanning three consecutive
strides were selected for analysis from each mouse. Mice that never produced
such samples of gait after three trials were excluded from the analysis. The
distances between the centers of (sole defined as center) of three consecutive
hind paw prints on one side of the body were averaged and taken as the stride
length. Stance width was taken as the average of distances separating every four
opposing hind paw print centers. Gait was defined as 100% alternate if each paw

58
print was equidistant between preceding and succeeding opposite paw prints or
0% if exactly opposite a contralateral paw print (hopping). The distance between
each of the consecutive paw prints and the closest, preceding or succeeding,
opposite paw print was multiplied by 200%, and the product divided by the
distance between preceding and succeeding opposite paw prints (stride length)
to obtain the percent value quantifying alternate gait. Values from three
consecutive strides were averaged. Paw discordance was taken as the average
of the distances between the centers of each hind paw print and the nearest fore
paw print for each of eight pairs of fore and hind paw prints from consecutive
strides.
3.3.3. Other Motor Phenotypes
3.3.3.1. Twitching Score
During the 5-day beam test, mice were observed every day for the presence of
subtle, highly-localized twitches that were best observed when mice paused on
the beam. Twitches were most evident on the back of the mouse and the ears.
Mice were rated as 0, 1, 2 or 3 (twitch score) according to frequency and strength
of twitches by two observers that were blind to genotype. The averaged twitch
scores for 5 days were used for data analysis.
3.3.3.2. Electromyography (EMG) Recordings
Mice were anesthetized with 50 mg/kg ketamine (Fort Dodge)/ 25 mg/kg
acepromazine (Vetus) diluted in 25% ethanol (ethanol 2 mg/kg), shaved over the
neck and monitored by a bipolar EMG electrode placed just subcutaneously. The
electrode was moved around until locations were reached where motor unit
activity was observable. In some instances the electrode was left in a silent
location and monitored for up to an hour until activity appeared. Bursting activity
was only regarded as such if it was not in phase with respiration and therefore
59
potentially a mere artifact of the muscle moving with respect to the stationary
electrode tip.
3.3.3.3. Grip Test
Individual mice were placed on the inside of an inverted Edstrom wire mesh cage
top that was flipped once the mouse grabbed a hold and suspended ~4 feet
above a surface. The latency was measured up to a maximum of 3 minutes.
3.3.3.4. Rocking Ball Test
A 6-inch diameter, clear, colorless round bottom Pyrex flask was suspended on
the end of a horizontal 1-cm wide metal rod anchored in a rubber cork inserted
into the opening in the middle of the flask. The rod was clamped ~7 inches high
(determines amplitude of rocking) to a vertical ring stand apparatus affixed to the
fulcrum of a variable-speed adjustable tilt Shaker 35 blot rocker (Labnet
International Corp., Woodbridge, NJ) set at 7˚. Beneath the ball (flask) a 63 x 37
cm wide 15 cm inch deep pool of room temperature water was made in a plastic
tray. It was important to keep the walls of the tray far enough from the ball that
the mouse did not attempt to escape from the ball, invalidating the test. I placed
mice squarely on top of the stationary ball and immediately turned the rocker on
speed setting of 5 (1 Hz) until mice fell into the water. This training session was
necessary to ensure mice were motivated to stay on the ball in the future. Actual
testing at 1.25 Hz commenced 1-2 hours after the initial dunk. Swimming ability
was noted. The latency to fall was measured up to 1 minute. The number of
seconds the mouse remained on the ball was subtracted from the maximal
duration of 60 seconds to provide a measure proportionate to impaired postural
control or balance.
These mice were kept on a 12/12 light/dark cycle and 2-4 months of age.
3.3.3.5. Harmaline Tremor

60
Harmaline tremor was induced in mice by injecting harmaline (Sigma) i.p. at 15
mg/kg in 0.9% NaCl (pH ~7.4 with NaOH). Tremor was measured for 12 minutes
~10 minutes post-injection on the force plate actometer (see section 2.1.3
above). Each recording was divided into 72 10.24-second epochs that were
visually inspected and 6 epochs were selected for analysis by a Fast Fourier-
algorithm.
3.4. BRAIN SLICE ELECTROPHYSIOLOGY
Unless otherwise indicated all chemicals were obtained from Sigma.
3.4.1. Purkinje Cells
3.4.1.1. Brain Slice Preparation
Mice aged P40-95 were anesthetized with 50 mg/kg ketamine (Fort Dodge)/25
mg/kg acepromazine (Vetus) diluted in 25% ethanol (ethanol 2 mg/kg by i.p.
injection prior to decapitation. Artificial cerebrospinal fluid (aCSF) was (in mM):
NaCl, 125; KCl, 3.25; CaCl2, 1.5; MgCl2, 1.5; NaHCO3, 25; D-glucose, 25;
preoxygenated by carbogen (95% O2, 5% CO2) gas. The cerebellum was rapidly
exposed, cooled with ice-cold aCSF, excised together with the brainstem, and
cut with a razor blade parasagitally for mounting on the cut surface with
cyanoacrylate securely to a chuck in a Vibratome (Ted Pella, Redding, CA,
USA). The brain was conveyed to the room temperature chuck with an ice-cold
spatula that was dabbed against a paper towel to dry the brain somewhat before
dislodging with a #1 fine sable paint brush onto the glue. Within 5-10 seconds the
tissue was immersed in ice-cold aCSF. The glue must be warm to cure and the
brain thoroughly chilled to stand firm against the blade. Warming should be
minimized however to reduce injury, as well as the overall duration of the slicing
procedure. 200 µm-thick slices were cut from the vermis in ice-cold, carbogen-

61
bubbled aCSF at speed 1.5-2 and an amplitude 5-8 with the dorsal surface facing
the blade. Each slice was pinched free from non-cerebellar tissue with forceps,
immediately transferred to an Edwards chamber submerged in carbogen-bubbled
aCSF maintained in a 35 °C water bath and incubated for 30–45 min; upon
removal from the water bath slices were allowed to cool and remain at room
temperature (22 °C) until use in recording at least 45 minutes after slicing.
3.4.1.2. Whole-Cell Patch-Clamp Recording
Slices were recorded in a submerged chamber maintained at 35 +/-0.5°C
anchored by a C-shaped piece of metal small enough to hold the parasagittal
cerebellar slice. The temperature was monitored near the slice with a bead
thermistor using a TC-344B heater (Warner Instruments, Hamden, CT).
Osmolality was adjusted if needed with sucrose, and was ~305 mOsm. Neurons
were visualized at 40x with an Eclipse 6600FN epifluorescence microscope
(Nikon, Melville, NY) using differential interference contrast-infrared optics and a
Hamamatsu C2400 camera (Hamamatsu Corp., Hamamatsu, Japan) linked to a
video monitor (Sony, Tokyo, Japan).
Borosilicate glass recording pipettes (bath 2–7 MΩ) were pulled on a
Sutter P-87 puller (Sutter Instruments, Novato, California) from thin-walled
(1.2 mm O.D.; 0.68 I.D.) borosilicate glass with filament (Warner). The internal
solution consisted of (in mM): K-methylsulfonate, 130; EGTA, 0.1; HEPES, 10;
NaCl, 7; MgCl2, 0.3; Di-Tris Creatine-PO4, 5; Tris-ATP, 2; Na-GTP, 0.5 at ~290
mOsm. The stock solutions of the latter 3 phosphates was adjusted upon
dissolution to pH 7.3 with HCl. The pH of the internal solution prior to the addition
of 100X phosphate stocks was adjusted to 7.3 with KOH. The electrolyte for
whole-cell current-clamp recordings was adjusted to closely approximate
physiological thermodynamic potentials for key ion species at 35 °C: ENa
55.9 mV; EK−97 mV; ECl−76 mV. A liquid junction potential with the external
bathing medium of ~11.6 mV was calculated for this electrolyte. Whole-cell
current-clamp recordings were obtained using the Axoclamp 2B amplifier (Axon

62
Instruments / Molecular Devices, Sunnyvale, CA) filtering at 10 kHz in bridge
mode. The intracellular pipette resistance was kept at 15-25 MΩ for spike
waveform measures by monitoring the bridge balance. Data were collected at 40
kHz with pCLAMP 9.2 software (Axon Instruments), operating on a Dell
Dimension 8250 (Dell Computer, Austin, Texas) interfaced with a Digidata 1322A
(Axon Instruments). Only neurons capable of stable spontaneous spiking
overshooting 0 mV resting more negative than ~-45 mV were recorded. Purkinje
cells were easily identified by their distinct morphology and position within the
cerebellar cortex, and selected primarily on the basis of membrane appearance.
An average bias current of ~−1 nA was applied in current-clamp mode to stop
spontaneous discharge and maintain all recordings at a baseline level of −70 mV
except for brief periods to deliver stimulation at various holding potentials or rest.
3.4.1.3. Spontaneous Simple Spike Recordings
Recordings were made at the resting potential to measure the spontaneous spike
rate and action potential waveform parameters. Measurements were taken after
the spike rate settled to a steady-state yet within 2 seconds of turning off
hyperpolarizing bias current. The simple spike rate was measured from the
interspike interval immediately preceding the complex spikes, and the pause was
taken as the interval between the last spikelet and first simple spike after the
complex spike.
3.4.1.4. Spike Frequency as a Function of Injected Current (F-I) Relation
F–I plots were compiled from 1.2-second depolarizing steps delivered by the
clamp every 5 seconds from a holding potential of -70 mV. After each step the
magnitude of the injected current was increased by 200 pA.
3.4.1.5. Climbing Fiber Stimulation
Climbing fibers were stimulated by 100-µs stimuli from an A365 stimulus isolator
(World Precision Instruments, Sarasota, FL) triggered by pClamp delivered via a

63
1.5 mm theta pipette in the granule layer pulled as above with the tip broke to
~10 µm filled with HEPES-aCSF (in mM: 150 NaCl, 3.35 KCl, 1.5 MgCl2, 20 D-
glucose, 10 HEPES, 1.5 CaCl2, pH 7.4 with NaOH). Formvar-insulated tungsten
0.005 wires (Plastics One, Roanoke, VA) were inserted into each barrel with the
insulation stripped 2 mm at the tip. These wires were connected by gold plugs to
hi-flex, shielded wire (Cooner Wire, Chatsworth, CA) that blocked transmission of
vibrations from the stimulus isolator to which it was connected outside the rig.
Climbing fiber responses were distinguished by their all-or-none nature, were
free from antidromic contamination and parallel-fiber evoked responses. Stimuli
were delivered at 1 Hz only to avoid short-term plasticity at the climbing fiber
synapse at minimal intensities.
3.4.2. DCN Neurons
3.4.2.1. Brain Slice Preparation
The methods were identical to those enumerated in section 3.4.1.1 above except
for the following modifications. Mice aged P17-21 were used that were typically
the offspring of mice used in behavioral experiments involving the +/+;-/- mice
lacking one or both Kcnc1 alleles. Perfusion was necessary to eliminate
autofluorescence from blood vessels for post-hoc immunofluorescence. Under
deep 100 mg/kg ketamine (Fort Dodge)/25 mg/kg acepromazine (Vetus)
anesthesia diluted in 25% ethanol (ethanol 2 mg/kg), mice were perfused at 20
ml/minute with 23-30 ml of ice-cold aCSF. Artificial cerebrospinal fluid (aCSF) for
preparing slices was (in mM): Sucrose, 228; KCl, 3.25; CaCl2, 0.5; MgCl2, 7;
NaHCO3, 28; D-glucose, 7; NaPyruvate, 3; ascorbic acid, 1; preoxygenated by
carbogen (95% O2, 5% CO2) gas. Ascorbic acid and pyruvate were added fresh
from frozen stocks. Osmolality was adjusted if needed with sucrose, and was
~320 mOsm. Completely-exsanguinated, cold brains were then used for
dissection to prepare 300 μm slices principally including the medial nucleus.
Slices recovered in normal aCSF.

64
For DCN recordings, normal or CsCl internal solution (see individual
descriptions below) was used except Alexafluor488 was added at 68 μM to fill
cells for post-hoc co-labeling with immunofluorescence. Recording pipettes were
pulled on a P-87 or P-97 horizontal puller (Sutter) when using 1.2 O.D. 0.68 I.D.
(Warner) or 1.5 O.D. 0.86 I.D. (Sutter) glass, respectively, as indicated in the
sections that follow. Low-pass filtering was at 3 kHz via the Axoclamp 2B, for
current clamp recordings, or 5 kHz for voltage clamp on the Axopatch 200A. Data
were collected at 200 kHz to provide adequate resolution of fast spikes for
measurement of waveform parameters in Minianalysis (See section 3.5.3.1).
3.4.2.2. Intrinsic Firing Properties
Normal aCSF was used except 25 μM D-(-)-2-Amino-5-phosphonopentanoic acid
(D-AP5; Ascent Scientific) and 25 μM 6,7-Dinitroquinoxaline-2,3-dione (DNQX)
were added to block glutamatergic inputs during stimulation and to minimize
interference from spontaneous synaptic inputs. Action potential waveform
measurements were taken from the resting potential 4-5 minutes after breaking
into the cell. F–I plots were compiled from 1.2-second depolarizing steps
delivered by the clamp every 5 seconds from a holding potential of -60 mV. After
each step the magnitude of the injected current was increased by 100 pA.
3.4.2.3. Stimulation of Purkinje Cell Terminals in the DCN
Normal aCSF was used except 25 μM D-AP5 and 25 μM DNQX were added to
block glutamatergic inputs during stimulation and to minimize interference from
spontaneous synaptic inputs. Stimulation was delivered as 100 µs stimuli from an
A365 stimulus isolator (World Precision Instruments) triggered by pClamp
delivered via a 1.5 mm theta pipette (W.P.I) in the granule layer pulled as above
with the tip broke to ~30 µm filled with HEPES-aCSF (in mM: 150 NaCl, 3.35
KCl, 1.5 MgCl2, 20 D-glucose, 10 HEPES, 1.5 CaCl2, pH 7.4 with NaOH).
Formvar-insulated tungsten 0.005 wires (Plastics One) were inserted into each
barrel with the insulation stripped 2 mm at the tip. These wires were connected

65
by gold plugs to hi-flex, shielded wire (Cooner Wire) that blocked transmission of
vibrations from the stimulus isolator to which it was connected outside the rig.
The stimulus electrode was placed >100 µm, typically 150 µm, dorsal or posterior
to the patched cell. Deeper placements tended to be more effective. The
distance was important to mitigate antidromic stimulation of axons that tend to
course ventrally to exit the cerebellum. Nonetheless, antidromic stimulation was
frequently a problem when the soma was depolarized. Also, the dendritic field of
large DCN neurons in rodents can extend out > 300 µm. Apparent direct
stimulation of the cell was evident in sudden depolarization of the membrane
potential in some cases. On the other hand, larger responses could be elicited
closer to the cell. Optimal responses were obtained from the most medial slices
containing the medial DCN nuclei with the stimulating electrode placed in the
white matter of folium VI adjacent to the dorsoposterior corner of the DCN, which
was moreover most amenable to patching for the white matter was less dense
here. Parasagittal slices at this level were indeed found to have the most intact
connections using DiI tracing (Telgkamp and Raman, 2002). Often the position
had to be adjusted to achieve usable responses.
3.4.2.4. IPSC Recordings
Inhibitory postsynaptic currents were recorded in voltage-clamp mode using an
Axopatch 200A amplifier (Axon). The internal solution for these experiments was
(in mM): CsCl, 126; EGTA, 9; HEPES, 9; NaCl, 6.2; MgCl2, 1.8; Di-Tris Creatine-
PO4, 5; Tris-ATP, 2; Na-GTP, 0.5; QX-314 Br, 7 at ~290 mOsm (calculated Ecl
+1mV). The calculated liquid junction potential was -6 mV. Gabazine (SR-95531;
Tocris) was applied when indicated at 10 μM in HEPES aCSF (See above
section 3.4.1.5) with 0.01% phenol red using a puffer pipette consisting of a
patch pipette broke to ~100 μm placed upstream with respect to the direction of
bath perfusate pressed into the surface of the slice controlled by a 1 cc syringe.
Pipettes were kept below a bath resistance of 4 MΩ and intracellular resistance
of 20 MΩ, most often <15 MΩ. 95% prediction and 50% compensation was used.

66
Recordings were rejected if the access resistance drifted >20% or input
resistance decreased below 50 MΩ. Stimulation trains were delivered at 15-
second intervals. Between trains cells were held at -6 mV (-6 mV correcting for
junction potential) to allow binding of the use-dependent sodium channel blocker
QX-314, which proved essential for blocking contaminating action potentials
triggered by the largest eIPSCs that were of sufficient magnitude to escape the
clamp. Otherwise cells were held at -60 mV, for holding the cell near the resting
potential is thought to extend the duration of stable whole-cell recordings.
Protocols were also executed from -60 mV, yielding eIPSCs of sufficient
magnitude while improving the space clamp by minimizing voltage error because
this potential is close to the resting potential. The frequencies of the protocols
used for voltage clamp were the same as those used in current clamp however
the overall durations were kept constant; the wildtype protocol at 100 Hz
delivered a total of 50 stimuli over 0.5 seconds whereas the null protocol was 33
stimuli over 0.5 seconds.
3.4.2.5. Post-Hoc Identification
When possible, 100-millisecond negative current injections were given at 1 Hz at
the end of recordings for up to 5 minutes to aid in filling the cell with the
positively-charged fixable polar tracer. Cells were retrieved after recording within
2 minutes, typically 1 minute, of completely breaking the seal. Often the pipette
could be withdrawn slowly from the cell as though excising a patch with the
resting potential remaining negative to -30 mV. Perfusion was stopped, the
anchor was removed, sometimes with the help of a fine sable #0 paint brush, and
the slice was retrieved by lifting the piece of lens paper or Kimwipe it was placed
on with forceps. The slice was dropped into 5 ml ice-cold 4% paraformaldehyde
in 0.1M DPBS that had been frozen promptly after and freshly thawed. In some
cases it was thawed by a 10-second pulse in a domestic microwave (May be
contraindicated as this seemed correlated to poor recovery). Slices were
protected from light. Fixation proceeded 1-2 hours after which slices were

67
transferred to 40% sucrose in DPBS with sodium azide until resectioning (See
section 3.2.2.2 above).
3.5. DATA ANALYSIS AND PRESENTATION
3.5.1. Characterization of Gene Expression
3.5.1.1. Imaging
Immunofluorescence was imaged using a Zeiss LSM 510 laser confocal
microscope except that shown in Figure 4.2, which employed a Leica TCS SP2.
Figures were made in Microsoft Publisher. With this microscope images were of
sufficient quality to obviate the need for adjustments in Photoshop. Though by
necessity laser confocal settings had to differ between slides and even regions of
interest to optimize dynamic range, the strategy employed to optimize the image
was very consistent. All images were scanned so that the gain and offset were
set to limit saturation (red on lookup table) and not show signal in areas that are
truly black yet minimize non-illuminated areas (blue on lookup table). It was often
necessary to saturate the soma in images of Alexafluor-filled cells for the ratio of
signal intensity in the soma compared to the dendrites was very high so that fine
processes would otherwise be invisible. Background in some negative controls
may seem higher because this same protocol was applied to those sections
which in the absence of strong signals had maxima closer to background. This in
turn elevated the overall intensity somewhat.

68
Figure 3.3. Calculation of the lateral deviation index. (A) Individual walking trajectories are
identified and colored differently in the figure. (B) Examples of individual walking trajectories that
are analyzed taken from a above. (C) Triangular areas denoted „a‟ defined by every three,
consecutive center of force measurements. Distances between consecutive points are labeled „d‟.
The first and third points of every three, consecutive measurements are connected with blue lines.
The walking trajectory is black. To derive the lateral deviation index the sum of the triangular areas
is normalized to the total distance traveled along the black walking trajectory connecting
consecutive center of force measurements.
3.5.2. Behavior

69
3.5.2.1 Analysis
Center of force (COF) data from the force plate actometer were examined in
Origin (Origin Lab Corp., Northampton, MA) where walking trajectories were
identified, lateral deviation was computed and ANOVA was performed. Area
measures were taken from every three consecutive COF measurements and
normalized to the total distance traveled to derive a lateral deviation index (see
section 2.1.3). Slips and falls of each mouse were averaged over the 5 traversals
of the narrow 100-cm beams from each of the 5 days. The means for each
mouse were analysed by 1-way and 2-way ANOVA in Origin. For 2-way ANOVA,
genotype was the between factor and days on beam was the within factor.
DigiGait™ data were analyzed in DigiGait™ analysis software v. 6.0 in MatLab
(The Mathworks, Natick, Massachusetts) by taking .AVI video files sampling the
300 frames containing the most consistent gait from each 1000-3000-frame .XVF
file captured at acquisition were taken per mouse, which typically captured 10
strides. The snout-out feature was adjusted to ensure the red in the snout was
not spuriously recognized as a paw. The red filter was set at 0.8 (just sufficient to
avoid artifactual recognition of red in agouti coat and prevent fusion of
recognized paw prints during frame-by-frame analysis) and the blue filter was
kept at 2. Control brightness was set at 255 and control darkness at 0. All
automated frame-by-frame analysis was monitored for artifacts. Data were of
sufficient quality that correction provisions in the program were rarely needed
and if so not more than one for every 10 steps. Footprint data were measured
within 1-mm manually and means were computed in IgorPro v. 5.0.4.8
(Wavemetrics, Oswego, OR). ANOVA for gait tests and the rotarod was
performed in Prism v. 5.01 (GraphPad Software, La Jolla, CA). Averaged twitch
scores of each mouse over 5 days were analyzed by the Kruskal-Wallis test in
Origin. Rocking ball data were analyzed by the Kruskal-Wallis test in Prism.
Harmaline tremor epochs were analyzed by a fast fourier transform algorithm and
ANOVA while frequency was analyzed with 2-tailed Student t-tests in Origin

70
(Microcal Origin, 7.0; Origin Lab Corp.). For ANOVA the Tukey post test was
always used.
3.5.2.2 Presentation
Graphs of force plate and beam data were created in Sigmaplot v. 8.0, SPSS,
Chicago, IL). Those of gait tests, rotarod and rocking ball were created in Prism
(Graphpad Software). Means and standard error of means (S.E.M) were used.
3.5.3. Brain Slice Electrophysiology
3.5.3.1. Analysis
Complex spike parameters, including pause durations, as well as the simple
spike frequency and action potential waveform data from Purkinje cells were
measured in Clampfit v. 9.2 (Axon). The latter was used also to measure foot-to-
peak IPSC amplitudes. Complex spikes were only measured if they were not
preceded by a simple spike for at least 2 ms. Spikelets were considered to
comprise a complex spike if the interspike interval did not exceed 75% of that of
the surrounding simple spikes, though typically the need for this criterion was
obviated by the significant pause following the complex spike. Action potential
waveform data from DCN neurons and spike rate data from both Purkinje and
DCN neurons were analyzed in Minianalysis v. 6.0.3 (Synaptosoft, Decatur, GA)
using the following settings. In the main window:
o Threshold = 20 o Period to search a local maximum = 1000 o Time before a peak for baseline = 750 o Period to search a decay time = 1000 o Fraction of peak to find a decay time = 0.05 o Period to average a baseline = 200 o Area threshold = 3.5 o Number of points to average a peak = 3.
Spike rate data were compiled from the detected peaks by calculating interevent
intervals and viewing the column statistics in Data Array menu. Spike waveform
71
measurements were then taken by marking the detected events as group 1 and
clicking Group Analysis in the Events menu. In Group Analysis the gain was set
at 20 and 4 blocks were analyzed per event. Events were analyzed as individual
aligned at rise. Baseline was set to zero and threshold was used as baseline.
Threshold was detected as the peak of the second differential using heavy
filtering (smoothing set to 80 points). Data from 10 spikes were analyzed per cell
and the average obtained from column statistics in the results menu.
Input resistances were measured by taking the linear slope of the plot of
voltage as a function of injected current using 4-9 steps (including zero) of
current injection, typically only in the negative direction but always where the
response was linear (“ohmic”) from a subthreshold voltage of -60 mV. Amplitudes
of the peaks of voltage steps from baseline were measured in Clampfit 9.2
(Axon). Input resistances were calculated by plotting the change in voltage as a
function of injected current to derive a slope in Prism (Graphpad).
3.5.3.2. Presentation
Graphs from Purkinje cells were presented using Sigmaplot (SPSS Corp.) while
DCN data were presented using Prism. Action potential data were presented
using Igor Pro (Wavemetrics) and not corrected for the calculated for the junction
potential.

72
CHAPTER FOUR
Results
4.1. A TRANSGENIC APPROACH TO RESTORE KV3.3 EXPRESSION IN
PURKINJE CELLS OF MICE LACKING KCNC3
To bridge the gap from ion channel gene to acute behavior, analysis at the level
of cellular electrophysiology is required, which requires knowledge of which cell
types actually contribute to the behavioral deficits. The main hypothesis I sought
to test in my dissertation work was the hypothesis that Kv3.3 expression in
Purkinje cells is sufficient for motor coordination such that expression in other
neuronal cell types is not absolutely necessary. A corollary of this hypothesis is
that restoration of Kv3.3 expression in Purkinje cells should suffice to abolish
ataxia in Kcnc3-null mice. Thus, I, with help from Dr. Anne McMahon, used a
transgenic approach to restore Kv3.3 expression in exclusively in Purkinje
neurons. I used a transgenic construct created by Dr. Anne McMahon to express
Kv3.3 and eGFP selectively in Purkinje neurons by using a bidirectional promoter
active only upon co-expression of the tetracycline transactivator protein (tTA). By
crossing these mice with existing L7-tTA transgenic mice that express the tTA
only in Purkinje cells on a Kcnc3-null background, I restored Kv3.3 expression
only in Purkinje cells (Fig. 4.1). The tTA of the L7-tTA is of the “tet-off” variety
with which transcription of the tet-regulated gene is constitutively active and
potentially suppressed by doxycycline if desired.
4.1.1. Characterization of Transgenic Lines
4.1.1.1 Transgenic Construct Design
The design of the pBIKcnc3b-eGFP construct used to generate transgenic
mouse lines featured the coding region of the b splice variant of Kcnc3 along with
the endogenous Kozak sequence and ~0.5 kb of 3‟UTR

73
Figure 4.1. Transgenic approach to restore Kv3.3 expression specifically in Purkinje cells. The
rectangles denote transgene constructs in two separate transgenic lines that are bred together.
Hooked arrows signify promoters. Expression of the tetracycline transactivator in the same cell is
necessary for transcription of Kv3.3 and eGFP. The protein structure at right depicts a tetrameric
potassium channel based on the structure of KcsA.
transcribed in one direction and that of eGFP in the other. The b splice variant
was selected because by Northern blot it is by far the most abundant variant in
the cerebellum and has been verified to be expressed at high levels in Purkinje
cells by (see sections 1.1.1.1 and 1.1.2.3). EGFP served as a marker during
patch recordings to discriminate definitively between basket and Purkinje cells.
The bidirectional promoter consisted of two minimal CMV promoters in opposite
orientations flanking a tetracycline response element (TRE).
4.1.1.2 Screening of Transgenic Founders
pBIKcnc3b-eGFP founders were crossed with homozygous L7-tTA+ transgenic
mice to obtain bi-transgenic (L7-tTA+;pBIKcnc3b-eGFP+) F1 mice. The F1 mice

74
were then crossed with L7-tTA+;pBIKcnc3b-eGFP- mice to obtain F2 mice used
to screen for transgene expression in the cerebellum to increase the chance of
segregation of potential separate transgene integrants on different
chromosomes. Screening took place by either inspecting acute slices for eGFP
fluorescence or immunofluorescence using an anti-GFP antibody. Several lines
were obtained, but most of them were scattered mosaics or quite sparse. Where
one of these lines was maintained, the degree of mosaicism was found to vary
between mice. Two lines, from founders 313 and 396, yielded expression in a
majority if not all Purkinje cells.
Several offspring derived from the F1 parents of the 313 and 396 line F2
mice with good expression were additionally examined once they had bred to
verify that they bred true. Consistent expression would suggest that any potential
alternate integrants that produce PCR positives but do not yield expression have
segregated away from the insert site with the expressed copy or complex
concatemer of nearby copies. Neither this method nor Southern blots can
establish whether there are multiple integrants present with perfect certainty. All
396 line bi-transgenic mice yielded expression of eGFP it seemed in all Purkinje
cells. Mice from the 313 line usually expressed in what seemed to be upwards of
80-90% of Purkinje neurons but in these initial screens the extent of mosaicism
varied considerably.
4.1.1.3 The Transgenes Are Expressed Exclusively in Purkinje Cells Throughout
the Cerebellum
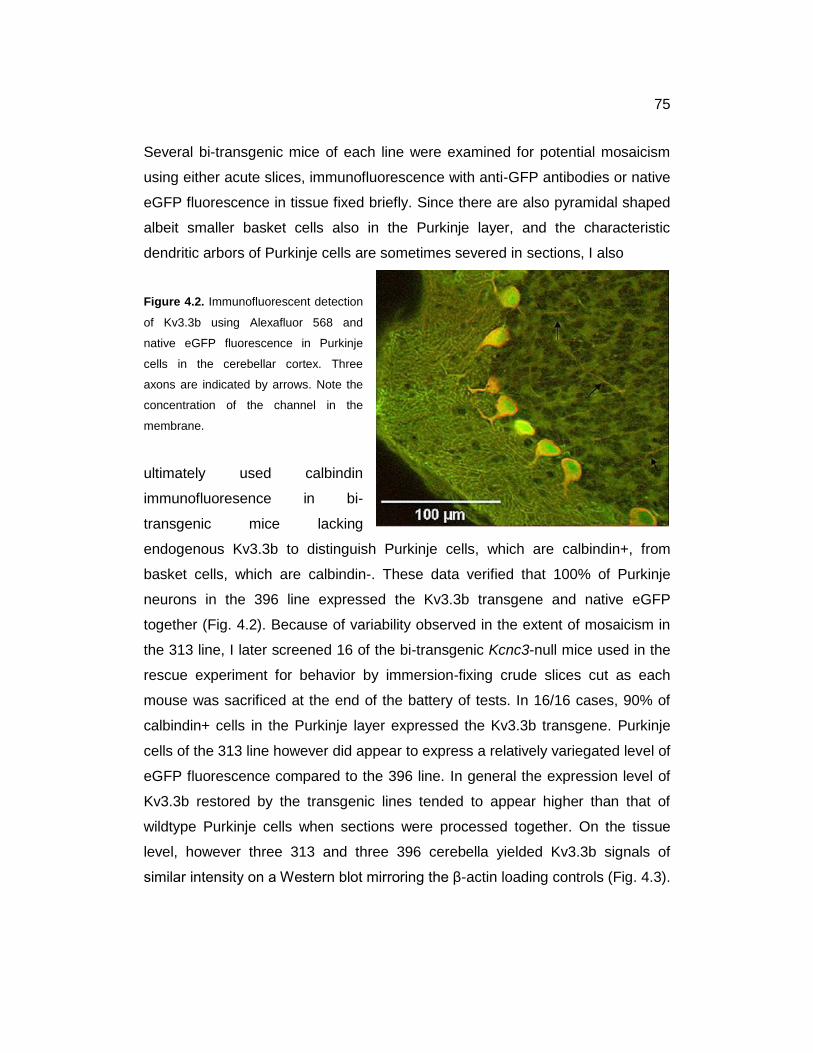
75
Several bi-transgenic mice of each line were examined for potential mosaicism
using either acute slices, immunofluorescence with anti-GFP antibodies or native
eGFP fluorescence in tissue fixed briefly. Since there are also pyramidal shaped
albeit smaller basket cells also in the Purkinje layer, and the characteristic
dendritic arbors of Purkinje cells are sometimes severed in sections, I also
Figure 4.2. Immunofluorescent detection
of Kv3.3b using Alexafluor 568 and
native eGFP fluorescence in Purkinje
cells in the cerebellar cortex. Three
axons are indicated by arrows. Note the
concentration of the channel in the
membrane.
ultimately used calbindin
immunofluoresence in bi-
transgenic mice lacking
endogenous Kv3.3b to distinguish Purkinje cells, which are calbindin+, from
basket cells, which are calbindin-. These data verified that 100% of Purkinje
neurons in the 396 line expressed the Kv3.3b transgene and native eGFP
together (Fig. 4.2). Because of variability observed in the extent of mosaicism in
the 313 line, I later screened 16 of the bi-transgenic Kcnc3-null mice used in the
rescue experiment for behavior by immersion-fixing crude slices cut as each
mouse was sacrificed at the end of the battery of tests. In 16/16 cases, 90% of
calbindin+ cells in the Purkinje layer expressed the Kv3.3b transgene. Purkinje
cells of the 313 line however did appear to express a relatively variegated level of
eGFP fluorescence compared to the 396 line. In general the expression level of
Kv3.3b restored by the transgenic lines tended to appear higher than that of
wildtype Purkinje cells when sections were processed together. On the tissue
level, however three 313 and three 396 cerebella yielded Kv3.3b signals of
similar intensity on a Western blot mirroring the β-actin loading controls (Fig. 4.3).

76
Therefore, the 396 line produced reliable, even expression over all Purkinje cells
and only in Purkinje cells, while the 313 line exhibited some mosaicism and
variegation in expression level yet was for the most part reliably expressed in the
vast majority of Purkinje neurons.
4.1.1.4. The Subcellular Localization of the Kv3.3b Splice Variant Used in the
Construct Matches that of Endogenous Kv3.3b in the Absence of the Other
Splice Variants
Altered subcellular localization of the Kv3.3b variant delivered by the transgene
was a concern because not all portions of the UTRs are present that are known
to regulate the subcellular localization of some neuronal genes through transport
and local translation. In addition, because the channels can exist as
heteromultimers, it was possible that the other variants might be necessary to
convey Kv3.3b to certain subcellular locations.
In both transgenic lines used in the study the Kv3.3b transgene appeared
in all the same subcellular locales on a Kcnc3-null background as endogenous
Kv3.3b (Fig. 4.2 above). Expression was observed most prominently in the soma
and proximal dendrite, fading with distance from the soma. There was low, even
expression over the more distal dendritic tree and axon. Axon terminals in the
DCN however were more intensely immunofluorescent. Although the level of
expression could be higher restored by the transgenic lines, this did not
apparently lead to ectopic accumulation of the channel at least at the plasma
membrane. Thus, null phenotypes related to fast repolarization in all parts of cell
should be restored in bi-transgenic null mice, insofar as the other variants are
redundant or inconsequential to this property.
4.1.1.5. The tet-Regulated Transgene Construct Is Not Leaky and Kv3.3 Is
Absent Outside the Cerebellum
Another concern surrounding the transgenic approach implemented here was the
possibility that the tet-regulated promoter would exhibit leaky expression outside

77
Purkinje cells independent of the presence of the tTA. Since transgenes can be
inserted essentially anywhere there are DNA strand breaks, there is always
some potential for the position of insertion to confer unusual transcriptional
regulation of transgenic constructs that are otherwise tightly-regulated. Leaky
expression, however, more often tends to be seen with the reverse tTA tet-on
system where tetracycline is necessary for transcriptional activity by virtue of a
mutation in the tTA; the tet-off tTA of the L7-tTA line tends to be free of this
problem. I therefore, with the technical assistance of Mitali Bose, assessed
expression of Kv3.3b by Western blot.
Figure 4.3. Western blot.
Genotype is indicated above
lanes. The numbers denote two
independent transgenic lines. β-
actin serves as a loading
control. The Kv3.3-null control is
from whole brain. Forebrain
includes midbrain.
Leaky expression from the pBI TRE promoter would be expected to
appear in mice with the pBIKcnc3b-eGFP transgene lacking the L7-tTA. Herein, I
will refer to bi-transgenic mice lacking Kcnc3 with Kv3.3b expression restored to
Purkinje cells as “rescue” mice. Brains were dissected into the cerebellum, the
brainstem and everything rostral, including the midbrain, referred to collectively
for brevity as simply the forebrain. A β-actin loading control ensured that a
comparable amount of protein was added to all lanes. A wildtype brain yielded as
expected relatively little Kv3.3b in the forebrain but a strong signal in the
hindbrain areas, cerebellum and brainstem (Fig. 4.3). In rescue mice of both
lines, signal was observed only in the cerebellum, supporting the contention that
the pBIKcnc3b-eGFP transgenes are not leaky and that the L7-tTA is faithfully
expressed just in Purkinje cells, corroborating previous work employing the line.
As anticipated, the signal is weaker because the channel has not been restored

78
in parallel fibers or DCN neurons. Curiously, an additional band of high molecular
weight appeared which may reflect differentially-glycosylated channel subunit
that accumulated in the ER due to overexpression, an impression congruent with
the seemingly more intense Kv3.3b immunofluorescence in Purkinje cells of
rescue mice compared to wildtype. Importantly, whole brains of mice that carried
only the pBIKcnc3b-eGFP transgene from each line on a Kcnc3-null background
did not express detectable Kv3.3b, which suggests that the construct was not
leaky or the pBIKcnc3b-eGFP somehow intrinsically active in Purkinje cells (see
“KO” lanes). Had the latter been the case, care would have needed to been
taken to avoid using such mice to represent Kcnc3-nulls.
In addition to the Western data, I also sectioned brains of bi-transgenic
mice in both the coronal and sagittal planes at ~1-mm intervals to examine eGFP
expression by immunofluorescence as described in section 3.2.2.1 above. In
every case I only saw expression in Purkinje cells in the brain posterior to the
olfactory bulb and anterior to the spinal cord. In theory the Western blot, even
using chemiluminescence rather than radiolabeling, is more sensitive or at least
easier to interpret unequivocally when there are low levels of expression
potentially buried in the noise of the higher background frequently seen with
immunofluorescence.
4.2. KV3.3 EXPRESSION IN PURKINJE CELLS IS SUFFICIENT TO RESCUE
MOTOR COORDINATION IN KCNC3-NULL MICE
With a transgenic line that expressed the channel in Purkinje cells, I tested the
hypothesis that Kv3.3 expression in Purkinje cells is sufficient for motor
coordination such that expression in other neuronal cell types is not absolutely
necessary. A corollary of this hypothesis is that restoration of Kv3.3 expression in
Purkinje cells should suffice to abolish ataxia in Kcnc3-null mice. Thus, I put mice

79
with Kv3.3 restored in Purkinje cells through a battery of behavioral assays to
test this hypothesis.
The +/+;-/- mice on this genetic background displayed the readily-
observed traits noted previously as well as a yet to be described phenotype that
potentially surfaced only on this background. Increased lateral deviation on a
force plate actometer and slips on a 1-cm beam were seen, confirming previous
work in the lab. Also the dramatic reduction in harmaline-induced tremor and the
ability to elicit it in mice lacking Kcnc3 was confirmed (see sections 1.2.3 and
2.1.4).
When +/+;-/- mice were initially characterized, “trembling and
hyperexcitability when picked up by the tail” was noted (Chan, 1997). Normal
mice will attempt to grasp and look around for something to get a hold of when
suspended by the tail, whereas the null mice tend to make relatively stereotyped,
repetitive, rapid flailing movements that often culminate in limb clasping. In
addition to this overt phenotype, I noticed both +/+;-/- and +/-;-/- mice exhibited
frequent, localized muscle twitches that were especially overt when mice stood
still that were most pronounced in the latter genotype. Both of these phenotypes
persisted in rescue mice, affording a control for specificity that would support the
notion that Purkinje cell Kv3.3 functions in motor coordination specifically. I chose
to use the twitching phenotype as control for specificity presumably unrelated to
the cerebellum because it was more readily scored and quantified.
When tested for a rescue of wildtype behavior I found that mice with
Kv3.3 restored in Purkinje cells indeed did not differ significantly from wildtype
mice. The twitching phenotype by contrast was not corrected, serving as a
control for specificity. That it was not alleviated yet beam performance and lateral
deviation were indicates twitching was not the cause of the deficits in these tests.
As the force plate and beam could be measuring various manifestations of
cerebellar ataxia, specifically jerky movements (hypermetria), loss of balance or
altered gait, I tested independently whether gait and balance or postural control
were altered to determine more precisely what was rescued. These tests

80
suggested Kv3.3 function in Purkinje cells specifically pertains to regulating
movement speed, with loss of the channel engendering hypermetria.
I further tested whether the rescue of coordination extended to +/-;-/-
mice. Kv3.1 is expressed in the cerebellum in granule cells, deep nuclear
neurons and possibly interneurons, but not Purkinje cells. The rescue was still
effective for the beam test but only partially regarding lateral deviation in +/-;-/-
mice. There was no detectable rescue of wildtype behavior in DKO mice entirely
lacking both channel genes. Moreover, additional phenotypes appeared. When
just one allele of Kcnc1 was lost on top of both Kcnc3 alleles, a subtle gait
abnormality appeared. Additional loss of both Kcnc1 alleles resulted in the full
spectrum of cerebellar ataxic signs, encompassing severe gait abnormalities and
grossly impaired balance. These data suggested that impaired fast action
potential repolarization appeared at additional nodes in the cerebellar circuitry
with loss of Kcnc1 that must be functional for restoration of fast repolarization in
Purkinje cells to be effective in rescuing mutant behavior.
4.2.1. Motor Coordination
To test whether motor coordination was rescued in mutants lacking Kcnc3 I
employed three tests. Because virtually any behavioral test is sensitive to
multiple parameters and therefore convergent data from multiple assays yield
greater confidence, I tested mice for performance in the narrow beam test, on the
force plate actometer and on the rotarod (see section 2.1.3). I began with line
313 to breed with +/+;-/- mice because it was the first suitable line to be
uncovered during screening. The risk of obtaining a false negative or
uninterpretable result due to unreliable expression in 100% of Purkinje cells was
greater with +/-;-/- and -/-;-/- because motor phenotypes are more severe. As the
expression characteristics of the 396 line were of better quality I later tested
+/-;-/- as well as -/-;-/- mice using this line. The results of the force plate and
beam tests from the rescue experiment are published in Hurlock et al., 2008.

81
4.2.1.1. Force Plate Actometer
Lateral deviation on the force plate actometer (see section 2.1.3) was measured
in +/+;-/- mice, wildtype controls and rescue mice (Fig. 4.4). The plate essentially
tracks the center of gravity determined by which paws are on the plate, how far
paw placements are from each other and how much force is applied during
stepping. The lateral deviation index (LDI) is the ratio of the sum of the triangular
Figure 4.4. Ability of Kv3.3b restoration in Purkinje cells to rescue normal lateral deviation on the
force plate actometer. The sample sizes are indicated above the bars. Error bars are S.E.M.
areas formed by every three consecutive center of gravity measurements to the
total distance traveled during ambulation (Fig. 3.1). The LDI is used to exclude
artifactual increases if the area measure was considered alone merely resulting
from summation over a longer distance rather than genuine increases in
deviation per se. Confirming previous observations in the lab (Joho et al., 2006),
+/+;-/- mice exhibited a significantly greater lateral deviation index than wildtype
mice (p = 0.0002). Rescue mice showed a significantly reduced LDI compared to
null mice (p = 0.015), while the LDI of rescue mice was not significantly different
from wildtype mice (p = 0.35), indicating a full rescue of normal lateral deviation.
The +/-;-/- had a higher LDI when compared directly to +/+;-/- mice using
the same population of mice where the single-null mutant allele was derived by
recombination from the double-null allele as recently as possible in generations
before breeding for the experiment (Joho et al., 2006). Consonant with this
observation, using mice of different genetic backgrounds that were only partially
related by using one parent from the single-null experiment to breed all mice

82
tested, the LDI is considerably higher with one allele of Kcnc1 absent than in
+/+;-/- mice (Fig. 4.4, middle bars of left and middle graphs). Mice heterozygous
for the Kcnc3-null allele did not have a significantly higher LDI than wildtype mice
when genetically related mice were used previously (p = 0.34). Thus, I used
+/+;+/- mice as normal controls in the +/-;-/- experiment which were expedient to
breed. Indeed, +/+;+/- mice still exhibited a significantly lower LDI than +/-;-/-
mice (p < 10-6; Fig. 4.4, middle graph). Corresponding +/-;-/- bi-transgenic rescue
mice had an LDI intermediate between the control and mutant mice that differed
from wildtype mice (p = 0.002) and was on the cusp of differing from that of
mutants (p = 0.057). The data suggested that a normal LDI was partially rescued
in +/-;-/- mice by reintroduction of Kv3.3b in Purkinje cells.
The LDI of -/-;-/- mice was roughly 3 times that of wildtype control mice,
replicating previous results from the lab (Fig. 4.4, right graph; p < 10-6; Joho et
al., 2006). In contrast to mutants retaining at least one Kcnc1 allele, -/-;-/- mice
exhibited absolutely no rescue of a normal LDI. Rescue mice were not
significantly different from -/-;-/- mice (p > 0.9), and remained significantly
different from the wildtype controls.
In sum, a normal LDI is rescued in mice just lacking Kcnc3, partially
rescued in +/-;-/- mice, and not rescued in -/-;-/- mice.
4.2.1.2. Beam Test

83
As described above (see section 2.1.3), the beam test measures motor
coordination by assessing the ability of mice to traverse a narrow beam without
Figure 4.5. Ability of Kv3.3b
restoration in Purkinje cells to
rescue motor coordination on
the narrow beam. (A)
Restoration in mice lacking just
Kcnc3. (B) Restoration in +/-;-/-
mice. Asterisks indicate
significance on single days
using one-way ANOVA (*p <
0.05; **p < 0.01; ***p < 0.001).
Error bars indicate S.E.M.
Sample sizes are listed beside
color codes, top, center.
slipping or falling. The
mice are tested on 5
consecutive days over
which they learn a motor
skill and become
habituated to the test
situation. Thus the first
days could be conceived
of as habituation and
training days, where day 5
represents the actual test
day, however trends observed on multiple days also likely reflect performance
and can be taken into account to increase the sensitivity of the test. Analysis of
each day was performed by one-way ANOVA whereas analysis taking all 5 days
into account was carried out by using repeated measures ANOVA.

84
On day one, +/+;-/- mice displayed significantly increased slips over
wildtype mice on the 1-cm beam that persisted through day 5, essentially in
agreement with earlier work (Fig. 4.5A; Joho et al., 2006). All genotypes are
capable of improvement as learning presumably takes place over the 5 days.
Interestingly, when fit with an exponential function the learning curves of
wildtype, +/+;-/- and rescue mice appear to reach an asymptote at a similar
latency. Thus the learning of a motor skill requiring coordination seems to be
unaffected by loss of Kcnc3. Previous work extending the test out 5 additional
days indicated that by day 5 improvement plateaus (Joho et al., 2006). Rescue
mice did not differ from either null or wildtype mice on day 1. By day 4,
presumably after learning, habituation or both had taken place, rescue mice
made significantly less slips than +/+;-/- mice (p < 0.05). The number of slips
made by rescue mice never differed from that of wildtype mice on any individual
day, in contrast null mice made significantly more slips on all 5 days. Further, by
2-way ANOVA, taking repeated measures across all 5 days into account, null
mice made significantly more slips than wildtype mice (p < 10-6) while rescue
mice made both significantly less slips than null mice (p < 10-4) yet still
significantly more than wildtype mice (p = 0.026), probably due to performance
on the first days. Overall, both types of analysis indicated that motor function in
the beam test was rescued by restoring Kv3.3b in Purkinje cells, with the null
deficit only remaining evident on training days that likely account for the
persisting difference between wildtype and rescue mice by 2-way ANOVA.
Rescue mice moreover learned at a rate similar to the other two groups.
On the 1-cm beam +/+;-/- mice lacking one Kcnc1 allele also improved
with Kv3.3b restoration to Purkinje cells. Looking at individual days, the
previously demonstrated increase in slips made by +/-;-/- mice compared to mice
heterozygous for the Kcnc3 null allele remained significant on all days despite
improvement by both groups. Intriguingly, the degree of improvement is greater
than that which occurs in mice just lacking Kcnc3 because those additionally
lacking Kcnc1 begin by making more slips, consonant with previous work.

85
Although this is comparing across two different populations of mice, that it
replicates previous work using a different outbred population and that I bred them
such that half of the genetic material of one is derived from the other increases
my confidence. Once learning and habituation have taken place, levels of slips
appear to reach an asymptote at a quite similar latency across these mutants
despite the initial difference in severity. Rescue mice, in this case using the 396
line, do not differ from mutant mice on any of the 5 days taken individually. It is
noteworthy that in this test the mutant and rescue groups are considerably
smaller than when mice just lacking Kcnc3 were tested above. A trend toward a
rescue however is clear and supported by two-way ANOVA comparing mutant
and rescue mice across all 5 days (p = 0.014). Using Kcnc3-null allele
heterozygote controls, rescue mice do not make significantly more slips than the
control (p = 0.07). The rescue is potentially partial in nature though like that of
lateral deviation considering the small sample size and that heterozygote controls
may have more slips than wildtype mice, mitigating the difference between
control and wildtype mice. In previous work the heterozygotes trended toward
having slips than wildtype mice but it did not quite reach significance. That caveat
Figure 4.6. Ability of Kv3.3b
restoration in Purkinje cells to
rescue motor coordination or
balance on the narrow beam.
Asterisks indicate significance
on single days using one-way
ANOVA (* p < 0.05; ** p < 0.01;
*** p < 0.001). Error bars
indicate S.E.M. Sample sizes
are listed beside color codes,
top, center.
notwithstanding, restoring

86
Kv3.3b in Purkinje cells also overall significantly improved beam performance in
these mice.
To further ascertain whether beam performance was rescued in +/-;-/-
mice I additionally counted falls on a 0.5-cm beam, a more robust phenotype
exhibited by this mutant (Joho et al., 2006). Falls could be caused by impaired
coordination, balance or both, however it seemed falls in these mice tended to
occur in conjunction with slips. A rescue is clear by both repeated measures and
considering individual days. Like wildtype mice examined by Joho et al., 2006,
+/+;+/- mice make very few falls and have acquired performance after one day of
training (Fig. 4.6). By day 4, all groups did not differ from each other significantly
in terms of falls. On days 1 through 3, mutants fall significantly more than
heterozygote controls. Rescue mice fall significantly less than mutants on days 1
and 3. The difference between wildtype and rescue mice was not significant on
any day. As with slips all genotypes show improvement. Taking all 5 days into
account, the mutants fall significantly more than heterozygotes and the rescue is
apparent in both respects; rescue mice fall significantly less than mutants and at
a rate not significantly different from heterozygote controls. Insofar as falls
originate from the same underlying deficit as slips, these data reinforce those
obtained counting slips to support the notion that motor coordination is rescued
by replacing Kv3.3b in Purkinje cells.
An intriguing observation I made during the beam tests was that +/+;-/-
mice and even more so in those additionally lacking a Kcnc1 allele was that slips
tended to occur in paroxysmal bouts. In some cases mice would traverse the
beam upright making few if any slips but then during a consecutive 100-cm
traversal would suddenly have more difficulty, often culminating in a total loss of
grip in the hind quarters while the fore limbs did not loose footing. Upon loss of
grip the hind limbs would kick rather frantically to regain footing on the beam. The
movement had a striking jerky quality to it reminiscent of a cardinal sign of
cerebellar ataxia, hypermetria, where excess speed is imparted to movements.
Acceleration and deceleration of limb movement is no longer smooth but rather

87
jerky in character. Another observation I noted was that mice lacking Kcnc3
seemed to poorly make use of their tails to balance themselves on the beam
although the effect, if real, is quite subtle. Mice are said to use their tails to
maintain balance on the narrow beam (Siegel, 1970). If so, ataxic tail movement
could affect balance, precipitating slips. Finally, I occasionally noticed +/-;-/- mice
had isolated incidents of hopping on the beam with their hind limbs. During
normal ambulation however I never observed hopping. This could be a subtle
manifestation of non-alternate gait emerging as Kcnc alleles are lost.
The -/-;-/- mice cannot perform on any beam except the widest, the 2-cm
beam. Even here falls must be counted rather than slips because the impairment
of -/-;-/- mice is so severe. The -/-;-/- mice in many cases must be initially placed
on the beam numerous times because they are frequently so agitated that they
leap away or attempt to bound across the beam, inevitably falling when they do.
If mice could not be placed on the beam or fell 15 times before reaching the other
end they were deemed unable. Falls were not strictly linked to obvious myoclonic
jerks. On day 1 and day 5, 11/21 and 13/21 -/-;-/- mice were unable compared to
11/21 and 14/21 rescue mice, respectively. These rates are clearly not different
and 49/49 wildtype mice by contrast were all able. Among mutant mice able to
traverse the beam, -/-;-/- rescues and -/-;-/- mice did not differ significantly in the
rate at which they fell on either day 1 or 5 (P > 0.8). Thus, on the -/-;-/-
background Kv3.3b re-expression in Purkinje cells was unable to rescue beam
performance.
Taken together, the beam test data indicate that restoration of Kv3.3b in
Purkinje cells rescues motor coordination in mice lacking Kcnc3 fully, +/-;-/- mice
additionally lacking Kcnc1 partially, and in DKO mice not at all.

88
4.2.1.3. Rotarod (Pilot Study)
Figure 4.7. Kcnc3-null mice
learn on the accelerating
rotarod and do not become
impaired preferentially at high
speeds. Wildtype n = 11; Null
n = 22. Error bars indicate
S.E.M. Mice underwent 4 trials
on each of 4 days.
To further elucidate the
nature of the ataxia that
is alleviated by restoring Kv3.3b to Purkinje cells, I tested Kcnc3-null and
wildtype mice, a subset of those used for the latter two studies above, on the
accelerating rotarod. Although the rotarod is regarded as a fairly easy motor task
that might not detect subtle ataxia, the difficulty can be varied by allowing the
mice to continue on to ever higher speeds. Indeed, as discussed in the review of
the literature above (section 2.2.2.6), when Nolan et al., 2003 tested Hcn1-null
mice, which have Purkinje cell firing alterations, they did not uncover a
phenotype except at high speeds. Therefore, I allowed the mice to remain on the
rod as long as they were able. I gave the mice the usual 4 days of testing for
learning to take place with 4 trials on each day. Looking across all 16 trials, aside
from perhaps the first trials, the performance of wildtype mice is significantly
different (2-way ANOVA, P <0.0001). Surprisingly, null mice perform better than
wildtype mice, and this becomes clear on the first day. In the beam test,
improvement with learning usually mitigated the difference between wildtype and
null mice. Here the deficit likely stems from the fact that, unfortunately, the subset
of mice tested on the rotarod that were not too obese to perform by the time I
added this test were very skewed in terms of how many albino mice were
present. The wildtype group was nearly all albino whereas the null mutant group
was nearly all agouti or black. Albino mice are known to develop visual deficits,
Kcnc3-null vs. wildtype all 16 trials
0 4 8 12 160
50
100
150
200
030
60
90
120
150
180
Null
Wildtype
Trial
Se
co
nd
s Rp
m

89
and this really seemed to be the case when I attempted to use the pole test to
assess equilibrium (data not shown). I could not use the test because many mice
I had available were albino and remarkably indifferent to heights. When placed
~5 feet above a surface atop a ~3.5 cm-wide vertical extendable shower rod
pigmented mice were reluctant to climb down but albino mice often showed little
hesitation to attempt to climb plummet 5 feet to a cushion. Therefore, I cannot
draw conclusions as to whether there are any static differences in rotarod
performance between these groups of mice.
I decided to include these data nevertheless because there are two
conclusions that can still be drawn. First, if Kv3.3 has a role in fine motor timing,
as with Hcn1 a phenotype might only manifest itself at higher speeds but not
lower speeds. This would be expected to lead to a ceiling where improvement
with further trials in the +/+;-/- mice begins to taper off whereas it does not with
wildtype mice once they attain equivalent speeds. Instead I saw that the rate of
improvement of null mice did not decline relative to wildtype mice over the trials.
Insofar as a sufficiently high speed was reached by the last trial, the data suggest
that fine motor timing of limb movements is not part of the ataxic phenotype of in
+/+;-/- mice. Second, the rates of improvement over the trials after the first three
remain the same between wildtype and Kcnc3-null mice corroborates, together
with the beam data, that motor skill learning is intact upon loss of Kcnc3.
4.2.2. Gait
One aspect of motor coordination is gait. As it is unclear exactly what lateral
deviation reflects and why mice make slips on the beam, I decided to investigate
further what aspect of the ataxia in +/+;-/- mice is related to Kv3.3 expression in
Purkinje cells, as revealed by the fact that restoration of the channel here
rescued performance in these tests. The increased lateral deviation and beam
slips in +/+;-/- mice could arise from increased force application due to
hypermetric, jerky movements, irregular paw placement due to gait ataxia,
wobbling from a deficit in balance or muscle twitches. Here I examined gait using

90
Figure 4.8. DigiGait™ apparatus. (A) The DigiGait™ treadmill derives gait parameters from traces
of the total paw area detected in films of the paws on a transparent belt from underneath. The paw
area increases as the foot is set down and decreases as it is lifted. (B) Data from mice in my study
from each of the four paws. Note the near total absence of artifactual signals. The traces are
separated into discrete paw prints by the software.

91
possibility that gait ataxia accounts for these deficits. I employed both DigiGait™

92
Figure 4.9. (above) Results of DigiGait™ analysis for right hind limb are shown (all limbs yielded no
significant differences) unless otherwise specified. Error bars are S.E.M.
DigiGait™ analysis, a semi-automated computer-assisted analysis of videos of
paw prints made at a forced fast pace on a treadmill, as well as traditional
footprint analysis of self-paced gait.
4.2.2.1. DigiGait™ Analysis
The DigiGait™ treadmill measures numerous gait parameters by computer-
assisted analysis of video recordings of paw placements made through a
transparent belt (see section 3.3.2.1). An initial pilot test was carried out to
determine the optimal parameters for the treadmill. In doing so, I also tested the
maximal speed at which wildtype and +/+;-/- mice could run, for I wanted to
determine the fastest speed at which I could test the mice without too many of
them failing to complete the test. The mouse was started at 10 cm/second and
the belt speed was increased in increments of 5 cm/second, with each stepwise
Figure 4.10. Kcnc3-null mice do not exhibit an
impairment in running at high forced speeds on
the DigiGait treadmill. Bars are S.E.M.
increase lasting for ~5 seconds until
the speed was increased again,
without intervening rest periods.
Although the mean speed at which
null mice could no longer run without
hitting the rear bumper was lower than that of wildtype mice, the difference did
not reach significance (Fig. 4.10). The higher the speed, the more precise fine
motor timing needs to be, rendering higher-speed motor tasks theoretically more
sensitive to fine timing deficits. Thus, in this task at least, +/+;-/- mice do not
exhibit a deficit in fine motor skill timing that precludes running at high speeds.
Breakpoint ambulation speed
+/+;+/+ n=11 +/+;-/- n=150
5
10
15
20
25
30
35
40
45
50
55
Genotype
cm
/s

93
Initially, I used the group of +/+;-/- mice I had used for the rotarod above
that were imbalanced in terms of coat color composition with respect to
genotype. Wildtype mice were nearly all albino. This was a serious problem for
DigiGait™ analysis because the computer recognizes paws by detecting red
signals. Even when paws were painted red the paw area of albino mice was
registered as larger and detected for a longer duration as the paw neared and
moved away from the surface of the belt. This led to likely artifactual differences
in gait parameters sensitive to paw area. These +/+;-/- experiment data are not
shown because of this confound. It is nonetheless worth mentioning that
parameters such as stride length likely insensitive to this problem did not differ
between wildtype and control males. Paws could not be painted entirely red
because of technical limitations that restricted me to the use of cake decorators.
I had +/-;-/- mice and +/+;+/- controls that were all pigmented. Accordingly
paw areas for the most part did not differ between mutant (n=7) and heterozygote
control mice (n=17), however both mutant and rescue mice tended to be smaller
due to slight runting which caused their paw areas to tend to be reduced. The
reduction did not reach significance for any side-by-side comparisons of
genotypes though (ANOVA). The gait of male mutants did not differ from that of
heterozygote males (Fig. 4.9) despite the fact that mutants of this kind appear to
remain just slightly smaller as adults. The most basic gait parameters, stride
length and stance width, did not differ for any limb or pair of limbs, despite the
fact that mutant mice appeared to be slightly smaller on average. A few +/-;-/-
rescue mice were analyzed. Step angle of hind limbs2, a parameter that can
increase with ataxia (Hannigan and Riley, 1988), and hind limb shared stance
means exhibited a pattern suggestive of a rescued null mutant phenotype that
was not significant (rescue n = 5). That hind limb shared stance3 was unaltered
2 Increases as stride length decreases and stance width increases. If a right triangle is
drawn from the stride length and stance width, and a line drawn from the midpoint of the hypotenuse to the right angle vertex, the angle formed between this line and the side corresponding to the stride length is the step angle 3 Duration over which both hind paws contact belt

94
suggested alternating gait might be intact even at high speeds where cerebellar
deficits in timing coordination might be most readily detected. Together
DigiGait™ treadmill data suggested that gait ataxia was absent in +/-;-/- mice at a
forced, high speed. The phenotypes of these mutants on the beam and plate is
greater than that of mice just lacking Kcnc3, so if there were any gait phenotype
in the latter mice it should have been apparent in the former.
4.2.2.2. Footprint Analysis
To assess gait alterations at a self-paced speed, such as paw discordance and
alternation, that are not obtainable as continuous measures using the DigiGait™,
footprint analysis was performed by painting fore paws and hind paws with blue
and red India ink, respectively. Moreover, -/-;-/- mice are clearly too impaired to
run at speeds required to keep normal controls from pausing on the treadmill,
precluding analysis. Subject to footprint analysis mice with cerebellar ataxia
typically display shorter strides, wider stance, decreased alternation of gait,
veering from a straight path and paw discordance. The latter refers to the
distance between the corresponding fore and hind paw prints, which usually is
minimal in normal, wildtype mice.
Here, I measured stride length, stance width, the extent to which gait was
alternate and paw discordance, noting qualitatively if veering was present. It is
noteworthy that I always compared the best obtainable gait sample of each
mouse capable of producing at least four strides of uninterrupted ambulation.
Gait quality was determined by regularity and consistency. Undoubtedly this
method will likely underestimate, if anything, the severe deficits of -/-;-/- mice,
which most of the time produced gait that was frankly chaotic. Often -/-;-/- gait
included extra fore paw prints that exceeded the number of hind paw prints. Most
likely these were produced by the prominent myoclonic jerks that occur
frequently in -/-;-/- mice.
I performed footprint analysis on +/+;-/- mice with wildtype controls, +/-;-/-
with +/+;+/- as controls and respective Purkinje cell rescue mice, and finally -/-;-/-

95
mice with wildtype controls and respective -/-;-/- rescue mice (Fig. 4.11). The
mice were almost entirely the same used for the other tests of motor
Figure 4.11. Self-paced gait patterns of mice lacking Kcnc3 and Kcnc1 alleles. The degree of
impairment increases as Kcnc1 alleles are ablated. Hind paws and fore paws are painted as
indicated and mice are allowed to walk through a tunnel on paper. Wildtype, n = 17; Kcnc3-null
heterozygote, n = 4; Kcnc3-null, n = 5; Kcnc3-null also lacking a Kcnc1 allele, n = 10; Kcnc3-null
also lacking a Kcnc1 allele rescue, n = 9; DKO, n = 9; DKO rescue, n = 3.
coordination. Separate control groups were used for each mutant because it is
impossible to derive all three types of mutants from the same breeding pairs
along with either wildtype or Kcnc3-null allele heterozygote controls. I however
minimized the genetic distance between these groups by deriving them from
breeders largely culled from the other groups. Indeed, none of the control groups
differed from each other in terms of any gait parameter (Fig. 4.12). As discussed
in the introduction, mice +/+;+/- also do not differ from wildtype controls in terms
of lateral deviation or slips on any narrow beam. Results will be discussed
comparing both to respective controls as well as when wildtype mice from both
the +/+;-/- and -/-;-/- experiments are pooled with all genotypes being compared
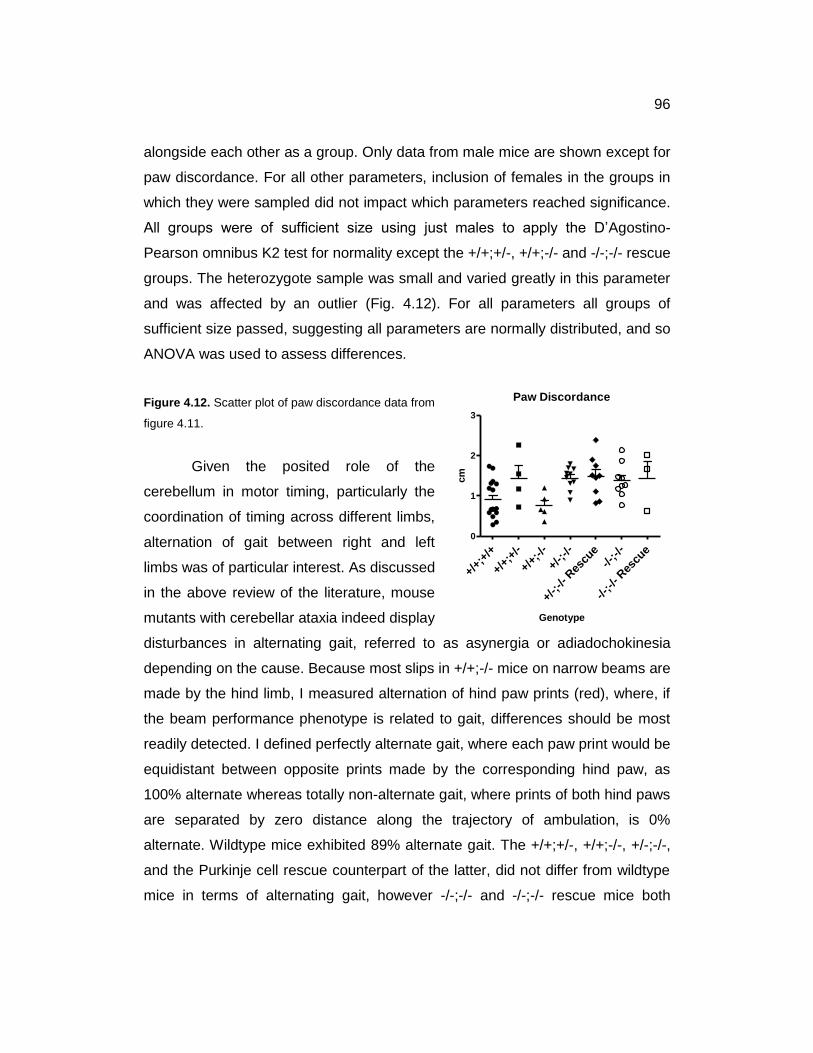
96
alongside each other as a group. Only data from male mice are shown except for
paw discordance. For all other parameters, inclusion of females in the groups in
which they were sampled did not impact which parameters reached significance.
All groups were of sufficient size using just males to apply the D‟Agostino-
Pearson omnibus K2 test for normality except the +/+;+/-, +/+;-/- and -/-;-/- rescue
groups. The heterozygote sample was small and varied greatly in this parameter
and was affected by an outlier (Fig. 4.12). For all parameters all groups of
sufficient size passed, suggesting all parameters are normally distributed, and so
ANOVA was used to assess differences.
Figure 4.12. Scatter plot of paw discordance data from
figure 4.11.
Given the posited role of the
cerebellum in motor timing, particularly the
coordination of timing across different limbs,
alternation of gait between right and left
limbs was of particular interest. As discussed
in the above review of the literature, mouse
mutants with cerebellar ataxia indeed display
disturbances in alternating gait, referred to as asynergia or adiadochokinesia
depending on the cause. Because most slips in +/+;-/- mice on narrow beams are
made by the hind limb, I measured alternation of hind paw prints (red), where, if
the beam performance phenotype is related to gait, differences should be most
readily detected. I defined perfectly alternate gait, where each paw print would be
equidistant between opposite prints made by the corresponding hind paw, as
100% alternate whereas totally non-alternate gait, where prints of both hind paws
are separated by zero distance along the trajectory of ambulation, is 0%
alternate. Wildtype mice exhibited 89% alternate gait. The +/+;+/-, +/+;-/-, +/-;-/-,
and the Purkinje cell rescue counterpart of the latter, did not differ from wildtype
mice in terms of alternating gait, however -/-;-/- and -/-;-/- rescue mice both
Paw Discordance
+/+;
+/+
+/+;
+/-
+/+;
-/-
+/-;-
/-
+/-;-
/- Res
cue
-/-;-/-
-/-;-/-
Res
cue
0
1
2
3
Genotype
cm

97
differed significantly from all other genotypes (Fig. 4.13A). The -/-;-/- mice exhibit
a mean of 61% alternate gait, roughly one-third less than wildtype mice (p <
0.001). Considering that the most regular, alternate gait was analyzed, the
difference likely represents a minimum difference. I noted that +/-;-/- mice
occasionally show isolated, single instances of hopping traversing the 1-cm
beam. It is interesting that these mice have the lowest mean in terms of
alternating gait
however it is not
significantly lower
than that of wildtype.
In sum, only -/-;-/-
mice show a
disturbance in gait
alternation and this is
not remedied by
restoring Kv3.3 in
Purkinje cells.
Figure 4.13. Results of
footprint analysis of mice
lacking Kcnc3 and mice
additionally lacking Kcnc1
alleles. The data indicate
gait ataxia is present in
mice lacking Kcnc3 if and
only if Kcnc1 alleles are
lost. * p < 0.05; ** p <
0.01; *** p < 0.001.
Horizontal bar compares
+/-;-/- to -/-;-/-. All other
comparisons are with
reference to +/+;+/+.

98
Cerebellar ataxia also typically presents with a widened stance and
shorter strides. I therefore measured stance width and stride length, as I did on
the DigiGait™ treadmill using only +/-;-/- mice. In agreement with the DigiGait™,
+/+;+/-, +/-;-/- and Purkinje cell rescue mice of the latter type did not differ from
each other (Fig. 4.13B, C). As with alternating gait, -/-;-/- mice differed
significantly from +/+;+/+, +/+;-/- and +/-;-/- mice. The -/-;-/- mice exhibited a
wider stance width. That the stance width is greater concurs with what one can
surmise just from qualitative observation. The -/-;-/- rescue mice did not differ
from -/-;-/- mice however the small sample was quite variable. The data suggest
that increased stance width is not corrected by the rescue. The stride length was
significantly decreased in -/-;-/- and -/-;-/- rescue mice to nearly half that of
+/+;+/+, +/+;+/-, +/+;-/-, +/-;-/- mice and their respective rescue line whereas the
latter groups did not differ significantly from one another (Fig. 4.13C). The -/-;-/-
and -/-;-/- rescue mice did not differ from each other significantly in stride length.
Since the magnitude of the decrease in stride length in -/-;-/- mice exceeds the
apparent difference in body length the difference likely at least in part reflects a
real difference related to gait. In fact, when 5 wildtype and 4 -/-;-/- mice were held
by the entire scruff and measured from the base of the tail to the ear the means
suggested -/-;-/- mice might be 6% smaller however the difference was not
significant (P>0.079). The apparent difference between these groups at maturity
is likely an illusion due to the relative leanness of -/-;-/- mice. Whatever the cause
of the decreased stride length, there is clearly an abnormal stepping pattern in
addition to decreased gait alternation for the ratio of stance width to stride length
is nearly one in -/-;-/- mice whereas in the other mutants and wildtype mice it is
always around 0.5 (Fig. 4.13E). In this regard -/-;-/- mice and all rescue mice
differ very significantly from the other genotypes tested, while -/-;-/- mice did not
differ from -/-;-/- rescue mice.
Finally, paw discordance or abduction was measured, which is the
distance separating otherwise overlaid fore and hind paw prints that has been
observed to increase in other ataxic mutants as discussed in the literature

99
review. A normal, wildtype mouse will tend to place its hind paw directly over its
fore paw print. In -/-;-/- mice, visual inspection revealed that the placement of the
hind paw was often perfectly opposite in phase with respect to the fore paw,
being placed exactly between successive fore paw prints. Indeed, paw
discordance appeared to be greater in -/-;-/- mice as well as in +/-;-/- mice
compared to +/+;-/- and +/+;+/+ control mice, however the differences were on
the cusp of significance using only the male mice except when +/+;+/+ was
compared to +/-;-/- rescue mice (Fig. 4.13D). When the females were included in
the analysis to augment the sample size, the differences between wildtype and
-/-;-/- as well as +/-;-/- mice reached significance, as was the analogous case with
+/+;-/- mice which did not differ significantly from +/+;+/+ mice (data not shown).
Differences in paw discordance could be obscured by differences in overall stride
length such that the error in paw placement would be expected intuitively to
increase in terms of absolute distance if the strides are longer. Therefore I re-
examined paw discordance by rendering the measure ratiometric, dividing by the
stride length. In particular this approach would be anticipated to better extricate
potential differences in paw discordance in -/-;-/- mice merely stemming from
their smaller size from those related to actual gait. Interestingly this analysis
yielded, even when restricted to males, significant differences between +/+;+/+
mice and -/-;-/- mice, but also to lesser extent between the latter and +/-;-/- mice
(Fig. 4.13). Thus, there appears to be an incremental gradient of this phenotype
as Kcnc1 alleles are lost on a Kcnc3-null background. Paw discordance is the
only parameter evaluated by footprint analysis that was abnormal in +/-;-/- mice if
we consider it intermediate between +/+;+/+ and -/-;-/-.
Together, the footprint data suggest that the pattern of gait is normal in
+/+;-/- mice despite the fact that lateral deviation is increased, suggesting that
increased lateral deviation arises from another abnormality, such as hypermetria,
in these mice. The footprint data additionally are congruent with those from the
DigiGait™ treadmill taken at high speeds that suggest gait pattern abnormalities,
including abnormalities in right-left alternation, are absent in +/-;-/- mice with the
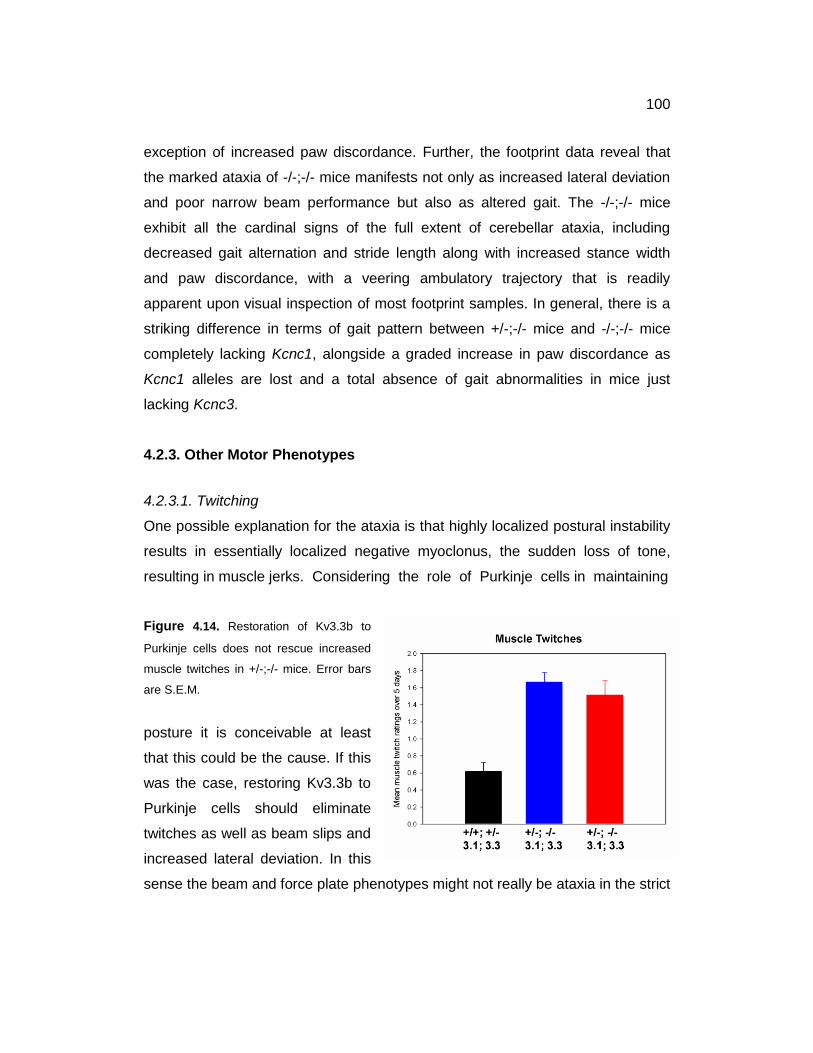
100
exception of increased paw discordance. Further, the footprint data reveal that
the marked ataxia of -/-;-/- mice manifests not only as increased lateral deviation
and poor narrow beam performance but also as altered gait. The -/-;-/- mice
exhibit all the cardinal signs of the full extent of cerebellar ataxia, including
decreased gait alternation and stride length along with increased stance width
and paw discordance, with a veering ambulatory trajectory that is readily
apparent upon visual inspection of most footprint samples. In general, there is a
striking difference in terms of gait pattern between +/-;-/- mice and -/-;-/- mice
completely lacking Kcnc1, alongside a graded increase in paw discordance as
Kcnc1 alleles are lost and a total absence of gait abnormalities in mice just
lacking Kcnc3.
4.2.3. Other Motor Phenotypes
4.2.3.1. Twitching
One possible explanation for the ataxia is that highly localized postural instability
results in essentially localized negative myoclonus, the sudden loss of tone,
resulting in muscle jerks. Considering the role of Purkinje cells in maintaining
Figure 4.14. Restoration of Kv3.3b to
Purkinje cells does not rescue increased
muscle twitches in +/-;-/- mice. Error bars
are S.E.M.
posture it is conceivable at least
that this could be the cause. If this
was the case, restoring Kv3.3b to
Purkinje cells should eliminate
twitches as well as beam slips and
increased lateral deviation. In this
sense the beam and force plate phenotypes might not really be ataxia in the strict

101
sense. Alternatively, the twitching represents an entirely independent, dissociable
phenotype involving Kv3.3b function at a distinct anatomical locus.
To quantify twitching, Dr. Joho and I independently rated mice blind to
genotype on a scale of 0-3. The +/-;-/- mice exhibited frequent localized muscle
twitches, and our ratings confirmed this impression (Kruskal-Wallis, p < 0.0001;
Fig. 4.14). Twitching in +/-;-/- was not rescued by restoring Kv3.3b in Purkinje
cells. Beam slips therefore are not caused by twitching. That the twitching
phenotype is independent of Purkinje neuronal expression of Kv3.3b suggests
that expression in this cell type may indeed be specifically related to motor
coordination.
4.2.3.2. EMG Recordings (Pilot Study)
To gain further insight as to the origin of the twitching I recorded the EMG of mice
lacking Kcnc3 and a wildtype controls under the guidance of Dr. Steven Vernino
in the Department of Neurology. Because twitching is not corrected by restoration
of Kv3.3b in Purkinje cells evidently the cellular locus underlying this phenotype
lies outside Purkinje cells. As Kv3.3 is expressed in alpha motor neurons and
patients with neuromyotonia, an autoimmune disease where anti-Kv channel
antibodies block presynaptic Kv channels at motor neuron terminals, also exhibit
twitching, it was conceivable that altered motor unit activity could explain the
twitches. Fast repolarization at these terminals is sensitive to 1 mM TEA,
consistent with loss of Kv3 function here being consequential for neurotransmitter
release.
I observed motor unit waveforms in wildtype and Kcnc3-mutant mice
under fairly deep anesthesia (Fig. 4.15). There was little or no twitching under
this condition. Dr. Vernino considered the unit waveforms to be normal, based on
his experience with rabbits. Spikes in multiunit EMG recordings reflect the
depolarization of a group of fused myocytes that are excited together as a group
or motor unit. This suggests the endplate potentials, muscle action potentials and
neuromuscular junction are basically intact overall however it does not exclude

102
the possibility of a greater amplitude due to enhanced acetylcholine release upon
spike broadening at terminals. What counts ultimately though is unit activity.
Normal motor unit activity produces consistent tone by taking place repetitively at
fairly regular intervals. Individual units, or units the same distance from the
electrode, generate spikes of a particular amplitude. Perfect synchronization can
result in summation. In the trace under deep anesthesia, we can see activity that
would engender consistent tone.
Although myoclonus can be defined phenomenologically as any sudden
muscle twitch regardless of origin, including localized jerks, typically myoclonus
is accompanied by characteristic motor unit activity. Specifically, discrete bursts
of activity are observed where unit activity occurs within a 100-ms brief window.
Because muscle contraction takes place on a much slower timescale these
action potentials are effectively synchronized as far as the muscle is concerned.
The synchronized aspect of myoclonus is important for increased myoclonus is
found in epilepsy. It therefore may be helpful to differentiate twitching due to
synchronized activity identified by electrophysiology as myoclonic in nature from
twitching due to other causes to bring nosology in line with biology. The +/+;-/-
mice show whole-body myoclonic jerks very infrequently (see section 1.2.3).
After monitoring a deeply-anesthetized null mouse EMG for an hour with the
electrode placed in a virtually silent location I suddenly started observing
occasional synchronized bursts (Fig. 4.15) that were not accompanied by whole-
body jerks or twitching, however. Dr. Vernino considered this activity
characteristic of myoclonus. Nevertheless myoclonus can also manifest as
“negative myoclonus” where (presumably synchronized) lapses in excitatory
input to muscles occur leading to brief, potentially localized, losses of tone and
consequently posture.
As the acepromazine/ketamine (with ethanol) anesthesia lightened, both
a +/+;-/- and rescue mouse displayed twitching that became more marked than
normal once the anesthesia was very light. Notably the heads of the mice began
to bob arrhythmically as though their posture was unsteady. The wildtype mouse

103
Figure 4.15. Abnormal EMG activity but normal motor units in Kcnc3-null mice during twitching.
Multiunit recordings are from the trapezious muscle made with a subcutaneous bipolar electrode.
Synchronized bursts typical of myoclonus (middle panel) were observed in Kcnc3-null mice but
twitching was related to bursty activity and periods of synchronized silence, which could represent
negative myoclonus (lower panels, which represent a continuous recording), while the unit action
potential was normal.
did not display such a robust response when recovering from the anesthesia.
Unit activity at this time was bursty and chaotic, however the short bursts
distinguishing myoclonus were not observed. Rather, nearly complete lapses in
multiunit activity within the range of the electrode were observed lasting >100 ms
(Fig. 4.15, bottom). With this duration the pauses could affect the maintenance of
posture and result in a twitch. That these were synchronized is potentially
consistent with negative myoclonus but the irregular activity between the pauses

104
could just as well be involved. Interestingly, the observed activity is unlikely to
arise from the types of intrinsic alterations one might expect to see in the firing of
motor neurons without Kv3.3, which, in addition, is mainly expressed in the
terminals rather than the soma. Though terminal expression likely has a function
and neuromyotonia leads to twitching in humans, Kv3.4 is co-expressed there
presenting the potential for functional redundancy. Thus it is likely that the
twitching, though not rescued by replacing Kv3.3 in Purkinje cells, originates from
the loss of Kv3.3 in another neuronal cell type elsewhere upstream in the brain.
The results of this pilot study further suggest the twitches are either non-
myoclonic in nature or negative myoclonus. It is unclear whether the twitching
phenotype shares a common anatomical origin with the infrequent, large
myoclonic jerks already described in mice lacking Kcnc1 and Kcnc3 alleles.
4.2.3.3. Grip Test
Another possible explanation of the
beam slips is impaired grip strength.
Expression of Kv3.3b in alpha motor
neurons raises the possibility that
muscle weakness leads to poor grip
resulting in slips on the 1-cm beam
and falls on the 0.5-cm beam. The
Figure 4.16. Mouse performing the grip test. Mice lacking Kcnc3 and one Kcnc1 allele have
normal grip strength.
+/-;-/- mice used in the above studies were placed on the inside of a cage lid
lined in wire mesh and the lid was inverted for 3 minutes. All mice were able to
sustain their grip upside down on the cage lid. The mutant mice could even
explore the underside of the lid, moving about. The -/-;-/- mice, in stark contrast,
only remained on the lid a few seconds before falling. Poor beam performance
therefore in the mutants is not merely due to impaired grip strength however in

105
-/-;-/- mice this may contribute. Because lateral deviation is also increased in
-/-;-/- mice and myoclonic jerks are not frequent enough to account for the
increase however poorer beam performance likely still reflects ataxia as well. It
cannot be stated though that the increased LDI results from augmented
hypermetria though because of the pronounced gait phenotype.
4.2.3.4. Equilibrium and Postural Control: The Rocking Ball Test (Pilot Study)
Beams slips and falls could both be due to a disturbance in balance or postural
control rather than motor coordination, or a combination thereof. It is reasonable
to expect postural adjustments to maintain balance to be potentially affected by
cerebellar dysfunction, especially when visual cues as well as vestibular stimuli
are involved since the cerebellum integrates these stimuli to maintain balance.
To directly measure balance and postural control there is an unfortunate
paucity of options available to behavioral neuroscientists. For testing basic, gross
equilibrium the contact righting test is available, however this test would not
detect more subtle deficits or problems with postural control. Other such tests are
assessment of negative geotaxis and swimming. The former refers to the fact
that normal mice, when placed on a ramp on an incline, will climb upward. Mice
with impaired equilibrium will climb down a ramp instead. When dropped in a
pool of water, such mice will fall to the bottom rather than swim to keep their
heads above water.
Figure 4.17. +/+;-/- mice are able to stay on
the rocking ball suggesting posture and
balance are intact. Data are the number of
seconds the mouseremained on the ball
subtracted from 60 to be directly
proportional to impairment.
To test basic equilibrium I
examined whether the +/+;-/- mice
+/++/
+
+/+-/-
+/+-/-
Res
cue
0
20
40
60
Imp
air
men
t

106
would demonstrate negative geotaxis. I placed them on a textured slope and they
did not climb downward but rather upward, indicating an absence of negative
geotaxis and therefore gross equilibrium is intact. The elevated platform test
where mice are placed on a small roost several feet above ground could not be
performed because too many albino mice were in the group, which were not
reluctant to jump down on purpose, invalidating the test. Because there is a lack
essentially of sensitive tests that mostly measure postural control I resorted to
devising a novel test.
I obtained pilot data comparing +/+;-/-, rescue and +/+;+/+ mice using the
rocking ball test (Fig. 4.17). Briefly, in this test (see section 3.3.4.4) mice are
placed on a smooth glass ball over a tub of water. The ball is rocked rapidly until
mice fall into the water at which point swimming is also assessed. Neither +/+;-/-
mice nor their cognate rescue mice fell in the water significantly sooner than
wildtype controls. Further, +/+;-/- mice are able to swim, albeit less well,
supporting the notion that their basic sense of equilibrium is intact. Again, during
swimming the hind limb movement of null mutants has a jerky quality to it, as
when they kick paroxysmally on the narrow beam after totally losing their footing.
I also noted qualitatively that these mutant mice were abnormal in the use of their
tails to aid in keeping their balance it seemed, as on the beam. The +/+;+/+ mice
often wagged their tail in phase with the rocking of the ball.
The rocking ball test therefore suggests that +/+;-/- mice do not have
impaired balance or fine postural control even when challenged with a
demanding task. It should be emphasized though that this is not an established
test, and there is no positive control with a known mild deficit in postural control
to validate that the test is sensitive. Nonetheless, the results are quite striking. It
was remarkable that some mice of the mutant and wildtype groups were able to
remain standing on the rocking ball in excess of a minute, frequently correcting
their position with agility whenever they began to slide down the ball.
4.2.3.5. Harmaline Tremor

107
As harmaline-induced tremor is believed to be an index of the functionality of
olivo-cerebellar circuitry, harmaline was injected into +/+;+/+, +/+;-/- and rescue
mice to determine whether Purkinje cells represented the critical link in the
circuitry with regard to Kcnc3 function. In particular, harmaline tremor had been
posited to involve synchronized complex spike firing by Purkinje cells in response
to olivary (climbing fiber) input. Harmaline tremor was not rescued. One possible
explanation was that the 313 line used for the +/+;-/- rescue experiment did not
consistently express in all Purkinje neurons in the mice sampled. This was the
same population used for the force plate and beam test studies above, which by
sampling 16 mice I confirmed expressed in >90% of Purkinje neurons.
Nonetheless some +/+;-/- rescue mice bred using the 396 line were also tested
which reliably express in virtually all Purkinje cells (see section 4.1.1). Still
harmaline tremor was absent. That harmaline tremor was not at least rescued in
+/+;-/- mice is intriguing and surprising. It suggests that another neuronal
population in the olivo-cerebellar loop is affected by the loss of Kcnc3, neuronal
populations in downstream target nuclei are affected, or the normal development
of requisite connectivity is disturbed.
4.3. RESTORATION OF KV3.3B EXPRESSION IN PURKINJE CELLS
RESCUES WILDTYPE OUTPUT TO DCN NEURONS WHICH EXHIBIT KCNC-
ALLELE DEPENDENT SPIKE BROADENING
Above I established that expression Kv3.3 in Purkinje cells is involved in motor
coordination by determining that selective restoration of Kv3.3b to Purkinje cells
is sufficient to rescue motor coordination on a Kcnc3-null mutant background.
With the functional relevance of expression in this cell type elucidated, I
investigated what electrophysiological changes occur in null mice that are
rescued in conjunction with behavior, and thereby bridge the gap between events
in networks at the cellular level and behavior. As the only known physiological
108
role of axo-somatic Kv3 channels as of yet is to act upstream ultimately in spike
repolarization, the most parsimonious explanation for the behavioral effect is the
impact of the channel current on action potentials.
First, I further characterized the Kcnc3-null phenotype in Purkinje cells
and tested for a rescue of normal spiking after Kv3.3b re-expression. These
results are published in Hurlock et al., 2008. Secondly, I explored changes in the
intrinsic firing properties of DCN in neurons in +/+;-/- mice, +/-;-/- mice, and -/-;-/-
mice. For rescued Purkinje cell spiking to be able to correct cerebellar output the
output of the DCN must in theory remain intact. Finally, I also assessed how the
rescued changes I observed in Purkinje cell spiking in mice lacking Kv3.3 might
affect DCN spiking, to the extent this can be addressed in slices in vitro.
4.3.1. Purkinje Cells
In +/+;-/- mice previous investigations had only addressed alterations in
spontaneous simple spike width and frequency. High-frequency spiking, apt to be
most affected by loss of Kv3 channels, such as that occurring during complex
spikes elicited in response to climbing fiber input or when depolarized in a
systematic, controlled manner, was not evaluated. I evaluated these parameters
and found them to be altered in mice lacking Kv3.3. I further found that all of
these parameters were rescued by re-introducing Kv3.3b using the 313 line, and
found converging results with a recording from the 396 line.
4.3.1.1. Intrinsic Firing Properties
Figure 4.18. (below) Input resistance of Purkinje cells recorded in current clamp mode in the
rescue experiment.

109
I recorded action potentials in
current clamp mode in Purkinje
cells from adult mice, often the
same used for behavior, using
whole-cell patch-clamp. The input
resistances measured with current
injections below threshold did not
differ among wildtype, null or
rescue groups (Fig. 4.18),
congruent with the notion that Kv3 channels are only engaged at depolarized
potentials above spike threshold. Importantly, the data suggest that any
differences in spike rates among groups are not merely due to differences in the
input resistance.
Replicating previous work in the lab (McMahon et al., 2004), I found that
spikes were about twice as broad at half-height in +/+;-/- mice (0.26 ms, ANOVA,
p < 0.001; Figure 4.21; Hurlock et al., 2008) compared to wildtype mice (0.15 ±
0.004 ms). Rescue mice (0.14 ± 0.006 ms) were indistinguishable from null
mutants in this regard (p > 0.05). The mean width at half-height in a mouse
heterozygous for the Kcnc3-null allele was 0.145 ms ± 0.015 (n=2). Considering
the very low level of variation in this parameter between these two recordings,
the data suggest, albeit weakly, that the width in heterozygotes is virtually
unchanged, by contrast. When I applied 1 mM TEA to Kcnc3-null Purkinje cells,
no clear additional broadening was observed (Figure 4.21), whereas spikes of
wildtype Purkinje cells underwent a twofold broadening, a magnitude echoing
that observed in the null mutant. As anticipated if the rescue of narrow spiking is
through an acute, direct effect of restoration of Kv3.3, the spike width in Purkinje
cells of rescue mice could be converted to that of null mice by 1 mM TEA, which
should block the bulk of Kv3 current. That no further broadening is seen with 1
mM TEA than is seen in +/+;-/- mice suggests that somatic Kv3.4 expression
does not contribute strongly to spike repolarization in Purkinje cells, at least in
Input Resistance
+/+;+/+ +/+;-/- +/+;-/- Rescue0
5
10
15
20
25
Genotype
Meg
ao
hm
s

110
Figure 4.19. Spike frequency is slower in
+/+;-/- mice especially at high
frequencies. Interspike intervals. Data
are from intracellular whole-cell patch-
clamp recordings performed in current-
clamp mode4 (A), post-complex spike
pause durations (B), and spike
frequency as a function of injected
current are all rescued to wildtype values
with Kv3.3b restoration to Purkinje cells.
those sampled in this study in the
vermis. In conjunction with spike
broadening, removal of Kv3
current concomitantly abrogates
the fast afterhyperpolarization
that immediately follows the
spike, caused when rapid
hyperpolarization mediated by
Kv3 current quickly ceases
before other delayed-rectifier or
calcium-activated potassium
channels have opened
substantially. The slow
afterhyperpolarization that follows
reflects activity of those slower
channels.
4 In current clamp mode current is injected and the membrane voltage is allowed to
dynamically respond based on the value of the membrane resistance and the dialog between voltage-gated conductances etc. Action potentials can occur freely in response to depolarization. In voltage-clamp rapid feedback allows for ongoing adjustments in injected current to clamp the voltage, allowing isolation of currents provided the electrical access is sufficient and the injected current can effectively spread to all compartments of the cell.

111
Since I was already recording Purkinje cells intracellularly I also had
recordings of the spontaneous simple spike rate. Intracellular recording perturbs
cells and increases the variability in this measurement as well as the difference
between cells in the behaving mouse and in the acute preparation because
whole-cell recording dialyzes the cytosol, rapidly diluting small solutes that
diffuse readily. These caveats notwithstanding, I still replicated in my sample the
general observation reported previously using extracellular recording that the
interspike interval of spontaneous spikes of +/+;+/+ mice (9.56 ± 1.02) is
increased (p < 0.05) in +/+;-/- (14.2 ± 1.3) Purkinje cells and restored to normal in
those of rescue mice (7.31 ± 0.72; Fig. 4.19A).
If high-frequency firing is relatively more attenuated by loss of Kv3
channels, we would expect to see the difference in the frequency of firing as a
Figure 4.20. Square 1.2-second depolarizing current injection pulses to determine the relationship
of spike frequency to injected current in Purkinje cells.
function of injected depolarizing current (F-I relation; Fig. 4.20) between +/+;-/-
and +/+;+/+ mice to increase at higher frequencies. By 2-way ANOVA using
repeated measures across all current steps +/+;-/- Purkinje cells spiked at 11.8 ±

112
2.55 Hz/200 pA a frequency significantly less than +/+;+/+ mice (29.3 ± 3.19, p <
0.01) while rescue mice did not differ significantly from +/+;+/+ mice (25.8 ±
3.42), consistent with the difference in spontaneous spike rates. The F-I plot (Fig.
4.19C) revealed that the slope of the relation was clearly decreased in null mice
(ANOVA, p < 0.01) and normal in rescue mice, supporting the notion that high
frequency firing is more susceptible to the loss of Kv3.3. This result suggested
that complex spikes might be particularly affected by the null mutation.
4.3.1.2. Response to Climbing Fiber Input
To best model in vivo conditions relevant to behavior, climbing fiber responses
were elicited with Purkinje cells at the resting potential (Fig. 4.21). In wildtype
mice, complex spikes were comprised of an average of 2.61 ± 0.29 spikelets
following the initial full spike. The number of spikelets in null mice was reduced
roughly by a factor of two (ANOVA, p < 0.001; Fig. 4.21A). Measuring the first
interspike interval to derive an instantaneous frequency, the frequency attained
by wildtype complex spikes was roughly three times that of null mice (ANOVA, p
< 0.001; Fig. 4.21A, B). In keeping with the notion that the main role of Kv3.3 is in
supporting high frequency spiking, this three-fold difference contrasts with a less
than two-fold difference in simple spike rates. Complex spikes of rescue mice did
not differ significantly from wildtype controls in terms of spikelet number or
frequency (Fig. 4.21A, C). The pause in simple spiking that typically ensues after
a complex spike was about twice as long in +/+;-/- mice (ANOVA, p < 0.01). This
parameter, likewise, was rescued in Purkinje cells of rescue mice (Fig. 4.19B). In
summary, all spike parameters altered in Purkinje cells of +/+;-/- mice were
rescued by Kv3.3 restoration at the soma. I did not endeavor to explore the
mechanisms of complex spike attenuation in-depth, however some observations

113
Figure 4.21. Purkinje-cell-targeted Kv3.3 expression restores normal action potentials and complex
spikes in Kcnc3-null mutants. Complex spikes triggered by climbing fiber stimulation (arrow) in
Purkinje cells at the resting potential in +/+;+/+ mice (A), +/+;-/- mutant (B), and upon restoration of
Kv3.3b expression (C). At right, 1 mM TEA is able to reverse the rescue suggested that it Kv3-
mediated and the spike-broadening effect is largely occluded by the null mutation in Kcnc3.
Figure 4.22. (below) Climbing fiber responses evoked from a hyperpolarized potential. Stimuli are
delivered to the climbing fiber (arrow) in the absence of ongoing simple spiking by holding the
membrane potential at -60 mV by injecting a constant, hyperpolarizing bias current. (A) +/+;+/+, (B)
+/+;-/-, (C) Rescue.

114
are worth noting. At non-
physiological, hyperpolarized
holding potentials in isolation
without preceding,
spontaneous simple spikes I
arrived at the same
conclusions in terms of the
null phenotype. At -60 mV
climbing fiber responses of
wildtype Purkinje neurons
quite consistently were
crowned by one spikelet or,
rarely, two (Fig. 4.22A). Null
mice invariably just fired one
spike without spikelets (Fig.
4.22B). Similar results were obtained at -70 mV, although here wildtype mice
never had more than one spikelet. Rescue mice were indistinguishable from
wildtype mice (Fig. 4.22C). The rescue of complex spikes therefore arose from
intrinsic effects on the complex spike itself rather than somehow as an indirect
result of effects on preceding simple spikes. Moreover, the rescue was likely
attributable to the role of Kv3 channels in fast repolarization of action potentials
facilitating high-frequency firing rather than a disturbance in climbing fiber input
because injection of current waveforms simulating climbing fiber input of varying
magnitude could not elicit instantaneous frequencies comparable to wildtype
mice even at the highest strengths (data not shown).
4.3.2. DCN Neurons
For Purkinje cell output to influence motor skills, it must be conveyed to motor
centers by way of DCN neurons. If the rescue of Purkinje cell action potential

115
firing corrects the motor coordination deficit of +/+;-/- mice but not mice lacking
Kcnc1 as well we would expect that perhaps DCN firing becomes significantly
altered once Kcnc1 alleles are lost. Kv3.3 and Kv3.1 subunits are both expressed
by large DCN projection neurons that innervate motor centers raising the
possibility that functional redundancy explains the pronounced cerebellar ataxia
Figure 4.23. Electrophysiological signature of weak and transient, strong bursting neurons in the
DCN. Current injection is indicated by a black line. A 100 pA depolarizing step is injected in A and
B. In C, D, E, F a rebound burst response is shown upon relief of hyperpolarizaing current injection
(or anode break). In E and F the current magnitude is more intense. A, C, E show a weak-burst
neuron. B, D, F show a transient-burst neuron. Note the high-frequency firing at the leading edge of
the rebound that appears to distinguish these neurons in mice. In rat the burst is more discrete. The
morphology of the cell featured in B, D, F is shown in Figure 4.24C.
of -/-;-/- mice. Moreover, we would envision that Purkinje cell output to the DCN
to be rescued too if the rescued parameters at the soma are to be consequential
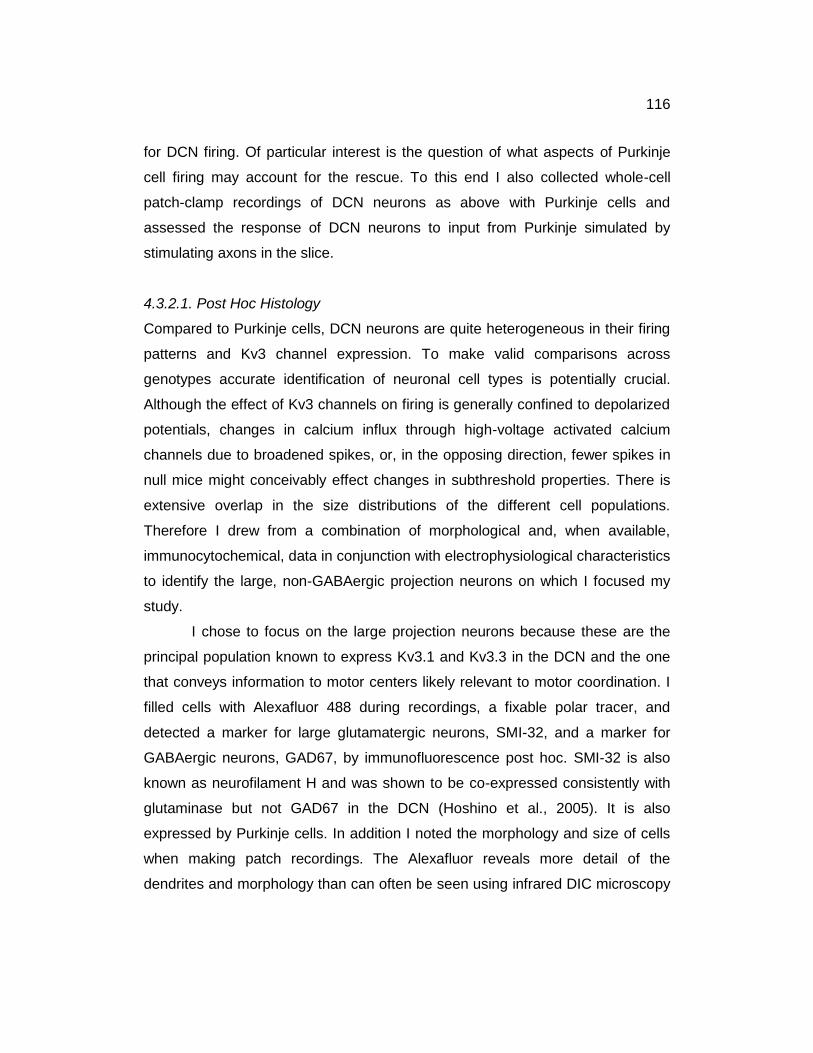
116
for DCN firing. Of particular interest is the question of what aspects of Purkinje
cell firing may account for the rescue. To this end I also collected whole-cell
patch-clamp recordings of DCN neurons as above with Purkinje cells and
assessed the response of DCN neurons to input from Purkinje simulated by
stimulating axons in the slice.
4.3.2.1. Post Hoc Histology
Compared to Purkinje cells, DCN neurons are quite heterogeneous in their firing
patterns and Kv3 channel expression. To make valid comparisons across
genotypes accurate identification of neuronal cell types is potentially crucial.
Although the effect of Kv3 channels on firing is generally confined to depolarized
potentials, changes in calcium influx through high-voltage activated calcium
channels due to broadened spikes, or, in the opposing direction, fewer spikes in
null mice might conceivably effect changes in subthreshold properties. There is
extensive overlap in the size distributions of the different cell populations.
Therefore I drew from a combination of morphological and, when available,
immunocytochemical, data in conjunction with electrophysiological characteristics
to identify the large, non-GABAergic projection neurons on which I focused my
study.
I chose to focus on the large projection neurons because these are the
principal population known to express Kv3.1 and Kv3.3 in the DCN and the one
that conveys information to motor centers likely relevant to motor coordination. I
filled cells with Alexafluor 488 during recordings, a fixable polar tracer, and
detected a marker for large glutamatergic neurons, SMI-32, and a marker for
GABAergic neurons, GAD67, by immunofluorescence post hoc. SMI-32 is also
known as neurofilament H and was shown to be co-expressed consistently with
glutaminase but not GAD67 in the DCN (Hoshino et al., 2005). It is also
expressed by Purkinje cells. In addition I noted the morphology and size of cells
when making patch recordings. The Alexafluor reveals more detail of the
dendrites and morphology than can often be seen using infrared DIC microscopy
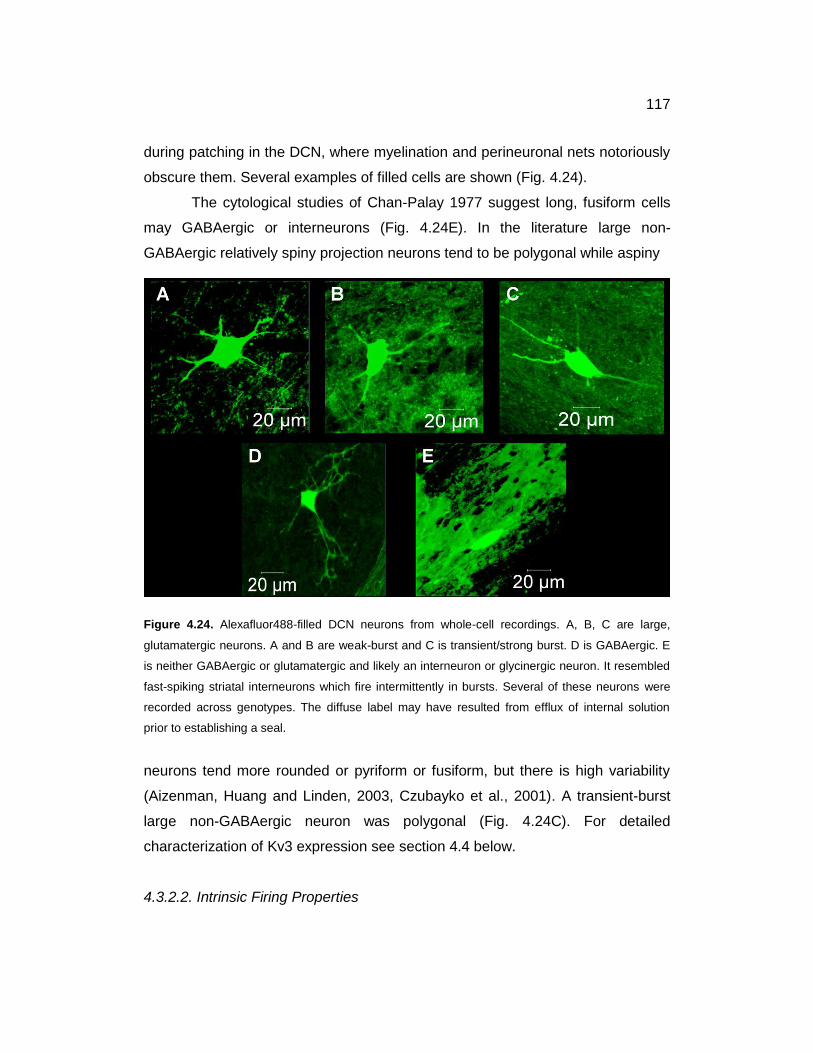
117
during patching in the DCN, where myelination and perineuronal nets notoriously
obscure them. Several examples of filled cells are shown (Fig. 4.24).
The cytological studies of Chan-Palay 1977 suggest long, fusiform cells
may GABAergic or interneurons (Fig. 4.24E). In the literature large non-
GABAergic relatively spiny projection neurons tend to be polygonal while aspiny
Figure 4.24. Alexafluor488-filled DCN neurons from whole-cell recordings. A, B, C are large,
glutamatergic neurons. A and B are weak-burst and C is transient/strong burst. D is GABAergic. E
is neither GABAergic or glutamatergic and likely an interneuron or glycinergic neuron. It resembled
fast-spiking striatal interneurons which fire intermittently in bursts. Several of these neurons were
recorded across genotypes. The diffuse label may have resulted from efflux of internal solution
prior to establishing a seal.
neurons tend more rounded or pyriform or fusiform, but there is high variability
(Aizenman, Huang and Linden, 2003, Czubayko et al., 2001). A transient-burst
large non-GABAergic neuron was polygonal (Fig. 4.24C). For detailed
characterization of Kv3 expression see section 4.4 below.
4.3.2.2. Intrinsic Firing Properties

118
The large, weak-bursting DCN neurons I focused on displayed graded
differences in their action potential properties and ability to spike at high
frequencies as function of genotype. The +/+;-/- mice showed only subtle
alterations whereas mice additionally lacking Kcnc1 exhibited more significant
ones while DKO mice demonstrated pronounced alterations. Using
hyperpolarizing steps otherwise as described for the F-I relation data below, I
classified large neurons as transient or weak-bursting. Rebound bursts in murine
DCN neurons may differ from those of rat. Though discrete transient bursts were
absent in large neurons, I did see bursts where the initial spike frequency of the
first three to five spikes was noticeably higher than the rest in the burst, which
was generally larger than those of most large neurons but not quite as robust as
those of small neurons. The abundances of these transient-burst neurons were
as follows: +/+;+/+, 1/13; +/+;-/-, 4/10; +/-;-/-, 0/5; -/-;-/-, 1/9. These neurons were
excluded from the analysis below.
Figure 4.25. Input resistance of recorded
large, glutamatergic DCN neurons across
genotypes do not differ significantly
(ANOVA). Error bars are S.E.M.
As in the case of Purkinje
cells, input resistance
measurements indicated that loss
of Kv3 subunit genes did not affect
this parameter and that recordings
were comparable (Fig. 4.25). The
variability was clearly higher not surprisingly given the diversity of neuronal sizes
in the DCN within a given class. Resistance values were less than those of
Uusisaari et al., 2007 probably because they used K-gluconate I used K-
methylsulfonate as my electrolyte in my internal solution, which has been shown
to block less conductances than the K-gluconate (Velumian et al., 1997), as
Input Resistance
+/+;
+/+
+/+;
-/-
+/-;-
/-
-/-;-/
-0
100
200
300
Genotype
Meg
ao
hm
s

119
conductance is the inverse of resistance. Another difference was that Uusisaari
et al., 2007 used NBQX as opposed to DNQX in the bath. NBQX blocks
glycinergic input more, which, if it constitutes a sufficient conductance, could
impact the input resistance. I measured action potential properties of
spontaneous tonic spikes and the F-I relation.
Figure 4.26. Action potential properties of large, glutamatergic DCN neurons across mutants
lacking Kcnc3 and Kcnc1 alleles. Broadening becomes significant with loss of Kcnc1 alleles. (A)
Representative, individual action potential waveforms of each genotype indicated Kcnc1 then
Kcnc3 below. An overlay is at right. (B) The time it takes the voltage to rise from 10-90% of the
difference between the threshold and the peak. (C) The spike width measured halfway between the
threshold and the peak. (D) The spike height measured from threshold to peak. (E) The time it
takes for the spike to decay 90% of the distance between the peak of the spike to the peak of the
afterhyperpolarization. +/+;+/+, n = 11; +/+;-/-, n = 6; +/-;-/-, n = 4; -/-;-/-, n = 8. All error bars are
S.E.M. Asterisks are compared wildtype: * p < 0.05; ** p < 0.01; *** p < 0.001.

120
The mean action potential width at half-height was greater in the mutant
DCN neurons than in wildtype, reaching significance in +/+;-/- mice lacking a
Kcnc1 allele (ANOVA, p < 0.001) where spikes were ~50% broader and in -/-;-/-
mice (p < 0.001) where spikes were broadened in excess of ~100% (Fig. 4.26A,
C). By the D‟Agostino & Pearson test, wildtype data were not found to be
normally distributed probably due to an outlier score. Using the Kruskal-Wallis
test alternatively only the difference between wildtype and -/-;-/- mice was
significant yet still yielded a p value of < 0.001. It is difficult however with the
small sample sizes involved to determine normality for certain, and if the outlier is
removed the distribution is normal. The width in -/-;-/- mice is moreover
significantly greater than that of +/+;-/- mice (p < 0.001) or +/-;-/- mice (p <
0.001). Along with the spike width, the spike height is significantly greater in the
mutants, and in this case the difference between wildtype and mice just lacking
Kcnc3 is significant (p < 0.05). The fast afterhyperpolarization amplitude also
appears to diminish with decreased Kcnc1/Kcnc3 gene dosage, while the time it
takes for the membrane potential to
decay to 90% of the difference between
the action potential and
afterhyperpolarization peaks significantly
increases for all genotypes (p < 0.001)
except +/+;-/- mice, in part reflecting the
loss in -/-;-/- mice or reduction in +/-;-/-
mice of the fast afterhyperpolarization.
This decay time is significantly in slower
in -/-;-/- mice than in mice just lacking
Figure 4.27. Intracellularly-recorded interspike interval at the resting potential in large,
glutamatergic DCN neurons. The same cells were sampled as in the action potential waveform
study in Figure 4.26. Error bars are S.E.M. * p < 0.05.

121
Kcnc3 (p < 0.001) and +/-;-/- (p < 0.001). The difference between mice just
lacking Kcnc3 and +/-;-/- mice is also significant (p < 0.01). Finally, the rise time
of the action potential measured from 10-90% is not different among any of the
genotypes. Among the limited number of transient-burst neurons that I sampled,
there were no striking, obvious differences between this subtype and weak-burst
large neurons. Values were within the same range observed for weak-burst
neurons of the same genotype.
The mean spontaneous spike rate measured intracellularly was
significantly (p < 0.05; Fig. 4.27) slower in -/-;-/- mice (~50 Hz) than is wildtype
mice (~100 Hz). The two-fold difference in the spontaneous spike rate parallels
the difference in spike width between wildtype and -/-;-/-. This was fairly similar to
the situation in Purkinje cells lacking just Kcnc3. The coefficient of variance of the
interspike interval was not increased over that of wildtype mice in -/-;-/- mice
(ANOVA, overall p = 0.2587).
I took some pilot measurements to assess high-frequency spiking. The F-
I relation also appeared to differ among genotypes such that mutants with greater
spike broadening exhibited a more shallow slope on the F-I plot consistent with a
relatively more severe impairment in firing at high frequencies (Fig. 4.28). These
Figure 4.28. Spike frequency as a function of injected current in large, glutamatergic DCN neurons
lacking variable numbers of Kcnc1 and Kcnc3 alleles. (A) The F-I plot. (B) Average slopes of the F-
I relation are shown. +/+;+/+, n = 9; +/+;-/-, n = 4; +/-;-/-, n = 5; -/-;-/-, n = 6.

122
intuitive differences however were on the cusp of significance (ANOVA, overall p
= 0.0523). Assessed by 2-way ANOVA again the differences were not significant
except when the three most intense current injections were considered using
multiple comparisons via the Bonferroni correction between wildtype and -/-;-/-.
When the more variable, small +/+;-/- sample is removed, the effect of genotype,
differences between -/-;-/- and wildtype, as well as differences between +/-;-/-
mice become significant at the highest frequencies elicited by the strongest
current injections. Although the small sample sizes render the conclusions
tentative, it appears that higher-frequency firing is especially perturbed in -/-;-/-
and +/-;-/- mice.
Taken together the intrinsic spike data suggest that the large, weak-
bursting DCN projection neurons are only subtly altered by the loss of Kcnc3,
more so by the loss of a Kcnc1 allele and markedly, to an extent comparable to
Purkinje cells upon loss of just Kcnc3, when both Kcnc1 and Kcnc3 are entirely
ablated. The cerebellar output neurons downstream of Purkinje neurons are in
essence normal in +/+;-/- mice, enabling normal Purkinje output restored in
rescue mice to be faithfully transmitted to motor centers.
4.3.2.3. Depression of Input from Purkinje Cells to DCN Neurons (Pilot Study)
Loss of Kv3-mediated fast repolarization of action potentials at axon terminals
leads to increased calcium influx through high-voltage activated calcium
channels that in turn increases neurotransmitter release. At synapses made onto
DCN neurons by Purkinje cells, short-term plasticity in the form of synaptic
depression results due to progressive depletion of GABA. Since blockade of Kv3
channels principally by 1 mM TEA application augmented depression here
(Telgkamp and Raman, 2002), I hypothesized that if Purkinje cell terminals rely
on Kv3.3 like the Purkinje cell soma then loss of Kv3.3 expression would yield
enhanced synaptic depression. A corollary would be that the basis of the rescue
mediated by Kv3.3b, which is expressed at terminals (see sections 4.1.1.3 and

123
4.1.1.4) would potentially include a restoration of a normal level of synaptic
depression.
DCN neurons can only be practically recorded by patch-clamp
approaches without some tissue dissociation prior to P21. Fast repolarization, the
cardinal sign of Kv3 channel expression, appears in Purkinje cells rather abruptly
(McKay and Turner, 2005). In Purkinje cells Kv3 expression is first detectable
postnatally and the protein accumulates thereafter. The latency between somatic
expression and axonal transport to terminals remained unexplored. To ensure
channel protein was actually present at terminals with assistance from Mitali
Bose I examined sections processed in parallel from individual adult and P17
mice representing +/+;+/+, +/+;-/- and rescue genotypes. A low level of Kv3.3b
subunit protein was detected by P17 in wildtype mice (data not shown).
The functional current magnitude generated by channels in the
membrane cannot be inferred with certainty from expression levels, and it is not
possible to make intracellular recordings of small axon terminals such as those of
Purkinje neurons. Rescue mice had, if there was any difference, a higher level of
Kv3.3b immunofluorescence at the terminal closer to that of adult wildtype mice
(data not shown). Transgene expression should begin by P7 based on the
activity of the L7 promoter (Zhang et al., 2001).
With the assistance of summer undergraduate student Ganon Pierce,
Purkinje cell axons were stimulated in slices while eIPSCs were recorded in
voltage-clamped DCN neurons using whole-cell patch-clamp recording (Fig.
4.30). 500-ms trains of stimuli were used to evidence depression of eIPSC foot-
to-peak amplitude. Trains (Fig. 4.29) of two different frequencies characteristic of
wildtype or null Purkinje cell simple spikes recorded in Hurlock et al., 2008 were
delivered to either +/+;+/+ or +/+;-/-. The stimulation frequency was
approximately matched to the spontaneous spike rate of Purkinje cells observed
in slices (see section 4.3.2.3) in either wildtype or null mice. Depression
measurements were taken at each frequency. Immediately following these trains,
stimulation mimicking the average parameters of complex spikes were delivered

124
followed by a pause and then a resumption of the frequency prior to the
simulated complex spike input for 500 ms. Next, the frequency was accelerated
to 200 Hz for 500 ms, roughly twice the average wildtype simple spike frequency,
to mimic the maximal frequency of simple spiking seen in vivo, and then returned
to 100 Hz. Similarly, in the +/+;-/- frequency train, the average simple spike
frequency was roughly doubled during this epoch of transient accelerated input.
Figure 4.29.
Stimulation train
with frequencies
approximating
wildtype Purkinje
cell spiking.
The fast epoch was included to assess whether depression increased and then
diminished when the input frequency was increased and decreased, respectively.
Very little summation of eIPSCs was observed during the simulated complex
spike and no obvious recovery from depression occurred after the pause that
follows the complex spike using either the wildtype or null simple spike frequency
in either mice lacking Kv3.3 in Purkinje cells or wildtype mice. Likewise there
were nominal if any effects on eIPSC amplitude when the simple spike input
frequency was shifted within the physiological window between the mean and
maximum. This does not exclude the possibility that recovery from depression
could take place shifting between the low end of the spectrum of wildtype
Purkinje cell output frequency (~50 Hz) or between longer pauses in Purkinje cell
output and the maximum of 200 Hz. I chose then to focus on depression during
epoch I of the protocol after a baseline of silence.
To be assured that eIPSCs were mediated by GABA-A receptors and that
no other currents were elicited by the stimulation, SR-95531, a GABA-A blocker,
was applied by a puffer at 10 µM while the stimulation trains were delivered at
Epoch II Epoch I Epoch III Epoch IV

125
Figure 4.30. Synaptic depression at the synapse made by Purkinje cells on DCN neurons. eIPSCs
were recorded in voltage-clamp after stimulating Purkinje cell axons near the DCN. Stimulation is
indicated by negative-going stimulus artifacts prior to eIPSCs. (A) Purkinje-cell axonal stimulation
trains delivered to either mice lacking or bearing Kv3.3 in Purkinje cell terminals at a frequency

126
roughly approximating the typical spike rate of wildtype Purkinje cells. (B) Trains delivered to both
genotypes in the same manner except at a lower frequency more characteristic of mice lacking
Kcnc3. (C) Plot of normalized averaged eIPSC amplitudes using the high-frequency wildtype-
simulating protocol from A. (D) Conterpart plot of data from B. Wildtype, n = 3; Kcnc3-null, n = 5;
Rescue, n = 1.
Figure 4.31. (below) Verification of the GABA-A-mediated nature of stimulated eIPSCs by puffer
application of the GABA-A anatagonist SR-95531. 100 Hz stimulation is indicated by vertical lines
caused by stimulus artifacts. Baseline (traces 1-4, going left to right), application (traces 5-12) and
wash (traces 13-16) are shown. SR-95531 thoroughly and reversibly blocked the eIPSCs. Shown
is the leading edge of the stimulation protocol used in Figure 4.30 above.
15-second intervals. During SR-95531 delivery eIPSCs were abolished and no
synaptic currents insensitive to the blocker were evident. Glutamate blockers
were present in the bath and interneuron stimulation was avoided by keeping the
stimulation electrode at a distance in the white matter. GABAergic interneurons
are also very rare in the medial nucleus (Molineux et al., 2006) where all cells
were recorded for this part of the study. The eIPSCs therefore were most likely
originated from Purkinje cell afferents to DCN neurons.

127
Wildtype mice as reported by Telgkamp and Raman, 2002 looking at
mice younger than P17 exhibited depression (Fig. 4.30) that appears to be
greater at steady state and more abrupt in its onset at higher frequencies.
Purkinje-cell-to DCN synapses of mice lacking Kcnc3 demonstrate the same
pattern, and depressed more abruptly it seemed at either frequency than those of
wildtype mice. The mutants seemed to have more depression at steady state
than wildtype mice only at the null stimulation frequency, possibly due to
saturation of the vesicle depletion effect at the higher frequency. In actual mutant
mice, Purkinje cells might be expected to fire at the null frequency, so if this small
pilot sample reflects true means the data suggest depression may occur both
more rapidly and to a greater extent at steady state in Kcnc3-null mutants. One
usable recording from a rescue mouse was analyzed. For both stimulation
frequencies the mean eIPSC amplitudes tracked those of the 5 averaged null
mice. The cell was recovered by histology and turned out to be GABAergic based
on GAD67 immunofluorescence. eGFP+ axons can be seen in the white matter
near the cell and genotyping confirmed that the mouse was a rescue (Fig.
4.24D). If the pilot recordings reflect the true means the data suggest that
augmented depression is not rescued by restoration of Kv3.3b to Purkinje cells.
To determine if any change in depression or other parameters of Purkinje cell
output might be consequential for DCN firing I performed current clamp
recordings.
4.3.2.4. Response to Input from Purkinje Cells (Pilot Study)
To characterize responses of DCN neurons to Purkinje cell input trains of stimuli
mimicking the mean interspike intervals of simple spikes, complex spikes and the
ensuing pauses in simple spike firing were delivered in current clamp mode. In
addition, the effect of varying the frequency over the physiological range was
examined (Fig. 4.31). The duration of and number of stimuli in simple spike trains

128
Figure 4.32. Annotated voltage trace of a DCN neuron in current clamp using a protocol developed
to explore the effects of Purkinje cell input to the DCN that may be affected in Kcnc3-mutant mice
explained in Figure 4.29. Stimulation frequencies during different epochs of the train are indicated.
A complex spike input simulation comprised of the burst followed by the pause occurs after the first
100 Hz train (epoch I). I also developed a corresponding protocol that simulates input to the DCN
from Purkinje cells lacking Kv3.3, as in the eIPSC recording experiment (see Figure 4.29). The
vertical lines below are stimulus artifacts signifying the delivery of stimuli to Purkinje cell axons.
was sufficient for short-term plastic changes such as synaptic depression to
reach steady-state based on previous work. By necessity, keeping the number of
stimuli constant at different frequencies positioned later epochs within the train at
different latencies after the onset of stimulation, which rendered traces collected
with the two different frequencies difficult to compare with regard to the
cumulative rebound depolarization that is very pronounced in DCN neurons.
Nevertheless I persisted in an effort to be systematic. Only a few quality
recordings were obtained across genotypes to provide a preliminary glimpse so I
will give qualitative descriptions.
Cells were held using injection of constant current at various membrane
potentials. The current often had to be varied to maintain a stable potential

129
because of the dynamic nature of the membrane potential below rest in DCN
neurons. Despite keeping the stimulation electrode away from the ventral white
matter surrounding the DCN that contains the efferent axons I nonetheless
frequently encountered axons. Antidromic stimulation was especially rampant
when the membrane potential was held at or more depolarized to the resting
potential, possibly due to current spread into axons bringing them closer to
threshold. I also saw this during climbing fiber stimulation in Purkinje cells.
Consequently, only data acquired at potentials hyperpolarized to rest are shown,
however it should be noted that the resting potential of DCN neurons varies in
vivo and may be bistable, so at times these potentials may well be physiological.
Had I kept the stimulating electrode strictly in medial slices I might have been
able to avoid antidromic stimulation better because I would have been able to
stimulate Purkinje cell axons effectively at a greater distance from the DCN but I
realized this too late. Also noteworthy is that Purkinje cell axons were stimulated
here in unison whereas in vivo activity in various afferent axons can be
asynchronous, producing a smoothed, tonic IPSP.
In large neurons, the first epoch of the train was capable of halting
spontaneous spiking at -55 mV (Fig. 4.33). Depending on the stimulation
intensity, the first IPSP either reached the chloride equilibrium potential, at which
there was saturation of the IPSP amplitude with increasing stimulation intensity,
or a less hyperpolarized potential if milder. Despite the depressing nature of the
synapse sub-saturating stimuli elicited temporal summation of IPSPs. Either
because of synaptic depression or an accruing underlying rebound depolarization
or, most likely, both, the membrane potential became depolarized returning back
toward the resting potential by the time the first epoch was followed by the
simulated complex spike input. With weaker stimulation, cells sometimes
resumed spiking during the train. In vivo complex spikes occur in the context of
ongoing simple spiking that is believed to shift in frequency in response to
varying parallel fiber and interneuronal input. Thus, my protocol should serve as

130
Figure 4.33. Stimulation as in Figure 4.32. (above) Response of a DCN neuron to Purkinje cell
stimulation at -55 mV. Stimulus intensity is increased going left to right, top to bottom, in 200 μA
increments. Figure 4.34. Stimulation as in Figure 4.32. (below) Response of a DCN neuron to
Purkinje cell stimulation at -60 mV. Same cell as in Figure 4.33 above.

131
a valid representation of what might actually be happening after synaptic
depression has reached steady state and the slow rebound depolarization has
been engaged by IPSPs.
Surprisingly, despite suggestions by in vivo or explant preparation data to
the contrary, the simulated complex spike input between epochs I and II even
using the wildtype parameters in wildtype slices did not elicit a transient, discrete
rebound burst or acute acceleration of firing at any potential or stimulation
intensity. As seen in the depression recordings above, IPSCs that trigger the
IPSPs are already suppressed once the complex spike stimuli arrive at the
terminal on a background of simple spiking. Intriguingly, the simulated pause that
follows the complex spike was in some cases capable of allowing the underlying
rebound depolarization to drive the cell to threshold before stimulation resumed
(Figs. 4.32 and 4.33). After the pause the depolarization was sustained, and
spikes were more likely. Next the epoch of accelerated firing (III) typically
resulted in somewhat enhanced hyperpolarization, as expected, which dissipated
probably due to further rebound depolarization building since depression does
not change much here. Indeed, following this high-frequency epoch the DCN
neuron became more depolarized upon resumption of the previous stimulation
frequency (epoch IV) than before the accelerated epoch (epoch III; Figs. 4.31,
4.32 and 4.34), suggestive of further rebound drive. The rebound depolarization
was quite apparent after the end of the stimulation protocol as the spike rate was
substantially accelerated over baseline. In some cases, the rebound potential
presumably contributed to increased spiking not just by depolarizing the cell but
also by decreasing the input resistance. Normally, decreasing the input
resistance decreases excitability, however during repetitive IPSP trains from
synchronized inputs, a subsequent shortening of the membrane time constant
(time constant = resistance x capacitance) will allow the membrane to depolarize
faster between IPSPs (Fig. 4.34).
At -60 mV the pattern was similar except the rebound depolarization
actually depolarized the cells beyond the initial holding potential even while the

132
Figure 4.35. Stimulation of Purkinje cell axons according to the protocol in Figure 4.29 when the
recorded DCN neuron is at a hyperpolarized potential is capable of leading to eventual net
depolarization. Stimuli of increasing magnitude are given to Purkinje cell axons left to right, top to
bottom. Note acceleration of membrane time constant as the rebound depolarization grows. In the
first two trains stimuli are subthreshold.
barrage of IPSPs continued (Fig. 4.34). From hyperpolarized potentials below the
chloride equilibrium potential (ECl) at the soma eIPSPs (or IPSPs in the
electronically-distant dendrites) depolarized many cells, in some cases triggering
a bistable shift to an up state. That occurred mostly in small neurons with high

133
input resistances that were more prone to spontaneous bistability in general,
such as this GABAergic neuron (Figure 4.37) and another one below ECl (Fig.
4.36). This scenario may be physiological when bistable cells are resting in a
down state.
Figure 4.36. (above) GABAergic (GAD67+
and characteristic firing) DCN neuron
responds to eIPSPs elicited by short trains
of Purkinje cell axon stimulation from a
hyperpolarized potential with bistable shifts
to an up state lasting nearly one second.
Pipette is blocked causing a high access
resistance which filters the spike amplitude
in this case.
Figure 4.37. (right) Another GABAergic
(GAD67+ and characteristic firing) DCN
neuron responds to IPSPs elicited by short
trains of Purkinje cell axon stimulation from
a hyperpolarized potential with bistable
shifts to an up state. This neuron exhibited

134
frequent bistability. Pipette is blocked causing a high access resistance which filters the spike
amplitude in this case.
When the null frequency stimulation protocol was used with wildtype or
+/-;-/- slices (no comparable pair of wildtype recordings was available at the two
frequencies) overall inhibition was decreased as evidenced by more spiking
during the trains. Whether Purkinje cell output is synchronized or asynchronous
the net effect of a tendency toward a reduced simple spike frequency without
Kv3.3 should then be to decrease inhibition of large, glutamatergic DCN neurons.
Figure 4.38. Comparable recordings of a DCN neuron responding to Purkinje cell stimulation at the
frequency characteristic of wildtype or mice lacking Kv3.3 in Purkinje cells. Slices are from a +/-;-/-
mouse. Just decreasing the frequency is sufficient to decrease the efficacy of inhibition by Purkinje
cels to oppose the rebound depolarization it simultaneously fosters. That this is a slice that lacks
Kv3.3 in Purkinje cells additionally indicates that frequency likely contributes to altered inhibition (A)
Wildtype stimulation frequency. (B) Kcnc3-null Purkinje cell stimulation frequency. Note that null
protocol takes longer because the frequency is lower yet the total number of stimuli is the same.
It remains unclear however whether overall inhibition of DCN neurons by
Purkinje neurons during tonic spiking is increased or decreased at a given
frequency. If synaptic depression is indeed enhanced in mutants lacking Kv3.3 in
Purkinje neurons then neither would simply be true, for, initially, inhibitory drive
would be greater due to more GABA release, whereas at steady state inhibition
would weaken due to greater steady state depression. Further complicating this
analysis is the inability to control how many axons are activated by the
stimulation using intracellular recordings. Using extracellular recordings, a fiber
volley directly proportional to the number of stimulated axons can be used to

135
normalize postsynaptic field responses to in order to remove this variable, even
in disordered, non-laminar neural tissues (Dr. Donald Cooper, personal
communication)5. IPSPs however cannot be observed with this method, only
spikes. A very large number of these technically-challenging intracellular
recordings would be needed to detect a difference in IPSP amplitude on average
keeping stimulation intensities the same. Comparing a limited number of
recordings all I could discern was that the diminution of inhibition transpired more
quickly during trains in mice lacking Kv3.3. If true, it would be consonant with the
anticipated effect of greater steady state depression and faster recruitment of the
rebound depolarization by initially stronger inhibition.
Though it remains inconclusive whether tonic inhibition is altered when
Purkinje neurons lack Kv3.3, I did reveal that the changes in spikelets are
unlikely to have an impact on DCN neurons whereas the extended pause
following the complex spike could. It may be quite clear that decreasing the
frequency of input from Purkinje cells between null and wildtype frequencies
decreases inhibition of the DCN, however if DCN neurons compensate for this in
null mice by increased postsynaptic sensitivity to GABA it may be
inconsequential.
The intrinsic firing data suggested that Kv3.3 and Kv3.1 are largely
functionally-redundant in the DCN and that there is some haploinsufficiency
when one Kv3.1 allele is lost when neurons evidently rely on Kv3.1 for fast
repolarization. If we assume all Kv3 subunits are capable of repolarizing spikes
with the same agility as Kv3.1 and Kv3.3, we would expect that Kv3.2 and Kv3.4
are absent in DCN neurons. If not, it is interesting that these subunits do not
complement the function of Kv3.1 in -/-;-/- and Kcnc3-null mice lacking a Kcnc1
allele. Previous expression studies suggested Kv3.2 was present in DCN
neurons but did not determine which type(s). Meanwhile Kv3.4 protein is
5 Typically, field recordings are performed in orderly, laminar tissues such as the
hippocampus where potentials summate rather than cancel each other because the dipoles are aligned. Also neurons with long, apical dendrites produce more robust dipoles.

136
sometimes expressed where the mRNA is barely detectable. I therefore next
examined co-expression of channel subunits in DCN neurons.
4.4. REDUNDANT EXPRESSION OF KV3 CHANNELS IN CEREBELLAR
NEURONAL CELL TYPES
Understanding what neuronal cell types might account for the phenotypes seen
with Kcnc subunit gene ablation calls for an assessment of the potential for
functional redundancy at the anatomical and cellular levels. When two or more
subunits are expressed in the same subcellular compartment, potential for
functional redundancy exists. Co-expression of Kv3 subunits without functional
redundancy is of interest regarding the respective functions of the individual
genes for this bespeaks of non-overlapping roles. Though several studies have
explored Kv3 subunit distributions in the cerebellum, as discussed in the
introduction (see section 1.4) unanswered questions remained. For these
reasons, I undertook some anatomical work with extensive technical assistance
from Mitali Bose to take a closer look at the co-expression of the four Kv3
subunits in cerebellar neurons.
I availed myself of commercial antibodies that are either “pan” antibodies
against all splice variants or just one. For Kv3.1, I used an anti-Kv3.1b antibody
and for Kv3.3 I used an anti-Kv3.3b antibody, both reacting with the variable C
termini of their respective targets. Antibodies I used for Kv3.2 and Kv3.4 bind to
all subfamily members via the N terminus which is not subject to alternative
splicing, except where otherwise specified. All antibodies were assessed for
specificity using null-mutant tissue or preadsorption with antigen. The stranded
appearance of some cells was likely due to light fixation used to preserve eGFP
fluorescence for detection in the transgenics and I used light fixation as a general
protocol.

137
Figure 4.39. Kv3.2 is not detected in wildtype cerebellar cortex. (A) Kv3.2. (B) GAD67, which
marks Purkinje cells. (C) SMI-32, which marks Purkinje cells. (D) Overlay of A-C.
4.4.1. Cerebellar Cortex
Because our understanding
of Kv3 subunit expression
in fast-spiking inhibitory
interneurons in the
cerebellar cortex remained
very sketchy and I had
stained cerebellar sections
at hand I also evaluated
expression in the cortex.
4.4.1.1. Somata and Axons
of Purkinje Neurons
The only Kv3 channel
subunits detected in Purkinje cells to date at the protein level are Kv3.3b and
Kv3.4. In agreement with these results, I did not detect Kv3.1b (data not shown)
or Kv3.2 in Purkinje cells above background6 (Fig. 4.39), where fluorescence did
not differ from null-mutant or controls pre-adsorbed with antigenic peptide,
respectively. Kv3.3b was co-localized with Kv3.4 in Purkinje cells at the cellular
level using a monoclonal Kv3.4 antibody to the C terminus that may only
6 It should emphasized that negative control images and images lacking the antigen in all
cells were acquired according to the same algorithm as those with the antigen but not at
the same absolute settings, which are virtually impossible to accurately recapitulate
between sections using confocal microscopy. In all images the full dynamic range was
used. For negative controls and tissue lacking the antigen this entails setting the
strongest signal just below saturation. Consequently the background is higher. What is of
significance is the relative difference between putative signals and background, not the
absolute level.

138
recognize one splice variant (data not shown). The distributions diverged at the
subcellular level such that Kv3.4 was spread throughout the dendritic tree in
curious, almost punctate segments (see left, molecular layer, Fig. 4.40A, B and
C, as well as F throughout in the molecular layer) and minimally at the soma
whereas Kv3.3b was expressed predominantly in the soma and proximal
dendrite, becoming very low but detectable in distal dendrites marked by
calbindin as seen in wildtype (Fig. 4.40B, D, I & K) and more clearly in rescue
mice lacking expression in granule cell somata and parallel fibers (Fig. 4.2,
Figure 4.40. (above) Expression of Kv3.4 in Purkinje neurons, basket cell terminals, putative
stellate and Golgi cells in wildtype cerebellar cortex. In all panels Kv3.4 is shown in green, SMI-32
in blue and GAD67 in red. Pinceauxs are indicated by arrows; putative Golgi cells by block arrows;
putative stellate cells by downward arrowheads; Purkinje cell axons by upward arrowheads. Scale
in panel F is similar to A; D is similar to B. (A) Purkinje cells with punctate Kv3.4 staining in the
dendrites with pinceaux structures around axon hillocks. (B) Same as A. Axon shown with
arrowhead. (C) Same as A and B except more of granule layer shown with putative Kv3.4+ Golgi
cell indicated by block arrow. (D) More putative Kv3.4+ Golgi cells in the granule layer indicated by
block arrows. Punctate Kv3.4 staining is likely derived from Golgi cell terminals in synaptic

139
glomeruli also composed of mossy fibers and granule cell dendrites. A Purkinje cell axon is
indicated by the arrowhead. (E) Purkinje cell axons in the cortical white matter marked by GAD67
and SMI-32 express Kv3.4. (F) Putative stellate cells indicated by arrowheads in the molecular
layer express Kv3.4 primarily in the somatic plasma membrane.
Figure 4.41. (above) Expression of Kv3.3b in the wildtype cerebellar cortex. Scale bars are 20 µm.
A-H: Kv3.3b is visualized with green fluorescence, GAD67 with red and SMI-32 with blue. F and H
are overlays. Note the clear lack of Kv3.3b in the pinceaux brightly stained with GAD67. (A)
Kv3.3b. (B) GAD67. (C) Kv3.3b. (D) GAD67. (E) SMI-32. (F) Overlay of A, B & E. (G) SMI-32. (H)
Overlay of C, D & G. I-K: Kv3.3b is red and calbindin blue. K is overlay. Kv3.3b is enriched in the
Purkinje cell membrane. Parallel fibers account for some of the staining the the molecular layer. In
Purkinje cells calbindin is also enriched near the membrane. (I) Kv3.3b. (J) Calbindin. (K) Overlay
of I & J.
Novel observations that have not been noted thus far include the following.
Kv3.3b can be seen in presumed terminal boutons of recurrent collaterals of

140
Purkinje neurons distinguished by calbindin just below the Purkinje cell layer
manifest as sparse punctate labeling (Fig. 4.41I-J). Both subunits are distributed
evenly in Purkinje cell axons (Figs. 4.40E and 4.41A, F). In the DCN, Kv3.4, as
has been described for Kv3.3b, is concentrated at terminals on at least large
neurons (Fig. 4.42A-B). The data indicate that Kv3.4 completely overlaps in its
distribution with Kv3.3b in axons.
4.4.1.2. Granule Cells
Granule cells and parallel
fibers had Kv3.1b and
Kv3.3b expression. Kv3.2
(Figure 4.38) and Kv3.4
(Figure 4.40A-D) were
clearly absent.
4.4.1.3. Basket Cells
Basket cells are known to
be fast-spiking
interneurons and spike
brevity is sensitive to 1
Figure 4.42. Expression of Kv3.3 and Kv3.4 in Purkinje cell terminals in the DCN of wildtype mice.
(A-B) Kv3.4 is stained green, GAD67 red and SMI-32 blue. Arrows indicate Kv3.4+ Purkinje cell
terminals marked by GAD67 and SMI-32 on large DCN neurons and their proximal dendrites.
Arrowhead indicates small Kv3.4+ GABAergic interneuron. (C-D) Kv3.3b is detected as red
immunofluorescence and calbindin as blue. Large DCN neurons are indicated by asterisks and
studded with numerous Kv3.3+/calbindin+ terminals, where Kv3.3b can be clearly seen enriched in
the terminal membrane. D is a zoomed image of C.
TEA, however it was unclear whether Kv3.3 might contribute to fast
repolarization in these cells. GAD67 immunofluorescence clearly demarcates
cerebellar pinceaux formed by basket cells onto the axon hillocks of Purkinje

141
cells. Kv3.3b was absent from these structures. This does not exclude the
possibility of expression of the low-abundance splice variants or restriction of
expression to subcellular loci other than axonal plexes, but suggests that Kv3.3
most likely does not play a role in these inhibitory interneurons. I found no signal
above background for Kv3.2, and Kv3.1b expression was difficult to conclusively
exclude given the immersion in a sea of granule cells expressing this subunit.
Kv3.4 immunofluorescence, however, as reported previously, was intense in the
pinceauxs (Fig. 4.40A-C). Unless splice variants other than those detected by the
antibodies are present, these data together suggest that Kv3.4 is solely
responsible for Kv3 current in basket cells.
4.4.1.4. Stellate Cells
Like basket cells, stellate cells are fast-spiking interneurons. Although Kv3.3b is
present in parallel fibers and Purkinje cell dendrites, sections were evidently thin
enough to detect holes were stellate cells are located in sections treated with
Kv3.3b antibody (Fig. 4.41C, I, K) suggestive of an absence of Kv3.3b when
viewed against the contrast of another antigen in Purkinje cell dendrites, which
allows one to exclude labeling potentially being circumscribed to a thin halo at
the membrane. Similarly, Kv3.1b was excluded. There was no greater Kv3.2
signal in the vicinity of stellate cells above background. Kv3.4 again by contrast
appeared to be present albeit at a low level (Fig. 4.40F, at downward
arrowheads). That it was enriched in the membrane argues in favor of it being
bona fide staining, although Kv3 channels are not universally overtly enriched in
the membrane. Other types of interneurons could account for this signal however
stellate cells are by far the most numerous. Thus Kv3.3 likely does not contribute
to fast repolarization in cerebellar cortical interneurons in the molecular layer
either, whereas Kv3.4 is present as in basket cells at least in a subpopulation of
interneurons that most likely represents stellate cells.
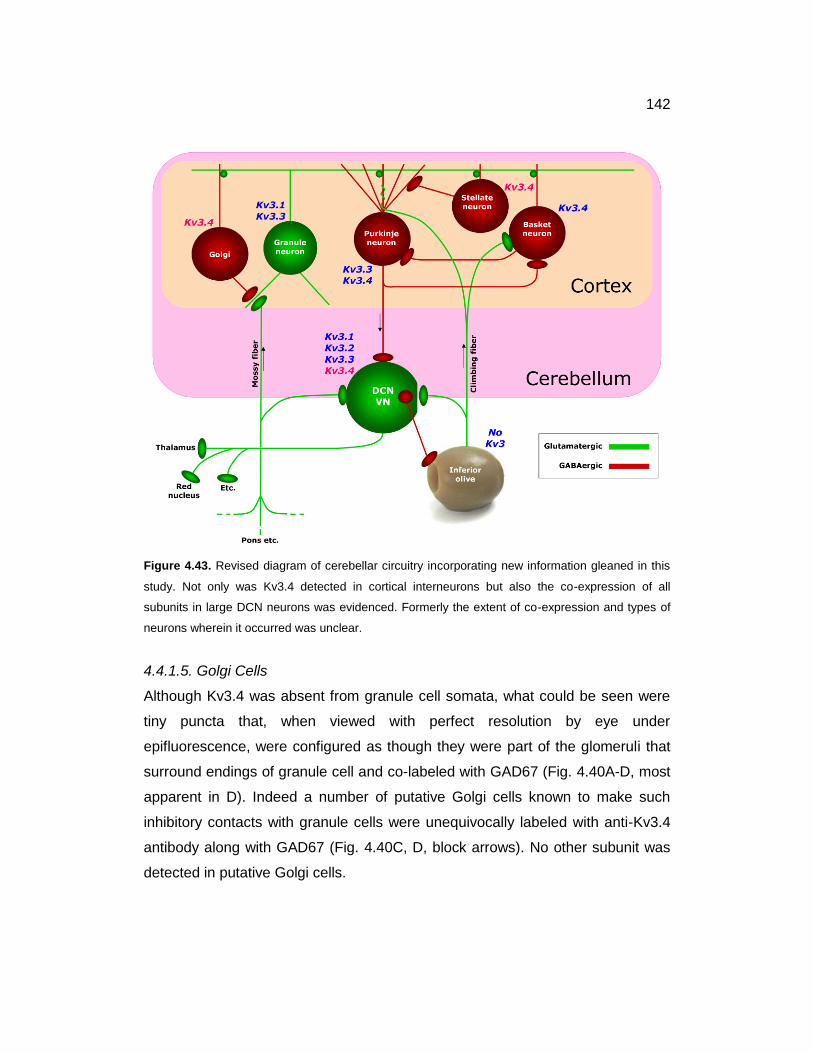
142
Figure 4.43. Revised diagram of cerebellar circuitry incorporating new information gleaned in this
study. Not only was Kv3.4 detected in cortical interneurons but also the co-expression of all
subunits in large DCN neurons was evidenced. Formerly the extent of co-expression and types of
neurons wherein it occurred was unclear.
4.4.1.5. Golgi Cells
Although Kv3.4 was absent from granule cell somata, what could be seen were
tiny puncta that, when viewed with perfect resolution by eye under
epifluorescence, were configured as though they were part of the glomeruli that
surround endings of granule cell and co-labeled with GAD67 (Fig. 4.40A-D, most
apparent in D). Indeed a number of putative Golgi cells known to make such
inhibitory contacts with granule cells were unequivocally labeled with anti-Kv3.4
antibody along with GAD67 (Fig. 4.40C, D, block arrows). No other subunit was
detected in putative Golgi cells.

143
Figure 4.44. Kv3.3b and Kv3.2
are expressed in large,
glutamatergic DCN neurons of
wildtype mice. (A-B) SMI-32 in
blue. (C-D) GAD67 in red. (E)
Kv3.3b. (F) Kv3.2. Arrows
indicate GABAergic presynaptic
terminals largely derived from
Purkinje cells. Kv3.3b localizes
to terminals but not Kv3.2,
which is absent in Purkinje
cells. (G-H) overlays of the
above panels.
4.4.2. DCN Neurons
Where host species
compatibility allowed,
subunit-specific
antibodies were used to
assess primarily co-
expression of Kv3
subunits in DCN neurons
to determine whether an
anatomical, molecular
basis exists for functional
redundancy. Previous
work found both Kv3.1
and Kv3.3 expression in
large DCN neurons but
had not directly
demonstrated co-expression. I focused principally on large neurons.
GAD67 and SMI-32 were used to distinguish small GABAergic and large
DCN neurons respectively however many small neurons are non-GABAergic. In

144

145
Figure 4.45 (above) Kv3.1b and Kv3.3b consistently are co-expressed by large glutamatergic
neurons of wildtype mice. Column A, D, G, J shows that large SMI-32+ neurons have a
characteristic appearance using Nissl staining (scale bars 50 µm). (A) Green fluorescent Nissl. (D)
SMI-32 in blue. (G) GAD67 in red. (J) Overlay of A, D & G. Column B, E, H, K shows co-expression
of Kv3.1b and Kv3.3b in large neurons and is corroborated by the experiment in column C, F, I, L
using different antibodies. (B, C) Red Nissl. (E, F) Kv3.3b in blue. (H, I) Kv3.1b in green. (K)
Overlay of B, E & H. (L) Overlay of C, F & I.
part to visualize these as well some sections were treated with fluorescent Nissl
stain (Fig. 4.45A, D, G, J).
4.4.2.1. Large Glutamatergic Neurons
The large, glutamatergic neurons were identified by SMI-32 expression (Fig.
4.45A, D). Kv3.3b was universally expressed in such neurons and never in the
small neurons sampled in this study (Fig. 4.44A, C, E, G). Kv3.3b was present in
Purkinje-cell terminals marked by calbindin (Fig. 4.42C, D). Kv3.1b and Kv3.3b
were co-expressed in all large neurons observed using fluorescent Nissl staining
(Fig. 4.45K, L). All neurons that expressed Kv3.1b also expressed Kv3.3b. This
result was confirmed with an independent pair of antibodies (Fig. 4.45L). Kv3.3b
seemed to be relatively more enriched in the membrane than Kv3.1b using the
Kv3.3b antibody with a greater signal-to-noise ratio. By deduction, therefore,
because Kv3.3b is present in all large glutamatergic neurons Kv3.1b was present
in all large, glutamatergic neurons. Unless other splice variants display a different
expression pattern, an anatomical basis for functional redundancy does exist in
large DCN neurons between Kv3.1 and Kv3.3. Kv3.3b seemed to be relatively
more enriched in the membrane than Kv3.1b using the higher-quality Kv3.3b
antibody.
In contrast to the aforementioned subunits, Kv3.2 was seen in essentially
all large DCN neurons distributed evenly over the cytoplasm (Fig. 4.44H). All
large neurons examined had Kv3.2 expression. Kv3.1b and Kv3.2 were in turn
always co-expressed in large neurons (Fig. 4.46J). Kv3.4 was similarly
expressed (Fig. 4.46K), and seemingly absent in small neurons (Fig 4.46K).

146
Finally, Kv3.3 and Kv3.4 could be seen together in large neurons (Fig. 4.46L).
Together the expression data suggest that there is a potential for functional
redundancy between all Kv3 subunits in large, glutamatergic DCN neurons
marked by SMI-32.
4.4.2.2. Small Neurons
To my surprise, I did not observe GAD67+ DCN neurons among the sections I
sampled despite vivid Purkinje cell terminal and soma labeling deep into the
sections, though I did identify some in the course of recovering Alexafluor-filled
cells from patch-clamp recordings. Molineux et al., 2006 did note that GAD67+
cells were rarely encountered at least in the medial nucleus from which
parasagittal slices are obtained for recordings.
I never found Kv3 subunits in unequivocal small neurons lacking SMI-32
other than Kv3.4 (Fig. 4.42B). The theme that emerged from my data was
expression in cerebellar neurons of potentially all Kv3 subunits in projection
neurons, most prominently Kv3.3 and Kv3.1, and in interneurons Kv3.4. The
fastest-spiking neurons invariably express Kv3.3 protein or a combination of
Kv3.3 and Kv3.1. In the cerebellum small DCN neurons and cortical interneurons
fire somewhat slower and seem to either exclusively express low levels of Kv3.4
possibly in combination with splice variants of Kv3.1 and Kv3.3, for which I only
explored expression of the abundant b variants.
Figure 4.46 (below) Kv3.1b and Kv3.2 (column A, D, G & J), Kv3.1b and Kv3.4 (column B, E, H &
K) as well as Kv3.3b and Kv3.4 (column C, F, I & L) all are co-expressed in large DCN neurons of
wildtype mice. It is likely that these are the glutamatergic neurons because of the strong correlation
that exists and distinctive Nissl staining that correlates well with SMI-32 staining in Figure 4.43J.
Large neurons are indicated by arrows. (A, B, C) Red Nissl. (D) Kv3.2 in blue. (E) Kv3.4 in blue. (F)
Kv3.4 in green. (G) Kv3.1b in green. (H) Kv3.1b in green. (I) is Kv3.3 in blue. (J, K, L) Overlays of
the panels above. The Kv3.4 monoclonal antibody used for the co-expression experiments due to
species constraints is weaker than that used in Figures 4.40 and 4.42 and binds the C terminus
subject to splice variation.

147

148
CHAPTER FIVE
Conclusions and Recommendations
The results of the behavioral, electrophysiological and anatomical, molecular
investigations support the main hypothesis that Kv3.3 expression in Purkinje cells
is involved in motor coordination and can account for the ataxic phenotype of
+/+;-/- mice. The mild ataxia specifically takes the form of hypermetria sparing
gait. In addition to spike broadening and decelerated simple spiking described
before I found that complex spikes are also markedly altered in mice lacking
Kcnc3, while loss of Kcnc1 alleles significantly affects action potentials of DCN
neurons in parallel with coordination, yielding more marked phenotypes
encompassing gait ataxia. Further, Kv3.1 and Kv3.3 are largely functionally
redundant in large projection neurons in the DCN, however despite co-
expression in these neurons, Kv3.2 and Kv3.4 by contrast do not complement
the loss of Kv3.1 and Kv3.3.
While the behavioral rescue strongly implicates Purkinje cells as a locus
where Kv3.3 exerts its effect on motor coordination, I formally show only that
expression of Kv3.3 only in Purkinje cells is sufficient for normal motor
coordination. I do not imply that it is necessary, although the rescue paradigm
suggests expression in other cell-types is unnecessary. It could be that in neural
circuitry single weak links where the channel is absent are tolerated such that
loss of the channel in any one cell type would not yield a phenotype. Expression
may be dynamically necessary, depending on the context of functioning of the
rest of the network. Future work then will have to test necessity by ablating
Kcnc3 specifically in Purkinje cells perhaps with an L7tTA-promoter driven cre
recombinase line and a floxed Kcnc3 allele, or by using a dominant negative
such as the one I created in the lab by site-directed mutagenesis prior to this
thesis project in a transgenic approach analogous to that employed here for the
rescue. The dominant negative however would also eliminate Kv3.4 current as
well. Necessity might only be revealed for the reasons mentioned above however

149
when the channel is ablated in both granule and Purkinje cells, where a negative
result ablating in just one cell type could be misleading.
5.1 RESTORATION OF KV3.3 FUNCTION IN PURKINJE CELLS CORRECTS
HYPERMETRIA IN KCNC3-NULL MICE BUT NOT GAIT ABNORMALITIES
THAT APPEAR AS KCNC1 ALLELES ARE ADDITIONALLY LOST
5.1.1. Expression of Kv3.3 Channels in Purkinje Cells Is Involved in
Coordination of Movement Velocity
Subtle but significant deficits in motor performance of unknown origin had been
described for +/+;-/- mice that became worse upon additional loss of a Kcnc1
allele and severe when both Kcnc1 alleles were lost. The deficits encompassed
normal ambulation on a force plate actometer, measured as lateral deviation, and
traversal of narrow beams without slips or falls. Motor skill learning was
unaffected, as confirmed on the rotarod. Here, through restoring Kv3.3
expression exclusively in Purkinje cells, I was able to demonstrate a full recovery
of function in +/+;-/- mice, and a partial rescue in +/-;-/- mice, establishing Kv3.3
function in this cell type as important for motor coordination and in the null
phenotype. Other phenotypes present, including twitching, were not rescued
arguing that expression in Purkinje cells was specifically related to coordination
and that twitching did not interfere with beam performance. Testing this main
hypothesis regarding function in Purkinje cells represented a significant step
forward because then I then knew where to characterize electrophysiological
changes that might explain how Kv3.3 expression supports motor coordination,
bridging the gap between gene function at the molecular level to behavior.
5.1.2. Kv3.3b Delivered by A Transgenic Line Is Sufficient to Rescue
Behavior

150
Selectively replacing the Kv3.3b splice variant intriguingly sufficed to rescue
motor coordination completely in +/+;-/- mice despite the existence of several
other splice variants, some of which even affect the coding region. In one respect
it is not surprising. Kv3.3b is the most abundant variant in terms of mRNA level.
Nonetheless it begs the question of what the function of the others might be.
Evolutionarily speaking, it is possible that the function of these variants is
redundant with Kv3.4 which is still expressed in null mice or they exist by chance,
not having yet evolved a function.
It is also interesting that the level of expression in rescue mice did not
either perturb cell function due to excess levels or fail to rescue function due to
insufficient levels in both the 396 and 313 independent lines. The high-molecular
weight bands on the Western blot and intensity of immunofluorescence when
rescue mice were compared to wildtype mice suggested overexpression7.
Moreover mean values for the spike width and spontaneous frequency alluded to
a possible subtle gain-of-function but differences were not significant. This
observation is of interest in terms of how ion channels are regulated. Limited
essential docking sites for functional insertion at the plasma membrane or
auxiliary subunits or posttranslational modification might delimit the amount of
actual current regardless of the level of translation. Injection of simulated Kv3
current from a point source at the soma in fast-spiking interneurons was capable
of rescuing fast repolarization during blockade of channels by TEA and excess
Kv3 current initially accelerated but then blocked firing beyond a certain
magnitude (Lien and Jonas, 2003). With genetic restoration throughout the cell
either I was lucky with the level produced by the two lines or Purkinje cells are
able to put a ceiling on Kv3 current.
Another noteworthy observation was that the 313 line, in spite of some
mosaicism and variability in its extent, nevertheless rescued behavior. The
7 If excess protein is retained in the endoplasmic reticulum, glycosylation may not be
properly removed, resulting in an increase in molecular weight and corresponding upward shift on a gel.

151
rescue is not inconsistent with reports that rodents must lose >90% of Purkinje
cells before there is any sign of motor impairment, at least on the rotarod (Martin,
Goldowitz and Mittleman, 2003). Innervation of individual DCN neurons by
multiple Purkinje cells is consonant with this, for as long as DCN neurons are
sufficiently plastic to modulate responsiveness to inhibition, synapses made by
surviving Purkinje cells might conceivably suffice. A rescue inspite of mosaicism
also suggests the null mice lack firing properties necessary for normal function
rather than that the abnormal firing actively disrupts normal function. Clearly, that
the +/+;-/- mice were by all accounts fully rescued indicates that the mosaicism
does not confound but rather strengthens my conclusions, for the rescue is
evident even without 100% of Purkinje cells being restored. If only a few Purkinje
cells expressed the transgene it would suggest however the rescue is related to
an insertional mutation or background gene linked to the transgene insertion site.
Though I did not determine the chromosomal location of the insertions, that both
the 313 and 396 lines produced a rescue argues against this.
5.1.3. Hypermetria Is the Deficit Rescued in Kcnc3-Null Mice
The subtle phenotype of +/+;-/- mice afforded an invaluable opportunity to
correlate specific changes in action potentials related to Kv3 expression, and in
doing so, Purkinje cell firing, to a specific aspect of motor behavior. Although the
effects of loss of Kv3.3 on Purkinje cell spiking are several-fold, because high-
frequency spiking is most acutely affected the behavioral deficits might at least in
large part reflect the role of complex spikes. Regardless of what specific aspect
of Purkinje cell output is involved, observing what facet of motor coordination
disappears first with a subtle alteration in spiking might uncover the main
essence of the function of Purkinje cell output along with that of Kv3.3 in these
cells. Given the above, I set out to systematically determine the specific origin of
the deficits.

152
Ataxia is commonly thought of in the sense of gait ataxia. Investigators in
the past have casually referred to ataxia presumably reflected in increased lateral
deviation as abnormal gait. Here I tested explicitly whether gait was altered and it
was actually normal in +/+;-/- mice using both a treadmill at high speed and the
self-paced footprint test. Gait did show one type of abnormality in +/-;-/- mice,
paw discordance, however these mice were only partially rescued on the plate
and 1-cm beam. Moreover the paw discordance was not rescued by replacing
Kv3.3b in Purkinje cells. Another explanation for increased lateral deviation on
the force plate could be excessive force applied during steps side-to-side
because the mouse is subtly tipping over during ambulation to an extent invisible
to the eye due to defective maintenance of posture and balance. To directly test
this, I conducted a pilot experiment using a novel test, the rocking ball, which
incorporates an opportunity to observe swimming ability. That +/+;-/- mice were
capable of performing this difficult task demanding rapid, fine postural adjustment
based on vestibular and visual feedback as well as swim suggested balance and
posture are intact. Although the test was pilot in nature, other more direct
qualitative observations are congruent with the hypermetria hypothesis.
During swimming and on the beam, +/+;-/- mice manifested a striking
tendency to make jerky kicking movements rather than exhibit smooth,
coordinated acceleration and deceleration of movement with precision and
finesse. Swimming and regaining of footing on the beam seemed to be impaired
by this. Mice kick when trying to place their hind feet back on the beam and jerky
movement would be expected to increase the chance of slipping, since mice
grasp the side of the beam mostly when walking across. I also tested whether
grip strength was normal and it was fully intact even in +/-;-/- mice that had worse
lateral deviation and more beam slips. Taken together, the qualitative and
quantitative data point to hypermetria, an abnormality prominent in cerebellar
ataxia.
Other investigators suggested that beam performance might be affected
by anxiety. The posture of mice was perturbed on the beam and this was

153
remedied by anxiolytic drugs which reduced slips (Lepicard et al., 2003). The
+/+;-/- mice have not been tested for anxiety, and the cerebellum is involved in
many brain functions, not just motor function. Novel environments are anxiogenic
in rodents especially out in the open in bright light, as in the beam test. Indeed,
often mice freeze on the beam but don‟t appear startled. A rescue of increased
anxiety likely does not explain the results here though. Habituation likely
progressively decreases anxiety on subsequent days of the beam test. The
difference between null and rescue mice is not significant on individual days until
the last two days, and by two-way ANOVA the rescue mice are still different from
wildtypes taking all five days into account probably because of performance on
day 1 chiefly which resembles that of null mice (Fig. 4.5). If increased anxiety is
present in the null mice, it likely involves neuronal cell types other than Purkinje
cells since poorer performance at the outset is not rescued and, importantly, one
would expect improvement to be more marked at a time when anxiety is greater,
unless it is a partial improvement that is only full when anxiety is diminished by
habituation. Further support comes from the observation that wildtype mice are
different in terms of kind rather than degree; wildtypes do not exhibit any of the
jerky kicking episodes ever even on day one when they perform at their worst
and are presumably most anxious over the novel test situation. This distinction
was clear with the +/-;-/- mice where kicking bouts were more frequent. The
reason they can be seen at all in rescue mice could stem from the fact that
parallel fibers still lack Kv3.3.
The seemingly increased slipping on the training days that improves with
learning and habituation in rescue and null mice could arise from a persistent
lack of Kv3.3 in parallel fibers that learning eventually compensates for
completely. The synapse made by parallel fibers onto Purkinje cells is highly
plastic and this plasticity is thought to pertain to motor skill learning, primarily
through LTD, which is normal even in -/-;-/- mice. It may be that LTD can
gradually tune down this synapse to compensate for the increased glutamatergic

154
drive inferred from decreased paired-pulse facilitation, allowing the rescue of
Purkinje cell Kv3.3 function to become evident on later test days.
Since beam performance is worse when the beam is novel another factor
that may contribute is modulation. The cerebellum is innervated by monoamines
such as norepinephrine which is influenced by behavioral state. Increased
norepinephrine during anxiety could well alter the extent of the expression of the
null phenotype at the cellular level.
5.1.4. Additional Loss of Kcnc1 Leads to Gait Abnormalities
Kv3.1 is not expressed at the protein level in Purkinje cells but is present
upstream in granule cells and downstream in large, glutamatergic DCN neurons.
Interneuronal expression remains obscure but when detected appears to involve
only a subclass in the DCN. In the case of parallel fibers, loss of individual Kcnc1
alleles leads to significant but mild electrophysiological changes yet no significant
behavioral changes on the beam or plate in mice solely heterozygous for Kcnc1
or double-heterozygous mice that also lack a Kcnc3 allele. Both beam
performance and lateral deviation worsen when Kcnc3 is absent in mice
heterozygous for the Kcnc1 allele, unmasking a haploinsufficiency effect.
Mice just lacking Kcnc3 or heterozygous for the Kcnc3-null allele did not
have abnormal gait, however upon additional loss of one allele of Kcnc1, Kcnc3-
null mice exhibited paw discordance. Thus at some cellular locus, a reduced
Kcnc1 gene dosage is consequential for gait as well. The -/-;-/- mice completely
lacking Kcnc1 had by contrast all the characteristics of gait ataxia found in
cerebellar ataxia. The gait aberrations are unlikely to be entirely explained by
myoclonic jerks, tremors or twitches in -/-;-/- mice for the jerks, though of great
magnitude, occur at a frequency lower than that necessary to account for altered
gait and the other motor phenotypes do not produce deviations in paw placement
of sufficient amplitude. These data suggested that Kcnc1 is in large part
functionally redundant with at least Kcnc3 in one or several neuronal cell-types,

155
likely in the cerebellum or downstream in the motor circuitry. The same may be
true of hypermetria but it is difficult to directly measure once gait abnormalities
complicate the picture. Severe hypermetria might be capable of influencing gait
pattern as well, at least paw discordance. Stride length, stance width and the
relative timing of limb movement manifest in gait alternation as well as veering
probably do not arise merely from jerky, hypermetric movements originating in
uncoordinated movement speed, but a contribution cannot be categorically
excluded.
5.2. COMPLEX SPIKES ARE ALTERED IN KCNC3-NULL MICE AND
PURKINJE CELL FIRING IS RESTORED IN RESCUE MICE
The rescue of wildtype behavior highlighted Kv3.3 expression in Purkinje cells as
important functionally in motor coordination. The most parsimonious explanation
is that this occurs through the electrophysiological effects of the channel protein,
so, with a relevant cell-type elucidated, I sought to characterize candidate
electrophysiological mechanisms whereby Kv3.3 functions that could be involved
in motor coordination. Previous investigations had revealed spike broadening
and decelerated spontaneous firing of simple spikes in slices of +/+;-/- mice
despite the co-expression of Kcnc4 at the soma. I replicated these results and
expanded our understanding by evaluating effects on high frequency firing,
exploring the F-I relation, and eliciting climbing fiber responses. I found that
complex spikes are more profoundly altered than simple spikes. The behavioral
rescue was accompanied by a full restoration of Purkinje cell spiking parameters
to those found in wildtype mice. In sum, I highlighted complex spikes as a
potential contributor to the null phenotype, specifically hypermetria, in addition to
spike broadening and slower simple spiking in vitro. Kv3.3 channels therefore
function in regulating movement speed in Purkinje cells by supporting spike
brevity and high-frequency firing, most markedly in the case of complex spikes.

156
5.2.1. Complex Spikes Are Altered in Kcnc3-Null Mice
My in vitro, intracellular brain slice recordings confirmed that spikes are doubled
in their width at half height and that the spontaneous simple spike frequency is
reduced by ~30%. Broader spikes would be expected to acutely increase
synaptic depression at Purkinje cell terminals in the DCN (see section 5.4.1), as
well as at synapses made by collaterals on cortical interneurons and other
Purkinje cells. Inhibitory drive would increase early in a train or an acceleration of
simple spiking and then decrease below that of wildtype mice after augmented
depression set in. The lower frequency though would mitigate this effect since
depression occurs more slowly at lower frequencies. It is very difficult to posit
what the net effect might be of losing Kv3.3 in vivo. Parallel fibers undergo
increased paired-pulse facilitation as Kcnc3 alleles are lost, suggesting increased
excitatory drive due to enhanced glutamate release onto Purkinje cells. Phasic
increases in granule cell firing rate could thereby overcome the intrinsic tendency
of Kcnc3-null Purkinje cells to fire at slower rates, driving them to perhaps fire at
even higher rates. Future work should evaluate this in vivo.
At the resting potential and hyperpolarized potentials the number of
spikelets in complex spikes was reduced by half or eliminated, respectively, while
the intraburst frequency measured from the first interspike interval was only one-
third that of wildtype mice in Kcnc3-null mice. Complex spikes were thus more
affected than the simple spike rate. High-frequency firing, assessed by a plot of
frequency as a function of injected current, was relatively more affected than low-
frequency firing. Consistent with the explanation that an impairment in high-
frequency firing produces the deficits in complex spikes rather than an alteration
primarily in the underlying waveform, current injections simulating complex
spikes could not elicit the high intraburst frequency or higher number of spikelets
characteristic of wildtype mice in null mice.

157
Intriguingly, the post-complex spike pause that is also seen in vivo is
longer in Kcnc3-null Purkinje cells. The pause is expected to produce
synchronized disinhibition of DCN neurons after complex spikes that could
facilitate rebound depolarization (see section 5.4.2). It could also impact effects
of Purkinje cell collateral input onto other Purkinje cells and interneurons, an
effect that may be difficult to study in slices because the connections are likely
severed in most cases.
I did not observe bistable shifts between up and down states toggled by
climbing fiber stimulation as McKay et al., 2007 did in rat using K-gluconate
internal. In all my recordings I only saw this behavior once in a pilot study not
included here. Based on in vivo data, only a subset of Purkinje cells may be
prone to this. The propensity to shift Purkinje cells between states, if they do
prove to be physiological, might be an interesting topic for future research. When
Dr. McKay and I tried K-gluconate in mouse slices Purkinje cells were very prone
to calcium spiking and less stable however.
In light of their use as normal controls in the behavioral studies of +/-;-/-
mice, mice heterozygous for the Kcnc3-null allele were normal with regard to all
Purkinje cell spike parameters. Again, the firing correlates to the motor
phenotype. Evidently there is no haploinsufficiency in this cell type when one
Kcnc3 allele is ablated. Also, one Purkinje cell from a rescue mouse from the 396
line was indistinguishable from those of the 313 line used for analysis.
The laboratory of Dr. Bernardo Rudy was also investigating changes in
climbing fiber responses in +/+;-/- mice simultaneously however that lab focused
on the dendrite and at the soma only examined responses at a hyperpolarized
potential. My manuscript reports data collected at the resting potential because it
is more pertinent to the behavioral rescue but Zagha et al., 2008 made
extracellular recordings in vivo (Zagha, Lang and Rudy, 2008). Our results were
in agreement, with minor differences likely due to the difference in the ages of the
mice. Namely, there were more spikelets in their wildtype mice probably because
the input resistance should be higher in young mice extrapolating from the

158
maturation curve in rat slices reported by (McKay and Turner, 2005). Another
factor is my use of K-methylsulfonate in my internal solution rather than K-
gluconate, which blocks channels more and thereby raises the input resistance
(Velumian et al., 1997). My use of K-methylsulfonate is if anything closer to
natural conditions relevant to behavior.
Another study using K-gluconate in this case in young rat slices found
that partial blockade of Kv3 channels at a dose of 150 μM that is ostensibly
specific but not calcium-activated potassium channels led to the emergence of
sodium-calcium spike bursts that were more intense at 1 mM (McKay and
Turner, 2004). Although I could elicit bursting with TEA in adult mouse slices of
+/+;-/- mice, I did not see these bursts at baseline in null mice, suggesting
another mechanism was yet at play. Moreover, complex spikes, which are
distinct, synaptically generated bursts that are partly sculpted by calcium currents
were not augmented in the null. The effect McKay and Turner observed thus
does not appear to bespeak of a general function of Kv3.3 in suppressing all
types of bursts.
5.2.2. Normal Purkinje Cell Spiking Is Rescued by Restoring Kv3.3b to
Purkinje Cells
Purkinje cells from rescue mice exhibited a concomitant cellular rescue of all
spike parameters that were disturbed by ablation of endogenous Kcnc3,
including spike width, spontaneous simple spike frequency, the F-I relation, and
all aspects of complex spike firing including the lengthened pause that follows.
Additionally responses to current injections simulating complex spikes returned to
normal, suggesting the rescued abnormality is high-frequency firing rather than
development of climbing fibers or other effects. The rescue could be reversed by
TEA consistent with the notion that it was mediated by re-expression of the Kv3-
type channel. Also, the diminution of the burst by TEA runs counter to the notion

159
that Kv3.3 suppresses bursts in general suggested by the effect on sodium-
calcium spikes.
I was surprised that harmaline-induced tremor did not return in +/+;-/-
mice with complex spikes rescued in Purkinje cells by Kv3.3. This result might
entail that Kv3.3 must also be rescued downstream of the DCN in red nucleus
neurons to adequately convey the synchronized output to effect movement or the
GABAergic neurons of the DCN that close the olivo-cerebellar loop. Although
these cells spike slower than the large, non-GABAergic neurons they are still
fast-spiking by whole-brain standards and Kv3.3b has been reported to be
expressed in some of them (Grandes et al., 2008).
5.3. FIRING IN DCN NEURONS DOWNSTREAM IS ALTERED UPON
ADDITIONAL LOSS OF KCNC1

160
Figure 5.1. (above) The severity of gait ataxia correlates strikingly well with changes in the intrinsic
firing properties of large glutamatergic DCN neurons.
In order for the rescue of Purkinje cell spiking to correct behavior presumably
DCN firing must be normal in +/+;-/- mice. Also, it was not clear whether Kv3.1
and Kv3.3 might be functionally redundant in large glutamatergic DCN projection
neurons. I recorded these neurons in +/+;+/+, +/+;-/-, +/-;-/- and in -/-;-/- mice. A
graded slowing of action potential repolarization was evident as alleles were lost
that was not quite significant in mice just lacking Kcnc3, suggesting that indeed
DCN output is intact in single-null mutant rescue mice that achieve a full rescue
of motor performance and lack gait abnormalities. Spikes were significantly
broader in +/-;-/- mice that had only a partial rescue and a subtle gait
disturbance. There was a considerable step up in spike width once both Kcnc1
alleles were lost in -/-;-/- mice, which did not benefit at all from the rescue
upstream in Purkinje cells and acquired the full spectrum of cerebellar gait ataxia
(Fig. 5.1). The intrinsic firing properties mirror the gait phenotype and
effectiveness of the Purkinje cell rescue, indicating that intrinsic changes in large
DCN neurons in the cerebellum could underlie the gait phenotype and potentially
explain why the rescue depends on the presence of Kcnc1 alleles.
5.3.1. Action Potential Properties of DCN Neurons Become Significantly
Altered As Kcnc1 Alleles Are Ablated
Large, weak-burst DCN neurons of +/+;-/- mice had normal spike widths and
decay times but the height of action potentials was significantly greater than that
of wildtype mice. The p values for these parameters were suggestive of the
possibility that a difference might surface with a larger sample size. Nonetheless
the data indicated that action potentials are more or less normal in +/+;-/- mice,
consistent with the notion that DCN spiking should be intact for the rescue of
Purkinje cells to be expressed behaviorally. Additional lack of a Kcnc1 allele
broadened, heightened and slowed the rise and decay of action potentials, while

161
the lack of both Kcnc1 alleles led to much greater differences. The spike width in
-/-;-/- mice doubled relative to +/+;+/+ mice, whereas in +/+;-/- mice additionally
lacking just one Kcnc1 allele the width was 50% broader, changes that parallel
both the loss of rescue efficacy and the appearance of gait ataxia. Spike
broadening can have a non-linear effect on transmitter release if present also at
axon terminals, for there is a third to fifth order dependence of transmitter release
on calcium influx. If augmented transmitter release is a critical variable then in
this respect the perhaps disproportionately lesser phenotype of Kcnc3-null mice
with one wildtype Kcnc1 allele (50% vs. 100% broader), and absence of a
phenotype in Kcnc3-null mice with Purkinje cells rescued (~25% broader, if a
larger sample shrinks the error without changing the now uncertain but almost
significant mean), is sensible and does not argue against changes in the DCN
accounting for the more marked phenotypes as Kcnc1 alleles are lost.
Mechanistically speaking, the action potential rise time should have
slowed significantly as spikes broadened but did not. Kv3 channels accelerate
spike frequency ultimately by increasing the number of available, deinactivated
sodium channels to reach threshold more readily. Concurrently the rate at which
further sodium channels are recruited increases, in theory hastening the rise
time. Perhaps because Kv3 channels open very quickly and have a large
conductance, the fraction of channels that manages to open during the rise of the
action potential is able to slow it slightly in wildtype mice. A reduction in Kv3
current magnitude in null mutants could potentially remove this stalling influence,
thereby permitting the action potential rise time to decrease, canceling the
stalling effect of fewer sodium channels being available to activate.
5.3.2. High-Frequency Firing of DCN Neurons Becomes Significantly
Altered As Kcnc1 Alleles Are Ablated
I strongly expected to see a decrease in the spontaneous spike rate in large DCN
neurons in the mutants that had significantly broadened spikes. The spike rate is

162
indeed lower but statistical significance is only reached using intracellular
recording with these sample sizes in -/-;-/- mice. At higher frequencies induced
by current injection as revealed by the F-I plot pilot data from a small sample
indicated DCN neurons from -/-;-/- mice showed a significant slowing. The slope
of the plot was less in +/-;-/- and -/-;-/- mice with the p value on the cusp of
statistical significance. As in Purkinje cells, the data pointed to a more marked
deficit in high-frequency firing. In DCN neurons the spike frequency is higher
during EPSPs and rebound depolarization following IPSPs. Transient-burst large
neurons are apt to produce the highest frequencies during rebound bursts. My
limited sample suggested spike properties of these neurons are affected in
parallel with those of weak-burst neurons. Climbing fibers innervate DCN
neurons as well but do not produce EPSPs of the same magnitude as with
Purkinje neurons. Consequently, burst output of large DCN neurons would be
diminished to an even greater extent than tonic excitation of downstream target
neurons in the red nucleus and ventral thalamus. Of course the net effect of this
combined with greater glutamate release is a potentially interesting topic for
future empirical studies as the answer is non-intuitive.
I also examined the coefficient of variance of the interspike interval, a
property that is disrupted in ataxic calcium channel mutants in Purkinje cells but
normal in these neurons in +/+;-/- mice. Even in -/-;-/- mice which had the highest
mean the difference was not even close to significant.
Together the spike data in the DCN elegantly track the changes in gait
that appear as Kcnc1 alleles are lost and offer an explanation as to why the
rescue can occur without Kcnc3 in DCN neurons but not without Kcnc1 on a
Kcnc3-null mutant background. Nevertheless alternative explanations exist and
data for gait are only correlative. Parallel fibers also show graded changes in
spike width and input to Purkinje cells as Kcnc1 alleles are lost. The profile of this
graded trend however does not match the behavioral deficits as well as that of
DCN spike properties. Between mice lacking Kcnc3 additionally lacking a Kcnc1
allele and -/-;-/- mice there is a big jump in severity. This mirrors the considerable

163
broadening of large DCN neuron spikes better than the incremental increase in
parallel fiber input to Purkinje cells seen as Kcnc1 or Kcnc3 alleles are lost.
Downstream of the DCN, neurons in the ventral thalamus are likely unaltered
because they chiefly rely on Kcnc2. It is not clear what Kv3 subunits the fast-
spiking intralaminar and midline nuclear thalamic neurons express. An alternative
candidate locus that cannot be ruled-out is the red nucleus in the midbrain where
mRNA for all subunits has been reported but the fine cellular distributions of the
channel proteins have yet to be described. On functional neuroanatomic grounds
neurons within the cerebellum are the most likely candidates based on what is
known from lesion studies to date since ataxic gait characteristic of cerebellar
ataxia has only been reported after cerebellar lesions to my knowledge.
The ability of disruptions in DCN neuronal spike rate in general and
impaired repolarization to elicit ataxia is evident in the report by Shakkottai et al.,
2004, where although the red nucleus was also directly affected ataxia best
tracked changes in the DCN.
5.4. INPUT TO DCN NEURONS FROM PURKINJE CELLS IS ALTERED IN
KCNC3-NULL MICE
In these pilot studies I endeavored to discern what aspects of Purkinje cell input
to DCN neurons is rescued and in turn related to hypermetria. For Purkinje cell
activity to impact motor skills it must change DCN output, or vestibular nuclear
output to the extent the task requires maintaining balance. Of particular interest
was the question of whether complex spike changes wrought by the Kcnc3-null
mutation are consequential for DCN output. This is primarily a section indicating
future directions.
5.4.1. Synaptic Depression

164
Pilot data were consistent with increased synaptic depression in +/+;-/- mice.
Only one rescue recording suggested normal depression may not be rescued by
Kv3.3b restoration. If we assume this is variation about a mean and that normal
depression was rescued, hypermetria could result from enhanced depression.
Synaptic depression is believed to render the Purkinje cell-DCN neuron synapse
more responsive to sudden changes in the frequency of input than steady
inhibition. Despite the fact that broadened spikes would release more GABA
acutely after a period of Purkinje cell silence or low-frequency spiking, once
depression develops the overall tonic inhibition would be reduced. It is tempting
to speculate that a synapse that overreacts to changes in input might amplify the
effect of slight changes in Purkinje cell spiking triggered by parallel fibers and
ultimately mossy fibers to cause hypermetric movements that would otherwise
occur at a normal rate of acceleration and deceleration once the target limb
position is reached.
The study by Sausbier et al., 2004 of mice lacking a large-conductance
calcium-activated potassium channel gene also found spike repolarization
deficits in Purkinje cells. In DCN neurons from these mice increased synaptic
depression of input from Purkinje cells was observed along with ataxia.
Decreased inhibition due to depression of inhibition by Purkinje cells of DCN
neurons would presumably increase the frequency of firing. An increased firing
rate of DCN neurons was also seen when a small conductance calcium-activated
potassium channel was ablated functionally by a dominant negative approach. It
is plausible that in all cases DCN output is increased in terms of spike rate, an
effect that may be compounded by the fact that spikes are broadened, increasing
glutamate release. Aberrantly increased DCN output to the red nucleus disrupts
critical pauses in activity in animals lacking all inhibition from Purkinje cells
(Tarnecki, 2003) suggesting this as a tenable mechanism.
The inability of restoring Kv3.3b to Purkinje cells to rescue coordination in
-/-;-/- mice could parsimoniously result simply from DCN neuronal output being
disrupted by spike broadening. If depression is greater without Kv3.3 and normal

165
with the rescue, rescuing input from Purkinje cells could actually make the -/-;-/-
worse paradoxically. The tendency to spike slower in large -/-;-/- DCN neurons
could be improved actually, at least during tonic inhibition at rest, by reducing
inhibition by Purkinje cells. Increased steady-state depression then could actually
mitigate dysfunction in -/-;-/- neurons, complementing the deficit. Unless there is
a ceiling effect this is probably not true or inconsequential for DCN output
ultimately in -/-;-/- mice because -/-;-/- rescues do not perform worse than -/-;-/-
mice.
Augmented depression could also impact complex spikes. Since
depression increases with increasing firing rates, high-frequency inputs during
complex spikes might be diminished. Such an effect would be expected to
attenuate the difference in complex spike instantaneous frequency between
wildtype and +/+;-/- mice in terms of inhibiting DCN neurons.
Another attenuating influence might be the Purkinje cell axons
themselves, as discussed in detail in the introduction (see section 1.3). We do
not know whether Kv3.3b contributes to axonal propagation or is just in transit to
axon terminals. Purkinje cell axons are myelinated and Kv3.3b does not show
any enrichment in nodal structures. Moreover in wildtype murine and rat slices
these axons do not reliably propagate sustained, high-frequency action potentials
in the range attained by complex spike bursts. Though it may be that converging
innervation by many Purkinje cells of DCN target neurons allows them to
effectively experience burst input even though only a fraction of Purkinje cells
propagate at any given latency after the first initial spike, the low-pass filtering
effect of the axon might attenuate or erase the difference between +/+;-/- and
wildtype complex spikes. The function of Kv3 channels in axonal propagation is a
fertile future avenue of inquiry.
5.4.2. The Effect of Altered Purkinje Cell Input to the DCN on DCN Output

166
Here I was able to determine that the complex spike alterations except for the
lengthened pause are unlikely to impact the DCN in a physiological context even
if synchronized. Further, it was apparent that the lower frequency of Purkinje cell
output in slices will disinhibit DCN neurons all other things being equal. The
decreased simple spike frequency reduced DCN inhibition whether +/+;-/- or
wildtype Purkinje cell axons were stimulated, but future work will have to
determine with a very large sample size whether the net effect of spike
broadening and a decreased spike frequency is to hyperpolarize or depolarize
DCN neurons. Acute pharmacology may be misleading as to what is happening
in the genetic model because of long-term adaptations that are known to take
place in the DCN when deprived altogether of Purkinje cell-mediated inhibition.
To better recapitulate the in vivo situation I stimulated Purkinje cell axons
after a simulated simple spike train that allowed steady state synaptic depression
to be established, as in vivo Purkinje cells typically are spiking except during
short pauses after complex spikes and occasional, longer pauses. By the time
the simulated burst input of either wildtype or +/+;-/- mice reached the synapse
the depression or other factors prevented any noticeable temporal summation of
evoked IPSPs. During the pause however recovery from inhibition, in part driven
by the accumulated rebound depolarization depolarized the membrane, led to at
most one spike. Delivering stimulation at a frequency simulating that of mice
lacking Kv3.3 in Purkinje cell axons compared to the corresponding wildtype
frequency, the simulated longer pause seemed to increase the chance of a spike
occurring as well as more significant recovery from inhibition that was not
restored after the pause in either genotype. The complex spike input seemed to
allow the DCN neuron to escape tonic hyperpolarization, which the ensuing
simple spikes could not restore presumably due to depressed input. Based on
these slice data the changes in complex spike bursts are virtually inconsequential
while the pause might actually have an impact on DCN firing. According to some
theoretical conceptions the pause could well be more important to the DCN than
the complex spike burst (Armstrong, 1974).

167
The above conclusion on complex spikes is subject to the caveat that
DCN neurons receive inhibitory contacts from ~30 Purkinje cells in rodents.
Although I did deliver synchronized stimulation as might occur during certain
behaviors in vivo, I cannot fully recapitulate the total number of inputs in 300 µm
slices. Future work should address this question in vivo. Nonetheless it is difficult
to imagine the input being robust if synapses are already depressed by prior
simple spiking, suggesting complex spikes must occur after pauses or significant
decelerations in Purkinje cell activity.
Under in vivo conditions neurons typically have a higher input resistance
than in vitro and are subject to modulation by diffuse input from monoaminergic
systems among others. The membrane potential is as a result more dynamic. As
I saw in one GABAergic cell with a high input resistance, burst input from
Purkinje cell axons, in that case after a baseline of silence, can toggle DCN
neurons potentially between up and down states. In both Purkinje cells and DCN
neurons complex spikes may function as a mechanism whereby cells are shifted
between bistable states.
One aspect of complex spike function that has received much speculation
and experimental attention is in timing. In +/+;-/- mice the ability of complex
spikes to time DCN neuronal activity is likely unaltered based on my slice data
where the pause remains and is if anything enhanced in its impact on DCN
neuronal firing. Though I found movement velocity control was altered, a posited
function for complex as well as simple spikes (see section 1.3), my work on the
DigiGait™ and Rotarod suggested faster speeds did not differentially affect
Kcnc3-mutant mice.

168
The ability of the complex spike to control fine timing of movement has
Figure 5.2. Simple spikes following complex spikes in the same cell are remarkably consistent in
their phase. If this is true under some conditions across multiple Purkinje neurons it could
powerfully synchronize simple spikes across the population after the occurrence of synchronized
complex spikes. Here, an overlay of 5 traces is shown from a Purkinje cell stimulated at the notch
in the middle of the lower trace.
been contested on the grounds that the low frequency of complex spikes (~1-4
Hz) is not fast enough to shape rapid movements. During my analysis of complex
spikes at the resting potential I noticed that in overlays of 5 traces of climbing
fiber stimulation simple spikes following complex spikes occurred at remarkably
similar intervals (Fig. 5.2). If one imagines if these traces represented 5 different
Purkinje neurons in a similar state of depolarization and modulation with similar
input resistances it immediately becomes clear that the complex spike may not
need to be elicited more frequently than 1 Hz to influence the timing of simple
spikes up to 300 milliseconds later, at least in the slice. The recently described
gap-junction mediated synchronized fast oscillations among Purkinje cells
entrained by recurrent collaterals could help extend the duration of phase setting
longer, allowing the simple spikes to ride on a harmonic of the fast oscillation.
Also synchronizing simple spikes through persistent phase-locking might have
169
pivotal effects on DCN neurons since it would create windows during which the
DCN neurons could fire action potentials also in synchrony, increasing the
strength of output, in contrast to a tonic IPSP that would suppress output. If the
complex spike can actually trigger large IPSPs under some conditions as
suggested by some in vivo recordings where complex spikes were triggered by
stimulation these too might be capable of temporal entrainment across DCN
neurons if synchronized. If these in vivo recordings are representative of
conditions where complex spikes can occur spontaneously and complex spikes
in converging Purkinje cell terminals indeed elicit strong IPSPs this could be
weakened in null mice. It is clear though that in null mutants such a phase-setting
effect would persist. There was no indication of increased variability of the overall
duration of the complex spike and pause that could disrupt it.
Although complex spikes are more affected than simple spikes, spikes
are broadened in both cases and the results here only indicate that complex
spikes are a potential mechanism through which Kv3.3 functions in motor
coordination. The above data suggest only, and weakly given the caveats of
slices, that the spikelet changes are superfluous. It is likely impossible to
extricate effects of Kv3 on complex and simple spikes by other than correlational
means. Changes in simple spike frequency, if they exist in vivo with inferred
augmented parallel fiber drive in +/+;-/- mice could however be extricated from
broadening perhaps by using Kv4 channels via a transgenic or gene transfer
approach which, when overexpressed, decelerate spiking and, when blocked by
a dominant negative, accelerate spiking leaving spike width more or less
unaffected. The SCA13 mutation that slowed deactivation would be expected to
for the most part just affect spike rate without broadening spikes and sufficed to
cause ataxia. This result suggests simple spike rate may contribute to motor
coordination. However the dominant negative would likely decelerate spiking in
many other neurons by removing all Kv3 function not just Kv3.3 which seems
uniquely essential for narrow spikes in Purkinje cells based on what neuronal
cell-types have been recorded so far. The finding of decelerated spiking in SCA1

170
is interesting in this regard as well but again there is no cell-type specificity to be
sure it is attributable to Purkinje cells.
5.5. CO-EXPRESSION OF KV3 SUBUNITS DOES NOT IMPLY FUNCTIONAL
REDUNDANCY
Functional redundancy has been invoked in the past to explain the mild
phenotypes of the Kv3 single-null mutants in sharp contrast to the severe
phenotype of the -/-;-/- mice. Early anatomical data relying on in situ hybridization
suggested co-expression and potential heterotetramerization of subunits might
be widespread. The cerebellar ataxia of mice lacking Kcnc3 alone or along with
Kcnc1 alleles highlights neuronal cell-types in the cerebellum as likely cellular
loci where functional redundancy explains the increased severity once Kcnc1 is
lost. Previous studies had not directly demonstrated co-expression of Kv3.1 and
Kv3.3 in large, glutamatergic neurons. I found that these subunits were indeed
co-expressed in all large, glutamatergic neurons marked by SMI-32 expression,
indicating that Kv3.1b and Kv3.3b are not entirely redundant functionally
considering that loss of one allele of Kcnc1 led to significant spike broadening.
Both Kv3.2 and Kv3.4 were also co-expressed in these neurons, interestingly, yet
were incapable of complementing the loss of Kv3.1 and Kv3.3. Curiously, unlike
Kv3.1 and Kv3.3, Kv3.2 and Kv3.4 did not exhibit enrichment in the membrane
except in stellate cells. This may explain why these subunits make a lesser
contribution to spike repolarization. The significance of this more homogenous,
somatic distribution remains elusive.
It was also unknown whether Kv3.3 is expressed in cerebellar cortical
interneurons. I found that stellate cells and basket cells, inferred from the
pinceauxs revealed by GAD67 immunolabeling, lack expression of the most
abundant splice variant, Kv3.3b. Thus the changes in complex spikes and
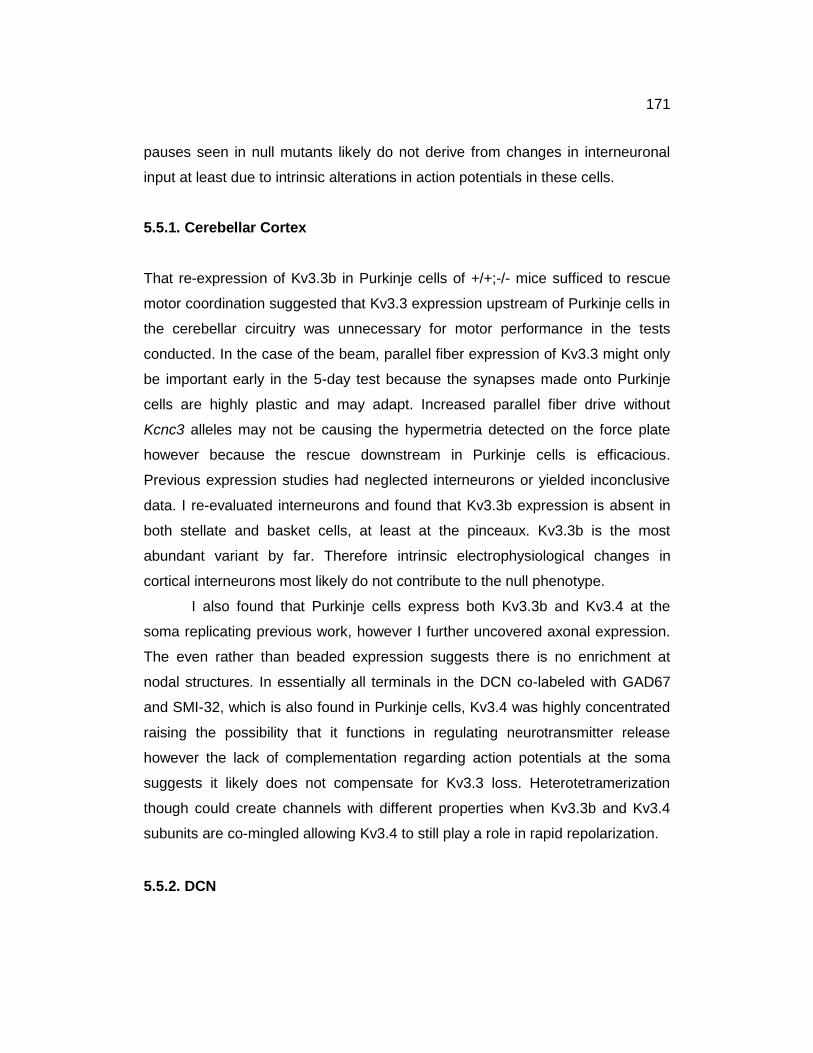
171
pauses seen in null mutants likely do not derive from changes in interneuronal
input at least due to intrinsic alterations in action potentials in these cells.
5.5.1. Cerebellar Cortex
That re-expression of Kv3.3b in Purkinje cells of +/+;-/- mice sufficed to rescue
motor coordination suggested that Kv3.3 expression upstream of Purkinje cells in
the cerebellar circuitry was unnecessary for motor performance in the tests
conducted. In the case of the beam, parallel fiber expression of Kv3.3 might only
be important early in the 5-day test because the synapses made onto Purkinje
cells are highly plastic and may adapt. Increased parallel fiber drive without
Kcnc3 alleles may not be causing the hypermetria detected on the force plate
however because the rescue downstream in Purkinje cells is efficacious.
Previous expression studies had neglected interneurons or yielded inconclusive
data. I re-evaluated interneurons and found that Kv3.3b expression is absent in
both stellate and basket cells, at least at the pinceaux. Kv3.3b is the most
abundant variant by far. Therefore intrinsic electrophysiological changes in
cortical interneurons most likely do not contribute to the null phenotype.
I also found that Purkinje cells express both Kv3.3b and Kv3.4 at the
soma replicating previous work, however I further uncovered axonal expression.
The even rather than beaded expression suggests there is no enrichment at
nodal structures. In essentially all terminals in the DCN co-labeled with GAD67
and SMI-32, which is also found in Purkinje cells, Kv3.4 was highly concentrated
raising the possibility that it functions in regulating neurotransmitter release
however the lack of complementation regarding action potentials at the soma
suggests it likely does not compensate for Kv3.3 loss. Heterotetramerization
though could create channels with different properties when Kv3.3b and Kv3.4
subunits are co-mingled allowing Kv3.4 to still play a role in rapid repolarization.
5.5.2. DCN

172
To determine whether the alterations in spike properties seen as Kcnc1 alleles
are ablated in large DCN neurons were a result of limited complementation
between Kcnc1 and Kcnc3 or non-overlapping expression in independent
subsets of neurons I re-examined expression of these subunits. Although Kv3.1b
and Kv3.3b have been described in separate experiments as confined to the
large neurons, it remained unclear whether these neurons were the
glutamatergic projection neurons and whether expression entirely overlapped.
Action potentials of +/+;-/- mice tended to be slightly broader but only spike
height reached statistical significance. Gene dosage effects were evident for
Kcnc1 comparing the different compound mutants when Kcnc3 was ablated, a
result that would make sense if the subunits are co-expressed rather than in
separate cells, as mice just heterozygous for the Kcnc1 allele with intact Kcnc3
do not reliably exhibit motor impairment in all assays in all strains tested (Joho et
al., 2006, Ho, Grange and Joho, 1997, Sanchez et al., 2000). A lack of functional
redundancy could just as well result from some neurons expressing only Kv3.1
but not Kv3.3 as much as it could result from currents in the same cell failing to
compensate.
Expression of Kv3.1b and Kv3.3b was completely overlapping and
universally present in large, glutamatergic DCN neurons marked by SMI-32.
Thus, the slight lack of functional redundancy in spike repolarization seen in mice
lacking Kcnc3 with intact Kcnc1 does stem from co-expression not separate
populations depending on one subunit gene. Curiously Kv3.2 and Kv3.4 were
also present in large, glutamatergic neurons. Like in Purkinje cells, Kv3.4 does
not complement the loss of other Kv3 subunits. Kv3.2 is known to be expressed
in fast-spiking neurons such as thalamocortical relay cells, which have broader
spikes and do not spike at as high of rates as large DCN neurons. To study the
role of Kv3.2 in some neocortical interneurons, interestingly, a double-mutant had
to be used encompassing the Kcnc1 null allele, suggesting Kv3.2 loss is
complemented by Kv3.1. Either Kv3.2 and Kv3.4 are expressed at lower

173
functional levels, resulting in a slower repolarization rate because the smaller
conductance takes longer to change the membrane potential, or possess
divergent, slower kinetics compared to Kv3.1 and Kv3.3. Together the expression
and electrophysiological data from large DCN neurons buttress the notion
advanced by findings from Purkinje neurons, thalamic reticular neurons and
cortical interneurons that co-expression of Kv3 subunits does not imply functional
redundancy with regard to somatic spike repolarization.
Again, the axonal function of Kv3 channels might be of immense interest.
Aside from limited functional redundancy with respect to repolarization at the
soma, Kv3.1 and Kv3.3 may differ crucially in their ability to support high-
frequency propagation of action potentials, or still other functions, in the long
axons of large, DCN neurons. In addition, the issue of glial expression of the
channels should be considered, which had a mild but significant effect on
myelination. A lack of both Kv3.1 and Kv3.3 in DCN neurons could exert complex
effects at multiple cellular loci that together result in much more severe
dysfunction. Work on Kv3 function in axons should be a high priority for future
work on Kv3 channels that, while challenging, might yield insight into a novel and
surprising roles for the channels beyond just action potential repolarization and
delimiting neurotransmitter release.
Regarding -/-;-/- mice and mice lacking Kcnc1, the axonal role of the
channels is especially enigmatic. Unless other splice variants not explored with
available antibodies concentrate at nodes of Ranvier, it appears that myelinated
axons rely on Kv3.1b to serve whatever function Kv3 current serves at nodes
(Chang et al., 2007, Devaux et al., 2003). If expression here was critical for
axonal function, one would anticipate motor phenotypes in mice lacking just
Kcnc1. That -/-;-/- mice are much worse than +/+;-/- mice fits, however Kcnc1-null
mice do not reliably show significant ataxia with good penetrance on all genetic
backgrounds. Importantly, what has been detected is not present across multiple
assays sensitive to ataxia. The paradox only adds interest to the question. The

174
effect may be subtle and require sensitive tests or special conditions to make it
evident, but is interesting nonetheless.

175
APPENDIX A: Mouse Husbandry Manual
Joho Lab Mouse Husbandry Manual 6/24/07
By Ed Hurlock This protocol is tailored to the Joho Lab using the NG vivarium at UTSW. Notes are included on other vivaria but they are not comprehensive. Contents: 1. Colony management:
Remember always to think like a mouse. Mice perceive the world primarily through olfaction, and communicate by pheromones. They hear and communicate vocally in ranges we cannot hear, so equipment humming at these ultrasonic frequencies may agitate them, interfering with breeding etc. Educate yourself on the social behavior and natural history of mice; cultivating this awareness is invaluable and only touched upon here where directly relevant. 1.1 General maintenance Knock-out or null alleles and transgenic lines need to be maintained, if not in “active duty” with ongoing breeding for experiments, every nine months if outbred or every 5 months if inbred (i.e. Kv3-null allele backcrosses). Waiting longer risks reproductive senescence. C57/BL/6 a.k.a “Black 6” females reputedly sometimes deplete their eggs by ~6 months. For maintenance, ideally two cages of five mice (NG facility) bearing the genes of interest should be kept, one cage of females and another of males. Every few generations these should be bred against outbred wildtype mice to prevent poor breeding, loss of fecundity (small litter size) and poor parenting that develops with inbreeding. Even in “inbred” strains (C57/BL/6, 129, FVB, etc.) there is still some diversity left so it can be beneficial to order mice from the vendor again to reinvigorate after breeding many generations a few mice within the colony. Keeping only one cage for maintenance (ideally females to avoid potential fighting) is risky because if that one cage floods (rare but happens), has water supply problems or is subject to an infectious disease outbreak (almost non-existent in clean facility) the line could be lost. If females or males have bred before at least once they may last longer before reaching reproductive senescence (Robert Hammer, pers. comm.). Typically maintenance mice don‟t need regular attention from the lab. Vet techs will notify the lab of any mice that need to be sac‟ed and place a card on cages where fighting is severe mandating separation. Initially, shepherd shacks and nestlets for distraction can be provided to mitigate violence. Mainly this is prevented by properly housing males and females as described further in the breeding section below.

176
If mice are culled for experiments or die and it is economical to consolidate them to fewer cages after P30 or so, note the following. Always at least give the new cagemates fresh bedding to eliminate territorial demarcation odors and preferably a shepherd shack. It may help to rub dirty bedding on the newcomers so they smell somewhat familiar. Males that have bred will almost certainly fight at least moderately, possibly viciously, after being removed from the female(s) and housed with males, even those that had been familiar prior to breeding. Males that have been bred can therefore only be used for further breeding, housed individually (potentially with sons) or sac‟ed. Females with a litter should never have other females or males added to their cage, as it risks pups being bitten or eaten, stresses the mother, impeding proper care of the pups, and will result in fighting. Small females should not be placed with older, larger females for it risks fighting resulting in potentially severe wounds in the small mouse, although a shepherd shack may suffice to avert this. Genetic background strongly influences fighting probability. FVB mice and to a lesser extent outbred ICR mice are known to be more aggressive. For example, unfamiliar adult female FVB mice will fight aggressively. Eartags are often lost over time. To ensure positive identification, only house mice together that can be clearly differentiated by coat color, natural tail stripes, earpunches and or tags, unless mice are strictly for maintenance and all of the same genotype without a specific history to track, such as a genetic lineage.
For maintenance only, mice of genotypes known to be capable of breeding should be used. If null mice are more convenient to maintain since it obviates genotyping, first determine if they can breed, at least with one parent null so the line is not lost. In the Joho Lab this includes mice heterozygous for one or both Kv3 null alleles (Kv3.1 and Kv3.3). Transgenes thus far have no effect on breeding (pBIKv3.3b line 303, 313, 396; pBIKv3.1a A, pBIKv3.1b A and D, pBIKv3.1c, L7tTA and GAD67GFP (Parv. line). Kv3.3 SKO mice breed fairly well but Kv3.1 null females seem to take longer to get pregnant and mother less reliably (work in progress). Kv3.1 SKO males seem to breed fine but statistics are limited. +/-; -/- mice can breed but previous lab records indicate that both triple minus mice are contraindicated for breeding, possibly due to genetic background differences. In short it is more risky to breed null mice. -/-;-/- mice will consistently not breed. Nor will they fight, which makes housing more convenient (any male can be housed with any female or other male without concern of pregnancies and overcrowding). It is a good idea to save -/-;-/- mice on hand for unanticipated experiments, however there is an attrition of Kv3.1/3.3 -/-;-/- mice because of their seemingly shorter lifespan. Note that Kv3.1 SKO mice and even +/-;-/- mice are significantly more difficult to handle than wildtype or heterozygous mice. 1.2 Breeding Breeding is the most arduous, complex, time-consuming aspect of colony management, for experiments or maintenance. Careful forethought and planning

177
are crucial, or at least will potentially save huge amounts of labor and resources, as well as avoid problems at publication time from concerns over effects of modifier genes. The latter have the greatest impact on behavioral studies, may affect electrophysiological studies and are likely to have relatively less impact on gene expression studies because behavior is a complex systems-level phenomenon known to be influenced by a myriad of genes. Keep a pedigree.
When mice are potentially going to give birth or “drop a litter” (as early as 17 days postpartum if the male was present during birthing), unless 1:1 harem ratios are used, the colony should be checked at least every couple days if not daily. If the birthdate is critical for experiments, mice should be checked daily. Early morning is most ideal because litters are usually born at night and overcrowded cages can be caught before they get tagged. First, anticipate how much cage space will eventually be needed and arrange for it. Plan in detail crosses especially if it is important to control for modifying genes necessitating either use of pairwise comparisons of littermates or at least balanced culling of genotypes from related parents, ideally derived from a common breeding pair within a couple generations. Calculate Mendelian probabilities to determine how many mice to breed to have reasonable assurance of sufficient numbers of analyzable mice from each experimental group, or for maintenance, where a certain number of males or females might be sought (see section 1.1). Work backwards from the number of mice ultimately needed. It may be desirable or acceptable to breed the total number of mice needed over a few generations. Thinking ahead about genetic caveats when breeding for experiments is crucial. The potential impact of modifier genes, linked genes and genetic drift should be considered. Ideally pairwise comparisons are made between littermate controls culled from litters from the same parents or additionally from closely-related parents to obtain reasonable sample sizes quickly. 25% wildtype, 25% null and 50% heterozygous mice should be obtained, so typically conventional null mutants can quite efficiently be bred with respective controls. If however further independently-segregating genes are involved, such as transgenes, the efficiency drops precipitously. With one additional gene it is still feasible to use littermates, but with two or more it becomes unrealistic or at least so exorbitant as to constitute questionable stewardship of grant money. Instead, a balanced breeding approach can greatly reduce the chances of genetic drift or modifier genes confounding results. To achieve this with one transgene and a null mutation, breed mice carrying the transgene (homozygous if possible) with null mice. Mate one pair of resulting heterozygous null mice carrying the transgene to obtain a number of null and wildtype mice carrying the transgene. Next, mate multiple pairs of these wildtype and null siblings that will produce essentially cousins to compare, 75% of which should carry the transgene. For larger sample sizes, use multiple heterozygous pairs bred as described but be sure to cross wildtype and null mice that are cousins to produce experimental mice, never siblings, to maximally mesh the genetic background. In fact, the more breeding pairs used with this paradigm the more evenly distributed the modifier genes will

178
be among experimental mice. Using this paradigm genetic drift is drastically reduced. To repeat the experiment >9 months later with young mice, again derive heterozygous null mice by crossing the wildtype and null breeders with each other, and then using these heterozygous mice to again generate wildtype and null breeders. This will reshuffle the genes, largely maintaining outbred vigor, and greatly reduce genetic drift or modifier effects appeared while maximally sustaining the genetic background. The problem of linked genes influencing a null phenotype can be excluded by analyzing heterozygous mice but only if there is no associated phenotype stemming from gene dosage effects. The only way to deal with this if it is observed is to breed the mice extensively and assess the heterozygous phenotype over several generations. Chances are that linked genes will eventually segregate by recombination. The same approach can be applied to transgenes. Where one transgene alone is insufficient to trigger the manipulated variable, double transgenics can be compared to single transgenics, or in the case of cre recombinase lines, the cre line with or without the floxed alleles. Alternatively, with transgenics different founder lines can be compared to exclude effects of linked modifier genes much faster.
Having maximally diversified coat colors aids in identifying mice, reducing the need for ear punches etc. to identify mice upon loss of tags. Preferentially breeding striped tails also aids in this. Color genes are dominant in roughly the following order: Agouti>white=black>hay/fawn[gold]=brown=light agouti=chinchilla8. Without a deliberate effort, all mice will eventually end-up agouti. Further, diversifying colors in a random way helps avoid distinguishing between mice of different genotypes in blind experiments. Therefore, try where possible to pair mice of dissimilar colors, with a slight but not absolute bias against agouti.
If sufficient males are available to be allocated to breeding (they cannot be housed with males other than sons afterward), the ideal harem ratio is 1:1. If cage space were no object, it would be best to remove the male prior to the birth of pups to maximize calm and avert the male potentially eating viable pups. A 1:1 harem ratio yields the best chance of rapid pregnancy since males have refractory periods after mating that may preclude inseminating another female in estrus at the same time. This is more marked in inbred males. Chances of pregnancy are further enhanced by using a male that is a proven breeder. When males of the right genotype are scarce, harem ratios of 1:2-1:4 can be used, and the male can even be rotated between cages every 4-5 days to encounter each female during at least one estrus phase. Frequently good outbred males will be
8 Note that albino mice may have visual impairments affecting performance on
behavioral tests requiring visual acuity. White however works best with the
DigiGait system (Mouse Specifics), where pink pawprint videos are analyzed
(other pink parts must be painted with a sharpie or food coloring pen, ideally
blue), although this problem may be circumvented by painting paws red,
removing the pigmentation variable.

179
able to handle this and (very approximately) up to 6 outbred females will get pregnant within a week or two.
When mice are setup for breeding9, the female(s) should be introduced to the male‟s bedding or fresh bedding to avoid territorial conflict. A shepherd shack should be provided to mitigate conflict and it is rumored that these facilitate breeding. Observe mice for a minute. In rare cases aggression may be a problem and different prospective breeders will be needed. Good males will often immediately take an interest in the female(s) and attempt to mount after sniffing pheromones, particularly in the dark phase. Cross-out numbers of breeders on their former cages and create a new tag for the breeding cage. Write the purpose of the cross in the center at the top of the breeding cage card. Below, write the male on the left, indicating number and genotype and then a list of “X”s after which the tag number, genotype and markings of each female should follow. Finally, write the setup date below this information. If the male is switched, which is sometimes necessary due to poor performance, note the date because it may be important to know to keep track of the lineage or what genes require genotyping. A hiatus can be implemented to definitively know the lineage.
By consulting the setup date, check breeding cages 15-17 days after setting-up breeding. Only one litter is allowed per cage accompanied by up to three adults, including pre-weanling mice from the previous litter. Mice that show any clear sign of pregnancy (easiest in young, lean mice; difficult in older or obese mice) should be either noted if it is the only pregnant female among a total of three mice in the cage, or separated if there are more than two or more than two are pregnant. Take care not to apply pressure to the uterus when handling pregnant females; instead examine eartags of less or non-pregnant females and deduce by process of elimination the identity of the pregnant female using the list on the cage tag. The most pregnant female should be left in the old bedding if it appears that it doesn‟t need changing for several more days. This will minimize distress from new bedding. One nestlet should be provided (with two newborns often get lost in excess nest and die; one works best). Nesting material or at least a shepherd shack is important to ensure maximal survival of pups as the mother is stressed without a nest and, because pups are altricial, failure to maintain warmth can lead to a loss of viability. Cold pups are generally presumed non-viable and eaten10. Pups begin to maintain their own body temperature however once stubble appears around P5, and the nest gradually subsides in importance. A red special instructions card reading “No bedding change” should be conspicuously applied to the cage for bedding changes will distress the mother
9 Whenever mice are handled in the NG clean facility using aseptic technique
try to remember to wipe gloves with Process NPD disinfectant. Spray NPD in
or near the hood to avoid breathing it (chronic breathing may lead to asthma)
and take care to avoid eye contact. Do not get extensive NPD on the mice. Be
sure to wipe cage lids before and after use them to grab mice. 10
If pups are removed from the mother they need to be pre-warmed before
they are returned.

180
perinatally and risk pup mortality (C57/BL/6 are especially susceptible). Changing the bedding before birth is not typically a problem since birth usually occurs deep into the dark phase that will occur at night with a conventional light dark cycle in the vivarium. As other females become pregnant in a harem, they can be separated from the others until only 3 adults remain and one nascent litter. In the latter case, the final female to get pregnant and the male should be moved to a fresh cage. There are pros and cons of a female giving birth in the continued presence of a male or additional female. Other mice can disturb the mother, and in the case of males, even the real father, may eat viable pups. An additional female is generally beneficial overall since she may help mother the pups and keep them warm. The male has a chance to inseminate the female again during postpartum estrus, which typically is the case. This is advantageous if a maximal rate of breeding is sought, although it can be inconvenient as it mandates early weaning to prevent overcrowding when the next litter arrives.
Check mice for pregnancies every 2-3 days. A good schedule to maintain is checking the colony Monday-Wednesday-Friday. The DOB can generally be judged accurately within 1 day this way when the appearance of neonates of different postnatal days is considered. If the nascent mother grows very large, becomes sluggish, and overall shows signs of pain or distress, it is likely dystocia. Usually the bulge will be lumpy. She must be sac‟ed. Often by the time this is observed fetuses have died.
Unplanned pregnancies occur when males are inadvertently mixed with females and sometimes very small litters are dropped by females that did not appear pregnant. In these cases if pups are usable try to keep the mother in the familiar bedding if it is not too dirty to last a few days. Otherwise get a fresh cage. A nestlet should be provided and “No bedding change” special instructions card applied. The mother can often be determined by the extent to which the fur has cleared around her nipples, or observing nursing pups. Sometimes determining this is difficult since pups will latch onto other females albeit to a lesser extent. Up to three females can be kept with the pups just in case in that event. The difficulty in identifying the mother underscores the need to note which females are observed to be pregnant with planned pregancies.
If pups are born and the mother is not caring for them or is eating viable pups, the litter can be fostered to a mother with pups of roughly the same age. The total number of pups should remain close to that of the original litter, and a few pups from the original litter should be retained to ease the transition. Foster mothers preferably have pups visibly distinguishable from the fostered pups. Newcomers can be rubbed with bedding to discourage rejection. Good maternal care is indicated by visible milk within the semi-transparent newborns. Fostering can also be done at later ages. Keep red special instruction cards reading “No bedding change” on until about P5, when stubble appears, pigment reduces redness to a pink hue, digits separate, ears protrude laterally and the body becomes plump.
As pups mature, runts may appear. Check that functional teeth have emerged and sack or nurse (if valuable) any pups showing malocclusion. Runting

181
can be attenuated by removing robust pups from the mother for a few hours to allow the runt(s) to nurse, if it is feasible / worth the effort. -/-;-/- mice require special care because they have difficulty nursing in the presence of non--/-;-/- pups particularly in the case of backcrosses to inbred strains. After P10 -/-;-/- mice can be fairly easily identified, allowing the number of non--/-;-/- mice to be reduced by culling. If competition is not reduced to more than a couple non--/-;-/- mice to ensure free nipples by P14, -/-;-/- mice will likely perish. It is important to try to use a food hopper with young -/-;-/- mice with a round hole for one time an uncoordinated -/-;-/- mouse became stuck in the oval hole in one of the hopper types. Upon turning its head ninety degrees it could not go back through. The mouse lacked the insight and coordination necessary to emerge from the predicament.
If the male was present perinatally, there is a high likelihood that there was a conception during the postpartum estrus. Thus, when the litter reaches P17 check the mother for pregnancy and if she is pregnant the pups will have to be weaned early to prevent overcrowding, which risks trampling of the second litter. Early weaning (technically before P21) requires provision of food pellets, preferably wetted, on the floor, a Petri dish of water and placement of a red tag with a neon green charge lixit sticker that should request charging by the ARC tech for several days. The mother should be moved to fresh bedding with a nestlet and the red “No bedding change” tag should be applied. The entire litter can be kept in the same cage until P21. Before P28 mice are small enough that up to ~7 can be kept in the cage (exact rules regarding the weight of mice and limits on how many can inhabit a cage are complex, and whether this will pose a problem depends on your particular ARC tech‟s meticulousness and interpretation of “the law”). Shepherd shacks should be removed around P13 once eyes open and pups begin to ambulate about the cage for this allows for the development of proper coordination during a critical period (per ARC vet techs).
A good time to tag and tail pups is between P18-P21. Although ears are somewhat smaller and tags slightly more likely to be removed, it is economical and efficient in terms of labor to genotype at this time because results can be obtained prior to the absolute weaning deadline of P28, obviating the need to sort mice twice (see section 2.1 for tailing details). It‟s helpful to sprinkle food pellets on the floor to ease the transition to eating solid food. If there are >10 pups, it may be necessary to wean by P21 depending on how strictly this is enforced. Runts or the smallest mice in the litter are preferably kept with the mother until P28. DKOs should not be weaned until P28 or at the earliest P21. If weaned before P28, a water dish should be provided and food kept on the floor. DKOs from backcrosses to inbred strains may need more attention and soft food. Lixit charging tags should definitely be placed on the cage. Generally, because typically only 1-4 DKOs are born per litter, DKOs can be kept with the mother not exceeding 3 adults with one litter. Alternatively, newborns could be fostered if a foster mother happens to be available. Weaned DKOs can be housed in any combination desired because they cannot breed nor fight.

182
Once genotyping results are obtained prior to the P28 wean deadline, pups of unwanted genotypes of no potential miscellaneous use can be sac‟ed and those of desired genotypes parsed into cages of no more than 5 mice. Requirements of specific experiments or line maintenance may differ, but there are a few good rules of thumb. Male mice can often be consolidated from different litters if united before P28. Afterward fighting is increasingly likely. Females can almost always be resorted later at will but males more or less need to remain with the same male cagemates for life. If males are removed from the group of five other males generally cannot be added because they will fight. Therefore one should plan to use multiples of 5 mice to prevent having one or two mice consuming potential space for 5 mice for long periods. Accordingly an effort should be made out of economics to either pare down the number of mice of a given sex to multiples of 5, if mice of the desired genotypes are abundant, or retain a few mice of potential miscellaneous use (so-called “scrub mice”) to fill all cages with 5 mice.
Prevent adverse evolution by avoiding breeding offspring of poor parents (mating, fecundity or parental care) or highly aggressive mice (where aggression is part of the mutant phenotype, just don‟t select exceptionally aggressive ones).
1.3 Use in experiments For behavioral experiments, mice can be taken to any common procedure rooms. Here they can be handled outside the hood, by necessity, but the area should be cleaned with NPD disinfectant before and after. Ideally one should wipe gloves and equipment between handling mice from different cages or at least racks to prevent potential spread of as-yet-undetected pathogens, although this is extremely rare in a clean facility. Note that males removed from their cages housed with other males will entail fights for three principal reasons. First, the hierarchy and territorial distribution is disturbed, and males will attempt to establish a new order. Second, once a removed male is returned, the male may have smelled or worse acquired female urine during testing, which contains pheromones that elicit fighting. Third, if the reintroduced mouse merely smells unfamiliar from potentially any acquired scent or contact with unfamiliar males it will likely be assaulted. Females typically will not fight under these circumstances. Mice can be identified using the Joho Lab system by eartags normally or if tags are lost which ear the tag was in as well as potentially punches. A tear should be evident on that side. 1.4 Imports and exports On campus exports from NG can be executed within 72 hours as NG is a clean facility obviating the need for quarantine. There is an online animal transport form on the ARC website. Imports from other vivaria on campus require a ~6 week quarantine in NG if not also in their vivarium of origin if they were

183
infected with pathogens already. Serology is conducted by Joe Fields under the direction of Dr. Robert Lu. Once mice are seronegative in NG quarantine they can join the colony. The same is true for imports from other institutions. Mice can be ordered of specific strains (i.e. C57/BL/6) from outside vendors (i.e. Jackson Labs, C57/BL/6/J –even inbred strains differ slightly between vendors, so note the suffix. 129 mice have the most heterogeneity) through Dan Olsen in the ARC front office. One box costs ~$80.00. Males and females can be shipped in one box by requesting a divider, if it is desired that they not breed amongst themselves in transit. Mice are best ordered in spring or fall because of respiratory infections in the winter and the risk of overheating in the summer, especially in Dallas. Some feel that it is better to have mice shipped by air than truck but there are pros and cons. There may be better climate control during flights than in trucks but mice may sit at the airport with poor climate control, which can even be fatal. 2. Genotyping 2.1 Tailing Usually it is most convenient to tail and tag at weaning (P18-P28). The ideal time however is P21 in terms of better tag retention, ease of tagging, minimizing distress to mice and ability to mix males of different litters without fighting. By genotyping before the P28 wean deadline, unwanted mice can be discarded upon obtaining results, minimizing the number of cages needed while awaiting genotyping results. Have ready enough eartags, enough tail tubes, stainless nail-clipping scissors, tag applicator and ear puncher. Separate males and females (useful convention is put males in fresh cage on right, females in empty food hopper, then put females back in original cage on the left. First tag males then females). Enter litter DOB in excel sheet and copy-paste it into a total number of cells corresponding to the total number of pups. Copy-paste m‟s and then f‟s corresponding to the numbers of each sex, looking at the right and left cages conveniently. Then copy-paste from above, or type de novo, the coat colors (conventional order: Agouti, L [light] Agouti, Black, White, Gold aka Hay aka Fawn, Grey, Brown, Chinchilla). Note on the right in margin parents (“male tag#x female tag#”) to keep track of family tree. Put tag in applicator and position it poised upright ready to go in foam holder. Label free-standing boil-proof 2 ml tube with alcohol-resistant marker on tethered screw cap (tubes: Corning 430915).

184
Tag ear by holding entire scruff of mouse (head to tail)11, with tail held with the middle finger to restrain hindquarters, and letting mouse bite the edge of a cage (distraction) until an opportune moment arises when the tag can be inserted deeply into the ear (mitigates tag loss; ear lobe fills-out into it as it grows) but without hitting bone. Be patient. Hold applicator in right hand for right ear, left hand for left. Scruff mouse in opposite hand. Before letting go of mouse punch or clip opposite ear if necessary. Cut 0.25-0.75cm tail, close cap, tap sample down to bottom of tube to make sure it‟s there. Note: if tailing or retailing old mice (avoid if at all possible), put quick stop glob on cotton swab before tailing mouse to dab for several seconds onto tail immediately after cutting to stop bleeding and provide local anesthesia. Pick up tip (not bloody end) of tail with ear puncher and drop into tube. Arrange tubes in a row. Look at row of tubes before placing them in a sealable bag. Ensure that all eartag numbers are there consecutively. An error will become immediately apparent by looking at tubes this way. Do not let tails sit at room temperature for more than a couple hours; it is good idea to put tails in the freezer in the animal facility, if available, if a lot of tail cutting is yet to be done that may exceed 2 hours. DNA yield is important for the protocol used here to work. Wipe down tools with NPD disinfectant, except near hinge of tag applicator to minimize rust. Spray foam holder copiously with NPD.
11
The key things are to 1) Hold the tail far enough from the body to leave
room for the other hand 2) Have relaxed, confident, resolute agility 3) Wait
until the mouse is facing straight ahead, keeping glove nearby before lunging
because the mouse can smell it approaching 4) Hold the entire length of one’s
thumb along the side of one’s hand to apply instant pressure to the entire
back of the mouse to restrain it, even the neck, pressing forward slightly 5)
Pinch the scruff by rolling one’s thumb tightly against the side of one’s hand
to hold the mouse. In general, minimize the time the mouse is restrained
<100%, for it is restraint itself that provokes the mouse to bite. If the mouse
is being restrained, it must be fully restrained. That’s why resolve is
important. If a mouse is poorly restrained, put it down and re-establish
proper grip. If a mouse eases loose and is going to bite, immediate release
will almost instantly abate the motivation of the mouse to bite.

185
2.2 DNA preparation DNA is added directly to the PCR reaction from the proteinase K digest rather than purified by phenol:chloroform or salting-out. Generally, if primers and the chosen template are optimal, purification should be unnecessary (see section 2.3, PCR, and Appendix I). The hotshot method obviating the need for proteinase K digestion, that reputedly saves time and money, suffers from unreliability, often necessitating repetition. Here a modified version of the GNT-K buffer method (Biotechniques (1997) 22:1114-1118) is used where additionally DNAse is heat-inactivated prior to proteinase K digestion (“Hurlock Modification”). There is no EDTA in the buffer but rather added Mg as well as various other components thought to foster the PCR reaction found in PCR buffers. Essentially the DNA is digested in a mild detergent that will not subsequently destroy Taq polymerase when added to the PCR reaction. In this same vein, heat inactivation of proteinase K is key to avoid destroying Taq.
DNA Preparation Protocol: Remove tails from freezer, dump sealable bag on benchtop12. Stand up tubes to see numbered caps and then order them, spaced every other slot, in microcentrifuge tube racks, with tethered caps open. Squirt 200ul GNT-K buffer (see Appendix III)13 into each tube with a filter tip. Ensure tail is submerged. Tightly close caps and place tubes on a heat block at 90-95C or boiling water for 15 minutes (at 30 minutes may start to see detrimental effect) to denature DNAse, which protects DNA from degradation during PK digest and may also help remove histones. This is a critical step that makes a night-and-day difference. Let tubes cool on the benchtop until they are ~60C or cooler. At this point DNA will only slowly degrade, measured on a timescale of weeks. Open caps. Add 2ul of 1230U/ml liquid proteinase K (i.e. Sigma P4850) using filter tips, close caps, and pulse on vortex for second to mix as well as collect condensation.
12
A supply of tube racks and lids or boxes can be cycled between the lab and
ARC but all materials must be cleaned with NPD; a matter of personal
preference. Racks tend to spill. 13
Another good option supposedly is the proprietary Direct PCR buffer by
Viagen, or just use Tween-20. I have not tried these with the PCRs in the
Joho Lab.

186
Place tubes overnight (12-18 hours) on orbital shaker in oven set at 55˚C, shaking fast enough to gently agitate the solution, ~30rpm. A four-hour incubation suffices at minimum, and another microliter of proteinase K can accelerate digestion. Remove tails from oven and swish solution. The connective tissue skeleton should distintegrate to small bones, hair and debris if digestion is complete. Spin tubes at ~10,000-13,000G for 5 minutes to pellet debris. Keep tubes at 4 C for a few weeks but freeze for long-term storage. Frost-free is OK since the DNA template for genotyping is typically short, so shearing by ice crystals is of minimal concern. 2.3 PCR
Although PCR has the potential to be highly sensitive, sensitivity depends on how many cycles are used, rounds of PCR and template purity. Contamination can be introduced by pipetting (use all filter tips for anything going into PCR reaction to be safe) or dirty tools during tailing (wipe blood), however usually substantial DNA needed using the number of cycles and one round used in genotyping PCRs. Negative controls lacking template can reveal contamination.
With genotyping yield is often more of a concern. Transgenes in particular often have no band signifying a genuine negative since a genomic integration site junction is typically not elucidated. A negative can be a true negative or mere failure to detect, a call aided by having a comparably-prepared positive control. Null alleles exist in single copies in heterozygous mice. Although here the junction is known (generally), and there are two bands involved, one may fail to amplify while the other still looks robust. The chance of this can be attenuated by fine tuning the relative concentrations of the two primer pairs to balance processivity. Nonetheless, the most frequent problem is obtaining bands at all with DNA samples that do not require a lot of time or hazardous, expensive reagents to prepare. New PCRs should incorporate the design principles outlined here and existing PCRs adopted by the lab that are not compatible with the efficient DNA preparation methods outlined herein should be redesigned, unless the mice are only to be used for a few experiments such that the increase in efficiency gained does not compensate for time invested engineering. The PCR should amplify a region with the most suitable template for PCR. Genomic DNA is notorious bad PCR template in general, so if possible, coding regions of transgenes should be targeted. Problematic features of genomic DNA include GC-rich regions such as CpG islands (the rocky shoals that sinks the polymerase ship), repeats and secondary structures, especially GC-rich ones. Use of additives in the master mix, such as betaine or DMSO, can help melt GC-rich DNA to some extent and

187
should be tried at loci where primers cannot be repositioned. Once a promising template is found to generate bands ranging between 150bp-1kb, good 18-23bp primers should be selected from a large pool of potential pairs given the ever-lower cost of oligos designed to be cross-compatible having melting temperatures around 58C (see also Appendix I below). Design primers to all work well using single PCR program if possible for simplicity to avoid errors and for efficiency.
The optimal reaction conditions for different primers may differ but often it is possible to multiplex PCRs in the same reaction for efficiency. Raising magnesium or the primer concentration helps yield up to a point of diminishing return but at the cost of decreased purity; non-specific bands are more likely at higher concentrations. Enzyme concentration again can be raised up to a point of diminishing return. Intact dNTPs are crucial. These should be kept at -80C or otherwise in a non-frost-free freezer and aliquoted. They should be added just before enzyme given their expense. Always return dNTPs to the freezer as soon as possible and thaw them on ice or very rapidly by rubbing; do not leave on the benchtop. Taq can be made very economically in the lab using engineered bacteria and a protein purification column. RedTaq (Sigma) is more expensive but saves having to mix loading dye with samples and therefore time. Always add Taq last and do not vortex beyond “shake” settings to mix. Note whether it can be frozen or not, and at what temperature, in the buffer it is in. Frost-free freezers are not recommended.
Note that the nonlinear nature of PCR makes it potentially affected in all-or-nothing ways, and beyond a certain template concentration saturation of band intensity may occur. PCR protocol: Thaw primers, 25mM MgCl, 10X Red Taq buffer, and, on ice, 2.5mM dNTPs. dNTPs are unstable and should only be thawed immediately by hand or on ice. Do not leave them out on ice more than a couple hours and always store as aliquots (i.e. 200ul 2.5mM). Sigma sells 10mM dNTP sets that can be combined by making up 25% of the volume with each of the four dNTPs for a 2.5mM final concentration of each. Keep at -80C / not in frost-free freezer. Go to excel sheet and count how many samples need to be run for each PCR. Write intervals i.e. 315 to 330, then add 1 to the interval (16 samples), then sum these for the total number of samples. Run though calculations on PCR worksheets described above. Get out relevant tubes, including controls. Spin down debris if it is unsettled (1 minute 10,000G pulse is sufficient). Array tubes for PCR reaction in order in a tube rack leaving the first hole in the rack empty.

188
(While tubes thaw, if frozen, and/or spin) Open online archive of Word files of each PCR reaction made from adaptable templates for each set of primers (i.e. Kv3.1, Kv3.3, L7 & eGFP transgenes). Plug in total at the top and derive multiplier to multiply each reagent by. There should be enough excess for a couple controls. Try to run at least a positive control and negative control. An additional negative control that lacks template is beneficial to assess contamination of master mix/reagents. Vortex all thawed reagents. The 10X buffer must always be vortexed to redissolve and/or distribute components that get separated when ice crystals form. For unknown reasons, not vortexing other reagents causes problems. Do not vortex the Taq enzyme. Place reagents in ice bucket. Nearby place PCR 96-tube grids. Assemble master mix in order in PCR worksheet by first pipetting 10X buffer into tube that will accommodate the full volume14 Always use filter tips for PCR reagents. Do not pipette beyond the measured amount; the retentate in the tip is excess due to glycerol-containing solution clinging to the tip walls. Next add the water. Should be autoclaved ddH2O, replaced regularly to avoid contamination. Next add in any order the following reagents: MgCl2, primers and dNTPs. The latter are more expensive and best added last. Vortex ideally before adding enzyme so that the salt concentration is optimal since keeps the enzyme in good shape. Finally, if everything else was added correctly, add the more precious reagent, Red Taq polymerase (Sigma). Mix this master mix by vortexing gently on “shake” setting, and/or triturate. The red dye will indicate mixing, but mix more to be sure. Arrange thick-wall 0.2ml PCR tubes15 in grids on ice sufficient for anticipated number of samples. Distribute 25ul of master mix to each tube.
14 If 2ml is exceeded, can truncate 14ml culture tube with scissors. Also giant
microcentrifuge tubes are sold that can be tightly closed. 15
Changing suppliers risks necessitating adjustments to PCR program if
primers are of borderline quality. Tubes should fit snug in the thermocycler
and not spring upward when pressed down. We are currently using GeneMate
from ISC Bioexpress.

189
Add 1ul of template without touching hair pellet to each PCR tube individually. Move tail DNA tube one space to the left, and transcribe the number to the PCR tube with sharp, alcohol-resistant marker. Leftover reactions can be used for additional controls. Positive controls should at least include a sample where each multiplexed band is present. In addition, those with each of the multiplexed individually can be added to discriminate background/ghost bands. Negative controls can be the latter, mutually for individual multiplexed bands, or just a template sample that should yield bands, at least possible in the case of transgenes lacking a negative band. Also, to control for contamination of buffers, a control lacking DNA template just including master mix or GNT-K tail DNA buffer can be added if there is still room. Load thermocycler and run PCR. Ideally, design primers so that they all are compatible with the same PCR program to avoid mistakes and maximize efficiency, obviating the need to wait for serial PCRs. If necessary, the reactions can wait several hours on ice, with little diminution in product observed even after sitting overnight. Be sure lid is heated. Keeping tubes a 4C overnight after the reaction is unnecessary and just wears-out the compressor. Make 1.4-1.6% agarose gel >30 minutes before but not >1 week before thermocycling is complete. For model 75.2321 Continental Lab Products (CLP) gel apparatus, dissolve ~3g of fine powdered agarose in 200ml 1X TAE buffer16 (without ethidium bromide) in Corning 500ml media jar with the cap loosened by microwaving ~2 minutes. Periodically swish every ~30 seconds. Add 5ul of 10mg/ml ethidium bromide17 for every 100ml of gel (10ul) after microwaving. Swish to dissolve. Place 2 50-well combs into gel casting and then pour in gel at 4C18. Cooling is not necessary. Bubbles don‟t matter. The gel is ready to use in
30 minutes and will remain moist at 4C for hours. For longer storage periods wrap gel in casting tray in plastic wrap. Pull comb carefully. Place gel in tank with 1X TAE buffer with ethidium bromide added (50ul/l or 10mg/ml stock per liter).
16
Tris-Acetate-EDTA made from 50X stock: For 1L, 242g Trizma base, 57.1ml
glacial acetic acid, 100ml 0.5M EDTA pH 8.0, and pH to 8.5 using HCl. To
make EDTA solution first consult Molecular Cloning. Used TAE remains good
for ~1 week in the gel tank. Condensed TAE may lead to blurry or smiling
bands. 17
Still works fine if precipitate forms at the bottom. Caution: carcinogen. 18
Do not carry the media bottle by the cap as it is prone to being dropped if
the cap is loosened. Use rubber gripper to hold bottle, which is needed
anyway to pour it.

190
Stir buffer between running gels. Do not touch things in the lab with gloves laden with ethidium bromide. Load gel with 17ul of each 25ul sample, starting actually with the lowest row so that any unused rows will remain uncontaminated at the top for later use. Load 5ul of 2 log NEB ladder solution19 (see left) once per row. Run gel at 120V for ~30 minutes. Transport gel to Alpha Innotech imager on a tray to prevent spillage of ethidium bromide. Bring compatible zip disk. Carefully slide gel onto fluorescent lamp. Press out bubbles. A puddle of water helps to maneuver the gel. Make sure filter wheel is on ethidium bromide and turn it physically beneath camera if computer fails to control it. Click20 expose preview (green button) with an exposure time of 1s and optimize zoom, light level and focus via black knobs on camera above box with the door open. Maximize the light level unless it is too much even with a 1s exposure, then optimize exposure time. The bands should be just visible not overexposed. Acquire image (red button). Set filtering to 4 by going to 3-D tab under filters tab in tools box. Acquire again if bands are now too intense. Save image as date followed by relevant genes in lab folder (i.e. “El Igor de Joho”). Copy tif file(s) to zip disk. Never touch zip disk with gloves. Retain gel at 4C under plastic wrap until it is certain that it does not need to be scrutinized again. 2.4 Archiving of PCR data Not only is heat sensitive film expensive, but there are also several key advantages to keeping a digital log of every PCR. Digital images can capture in a single image at high resolution the entire gel, can be arranged with neat labels in a layout using Microsoft publisher or Powerpoint or other software, can be archived to make extra copies readily, do not depend a continued supply of film with a functional printer, and can be conveniently accessed anytime from one‟s laptop, including that which one brings to the vivarium in case a band must be double-checked, etc. Tif images from the zip disk can be downloaded to the imaging computer with Photoshop and Microsoft Photo Editor. In Photoshop the image can be cropped and inverted by going to image, adjust, and invert. The image can then be opened in Photo Editor to save it as a tif that can be opened outside of Photoshop. Discard images on zip disk and periodically clean folder on shared computer used for image acquisition as a courtesy. Insert each tif file into a Microsoft Publisher layout where they can be labeled with text boxes that one can copy-paste rapidly via control+C and
19
20% NEB 2-log ladder, 20% 5X loading dye (40% v/v glycerol with
0.25%w/v orange G) and 60% 1X TE pH 8.0; kept at 4C. Freeze ladder stock. 20
Caution: Mouse and keyboard should be handled with gloves.

191
control+V, respectively. Excel files housing the mouse inventory can then be opened alongside the layout to type-in the genotypes. Joho Lab bands: Kv3.1: WT=216bp; null=420bp, Kv3.3: WT=594bp; null=~300bp21, tTA=400bp (i.e. L7tTA transgenic), GFP=546bp (i.e. all pBI GFP/Kv transgenics), pBI[specific channels] not shown.
Kv3.1
SI S2 S3
PGKNeo 35-77131F775
31 R991
Ec
oR
I
B al I / Msc I
PNR278
31F775 216 bp WILDTYPE
420 bp NULL
21
The precise length will remain unknown until the junction between the neo insert and the genomic DNA is sequenced for the amplicon spans this junction. The wildtype band is located entirely in the deleted region 5‟ to Kv3.3. The null band spans the 3‟ junction of the neo insert with respect to the genome and the 5‟ edge of Kv3.3, exon 1. The neo cassette was inserted in reverse with regard to Kv3.3 to prevent inadvertent Kv3.3 transcription from the pgk promoter, so the 5‟ null genotyping primer is near the 5‟ end of the neo cassette with regard to the direction of neo transcription and the 3‟ end of the insert with regard to Kv3.3 transcription. Neo was inserted at the 5‟ end of Kv3.3, near the two alternative initiator methionines.

192
Wildtype
Null
Kv3.3 exon 1
Pgk Neo
WT 594 bp
Null ~300 bp
Kv3.3 endogenous genotyping Fall 2006 onwards:
Appendix I: GNT-K buffer: 50 mM KCl 1.5mM MgCl2 10mM Tris HCl, pH 8.5 0.01% v/v Gelatin 0.45% v/v Nonidet P-40 0.45% v/v Tween-20 For 500ml: 25ml 1M KCl 625ul 1.2M MgCl2 5ml 1M Tris, pH 8.5 2.5ml 2% Gelatin 22.5ml 10% NP-40 22.5ml 10% Tween-20 Keep at 4C. Prepare and handle only with filter tips.

193

194
REFERENCES
Abbott GW, Butler MH, Bendahhou S, Dalakas MC, Ptacek LJ, Goldstein SA (2001) MiRP2 forms potassium channels in skeletal muscle with Kv3.4 and is associated with periodic paralysis. Cell 104:217-231.
Ahn HS, Choi JS, Choi BH, Kim MJ, Rhie DJ, Yoon SH, Jo YH, Kim MS, Sung KW, Hahn SJ (2005) Inhibition of the cloned delayed rectifier K+ channels, Kv1.5 and Kv3.1, by riluzole. Neuroscience 133:1007-1019.
Aizenman CD, Huang EJ, Linden DJ (2003) Morphological correlates of intrinsic electrical excitability in neurons of the deep cerebellar nuclei. J Neurophysiol 89:1738-1747.
Akagi H, Kumar TM (2002) Lesson of the week: Akathisia: Overlooked at a cost. BMJ 324:1506-1507.
Albus JS (1971) A theory of cerebellar function. Math Biosci 10:26-27-61.
Alonso-Espinaco V, Elezgarai I, Diez-Garcia J, Puente N, Knopfel T, Grandes P (2008) Subcellular localization of the voltage-gated potassium channels Kv3.1b and Kv3.3 in the cerebellar dentate nucleus of glutamic acid decarboxylase 67-green fluorescent protein transgenic mice. Neuroscience 155:1059-1069.
Alvina K, Khodakhah K (2008) Selective regulation of spontaneous activity of neurons of the deep cerebellar nuclei by N-type calcium channels in juvenile rats. J Physiol 586:2523-2538.
Armstrong DM (1974) Functional significance of connections of the inferior olive. Physiol Rev 54:358-407.
Armstrong DM, Cogdell B, Harvey RJ (1973) Response of interpositus neurones to nerve stimulation in chloralose anesthetized cats. Brain Res 55:461-466.
Aromolaran KA, Benzow KA, Koob MD, Piedras-Renteria ES (2007) The kelch-like protein 1 modulates P/Q-type calcium current density. Neuroscience 145:841-850.
Bagnall MW, Stevens RJ, du Lac S (2007) Transgenic mouse lines subdivide medial vestibular nucleus neurons into discrete, neurochemically distinct populations. J Neurosci 27:2318-2330.

195
Balaban CD (1985) Central neurotoxic effects of intraperitoneally administered 3-acetylpyridine, harmaline and niacinamide in sprague-dawley and long-evans rats: A critical review of central 3-acetylpyridine neurotoxicity. Brain Res 356:21-42.
Baranauskas G, Tkatch T, Nagata K, Yeh JZ, Surmeier DJ (2003) Kv3.4 subunits enhance the repolarizing efficiency of Kv3.1 channels in fast-spiking neurons. Nat Neurosci 6:258-266.
Barboi AC (2000) Cerebellar ataxia. Arch Neurol 57:1525-1527.
Barmack NH, Yakhnitsa V (2008) Functions of interneurons in mouse cerebellum. J Neurosci 28:1140-1152.
Barmack NH, Yakhnitsa V (2003) Cerebellar climbing fibers modulate simple spikes in purkinje cells. J Neurosci 23:7904-7916.
Bearzatto B, Servais L, Roussel C, Gall D, Baba-Aissa F, Schurmans S, de Kerchove d'Exaerde A, Cheron G, Schiffmann SN (2006) Targeted calretinin expression in granule cells of calretinin-null mice restores normal cerebellar functions. FASEB J 20:380-382.
Benedetti F, Montarolo PG, Rabacchi S (1984) Inferior olive lesion induces long-lasting functional modification in the purkinje cells. Exp Brain Res 55:368-371.
Bernard G, Shevell MI (2008) Channelopathies: A review. Pediatr Neurol 38:73-85.
Browne DL, Gancher ST, Nutt JG, Brunt ER, Smith EA, Kramer P, Litt M (1994) Episodic ataxia/myokymia syndrome is associated with point mutations in the human potassium channel gene, KCNA1. Nat Genet 8:136-140.
Brumberg JC, Nowak LG, McCormick DA (2000) Ionic mechanisms underlying repetitive high-frequency burst firing in supragranular cortical neurons. J Neurosci 20:4829-4843.
Cannon SC (2006) Pathomechanisms in channelopathies of skeletal muscle and brain. Annu Rev Neurosci 29:387-415.
Catz N, Dicke PW, Thier P (2005) Cerebellar complex spike firing is suitable to induce as well as to stabilize motor learning. Curr Biol 15:2179-2189.
Chakrabarti L, Eng J, Martinez RA, Jackson S, Huang J, Possin DE, Sopher BL, La Spada AR (2008) The zinc-binding domain of Nna1 is required to prevent

196
retinal photoreceptor loss and cerebellar ataxia in purkinje cell degeneration (pcd) mice. Vision Res 48:1999-2005.
Chan E (1997) Regulation and function of Kv3.3.
Chang SY, Zagha E, Kwon ES, Ozaita A, Bobik M, Martone ME, Ellisman MH, Heintz N, Rudy B (2007) Distribution of Kv3.3 potassium channel subunits in distinct neuronal populations of mouse brain. J Comp Neurol 502:953-972.
Chan-Palay V (1977) Cerebellar dentate nucleus: Organization, cytology and transmitters. New York: Springer-Verlag.
Chen C, Westenbroek RE, Xu X, Edwards CA, Sorenson DR, Chen Y, McEwen DP, O'Malley HA, Bharucha V, Meadows LS, Knudsen GA, Vilaythong A, Noebels JL, Saunders TL, Scheuer T, Shrager P, Catterall WA, Isom LL (2004) Mice lacking sodium channel beta1 subunits display defects in neuronal excitability, sodium channel expression, and nodal architecture. J Neurosci 24:4030-4042.
Cheron G, Servais L, Wagstaff J, Dan B (2005) Fast cerebellar oscillation associated with ataxia in a mouse model of angelman syndrome. Neuroscience 130:631-637.
Cheron G, Gall D, Servais L, Dan B, Maex R, Schiffmann SN (2004) Inactivation of calcium-binding protein genes induces 160 hz oscillations in the cerebellar cortex of alert mice. J Neurosci 24:434-441.
Choi BH, Choi JS, Yoon SH, Rhie DJ, Min DS, Jo YH, Kim MS, Hahn SJ (2001) Effects of norfluoxetine, the major metabolite of fluoxetine, on the cloned neuronal potassium channel Kv3.1. Neuropharmacology 41:443-453.
Chow A, Erisir A, Farb C, Nadal MS, Ozaita A, Lau D, Welker E, Rudy B (1999) K(+) channel expression distinguishes subpopulations of parvalbumin- and somatostatin-containing neocortical interneurons. J Neurosci 19:9332-9345.
Coltz JD, Johnson MT, Ebner TJ (1999) Cerebellar purkinje cell simple spike discharge encodes movement velocity in primates during visuomotor arm tracking. J Neurosci 19:1782-1803.
Critz SD, Wible BA, Lopez HS, Brown AM (1993) Stable expression and regulation of a rat brain K+ channel. J Neurochem 60:1175-1178.

197
Czubayko U, Sultan F, Thier P, Schwarz C (2001) Two types of neurons in the rat cerebellar nuclei as distinguished by membrane potentials and intracellular fillings. J Neurophysiol 85:2017-2029.
de Solages C, Szapiro G, Brunel N, Hakim V, Isope P, Buisseret P, Rousseau C, Barbour B, Lena C (2008) High-frequency organization and synchrony of activity in the purkinje cell layer of the cerebellum. Neuron 58:775-788.
De Zeeuw CI, Berrebi AS (1995) Postsynaptic targets of purkinje cell terminals in the cerebellar and vestibular nuclei of the rat. Eur J Neurosci 7:2322-2333.
Deng Q, Rashid AJ, Fernandez FR, Turner RW, Maler L, Dunn RJ (2005) A C-terminal domain directs Kv3.3 channels to dendrites. J Neurosci 25:11531-11541.
Denk W, Sugimori M, Llinas R (1995) Two types of calcium response limited to single spines in cerebellar purkinje cells. Proc Natl Acad Sci U S A 92:8279-8282.
Desai R, Kronengold J, Mei J, Forman SA, Kaczmarek LK (2008) Protein kinase C modulates inactivation of Kv3.3 channels. J Biol Chem 283:22283-22294.
Devaux J, Alcaraz G, Grinspan J, Bennett V, Joho R, Crest M, Scherer SS (2003) Kv3.1b is a novel component of CNS nodes. J Neurosci 23:4509-4518.
Diochot S, Schweitz H, Beress L, Lazdunski M (1998) Sea anemone peptides with a specific blocking activity against the fast inactivating potassium channel Kv3.4. J Biol Chem 273:6744-6749.
Dixon JE, McKinnon D (1996) Potassium channel mRNA expression in prevertebral and paravertebral sympathetic neurons. Eur J Neurosci 8:183-191.
Doyle DA, Cabral JM, Pfuetzer RA, Kuo A, Gulbis JM, Cohen SL, Chait BT, MacKinnon R (1998) The Structure of the Potassium Channel: Molecular Basis of K+ Conduction and Selectivity. Science 280: 69-77.
Duprat F, Guillemare E, Romey G, Fink M, Lesage F, Lazdunski M, Honore E (1995) Susceptibility of cloned K+ channels to reactive oxygen species. Proc Natl Acad Sci U S A 92:11796-11800.
Ebner TJ (1998) A role for the cerebellum in the control of limb movement velocity. Curr Opin Neurobiol 8:762-769.

198
Eccles JC, Llinas R, and Sasaki K (1966) The excitatory synaptic action of climbing fibres on the purkinje cells of the cerebellum. J Physiol 182:268-269-296.
Einat H, Yuan P, Szabo ST, Dogra S, Manji HK (2007) Protein kinase C inhibition by tamoxifen antagonizes manic-like behavior in rats: Implications for the development of novel therapeutics for bipolar disorder. Neuropsychobiology 55:123-131.
Emamian ES, Kaytor MD, Duvick LA, Zu T, Tousey SK, Zoghbi HY, Clark HB, Orr HT (2003) Serine 776 of ataxin-1 is critical for polyglutamine-induced disease in SCA1 transgenic mice. Neuron 38:375-387.
Engel AK, Singer W (2001) Temporal binding and the neural correlates of sensory awareness. Trends Cogn Sci 5:16-25.
Erickson MA, Haburcak M, Smukler L, Dunlap K (2007) Altered functional expression of purkinje cell calcium channels precedes motor dysfunction in tottering mice. Neuroscience 150:547-555.
Espinosa F, Torres-Vega MA, Marks GA, Joho RH (2008) Ablation of Kv3.1 and Kv3.3 potassium channels disrupts thalamocortical oscillations in vitro and in vivo. J Neurosci 28:5570-5581.
Espinosa F, Marks G, Heintz N, Joho RH (2004a) Increased motor drive and sleep loss in mice lacking Kv3-type potassium channels. Genes Brain Behav 3:90-100.
Espinosa F, Marks G, Heintz N, Joho RH (2004b) Increased motor drive and sleep loss in mice lacking Kv3-type potassium channels. Genes Brain Behav 3:90-100.
Espinosa F, McMahon A, Chan E, Wang S, Ho CS, Heintz N, Joho RH (2001) Alcohol hypersensitivity, increased locomotion, and spontaneous myoclonus in mice lacking the potassium channels Kv3.1 and Kv3.3. J Neurosci 21:6657-6665.
Fernandez FR, Morales E, Rashid AJ, Dunn RJ, Turner RW (2003) Inactivation of Kv3.3 potassium channels in heterologous expression systems. J Biol Chem 278:40890-40898.
Forti L, Cesana E, Mapelli J, D'Angelo Edgidio (2006) Ionic mechanisms of autorhythmic firing in rat cerebellar Golgi cells. J Physiol 574: 711-729.

199
Fowler SC, Birkestrand BR, Chen R, Moss SJ, Vorontsova E, Wang G, Zarcone TJ (2001) A force-plate actometer for quantitating rodent behaviors: Illustrative data on locomotion, rotation, spatial patterning, stereotypies, and tremor. J Neurosci Methods 107:107-124.
Friederich P, Benzenberg D, Urban BW (2002) Bupivacaine inhibits human neuronal Kv3 channels in SH-SY5Y human neuroblastoma cells. Br J Anaesth 88:864-866.
Fukuda M, Yamamoto T, Llinas R (2001) The isochronic band hypothesis and climbing fibre regulation of motricity: An experimental study. Eur J Neurosci 13:315-326.
Gabbiani F, Midtgaard J, Knopfel T (1994) Synaptic integration in a model of cerebellar granule cells. J Neurophysiol 72:999-1009.
Gauck V, Jaeger D (2000) The control of rate and timing of spikes in the deep cerebellar nuclei by inhibition. J Neurosci 20:3006-3016.
Ghez C, Thach W (2000) The cerebellum. In: Principles of neural science (Kandel E, Schwartz J, Jessell T, eds), pp832-833-852. New York: McGraw Hill.
Gittis AH, du Lac S (2007) Firing properties of GABAergic versus non-GABAergic vestibular nucleus neurons conferred by a differential balance of potassium currents. J Neurophysiol 97:3986-3996.
Goldberg EM, Watanabe S, Chang SY, Joho RH, Huang ZJ, Leonard CS, Rudy B (2005) Specific functions of synaptically localized potassium channels in synaptic transmission at the neocortical GABAergic fast-spiking cell synapse. J Neurosci 25:5230-5235.
Goldman-Wohl DS, Chan E, Baird D, Heintz N (1994) Kv3.3b: A novel shaw type potassium channel expressed in terminally differentiated cerebellar purkinje cells and deep cerebellar nuclei. J Neurosci 14:511-522.
Goldowitz D, Moran TH, Wetts R (1992) Mouse chimeras in the study of genetic and structural determinants of behavior. In: Techniques for the genetic analysis of brain and behavior (Goldowitz D, Wahlsten D, Wimer RE, eds), Amsterdam: Elsevier.
Grissmer S, Ghanshani S, Dethlefs B, McPherson JD, Wasmuth JJ, Gutman GA, Cahalan MD, Chandy KG (1992) The shaw-related potassium channel gene,

200
Kv3.1, on human chromosome 11, encodes the type l K+ channel in T cells. J Biol Chem 267:20971-20979.
Hannigan JH, Riley EP (1988) Prenatal ethanol alters gait in rats. Alcohol 5:451-454.
Hartig W, Singer A, Grosche J, Brauer K, Ottersen OP, Bruckner G (2001) Perineuronal nets in the rat medial nucleus of the trapezoid body surround neurons immunoreactive for various amino acids, calcium-binding proteins and the potassium channel subunit Kv3.1b. Brain Res 899:123-133.
Hartig W, Derouiche A, Welt K, Brauer K, Grosche J, Mader M, Reichenbach A, Bruckner G (1999) Cortical neurons immunoreactive for the potassium channel Kv3.1b subunit are predominantly surrounded by perineuronal nets presumed as a buffering system for cations. Brain Res 842:15-29.
He Y, Zu T, Benzow KA, Orr HT, Clark HB, Koob MD (2006) Targeted deletion of a single Sca8 ataxia locus allele in mice causes abnormal gait, progressive loss of motor coordination, and purkinje cell dendritic deficits. J Neurosci 26:9975-9982.
Heck DH, Boughter J, and Bryant J (2006) Inverted neuronal code in the cerebellum: Pauses in purkinje cell activity are correlated with rhythmic movements. Proc Soc Neurosci 32:.
Herson PS, Virk M, Rustay NR, Bond CT, Crabbe JC, Adelman JP, Maylie J (2003) A mouse model of episodic ataxia type-1. Nat Neurosci 6:378-383.
Ho CS (1996) Generation and characterization of a mutant mouse carrying the disrupted gene for the voltage-gated potassium channel Kv3.1.
Ho CS, Grange RW, Joho RH (1997) Pleiotropic effects of a disrupted K+ channel gene: Reduced body weight, impaired motor skill and muscle contraction, but no seizures. Proc Natl Acad Sci U S A 94:1533-1538.
Hoshino M, Nakamura S, Mori K, Kawauchi T, Terao M, Nishimura YV, Fukuda A, Fuse T, Matsuo N, Sone M, Watanabe M, Bito H, Terashima T, Wright CV, Kawaguchi Y, Nakao K, Nabeshima Y (2005) Ptf1a, a bHLH transcriptional gene, defines GABAergic neuronal fates in cerebellum. Neuron 47:201-213.
Hourez RH, Millard I, Servais L, Vig PJ, Orr HT, Gall D, Pandolfo M, Schiffmann SN (2007) Early electrophysiological anomalies of purkinje cells in a transgenic mouse model of spinocerebellar ataxia type 1 (SCA1). Proc Soc Neurosci 33:.

201
Hurlock EC, McMahon A, Joho RH (2008) Purkinje-cell-restricted restoration of Kv3.3 function restores complex spikes and rescues motor coordination in Kcnc3 mutants. J Neurosci 28:4640-4648.
Ichinohe N, Watakabe A, Miyashita T, Yamamori T, Hashikawa T, Rockland KS (2004) A voltage-gated potassium channel, Kv3.1b, is expressed by a subpopulation of large pyramidal neurons in layer 5 of the macaque monkey cortex. Neuroscience 129:179-185.
Ishikawa T, Nakamura Y, Saitoh N, Li WB, Iwasaki S, Takahashi T (2003) Distinct roles of Kv1 and Kv3 potassium channels at the calyx of held presynaptic terminal. J Neurosci 23:10445-10453.
Ito M (2000) Mechanisms of motor learning in the cerebellum. Brain Res 886:237-245.
Ito M (1984) The modifiable neuronal network of the cerebellum. Jpn J Physiol 34:781-792.
Ito M, Simpson JI (1971) Discharges in purkinje cell axons during climbing fiber activation. Brain Res 31:215-219.
Jeub M, Herbst M, Spauschus A, Fleischer H, Klockgether T, Wuellner U, Evert BO (2006) Potassium channel dysfunction and depolarized resting membrane potential in a cell model of SCA3. Exp Neurol 201:182-192.
Joho RH, Ho CS, Marks GA (1999) Increased gamma- and decreased delta-oscillations in a mouse deficient for a potassium channel expressed in fast-spiking interneurons. J Neurophysiol 82:1855-1864.
Joho RH, Street C, Matsushita S, Knopfel T (2006) Behavioral motor dysfunction in Kv3-type potassium channel-deficient mice. Genes Brain Behav 5:472-482.
Jorntell H, Ekerot CF (2002) Reciprocal bidirectional plasticity of parallel fiber receptive fields in cerebellar purkinje cells and their afferent interneurons. Neuron 34:797-806.
Kaczmarek LK (2006) Non-conducting functions of voltage-gated ion channels. Nat Rev Neurosci 7:761-771.
Kalume F, Yu FH, Westenbroek RE, Scheuer T, Catterall WA (2007) Reduced sodium current in purkinje neurons from Nav1.1 mutant mice: Implications for ataxia in severe myoclonic epilepsy in infancy. J Neurosci 27:11065-11074.

202
Kanemasa T, Gan L, Perney TM, Wang LY, Kaczmarek LK (1995) Electrophysiological and pharmacological characterization of a mammalian shaw channel expressed in NIH 3T3 fibroblasts. J Neurophysiol 74:207-217.
Khaliq ZM, Raman IM (2005) Axonal propagation of simple and complex spikes in cerebellar purkinje neurons. J Neurosci 25:454-463.
Kim SE, Ahn HS, Choi BH, Jang HJ, Kim MJ, Rhie DJ, Yoon SH, Jo YH, Kim MS, Sung KW, Hahn SJ (2007) Open channel block of A-type, kv4.3, and delayed rectifier K+ channels, Kv1.3 and Kv3.1, by sibutramine. J Pharmacol Exp Ther 321:753-762.
Kitai ST, McCrea RA, Preston RJ, Bishop GA (1977) Electrophysiological and horseradish peroxidase studies of precerebellar afferents to the nucleus interpositus anterior. I. climbing fiber system. Brain Res 122:197-214.
Kitazawa S, Wolpert DM (2005) Rhythmicity, randomness and synchrony in climbing fiber signals. Trends Neurosci 28:611-619.
Kitazawa S, Kimura T, Yin PB (1998) Cerebellar complex spikes encode both destinations and errors in arm movements. Nature 392:494-497.
Kleim JA, Swain RA, Armstrong KA, Napper RM, Jones TA, Greenough WT (1998) Selective synaptic plasticity within the cerebellar cortex following complex motor skill learning. Neurobiol Learn Mem 69:274-289.
Lau D, Vega-Saenz de Miera EC, Contreras D, Ozaita A, Harvey M, Chow A, Noebels JL, Paylor R, Morgan JI, Leonard CS, Rudy B (2000) Impaired fast-spiking, suppressed cortical inhibition, and increased susceptibility to seizures in mice lacking Kv3.2 K+ channel proteins. J Neurosci 20:9071-9085.
Laube G, Roper J, Pitt JC, Sewing S, Kistner U, Garner CC, Pongs O, Veh RW (1996) Ultrastructural localization of shaker-related potassium channel subunits and synapse-associated protein 90 to septate-like junctions in rat cerebellar pinceaux. Brain Res Mol Brain Res 42:51-61.
Lepicard EM, Venault P, Negroni J, Perez-Diaz F, Joubert C, Nosten-Bertrand M, Berthoz A, Chapouthier G (2003) Posture and balance responses to a sensory challenge are related to anxiety in mice. Psychiatry Res 118:273-284.
Levin SI, Khaliq ZM, Aman TK, Grieco TM, Kearney JA, Raman IM, Meisler MH (2006) Impaired motor function in mice with cell-specific knockout of sodium channel Scn8a (NaV1.6) in cerebellar purkinje neurons and granule cells. J Neurophysiol 96:785-793.

203
Lien CC, Jonas P (2003) Kv3 potassium conductance is necessary and kinetically optimized for high-frequency action potential generation in hippocampal interneurons. J Neurosci 23:2058-2068.
Linnemann C, Sultan F, Pedroarena CM, Schwarz C, Thier P (2004) Lurcher mice exhibit potentiation of GABA(A)-receptor-mediated conductance in cerebellar nuclei neurons in close temporal relationship to purkinje cell death. J Neurophysiol 91:1102-1107.
Liu SQ, Kaczmarek LK (2005) Aminoglycosides block the Kv3.1 potassium channel and reduce the ability of inferior colliculus neurons to fire at high frequencies. J Neurobiol 62:439-452.
Llinas R, Muhlethaler M (1988) Electrophysiology of guinea-pig cerebellar nuclear cells in the in vitro brain stem-cerebellar preparation. J Physiol 404:241-258.
Llinas R, Ribary U, Contreras D, Pedroarena C (1998) The neuronal basis for consciousness. Philos Trans R Soc Lond B Biol Sci 353:1841-1849.
Luneau C, Wiedmann R, Smith JS, Williams JB (1991a) Shaw-like rat brain potassium channel cDNA's with divergent 3' ends. FEBS Lett 288:163-167.
Luneau CJ, Williams JB, Marshall J, Levitan ES, Oliva C, Smith JS, Antanavage J, Folander K, Stein RB, Swanson R (1991b) Alternative splicing contributes to K+ channel diversity in the mammalian central nervous system. Proc Natl Acad Sci U S A 88:3932-3936.
Macica CM, von Hehn CA, Wang LY, Ho CS, Yokoyama S, Joho RH, Kaczmarek LK (2003) Modulation of the kv3.1b potassium channel isoform adjusts the fidelity of the firing pattern of auditory neurons. J Neurosci 23:1133-1141.
Malumbres M, Mangues R, Ferrer N, Lu S, Pellicer A (1997) Isolation of high molecular weight DNA for reliable genotyping of transgenic mice. BioTechniques 22:1114-1119.
Mariotti C, Fancellu R, Di Donato S (2005) An overview of the patient with ataxia. J Neurol 252:511-518.
Marr D (1969) A theory of cerebellar cortex. J Physiol 202:437-470.
Martin LA, Goldowitz D, Mittleman G (2003) The cerebellum and spatial ability: Dissection of motor and cognitive components with a mouse model system. Eur J Neurosci 18:2002-2010.

204
Martina M, Metz AE, Bean BP (2007) Voltage-dependent potassium currents during fast spikes of rat cerebellar purkinje neurons: Inhibition by BDS-I toxin. J Neurophysiol 97:563-571.
Martina M, Yao GL, Bean BP (2003) Properties and functional role of voltage-dependent potassium channels in dendrites of rat cerebellar purkinje neurons. J Neurosci 23:5698-5707.
Mathy A, Ho S, Davie JT, Clark BA, Hausser M (2007) Cerebellar climbing fiber axons transmit bursts of spikes. Proc Soc Neurosci 33:.
Matsukawa H, Wolf AM, Matsushita S, Joho RH, Knopfel T (2003) Motor dysfunction and altered synaptic transmission at the parallel fiber-purkinje cell synapse in mice lacking potassium channels Kv3.1 and Kv3.3. J Neurosci 23:7677-7684.
Mattick JS, Makunin IV (2005) Small regulatory RNAs in mammals. Hum Mol Genet 14 Spec No 1:R121-32.
McCrea RA, Bishop GA, Kitai ST (1977) Electrophysiological and horseradish peroxidase studies of precerebellar afferents to the nucleus interpositus anterior. II. mossy fiber system. Brain Res 122:215-228.
McCrossan ZA, Lewis A, Panaghie G, Jordan PN, Christini DJ, Lerner DJ, Abbott GW (2003) MinK-related peptide 2 modulates Kv2.1 and Kv3.1 potassium channels in mammalian brain. J Neurosci 23:8077-8091.
McKay BE, Turner RW (2005) Physiological and morphological development of the rat cerebellar purkinje cell. J Physiol 567:829-850.
McKay BE, Turner RW (2004) Kv3 K+ channels enable burst output in rat cerebellar purkinje cells. Eur J Neurosci 20:729-739.
McMahon A, Fowler SC, Perney TM, Akemann W, Knopfel T, Joho RH (2004) Allele-dependent changes of olivocerebellar circuit properties in the absence of the voltage-gated potassium channels Kv3.1 and Kv3.3. Eur J Neurosci 19:3317-3327.
Messiha FS (1993) Fluoxetine: Adverse effects and drug-drug interactions. J Toxicol Clin Toxicol 31:603-630.
Miall RC, Keating JG, Malkmus M, Thach WT (1998) Simple spike activity predicts occurrence of complex spikes in cerebellar purkinje cells. Nat Neurosci 1:13-15.

205
Middleton SJ, Racca C, Cunningham MO, Traub RD, Monyer H, Knopfel T, Schofield IS, Jenkins A, Whittington MA (2008) High-frequency network oscillations in cerebellar cortex. Neuron 58:763-774.
Miki T, Zwingman TA, Wakamori M, Lutz CM, Cook SA, Hosford DA, Herrup K, Fletcher CF, Mori Y, Frankel WN, Letts VA (2008) Two novel alleles of tottering with distinct ca(v)2.1 calcium channel neuropathologies. Neuroscience 155:31-44.
Molineux ML, McRory JE, McKay BE, Hamid J, Mehaffey WH, Rehak R, Snutch TP, Zamponi GW, Turner RW (2006) Specific T-type calcium channel isoforms are associated with distinct burst phenotypes in deep cerebellar nuclear neurons. Proc Natl Acad Sci U S A 103:5555-5560.
Monsivais P, Clark BA, Roth A, Hausser M (2005) Determinants of action potential propagation in cerebellar purkinje cell axons. J Neurosci 25:464-472.
Morales E, Fernandez FR, Sinclair S, Molineux ML, Mehaffey WH, Turner RW (2004) Releasing the peri-neuronal net to patch-clamp neurons in adult CNS. Pflugers Arch 448:248-258.
Moreno H, Kentros C, Bueno E, Weiser M, Hernandez A, Vega-Saenz de Miera E, Ponce A, Thornhill W, Rudy B (1995) Thalamocortical projections have a K+ channel that is phosphorylated and modulated by cAMP-dependent protein kinase. J Neurosci 15:5486-5501.
Nakamura Y, Takahashi T (2007) Developmental changes in potassium currents at the rat calyx of held presynaptic terminal. J Physiol 581:1101-1112.
Nakao H, Nakao K, Kano M, Aiba A (2007) Metabotropic glutamate receptor subtype-1 is essential for motor coordination in the adult cerebellum. Neurosci Res 57:538-543.
Nilsson JM, Madeja M, Elinder F, Arhem P (2008) Bupivacaine blocks N-type inactivating kv channels in the open state: No allosteric effect on inactivation kinetics. Biophys J .
Nolan MF, Malleret G, Lee KH, Gibbs E, Dudman JT, Santoro B, Yin D, Thompson RF, Siegelbaum SA, Kandel ER, Morozov A (2003) The hyperpolarization-activated HCN1 channel is important for motor learning and neuronal integration by cerebellar purkinje cells. Cell 115:551-564.

206
Ojakangas CL, Ebner TJ (1994) Purkinje cell complex spike activity during voluntary motor learning: Relationship to kinematics. J Neurophysiol 72:2617-2630.
Ovsepian SV, Friel DD (2008) The leaner P/Q-type calcium channel mutation renders cerebellar purkinje neurons hyper-excitable and eliminates Ca2+-na+ spike bursts. Eur J Neurosci 27:93-103.
Ozaita A, Martone ME, Ellisman MH, Rudy B (2002) Differential subcellular localization of the two alternatively spliced isoforms of the Kv3.1 potassium channel subunit in brain. J Neurophysiol 88:394-408.
Palay SL, Chan-Palay V (1974) Cerebellar cortex: Cytology and organization. New York: Springer-Verlag.
Pedroarena CM, Schwarz C (2003) Efficacy and short-term plasticity at GABAergic synapses between purkinje and cerebellar nuclei neurons. J Neurophysiol 89:704-715.
Perney TM, Marshall J, Martin KA, Hockfield S, Kaczmarek LK (1992) Expression of the mRNAs for the Kv3.1 potassium channel gene in the adult and developing rat brain. J Neurophysiol 68:756-766.
Peters HC, Hu H, Pongs O, Storm JF, Isbrandt D (2005) Conditional transgenic suppression of M channels in mouse brain reveals functions in neuronal excitability, resonance and behavior. Nat Neurosci 8:51-60.
Porcello DM, Ho CS, Joho RH, Huguenard JR (2002) Resilient RTN fast spiking in Kv3.1 null mice suggests redundancy in the action potential repolarization mechanism. J Neurophysiol 87:1303-1310.
Raman IM, Sprunger LK, Meisler MH, Bean BP (1997) Altered subthreshold sodium currents and disrupted firing patterns in purkinje neurons of Scn8a mutant mice. Neuron 19:881-891.
Rettig J, Wunder F, Stocker M, Lichtinghagen R, Mastiaux F, Beckh S, Kues W, Pedarzani P, Schroter KH, Ruppersberg JP (1992) Characterization of a shaw-related potassium channel family in rat brain. EMBO J 11:2473-2486.
Riant F, Mourtada R, Saugier-Veber P, Tournier-Lasserve E (2008) Large CACNA1A deletion in a family with episodic ataxia type 2. Arch Neurol 65:817-820.

207
Rudy B, Kentros C, Weiser M, Fruhling D, Serodio P, Vega-Saenz de Miera E, Ellisman MH, Pollock JA, Baker H (1992) Region-specific expression of a K+ channel gene in brain. Proc Natl Acad Sci U S A 89:4603-4607.
Rudy B, Chow A, Lau D, Amarillo Y, Ozaita A, Saganich M, Moreno H, Nadal MS, Hernandez-Pineda R, Hernandez-Cruz A, Erisir A, Leonard C, Vega-Saenz de Miera E (1999) Contributions of Kv3 channels to neuronal excitability. Ann N Y Acad Sci 868:304-343.
Sanchez JA, Ho CS, Vaughan DM, Garcia MC, Grange RW, Joho RH (2000) Muscle and motor-skill dysfunction in a K+ channel-deficient mouse are not due to altered muscle excitability or fiber type but depend on the genetic background. Pflugers Arch 440:34-41.
Sato Y, Miura A, Fushiki H, Kawasaki T (1992) Short-term modulation of cerebellar purkinje cell activity after spontaneous climbing fiber input. J Neurophysiol 68:2051-2062.
Sausbier M, Hu H, Arntz C, Feil S, Kamm S, Adelsberger H, Sausbier U, Sailer CA, Feil R, Hofmann F, Korth M, Shipston MJ, Knaus HG, Wolfer DP, Pedroarena CM, Storm JF, Ruth P (2004) Cerebellar ataxia and purkinje cell dysfunction caused by Ca2+-activated K+ channel deficiency. Proc Natl Acad Sci U S A 101:9474-9478.
Schiffmann SN, Cheron G, Lohof A, d'Alcantara P, Meyer M, Parmentier M, Schurmans S (1999) Impaired motor coordination and purkinje cell excitability in mice lacking calretinin. Proc Natl Acad Sci U S A 96:5257-5262.
Schlaggar BL, Mink JW (2003) Movement disorders in children. Pediatr Rev 24:39-51.
Schmahmann JD (2002) The role of the cerebellum in affect and psychosis. In: The cerebellum and its disorders The role of the cerebellum in affect and psychosis. pp136. Cambridge: Cambridge University Press.
Schonewille M, Khosrovani S, Winkelman BH, Hoebeek FE, De Jeu MT, Larsen IM, Van der Burg J, Schmolesky MT, Frens MA, De Zeeuw CI (2006) Purkinje cells in awake behaving animals operate at the upstate membrane potential. Nat Neurosci 9:459-61; author reply 461.
Sekirnjak C, Vissel B, Bollinger J, Faulstich M, du Lac S (2003) Purkinje cell synapses target physiologically unique brainstem neurons. J Neurosci 23:6392-6398.

208
Sekirnjak C, Martone ME, Weiser M, Deerinck T, Bueno E, Rudy B, Ellisman M (1997) Subcellular localization of the K+ channel subunit Kv3.1b in selected rat CNS neurons. Brain Res 766:173-187.
Servais L, Bearzatto B, Hourez R, Dan B, Schiffmann SN, Cheron G (2004) Effect of simple spike firing mode on complex spike firing rate and waveform in cerebellar purkinje cells in non-anesthetized mice. Neurosci Lett 367:171-176.
Shakkottai VG, Chou CH, Oddo S, Sailer CA, Knaus HG, Gutman GA, Barish ME, LaFerla FM, Chandy KG (2004) Enhanced neuronal excitability in the absence of neurodegeneration induces cerebellar ataxia. J Clin Invest 113:582-590.
Shin SL, Rotter S, Aertsen A, De Schutter E (2007a) Stochastic description of complex and simple spike firing in cerebellar purkinje cells. Eur J Neurosci 25:785-794.
Shin SL, Hoebeek FE, Schonewille M, De Zeeuw CI, Aertsen A, De Schutter E (2007b) Regular patterns in cerebellar purkinje cell simple spike trains. PLoS ONE 2:e485.
Song P, Yang Y, Barnes-Davies M, Bhattacharjee A, Hamann M, Forsythe ID, Oliver DL, Kaczmarek LK (2005) Acoustic environment determines phosphorylation state of the Kv3.1 potassium channel in auditory neurons. Nat Neurosci 8:1335-1342.
Southan AP, Robertson B (2000) Electrophysiological characterization of voltage-gated K(+) currents in cerebellar basket and purkinje cells: Kv1 and Kv3 channel subfamilies are present in basket cell nerve terminals. J Neurosci 20:114-122.
Steinmayr M, Andre E, Conquet F, Rondi-Reig L, Delhaye-Bouchaud N, Auclair N, Daniel H, Crepel F, Mariani J, Sotelo C, Becker-Andre M (1998) Staggerer phenotype in retinoid-related orphan receptor alpha-deficient mice. Proc Natl Acad Sci U S A 95:3960-3965.
Steuber V, Mittmann W, Hoebeek FE, Silver RA, De Zeeuw CI, Hausser M, De Schutter E (2007) Cerebellar LTD and pattern recognition by purkinje cells. Neuron 54:121-136.
Stolze H, Klebe S, Petersen G, Raethjen J, Wenzelburger R, Witt K, Deuschl G (2002) Typical features of cerebellar ataxic gait. J Neurol Neurosurg Psychiatry 73:310-312.

209
Sultan F, Konig T, Mock M, Thier P (2002) Quantitative organization of neurotransmitters in the deep cerebellar nuclei of the lurcher mutant. J Comp Neurol 452:311-323.
Sung MJ, Ahn HS, Hahn SJ, Choi BH (2008) Open channel block of Kv3.1 currents by fluoxetine. J Pharmacol Sci 106:38-45.
Suter KJ, Jaeger D (2004) Reliable control of spike rate and spike timing by rapid input transients in cerebellar stellate cells. Neuroscience 124:305-317.
Tarnecki R (2003) Responses of the red nucleus neurons to limb stimulation after cerebellar lesions. Cerebellum 2:96-100.
Telgkamp P, Raman IM (2002) Depression of inhibitory synaptic transmission between purkinje cells and neurons of the cerebellar nuclei. J Neurosci 22:8447-8457.
Tempia F, Kano M, Schneggenburger R, Schirra C, Garaschuk O, Plant T, Konnerth A (1996) Fractional calcium current through neuronal AMPA-receptor channels with a low calcium permeability. J Neurosci 16:456-466.
Teune TM, van der Burg J, de Zeeuw CI, Voogd J, Ruigrok TJ (1998) Single purkinje cell can innervate multiple classes of projection neurons in the cerebellar nuclei of the rat: A light microscopic and ultrastructural triple-tracer study in the rat. J Comp Neurol 392:164-178.
Timofeev I, Steriade M (1997) Fast (mainly 30-100 hz) oscillations in the cat cerebellothalamic pathway and their synchronization with cortical potentials. J Physiol 504 ( Pt 1):153-168.
Trudeau MM, Dalton JC, Day JW, Ranum LP, Meisler MH (2006) Heterozygosity for a protein truncation mutation of sodium channel SCN8A in a patient with cerebellar atrophy, ataxia, and mental retardation. J Med Genet 43:527-530.
Uusisaari M, Obata K, Knopfel T (2007) Morphological and electrophysiological properties of GABAergic and non-GABAergic cells in the deep cerebellar nuclei. J Neurophysiol 97:901-911.
Vanderhoff BT, Miller KE (1997) Major depression: Assessing the role of new antidepressants. Am Fam Physician 55:249-54, 259-60.
Veh RW, Lichtinghagen R, Sewing S, Wunder F, Grumbach IM, Pongs O (1995) Immunohistochemical localization of five members of the Kv1 channel subunits:

210
Contrasting subcellular locations and neuron-specific co-localizations in rat brain. Eur J Neurosci 7:2189-2205.
Velumian AA, Zhang L, Pennefather P, Carlen PL (1997) Reversible inhibition of IK, IAHP, ih and ICa currents by internally applied gluconate in rat hippocampal pyramidal neurones. Pflugers Arch 433:343-350.
Vullhorst D, Jockusch H, Bartsch JW (2001) The genomic basis of K(V)3.4 potassium channel mRNA diversity in mice. Gene 264:29-35.
Vyazovskiy VV, Deboer T, Rudy B, Lau D, Borbely AA, Tobler I (2002) Sleep EEG in mice that are deficient in the potassium channel subunit K.v.3.2. Brain Res 947:204-211.
Walter JT, Alvina K, Womack MD, Chevez C, Khodakhah K (2006) Decreases in the precision of purkinje cell pacemaking cause cerebellar dysfunction and ataxia. Nat Neurosci 9:389-397.
Wang T, Parris J, Li L, Morgan JI (2006) The carboxypeptidase-like substrate-binding site in Nna1 is essential for the rescue of the purkinje cell degeneration (pcd) phenotype. Mol Cell Neurosci 33:200-213.
Watanabe D, Inokawa H, Hashimoto K, Suzuki N, Kano M, Shigemoto R, Hirano T, Toyama K, Kaneko S, Yokoi M, Moriyoshi K, Suzuki M, Kobayashi K, Nagatsu T, Kreitman RJ, Pastan I, Nakanishi S (1998) Ablation of cerebellar golgi cells disrupts synaptic integration involving GABA inhibition and NMDA receptor activation in motor coordination. Cell 95:17-27.
Watase K, Barrett CF, Miyazaki T, Ishiguro T, Ishikawa K, Hu Y, Unno T, Sun Y, Kasai S, Watanabe M, Gomez CM, Mizusawa H, Tsien RW, Zoghbi HY (2008) Spinocerebellar ataxia type 6 knockin mice develop a progressive neuronal dysfunction with age-dependent accumulation of mutant CaV2.1 channels. Proc Natl Acad Sci U S A 105:11987-11992.
Waters MF, Fee D, Figueroa KP, Nolte D, Muller U, Advincula J, Coon H, Evidente VG, Pulst SM (2005) An autosomal dominant ataxia maps to 19q13: Allelic heterogeneity of SCA13 or novel locus? Neurology 65:1111-1113.
Waters MF, Minassian NA, Stevanin G, Figueroa KP, Bannister JP, Nolte D, Mock AF, Evidente VG, Fee DB, Muller U, Durr A, Brice A, Papazian DM, Pulst SM (2006) Mutations in voltage-gated potassium channel KCNC3 cause degenerative and developmental central nervous system phenotypes. Nat Genet 38:447-451.

211
Weiser M, Vega-Saenz de Miera E, Kentros C, Moreno H, Franzen L, Hillman D, Baker H, Rudy B (1994) Differential expression of shaw-related K+ channels in the rat central nervous system. J Neurosci 14:949-972.
Weiser M, Bueno E, Sekirnjak C, Martone ME, Baker H, Hillman D, Chen S, Thornhill W, Ellisman M, Rudy B (1995) The potassium channel subunit KV3.1b is localized to somatic and axonal membranes of specific populations of CNS neurons. J Neurosci 15:4298-4314.
Welsh JP, Lang EJ, Suglhara I, Llinas R (1995) Dynamic organization of motor control within the olivocerebellar system. Nature 374:453-457.
Xu J, Yu W, Jan YN, Jan LY, Li M (1995) Assembly of voltage-gated potassium channels. conserved hydrophilic motifs determine subfamily-specific interactions between the alpha-subunits. J Biol Chem 270:24761-24768.
Xu M, Cao R, Xiao R, Zhu MX, Gu C (2007) The axon-dendrite targeting of Kv3 (shaw) channels is determined by a targeting motif that associates with the T1 domain and ankyrin G. J Neurosci 27:14158-14170.
Yakhnitsa V, Barmack NH (2006) Antiphasic purkinje cell responses in mouse uvula-nodulus are sensitive to static roll-tilt and topographically organized. Neuroscience 143:615-626.
Yamamoto K, Kawato M, Kotosaka S, Kitazawa S (2007) Encoding of movement dynamics by purkinje cell simple spike activity during fast arm movements under resistive and assistive force fields. J Neurophysiol 97:1588-1599.
Yartsev M, Givon-Mayo R, Maller M, and Donchin O (2007) Simple spike pauses in purkinje cells of the awake cat: Relation to behavioral events and complex spike activity. Proc Soc Neurosci 33:.
Yeung SY, Thompson D, Wang Z, Fedida D, Robertson B (2005) Modulation of Kv3 subfamily potassium currents by the sea anemone toxin BDS: Significance for CNS and biophysical studies. J Neurosci 25:8735-8745.
Zagha E, Lang EJ, Rudy B (2008) Kv3.3 channels at the purkinje cell soma are necessary for generation of the classical complex spike waveform. J Neurosci 28:1291-1300.
Zarate CA,Jr, Singh JB, Carlson PJ, Quiroz J, Jolkovsky L, Luckenbaugh DA, Manji HK (2007) Efficacy of a protein kinase C inhibitor (tamoxifen) in the treatment of acute mania: A pilot study. Bipolar Disord 9:561-570.

212
Zhang X, Baader SL, Bian F, Muller W, Oberdick J (2001) High level purkinje cell specific expression of green fluorescent protein in transgenic mice. Histochem Cell Biol 115:455-464.
Zoghbi HY, Orr HT (2008) Pathogenic mechanisms of a polyglutamine mediated neurodegenerative disease: SCA1. J Biol Chem .
Zu T, Duvick LA, Kaytor MD, Berlinger MS, Zoghbi HY, Clark HB, Orr HT (2004) Recovery from polyglutamine-induced neurodegeneration in conditional SCA1 transgenic mice. J Neurosci 24:8853-8861.
-