Embed Size (px)
Citation preview
The role of interpersonal contingency and self-focused
attention in the development of trust in clinical
paranoia: a virtual reality study
Gail Wingham
D.Clin.Psy Thesis (Volume 1)
2016
University College London
2
UCL Doctorate in Clinical Psychology
Thesis declaration form
I confirm that the work presented in this thesis is my own. Where information has been
derived from other sources, I confirm that this has been indicated in the thesis.
Signature:
Name: Gail Wingham
Date:
3
Overview
This thesis explores paranoia in clinical populations with psychosis. Part one presents a
systematic review and meta-analysis of psychological treatments for psychosis impacting
on paranoia. It provides an overview of current interventions, their feasibility and efficacy
in reducing paranoia. The review provides preliminary evidence for the acceptability and
efficacy of individual cognitive behavioural therapy for psychosis (CBTp) in improving
paranoia and associated distress. Results are discussed in the context of potential
mechanisms of treatment, limitations in generalisability, and the need for further clinical
trials investigating various psychological approaches to treating persecutory delusions and
comparisons with active treatment controls.
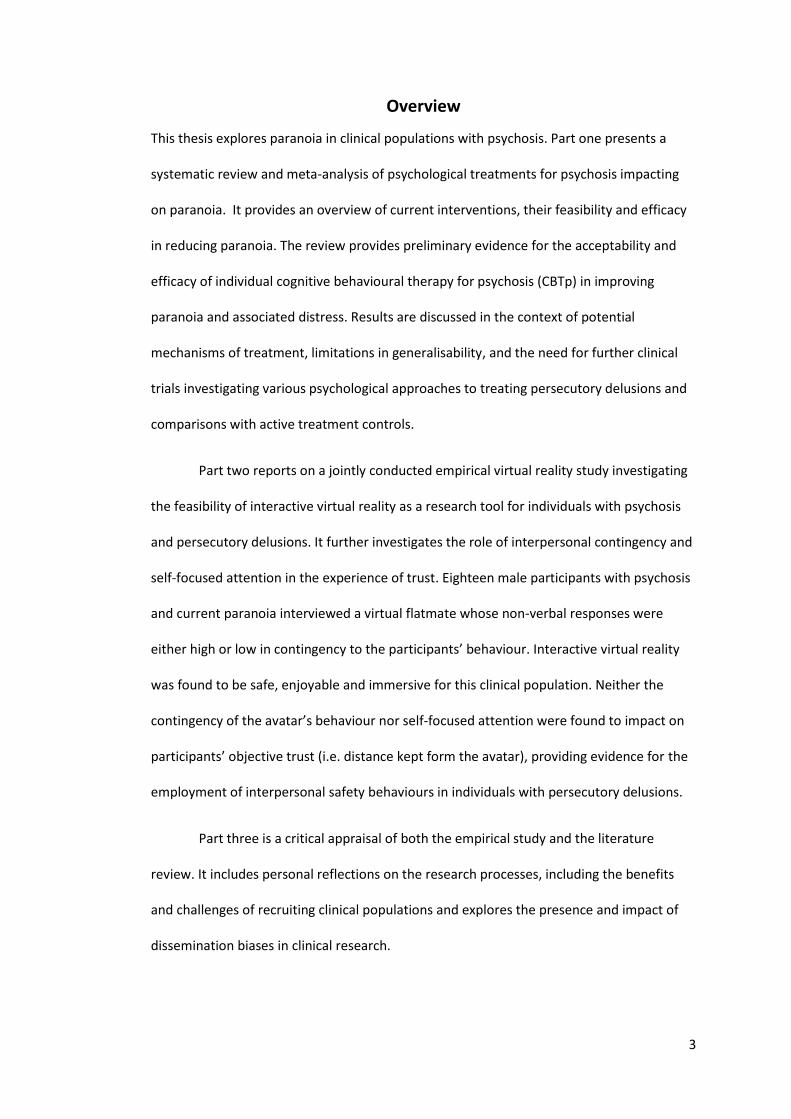
Part two reports on a jointly conducted empirical virtual reality study investigating
the feasibility of interactive virtual reality as a research tool for individuals with psychosis
and persecutory delusions. It further investigates the role of interpersonal contingency and
self-focused attention in the experience of trust. Eighteen male participants with psychosis
and current paranoia interviewed a virtual flatmate whose non-verbal responses were
either high or low in contingency to the participants’ behaviour. Interactive virtual reality
was found to be safe, enjoyable and immersive for this clinical population. Neither the
contingency of the avatar’s behaviour nor self-focused attention were found to impact on
participants’ objective trust (i.e. distance kept form the avatar), providing evidence for the
employment of interpersonal safety behaviours in individuals with persecutory delusions.
Part three is a critical appraisal of both the empirical study and the literature
review. It includes personal reflections on the research processes, including the benefits
and challenges of recruiting clinical populations and explores the presence and impact of
dissemination biases in clinical research.
4
Table of Contents
List of Tables ............................................................................................................................ 6
List of Figures ........................................................................................................................... 7
Acknowledgements ................................................................................................................. 8
Part 1: Literature Review ........................................................................................................ 9
Abstract .............................................................................................................................. 10
1. Introduction ................................................................................................................... 11
1.1. The evolution of psychological treatment for delusions ......................................... 11
1.2. Clinical relevance and treatment of persecutory delusions .................................... 14
1.3. The importance of treatment feasibility ................................................................. 16
1.4. Review objectives .................................................................................................... 17
2. Methods ......................................................................................................................... 18
2.1. Eligibility Criteria ..................................................................................................... 18
2.2. Information sources ................................................................................................ 18
2.3. Search ...................................................................................................................... 18
2.4. Study Selection ........................................................................................................ 20
2.5 Quality assessment .................................................................................................. 20
2.6 Assessment of efficacy of treatment ........................................................................ 21
3. Results ............................................................................................................................ 24
3.1. Characteristics of psychological treatments impacting on paranoia ...................... 24
3.2. Quality of the included studies ................................................................................ 30
3.3. Feasibility ................................................................................................................ 31
3.3. Efficacy of treatment ............................................................................................... 33
4. Discussion ....................................................................................................................... 43
4.1. Overview of findings ................................................................................................ 43
4.2. Psychological interventions acceptable for people with persecutory delusions ..... 44
4.3. Efficacy of treatment on a range of paranoia measures and related factors ......... 46
4.4. Strengths and limitations ........................................................................................ 49
4.5. Clinical implications ................................................................................................. 51
References ......................................................................................................................... 54
Part 2: Empirical Paper .......................................................................................................... 67
Abstract .............................................................................................................................. 68
1. Introduction ................................................................................................................... 69
1.1. Paranoia .................................................................................................................. 69
5
1.2. Social anxiety and paranoia .................................................................................... 70
1.3. Social anxiety, self-focused attention and interpersonal experiences .................... 70
1.4. Interpersonal contingency ....................................................................................... 71
1.5. Virtual reality research in paranoia ........................................................................ 72
1.6. Paranoia, interpersonal contingency and interpersonal distance .......................... 73
1.7. Study aims and hypotheses ..................................................................................... 74
2. Method .......................................................................................................................... 76
2.1. Design ...................................................................................................................... 76
2.2. Procedure ................................................................................................................ 78
2.3. Planned Data Analysis ............................................................................................. 90
2.4. Data screening ........................................................................................................ 93
3. Results ............................................................................................................................ 94
3.1. Descriptives ............................................................................................................. 94
3.2. Feasibility of the virtual reality scenario ................................................................. 97
3.3. Virtual reality outcomes ........................................................................................ 107
4. Discussion ..................................................................................................................... 110
4.1. Summary of findings ............................................................................................. 110
4.2. Limitations ............................................................................................................. 119
4.3. Future research and clinical implications .............................................................. 121
References ....................................................................................................................... 123
Part 3: Critical Appraisal ...................................................................................................... 135
1. Introduction ................................................................................................................. 136
2. A reflection on biases in clinical research .................................................................... 136
3. The highs and lows of conducting research with clinical populations ......................... 138
3.1. The need to engage clinical populations in experimental research ...................... 138
3.2. The barriers to recruiting clinical participants ...................................................... 139
3.3. The benefits of recruiting clinical populations ...................................................... 141
4. The issue of power – Baseyian vs Orthodox statistics in ‘hard to reach’ populations 143
References ....................................................................................................................... 145
Appendices ...................................................................................................................... 149
6
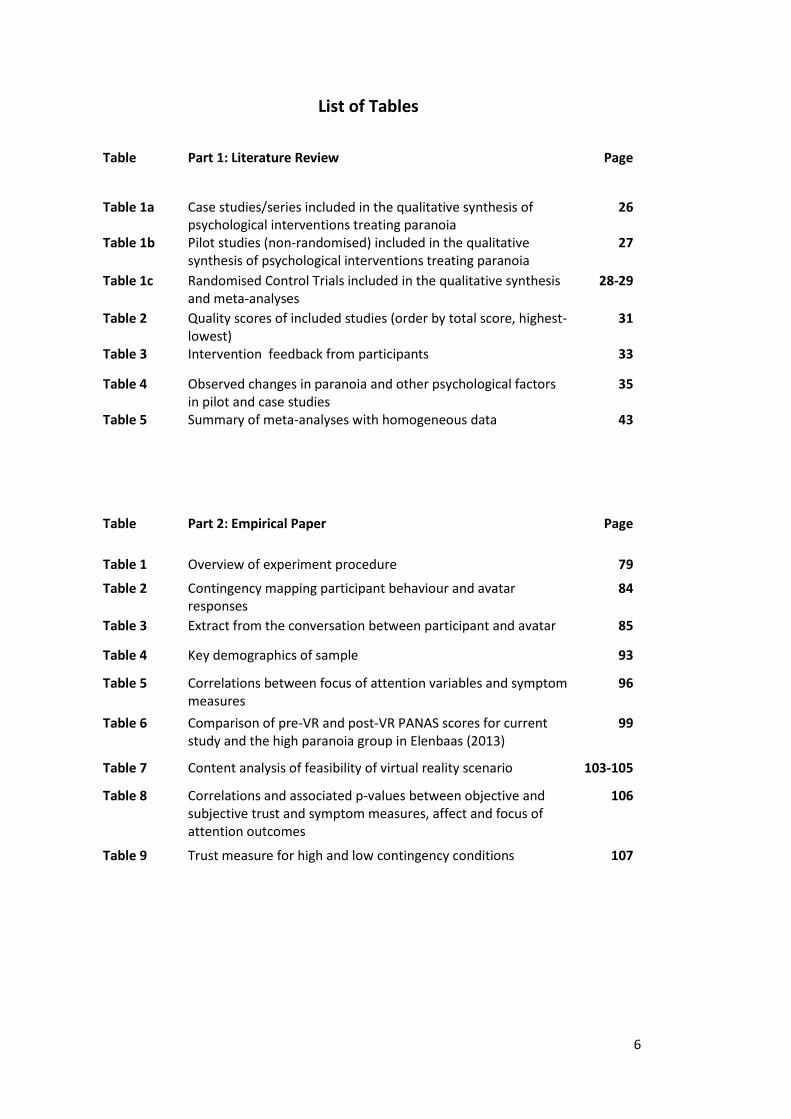
List of Tables
Table Part 1: Literature Review Page
Table 1a
Case studies/series included in the qualitative synthesis of psychological interventions treating paranoia
26
Table 1b Pilot studies (non-randomised) included in the qualitative synthesis of psychological interventions treating paranoia
27
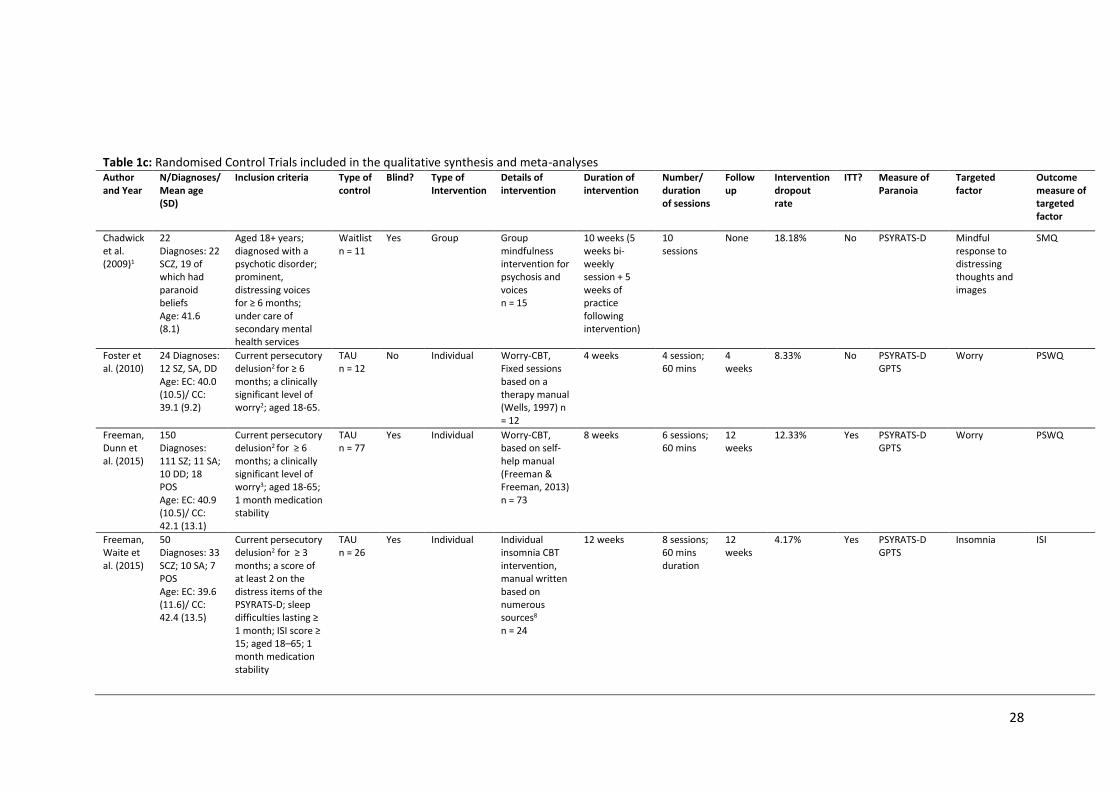
Table 1c Randomised Control Trials included in the qualitative synthesis and meta-analyses
28-29
Table 2 Quality scores of included studies (order by total score, highest-lowest)
31
Table 3 Intervention feedback from participants 33
Table 4 Observed changes in paranoia and other psychological factors in pilot and case studies
35
Table 5 Summary of meta-analyses with homogeneous data 43
Table Part 2: Empirical Paper Page
Table 1 Overview of experiment procedure 79
Table 2 Contingency mapping participant behaviour and avatar responses
84
Table 3 Extract from the conversation between participant and avatar 85
Table 4 Key demographics of sample 93
Table 5 Correlations between focus of attention variables and symptom measures
96
Table 6 Comparison of pre-VR and post-VR PANAS scores for current study and the high paranoia group in Elenbaas (2013)
99
Table 7 Content analysis of feasibility of virtual reality scenario 103-105
Table 8 Correlations and associated p-values between objective and subjective trust and symptom measures, affect and focus of attention outcomes
106
Table 9 Trust measure for high and low contingency conditions 107
7
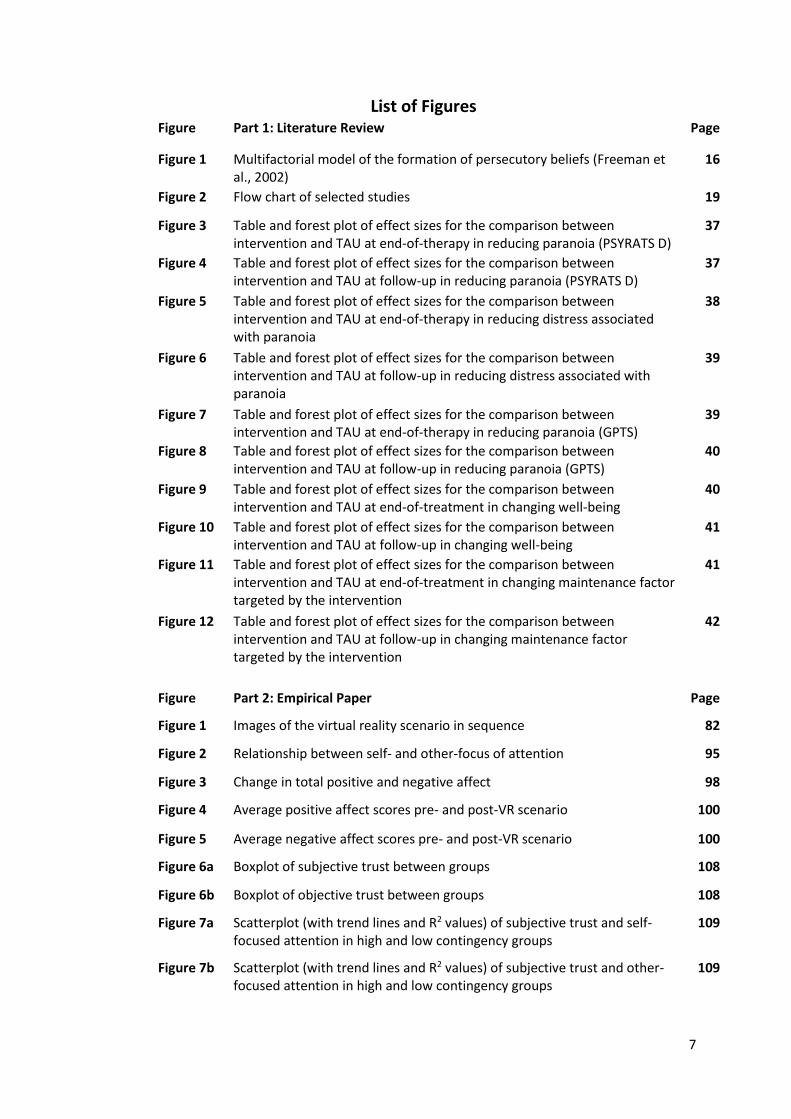
List of Figures Figure Part 1: Literature Review Page
Figure 1 Multifactorial model of the formation of persecutory beliefs (Freeman et al., 2002)
16
Figure 2 Flow chart of selected studies 19
Figure 3 Table and forest plot of effect sizes for the comparison between intervention and TAU at end-of-therapy in reducing paranoia (PSYRATS D)
37
Figure 4 Table and forest plot of effect sizes for the comparison between intervention and TAU at follow-up in reducing paranoia (PSYRATS D)
37
Figure 5 Table and forest plot of effect sizes for the comparison between intervention and TAU at end-of-therapy in reducing distress associated with paranoia
38
Figure 6 Table and forest plot of effect sizes for the comparison between intervention and TAU at follow-up in reducing distress associated with paranoia
39
Figure 7 Table and forest plot of effect sizes for the comparison between intervention and TAU at end-of-therapy in reducing paranoia (GPTS)
39
Figure 8 Table and forest plot of effect sizes for the comparison between intervention and TAU at follow-up in reducing paranoia (GPTS)
40
Figure 9 Table and forest plot of effect sizes for the comparison between intervention and TAU at end-of-treatment in changing well-being
40
Figure 10 Table and forest plot of effect sizes for the comparison between intervention and TAU at follow-up in changing well-being
41
Figure 11 Table and forest plot of effect sizes for the comparison between intervention and TAU at end-of-treatment in changing maintenance factor targeted by the intervention
41
Figure 12 Table and forest plot of effect sizes for the comparison between intervention and TAU at follow-up in changing maintenance factor targeted by the intervention
42
Figure Part 2: Empirical Paper Page
Figure 1 Images of the virtual reality scenario in sequence 82
Figure 2 Relationship between self- and other-focus of attention 95
Figure 3 Change in total positive and negative affect 98
Figure 4 Average positive affect scores pre- and post-VR scenario 100
Figure 5 Average negative affect scores pre- and post-VR scenario 100
Figure 6a Boxplot of subjective trust between groups 108
Figure 6b Boxplot of objective trust between groups 108
Figure 7a Scatterplot (with trend lines and R2 values) of subjective trust and self-focused attention in high and low contingency groups
109
Figure 7b Scatterplot (with trend lines and R2 values) of subjective trust and other-focused attention in high and low contingency groups
109
8
Acknowledgements
I would like to sincerely thank my research supervisors, Dr Miriam Fornells-Ambrojo and
Professor Chris Barker. Their wisdom, support and calm optimism undoubtedly allowed this
research project to weather its many storms. I am extraordinarily grateful that I had the
opportunity to work with such kind and talented researchers.
Thank you to Dr Amanda C de C Williams, my course tutor, without whom my literature
review would not have been possible. Her support throughout my years of training has kept
me going through every trial and tribulation.
I would like to also thank the other professionals who were invaluable to this research
project. Thank you to Dr David Swapp for providing access to the virtual reality lab at UCL
and for his faultless patience and flexibility with our volatile recruitment process. Thank you
to the Early Intervention teams who gave their time to listen to our research and went out
of their way to help us recruit their service users. Thank you too, to all the participants who
took the time and effort to help us with our research – it was a pleasure to work with them.
Thank you to my dear friend and research partner, Hannah Reidy. Our project could not have
survived without her incredible tenacity and enthusiasm, not to mention her exceptional
engagement skills. I am honoured to have worked alongside such a talented researcher and
clinician.
Finally, thank you to my wonderful family and friends. Their unwavering support, love and
guidance has carried me through this process. Words cannot express how grateful I am for
them.
9
Part 1: Literature Review
Efficacy and feasibility of psychological interventions targeting
paranoia in psychosis: a systematic review and meta-analysis
10
Abstract
Aim: Paranoia is one of the most common distressing experiences reported by people with
psychosis. In recent years, persecutory delusions have become the focal point of a number of
Cognitive Behavioural Therapy for psychosis (CBTp) interventions emerging in clinical literature.
Numerous meta-analytic reviews have assessed the efficacy of psychological interventions in
changing symptoms of psychosis, including delusions. However, no review has reviewed the
breadth, feasibility and efficacy of psychological interventions that have evaluated their impact
on paranoia.
Method: A systematic review identified 23 studies detailing interventions for persecutory
delusions, giving an overall synthesis of developments in paranoia interventions and treatment
feasibility. Six RCTs (1 group metacognitive training, 5 individual CBTp) were meta-analysed to
evaluate treatment efficacy compared to TAU.
Results: The synthesis of studies showed that interventions impacting on paranoia are
predominantly individual and from a CBT approach. Many were found to be from the same
research group. Meta-analyses found the group intervention to be ineffective. Further meta-
analyses of individual CBTp found a significant, small to medium effect size of intervention in
improving paranoia at end-of-treatment on two measures: the delusions subscale of the
Psychotic Symptoms Rating Scale (PSYRATS-D) (k = 5; d = 0.38) and Green et al. Paranoid
Thoughts Scale (GPTS) (k = 3; d = 0.31), the latter of which was sustained at follow-up (d = 0.39).
Significant, medium to large effect sizes of individual CBTp were found in improving distress
associated with paranoia (k = 3; d = 0.62) and well-being (k = 3; d = 0.50), predominantly
sustained at follow-up (d = 0.56 and d = 0.42).
Conclusion: There is a promising outlook for the efficacy and feasibility of CBTp for paranoia.
Low-intensity CBTp appears to be particularly useful for individuals with persecutory delusions.
The application of such interventions in clinical settings could stand to increase service-users
access to, and increase their choice of, psychological treatment for psychosis. However, in
future research, replication is needed in different settings and from different research groups.
11
1. Introduction
1.1. The evolution of psychological treatment for delusions
Before the emergence of Cognitive Behavioural Therapy for psychosis (CBTp) in the early
1990s, an assumption was held that psychotic symptoms, such as delusions, were
functionally different from ‘normal’ experiences (Jaspers, 1913). As such, targeting
delusions directly in therapy was viewed as either futile or detrimental as it was thought
that the patient would not be responsive to typical mechanisms of reason or learning.
The development of psychological therapies that directly target delusional beliefs
emerged from research indicating a continuum between normal and psychotic experiences
(McGovern and Turkington, 2001; van Os et al., 2009) and emotional and cognitive
correlates of psychotic symptoms (Garety et al., 2001). Developed from cognitive therapy,
individually tailored formulation-based CBTp combines broader therapeutic features (e.g.
psychoeducation, collaboration, guided discovery) with cognitive and behavioural
techniques that focus on changing key unhelpful cognitions (e.g. about the self and others)
and can also incorporate challenging the delusional belief itself. Research has
demonstrated that CBTp is effective in comparison to treatment as usual (TAU) in reducing
positive symptoms, negative symptoms, impairments in general functioning and symptoms
of depression (Gould, Mueser, Bolton, Mays & Goff, 2001; Rector & Beck, 2001;
Zimmerman, Favrod, Trieu & Pomini, 2005; Wykes, Steel, Everitt & Tarrier, 2008; Sarin,
Wallin & Widerlöv, 2011). The National Institute of Health and Care Excellence (NICE)
guidelines recommend a minimum of sixteen sessions of CBTp as a first-line treatment for
psychosis (NICE, 2014). These guidelines were informed by a meta-analysis conducted for
the purpose of the 2009 guidelines which included 31 randomised control trials (RCTs) that
predominantly delivered CBTp of this length (NICE, 2009). However, there is now a growing
body of evidence that briefer, low-intensity CBTp is similarly effective in treating psychosis.
Hazell et al. (2016) analysed 10 RCTs and found a moderate effect size of low-intensity
12
CBTp in reducing symptoms of psychosis compared to TAU (d = -0.46, 95%-CI: -0.06, -0.86).
Similarly, Naeem et al. (2016) found a moderate effect size of brief CBTp in 6 RCTs
compared to TAU (Hedge’s g = 0.43, 95%-CI: 0.24-0.63) and a small to moderate effect size
in comparison to other psychological treatments in 8 RCTs (Hedge’s g = 0.38, 95%-CI: 0.2-
0.57).
Studies investigating the efficacy of CBTp commonly report primary outcome
measures as overall symptom reduction, sometimes subdivided into positive and negative
symptoms. Thus meta-analyses report pooled estimates of effects for these more general
outcomes. For example, Gould, Mueser, Bolton, Mays & Goff (2001) analysed pre- post-
intervention change in symptoms of psychosis in 7 clinical trials. The reviewers found a
medium to large effect size of cognitive therapy (CT) in reducing overall symptoms (d =
0.65, 95%-CI: 0.56-0.71). Jauhar et al. (2014) analysed 34 RCT studies and found that
pooled effect sizes were in the ‘small’ range for all classes of symptoms i.e. overall
symptoms (d = -0.33, 95%-CI: -0.47, -0.19), positive symptoms (d = -0.25, 95%-CI: -0.37, -
0.13) and negative symptoms (d = -0.13, 95%-CI: -0.25, -0.01) in comparison to TAU.
However, this review found high heterogeneity in variance of effect sizes, suggesting a
limitation in considering all symptoms of psychosis in the analysis of efficacy of CBTp. A
Cochrane review (Jones, Hacker, Cormac, Meaden & Irving, 2012) compared CBTp to other
psychosocial interventions for psychosis. They found no significant effect of CBTp in
changing global mental state or positive and negative symptoms of schizophrenia in 4 RCTs.
Furthermore, the authors commented that very few studies measured impact of
interventions on quality of life and social functioning. Against a strong narrative of the
benefits of CBTp, they concluded that there is no clear and convincing argument for the
advantage of CBTp over other therapies for psychosis.
13
1.1.1 Effectiveness of psychological Interventions on specific symptoms
A recent meta-analysis investigated the effectiveness of CBTp in specifically reducing
delusions and hallucinations, rather than general positive symptoms. Van der Gaag et al.
(2014) analysed nine randomised controlled trials (RCTs) from a total of 50 RCTs of CBTp,
(identified in a recent review: Naeem, Farooq & Kingdon, 2014) which detailed secondary
outcome measures of change in delusions. They found a significant, small to medium effect
size of CBTp on delusions (Hedge’s g = 0.36) and a slightly stronger effect of CBTp on
hallucinations (Hedge’s g = 0.44), but did not report confidence intervals. In addition, CBT
for delusions in comparison to active control was non-significant. However, their inclusion
criteria of individually tailored formulation-based CBTp meant that studies using other
theory-driven approaches to changing delusions such as a worry-reduction CBT
intervention (Foster et al., 2010) or a coping skills based training (Cather et al., 2005) were
not considered in their review. Mehl, Werner & Lincoln (2015) conducted a meta-analysis
to specifically investigate the effect of CBTp on delusions which included both formulation-
based CBTp and other theory-driven CBT approaches. Analyses of twelve studies found
significant, small to medium effect sizes of CBTp vs. TAU at end-of-therapy (d = 0.27, 95%-
CI: 0.08, 0.47) and at an average follow-up period of 47 weeks (d = 0.25, 95%-CI: 0.07,
0.43). However, no significant effects were found for CBTp in comparison to other
interventions.
1.1.2 A New Strategy for Evaluating Psychological Interventions: How is Change Achieved?
In a review and revision of the Medical Research Council (MRC) framework for evaluating
complex interventions (Campbell, Fitzpatric, Haines & Kinmonth 2000), Craig et al. (2008)
put forward an important point – that there has perhaps been a misled urge to conduct
randomised controlled trials (RCTs) without preparatory work in developing the theory of
how change is to be achieved. The interventionist-causal model approach (Kendler and
Campbell, 2009) suggests that interventions should focus on one of several cognitive and
14
emotional factors hypothesised to be involved in the formation and maintenance of
delusions (Freeman, 2007; Garety, Bebbington, Fowler, Freeman & Kuipers, 2007; Freeman
& Garety, 2014).
Several interventions which have been developed to target cognitive and
emotional factors such as worry and self-confidence, use cognitive-behavioural techniques
to indirectly reduce the prevalence of hypothesised maintenance factors and the impact of
the delusion (e.g. Freeman, Waite et al., 2015; Waller et al., 2015). Mehl et al. (2015)
compared these causal-interventionist approach therapies (k = 4) with first-generation
studies and, at end of treatment, found a small to medium effect in favour of the newer
interventions. Furthermore, Mehl et al. (2015) included studies using causal-interventionist
therapies specifically tailored to change persecutory delusions but they did not separate
these from other forms of delusions in their analyses. To date, no meta-analysis has
specifically evaluated CBTp efficacy by delusion type or focused on persecutory delusions
alone.
1.2. Clinical relevance and treatment of persecutory delusions
Clinically, paranoia and persecutory delusions are most closely associated with a diagnosis
of psychosis, such as a schizophreniform or delusional disorder. In clinical populations,
those presenting with paranoid ideation are considered to be at the severe end of the
spectrum, with the most extreme form of ideation being persecutory delusions.
Persecutory delusions are beliefs held with high conviction that harm is occurring - or will
occur - to the individual and that that harm is intended by the persecutor (Freeman and
Garety, 2000). Persecutory delusions are one of the most common delusions (Cutting,
1997) and are strongly associated with high levels of distress and with admission to hospital
(Castle, Phelan, Wessely & Murray, 1994). Evidence also suggests that at the first episode
of psychosis, over 70% of patients have a persecutory delusion (Coid et al., 2013). In the
literature, a number of psychological models conceptualise the development and
15
maintenance of paranoid ideation. Three predominant models of persecutory delusions
exist: as a form of psychological self-esteem defence (Bentall et al., 1994; 2008); ‘poor-me’,
‘bad-me’ paranoia (Trower and Chadwick, 1995) and the cognitive multi-factorial model
(e.g. Freeman et al., 2002). These models have highlighted numerous cognitive and
emotional processes relevant to the phenomenon of clinical paranoia and, in doing so,
have informed the development of more recent psychological interventions for paranoia.
Freeman and Garety (2014) reviewed recent developments in understanding and
treating persecutory delusions. Outside of traditional CBTp given to individuals with
persecutory delusions, a number of cognitive therapies have more recently been developed
to target causal and maintenance factors such as worry (Foster et al., 2010; Freeman, Dunn
et al., 2015), interpersonal sensitivity (Bell and Freeman, 2014; Freeman et al., 2014),
insomnia (Freeman, Waite et al., 2015; Myers, Startup and Freeman, 2011), and reasoning
biases (Hepworth, Startup and Freeman, 2011; van Oosterhout et al., 2014; Waller et al.,
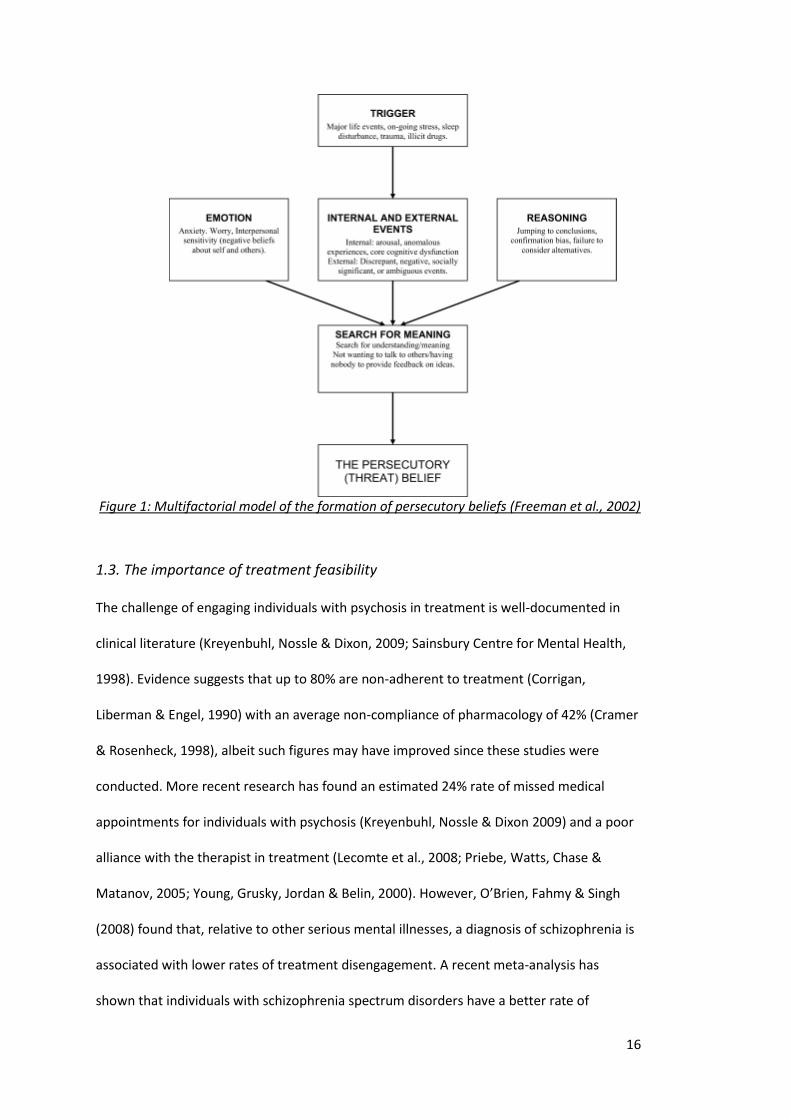
2015). These examples are notably developed from the cognitive multi-factorial model of
persecutory delusions, detailed in Figure 1, which focuses on either key emotional
processes (worry, interpersonal sensitivity), reasoning biases, or triggers (insomnia).
Freeman and Garety (2014) note in their review that pilot and RCT studies show initial
promising results for these interventions. However, to date no systematic, quantitative
assessment of the efficacy of CBTp for persecutory delusions has been undertaken.
16
Figure 1: Multifactorial model of the formation of persecutory beliefs (Freeman et al., 2002)
1.3. The importance of treatment feasibility
The challenge of engaging individuals with psychosis in treatment is well-documented in
clinical literature (Kreyenbuhl, Nossle & Dixon, 2009; Sainsbury Centre for Mental Health,
1998). Evidence suggests that up to 80% are non-adherent to treatment (Corrigan,
Liberman & Engel, 1990) with an average non-compliance of pharmacology of 42% (Cramer
& Rosenheck, 1998), albeit such figures may have improved since these studies were
conducted. More recent research has found an estimated 24% rate of missed medical
appointments for individuals with psychosis (Kreyenbuhl, Nossle & Dixon 2009) and a poor
alliance with the therapist in treatment (Lecomte et al., 2008; Priebe, Watts, Chase &
Matanov, 2005; Young, Grusky, Jordan & Belin, 2000). However, O’Brien, Fahmy & Singh
(2008) found that, relative to other serious mental illnesses, a diagnosis of schizophrenia is
associated with lower rates of treatment disengagement. A recent meta-analysis has
shown that individuals with schizophrenia spectrum disorders have a better rate of
17
engagement in psychosocial treatments compared to psychopharmacology adherence
(Villeneuve et al., 2010). Analysing 74 RCT studies, they found approximately 13% of
participants who had agreed to undergo psychological treatment dropped out prior to or
during therapy. Research has indicated that there is a more severe dropout rate among
individuals with severe delusions (Lincoln et al., 2014). Although dropout rates were not
investigated in relation to persecutory delusions, it is possible that the associated
difficulties of holding a persecutory belief (e.g. high anxiety, distrustfulness, social isolation)
would contribute to a greater difficulty in engagement. For example, Lawlor, Hall & Ellett
(2015) found that individuals with persecutory delusions experienced paranoia towards
their therapist, both in and between sessions. Although no participants dropped out of
treatment in this study, feelings of paranoia towards a therapist could undeniably disrupt
therapeutic engagement, particularly if this is not addressing by the therapist.
1.4. Review objectives
To date, no systematic review has investigated the efficacy and feasibility of psychological
treatments in reducing paranoia in psychosis populations. As such, this review has the
following research objectives and questions:
1. Provide a synthesis of the characteristics of psychological treatments (e.g. type of
intervention, treatment length) impacting on paranoia in psychosis literature to
date.
2. What is the feasibility of psychological treatments for paranoia, as measured by
treatment dropout rates and ratings of usefulness, satisfaction and interest?
3. What is the efficacy of psychological treatments for paranoia:
a. At the end-of-treatment and at follow-up?
b. In terms of overall persecutory delusion severity, frequency and
endorsement of paranoid ideas and distress associated with such beliefs?
18
c. Is general well-being improved?
4. Does the intervention change the targeted factors hypothesised to maintain
paranoia?
2. Methods
2.1. Eligibility Criteria
In order to be included in the qualitative review (feasibility and quality), studies needed to
meet the following criteria: 1) had to be an evaluation of a psychological intervention, 2)
report outcome data specific to persecutory delusions i.e. either the sample is broader
psychosis but paranoia change is measured or the sample is homogeneous with people
with persecutory delusions, 3) only peer reviewed studies published in the English language
were included.
In order for studies to be used in the meta-analysis to investigate efficacy of
interventions, studies needed to meet the previously mentioned inclusions criteria (criteria
1-3) and further meet the following inclusion criteria: 4) randomised control trial 5)
comparing a psychological therapy intervention (individual or group), 6) treatment as usual
(TAU) or another active control intervention (e.g. peer support).
2.2. Information sources
Relevant studies were identified by an electronic database search using three databases:
EMBASE, PUBMED and PSYCHinfo from 1987 to 14th December 2015 in English. Published
meta-analysis and reviews were also searched. Within each of these databases three
searches were conducted and combined.
2.3. Search
The first terms searched in the databases were “psychosis” OR “persecutory delusion*” OR
“paranoi*”. Next, databases were searched on the terms “cognitive therapy” OR “cognitive
behaviour therapy” OR “cognitive behaviour therapy” OR “cognitive behavioural therapy”
19
OR “cognitive behavioural therapy” OR “mindfulness” OR “group therapy” OR “group
intervention”. Following this, databases were search for the terms “RCT” OR “randomised
control trial” OR “randomized control trial” OR “pilot study” OR “case study”. Finally, all
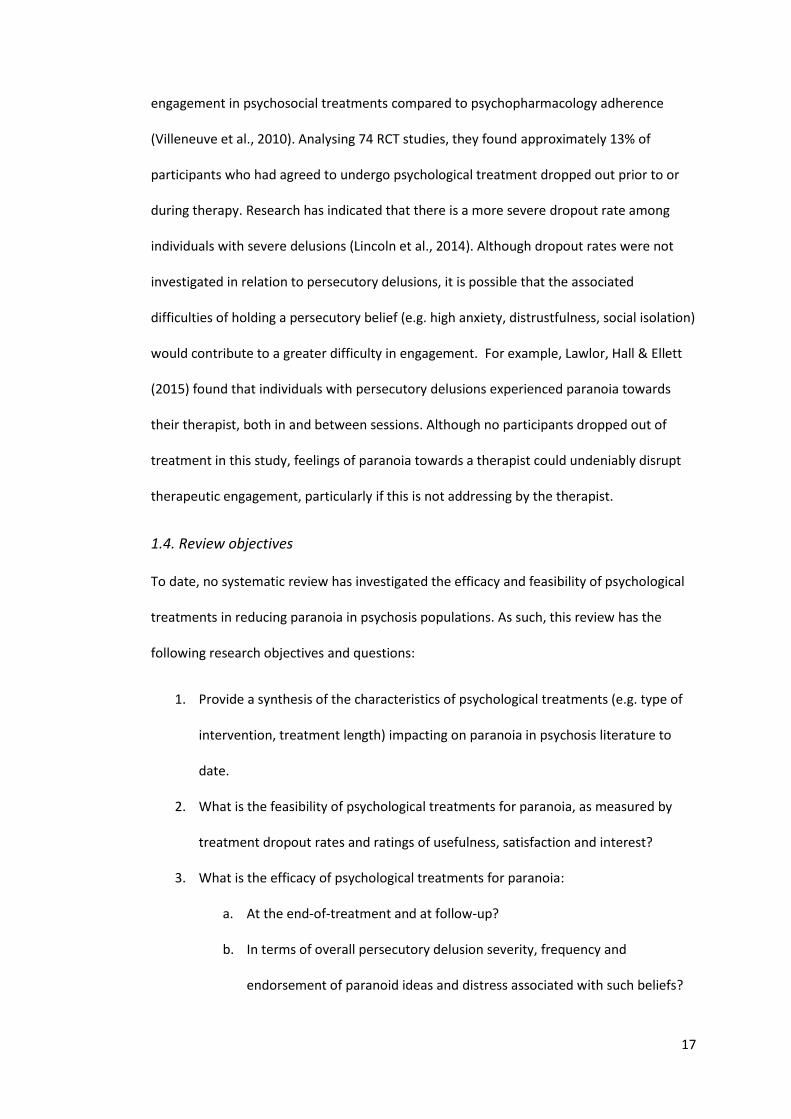
three searches were combined using the operator AND, which yielded 950 studies. The
removal of duplicates narrowed the search to 672 studies (see flow chart depicted on
Figure 2). Three further studies were added from other sources, resulting in a final total of
675 studies.
1.1
.Id
enti
fica
tio
n
1.4
. In
clu
ded
1
.3. E
ligib
ility
1
.2. S
cree
nin
g
Records identified through
database searching
(n = 950)
Additional records identified
through hand searches
(n = 4)
Records after duplicates
removed
(n = 672)
Records screened
(n = 676)
Records excluded Topic not relevant (n = 579)
Study protocol (n = 21)
Full-text articles assessed for
eligibility
(n = 76)
Full-text articles
excluded, with reasons
No measure of
paranoia/paranoia delusions not
specified
(n = 41)
Non-intervention paper (e.g.
review, correspondence)
(n = 5)
No standardised measure of
paranoia
(n = 3)
No measure of change
(n = 2)
Dual diagnosis of substance
misuse
(n = 1)
Non-clinical population
(n = 1)
Studies included in
qualitative synthesis
(n = 23)
Studies included for
quantitative synthesis
(treatment vs control group
comparison meta-analysis)
(n = 6)
20
Figure 2: Flow chart of selected studies
2.4. Study Selection
All papers were screened on titles and abstracts. Seventy-six full texts were read and
assessed for eligibility. Twenty-three studies fulfilled the criteria and were ultimately
included for the quantitative synthesis of the review. Of the excluded studies, 41 did not
specify delusions as paranoid or use a specific measure of paranoia, 5 were not
intervention papers (e.g. correspondence papers), 3 did not use standardised measures to
monitor paranoia, 2 did not give a measure of change and 2 did not include participants
who met the diagnostic criteria.
Of the 23 eligible studies included in the qualitative review, 6 studies were
identified as eligible for meta-analysis (see Table 1c). All studies not included in the meta-
analysis were excluded due to a lack of comparison group. It should be noted that one
study (Chadwick et al., 2009) was included in the qualitative review as the majority (86%)
were identified as suffering from paranoia. However, despite having a comparison group,
this study was excluded from the meta-analysis on the basis that the study did not have a
follow-up and it reported mean (pre-post) change rather than group means and standard
deviations.
2.5 Quality assessment
Quality of treatment and quality of methodology were coded by the author using a quality
rating scale developed by Yates et al. (2005) (see Appendix 1). This rating scale was
selected as it was specifically designed for assessing quality of randomised controlled trials
for psychological treatment and is evidenced to have good reliability and validity (Yates et
al., 2005). It also provides two subscales – one of treatment quality and – one of quality of
study design and methods. These can be combined to give an overall score of quality. The
scale has a maximum total quality score of 35, which is subdivided into a maximum
treatment quality score of 9 and a maximum design and methods quality score of 26.
21
Whilst some of the studies assessed in this review are not randomised controlled trials, the
majority of scale items are equally applicable to non-randomised studies and thus the scale
was deemed to be a valid comparison tool.
Feasibility of psychological interventions for paranoia was predominantly assessed
using the reported dropout rates prior to or during treatment as a measure of engagement
in treatment. Where reported, feasibility was also assessed using participants’ feedback on
the usefulness, and of their interest, enjoyment and satisfaction, of the intervention.
2.6 Assessment of efficacy of treatment
2.6.1. Meta-analyses
Statistical analyses were carried out in Review Manager (Version 5.3). Bias-corrected
standardised mean difference (d) were calculated on all outcome measures for every
intervention-control group comparison using pooled standard deviation as the standardiser
(Hedges and Olkin, 1985). A positive sign for d indicates that the intervention group
showed greater improvement after treatment than the control condition. Effect sizes were
calculated based on post-treatment data and follow-up data in order to estimate the long-
term effects of treatment.
Homogeneity of effect size was not assumed because the studies differ in various
ways (e.g. duration of treatment, format of therapy, measurement tool). Hence, a random-
effects model was fitted to the data to allow for variation in the true effect sizes (δi).
Heterogeneity was calculated using χ2 tests and the I2 statistic was reported. When I2 = 0%,
25%, 50% or 75%, then no, low, moderate and high heterogeneity must be assumed
(Higgins, Thompson, Deeks & Altman, 2003).
22
2.6.1.1. Paranoia assessment
2.6.1.1.1. Overall severity and distress associated with persecutory delusions
The most commonly used measure of paranoia severity was the delusion subscale of the
Psychotic Symptom Rating Scale (PSYRATS-D) (Haddock et al., 1999). The scale is largely
clinician-led, measuring delusions across six dimensions: amount of preoccupation,
duration of preoccupation, conviction, disruption, amount of distress and intensity of
distress. Five out of the six studies report a total PSYRATS D score as a primary measure of
change in persecutory delusion. Waller et al. (2015) used visual analogue scales (VAS) (scale
1-100) for three dimensions of persecutory delusions: conviction, distress and
preoccupation. This data was used for the primary meta-analysis investigating efficacy of
psychological treatment in reducing paranoia. Where subscale data was reported, sum
scores and pooled variance were calculated. Studies reporting subscale data for distress
(Foster et al., 2010; Freeman et al. 2015 and Waller et al., 2015) were used to estimate an
effect size of changes in distress.
2.6.1.1.2. Endorsement of persecutory ideation
Three studies also measured change in paranoia using Green et al. Paranoid Thoughts Scale
(GPTS) (Green et al., 2008). The GPTS is a self-report tool which measures ideas of social
reference, persecutory ideas and associated distress. It has been shown to have good
reliability, validity and sensitivity to clinical change and thus warrants inclusion in this
review as a secondary measure of change in paranoia. The GPTS differs conceptually from
the PSYRATS-D in that it predominantly measures frequency and the endorsement of
paranoid ideas held, either in the context of social referencing (part A; e.g. “People have
been dropping hints for me”) or persecution (part B; e.g. “Certain individuals have had it in
for me”).
23
2.6.1.2. Causal and maintenance factors
As all studies included in the meta-analysis used interventions designed from a causal-
interventionist approach, all interventions targeted a maintenance factor of paranoia. The
targeted maintenance factors and associated measuring tools for each study are detailed in
Table 1c. These measures were used to calculate the efficacy of interventions in improving
the targeted maintenance factors of paranoia. All studies used measures in which a
decreasing score indicates improvement with the exception of one study (Waller et al.,
2015) which used a measure with an increasing score indicating improvement. To allow for
this in the analysis, group means and standard deviations for Waller et al. (2015) were
switched between the intervention and control groups in the calculations.
2.6.1.3 Well-being
Three studies included in the meta-analyses measured change in well-being using the
Warwick-Edinburgh Mental Well-being Scale (WEMWBS) (Tennant et al., 2007). This tool
assesses well-being over the past fortnight across fourteen items such as ‘I’ve been feeling
cheerful’ and ‘I’ve been feeling good about myself’. The scale has high test-retest reliability
and criterion validity. Analyses were conducted to evaluate the efficacy of these
interventions in improving well-being at end-of-treatment and at follow-up.
2.6.2. Efficacy of pilot and case studies
Studies excluded from the meta-analyses were assessed for observed changes in paranoia
and other psychological factors measured within the studies. Observed change was
predominantly assessed by comparing scores on pre- and post-intervention measures,
factoring in change at follow-up where applicable. In a small number of studies, qualitative
evidence of change was found in narrative descriptions of outcomes.
24
3. Results
3.1. Characteristics of psychological treatments impacting on paranoia
Of the 23 studies identified that evaluated psychological interventions treating individuals
with paranoia, 10 were case studies or case series, 5 were non-randomised pilot studies
and 7 were RCTs (see Tables 1a, 1b and 1c). All interventions were individualised, with the
exception of two studies which delivered a mindfulness group intervention and a
metacognitive training group programme (Chadwick et al., 2009; van Oosterhout et al.,
2014). The majority of the studies were conducted in the UK and almost half (47.8%) were
conducted by the same research group (Bell & Freeman, 2014; Freeman et al., 2014;
Freeman et al., 2016; Freeman, Dunn et al., 2015; Freeman, Waite et al., 2015; Freeman,
Waller et al., 2015; Foster et al., 2010; Hepworth, Startup & Freeman, 2011; Myers, Startup
& Freeman, 2011; Waller et al., 2011; Waller et al., 2015).
Across the 23 studies, the number of therapy sessions ranged from 1 to 38
sessions. The average number of sessions was 10.5 (SD 9.61), with a median of 7 sessions
and mode of 6 sessions. The length of interventions ranged (in weeks) from 1 (for a one-off
intervention) to 78, with an average length of 13.7 weeks (SD 16.76), and a median and
mode of 8 weeks.
Seven studies used individually tailored formulation-based therapy. Interventions
included four ‘classic’ CBTp (including normalisation, belief modification and reality testing)
(Carden & Jones, 2009; Chadwick & Tower, 1996; Kinderman & Bentall, 1997; Kuller &
Björgvinsoon, 2010; Morrison, 2004); a third-wave intervention i.e. acceptance and
commitment therapy (ACT) (Bloy, Oliver and Morris, 2011); and a CBT for dog phobia and
agoraphobia (Dudley, Dixon and Turkington, 2005).
Sixteen of the interventions were manualised interventions. Two studies were
manualised mindfulness interventions (Chadwick et al., 2009; Ellett, 2013). All other studies
used interventionist-causal model approaches, targeting a specific causal and maintenance
25
factor of persecutory delusions. Six studies used variants of metacognitive therapy,
specifically targeting reasoning biases associated with persecutory delusions (e.g. jumping
to conclusions, belief inflexibility) (Balzan & Gallelty, 2015; Hepworth, Startup and
Freeman, 2011; Hutton, Morrison and Wardle, 2014; van Oosterhout et al., 2014; Waller et
al., 2011; Waller et al., 2015). Other studies used brief interventions targeting: worry
(Foster et al., 2010; Freeman, Dunn et al., 2015); interpersonal sensitivity (Bell and
Freeman, 2014); insomnia (Freeman, Waite et al., 2015; Myers, Startup and Freeman,
2011); anxiety in urban environments (Freeman, Waller et al., 2015); and negative self-
beliefs (Freeman et al., 2014). The most recent study (Freeman et al., 2016) delivered a
lengthier intervention that allowed participants to combine brief modules in improving
issues with worry, sleep, self-confidence, reasoning processes and safety behaviours, based
on their individual needs.
Eleven of the studies identified come from the same research group: the Oxford
Cognitive Approaches to Psychosis (O-CAP), led by Professor Daniel Freeman. Of these, five
are RCTs used in the meta-analysis of this review. This research group focus much of their
research on investigating their cognitive model of persecutory delusions and developing
therapeutic interventions based on hypothesised mechanisms of paranoia (Freeman et al.,
2002).
26
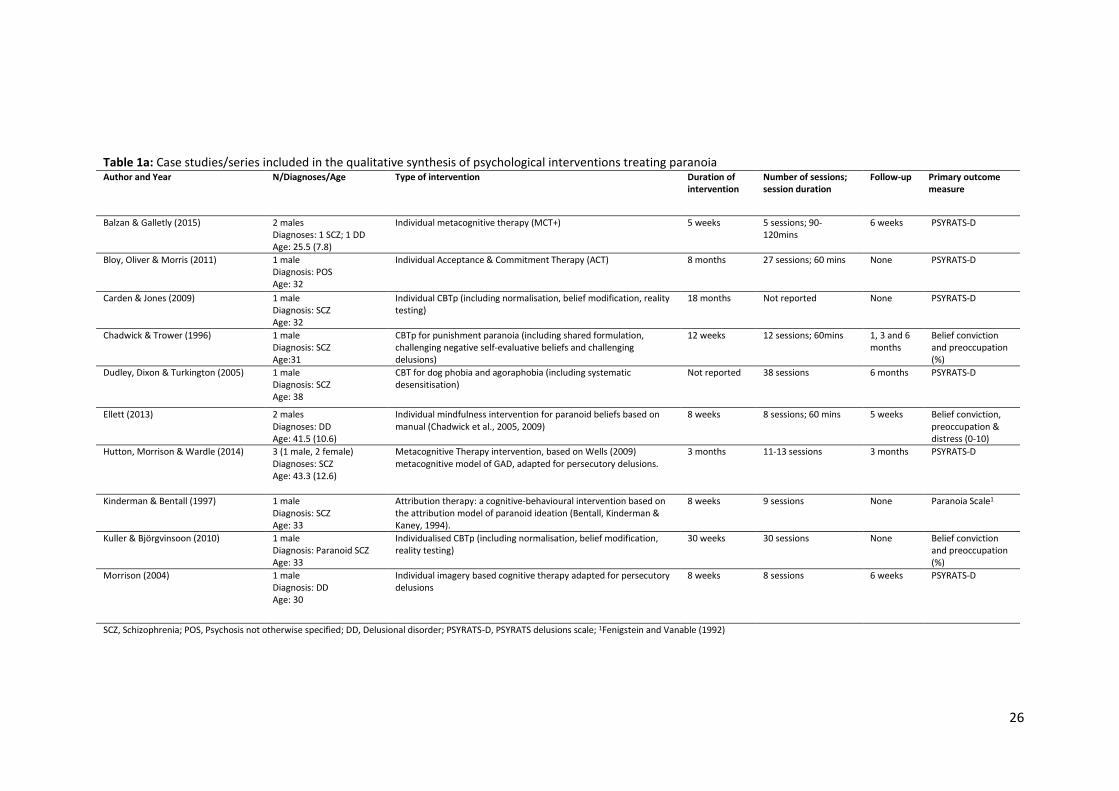
Table 1a: Case studies/series included in the qualitative synthesis of psychological interventions treating paranoia Author and Year N/Diagnoses/Age Type of intervention Duration of
intervention Number of sessions; session duration
Follow-up Primary outcome measure
Balzan & Galletly (2015) 2 males Diagnoses: 1 SCZ; 1 DD Age: 25.5 (7.8)
Individual metacognitive therapy (MCT+) 5 weeks 5 sessions; 90-120mins
6 weeks PSYRATS-D
Bloy, Oliver & Morris (2011) 1 male Diagnosis: POS Age: 32
Individual Acceptance & Commitment Therapy (ACT) 8 months 27 sessions; 60 mins None PSYRATS-D
Carden & Jones (2009) 1 male Diagnosis: SCZ Age: 32
Individual CBTp (including normalisation, belief modification, reality testing)
18 months Not reported None PSYRATS-D
Chadwick & Trower (1996) 1 male Diagnosis: SCZ Age:31
CBTp for punishment paranoia (including shared formulation, challenging negative self-evaluative beliefs and challenging delusions)
12 weeks 12 sessions; 60mins 1, 3 and 6 months
Belief conviction and preoccupation (%)
Dudley, Dixon & Turkington (2005) 1 male Diagnosis: SCZ Age: 38
CBT for dog phobia and agoraphobia (including systematic desensitisation)
Not reported 38 sessions 6 months PSYRATS-D
Ellett (2013) 2 males Diagnoses: DD Age: 41.5 (10.6)
Individual mindfulness intervention for paranoid beliefs based on manual (Chadwick et al., 2005, 2009)
8 weeks 8 sessions; 60 mins 5 weeks Belief conviction, preoccupation & distress (0-10)
Hutton, Morrison & Wardle (2014) 3 (1 male, 2 female) Diagnoses: SCZ Age: 43.3 (12.6)
Metacognitive Therapy intervention, based on Wells (2009) metacognitive model of GAD, adapted for persecutory delusions.
3 months 11-13 sessions 3 months PSYRATS-D
Kinderman & Bentall (1997) 1 male Diagnosis: SCZ Age: 33
Attribution therapy: a cognitive-behavioural intervention based on the attribution model of paranoid ideation (Bentall, Kinderman & Kaney, 1994).
8 weeks 9 sessions None Paranoia Scale1
Kuller & Björgvinsoon (2010) 1 male Diagnosis: Paranoid SCZ Age: 33
Individualised CBTp (including normalisation, belief modification, reality testing)
30 weeks 30 sessions None Belief conviction and preoccupation (%)
Morrison (2004) 1 male Diagnosis: DD Age: 30
Individual imagery based cognitive therapy adapted for persecutory delusions
8 weeks 8 sessions 6 weeks PSYRATS-D
SCZ, Schizophrenia; POS, Psychosis not otherwise specified; DD, Delusional disorder; PSYRATS-D, PSYRATS delusions scale; 1Fenigstein and Vanable (1992)
27
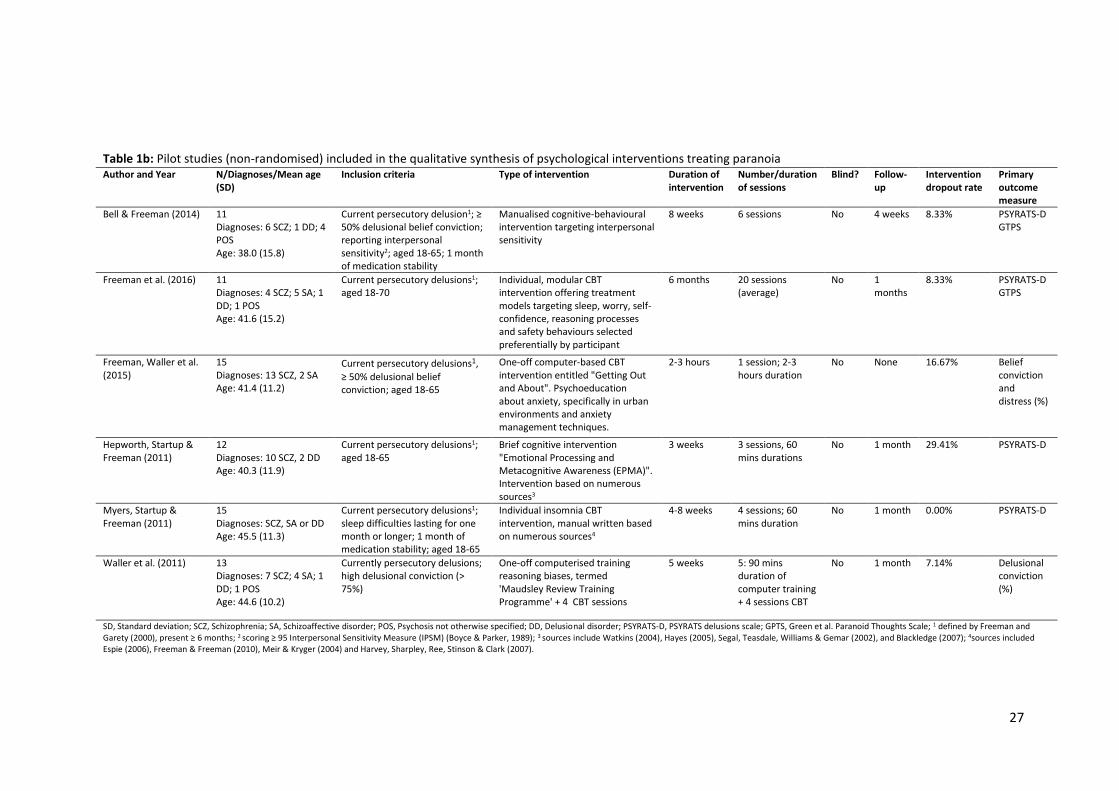
Table 1b: Pilot studies (non-randomised) included in the qualitative synthesis of psychological interventions treating paranoia Author and Year N/Diagnoses/Mean age
(SD) Inclusion criteria Type of intervention Duration of
intervention Number/duration of sessions
Blind? Follow-up
Intervention dropout rate
Primary outcome measure
Bell & Freeman (2014) 11 Diagnoses: 6 SCZ; 1 DD; 4 POS Age: 38.0 (15.8)
Current persecutory delusion1; ≥ 50% delusional belief conviction; reporting interpersonal sensitivity2; aged 18-65; 1 month of medication stability
Manualised cognitive-behavioural intervention targeting interpersonal sensitivity
8 weeks 6 sessions No 4 weeks 8.33% PSYRATS-D GTPS
Freeman et al. (2016) 11 Diagnoses: 4 SCZ; 5 SA; 1 DD; 1 POS Age: 41.6 (15.2)
Current persecutory delusions1; aged 18-70
Individual, modular CBT intervention offering treatment models targeting sleep, worry, self-confidence, reasoning processes and safety behaviours selected preferentially by participant
6 months 20 sessions (average)
No 1 months
8.33% PSYRATS-D GTPS
Freeman, Waller et al. (2015)
15 Diagnoses: 13 SCZ, 2 SA Age: 41.4 (11.2)
Current persecutory delusions1,
≥ 50% delusional belief conviction; aged 18-65
One-off computer-based CBT intervention entitled "Getting Out and About". Psychoeducation about anxiety, specifically in urban environments and anxiety management techniques.
2-3 hours 1 session; 2-3 hours duration
No None 16.67% Belief conviction and distress (%)
Hepworth, Startup & Freeman (2011)
12 Diagnoses: 10 SCZ, 2 DD Age: 40.3 (11.9)
Current persecutory delusions1; aged 18-65
Brief cognitive intervention "Emotional Processing and Metacognitive Awareness (EPMA)". Intervention based on numerous sources3
3 weeks 3 sessions, 60 mins durations
No 1 month 29.41% PSYRATS-D
Myers, Startup & Freeman (2011)
15 Diagnoses: SCZ, SA or DD Age: 45.5 (11.3)
Current persecutory delusions1; sleep difficulties lasting for one month or longer; 1 month of medication stability; aged 18-65
Individual insomnia CBT intervention, manual written based on numerous sources4
4-8 weeks 4 sessions; 60 mins duration
No 1 month 0.00% PSYRATS-D
Waller et al. (2011) 13 Diagnoses: 7 SCZ; 4 SA; 1 DD; 1 POS Age: 44.6 (10.2)
Currently persecutory delusions; high delusional conviction (> 75%)
One-off computerised training reasoning biases, termed 'Maudsley Review Training Programme' + 4 CBT sessions
5 weeks 5: 90 mins duration of computer training + 4 sessions CBT
No 1 month 7.14% Delusional conviction (%)
SD, Standard deviation; SCZ, Schizophrenia; SA, Schizoaffective disorder; POS, Psychosis not otherwise specified; DD, Delusional disorder; PSYRATS-D, PSYRATS delusions scale; GPTS, Green et al. Paranoid Thoughts Scale; 1 defined by Freeman and Garety (2000), present ≥ 6 months; 2 scoring ≥ 95 Interpersonal Sensitivity Measure (IPSM) (Boyce & Parker, 1989); 3 sources include Watkins (2004), Hayes (2005), Segal, Teasdale, Williams & Gemar (2002), and Blackledge (2007); 4sources included Espie (2006), Freeman & Freeman (2010), Meir & Kryger (2004) and Harvey, Sharpley, Ree, Stinson & Clark (2007).
28
Table 1c: Randomised Control Trials included in the qualitative synthesis and meta-analyses Author and Year
N/Diagnoses/Mean age (SD)
Inclusion criteria Type of control
Blind? Type of Intervention
Details of intervention
Duration of intervention
Number/ duration of sessions
Follow up
Intervention dropout rate
ITT? Measure of Paranoia
Targeted factor
Outcome measure of targeted factor
Chadwick et al. (2009)1
22 Diagnoses: 22 SCZ, 19 of which had paranoid beliefs Age: 41.6 (8.1)
Aged 18+ years; diagnosed with a psychotic disorder; prominent, distressing voices for ≥ 6 months; under care of secondary mental health services
Waitlist n = 11
Yes Group Group mindfulness intervention for psychosis and voices n = 15
10 weeks (5 weeks bi-weekly session + 5 weeks of practice following intervention)
10 sessions
None 18.18% No PSYRATS-D Mindful response to distressing thoughts and images
SMQ
Foster et al. (2010)
24 Diagnoses: 12 SZ, SA, DD Age: EC: 40.0 (10.5)/ CC: 39.1 (9.2)
Current persecutory delusion2 for ≥ 6 months; a clinically significant level of worry2; aged 18-65.
TAU n = 12
No Individual Worry-CBT, Fixed sessions based on a therapy manual (Wells, 1997) n = 12
4 weeks 4 session; 60 mins
4 weeks
8.33% No PSYRATS-D GPTS
Worry PSWQ
Freeman, Dunn et al. (2015)
150 Diagnoses: 111 SZ; 11 SA; 10 DD; 18 POS Age: EC: 40.9 (10.5)/ CC: 42.1 (13.1)
Current persecutory delusion2 for ≥ 6 months; a clinically significant level of worry3; aged 18-65; 1 month medication stability
TAU n = 77
Yes Individual Worry-CBT, based on self-help manual (Freeman & Freeman, 2013) n = 73
8 weeks 6 sessions; 60 mins
12 weeks
12.33% Yes PSYRATS-D GPTS
Worry PSWQ
Freeman, Waite et al. (2015)
50 Diagnoses: 33 SCZ; 10 SA; 7 POS Age: EC: 39.6 (11.6)/ CC: 42.4 (13.5)
Current persecutory delusion2 for ≥ 3 months; a score of at least 2 on the distress items of the PSYRATS-D; sleep difficulties lasting ≥ 1 month; ISI score ≥ 15; aged 18–65; 1 month medication stability
TAU n = 26
Yes Individual Individual insomnia CBT intervention, manual written based on numerous sources8 n = 24
12 weeks 8 sessions; 60 mins duration
12 weeks
4.17% Yes PSYRATS-D GPTS
Insomnia ISI
29
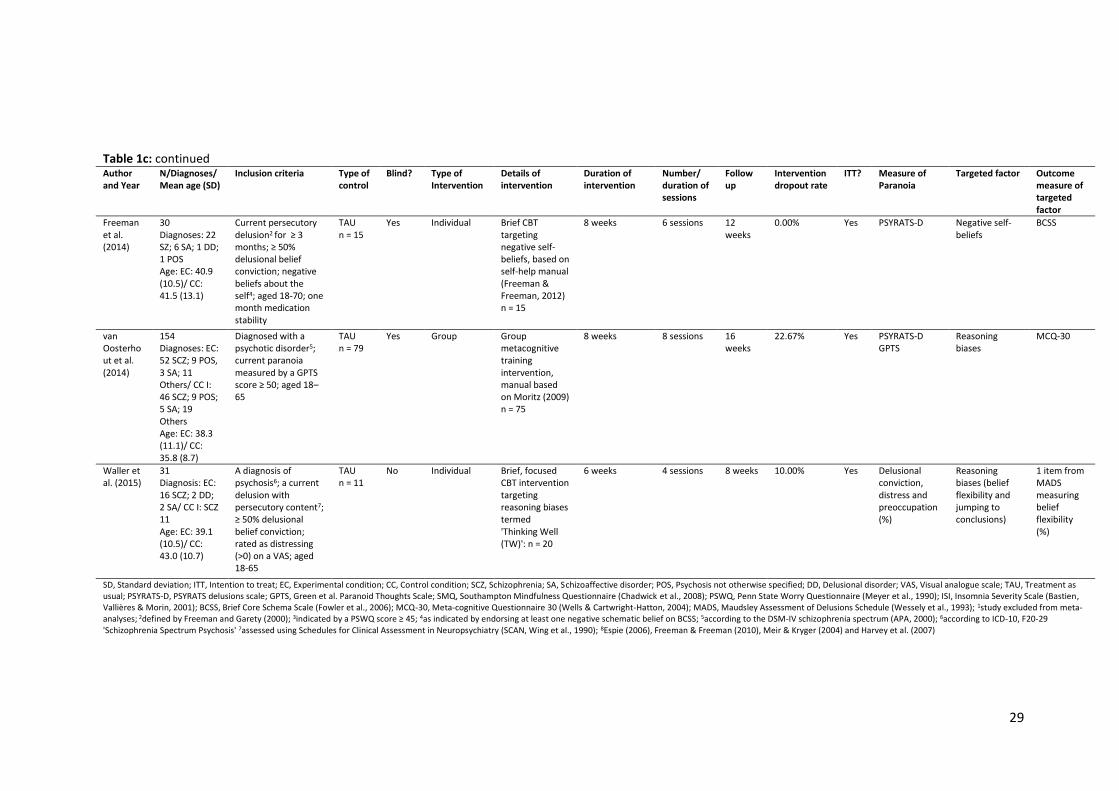
Table 1c: continued
Author and Year
N/Diagnoses/Mean age (SD)
Inclusion criteria Type of control
Blind? Type of Intervention
Details of intervention
Duration of intervention
Number/ duration of sessions
Follow up
Intervention dropout rate
ITT? Measure of Paranoia
Targeted factor Outcome measure of targeted factor
Freeman et al. (2014)
30 Diagnoses: 22 SZ; 6 SA; 1 DD; 1 POS Age: EC: 40.9 (10.5)/ CC: 41.5 (13.1)
Current persecutory delusion2 for ≥ 3 months; ≥ 50% delusional belief conviction; negative beliefs about the self4; aged 18-70; one month medication stability
TAU n = 15
Yes Individual Brief CBT targeting negative self-beliefs, based on self-help manual (Freeman & Freeman, 2012) n = 15
8 weeks 6 sessions 12 weeks
0.00% Yes PSYRATS-D Negative self-beliefs
BCSS
van Oosterhout et al. (2014)
154 Diagnoses: EC: 52 SCZ; 9 POS, 3 SA; 11 Others/ CC I: 46 SCZ; 9 POS; 5 SA; 19 Others Age: EC: 38.3 (11.1)/ CC: 35.8 (8.7)
Diagnosed with a psychotic disorder5; current paranoia measured by a GPTS score ≥ 50; aged 18–65
TAU n = 79
Yes Group Group metacognitive training intervention, manual based on Moritz (2009) n = 75
8 weeks 8 sessions 16 weeks
22.67% Yes PSYRATS-D GPTS
Reasoning biases
MCQ-30
Waller et al. (2015)
31 Diagnosis: EC: 16 SCZ; 2 DD; 2 SA/ CC I: SCZ 11 Age: EC: 39.1 (10.5)/ CC: 43.0 (10.7)
A diagnosis of psychosis6; a current delusion with persecutory content7; ≥ 50% delusional belief conviction; rated as distressing (>0) on a VAS; aged 18-65
TAU n = 11
No Individual Brief, focused CBT intervention targeting reasoning biases termed 'Thinking Well (TW)': n = 20
6 weeks 4 sessions 8 weeks 10.00% Yes Delusional conviction, distress and preoccupation (%)
Reasoning biases (belief flexibility and jumping to conclusions)
1 item from MADS measuring belief flexibility (%)
SD, Standard deviation; ITT, Intention to treat; EC, Experimental condition; CC, Control condition; SCZ, Schizophrenia; SA, Schizoaffective disorder; POS, Psychosis not otherwise specified; DD, Delusional disorder; VAS, Visual analogue scale; TAU, Treatment as usual; PSYRATS-D, PSYRATS delusions scale; GPTS, Green et al. Paranoid Thoughts Scale; SMQ, Southampton Mindfulness Questionnaire (Chadwick et al., 2008); PSWQ, Penn State Worry Questionnaire (Meyer et al., 1990); ISI, Insomnia Severity Scale (Bastien, Vallières & Morin, 2001); BCSS, Brief Core Schema Scale (Fowler et al., 2006); MCQ-30, Meta-cognitive Questionnaire 30 (Wells & Cartwright-Hatton, 2004); MADS, Maudsley Assessment of Delusions Schedule (Wessely et al., 1993); 1study excluded from meta-analyses; 2defined by Freeman and Garety (2000); 3indicated by a PSWQ score ≥ 45; 4as indicated by endorsing at least one negative schematic belief on BCSS; 5according to the DSM-IV schizophrenia spectrum (APA, 2000); 6according to ICD-10, F20-29 'Schizophrenia Spectrum Psychosis' 7assessed using Schedules for Clinical Assessment in Neuropsychiatry (SCAN, Wing et al., 1990); 8Espie (2006), Freeman & Freeman (2010), Meir & Kryger (2004) and Harvey et al. (2007)
30
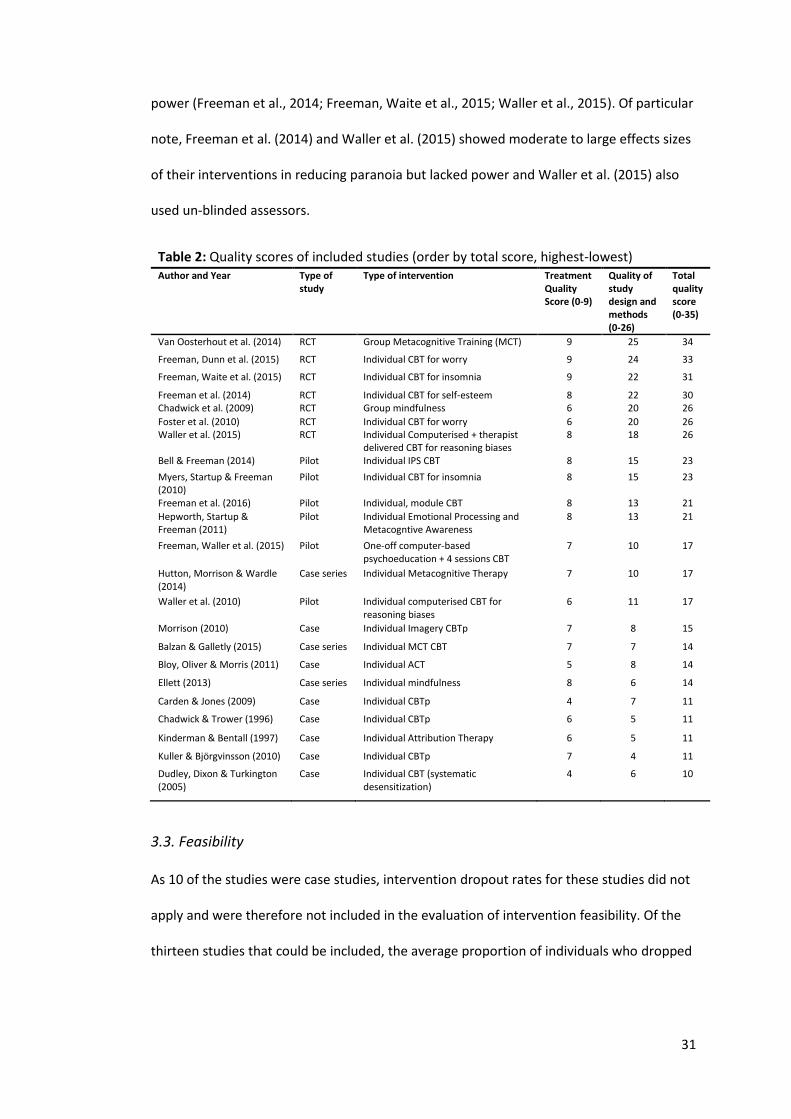
3.2. Quality of the included studies
Assessment of the quality of studies included in this review (detailed in Table 2) showed
that the overall quality of studies’ scores ranged from 10 to 34. The average total quality
score of studies was 20.1 (SD 7.57), indicating an overall moderate quality of studies.
Quality of treatment was generally high, with an average score of 7.0 (SD 1.45) within a
score range of 0 to 9. Quality scores of study design and methods were generally moderate
to high, with an average score of 13.1 (SD 6.63) and a range of 6 to 25. In particular, RCTs
had good quality of treatment and methodology. This is in comparison to van der Gaag et
al. (2013), who used the Clinical Trials Assessment Measure (CTAM; Tarrier & Wykes, 2004),
who found three of the ten studies included were of “inferior quality”.
More detailed assessment of individual items (see Appendix 2) reveals that
treatment quality was generally high across all studies. In particular, studies scored
consistently highly in detailing treatment content, quality of therapist training (almost
exclusively given by trained clinical psychologists) and evidencing patient engagement.
Lower scores in treatment quality were largely due to a lack of manualisation or lack of
evidence for adhering to a treatment manual (Bloy, Oliver & Morris, 2014; Chadwick &
Torwer, 1996; Carden & Jones, 2009; Dudley, Dixon & Turkington, 2005; Kinderman &
Bentall, 1997).
Quality scores for design and methodology approximately grouped studies into
RCTs (scoring highest), pilot studies and case studies (scoring lowest), as was to be
expected. Understandably, pilot and case studies had low scores for controlling for bias
(e.g. randomisation, blinding, allocation bias etc.) and statistical analyses (e.g. power
calculations, statistical report etc.). Most studies scored highly for justification and validity
of outcomes. The range observed in RCT quality scores was largely due to variation in
controlling for bias e.g. blindness (Foster et al., 2010; Waller et al., 2015), and statistical
31
power (Freeman et al., 2014; Freeman, Waite et al., 2015; Waller et al., 2015). Of particular
note, Freeman et al. (2014) and Waller et al. (2015) showed moderate to large effects sizes
of their interventions in reducing paranoia but lacked power and Waller et al. (2015) also
used un-blinded assessors.
Table 2: Quality scores of included studies (order by total score, highest-lowest) Author and Year Type of
study Type of intervention Treatment
Quality Score (0-9)
Quality of study design and methods (0-26)
Total quality score (0-35)
Van Oosterhout et al. (2014) RCT Group Metacognitive Training (MCT) 9 25 34
Freeman, Dunn et al. (2015) RCT Individual CBT for worry 9 24 33
Freeman, Waite et al. (2015) RCT Individual CBT for insomnia 9 22 31
Freeman et al. (2014) RCT Individual CBT for self-esteem 8 22 30 Chadwick et al. (2009) RCT Group mindfulness 6 20 26
Foster et al. (2010) RCT Individual CBT for worry 6 20 26 Waller et al. (2015) RCT Individual Computerised + therapist
delivered CBT for reasoning biases 8 18 26
Bell & Freeman (2014) Pilot Individual IPS CBT 8 15 23
Myers, Startup & Freeman (2010)
Pilot Individual CBT for insomnia 8 15 23
Freeman et al. (2016) Pilot Individual, module CBT 8 13 21
Hepworth, Startup & Freeman (2011)
Pilot Individual Emotional Processing and Metacogntive Awareness
8 13 21
Freeman, Waller et al. (2015) Pilot One-off computer-based psychoeducation + 4 sessions CBT
7 10 17
Hutton, Morrison & Wardle (2014)
Case series Individual Metacognitive Therapy 7 10 17
Waller et al. (2010) Pilot Individual computerised CBT for reasoning biases
6 11 17
Morrison (2010) Case Individual Imagery CBTp 7 8 15
Balzan & Galletly (2015) Case series Individual MCT CBT 7 7 14
Bloy, Oliver & Morris (2011) Case Individual ACT 5 8 14
Ellett (2013) Case series Individual mindfulness 8 6 14
Carden & Jones (2009) Case Individual CBTp 4 7 11
Chadwick & Trower (1996) Case Individual CBTp 6 5 11
Kinderman & Bentall (1997) Case Individual Attribution Therapy 6 5 11
Kuller & Björgvinsson (2010) Case Individual CBTp 7 4 11
Dudley, Dixon & Turkington (2005)
Case Individual CBT (systematic desensitization)
4 6 10
3.3. Feasibility
As 10 of the studies were case studies, intervention dropout rates for these studies did not
apply and were therefore not included in the evaluation of intervention feasibility. Of the
thirteen studies that could be included, the average proportion of individuals who dropped
32
out of the evaluated intervention was 11.2% (SD 8.59). The range of intervention dropout
rates was 0%-29.41%.
Closer inspection of dropout rates highlighted that two of the three studies with
the highest intervention dropout rates (van Oosterhout et al., 2014; Chadwick et al., 2009)
were the two group interventions, with respective dropout rates of 22.7% and 18.1%.
Evaluating the dropout rates of individualised treatments alone suggested an average
attrition of 9.5%, skewed by one particular study (Hepworth, Startup and Freeman, 2011)
which had a disproportionately high dropout rate of 29.4%. Excluding this study reduces
the average attrition rate for individual interventions to 7.5%.
Studies with interventions targeting insomnia (Myers, Startup and Freeman, 2011;
Freeman, Waite et al., 2015) had notably low dropout rates of 0.0% and 4.2%, respectively.
An intervention targeting negative self-belief (Freeman et al., 2014) also had no
participants drop out of treatment. Although studies reporting dropout rates were largely
briefer in length, there does not appear to be a distinct relationship between treatment
length or number of sessions and attrition in treatment conditions.
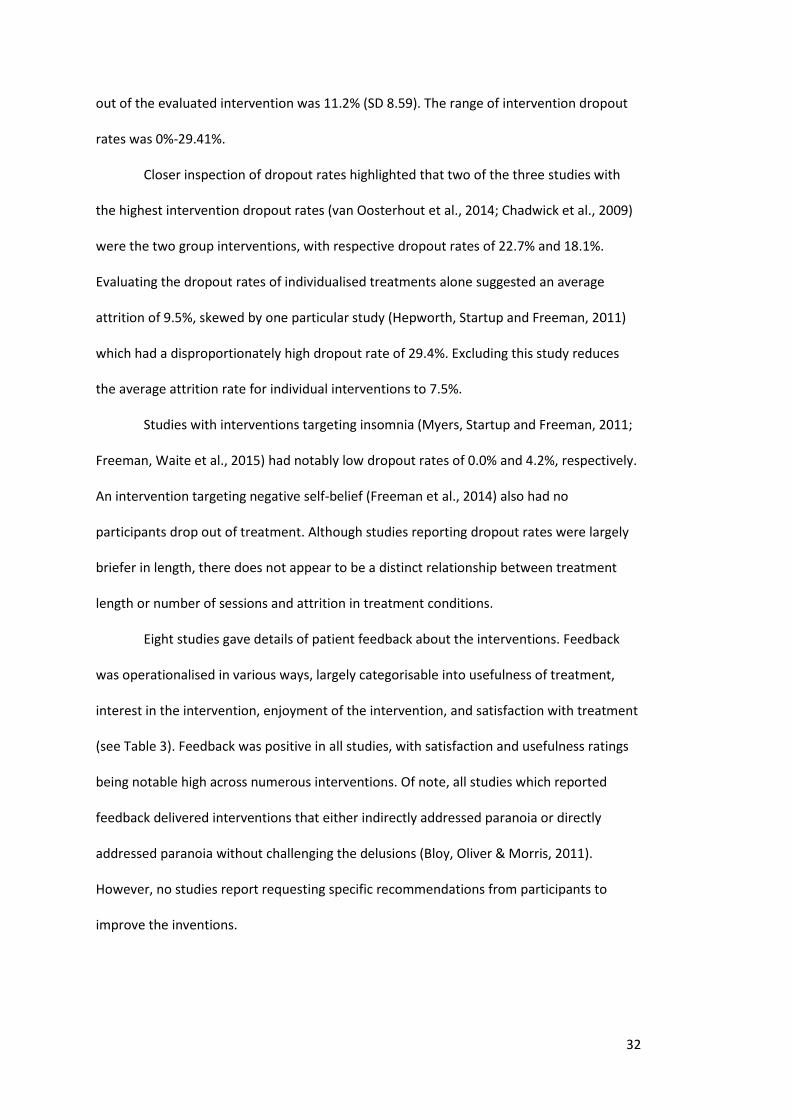
Eight studies gave details of patient feedback about the interventions. Feedback
was operationalised in various ways, largely categorisable into usefulness of treatment,
interest in the intervention, enjoyment of the intervention, and satisfaction with treatment
(see Table 3). Feedback was positive in all studies, with satisfaction and usefulness ratings
being notable high across numerous interventions. Of note, all studies which reported
feedback delivered interventions that either indirectly addressed paranoia or directly
addressed paranoia without challenging the delusions (Bloy, Oliver & Morris, 2011).
However, no studies report requesting specific recommendations from participants to
improve the inventions.
33
Table 3: Intervention feedback from participants
Usefulness Interest Enjoyment Satisfaction
Bell & Freeman (2014) ++ NR NR ++
Bloy, Oliver & Morris (2011) NR NR NR ++
Freeman et al. (2016) NR NR NR ++
Freeman, Dunn et al. (2015) NR NR NR +
Freeman, Waller et al. (2015) ++ NR ++ ++
Van Oosterhout et al. (2014) NR NR + ++
Waller et al. (2010) ++ ++ ++ NR
Waller et al. (2015) + NR + NR
++, high ratings reported; + positive feedback reported; NR, not reported
3.3. Efficacy of treatment
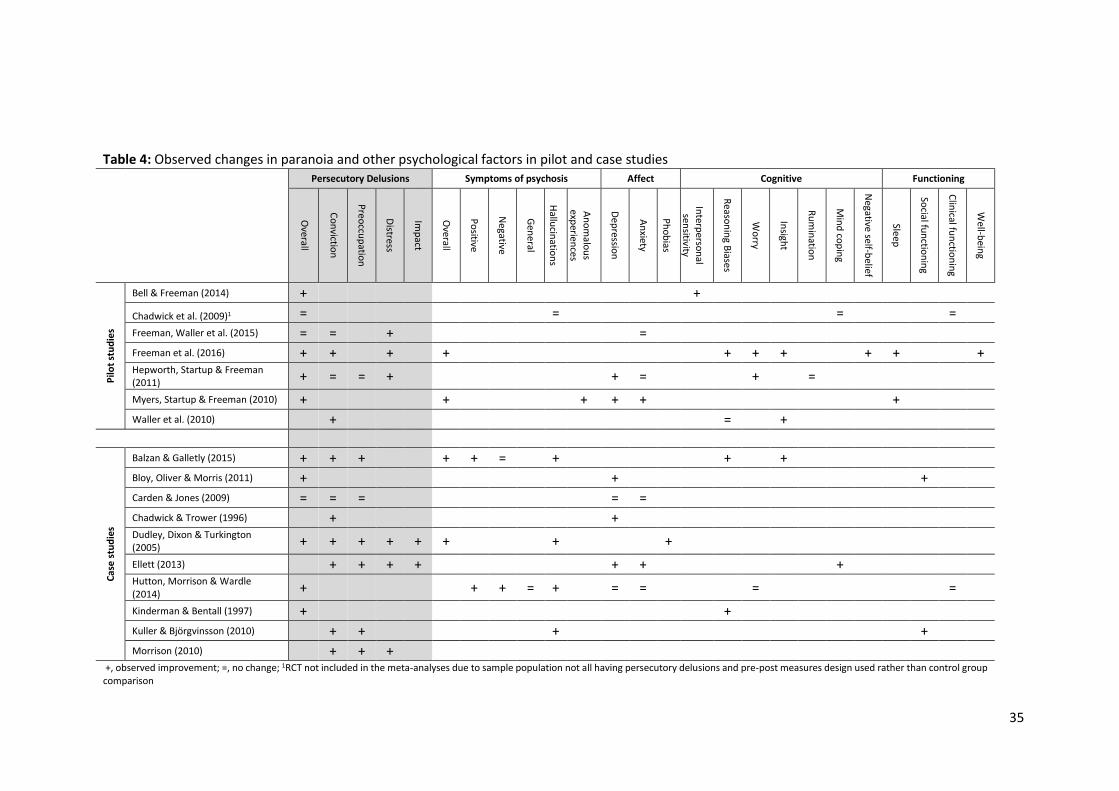
3.3.1. Efficacy of pilot and case studies
Across the studies not included in the meta-analyses, Table 4 depicts observed changes in
persecutory delusions and other psychological factors. Only a small number of studies
evaluated the same outcome with the exception of overall improvements in persecutory
delusions and conviction of persecutory belief.
With the exception of two studies (Chadwick et al., 2009; Carden & Jones, 2009),
improvements in some aspects (e.g. conviction, preoccupation, distress) if not overall
improvement in persecutory delusions were observed. In particular, all studies measuring
associated distress reported improvements. Where reported, improvements in other
psychological factors were also observed in the majority of studies. This was particularly
observed in overall symptoms of psychosis and cognitive factors, albeit the latter factors
were largely being targeted by the intervention and hence were reported as outcomes e.g.
worry. Observed changes in affect were less consistent – approximately half of the studies
measuring affect reported improvements in depression (Bloy, Oliver & Morris, 2011;
Chadwick & Trower, 1996; Ellett, 2013; Hepworth, Startup & Freeman, 2010; Myers,
Startup & Freeman, 2010) whilst the majority of studies measuring anxiety found no
change in outcome (Carden & Jones, 2009; Freeman, Waller et al., 2015; Hepworth, Startup
& Freeman, 2011; Hutton, Morrison & Wardle, 2014). Some studies reported

34
improvements in social functioning and well-being but there was no evidence for
improvement in clinical functioning. Notably, no studies reported worsening of persecutory
delusions or any other psychological factor.
35
Table 4: Observed changes in paranoia and other psychological factors in pilot and case studies
Persecutory Delusions Symptoms of psychosis Affect Cognitive Functioning
Overall
Co
nvictio
n
Preo
ccup
ation
Distress
Imp
act
Overall
Po
sitive
Negative
Gen
eral
Hallu
cinatio
ns
An
om
alou
s exp
eriences
Dep
ression
An
xiety
Ph
ob
ias
Interp
erson
al sen
sitivity
Reaso
nin
g Biases
Wo
rry
Insigh
t
Ru
min
ation
Min
d co
pin
g
Negative self-b
elief
Sleep
Social fu
nctio
nin
g
Clin
ical fun
ction
ing
Well-b
eing
Pilo
t st
ud
ies
Bell & Freeman (2014) + +
Chadwick et al. (2009)1 = = = =
Freeman, Waller et al. (2015) = = + =
Freeman et al. (2016) + + + + + + + + + + Hepworth, Startup & Freeman (2011) + = = + + = + =
Myers, Startup & Freeman (2010) + + + + + +
Waller et al. (2010) + = +
Cas
e s
tud
ies
Balzan & Galletly (2015) + + + + + = + + +
Bloy, Oliver & Morris (2011) + + +
Carden & Jones (2009) = = = = =
Chadwick & Trower (1996) + + Dudley, Dixon & Turkington (2005) + + + + + + + +
Ellett (2013) + + + + + + + Hutton, Morrison & Wardle (2014) + + + = + = = = =
Kinderman & Bentall (1997) + +
Kuller & Björgvinsson (2010) + + + +
Morrison (2010) + + + +, observed improvement; =, no change; 1RCT not included in the meta-analyses due to sample population not all having persecutory delusions and pre-post measures design used rather than control group comparison
36
3.3.2. Meta-analyses
3.3.2.1. Characteristics of studies included in the meta-analyses
All six studies used manualised interventions that targeted a specific causal or maintenance
factor of persecutory delusions (please see Table 1c). Only one study used a group
intervention (van Oosterhout et al., 2014). Two studies (Foster et al., 2010; Freeman, Dunn
et al., 2015) targeted worry and were a pilot and a larger-scale RCT trial developing the
same manual. Two studies (van Oosterhout et al., 2014; Waller et al., 2015) targeted
reasoning biases but had quite different intervention approaches e.g. group vs. individual.
All studies used treatment as usual (TAU) as their control comparison groups.
Treatment length ranged from 4 to 12 weeks with an average of 7.67 weeks (SD
2.66). Number of sessions in an intervention ranged from 4 to 8 with an average of 6
sessions (SD 1.79). Follow-up periods for studies ranged from 4 to 16 weeks with an
average follow-up period of 10.67 weeks (SD 4.13).
3.3.2.2 Efficacy of treatment at reducing paranoia
3.3.2.2.1. Overall severity of persecutory delusions (PSYRATS D)
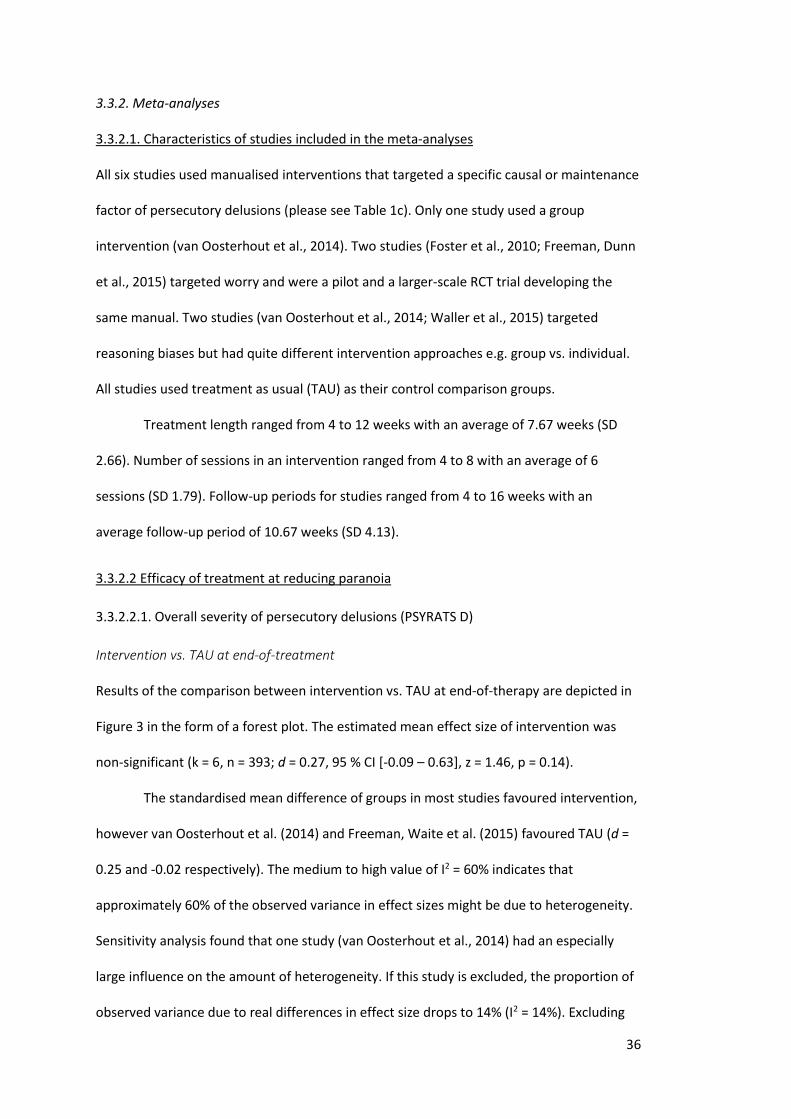
Intervention vs. TAU at end-of-treatment
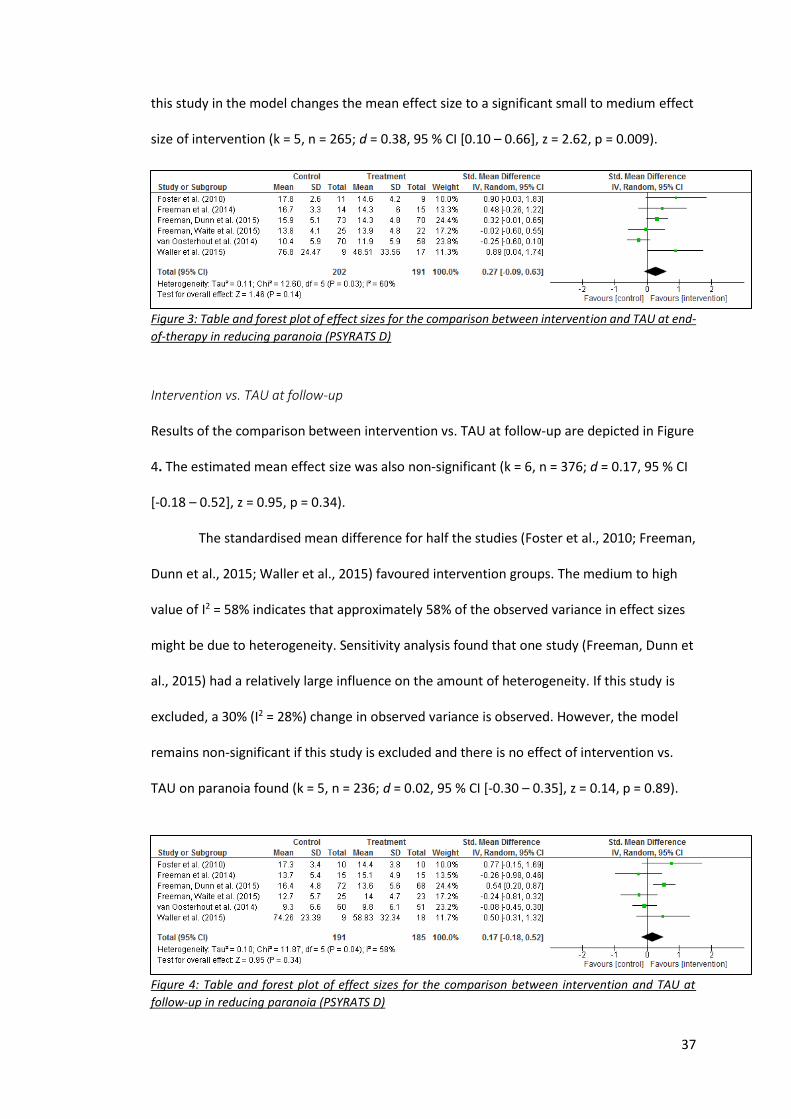
Results of the comparison between intervention vs. TAU at end-of-therapy are depicted in
Figure 3 in the form of a forest plot. The estimated mean effect size of intervention was
non-significant (k = 6, n = 393; d = 0.27, 95 % CI [-0.09 – 0.63], z = 1.46, p = 0.14).
The standardised mean difference of groups in most studies favoured intervention,
however van Oosterhout et al. (2014) and Freeman, Waite et al. (2015) favoured TAU (d =
0.25 and -0.02 respectively). The medium to high value of I2 = 60% indicates that
approximately 60% of the observed variance in effect sizes might be due to heterogeneity.
Sensitivity analysis found that one study (van Oosterhout et al., 2014) had an especially
large influence on the amount of heterogeneity. If this study is excluded, the proportion of
observed variance due to real differences in effect size drops to 14% (I2 = 14%). Excluding
37
this study in the model changes the mean effect size to a significant small to medium effect
size of intervention (k = 5, n = 265; d = 0.38, 95 % CI [0.10 – 0.66], z = 2.62, p = 0.009).
Figure 3: Table and forest plot of effect sizes for the comparison between intervention and TAU at end-
of-therapy in reducing paranoia (PSYRATS D)
Intervention vs. TAU at follow-up
Results of the comparison between intervention vs. TAU at follow-up are depicted in Figure
4. The estimated mean effect size was also non-significant (k = 6, n = 376; d = 0.17, 95 % CI
[-0.18 – 0.52], z = 0.95, p = 0.34).
The standardised mean difference for half the studies (Foster et al., 2010; Freeman,
Dunn et al., 2015; Waller et al., 2015) favoured intervention groups. The medium to high
value of I2 = 58% indicates that approximately 58% of the observed variance in effect sizes
might be due to heterogeneity. Sensitivity analysis found that one study (Freeman, Dunn et
al., 2015) had a relatively large influence on the amount of heterogeneity. If this study is
excluded, a 30% (I2 = 28%) change in observed variance is observed. However, the model
remains non-significant if this study is excluded and there is no effect of intervention vs.
TAU on paranoia found (k = 5, n = 236; d = 0.02, 95 % CI [-0.30 – 0.35], z = 0.14, p = 0.89).
Figure 4: Table and forest plot of effect sizes for the comparison between intervention and TAU at
follow-up in reducing paranoia (PSYRATS D)
38
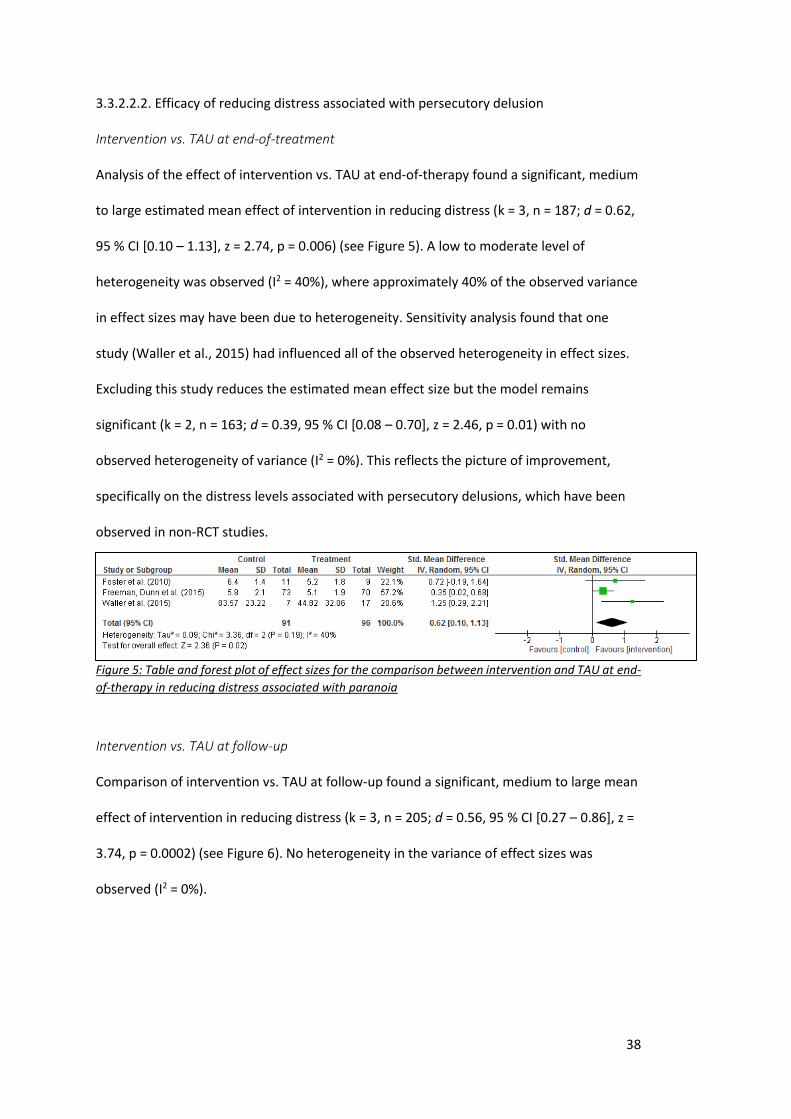
3.3.2.2.2. Efficacy of reducing distress associated with persecutory delusion
Intervention vs. TAU at end-of-treatment
Analysis of the effect of intervention vs. TAU at end-of-therapy found a significant, medium
to large estimated mean effect of intervention in reducing distress (k = 3, n = 187; d = 0.62,
95 % CI [0.10 – 1.13], z = 2.74, p = 0.006) (see Figure 5). A low to moderate level of
heterogeneity was observed (I2 = 40%), where approximately 40% of the observed variance
in effect sizes may have been due to heterogeneity. Sensitivity analysis found that one
study (Waller et al., 2015) had influenced all of the observed heterogeneity in effect sizes.
Excluding this study reduces the estimated mean effect size but the model remains
significant (k = 2, n = 163; d = 0.39, 95 % CI [0.08 – 0.70], z = 2.46, p = 0.01) with no
observed heterogeneity of variance (I2 = 0%). This reflects the picture of improvement,
specifically on the distress levels associated with persecutory delusions, which have been
observed in non-RCT studies.
Figure 5: Table and forest plot of effect sizes for the comparison between intervention and TAU at end-
of-therapy in reducing distress associated with paranoia
Intervention vs. TAU at follow-up
Comparison of intervention vs. TAU at follow-up found a significant, medium to large mean
effect of intervention in reducing distress (k = 3, n = 205; d = 0.56, 95 % CI [0.27 – 0.86], z =
3.74, p = 0.0002) (see Figure 6). No heterogeneity in the variance of effect sizes was
observed (I2 = 0%).
39
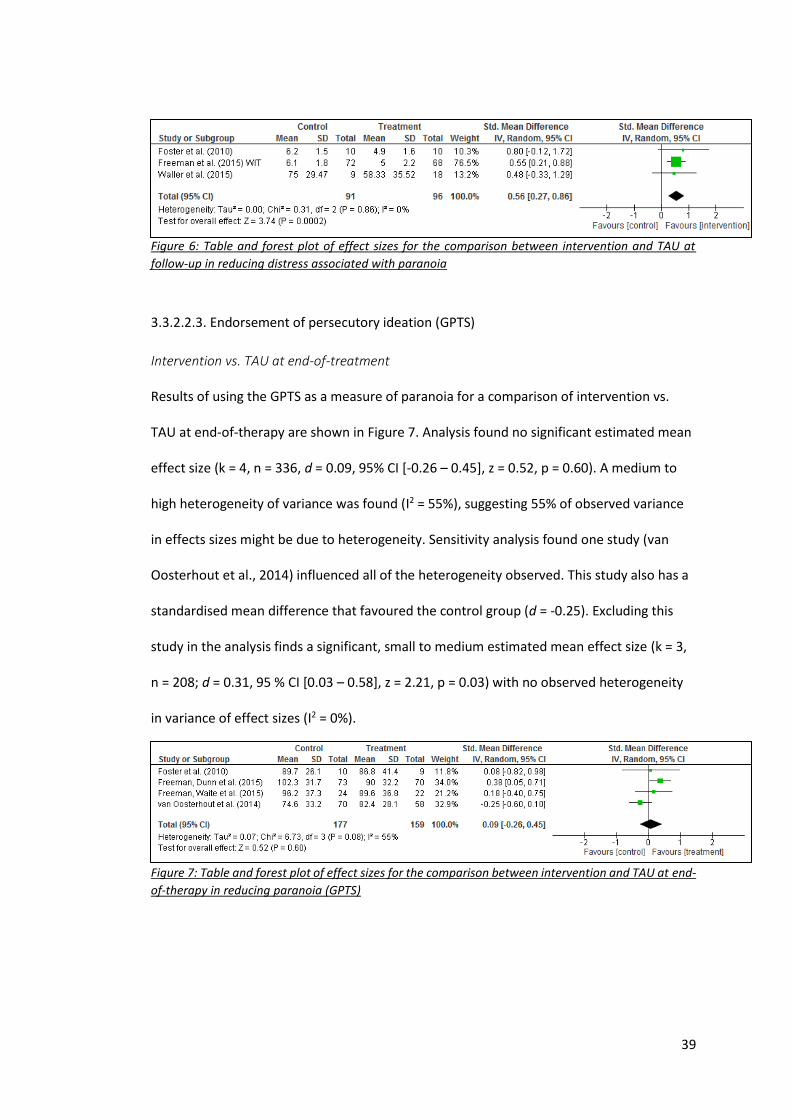
Figure 6: Table and forest plot of effect sizes for the comparison between intervention and TAU at
follow-up in reducing distress associated with paranoia
3.3.2.2.3. Endorsement of persecutory ideation (GPTS)
Intervention vs. TAU at end-of-treatment
Results of using the GPTS as a measure of paranoia for a comparison of intervention vs.
TAU at end-of-therapy are shown in Figure 7. Analysis found no significant estimated mean
effect size (k = 4, n = 336, d = 0.09, 95% CI [-0.26 – 0.45], z = 0.52, p = 0.60). A medium to
high heterogeneity of variance was found (I2 = 55%), suggesting 55% of observed variance
in effects sizes might be due to heterogeneity. Sensitivity analysis found one study (van
Oosterhout et al., 2014) influenced all of the heterogeneity observed. This study also has a
standardised mean difference that favoured the control group (d = -0.25). Excluding this
study in the analysis finds a significant, small to medium estimated mean effect size (k = 3,
n = 208; d = 0.31, 95 % CI [0.03 – 0.58], z = 2.21, p = 0.03) with no observed heterogeneity
in variance of effect sizes (I2 = 0%).
Figure 7: Table and forest plot of effect sizes for the comparison between intervention and TAU at end-
of-therapy in reducing paranoia (GPTS)
40
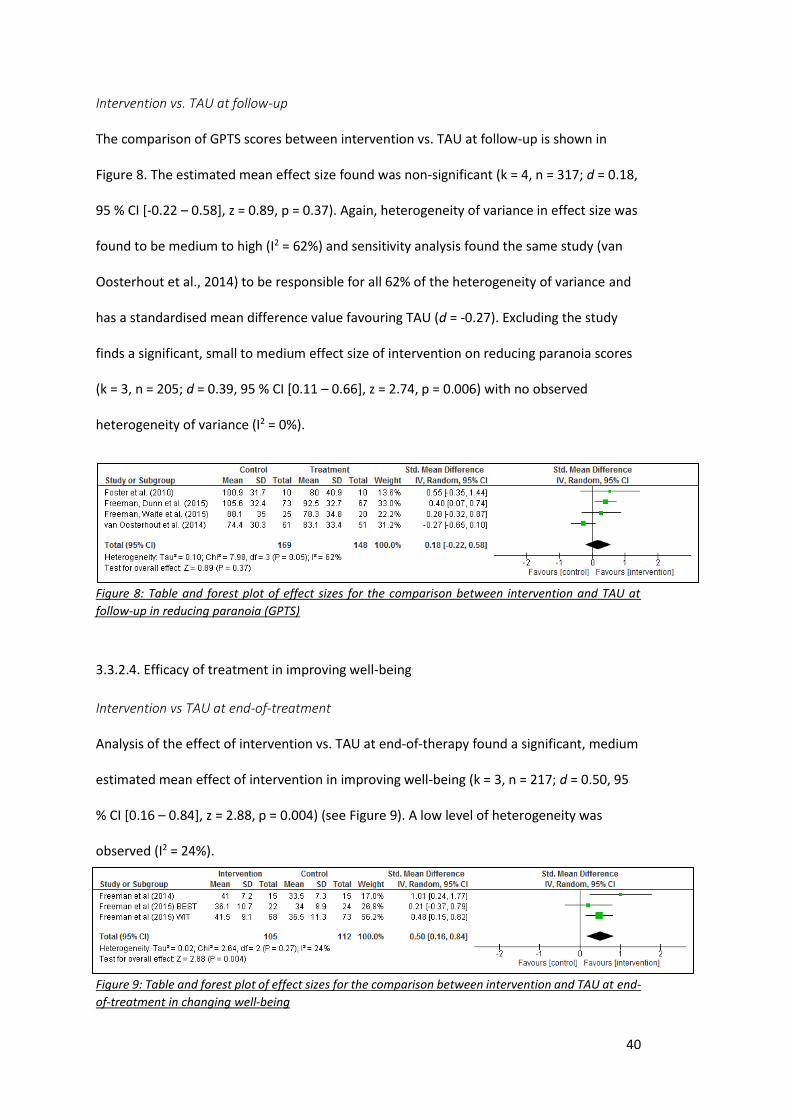
Intervention vs. TAU at follow-up
The comparison of GPTS scores between intervention vs. TAU at follow-up is shown in
Figure 8. The estimated mean effect size found was non-significant (k = 4, n = 317; d = 0.18,
95 % CI [-0.22 – 0.58], z = 0.89, p = 0.37). Again, heterogeneity of variance in effect size was
found to be medium to high (I2 = 62%) and sensitivity analysis found the same study (van
Oosterhout et al., 2014) to be responsible for all 62% of the heterogeneity of variance and
has a standardised mean difference value favouring TAU (d = -0.27). Excluding the study
finds a significant, small to medium effect size of intervention on reducing paranoia scores
(k = 3, n = 205; d = 0.39, 95 % CI [0.11 – 0.66], z = 2.74, p = 0.006) with no observed
heterogeneity of variance (I2 = 0%).
Figure 8: Table and forest plot of effect sizes for the comparison between intervention and TAU at
follow-up in reducing paranoia (GPTS)
3.3.2.4. Efficacy of treatment in improving well-being
Intervention vs TAU at end-of-treatment
Analysis of the effect of intervention vs. TAU at end-of-therapy found a significant, medium
estimated mean effect of intervention in improving well-being (k = 3, n = 217; d = 0.50, 95
% CI [0.16 – 0.84], z = 2.88, p = 0.004) (see Figure 9). A low level of heterogeneity was
observed (I2 = 24%).
Figure 9: Table and forest plot of effect sizes for the comparison between intervention and TAU at end-
of-treatment in changing well-being
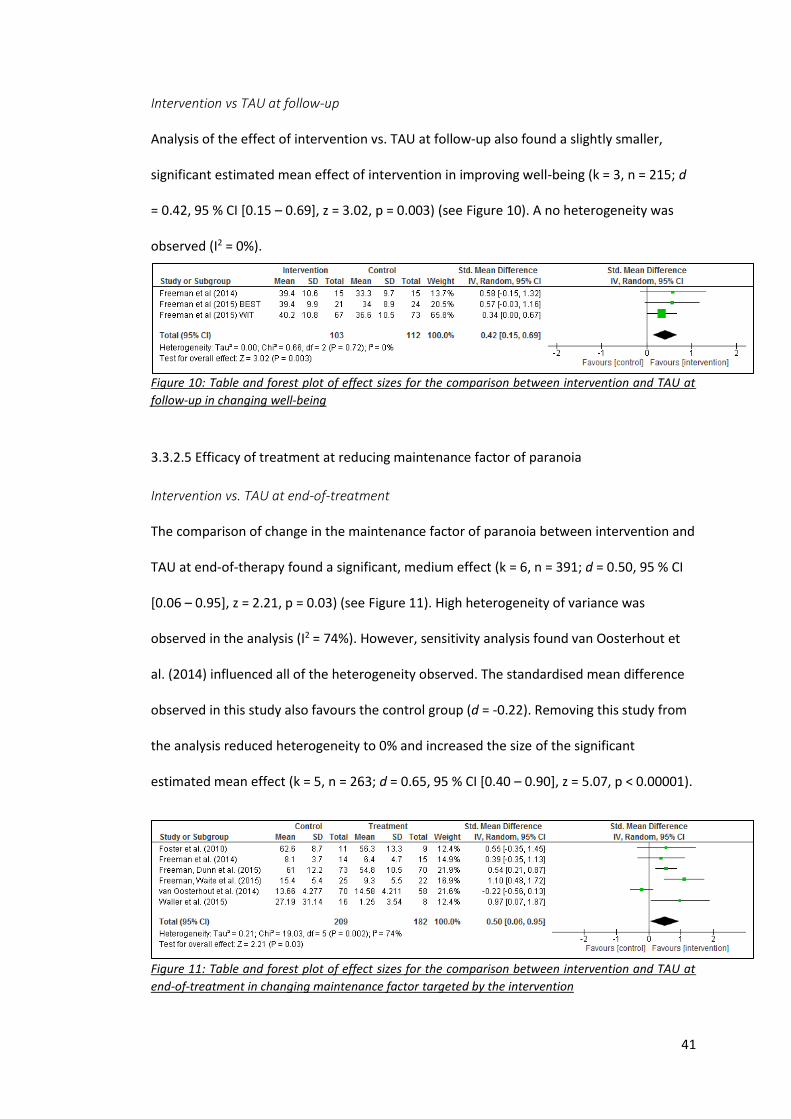
41
Intervention vs TAU at follow-up
Analysis of the effect of intervention vs. TAU at follow-up also found a slightly smaller,
significant estimated mean effect of intervention in improving well-being (k = 3, n = 215; d
= 0.42, 95 % CI [0.15 – 0.69], z = 3.02, p = 0.003) (see Figure 10). A no heterogeneity was
observed (I2 = 0%).
Figure 10: Table and forest plot of effect sizes for the comparison between intervention and TAU at
follow-up in changing well-being
3.3.2.5 Efficacy of treatment at reducing maintenance factor of paranoia
Intervention vs. TAU at end-of-treatment
The comparison of change in the maintenance factor of paranoia between intervention and
TAU at end-of-therapy found a significant, medium effect (k = 6, n = 391; d = 0.50, 95 % CI
[0.06 – 0.95], z = 2.21, p = 0.03) (see Figure 11). High heterogeneity of variance was
observed in the analysis (I2 = 74%). However, sensitivity analysis found van Oosterhout et
al. (2014) influenced all of the heterogeneity observed. The standardised mean difference
observed in this study also favours the control group (d = -0.22). Removing this study from
the analysis reduced heterogeneity to 0% and increased the size of the significant
estimated mean effect (k = 5, n = 263; d = 0.65, 95 % CI [0.40 – 0.90], z = 5.07, p < 0.00001).
Figure 11: Table and forest plot of effect sizes for the comparison between intervention and TAU at
end-of-treatment in changing maintenance factor targeted by the intervention
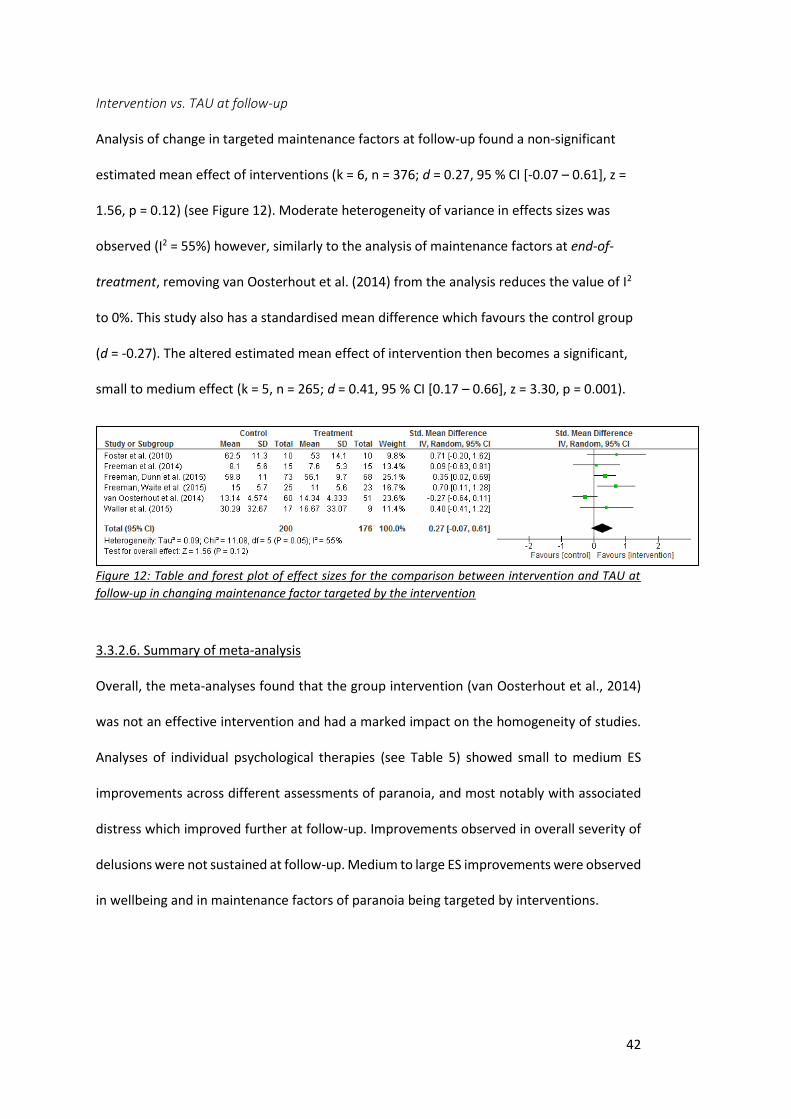
42
Intervention vs. TAU at follow-up
Analysis of change in targeted maintenance factors at follow-up found a non-significant
estimated mean effect of interventions (k = 6, n = 376; d = 0.27, 95 % CI [-0.07 – 0.61], z =
1.56, p = 0.12) (see Figure 12). Moderate heterogeneity of variance in effects sizes was
observed (I2 = 55%) however, similarly to the analysis of maintenance factors at end-of-
treatment, removing van Oosterhout et al. (2014) from the analysis reduces the value of I2
to 0%. This study also has a standardised mean difference which favours the control group
(d = -0.27). The altered estimated mean effect of intervention then becomes a significant,
small to medium effect (k = 5, n = 265; d = 0.41, 95 % CI [0.17 – 0.66], z = 3.30, p = 0.001).
Figure 12: Table and forest plot of effect sizes for the comparison between intervention and TAU at
follow-up in changing maintenance factor targeted by the intervention
3.3.2.6. Summary of meta-analysis
Overall, the meta-analyses found that the group intervention (van Oosterhout et al., 2014)
was not an effective intervention and had a marked impact on the homogeneity of studies.
Analyses of individual psychological therapies (see Table 5) showed small to medium ES
improvements across different assessments of paranoia, and most notably with associated
distress which improved further at follow-up. Improvements observed in overall severity of
delusions were not sustained at follow-up. Medium to large ES improvements were observed
in wellbeing and in maintenance factors of paranoia being targeted by interventions.
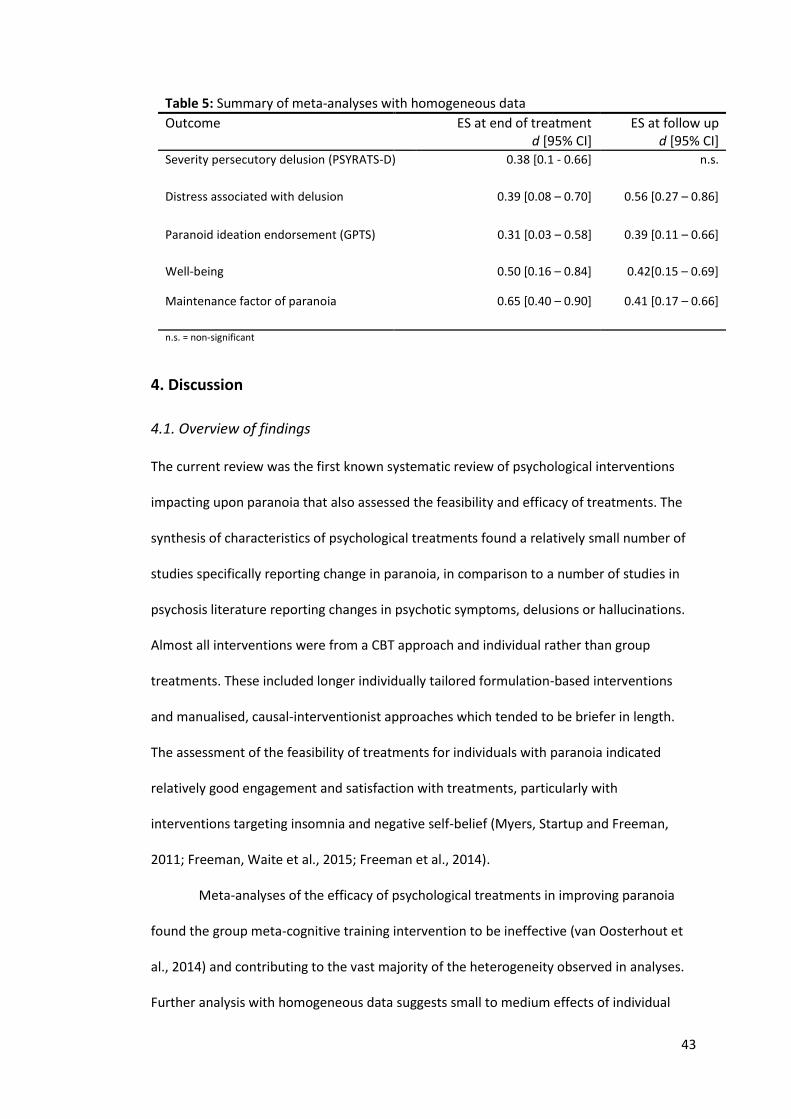
43
Table 5: Summary of meta-analyses with homogeneous data
Outcome ES at end of treatment d [95% CI]
ES at follow up d [95% CI]
Severity persecutory delusion (PSYRATS-D) 0.38 [0.1 - 0.66] n.s.
Distress associated with delusion 0.39 [0.08 – 0.70] 0.56 [0.27 – 0.86]
Paranoid ideation endorsement (GPTS) 0.31 [0.03 – 0.58] 0.39 [0.11 – 0.66]
Well-being 0.50 [0.16 – 0.84] 0.42[0.15 – 0.69]
Maintenance factor of paranoia 0.65 [0.40 – 0.90] 0.41 [0.17 – 0.66]
n.s. = non-significant
4. Discussion
4.1. Overview of findings
The current review was the first known systematic review of psychological interventions
impacting upon paranoia that also assessed the feasibility and efficacy of treatments. The
synthesis of characteristics of psychological treatments found a relatively small number of
studies specifically reporting change in paranoia, in comparison to a number of studies in
psychosis literature reporting changes in psychotic symptoms, delusions or hallucinations.
Almost all interventions were from a CBT approach and individual rather than group
treatments. These included longer individually tailored formulation-based interventions
and manualised, causal-interventionist approaches which tended to be briefer in length.
The assessment of the feasibility of treatments for individuals with paranoia indicated
relatively good engagement and satisfaction with treatments, particularly with
interventions targeting insomnia and negative self-belief (Myers, Startup and Freeman,
2011; Freeman, Waite et al., 2015; Freeman et al., 2014).
Meta-analyses of the efficacy of psychological treatments in improving paranoia
found the group meta-cognitive training intervention to be ineffective (van Oosterhout et
al., 2014) and contributing to the vast majority of the heterogeneity observed in analyses.
Further analysis with homogeneous data suggests small to medium effects of individual
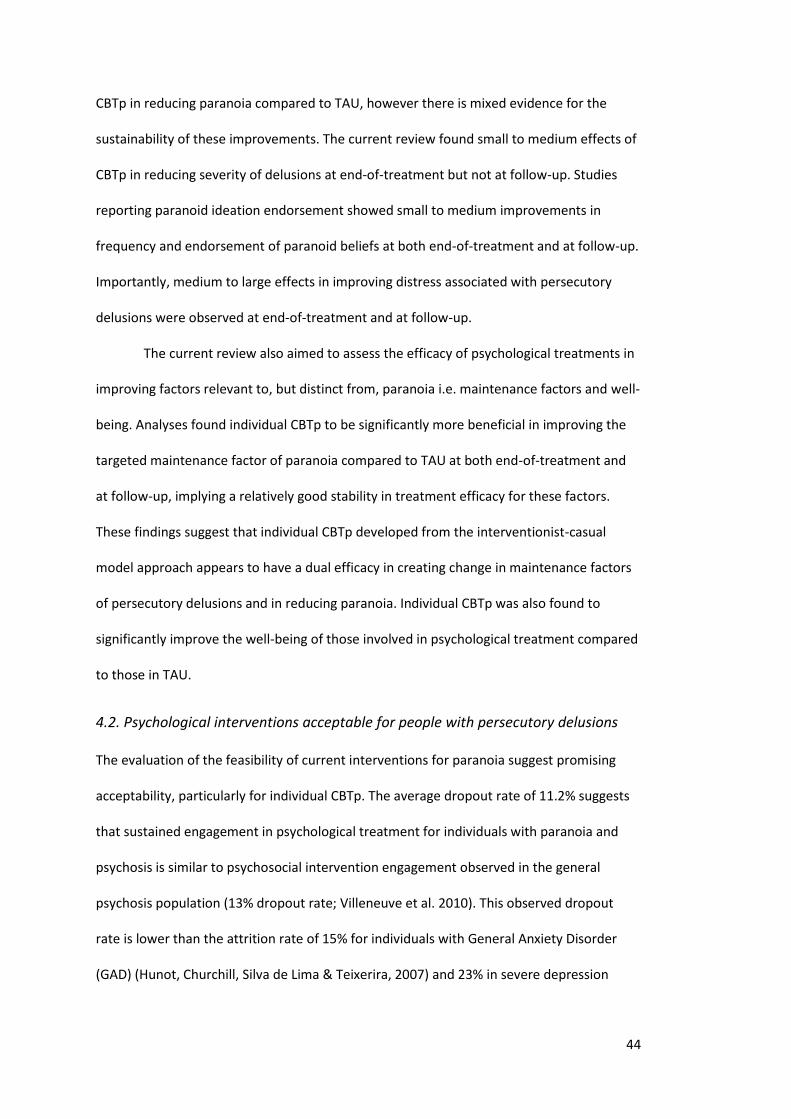
44
CBTp in reducing paranoia compared to TAU, however there is mixed evidence for the
sustainability of these improvements. The current review found small to medium effects of
CBTp in reducing severity of delusions at end-of-treatment but not at follow-up. Studies
reporting paranoid ideation endorsement showed small to medium improvements in
frequency and endorsement of paranoid beliefs at both end-of-treatment and at follow-up.
Importantly, medium to large effects in improving distress associated with persecutory
delusions were observed at end-of-treatment and at follow-up.
The current review also aimed to assess the efficacy of psychological treatments in
improving factors relevant to, but distinct from, paranoia i.e. maintenance factors and well-
being. Analyses found individual CBTp to be significantly more beneficial in improving the
targeted maintenance factor of paranoia compared to TAU at both end-of-treatment and
at follow-up, implying a relatively good stability in treatment efficacy for these factors.
These findings suggest that individual CBTp developed from the interventionist-casual
model approach appears to have a dual efficacy in creating change in maintenance factors
of persecutory delusions and in reducing paranoia. Individual CBTp was also found to
significantly improve the well-being of those involved in psychological treatment compared
to those in TAU.
4.2. Psychological interventions acceptable for people with persecutory delusions
The evaluation of the feasibility of current interventions for paranoia suggest promising
acceptability, particularly for individual CBTp. The average dropout rate of 11.2% suggests
that sustained engagement in psychological treatment for individuals with paranoia and
psychosis is similar to psychosocial intervention engagement observed in the general
psychosis population (13% dropout rate; Villeneuve et al. 2010). This observed dropout
rate is lower than the attrition rate of 15% for individuals with General Anxiety Disorder
(GAD) (Hunot, Churchill, Silva de Lima & Teixerira, 2007) and 23% in severe depression
45
(Arnow et al., 2007). In the current review, engagement appears to be good irrespective of
treatment length, albeit the majority of studies offer briefer treatments.
Individual CBTp had a noticeably lower attrition rate in comparison to group
interventions, whereby some studies had no individuals decline or dropout of treatment. In
general psychotherapy literature, greater dropout rates are observed in group treatments
compared to individual therapy, with approximately 20 to 50% of client’s terminating group
therapy early in the treatment (Stone & Rutan, 1984) and an estimated average dropout
rate of 35% (Bostwick, 1987). It is hypothesised that entering a group process with
numerous unknown service-users can be extremely threatening for some individuals and
lead to premature termination of treatment (MacNair & Corazzini, 1994). It is further
hypothesised that premature terminations may impact on meaningful group work (Yalom,
1966; 1985) and precipitate a wave of other dropouts (Stone, Blaze & Bozzuto, 1980).
Dynamics such as these may be particularly relevant for individuals with paranoia.
Individuals with persecutory delusions are found to have heightened perceptions of social
threat (Green & Phillips, 2004), selective attention to threat-stimuli (Bentall & Kaney,
1989), and excessive sensitivity to others’ expressions of negative emotions (Bentall,
Corcoran, Howard, Blackwood & Kinderman, 2001). It is therefore likely that these
individuals will find a group scenario more threatening that one-to-one therapeutic
interactions as there is a greater presence of stimuli that may trigger a perception of
threat, hence a greater dropout rate is observed.
Considering the aforementioned heightened sensitivity to threat amongst
individuals with persecutory delusions, it is perhaps surprising to find a relatively low level
of treatment attrition in individual interventions. However, it would seem that individuals
with persecutory delusions, considering the inherently distressing nature of the condition,
do wish to have access to psychological treatment, equally if not more so than people with
other mental health conditions. Research in physical illness has identified a number of key
46
appraisals that are linked to uptake of treatment (Weinman, Petrie, Moss-Morris & Horne,
1996; Hagger & Orbell, 2003; Petrie, Jago & Devcich, 2007). These include beliefs about the
cause of illness, the length of the prognosis, the severity of the consequences and the
amount of control the individual has over their illness. Freeman et al. (2013) investigated
the impact of these beliefs in the uptake of longer-term CBT in a psychosis population.
Conclusions were tentative due to lack of power but it was suggested that a low sense of
control and a more biological view of illness was linked with declining therapy, whereas an
attribution of illness to their personality or state of mind was linked to better uptake of
CBT. As a number of the interventions identified in the current review targeted problems
outside of psychosis (e.g. insomnia, worry), it is possible that individuals perceived they had
more control over such problems and linked this more with their state of mind in
comparison to their perception about their persecutory beliefs. Furthermore, targeting
associated difficulties, such as sleep, might facilitate engagement by establishing shared
therapeutic goals and collaborative working, which are associated with improved
therapeutic engagement and treatment outcomes (Bachelor, 2013).
4.3. Efficacy of treatment on a range of paranoia measures and related factors
Overall, results show that individual CBTp interventions tailored for individuals with
paranoia are significantly more beneficial in reducing the severity of persecutory delusions
and endorsement of paranoid ideation than TAU immediately following treatment. The
mean effect sizes observed are comparable with those seen in other meta-analyses
evaluating efficacy of CBTp for all delusions (Van der Gaag et al., 2014; Mehl et al., 2015).
Whilst improvements in the endorsement of paranoid ideation (GPTS) were observable at
follow-up, improvements in severity of persecutory delusions (PSYRATS-D) were not.
Importantly, studies reporting change in distress associated with persecutory delusions
found significant and relatively large effects of interventions in reducing distress at both
end-of treatment and at follow-up. In keeping with this, significant and sustained
47
improvement in overall well-being was observed in those receiving treatment compared
with TAU. This is a particularly important finding as research has shown that individuals
with persecutory delusions have levels of well-being at least one standard deviation below
that of the normal population (Freeman, Startup et al., 2014).
The above findings suggest that current interventions targeting paranoia are more
effective in reducing the level of general paranoid ideation and distress associated with
paranoid beliefs but are less effective in improving overall severity of persecutory
delusions. It is possible that the causal-interventionist treatments for paranoia target
maintenance factors that are more closely related to general paranoid ideation and distress
than those factors more crucial in severe persecutory delusions. For example, it is
suggested that the formation and maintenance of persecutory delusions are related to
idiosyncratic negative beliefs about the self (Garety, Kuipers, Fowler, Freeman &
Bebbington, 2001). There is also evidence in the literature that persecutory delusions serve
a defensive explanatory bias which protect an individual from the triggering of negative
self-schemas that highlight discrepancies between an individual’s ideal-self and actual-self
(Bentall, Kinderman & Kaney, 1994). Potentially, other therapeutic approaches, such as
longer individually tailored formulation-based CBT or compassion focused therapy, may
better address individuals’ negative self-schemas and other idiosyncratic maintenance
factors that could be contributing to the severity of their persecutory delusions. Further
clinical research is needed to determine the efficacy of other treatment approaches in
reducing paranoia, particularly outside of causal-interventionist approaches and in
comparison to active treatment.
The disparity observed between outcomes in PSYRATS-D and GPTS measures poses
a question about the current operationalisation of clinically significant change in paranoia.
PSYRATS-D is a measure developed to assess all forms of delusions (e.g. of grandeur,
reference, control, persecution etc.) and places an equal importance on the conviction,
48
preoccupation, distress and functional impact of the delusional belief. The measure is also
predominantly clinician-led rather than self-rated and requires focus on a main belief,
potentially overlooking whether or not multiple delusions (persecutory or otherwise) are
held. In contrast, the GPTS is self-rated and specifically focuses on the endorsement of
multiple ideas of social reference and ideas of persecution, incorporating items that also
measure associated distress. Whilst this measure may better capture the level of general
paranoid ideation in an individual, there is also a potential for response bias and an
omission of measurement of the severity and impact of a specific persecutory delusion.
This should be considered in future research, and indeed clinical practice, when selecting a
tool to measure change in paranoia.
It is important to note that the group meta-cognitive intervention included in the
initial analysis (van Oosterhout et al., 2014), consistently showed the intervention to be less
effective than TAU and was responsible for the majority of the heterogeneity in observed
variance of effect sizes. This was observed despite the study being scored highest on total
quality. As such, it is reasonable to deduce that the observed outcomes are more
attributable to the psychological mechanisms of the intervention, rather than faults in
methodology or treatment quality. Although some evidence exists for the efficacy of MCT
for individuals with mild delusions (Ferwerda et al., 2010; Moritz et al., 2011), van
Oosterhout et al. (2014) concluded that MCT interventions may not be effective for
individuals with moderate to severe delusions. The intervention predominantly uses
psychoeducation as a mechanism for change, leading the authors to conclude that MCT
may not elicit the necessary emotional arousal needed to create change in core cognitions
involved in more severe persecutory delusions. As such, the inefficacy of this intervention is
likely to be more attributable to the specific content of the treatment, than the fact that it
was a group intervention.
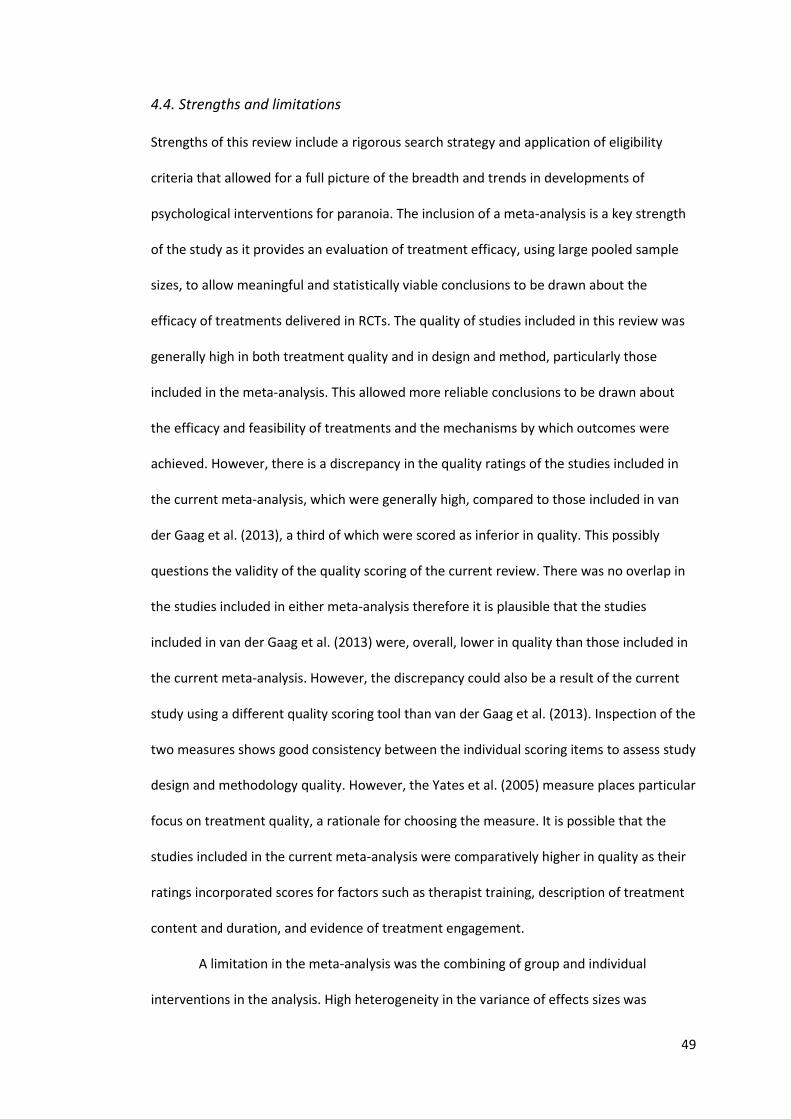
49
4.4. Strengths and limitations
Strengths of this review include a rigorous search strategy and application of eligibility
criteria that allowed for a full picture of the breadth and trends in developments of
psychological interventions for paranoia. The inclusion of a meta-analysis is a key strength
of the study as it provides an evaluation of treatment efficacy, using large pooled sample
sizes, to allow meaningful and statistically viable conclusions to be drawn about the
efficacy of treatments delivered in RCTs. The quality of studies included in this review was
generally high in both treatment quality and in design and method, particularly those
included in the meta-analysis. This allowed more reliable conclusions to be drawn about
the efficacy and feasibility of treatments and the mechanisms by which outcomes were
achieved. However, there is a discrepancy in the quality ratings of the studies included in
the current meta-analysis, which were generally high, compared to those included in van
der Gaag et al. (2013), a third of which were scored as inferior in quality. This possibly
questions the validity of the quality scoring of the current review. There was no overlap in
the studies included in either meta-analysis therefore it is plausible that the studies
included in van der Gaag et al. (2013) were, overall, lower in quality than those included in
the current meta-analysis. However, the discrepancy could also be a result of the current
study using a different quality scoring tool than van der Gaag et al. (2013). Inspection of the
two measures shows good consistency between the individual scoring items to assess study
design and methodology quality. However, the Yates et al. (2005) measure places particular
focus on treatment quality, a rationale for choosing the measure. It is possible that the
studies included in the current meta-analysis were comparatively higher in quality as their
ratings incorporated scores for factors such as therapist training, description of treatment
content and duration, and evidence of treatment engagement.
A limitation in the meta-analysis was the combining of group and individual
interventions in the analysis. High heterogeneity in the variance of effects sizes was
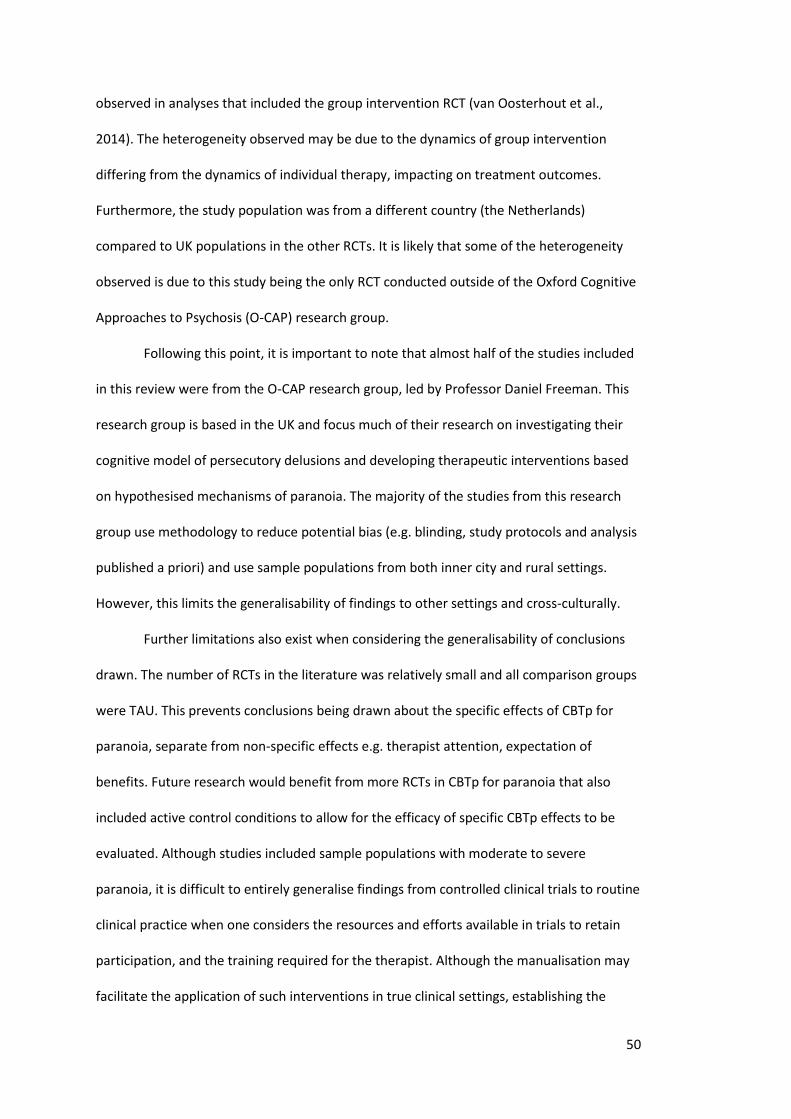
50
observed in analyses that included the group intervention RCT (van Oosterhout et al.,
2014). The heterogeneity observed may be due to the dynamics of group intervention
differing from the dynamics of individual therapy, impacting on treatment outcomes.
Furthermore, the study population was from a different country (the Netherlands)
compared to UK populations in the other RCTs. It is likely that some of the heterogeneity
observed is due to this study being the only RCT conducted outside of the Oxford Cognitive
Approaches to Psychosis (O-CAP) research group.
Following this point, it is important to note that almost half of the studies included
in this review were from the O-CAP research group, led by Professor Daniel Freeman. This
research group is based in the UK and focus much of their research on investigating their
cognitive model of persecutory delusions and developing therapeutic interventions based
on hypothesised mechanisms of paranoia. The majority of the studies from this research
group use methodology to reduce potential bias (e.g. blinding, study protocols and analysis
published a priori) and use sample populations from both inner city and rural settings.
However, this limits the generalisability of findings to other settings and cross-culturally.
Further limitations also exist when considering the generalisability of conclusions
drawn. The number of RCTs in the literature was relatively small and all comparison groups
were TAU. This prevents conclusions being drawn about the specific effects of CBTp for
paranoia, separate from non-specific effects e.g. therapist attention, expectation of
benefits. Future research would benefit from more RCTs in CBTp for paranoia that also
included active control conditions to allow for the efficacy of specific CBTp effects to be
evaluated. Although studies included sample populations with moderate to severe
paranoia, it is difficult to entirely generalise findings from controlled clinical trials to routine
clinical practice when one considers the resources and efforts available in trials to retain
participation, and the training required for the therapist. Although the manualisation may
facilitate the application of such interventions in true clinical settings, establishing the
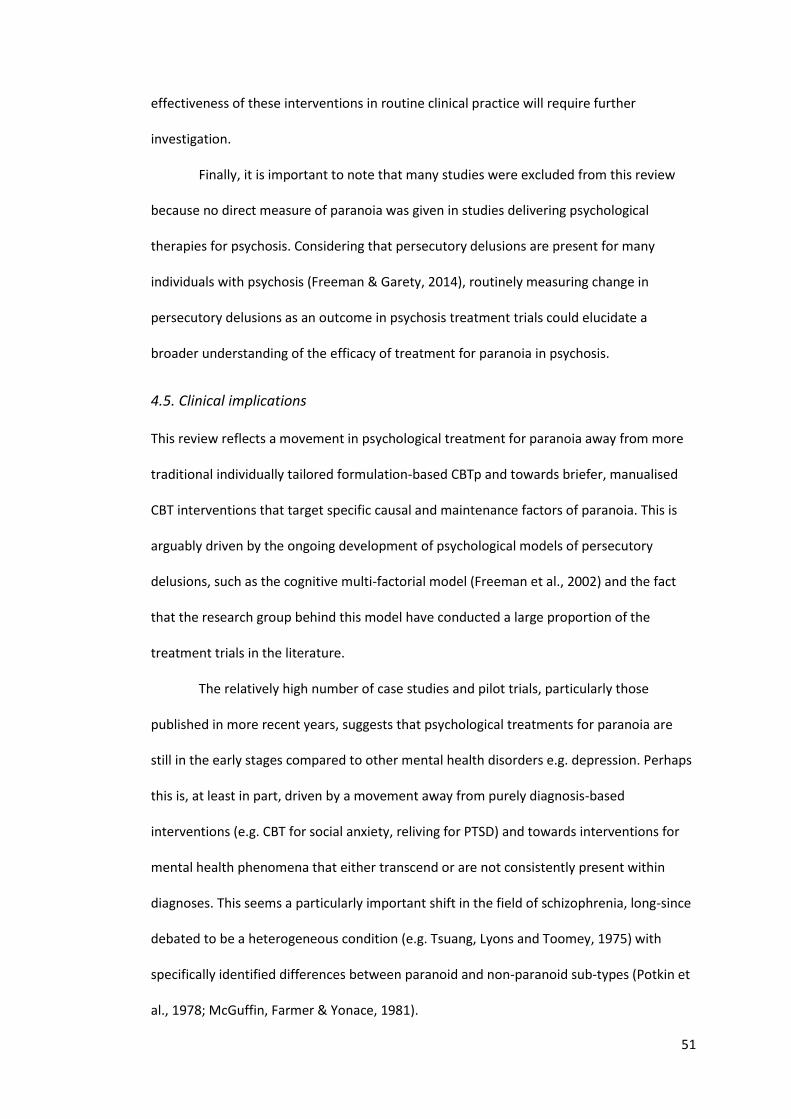
51
effectiveness of these interventions in routine clinical practice will require further
investigation.
Finally, it is important to note that many studies were excluded from this review
because no direct measure of paranoia was given in studies delivering psychological
therapies for psychosis. Considering that persecutory delusions are present for many
individuals with psychosis (Freeman & Garety, 2014), routinely measuring change in
persecutory delusions as an outcome in psychosis treatment trials could elucidate a
broader understanding of the efficacy of treatment for paranoia in psychosis.
4.5. Clinical implications
This review reflects a movement in psychological treatment for paranoia away from more
traditional individually tailored formulation-based CBTp and towards briefer, manualised
CBT interventions that target specific causal and maintenance factors of paranoia. This is
arguably driven by the ongoing development of psychological models of persecutory
delusions, such as the cognitive multi-factorial model (Freeman et al., 2002) and the fact
that the research group behind this model have conducted a large proportion of the
treatment trials in the literature.
The relatively high number of case studies and pilot trials, particularly those
published in more recent years, suggests that psychological treatments for paranoia are
still in the early stages compared to other mental health disorders e.g. depression. Perhaps
this is, at least in part, driven by a movement away from purely diagnosis-based
interventions (e.g. CBT for social anxiety, reliving for PTSD) and towards interventions for
mental health phenomena that either transcend or are not consistently present within
diagnoses. This seems a particularly important shift in the field of schizophrenia, long-since
debated to be a heterogeneous condition (e.g. Tsuang, Lyons and Toomey, 1975) with
specifically identified differences between paranoid and non-paranoid sub-types (Potkin et
al., 1978; McGuffin, Farmer & Yonace, 1981).
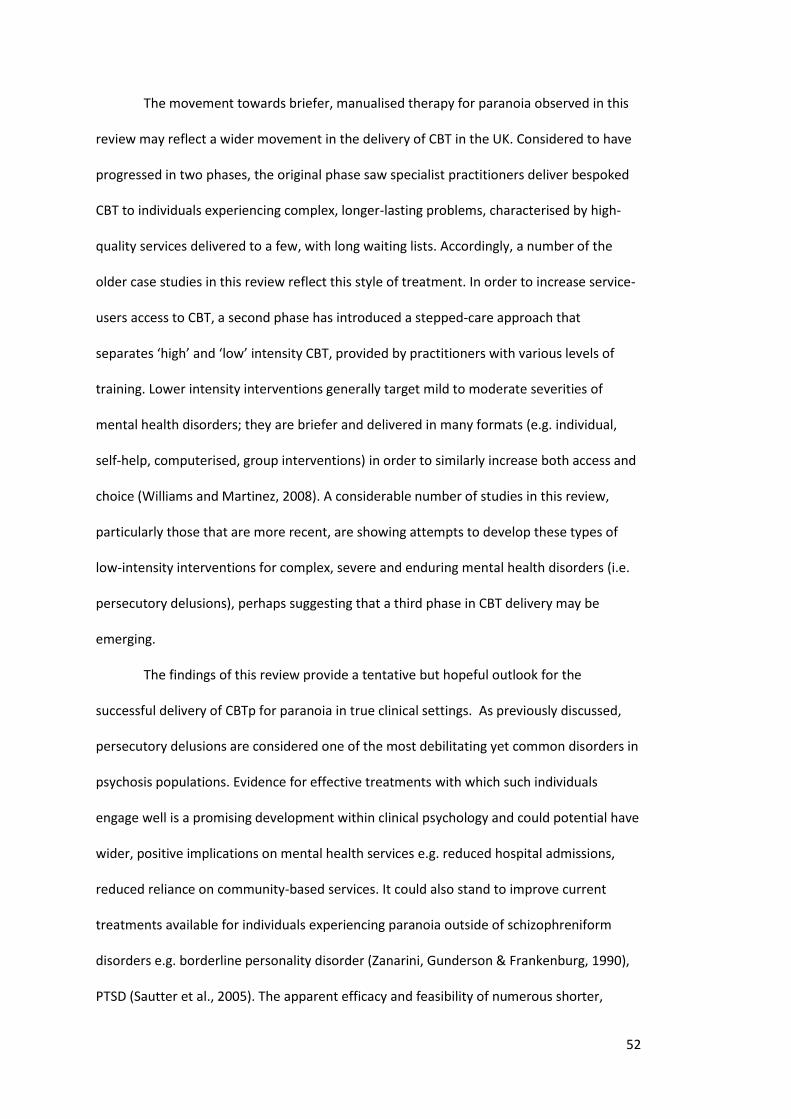
52
The movement towards briefer, manualised therapy for paranoia observed in this
review may reflect a wider movement in the delivery of CBT in the UK. Considered to have
progressed in two phases, the original phase saw specialist practitioners deliver bespoked
CBT to individuals experiencing complex, longer-lasting problems, characterised by high-
quality services delivered to a few, with long waiting lists. Accordingly, a number of the
older case studies in this review reflect this style of treatment. In order to increase service-
users access to CBT, a second phase has introduced a stepped-care approach that
separates ‘high’ and ‘low’ intensity CBT, provided by practitioners with various levels of
training. Lower intensity interventions generally target mild to moderate severities of
mental health disorders; they are briefer and delivered in many formats (e.g. individual,
self-help, computerised, group interventions) in order to similarly increase both access and
choice (Williams and Martinez, 2008). A considerable number of studies in this review,
particularly those that are more recent, are showing attempts to develop these types of
low-intensity interventions for complex, severe and enduring mental health disorders (i.e.
persecutory delusions), perhaps suggesting that a third phase in CBT delivery may be
emerging.
The findings of this review provide a tentative but hopeful outlook for the
successful delivery of CBTp for paranoia in true clinical settings. As previously discussed,
persecutory delusions are considered one of the most debilitating yet common disorders in
psychosis populations. Evidence for effective treatments with which such individuals
engage well is a promising development within clinical psychology and could potential have
wider, positive implications on mental health services e.g. reduced hospital admissions,
reduced reliance on community-based services. It could also stand to improve current
treatments available for individuals experiencing paranoia outside of schizophreniform
disorders e.g. borderline personality disorder (Zanarini, Gunderson & Frankenburg, 1990),
PTSD (Sautter et al., 2005). The apparent efficacy and feasibility of numerous shorter,
53
manualised CBTp interventions could stand to increase the availability and choice service-
users suffering with paranoia have with regards to psychological interventions.
Finally, there are also implications on the current NICE guidelines (NICE, 2014)
which recommend a minimum of 16 sessions of individually-tailored CBTp for service-users
with psychosis. Currently, these guidelines do not make any specific recommendation for
the treatment of persecutory delusions. In time, a revision to the guidelines to specify
treatments for paranoia may be warranted. For this to occur justifiably, future research
would need to concentrate on further establishing the efficacy of CBTp for paranoia, to
clarify the operationalisation of ‘recovery’ from paranoia and to tighten our understanding
of the mechanisms that underpin it. The more general growing body of evidence for low-
intensity CBTp may also warrant its inclusion as a recommended treatment for psychosis in
the near future. However, replication of studies in different settings and by independent
research groups is needed in order to confirm the efficacy of brief CBTp, particularly for
persecutory delusions. Future research in CBTp for paranoia should also consider the
implementation of interventions (e.g. low-intensity, manualised vs longer, individualised
CBT) and the feasibility of their application in mental health services.
54
References
American Psychiatric Association (2000). Diagnostic and statistical manual of mental disorders
(4th Edition). doi:10.1176/appi.books.9780890423349.
Arnow, B. A., Blasey, C., Manber, R., Constantino, M. J., Markowitz, J. C., Klein, D. N., Thase, M.,
Kocsis, J., & Rush, A. J. (2007). Dropouts versus completers among chronically
depressed outpatients. Journal of affective disorders, 97(1), 197-202.
Bachelor, A. (2013). Clients' and therapists' views of the therapeutic alliance: Similarities,
differences and relationship to therapy outcome. Clinical Psychology & Psychotherapy,
20(2), 118-135.
Balzan, R. P., & Galletly, C. (2015). Metacognitive therapy (MCT+) in patients with psychosis not
receiving antipsychotic medication: A case study. Frontiers in Psychology Vol 6 Jul 2015,
ArtID 967, 6.
Bastien, C. H., Vallieres, A., & Morin, C. M. (2001). Validation of the Insomnia Severity Index as
an outcome measure for insomnia research. Sleep medicine, 2(4), 297-307.
Bell, V., & Freeman, D. (2014). A pilot trial of cognitive behavioural therapy for interpersonal
sensitivity in individuals with persecutory delusions. Journal of Behavior Therapy and
Experimental Psychiatry, 45(4), 441-446.
Bentall, R. P., Corcoran, R., Howard, R., Blackwood, N., & Kinderman, P. (2001). Persecutory
delusions: a review and theoretical integration. Clinical psychology review, 21(8), 1143-
1192.
Bentall, R. P., & Kaney, S. (1989). Content specific information processing and persecutory
delusions: an investigation using the emotional Stroop test. British Journal of Medical
Psychology, 62(4), 355-364.
Bentall, R. P., Kinderman, P., & Kaney, S. (1994). The self, attributional processes and abnormal
beliefs: Towards a model of persecutory delusions. Behaviour Research and Therapy,
32(3), 331-341.
55
Bentall, R. P., Rouse, G., Kinderman, P., Blackwood, N., Howard, R., Moore, R., Cummins, R.,
Corcoran, R. (2008). Paranoid delusions in schizophrenia spectrum disorders and
depression: the transdiagnostic role of expectations of negative events and negative
self-esteem. The Journal of nervous and mental disease, 196(5), 375-383.
Blackledge, J. T. (2007). Disrupting verbal processes: Cognitive defusion in acceptance and
commitment therapy and other mindfulness-based psychotherapies. The Psychological
Record, 57(4), 555.
Bloy, S., Oliver, J. E., & Morris, E. (2011). Using acceptance and commitment therapy with
people with psychosis: A case study. Clinical Case Studies, 10(5), 347-359.
Bostwick, G. J. (1987). "Where's Mary?" A review of the group treatment dropout literature.
Social Work with Groups, 10(3), 117-132.
Boyce, P., & Parker, G. (1989). Development of a scale to measure interpersonal sensitivity.
Australian and New Zealand Journal of Psychiatry, 23(3), 341-351.
Campbell, M., Fitzpatrick, R., Haines, A., Kinmonth, A. L., Sandercock, P., Spiegelhalter, D., &
Tyrer, P. (2000). Framework for design and evaluation of complex interventions to
improve health. BMJ, 321(7262), 694-696. doi: 10.1136/bmj.321.7262.694
Carden, J., & Jones, A. (2009). Collecting subjective and rating scale data within a single case
study design: Cognitive behavioural therapy for a person experiencing psychosis.
Journal of Psychiatric and Mental Health Nursing, 16(9), 848-856.
Castle, D. J., Phelan, M., Wessely, S., & Murray, R. M. (1994). Which patients with non-affective
functional psychosis are not admitted at first psychiatric contact? The British Journal of
Psychiatry, 165(1), 101-106.
Cather, C., Penn, D., Otto, M. W., Yovel, I., Mueser, K. T., & Goff, D. C. (2005). A pilot study of
functional Cognitive Behavioral Therapy (fCBT) for schizophrenia. Schizophrenia
research, 74(2), 201-209.
Chadwick, P., Hember, M., Symes, J., Peters, E., Kuipers, E., & Dagnan, D. (2008). Responding
mindfully to unpleasant thoughts and images: reliability and validity of the
56
Southampton mindfulness questionnaire (SMQ). British Journal of Clinical Psychology,
47(4), 451-455.
Chadwick, P., Hughes, S., Russell, D., Russell, I., & Dagnan, D. (2009). Mindfulness groups for
distressing voices and paranoia: a replication and randomized feasibility trial.
Behavioural & Cognitive Psychotherapy, 37(4), 403-412.
Chadwick, P., & Trower, P. (1996). Cognitive therapy for punishment paranoia: A single case
experiment. Behaviour Research and Therapy, 34(4), 351-356.
Coid, J. W., Ullrich, S., Kallis, C., Keers, R., Barker, D., Cowden, F., & Stamps, R. (2013). The
relationship between delusions and violence: findings from the East London first
episode psychosis study. JAMA psychiatry, 70(5), 465-471.
Corrigan, P. W., Liberman, R. P., & Engel, J. D. (1990). From noncompliance to collaboration in
the treatment of schizophrenia. Psychiatric Services, 41(11), 1203-1211.
Craig, P., Dieppe, P., Macintyre, S., Michie, S., Nazareth, I., & Petticrew, M. (2008). Developing
and evaluating complex interventions: the new Medical Research Council guidance.
British Medical Journal, 337. doi: 10.1136/bmj.a1655
Cramer, J. A., & Rosenheck, R. (1998). Compliance with medication regimens for mental and
physical disorders. Psychiatric Services, 49(2), 196-201.
Cutting, J. (1997). Principles of Psychopathology Two Worlds, Two Minds, Two Hemispheres.
Oxford: Oxford University Press.
Dudley, R., Dixon, J., & Turkington, D. (2005). CBT for a Person With Schizophrenia: Systematic
Desensitization for Phobias Led to Positive Symptom Improvement. Behavioural and
Cognitive Psychotherapy, 33(2), 249-254.
Ellett, L. (2013). Mindfulness for paranoid beliefs: Evidence from two case studies. Behavioural
and Cognitive Psychotherapy, 41(2), 238-242.
Espie, C. A. (2006). Overcoming Insomnia: A Self-Help Guide Using Cognitive Behavioural
Therapy. London: Robinson.
57
Fenigstein, A., & Vanable, P. A. (1992). Paranoia and self-consciousness. Journal of Personality
and Social Psychology, 62(1), 129-138. doi: 10.1037/0022-3514.62.1.129
Ferwerda, D. J., De Boer, D. K., & van der Gaag, D. M. (2010). Metacognitieve training voor
patiënten met een psychotische kwetsbaarheid. Directieve therapie, 30(4), 263-279.
Foster, C., Startup, H., Potts, L., & Freeman, D. (2010). A randomised controlled trial of a worry
intervention for individuals with persistent persecutory delusions. Journal of Behavior
Therapy and Experimental Psychiatry, 41(1), 45-51.
Fowler, D., Freeman, D., Smith, B., Kuipers, E., Bebbington, P., Bashforth, H., Coker, S.,
Hodgekins, J., Gracie, A., Dunn, G., Garety, P. (2006). The Brief Core Schema Scales
(BCSS): psychometric properties and associations with paranoia and grandiosity in non-
clinical and psychosis samples. Psychological Medicine, 36(06), 749-759.
Freeman, D. (2007). Suspicious minds: the psychology of persecutory delusions. Clinical
psychology review, 27(4), 425-457.
Freeman, D., Bradley, J., Waite, F., Sheaves, B., DeWeever, N., Bourke, E., McInerney, J., Evans,
N., Černis, E., & Lister, R. (2016). Targeting recovery in persistent persecutory
delusions: a proof of principle study of a new translational psychological treatment.
Behavioural and Cognitive Psychotherapy, 1-14. doi:10.1017/S1352465816000060.
Freeman, D., Dunn, G., Garety, P., Weinman, J., Kuipers, E., Fowler, D., Jolley, S., & Bebbington,
P. (2013). Patients' beliefs about the causes, persistence and control of psychotic
experiences predict take-up of effective cognitive behaviour therapy for psychosis.
Psychological medicine, 43(02), 269-277.
Freeman, D., Dunn, G., Startup, H., Pugh, K., Cordwell, J., Mander, H., Černis, E., Wingham, G.,
Shirvell, K., & Kingdon, D. (2015). Effects of cognitive behaviour therapy for worry on
persecutory delusions in patients with psychosis (WIT): A parallel, single-blind,
randomised controlled trial with a mediation analysis. The Lancet Psychiatry, 2(4), 305-
313.
58
Freeman, D., & Freeman, J. R. (2010). Know your mind: the complete family reference guide to
emotional health. New York: Sterling Publishing.
Freeman, D., & Garety, P. (2014). Advances in understanding and treating persecutory
delusions: a review. Social psychiatry and psychiatric epidemiology, 49(8), 1179-1189.
Freeman, D., & Garety, P. A. (2000). Comments on the content of persecutory delusions: Does
the definition need clarification? British Journal of Clinical Psychology, 39(4), 407-414.
Freeman, D., Garety, P. A., Kuipers, E., Fowler, D., & Bebbington, P. E. (2002). A cognitive model
of persecutory delusions. British Journal of Clinical Psychology, 41(4), 331-347. doi:
10.1348/014466502760387461
Freeman, D., Pugh, K., Dunn, G., Evans, N., Sheaves, B., Waite, F., Černis, E., Lister, R., & Fowler,
D. (2014). An early Phase II randomised controlled trial testing the effect on
persecutory delusions of using CBT to reduce negative cognitions about the self: the
potential benefits of enhancing self confidence. Schizophrenia research, 160(1), 186-
192.
Freeman, D., Startup, H., Dunn, G., Wingham, G., Černis, E., Evans, N., Lister, R., Pugh, K,
Cordwell, J., & Kingdon, D. (2014). Persecutory delusions and psychological well-being.
Social psychiatry and psychiatric epidemiology, 49(7), 1045-1050.
Freeman, D., Waite, F., Startup, H., Myers, E., Lister, R., McInerney, J., Harvey, A., Geddes, J.,
Zaiwalla, Z., Luengo-Fernandez, R., Foster, R., Clifton, L., & Yu, L-M. (2015). Efficacy of
cognitive behavioural therapy for sleep improvement in patients with persistent
delusions and hallucinations (BEST): a prospective, assessor-blind, randomised
controlled pilot trial. The Lancet Psychiatry, 2(11), 975-983.
Freeman, D., Waller, H., Harpur-Lewis, R. A., Moore, R., Garety, P., Bebbington, P., Kuipers, E.,
Emsley, R., Dunn, G., Fowler, D., & Jolley, S. (2015). Urbanicity, persecutory delusions,
and clinical intervention: the development of a brief CBT module for helping patients
with persecutory delusions enter social urban environments. Behavioural and Cognitive
Psychotherapy, 43(01), 42-51.
59
Garety, P. A., Bebbington, P., Fowler, D., Freeman, D., & Kuipers, E. (2007). Implications for
neurobiological research of cognitive models of psychosis: a theoretical paper.
Psychological Medicine, 37(10), 1377-1391.
Garety, P. A., Kuipers, E., Fowler, D., Freeman, D., & Bebbington, P. (2001). A cognitive model of
the positive symptoms of psychosis. Psychological Medicine, 31(02), 189-195.
Gould, R. A., Mueser, K. T., Bolton, E., Mays, V., & Goff, D. (2001). Cognitive therapy for
psychosis in schizophrenia: an effect size analysis. Schizophrenia research, 48(2), 335-
342.
Green, C., Freeman, D., Kuipers, E., Bebbington, P., Fowler, D., Dunn, G., & Garety, P. (2008).
Measuring ideas of persecution and social reference: the Green et al. Paranoid Thought
Scales (GPTS). Psychological Medicine, 38(01), 101-111.
Green, M. J., & Phillips, M. L. (2004). Social threat perception and the evolution of paranoia.
Neuroscience & Biobehavioral Reviews, 28(3), 333-342.
Haddock, G., McCarron, J., Tarrier, N., & Faragher, E. (1999). Scales to measure dimensions of
hallucinations and delusions: the psychotic symptom rating scales (PSYRATS).
Psychological Medicine, 29(04), 879-889.
Hagger, M. S., & Orbell, S. (2003). A meta-analytic review of the common-sense model of illness
representations. Psychology and health, 18(2), 141-184.
Harvey, A. G., Sharpley, A. L., Ree, M. J., Stinson, K., & Clark, D. M. (2007). An open trial of
cognitive therapy for chronic insomnia. Behaviour Research and Therapy, 45(10), 2491-
2501.
Hayes, S. C. (2005). Get out of your mind and into your life: The new acceptance and
commitment therapy. Oakland: New Harbinger Publications.
Hazell, C. M., Hayward, M., Cavanagh, K., & Strauss, C. (2016). A systematic review and meta-
analysis of low intensity CBT for psychosis. Clinical psychology review, 45, 183-192.
Hedges, L., & Olkin, I. (1985). Statistical models for meta-analysis. New York: Academic Press.
60
Hepworth, C., Startup, H., & Freeman, D. (2011). Developing treatments of persistent
persecutory delusions: the impact of an emotional processing and metacognitive
awareness intervention. The Journal of nervous and mental disease, 199(9), 653-658.
Higgins, J. P., Thompson, S. G., Deeks, J. J., & Altman, D. G. (2003). Measuring inconsistency in
meta-analyses. BMJ, 327(7414), 557-560.
Hunot, V., Churchill, R., Silva de Lima, M., & Teixeira, V. (2007). Psychological therapies for
generalised anxiety disorder. Cochrane Database Systematic Review, 1 CD001848.
Hutton, P., Morrison, A. P., Wardle, M., & Wells, A. (2014). Metacognitive therapy in treatment-
resistant psychosis: a multiple-baseline study. Behavioural & Cognitive Psychotherapy,
42(2), 166-185.
Hutton, P., & Taylor, P. J. (2014). Cognitive behavioural therapy for psychosis prevention: a
systematic review and meta-analysis. Psychological Medicine, 44(03), 449-468.
Jaspers, K. (1913). Allgemeine psychopathologie: ein leitfaden für studierende, ärzte und
psychologen. Berlin: Springer.
Jauhar, S., McKenna, P. J., Radua, J., Fung, E., Salvador, R., & Laws, K. R. (2014). Cognitive-
behavioural therapy for the symptoms of schizophrenia: systematic review and meta-
analysis with examination of potential bias. The British Journal of Psychiatry, 204(1), 20-
29. doi: 10.1192/bjp.bp.112.116285.
Jones, C., Hacker, D., Cormac, I., Meaden, A., & Irving, C. (2012). Cognitive behavioural therapy
versus other psychosocial treatments for schizophrenia. Cochrane Database of
Systematic Reviews. Art. no.: CD008712. doi: 10.1002/14651858.CD008712.pub2.
Kendler, K., & Campbell, J. (2009). Interventionist causal models in psychiatry: repositioning the
mind–body problem. Psychological Medicine, 39(06), 881-887.
Kinderman, P., & Bentall, R. P. (1997). Attribution therapy for paranoid delusions: A case study.
Behavioural and Cognitive Psychotherapy, 25(3), 269-280.
61
Kreyenbuhl, J., Nossel, I. R., & Dixon, L. B. (2009). Disengagement from mental health treatment
among individuals with schizophrenia and strategies for facilitating connections to care:
a review of the literature. Schizophrenia bulletin, 35(4), 696-703.
Kuller, A. M., & Bjorgvinsson, T. (2010). Cognitive behavioral therapy with a paranoid
schizophrenic patient. Clinical Case Studies, 9(5), 311-327.
Lawlor, C., Hall, K., & Ellett, L. (2015). Paranoia in the therapeutic relationship in cognitive
behavioural therapy for psychosis. Behavioural and cognitive psychotherapy, 43(04),
490-501.
Lecomte, T., Spidel, A., Leclerc, C., MacEwan, G. W., Greaves, C., & Bentall, R. P. (2008).
Predictors and profiles of treatment non-adherence and engagement in services
problems in early psychosis. Schizophrenia Research, 102, 295-302.
Lincoln, T. M., Rief, W., Westermann, S., Ziegler, M., Kesting, M.-L., Heibach, E., & Mehl, S.
(2014). Who stays, who benefits? Predicting dropout and change in cognitive behaviour
therapy for psychosis. Psychiatry Research, 216(2), 198-205.
MacNair, R. R., & Corazzini, J. G. (1994). Client factors influencing group therapy dropout.
Psychotherapy: Theory, Research, Practice, Training, 31(2), 352.
McGovern, J., & Turkington, D. (2001). ‘Seeing the wood from the trees’: a continuum model of
psychopathology advocating cognitive behaviour therapy for schizophrenia. Clinical
Psychology & Psychotherapy, 8(3), 149-175. doi: 10.1002/cpp.283
McGuffin, P., Farmer, A. E., & Yonace, A. H. (1981). HLA antigens and subtypes of schizophrenia.
Psychiatry Research, 5(2), 115-122.
Mehl, S., Werner, D., & Lincoln, T. M. (2015). Does Cognitive Behavior Therapy for psychosis
(CBTp) show a sustainable effect on delusions? A meta-analysis. Frontiers in
psychology, 6, 1450.
Meir, H., & Kryger, M. (2004). A Woman’s guide to sleep Disorders. New York: McGraw-Hill.
62
Meyer, T. J., Miller, M. L., Metzger, R. L., & Borkovec, T. D. (1990). Development and validation
of the Penn State worry questionnaire. Behaviour Research and Therapy, 28(6), 487-
495.
Moritz, S., Veckenstedt, R., Randjbar, S., Vitzthum, F., & Woodward, T. (2011). Antipsychotic
treatment beyond antipsychotics: metacognitive intervention for schizophrenia
patients improves delusional symptoms. Psychological Medicine, 41(09), 1823-1832.
Morrison, A. P. (2004). The use of imagery in cognitive therapy for psychosis: a case example.
Memory, 12(4), 517-524.
Myers, E., Startup, H., & Freeman, D. (2011). Cognitive behavioural treatment of insomnia in
individuals with persistent persecutory delusions: a pilot trial. Journal of Behavior
Therapy and Experimental Psychiatry, 42(3), 330-336.
Naeem, F., Farooq, S., & Kingdon, D. (2014). Cognitive behavioral therapy (brief vs standard
duration) for schizophrenia. Schizophrenia bulletin, 40(5), 958-959.
Naeem, F., Khoury, B., Munshi, T., Ayub, M., Lecomte, T., Kingdon, D., & Farooq, S. (2016). Brief
Cognitive Behavioral Therapy for Psychosis (CBTp) for Schizophrenia: Literature Review
and Meta-analysis. International Journal of Cognitive Therapy, 9(1), 73-86.
NICE (2009). Schizophrenia: Core Interventions in the Treatment and Management of
Schizophrenia in Adults in Primary and Secondary Care. NICE clinical guideline 82.
NICE (2014). Psychosis and schizophrenia: treatment and management. NICE clinical guideline
178.
O’Brien, A., Fahmy, R., & Singh, S. P. (2009). Disengagement from mental health services. Social
psychiatry and psychiatric epidemiology, 44(7), 558-568.
Petrie, K. J., Jago, L. A., & Devcich, D. A. (2007). The role of illness perceptions in patients with
medical conditions. Current opinion in psychiatry, 20(2), 163-167.
63
Potkin, S. G., Cannon, H. E., Murphy, D. L., & Wyatt, R. J. (1978). Are paranoid schizophrenics
biologically different from other schizophrenics? New England Journal of Medicine,
298(2), 61-66.
Priebe, S., Watts, J., Chase, M., & Matanov, A. (2005). Processes of disengagement and
engagement in assertive outreach patients: qualitative study. British Journal of
Psychiatry, 187, 438-443.
Rector, N. A., & Beck, A. T. (2001). Cognitive behavioral therapy for schizophrenia: an empirical
review. The Journal of nervous and mental disease, 189(5), 278-287.
Sainsbury Centre for Mental Health (1998). Keys to Engagement: Review of care for people with
severe mental illness who are hard to engage with services. London: Sainsbury Centre
for Mental Health.
Sarin, F., Wallin, L., & Widerlöv, B. (2011). Cognitive behavior therapy for schizophrenia: a meta-
analytical review of randomized controlled trials. Nordic journal of psychiatry, 65(3),
162-174.
Segal, Z. V., Teasdale, J. D., Williams, J. M., & Gemar, M. C. (2002). The mindfulness‐based
cognitive therapy adherence scale: inter‐rater reliability, adherence to protocol and
treatment distinctiveness. Clinical Psychology & Psychotherapy, 9(2), 131-138.
Sautter, F. J., Brailey, K., Uddo, M. M., Hamilton, M. F., Beard, M. G., & Borges, A. H. (1999).
PTSD and comorbid psychotic disorder: comparison with veterans diagnosed with PTSD
or psychotic disorder. Journal of traumatic stress, 12(1), 73-88.
Stone, W. N., Blaze, M., & Bozzuto, J. (1980). Late dropouts from group psychotherapy.
American Journal of Psychotherapy, 34(3), 401-413.
Stone, W. N., & Rutan, J. S. (1984). Duration of treatment in group psychotherapy. International
Journal of Group Psychotherapy, 34(1), 93-109.
Tennant, R., Hiller, L., Fishwick, R., Platt, S., Joseph, S., Weich, S., Parkinson, J., Secker, J., &
Stewart-Brown, S. (2007). The Warwick-Edinburgh mental well-being scale (WEMWBS):
development and UK validation. Health and Quality of life Outcomes, 5(1), 715-722.
64
Trower, P., & Chadwick, P. (1995). Pathways to defense of the self: A theory of two types of
paranoia. Clinical psychology: Science and practice, 2(3), 263-278.
Tsuang, M., Lyons, M., & Toomey, R. (1975). Heterogeneity of schizophrenia. Biological
Psychiatry, 10(4), 465-474.
van der Gaag, M., Valmaggia, L. R., & Smit, F. (2014). The effects of individually tailored
formulation-based cognitive behavioural therapy in auditory hallucinations and
delusions: a meta-analysis. Schizophrenia research, 156(1), 30-37.
Van Oosterhout, B., Krabbendam, L., De Boer, K., Ferwerda, J., Van der Helm, M., Stant, A., &
van der Gaag, M. (2014). Metacognitive group training for schizophrenia spectrum
patients with delusions: a randomized controlled trial. Psychological Medicine, 44(14),
3025-3035.
van Os, J., Linscott, R. J., Myin-Germeys, I., Delespaul, P., & Krabbendam, L. (2009). A systematic
review and meta-analysis of the psychosis continuum: evidence for a psychosis
proneness–persistence–impairment model of psychotic disorder. Psychological
Medicine, 39(02), 179-195. doi:10.1017/S0033291708003814
Villeneuve, K., Potvin, S., Lesage, A., & Nicole, L. (2010). Meta-analysis of rates of dropout from
psychosocial treatment among persons with schizophrenia spectrum disorder.
Schizophrenia research, 121(1), 266-270.
Tarrier, N., & Wykes, T. (2004). Is there evidence that cognitive behaviour therapy is an
effective treatment for schizophrenia? A cautious or cautionary tale? Behaviour
research and therapy, 42(12), 1377-1401.
Waller, H., Emsley, R., Freeman, D., Bebbington, P., Dunn, G., Fowler, D., Hardy, A., Kuipers, E.,
& Garety, P. (2015). Thinking Well: a randomised controlled feasibility study of a new
CBT therapy targeting reasoning biases in people with distressing persecutory
delusional beliefs. Journal of Behavior Therapy and Experimental Psychiatry, 48, 82-89.
Waller, H., Freeman, D., Jolley, S., Dunn, G., & Garety, P. (2011). Targeting reasoning biases in
delusions: A pilot study of the Maudsley Review Training Programme for individuals
65
with persistent, high conviction delusions. Journal of Behavior Therapy and
Experimental Psychiatry, 42(3), 414-421.
Watkins, E. (2004). Appraisals and strategies associated with rumination and worry. Personality
and Individual Differences, 37(4), 679-694.
Weinman, J., Petrie, K. J., Moss-Morris, R., & Horne, R. (1996). The illness perception
questionnaire: a new method for assessing the cognitive representation of illness.
Psychology and health, 11(3), 431-445.
Wells, A., & Cartwright-Hatton, S. (2004). A short form of the metacognitions questionnaire:
properties of the MCQ-30. Behaviour Research and Therapy, 42(4), 385-396.
Wessely, S., Buchanan, A., Reed, A., Cutting, J., Everitt, B., Garety, P., & Taylor, P. (1993). Acting
on delusions. I: Prevalence. The British Journal of Psychiatry, 163(1), 69-76.
Williams, C., & Martinez, R. (2008). Increasing access to CBT: stepped care and CBT self-help
models in practice. Behavioural and Cognitive Psychotherapy, 36(06), 675-683.
Wing, J. K., Babor, T., Brugha, T., Burke, J., Cooper, J., Giel, R., Jablenski, A., Regier, D., &
Sartorius, N. (1990). SCAN: Schedules fonr Clinical Assessment in Neuropsychiatry.
Archives of General Psychiatry, 47(6), 589-593.
Wykes, T., Steel, C., Everitt, B., & Tarrier, N. (2008). Cognitive behavior therapy for
schizophrenia: effect sizes, clinical models, and methodological rigor. Schizophrenia
bulletin, 34(3), 523-537.
Yalom, I. D. (1966). A study of group therapy dropouts. Archives of General Psychiatry, 14(4),
393-414.
Yalom, M. (1985). Maternity, mortality, and the literature of madness. Pennsylvania State:
University Press.
Yates, S. L., Morley, S., Eccleston, C., & Williams, A. C. d. C. (2005). A scale for rating the quality
of psychological trials for pain. Pain, 117(3), 314-325.
66
Young, A. S., Grusky, O., Jordan, D., Belin, T. R. (2000). Routine outcome monitoring in a public
mental health system: the impact of patients who leave care. Psychiatric Services, 51,
85-91.
Zanarini, M. C., Gunderson, J. G., & Frankenburg, F. R. (1990). Cognitive features of borderline
personality disorder. The American Journal of Psychiatry, 147(1), 57-63.
Zimmermann, G., Favrod, J., Trieu, V., & Pomini, V. (2005). The effect of cognitive behavioral
treatment on the positive symptoms of schizophrenia spectrum disorders: a meta-
analysis. Schizophrenia research, 77(1), 1-9.
67
Part 2: Empirical Paper
The role of interpersonal contingency and self-focused
attention in the development of trust in clinical paranoia: a
virtual reality study.
68
Abstract
Aims: Research into interpersonal processes involved in paranoia remains limited. This study
aimed to assess the feasibility of using interactive virtual reality in a clinical sample with
psychosis and persecutory delusions. The study aimed to replicate an experiment which found
healthy individuals high in paranoia showed a hypersensitivity to contingent behaviour which
increased their perceived trust towards the avatar. A further aim was to investigate the impact
of self-focused attention on the perception of interpersonal contingency and trust.
Method: Eighteen male participants with psychosis and paranoia completed the virtual reality
exercise. Participants entered a virtual flat and interviewed a virtual flatmate whose non-verbal
responses were either high or low in contingency in relation to the participant. Trust towards
the avatar was measured by self-report and behaviour towards the virtual flatmate,
operationalised as interpersonal distance. Focus of attention, affect and immersion in the
virtual reality scenario were assessed.
Results: Overall, participants enjoyed and were immersed in the interactive virtual reality
environment. Interpersonal distance was predicted by severity of persecutory delusions and
negative affect. Exploratory graphic analyses showed no evidence of hypersensitivity to avatar
contingency or moderating effect of self-focus attention. Persecutory delusion severity was
associated with other-focus attention, which in turn, unexpectedly, predicted higher self-
focused attention.
Conclusions: Interactive virtual reality is a safe and feasibility research tool for individuals with
clinical paranoia. Severity of persecutory delusions, rather than environmental manipulation,
predicted trust. However, the lack of power in the current study prevents clear conclusions
about the impact of interpersonal contingency on trust in clinical paranoia from being drawn.
Replication is required with a larger sample and a more ambiguous scenario.
69
1. Introduction
1.1. Paranoia
Paranoid thinking is a phenomenon shown to occur in both general and clinical populations
(e.g. Freeman et al., 2005). Whilst previously perceived to be limited to delusional
presentations seen in psychiatric services, a growing body of literature supports the
conceptualisation of paranoia as a continuum (e.g. Chapman & Chapman, 1980; Claridge,
1997; van Os et al., 2009). In non-clinical populations, suspicious thoughts are found to be a
relatively common occurrence, particularly with regards to social evaluative concerns e.g.
fears of rejection (Freeman et al., 2005). In clinical populations, those presenting with
paranoid ideation are considered to be at the severe end of the spectrum, the most
extreme form being persecutory delusions. Persecutory delusions are strongly held beliefs
that harm is occurring, or will occur, to the individual and that harm is intended by the
persecutor (Freeman & Garety, 2000).
Persecutory delusions are one of the most common delusions (Cutting, 1997), strongly
associated with high levels of distress and admission to hospital (Castle et al., 1994). Given
the clinical relevance of researching paranoia, a number of psychological models
conceptualising paranoia have been put forward. The cognitive model of persecutory
delusions (Freeman, Garety, Kuipers, Fowler & Bebbington, 2002) proposes that a number
of key mechanisms contribute to the formation and maintenance of paranoid ideation
including negative beliefs about the self and others, self-esteem, jumping to conclusions
data gathering bias and safety behaviours which prevent disconfirmation of persecutory
beliefs. Attributional biases (Kaney & Bentall, 1989; Kinderman & Bentall, 1994) and Theory
of Mind (ToM) deficits (Corcoran & Frith, 1996) have also been long linked to paranoia. An
investigation using structural equation modelling revealed that paranoid delusions were
predicted by a wide range of hypothesised cognitive and emotional processes (Bentall et al,
2009). Since, in parallel with proposals for interpersonal conceptualisation of psychosis
70
(Berry, Barrowclough & Wearden, 2007; Bentall et al., 2014), growing evidence is building
for the role of social anxiety (e.g. Birchwood et al., 2007; Michail & Birchwood, 2009;
Michail & Birchwood, 2013; Rietdijk et al., 2009; Voges & Addington, 2005).
1.2. Social anxiety and paranoia
Epidemiological studies have found the rate of co-morbid social anxiety disorder in
individuals with schizophrenia to range between 13%-39% (Kendler et al., 1995b; Cosoff &
Hafner, 1998; Cassano et al., 1999; Bermanzohn et al., 2000). This is compared to a notably
lower 6.8% prevalence of social anxiety found in the general population (Kessler et al.,
2005b). A key feature of social anxiety is the expectation of embarrassment and negative
appraisals from others. Several studies have indicated that intense social anxiety can lead
to the anticipation of catastrophic loss of social status, resulting in the conviction that
others mean harm (Michail & Birchwood, 2009; Birchwood et al., 2007). As such, theories
have emerged to suggest that social anxiety may be an independent route to paranoia or it
may interact with other mechanistic pathways such as deficits in theory of mind (Lysaker et
al., 2010; Brüne, 2005). Whilst Lysaker et al. (2010) do not suggest that all cases of clinical
paranoia are a product of social anxiety, they propose that a subset of this clinical
population have significant levels of social anxiety which contributes to the occurrence of
their paranoid ideation.
1.3. Social anxiety, self-focused attention and interpersonal experiences
Defined as “an awareness of self-relevant, internally generated information”, self-focused
attention is proposed to play an important role in numerous pathological conditions
including social anxiety and schizophrenia (Ingram, 1990). The subject of self-focus can
include physiological information, thoughts, emotions, personal beliefs and attitudes and
has been shown to be exacerbated by physiological arousal and negative mood states
(Wegner & Giuliano, 1980; Hackman, Clark & McManus, 2000). Clark & Wells’ (1995) model
71
of social anxiety theorises that self-focused attention is a maintenance factor in the
condition as it increases access to negative thoughts and affect, interferes with
performance and prevents individuals from focusing on external information that might
disconfirm their beliefs driving the distress. Research has shown that high socially anxious
and socially phobic individuals, while in a social situation, display higher levels of self-
reported self-focused attention than participants scoring lower on these measures (Bögels
& Lamers, 2002, Bögels et al., 2002). Experimental studies have shown that greater self-
focused attention correlates with higher levels of state anxiety in social situations for both
clinical and non-clinical populations (Woody & Rodriguez, 2000; Woody, 1996). Self-
focused attention also influences an individual’s information processing in social
interactions as shown by the association between high social anxiety correlates, greater
self-focused attention and poorer memory for details of recent social interactions (Daly et
al, 1989; Hope, Heimberg & Klein, 1990; Kimble & Zehr, 1982). This suggests that self-
focused attention creates a deficit in the processing of external social information, resulting
in lower other-focused attention, and therefore individuals are less able to utilise objective
feedback in an interpersonal experience.
1.4. Interpersonal contingency
Interpersonal contingency is considered to be an important feature in the experience of
interpersonal encounters. The concept of interpersonal contingency is defined as the
general responsiveness to another person’s actions during an interaction, including
mimicry and synchrony. Its presence during an interaction is theorised to influence the
positive appraisal of others, including trust between individuals (Kendon, 1970) and
experience of empathy (Van Baaren, Decety, Dijksterhuis, van der Leij, & van Leeuwen,
2009). A virtual reality study has shown that the presence of mimicry positively influences
the evaluation of an avatar in participants from a non-clinical population (Bailenson & Yee,
2007). However, the same positive effects of mimicry have not been observed in socially
72
anxious individuals (Vrijsen et al., 2010), hypothesised to be influenced by self-focused
attention interrupting the processing of the avatar’s responsiveness. The role of
interpersonal contingency in persecutory delusions has not yet been investigated.
However, research has found that clinical populations with persecutory delusions have a
tendency to perceive intentional contingency between animate shapes with random
movement (Blakemore, Sarfati, Bazin & Decety, 2003), suggesting a bias in over-attributing
behavioural contingency.
1.5. Virtual reality research in paranoia
In more recent years, virtual reality (VR) has been used as a method to study the
phenomenon of paranoia (e.g. Freeman et al., 2003, 2008; Freeman et al., 2005; Freeman,
Pugh, Vorontsova, Antley & Slater, 2010; Fornells-Ambrojo, Barker, Swapp, Slater, Antley &
Freeman, 2008; Valmaggia et al., 2007). The benefit of using this technology is that it allows
for a controlled environment in which avatars are consistent and neutral, thus
interpersonal behaviour and appraisals can be better attributed to the individual’s own
biases in interpretation rather than the reality of someone’s character. Virtual reality
studies have shown that participants, including those from clinical populations,
demonstrate paranoid ideation in relation to avatars (Freeman et al., 2010). The same
study also showed that factors hypothesised to be related to paranoia, including affective
processes (anxiety, worry), interpersonal sensitivity and trauma history, were predictive of
paranoid ideation across the spectrum. A recently published study has shown that that
virtual reality can be used therapeutically with individuals with persecutory delusions to
test threat predictions in paranoia-inducing situations (e.g. public transport) with the
dropping of safety behaviours (Freeman et al., 2016). However, little research has been
conducted to investigate how individuals with paranoia experience interpersonal
interactions and the interpersonal processes associated with paranoid thinking is these VR
environments.
73
1.6. Paranoia, interpersonal contingency and interpersonal distance
A recent VR study investigated the influence of contingency on experiences of
interpersonal trust in individuals with high paranoia in a non-clinical population (Fornells-
Ambrojo et al., 2016). Participants were randomly allocated to high or low contingency
conditions in a brief, friendly interaction with an avatar programmed either to be highly
responsive or less responsive (high/low contingency). Higher paranoia was associated with
larger interpersonal distance kept from the avatar and was independent of actual avatar
responsiveness. This interpersonal distance was considered to be an avoidant safety
behaviour employed by those with high paranoia in order to protect against anticipated
threat, in accordance with safety behaviours being a key maintenance factor of paranoia
(Freeman et al., 2002). Similar safety behaviours of greater interpersonal distance have also
been observed in relation to avatars amongst socially anxious individuals (Rinck et al,
2010).
Unexpectedly, Fornells-Ambrojo et al. (2016) found that individuals with high levels
of paranoia (90th percentile) were the only group to show susceptibility to contingency
manipulation, experiencing the highly responsive avatar as more trustworthy than the low
contingency avatar. It was concluded that extreme paranoia may be associated with
hypersensitivity and preference for contingent behaviour in others which, in turn, could
explain experiences of mistrust in everyday social situations when others are not highly
responsive.
As yet, no research has been conducted to investigate the interpersonal processes
relevant to paranoia in a clinical population, principally in those with psychosis. Although
paranoia is hypothesised to exist on a continuum, a number of cognitive deficits have been
found to exist in clinical populations of psychosis compared to non-clinical populations e.g.
attentional deficits (Fioravanti et al., 2005; Neuchterlein et al., 1991) and deficits in theory
of mind (Brüne, 2005; Sprong et al., 2007). It is therefore important to investigate whether
74
the hypersensitivity to interpersonal contingency observed in Fornells-Ambrojo et al.
(2016) is also found in a psychosis population with clinical paranoia.
Virtual reality research in clinical populations predominantly uses paradigms that
are observational and non-verbal i.e. whilst avatars might be present in the scenarios, the
participant does not verbally communicate with them (e.g. Freeman et al., 2010; Freeman
et al., 2016). To date, no virtual reality study of clinical paranoia uses a scenario that
involves an interpersonal interaction with an avatar. Moreover, most studies using virtual
reality to investigate paranoia have used either ambiguous or anxiety-eliciting situations
(e.g. Fornells-Ambrojo et al., 2008; Freeman et al., 2010; Freeman et al., 2016; Valmaggia
et al., 2007), whereas the use of positive interactions would allow parallels to be drawn
between processes that occur in friendly social encounters in everyday life (e.g. brief chat
with a peer). Furthermore, considering evidence that individuals with persecutory
delusions experience paranoia towards their therapist, both within and between sessions
(Lawlor, Hall & Ellett, 2015), the current study stands to inform clinical interactions in
therapeutic contexts.
1.7. Study aims and hypotheses
1.7.1. Feasibility of interactive VR scenario:
As this study is the first of its kind to use an interpersonal interaction with an avatar to
investigate factors relevant to a clinically paranoid population, this study aims to evaluate
the feasibility of using interactive virtual reality with this population. In particular,
participants’ levels of distress, sense of presence and feedback about the VR scenario will
be evaluated.
1.7.2. Paranoia, contingency and trust:
The primary aim of this study is to investigate the impact of interpersonal contingency on
trust (subjective and objective) in a clinical population of individuals with paranoia.
75
Hypothesis 1: People with persecutory delusions are hypothesised to keep a safe
distance from the avatar regardless of his behaviour. Severity of paranoia will
predict objective trust (distance) as shown by Fornells-Ambrojo et al. (2016) but
not subjective trustworthiness.
Hypothesis 2: Whereas trusting behaviour is hypothesised to be unaffected by the
contingency manipulation, it is predicted that greater subjective trust will be
experienced by clinically paranoid individuals interacting with the high contingency
avatar compared to the low contingency avatar, replicating Fornells-Ambrojo et al.
(2016) with a sample of non-clinical highly paranoid individuals.
1.7.3. Self-focussed attention: a moderator of contingency sensitivity?
Hypothesis 3: However, it is predicted that self-focused attention will moderate the
impact of contingent behaviour on subjective trust. Participants with higher levels
of self-focused attention will not show susceptibility to the contingency
manipulation (whereas those with low levels of self- focussed attention will do as
stated in hypothesis 1). This will be due to their internal attentional focus impairing
their processing of the avatar’s behaviour.
1.7.4. Self-focussed attention: Additional hypotheses
In line with the reviewed literature, we hypothesise that higher self-focussed
attention will be associated with higher social anxiety.
Self-focus and other-focus attention will be negatively associated. Clark & Wells
(1995) propose that self-focused attention prevents the processing of external
social information therefore one would expect lower levels of other-focused
attention in those with high levels of self-focused attention.
76
2. Method
2.1. Design
The study was jointly conducted with another trainee clinical psychologist (HR) (see
Appendix 3). A mixed-method, quantitative and qualitative design was employed to
investigate all hypotheses. A group-comparison design with randomised assignment to two
conditions, high versus low contingency, was used. The independent variables of paranoia,
social anxiety and self-focused attention were treated as continuous. The dependent
variables of trust, measured both subjectively (self-rated) and objectively (behaviourally)
were also treated as continuous.
Feasibility of the methodology and participants’ views of the scenario were
assessed using qualitative data collected using a semi-structured interview and quantitative
measures of participants’ attention and sense of presence during the VR scenario.
2.1.1. Participants
Male participants1 aged 18 and above were recruited from four Early Intervention in
Psychosis services across three London NHS trusts. Inclusion criteria were a diagnosis of
psychosis, schizophrenia or schizoaffective disorder and currently experiencing paranoia.
Exclusion criteria were a history of epilepsy (due to associated potentially adverse effects
of virtual reality) or a current clinical presentation (e.g. thought disorder, acutely psychotic
state) that prevented them from being able to engage in the VR exercise and complete
primary measures. Individuals under section were also excluded.
2.1.2. Sample size and power analysis
The sample needed to evaluate the feasibility of virtual reality as a methodology for
researching paranoia and interpersonal sensitivity was deemed to be ten or more
1 An all-male sample was chosen in an attempt to minimise the impact of gender differences shown to exist in sense of presence in virtual reality (Felnhofer et al. 2012), and taking into account the VR interaction was with a male avatar.
77
participants. This sample size would also permit exploratory data analysis of emerging
trends in the quantitative data along with a thematic analysis of the qualitative interview.
Power analyses were conducted using G*Power3 (Faul, Erdfelder, Lang & Buchner,
2007). Using the data from Fornells-Ambrojo et al. (2016), a sample size of 26 per group
(high/low contingency) was calculated based on a large effect size (d = 0.8, α = 0.05, β =
0.80) to detect an effect of contingency condition on trust. No studies currently investigate
the effect of self-focused attention on trust or paranoia using the same methodology. As a
result, the sample size needed to detect a moderating effect of self-focussed attention was
unknown. It was felt that a sample size of 60 participants (30 per condition) would be
sufficient. The achieved sample fell considerably short of this. A total of 18 participants
completed the study and nine participants were randomly allocated to each condition. The
power of the current study for the detection of contingency sensitivity is 35.8% (β = 0.358).
2.1.3. Ethics
The study was giving favourable ethical opinion from Camberwell St Giles NRES Committee
(see Appendix 4) and R&D approval from all NHS trusts.
Prior to taking part, participants were fully informed about the study’s procedure
and their right to withdraw from participation. They were told that the rationale for
undertaking the research was to help develop therapeutic tools for mental health service
users. Written informed consent was obtained from all participants prior to taking part in
the study.
Due to the nature of the participants’ clinical presentation, the researchers
expected high levels of anxiety in some prospective participants around travelling to and
from the research location. Researchers accompanied participants to and from the location
where necessary. Further considerations were made to minimise the likelihood of
worsening paranoia or distress during the experiment. Recent VR research has found that
patients with paranoia can feel engaged in VR scenes and experience persecutory thought
78
without experiencing raised levels of distress, anxiety or simulator sickness (Fornells-
Ambrojo et al., 2008). The VR paradigm was designed to be a pleasant experience that is
non-intrusive and non-threatening. Participants were informed prior to taking part that
they could discontinue at any time. All participants were debriefed following completing
the experiment, including monitoring current distress or adverse experiences.
2.2. Procedure
2.2.1. Participant recruitment
Participants were referred by their Early Intervention in Psychosis teams following
presentations to the teams and further correspondence. Initial screening was conducted
during discussion with care co-ordinators at the point of referral. All potential participants
were approached by their care co-ordinators with the participant information sheet (see
Appendix 5). Care co-ordinators sought permission from interested service-users for the
researchers to contact them to arrange a further screening and verbal consent, either over
the phone or in person.
Participants were screened using the Green et al. Paranoid Thoughts Scale (GTPS;
Green et al., 2008) as a measure of current paranoia (see appendix 6). A cut-off score of 33
and above on part A (ideas of social reference) or part B (ideas of persecution) was used to
meet the paranoia inclusion criterion. As no current measure of paranoia has a validated
clinical cut-off score, the use of this screening criteria was based upon a current clinical trial
using this cut-off score on the GTPS to recruit a population with psychosis and paranoia
(Hardy, 2016).
Successfully screened participants were then invited to take part in the one-off
virtual reality experiment. To minimise the risk that an individual’s level of paranoia would
fluctuate below the threshold for participation in the study, the maximum time between
screening and testing was one week. There was one exception to this, however the
79
participant was re-screened immediately before participating in the study to confirm they
still met inclusion criteria.
In total, sixty-eight potential participants were referred by the EIS teams. Of these
referrals, forty-one were successfully approached by their care coordinators about the
study. Thirty service-users agreed to be contacted by the researchers. Of those contacted
by the researchers, the following reasons were given (largely before screening) for non-
participation: lack of interest in the study or a feeling that the study did not apply to them
(n = 5); inability to travel to the testing location (n = 3); lack of availability during the
opening hours of the testing facility (n = 2); inability to make contact following successful
screening and recruitment (n = 1). One participant expressed interest but fell below the
cut-off score for paranoia. Eighteen participants were recruited and completed the study.
2.2.2. Overview of experimental procedure
All participants were either escorted to or met at the Virtual Reality Lab with the
researchers. Written consent was obtained at the start (see Appendix 6). Participants were
informed that the study was investigating how people interact with virtual environments
and the impressions people have of the virtual reality avatar. It was explained to
participants that they would complete a series of questionnaires about themselves before
taking part in the virtual reality exercise. Participants then entered the virtual reality
environment and completed the exercise. Following this, participants completed a series of
measures and a semi-structured interview about their experience in the virtual reality
exercise. After a final debrief, participants were paid £12.50 and reimbursed for any travel
expenses. The experiment took approximately 90 minutes. See Table 1 for overview of
procedure including measures used by both researchers.

80
Table 1: Overview of experiment procedure
Pre-VR VR exercise Post-VR
Randomisation to high or low
contingency condition
Written Consent
Demographic details (age, ethnicity,
occupation, previous experience of flat
sharing)
GPTS*
PSYRATS-D*
SIAS*
UCLA Loneliness Scale
RG-UK
RQ
FESFS
CAPE-42
PS
Baseline PANAS questionnaire*
Instructions to VR exercise
Brief rehearsal of questions to ask
the avatar
Participant interviews virtual
flatmate (four questions)
Avatar moves towards the window
and invites participant to follow him
Distance between avatar and
participant recorded*
Completion of following
measures:
Post-VR PANAS*
FAQ*
1-item trustworthy scale*
TICR
Detection of contingency
check*
Attention check*
Sense of Presence
Questionnaire*
Semi-structured interview
about avatar and the VR
experience and debrief*
Note: * = measures used by the author; CAPE = Community Assessment of Psychic Experiences-42 (Konings, Bak, Hanssen, Van Os,
& Krabbendam, 2006); FAQ = Focus of Attention Questionnaire (Woody, 1996); TICR = Trust in Close Relationships Scale (Rempel,
Holmes & Zanna, 1985); FESFS = First Episode Social Functioning Scale (Lecomte et al., 2014); GPTS = Green et al. Paranoid Thoughts
Scale (Green, Freeman, Kuipers, Bebbington, Fowler, Dunn & Garety, 2008); PANAS = Positive and Negative Affect Schedule
(Watson, Clark & Tellegen, 1988); PSYRATS-D = Psychotic Symptoms Rating Scale - Delusions (Haddock, McCarron, Tarrier &
Faragher, 1999); PS = Paranoia Scale (Fenigstein & Vanable, 1992); RG-UK = Resource Generator UK (Webber & Huxley, 2007); RQ
= Relationship Questionnaire (Bartholomew & Horowitz, 1991); SIAS = Social Interaction Anxiety Scale (Mattick & Clarke, 1998);
Sense of Presence Questionnaire (Slater, Steed, McCarthy & Maringelli, 1998); SOS = Significant Others Scale (Power, Champion, &
Aris, 1988);; UCLA Loneliness Scale (Russell, 1996).
2.2.3. Virtual reality exercise
Before entering the virtual reality environment, participants were informed that they
would be entering a virtual flat that was available to rent, in which they would meet a
virtual flatmate called Mark. Participants were given a set of four printed questions with
which to interview Mark to find out more about the flat. Participants were instructed to ask
the avatar the scripted questions in order (e.g. ‘What makes a good flatmate?’) and that
81
they should ask the first question when the avatar told them he was ‘ready’. Participants
were given time to read the questions and remember them as best as they could and were
also provided with a prompt sheet to take into the virtual reality environment (see
Appendix 8). To increase the spontaneity of the interaction, participants were told that the
avatar would introduce himself and may ask their name. Participants were told that they
could move around the virtual flat as much as they wanted during the exercise but that the
main aim was to find out how the virtual character comes across and ask to try to pay as
much attention as possible to what Mark told them. They were further informed that the
avatar would indicate to them when the interview was over.
On entering the virtual reality environment, participants were instructed about the
stereo glasses and allowed to look around the virtual flat to acclimatise to the
environment. When participants were ready and confirmed they could see in 3D they were
instructed to stand on a designated spot so that all participants began the exercise in-line
with the avatar and at approximately the same distance (200cm). Participants were
instructed they should move as naturally as possible once the scenario started, as they
would in a normal interaction. The researchers then drew a curtain, informing participants
they would stay on the other side for the duration of the exercise, and on a final signal
from participants that they were ready, the scenario was started. The scenario lasted
approximately two and a half minutes. On exiting the virtual reality scenario, researchers
verbally checked whether the participant was experiencing any ill-effects.
2.2.3.1. Virtual reality apparatus
The visuals of the VR exercise were displayed in an immersive projection system. High-
resolution images were projected in real-time onto three back-projected wall screens (3m x
2.2m) and a floor screen (3m x 3m). A stereo presentation of the virtual world was
delivered using Lightweight CrystalEyes shutter-glasses worn by participants. These glasses
present separate images to the left and right eyes, producing the illusions of 3D objects
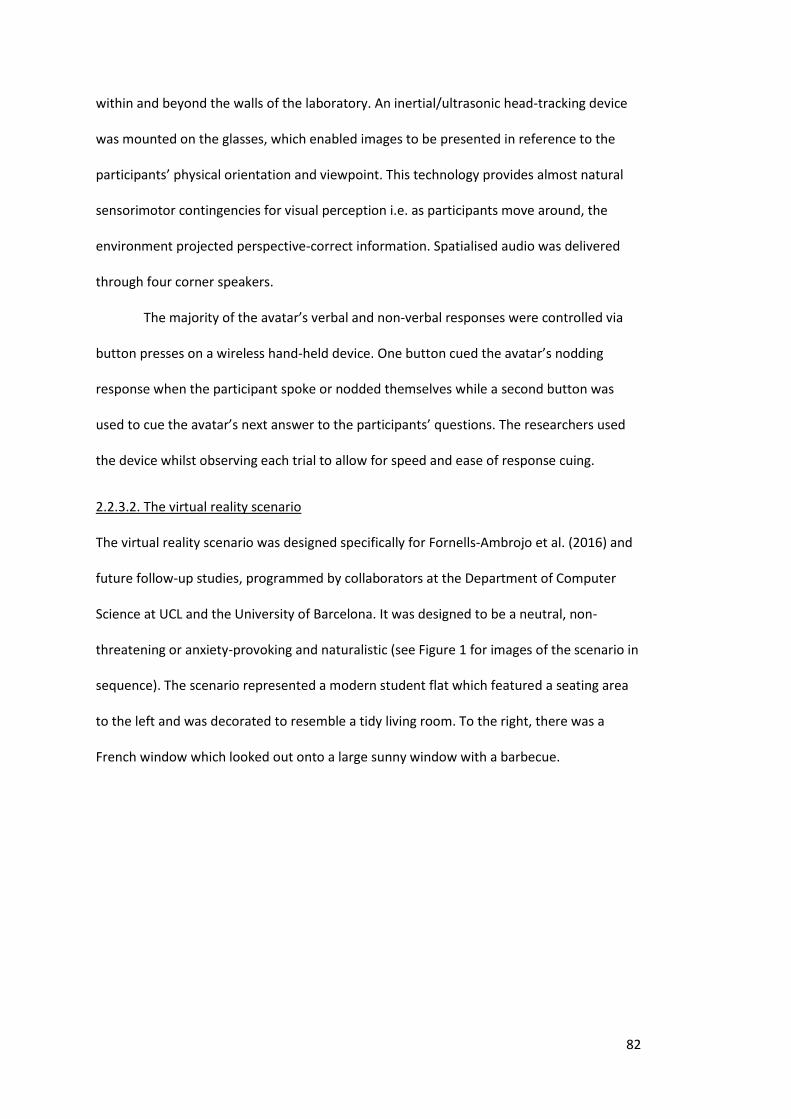
82
within and beyond the walls of the laboratory. An inertial/ultrasonic head-tracking device
was mounted on the glasses, which enabled images to be presented in reference to the
participants’ physical orientation and viewpoint. This technology provides almost natural
sensorimotor contingencies for visual perception i.e. as participants move around, the
environment projected perspective-correct information. Spatialised audio was delivered
through four corner speakers.
The majority of the avatar’s verbal and non-verbal responses were controlled via
button presses on a wireless hand-held device. One button cued the avatar’s nodding
response when the participant spoke or nodded themselves while a second button was
used to cue the avatar’s next answer to the participants’ questions. The researchers used
the device whilst observing each trial to allow for speed and ease of response cuing.
2.2.3.2. The virtual reality scenario
The virtual reality scenario was designed specifically for Fornells-Ambrojo et al. (2016) and
future follow-up studies, programmed by collaborators at the Department of Computer
Science at UCL and the University of Barcelona. It was designed to be a neutral, non-
threatening or anxiety-provoking and naturalistic (see Figure 1 for images of the scenario in
sequence). The scenario represented a modern student flat which featured a seating area
to the left and was decorated to resemble a tidy living room. To the right, there was a
French window which looked out onto a large sunny window with a barbecue.
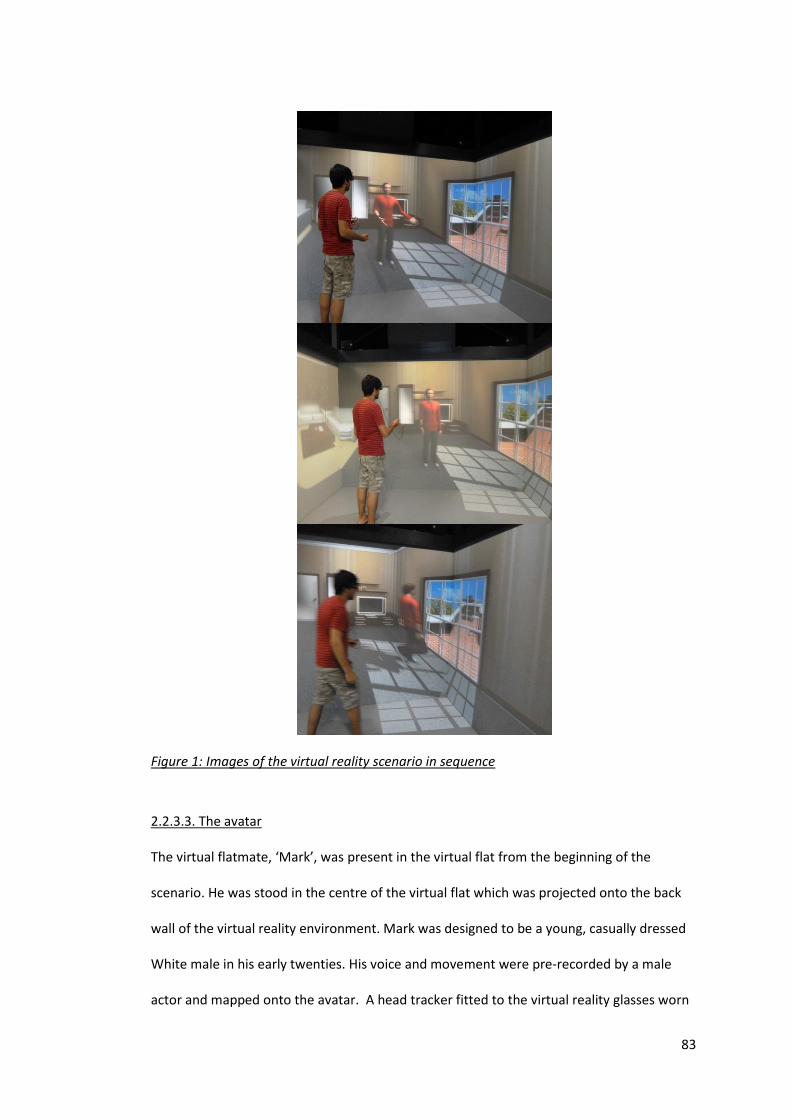
83
Figure 1: Images of the virtual reality scenario in sequence
2.2.3.3. The avatar
The virtual flatmate, ‘Mark’, was present in the virtual flat from the beginning of the
scenario. He was stood in the centre of the virtual flat which was projected onto the back
wall of the virtual reality environment. Mark was designed to be a young, casually dressed
White male in his early twenties. His voice and movement were pre-recorded by a male
actor and mapped onto the avatar. A head tracker fitted to the virtual reality glasses worn
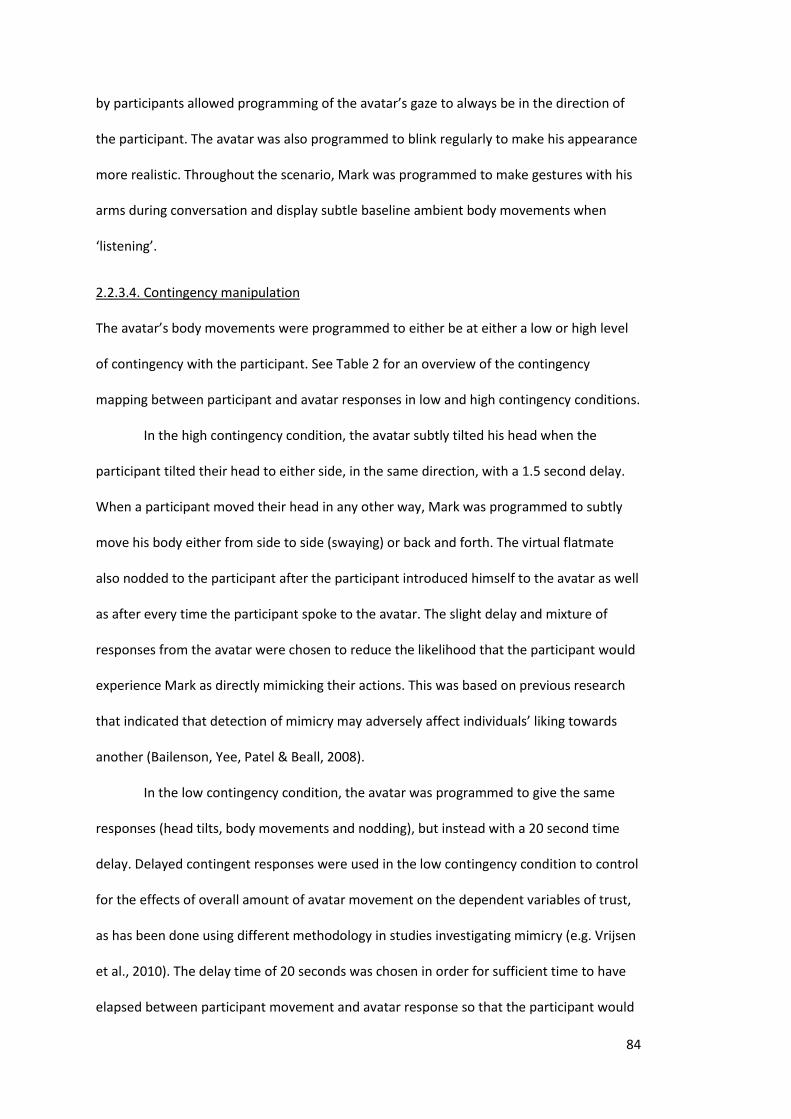
84
by participants allowed programming of the avatar’s gaze to always be in the direction of
the participant. The avatar was also programmed to blink regularly to make his appearance
more realistic. Throughout the scenario, Mark was programmed to make gestures with his
arms during conversation and display subtle baseline ambient body movements when
‘listening’.
2.2.3.4. Contingency manipulation
The avatar’s body movements were programmed to either be at either a low or high level
of contingency with the participant. See Table 2 for an overview of the contingency
mapping between participant and avatar responses in low and high contingency conditions.
In the high contingency condition, the avatar subtly tilted his head when the
participant tilted their head to either side, in the same direction, with a 1.5 second delay.
When a participant moved their head in any other way, Mark was programmed to subtly
move his body either from side to side (swaying) or back and forth. The virtual flatmate
also nodded to the participant after the participant introduced himself to the avatar as well
as after every time the participant spoke to the avatar. The slight delay and mixture of
responses from the avatar were chosen to reduce the likelihood that the participant would
experience Mark as directly mimicking their actions. This was based on previous research
that indicated that detection of mimicry may adversely affect individuals’ liking towards
another (Bailenson, Yee, Patel & Beall, 2008).
In the low contingency condition, the avatar was programmed to give the same
responses (head tilts, body movements and nodding), but instead with a 20 second time
delay. Delayed contingent responses were used in the low contingency condition to control
for the effects of overall amount of avatar movement on the dependent variables of trust,
as has been done using different methodology in studies investigating mimicry (e.g. Vrijsen
et al., 2010). The delay time of 20 seconds was chosen in order for sufficient time to have
elapsed between participant movement and avatar response so that the participant would
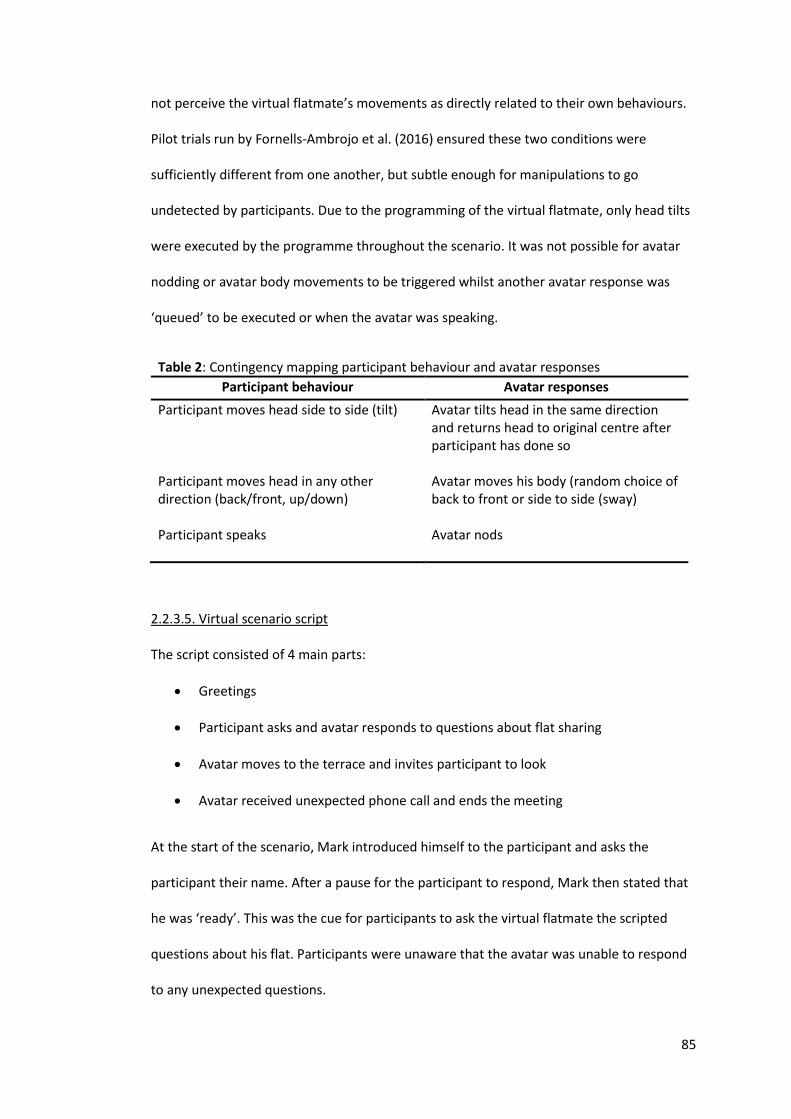
85
not perceive the virtual flatmate’s movements as directly related to their own behaviours.
Pilot trials run by Fornells-Ambrojo et al. (2016) ensured these two conditions were
sufficiently different from one another, but subtle enough for manipulations to go
undetected by participants. Due to the programming of the virtual flatmate, only head tilts
were executed by the programme throughout the scenario. It was not possible for avatar
nodding or avatar body movements to be triggered whilst another avatar response was
‘queued’ to be executed or when the avatar was speaking.
Table 2: Contingency mapping participant behaviour and avatar responses
Participant behaviour Avatar responses
Participant moves head side to side (tilt) Participant moves head in any other direction (back/front, up/down) Participant speaks
Avatar tilts head in the same direction and returns head to original centre after participant has done so Avatar moves his body (random choice of back to front or side to side (sway) Avatar nods
2.2.3.5. Virtual scenario script
The script consisted of 4 main parts:
Greetings
Participant asks and avatar responds to questions about flat sharing
Avatar moves to the terrace and invites participant to look
Avatar received unexpected phone call and ends the meeting
At the start of the scenario, Mark introduced himself to the participant and asks the
participant their name. After a pause for the participant to respond, Mark then stated that
he was ‘ready’. This was the cue for participants to ask the virtual flatmate the scripted
questions about his flat. Participants were unaware that the avatar was unable to respond
to any unexpected questions.
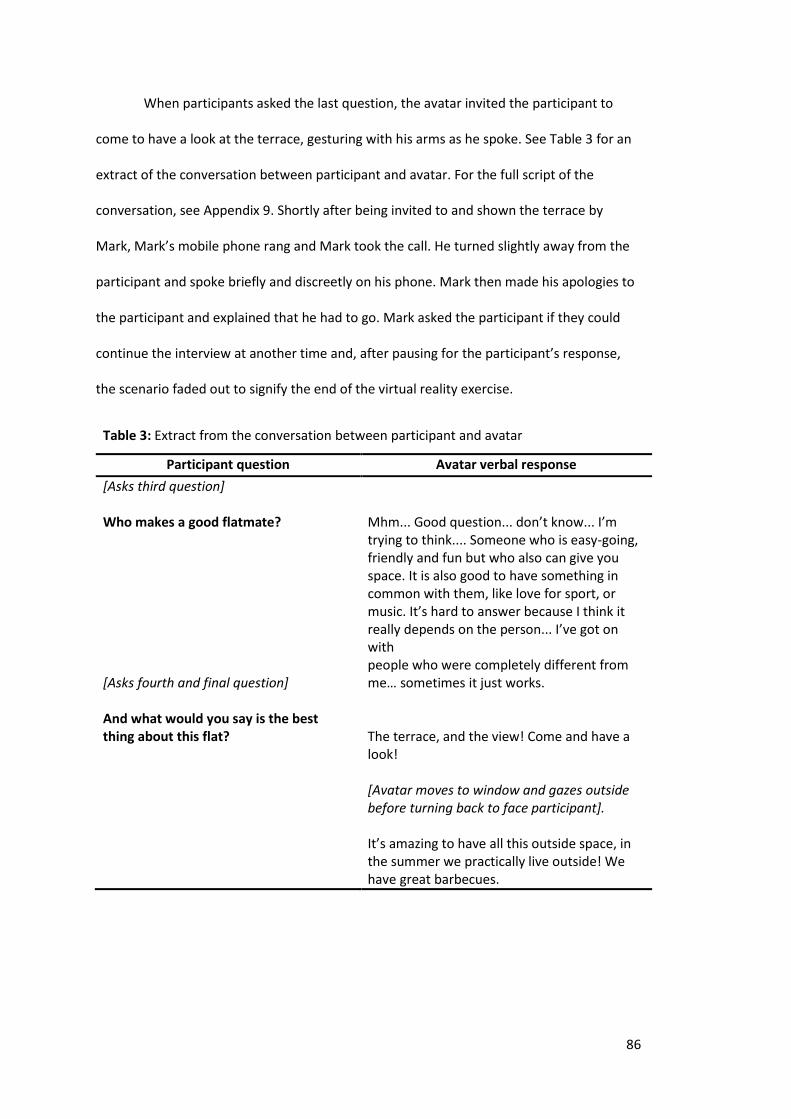
86
When participants asked the last question, the avatar invited the participant to
come to have a look at the terrace, gesturing with his arms as he spoke. See Table 3 for an
extract of the conversation between participant and avatar. For the full script of the
conversation, see Appendix 9. Shortly after being invited to and shown the terrace by
Mark, Mark’s mobile phone rang and Mark took the call. He turned slightly away from the
participant and spoke briefly and discreetly on his phone. Mark then made his apologies to
the participant and explained that he had to go. Mark asked the participant if they could
continue the interview at another time and, after pausing for the participant’s response,
the scenario faded out to signify the end of the virtual reality exercise.
Table 3: Extract from the conversation between participant and avatar
Participant question Avatar verbal response
[Asks third question] Who makes a good flatmate? [Asks fourth and final question] And what would you say is the best thing about this flat?
Mhm... Good question... don’t know... I’m trying to think.... Someone who is easy-going, friendly and fun but who also can give you space. It is also good to have something in common with them, like love for sport, or music. It’s hard to answer because I think it really depends on the person... I’ve got on with people who were completely different from me… sometimes it just works. The terrace, and the view! Come and have a look! [Avatar moves to window and gazes outside before turning back to face participant]. It’s amazing to have all this outside space, in the summer we practically live outside! We have great barbecues.
87
2.2.4. Measures
2.2.4.1. Pre-VR measures
Before entering the virtual reality environment, participants were asked to complete a
number of baseline measures. These measures were as follows:
Paranoia: The Green et al. Paranoia Thoughts Scale (GPTS; Green et al., 2008) was used
both as a screening tool and an experimental measure of paranoia. The GPTS consists of
two scales of 16-items: Part A assesses endorsement of ideas of social reference (e.g.
People have definitely laughed at me behind my back) and Part B assesses ideas of
persecution (e.g. I was convinced there was a conspiracy against me). Items are rated from
1 = not at all, 3 = somewhat, 5 = extremely, to the extent to which participants have
experiences these feelings over the past month. Scores on each subscale can range from 16
to 80, with higher scores indicating a greater degree of paranoid thinking. The internal
consistency of the GPTS is good, with a Cronbach’s α = .90 in the original clinical sample,
and the test is considered valid and sensitive to change (Green et al., 2008).
Severity of persecutory delusion: The Psychotic Symptoms Rating Scale – Delusions
(PSYRATS-D; Haddock et al., 1999) was used as a measure of persecutory delusions severity
(see Appendix 10). Delusions are assessed by 6 items measuring preoccupation, duration,
conviction, distress, intensity of distress and disruption. The items are clinician-rated in a
structured interview. The total score ranges from 0 to 24, with higher scores indicating a
greater delusional experience. The scale has good internal consistency (α = .90) (Haddock
et al., 1999) and has been shown to have validity when used in first-episode psychosis
(Drake et al., 2007).
88
Social anxiety: Trait levels of social anxiety were measured using the Social Interaction
Anxiety Scale (SIAS; Mattick & Clarke, 1998) (see Appendix 11). The SIAS is a 20-item self-
report scale assessing anxiety in interpersonal encounters (e.g. I feel I’ll say something
embarrassing when talking). Items are rated on a 5-point Likert scale of how characteristic
each item is for the person (from 0 = ‘Not at all’ to 4 = ‘Extremely’). The total score ranges
from 0 to 60, with a higher score indicating greater experiences of social anxiety. It is
widely used in social phobia literature and has received extensive validation (Peters, 2000).
The SIAS uses a cut-off score of 34 to indicate the presence of social anxiety. It has been
shown to discriminate between social anxiety and other anxiety disorders and community
samples, with a sensitivity of 0.93 and a specificity of 0.66 (Peters, 2000). The measure also
has good internal consistency (α = .94) (Mattick & Clarke, 1998).
State affect: To measure change in positive and negative affect during the virtual reality
exercise, the Positive and Negative Affect Schedule (PANAS; Watson, Clark & Tellegen,
1988) was completed by participants immediately prior to entering the VR environment
and immediate after completing the exercise. The PANAS is a 20-item self-report
questionnaire that assesses positive and negative affect on two independent subscales.
Participants were asked to rate the extent to which each word applies to how they feel
‘right at this present moment’ (e.g. ‘scared’, ‘enthusiastic’) on a 5-point Likert scale (from 1
= ‘Very slightly or not at all’ to 5 = ‘Extremely’). The PANAS has good reliability and validity
(Crawford & Henry, 2004).
2.2.4.2. Virtual reality measure
Distance kept from avatar: The distance participants kept from the avatar was
automatically recorded (in metres) throughout the participants’ time in the virtual
environment. For each animation frame, the 3D positions of both the avatar’s head and the
89
participant’s head were recorded. The distance was calculated using the horizontal
Pythagorean distance so that difference in height between participant and avatar were
ignored. Minimum or shortest distance kept by the participant from the avatar during the
scene when they are invited by Mark to view the terrace was used as an objective
behavioural measure of trust. Minimum distance rather than average distance was chosen
as this is a traditional measure used by proximity (interpersonal space) researchers
(Hayduk, 1983) and is commonly used in virtual reality proxemics research in this way (e.g.
Bailenson et al., 2001; Bailenson et al., 2003; Burgoon, Buller, Dillman & Walther, 1995).
2.2.4.3. Post-VR measures
Subjective Trust: As used by Fornells-Ambrojo et al. (2016), participants’ feelings of trust
towards the avatar were assessed with a Likert-scale item. Participants were asked to rate
how trustworthy they felt Mark the avatar seemed (‘How trustworthy did Mark come
across?’) on a 7-point scale (from 1 = ‘Not at al’ to 7 = ‘Very much’) (see Appendix 12).
Focus of Attention: In order to measure the extent of participants’ self-focused attention
and other-focused attention, the Focus of Attention Questionnaire (FAQ; Woody, 1996) was
used (see Appendix 13). The FAQ has two 5-item subscales: self-focused attention (FAQself)
e.g. ‘I was focusing on what I would say or do next’ and other-focused attention (FAQother)
e.g. ‘I was focusing on the other person’s appearance or dress’. Each item is rated on a 5-
point scale (from 1 = ‘Not at all’ to 5 = ‘Very much’). For each subscale, the average item
score is taken as a measure of self- and other-focused attention, with a higher mean score
indicating a greater level of attentional focus. Research suggests that the two scales are
independent and they display distinct patterns of correlations (Woody, Chambless & Glass,
1997). High internal consistency has been reported for the scale (Woody et al., 1997).
90
Scenario feedback and checks: In order to ascertain whether participants had consciously
perceived the contingency of the avatar’s body movements (head tilts and nods),
participants were asked whether they had noticed any relationship between what they did
and what Mark the avatar did (detection of avatar contingency) (see Appendix 14).
Participants who responded ‘yes’ to this question were asked to give details of what they
noticed. To assess whether participants were directing sufficient attention to the virtual
flatmate during the scenario, participants were asked two ‘true or false’ questions about
what the virtual flatmate had told them during their conversation about flat-sharing (e.g.
‘One reason that Mark the virtual flatmate gave for why he likes flat sharing is that he has
made new friends’).
Sense of presence: The Sense of Presence Questionnaire (Slater, Steed, McCarthy &
Maringelli, 1998, Appendix 15) assessed the extent to which participants felt present in the
virtual world, as opposed to their physical location (e.g. ‘During the experience, which was
strongest on the whole, your sense of being in the virtual flat, or being in the real world of
the laboratory’). Participants rated each item on a 7-point Likert scale with a higher score
indicating a greater sense of presence in the virtual flat.
Qualitative feedback: In order to elicit richer information about participant’s experience in
the virtual reality environment, a brief, semi-structured qualitative interview was
administered at the end of the experiment. The interview invited participants to share their
thoughts about the virtual flatmate and the virtual environment in general. The interview
was conducted by one of the researchers while the other researcher wrote down the
participant’s answers verbatim. See Appendix 16 for the full interview structure.
2.3. Planned Data Analysis
All quantitative data analyses were conducted using SPSS (Version 21).
91
2.3.1. Feasibility of interactive VR scenario
Affect change: To assess the impact of the virtual reality scenario on participants’ affect
states, differences between baseline and post-VR positive and negative affect scores as
measured by the PANAS were assessed. To assess if the virtual reality experience was a
predominantly positive experience, differences in mean positive and negative affect scores
were compared pre-VR and post-VR with related-sample t-tests. The post-VR comparison
used a non-parametric Wilcoxon signed rank test as assumptions of normality could not be
assumed for the post-VR negative PANAS variable. To assess whether there was a
significant change in positive or negative affect during the virtual reality scenario, related-
sample t-tests compared pre- and post-VR PANAS scores for positive affect (parametric
test) and negative affect (non-parametric test).
Detection of contingency manipulation: A non-parametric equivalent of chi-squared
(Fisher’s exact test) was used to identify whether group differences in perception of
contingency were observed.
Participant feedback: Participants’ responses about their overall experience in the virtual
reality exercise were analysed to evaluate the feasibility of the methodology in a clinically
paranoid population. Responses were predominantly from the final question ‘What did you
think of the VR environment? Do you have any feedback on the VR experience?’ but all
responses were assessed.
A generic thematic analysis approach (Braun & Clarke, 2006; 2016) was used to
analyse responses. Four distinct categories arose as a coding framework from
familiarisation with the data relevant to the broader concept of interactive virtual reality
feasibility: safety, enjoyment, immersion in the environment and engagement in the avatar
interaction. Themes were then searched for by the researcher within the coding framework
and reviewed in the context of the full data set. The qualitative ‘essence’ of each theme
92
was reported with data extracts. Participant responses were then triangulated with
relevant quantitative measures to assess whether verbal responses were concordant with
responses given on self-report measures.
2.3.2. Paranoia, contingency and trust
Associations between the two measures of severity of paranoid ideation and objective trust
(distance) were to be analysed using non-parametric correlation analysis (Spearman’s rho).
The originally planned data analysis for subjective trust analyses was based on the
study reaching sufficient power (β = .80) based on a sample size of n = 26 in each
contingency group. In this instance, participants’ sensitivity to contingency manipulation
was to be analysed (if normality assumptions were met) with two independent t-tests
assessing the difference in trust measures (subjective and objective) between high and low
contingency groups. Regression analysis was planned to analyse the moderating effects of
self-focused attention on subjective trust towards the avatar and susceptibility to
contingency. However, the study did not obtain a sample size large enough to adequately
evaluate the effects of interpersonal contingency and self-focus attention on trust toward
the avatar with statistics alone (β = .067; n = 9 per condition).
Exploratory Data Analysis (EDA; Tukey, 1977) was also used to systematically
explore the data and assess hypotheses. This method of analysis emphasises displaying the
data graphically and its use in research in clinical psychology is well supported (Barker,
Pistrang & Elliott, 2016). The distribution and normality of all variables were explored using
univariate non-graphical EDA (e.g. inspection of mean, range and skewedness) and
univariate graphical EDA (e.g. histograms and box and whisker plots). Comparisons of trust
between contingency conditions were explored using side-by-side boxplots.
Correlates of trust measures were also explored using Pearson’s correlation
coefficient where assumptions of normality could be assumed and non-parametric
93
equivalent correlational analyses where assumptions of normality were not met by
variables.
2.3.3. Self-focused attention: moderation of contingency sensitivity and additional analysis
The moderator of focus of attention was investigated using graphical EDA, namely
multivariate scatterplots with R2 values calculated (i.e. the proportion of the variation in one
variable explained by another variable) to assess the strength of the relationship.
Correlation analyses were used to assess whether self-focused attention was
associated with either social anxiety or other-focused attention. Non-parametric equivalent
correlational analyses (Spearman’s rank correlation coefficient) were used where
assumptions of normality were not met by variables.
2.4. Data screening
2.4.1. Missing data
All primary measures were completed fully by participants with the exception of one
participant who did not complete the PSYRATS-D due to his emerging distress during the
completion of the GPTS relevant to discussing his paranoid experiences. One participant
gave a double response on the PANAS. To correct for the double scored items, the more
conservative of the double score was chosen. One participant did not complete the
qualitative interview due to time constraints and participant fatigue.
2.4.2. Normality of distributions
All data was screened for normality and outliers. Inspection of histograms, distributions of
variances, significance levels on the Kolmogorov-Smirnov test and values of skewedness
and kurtosis indicated that most measures were found to be normally distributed. No clear
outliers were detected in any measure.
Kolmogorov-Smirnov tests of normality were found to be significant for the FAQself
(p = .001), measure of objective trust (p = .036) and the post-VR negative affect PANAS (p =
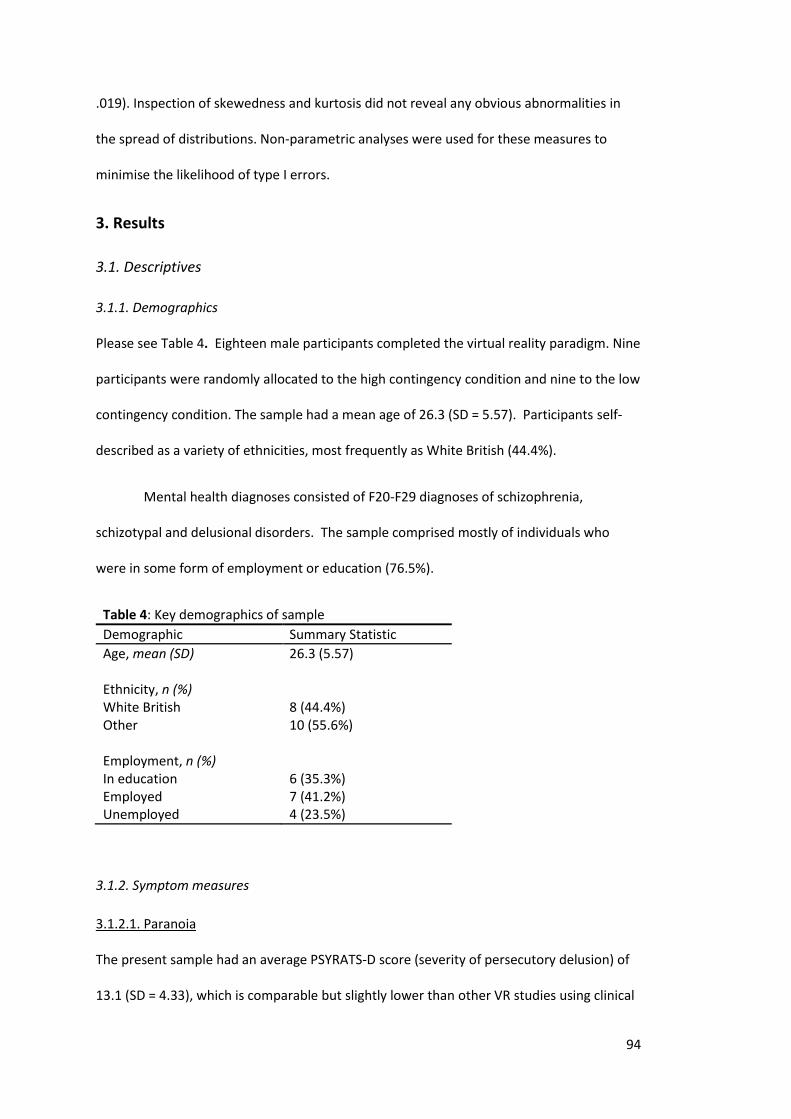
94
.019). Inspection of skewedness and kurtosis did not reveal any obvious abnormalities in
the spread of distributions. Non-parametric analyses were used for these measures to
minimise the likelihood of type I errors.
3. Results
3.1. Descriptives
3.1.1. Demographics
Please see Table 4. Eighteen male participants completed the virtual reality paradigm. Nine
participants were randomly allocated to the high contingency condition and nine to the low
contingency condition. The sample had a mean age of 26.3 (SD = 5.57). Participants self-
described as a variety of ethnicities, most frequently as White British (44.4%).
Mental health diagnoses consisted of F20-F29 diagnoses of schizophrenia,
schizotypal and delusional disorders. The sample comprised mostly of individuals who
were in some form of employment or education (76.5%).
Table 4: Key demographics of sample
Demographic Summary Statistic
Age, mean (SD) 26.3 (5.57) Ethnicity, n (%) White British 8 (44.4%) Other 10 (55.6%) Employment, n (%) In education 6 (35.3%) Employed 7 (41.2%) Unemployed 4 (23.5%)
3.1.2. Symptom measures
3.1.2.1. Paranoia
The present sample had an average PSYRATS-D score (severity of persecutory delusion) of
13.1 (SD = 4.33), which is comparable but slightly lower than other VR studies using clinical
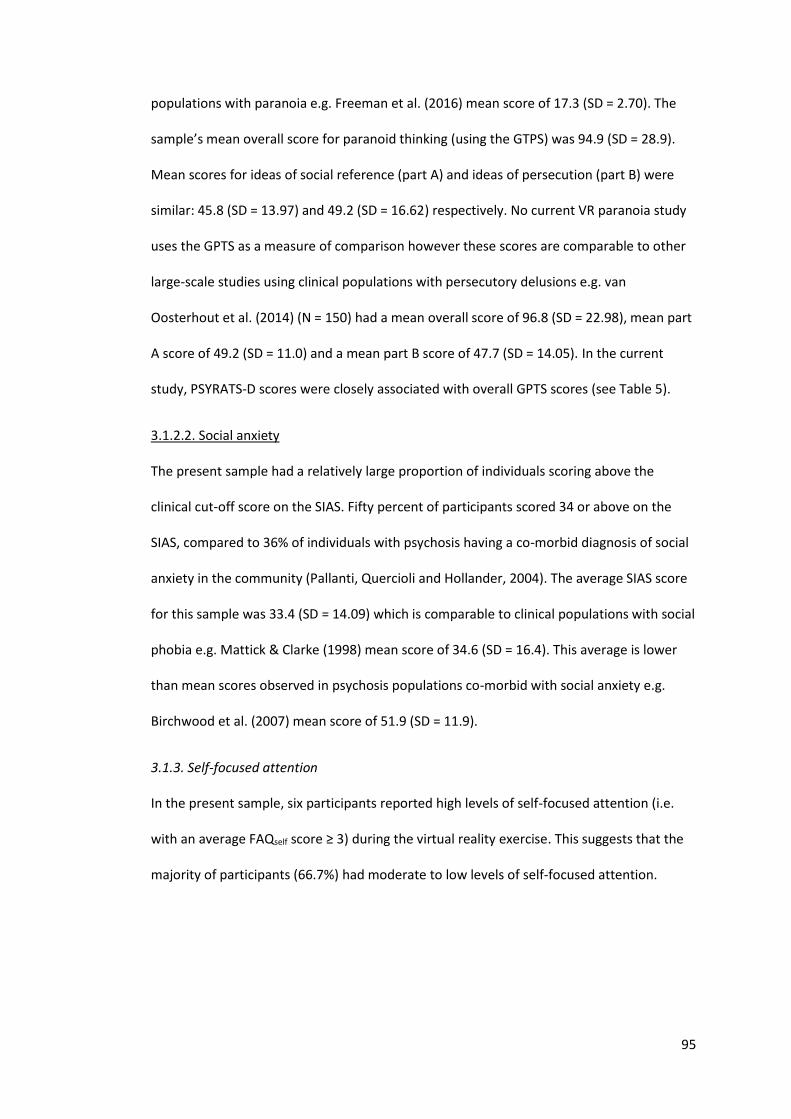
95
populations with paranoia e.g. Freeman et al. (2016) mean score of 17.3 (SD = 2.70). The
sample’s mean overall score for paranoid thinking (using the GTPS) was 94.9 (SD = 28.9).
Mean scores for ideas of social reference (part A) and ideas of persecution (part B) were
similar: 45.8 (SD = 13.97) and 49.2 (SD = 16.62) respectively. No current VR paranoia study
uses the GPTS as a measure of comparison however these scores are comparable to other
large-scale studies using clinical populations with persecutory delusions e.g. van
Oosterhout et al. (2014) (N = 150) had a mean overall score of 96.8 (SD = 22.98), mean part
A score of 49.2 (SD = 11.0) and a mean part B score of 47.7 (SD = 14.05). In the current
study, PSYRATS-D scores were closely associated with overall GPTS scores (see Table 5).
3.1.2.2. Social anxiety
The present sample had a relatively large proportion of individuals scoring above the
clinical cut-off score on the SIAS. Fifty percent of participants scored 34 or above on the
SIAS, compared to 36% of individuals with psychosis having a co-morbid diagnosis of social
anxiety in the community (Pallanti, Quercioli and Hollander, 2004). The average SIAS score
for this sample was 33.4 (SD = 14.09) which is comparable to clinical populations with social
phobia e.g. Mattick & Clarke (1998) mean score of 34.6 (SD = 16.4). This average is lower
than mean scores observed in psychosis populations co-morbid with social anxiety e.g.
Birchwood et al. (2007) mean score of 51.9 (SD = 11.9).
3.1.3. Self-focused attention
In the present sample, six participants reported high levels of self-focused attention (i.e.
with an average FAQself score ≥ 3) during the virtual reality exercise. This suggests that the
majority of participants (66.7%) had moderate to low levels of self-focused attention.
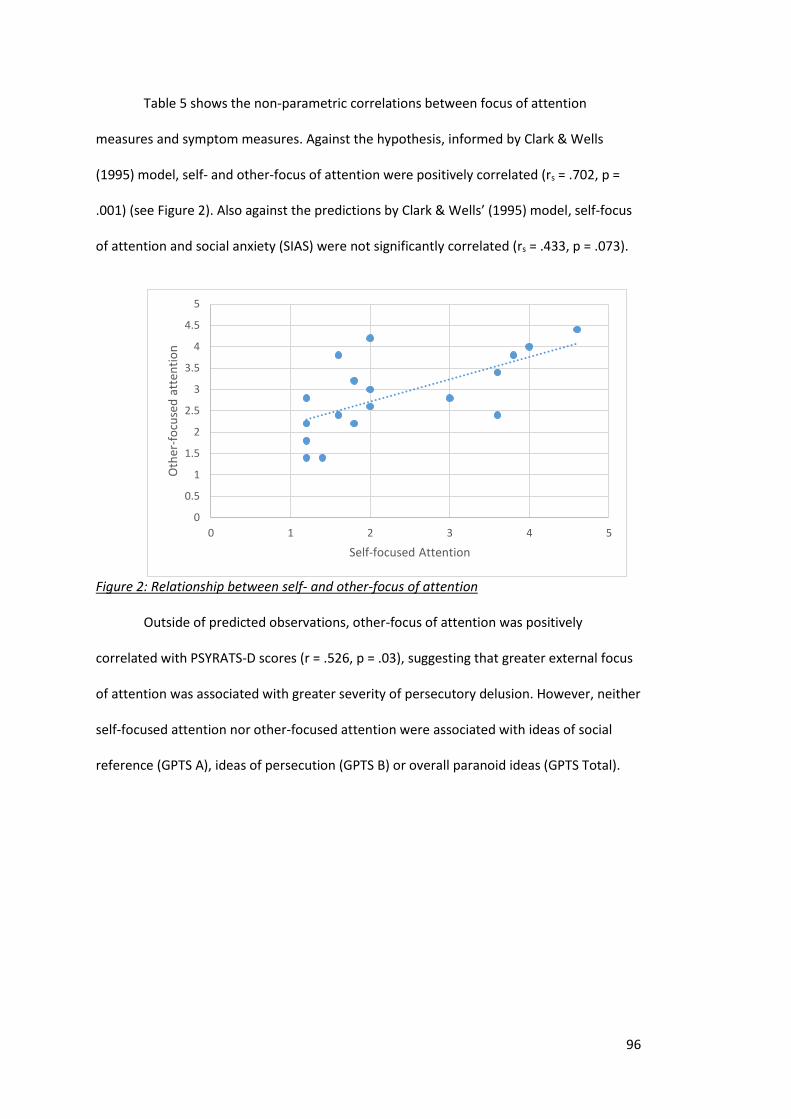
96
Table 5 shows the non-parametric correlations between focus of attention
measures and symptom measures. Against the hypothesis, informed by Clark & Wells
(1995) model, self- and other-focus of attention were positively correlated (rs = .702, p =
.001) (see Figure 2). Also against the predictions by Clark & Wells’ (1995) model, self-focus
of attention and social anxiety (SIAS) were not significantly correlated (rs = .433, p = .073).
Figure 2: Relationship between self- and other-focus of attention
Outside of predicted observations, other-focus of attention was positively
correlated with PSYRATS-D scores (r = .526, p = .03), suggesting that greater external focus
of attention was associated with greater severity of persecutory delusion. However, neither
self-focused attention nor other-focused attention were associated with ideas of social
reference (GPTS A), ideas of persecution (GPTS B) or overall paranoid ideas (GPTS Total).
0
0.5
1
1.5
2
2.5
3
3.5
4
4.5
5
0 1 2 3 4 5
Oth
er-f
ocu
sed
att
enti
on
Self-focused Attention
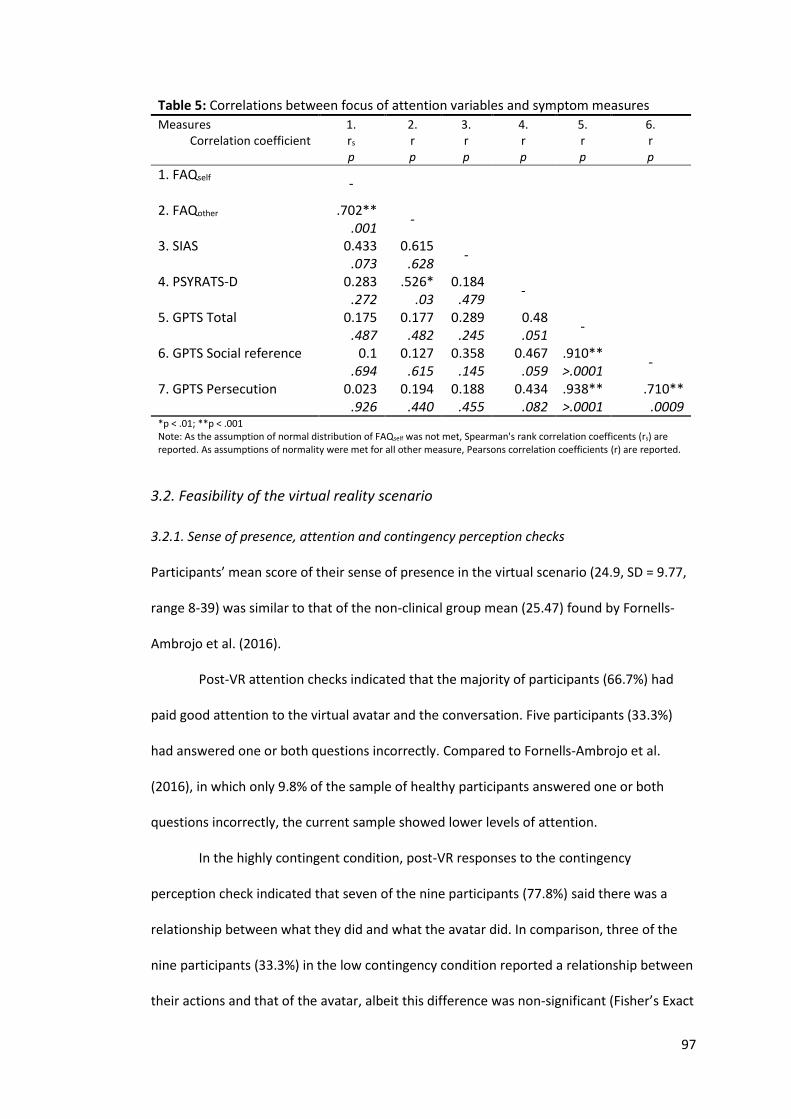
97
Table 5: Correlations between focus of attention variables and symptom measures
Measures Correlation coefficient
1. rs p
2. r p
3. r p
4. r p
5. r p
6. r p
1. FAQself
-
2. FAQother .702** .001
-
3. SIAS
0.433 .073
0.615 .628
-
4. PSYRATS-D 0.283 .272
.526* .03
0.184 .479
-
5. GPTS Total
0.175 .487
0.177 .482
0.289 .245
0.48 .051
-
6. GPTS Social reference
0.1 .694
0.127 .615
0.358 .145
0.467 .059
.910** >.0001
-
7. GPTS Persecution 0.023 .926
0.194 .440
0.188 .455
0.434 .082
.938** >.0001
.710** .0009
*p < .01; **p < .001 Note: As the assumption of normal distribution of FAQself was not met, Spearman's rank correlation coefficents (rs) are reported. As assumptions of normality were met for all other measure, Pearsons correlation coefficients (r) are reported.
3.2. Feasibility of the virtual reality scenario
3.2.1. Sense of presence, attention and contingency perception checks
Participants’ mean score of their sense of presence in the virtual scenario (24.9, SD = 9.77,
range 8-39) was similar to that of the non-clinical group mean (25.47) found by Fornells-
Ambrojo et al. (2016).
Post-VR attention checks indicated that the majority of participants (66.7%) had
paid good attention to the virtual avatar and the conversation. Five participants (33.3%)
had answered one or both questions incorrectly. Compared to Fornells-Ambrojo et al.
(2016), in which only 9.8% of the sample of healthy participants answered one or both
questions incorrectly, the current sample showed lower levels of attention.
In the highly contingent condition, post-VR responses to the contingency
perception check indicated that seven of the nine participants (77.8%) said there was a
relationship between what they did and what the avatar did. In comparison, three of the
nine participants (33.3%) in the low contingency condition reported a relationship between
their actions and that of the avatar, albeit this difference was non-significant (Fisher’s Exact
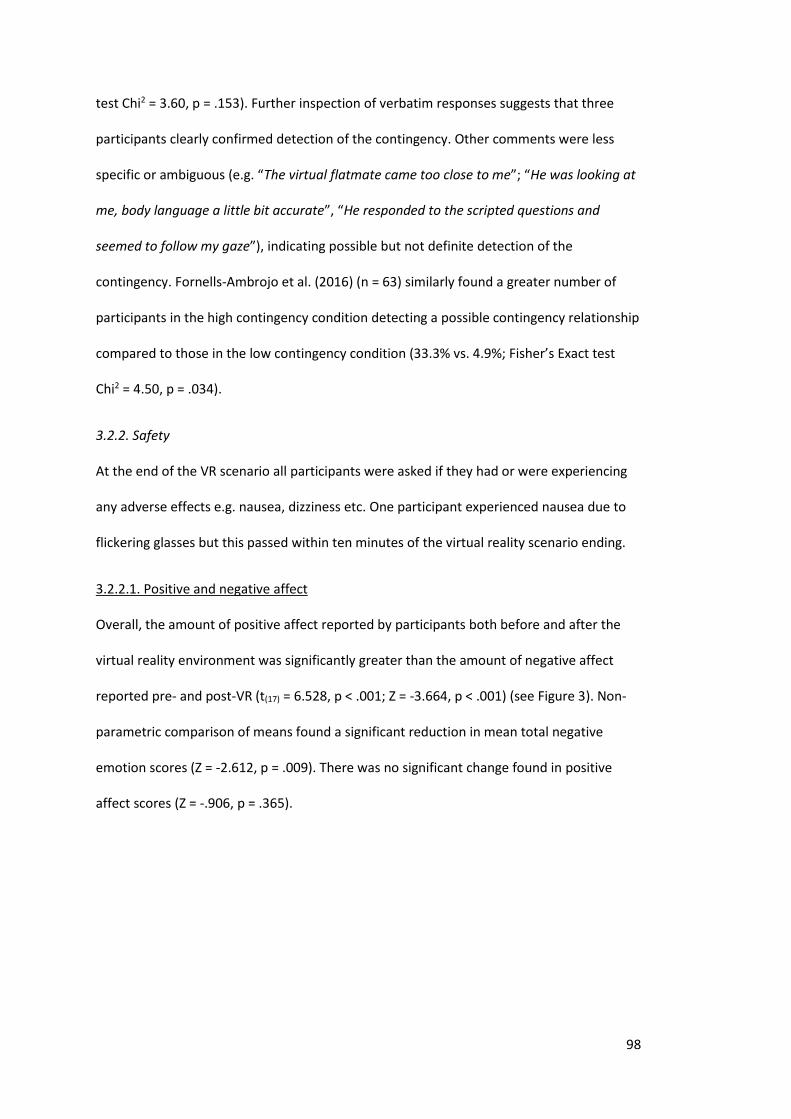
98
test Chi2 = 3.60, p = .153). Further inspection of verbatim responses suggests that three
participants clearly confirmed detection of the contingency. Other comments were less
specific or ambiguous (e.g. “The virtual flatmate came too close to me”; “He was looking at
me, body language a little bit accurate”, “He responded to the scripted questions and
seemed to follow my gaze”), indicating possible but not definite detection of the
contingency. Fornells-Ambrojo et al. (2016) (n = 63) similarly found a greater number of
participants in the high contingency condition detecting a possible contingency relationship
compared to those in the low contingency condition (33.3% vs. 4.9%; Fisher’s Exact test
Chi2 = 4.50, p = .034).
3.2.2. Safety
At the end of the VR scenario all participants were asked if they had or were experiencing
any adverse effects e.g. nausea, dizziness etc. One participant experienced nausea due to
flickering glasses but this passed within ten minutes of the virtual reality scenario ending.
3.2.2.1. Positive and negative affect
Overall, the amount of positive affect reported by participants both before and after the
virtual reality environment was significantly greater than the amount of negative affect
reported pre- and post-VR (t(17) = 6.528, p < .001; Z = -3.664, p < .001) (see Figure 3). Non-
parametric comparison of means found a significant reduction in mean total negative
emotion scores (Z = -2.612, p = .009). There was no significant change found in positive
affect scores (Z = -.906, p = .365).
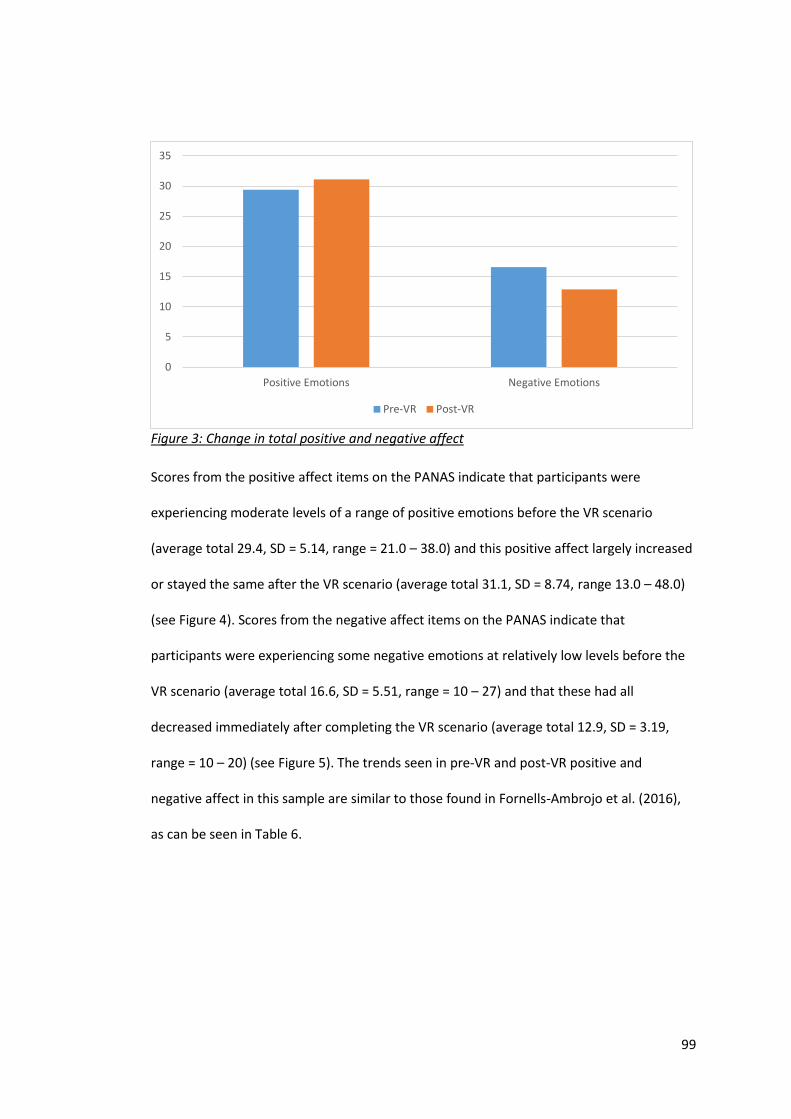
99
Figure 3: Change in total positive and negative affect
Scores from the positive affect items on the PANAS indicate that participants were
experiencing moderate levels of a range of positive emotions before the VR scenario
(average total 29.4, SD = 5.14, range = 21.0 – 38.0) and this positive affect largely increased
or stayed the same after the VR scenario (average total 31.1, SD = 8.74, range 13.0 – 48.0)
(see Figure 4). Scores from the negative affect items on the PANAS indicate that
participants were experiencing some negative emotions at relatively low levels before the
VR scenario (average total 16.6, SD = 5.51, range = 10 – 27) and that these had all
decreased immediately after completing the VR scenario (average total 12.9, SD = 3.19,
range = 10 – 20) (see Figure 5). The trends seen in pre-VR and post-VR positive and
negative affect in this sample are similar to those found in Fornells-Ambrojo et al. (2016),
as can be seen in Table 6.
0
5
10
15
20
25
30
35
Positive Emotions Negative Emotions
Pre-VR Post-VR
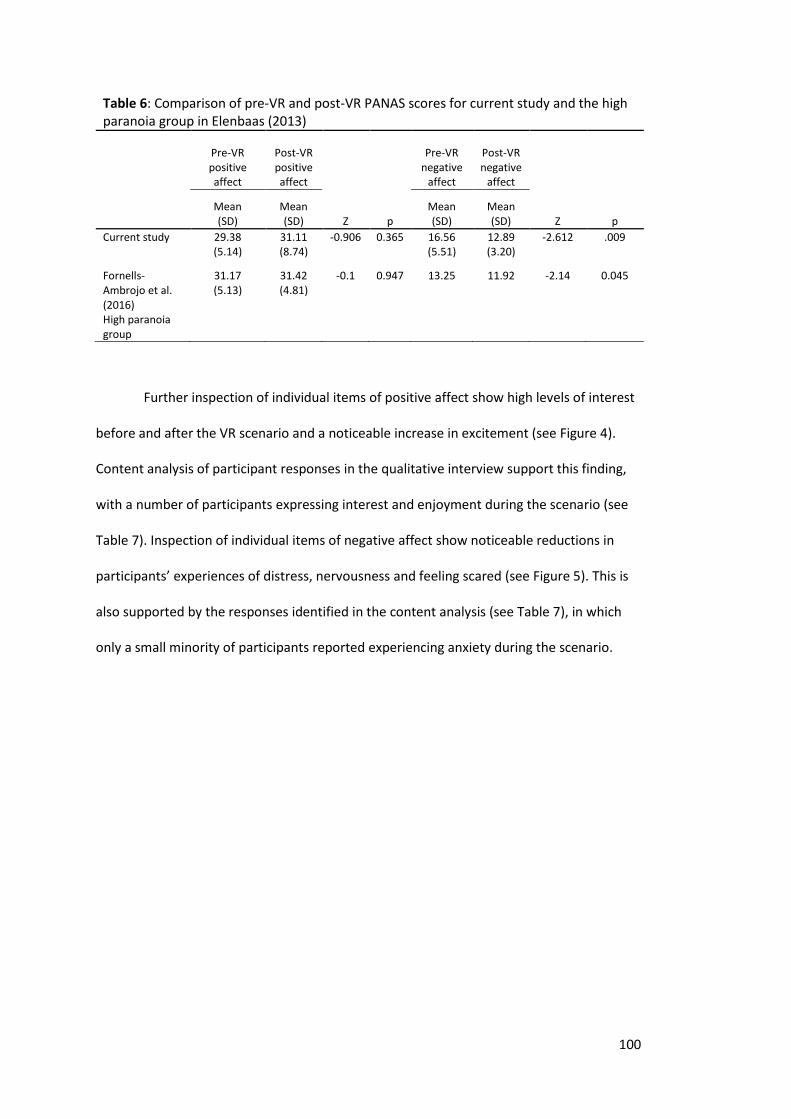
100
Table 6: Comparison of pre-VR and post-VR PANAS scores for current study and the high paranoia group in Elenbaas (2013)
Pre-VR positive affect
Post-VR positive affect
Pre-VR negative
affect
Post-VR negative
affect
Mean (SD)
Mean (SD) Z p
Mean (SD)
Mean (SD) Z p
Current study 29.38 (5.14)
31.11 (8.74)
-0.906 0.365 16.56 (5.51)
12.89 (3.20)
-2.612 .009
Fornells-Ambrojo et al. (2016) High paranoia group
31.17 (5.13)
31.42 (4.81)
-0.1 0.947 13.25 11.92 -2.14 0.045
Further inspection of individual items of positive affect show high levels of interest
before and after the VR scenario and a noticeable increase in excitement (see Figure 4).
Content analysis of participant responses in the qualitative interview support this finding,
with a number of participants expressing interest and enjoyment during the scenario (see
Table 7). Inspection of individual items of negative affect show noticeable reductions in
participants’ experiences of distress, nervousness and feeling scared (see Figure 5). This is
also supported by the responses identified in the content analysis (see Table 7), in which
only a small minority of participants reported experiencing anxiety during the scenario.
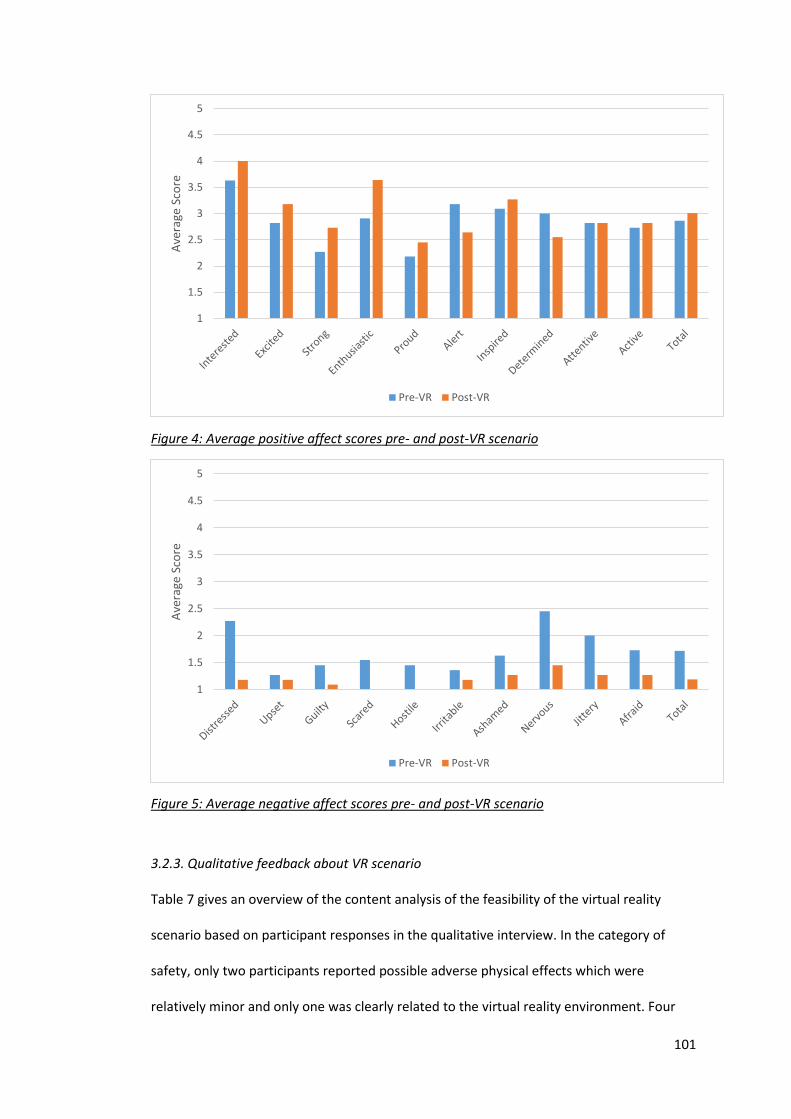
101
Figure 4: Average positive affect scores pre- and post-VR scenario
Figure 5: Average negative affect scores pre- and post-VR scenario
3.2.3. Qualitative feedback about VR scenario
Table 7 gives an overview of the content analysis of the feasibility of the virtual reality
scenario based on participant responses in the qualitative interview. In the category of
safety, only two participants reported possible adverse physical effects which were
relatively minor and only one was clearly related to the virtual reality environment. Four
1
1.5
2
2.5
3
3.5
4
4.5
5
Ave
rage
Sco
re
Pre-VR Post-VR
1
1.5
2
2.5
3
3.5
4
4.5
5
Ave
rage
Sco
re
Pre-VR Post-VR
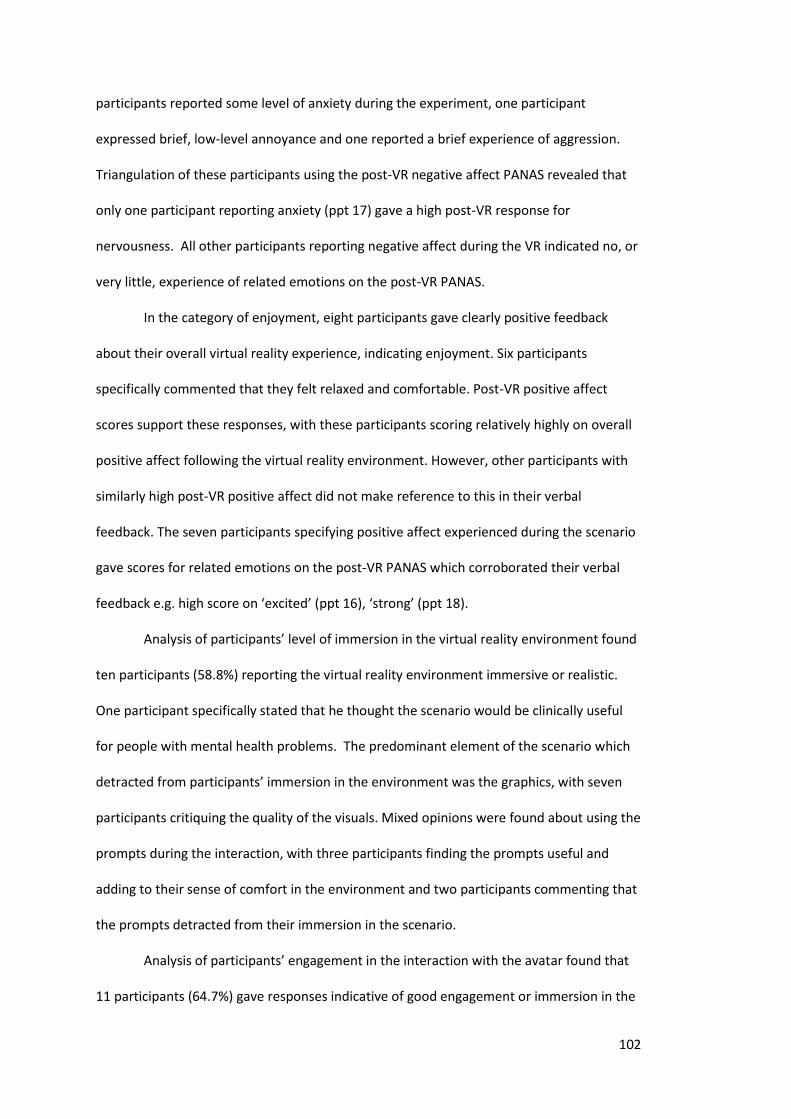
102
participants reported some level of anxiety during the experiment, one participant
expressed brief, low-level annoyance and one reported a brief experience of aggression.
Triangulation of these participants using the post-VR negative affect PANAS revealed that
only one participant reporting anxiety (ppt 17) gave a high post-VR response for
nervousness. All other participants reporting negative affect during the VR indicated no, or
very little, experience of related emotions on the post-VR PANAS.
In the category of enjoyment, eight participants gave clearly positive feedback
about their overall virtual reality experience, indicating enjoyment. Six participants
specifically commented that they felt relaxed and comfortable. Post-VR positive affect
scores support these responses, with these participants scoring relatively highly on overall
positive affect following the virtual reality environment. However, other participants with
similarly high post-VR positive affect did not make reference to this in their verbal
feedback. The seven participants specifying positive affect experienced during the scenario
gave scores for related emotions on the post-VR PANAS which corroborated their verbal
feedback e.g. high score on ‘excited’ (ppt 16), ‘strong’ (ppt 18).
Analysis of participants’ level of immersion in the virtual reality environment found
ten participants (58.8%) reporting the virtual reality environment immersive or realistic.
One participant specifically stated that he thought the scenario would be clinically useful
for people with mental health problems. The predominant element of the scenario which
detracted from participants’ immersion in the environment was the graphics, with seven
participants critiquing the quality of the visuals. Mixed opinions were found about using the
prompts during the interaction, with three participants finding the prompts useful and
adding to their sense of comfort in the environment and two participants commenting that
the prompts detracted from their immersion in the scenario.
Analysis of participants’ engagement in the interaction with the avatar found that
11 participants (64.7%) gave responses indicative of good engagement or immersion in the
103
interaction with the avatar. Analysis of responses revealed a predominant theme of
participants likening the interaction to that of a real interaction with another person. Nine
participants commented that they experienced their interaction with the avatar as similar
to a real-life interaction. Only one participant (ppt 11) reported finding the interaction
artificial. Four participants reported that the avatar’s behaviour during the scenario was
realistic and aided immersion in the interaction. Three participants directly commented on
their interest in the avatar, indicative of good engagement in the interaction. Participants’
critique of the interaction was largely centred on the content of the verbal interaction. Five
participants commented that the content of their conversation with the avatar was a
limiting factor in their immersion in the interaction e.g. being less restricted in the
questions they could ask the avatar, having a longer introduction period to get to know
each other better.
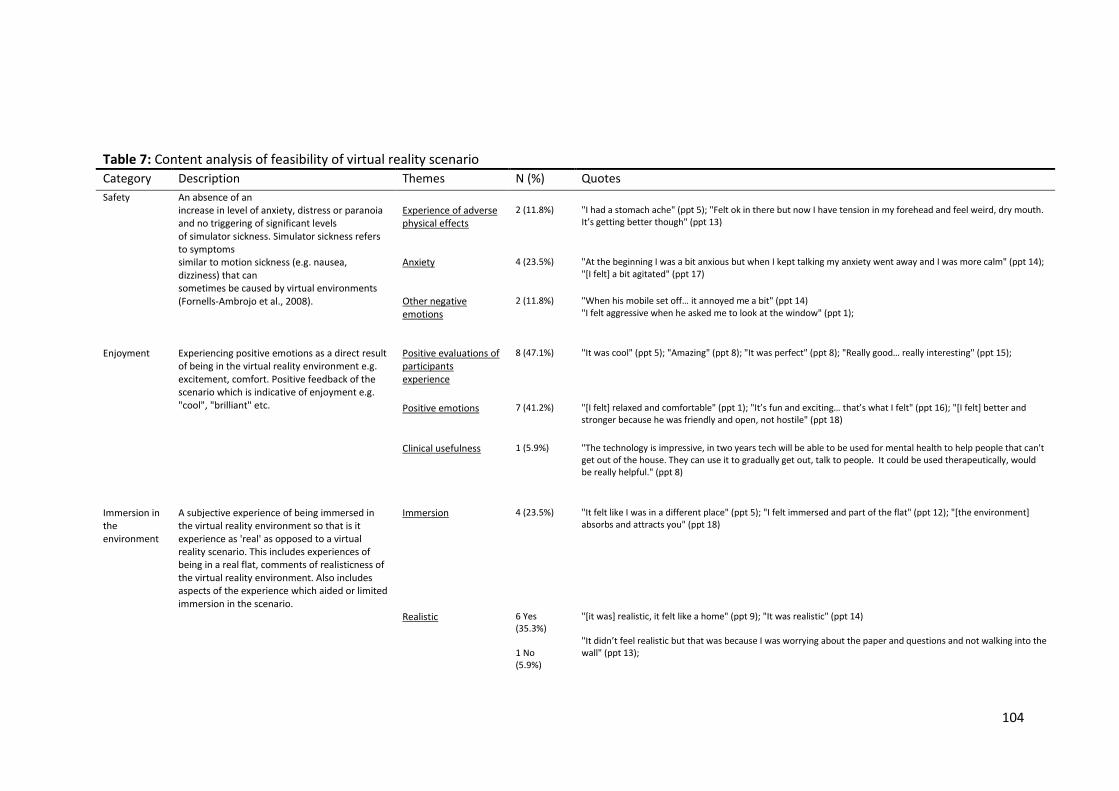
104
Table 7: Content analysis of feasibility of virtual reality scenario
Category Description Themes N (%) Quotes
Safety An absence of an increase in level of anxiety, distress or paranoia and no triggering of significant levels of simulator sickness. Simulator sickness refers to symptoms similar to motion sickness (e.g. nausea, dizziness) that can sometimes be caused by virtual environments (Fornells-Ambrojo et al., 2008).
Experience of adverse physical effects
2 (11.8%) "I had a stomach ache" (ppt 5); "Felt ok in there but now I have tension in my forehead and feel weird, dry mouth. It’s getting better though" (ppt 13)
Anxiety
4 (23.5%) "At the beginning I was a bit anxious but when I kept talking my anxiety went away and I was more calm" (ppt 14); "[I felt] a bit agitated" (ppt 17)
Other negative emotions
2 (11.8%) "When his mobile set off… it annoyed me a bit" (ppt 14) "I felt aggressive when he asked me to look at the window" (ppt 1);
Enjoyment
Experiencing positive emotions as a direct result of being in the virtual reality environment e.g. excitement, comfort. Positive feedback of the scenario which is indicative of enjoyment e.g. "cool", "brilliant" etc.
Positive evaluations of participants experience
8 (47.1%) "It was cool" (ppt 5); "Amazing" (ppt 8); "It was perfect" (ppt 8); "Really good… really interesting" (ppt 15);
Positive emotions
7 (41.2%) "[I felt] relaxed and comfortable" (ppt 1); "It’s fun and exciting… that’s what I felt" (ppt 16); "[I felt] better and stronger because he was friendly and open, not hostile" (ppt 18)
Clinical usefulness
1 (5.9%) "The technology is impressive, in two years tech will be able to be used for mental health to help people that can't get out of the house. They can use it to gradually get out, talk to people. It could be used therapeutically, would be really helpful." (ppt 8)
Immersion in the environment
A subjective experience of being immersed in the virtual reality environment so that is it experience as 'real' as opposed to a virtual reality scenario. This includes experiences of being in a real flat, comments of realisticness of the virtual reality environment. Also includes aspects of the experience which aided or limited immersion in the scenario.
Immersion
4 (23.5%) "It felt like I was in a different place" (ppt 5); "I felt immersed and part of the flat" (ppt 12); "[the environment] absorbs and attracts you" (ppt 18)
Realistic
6 Yes (35.3%) 1 No (5.9%)
"[it was] realistic, it felt like a home" (ppt 9); "It was realistic" (ppt 14) "It didn’t feel realistic but that was because I was worrying about the paper and questions and not walking into the wall" (ppt 13);
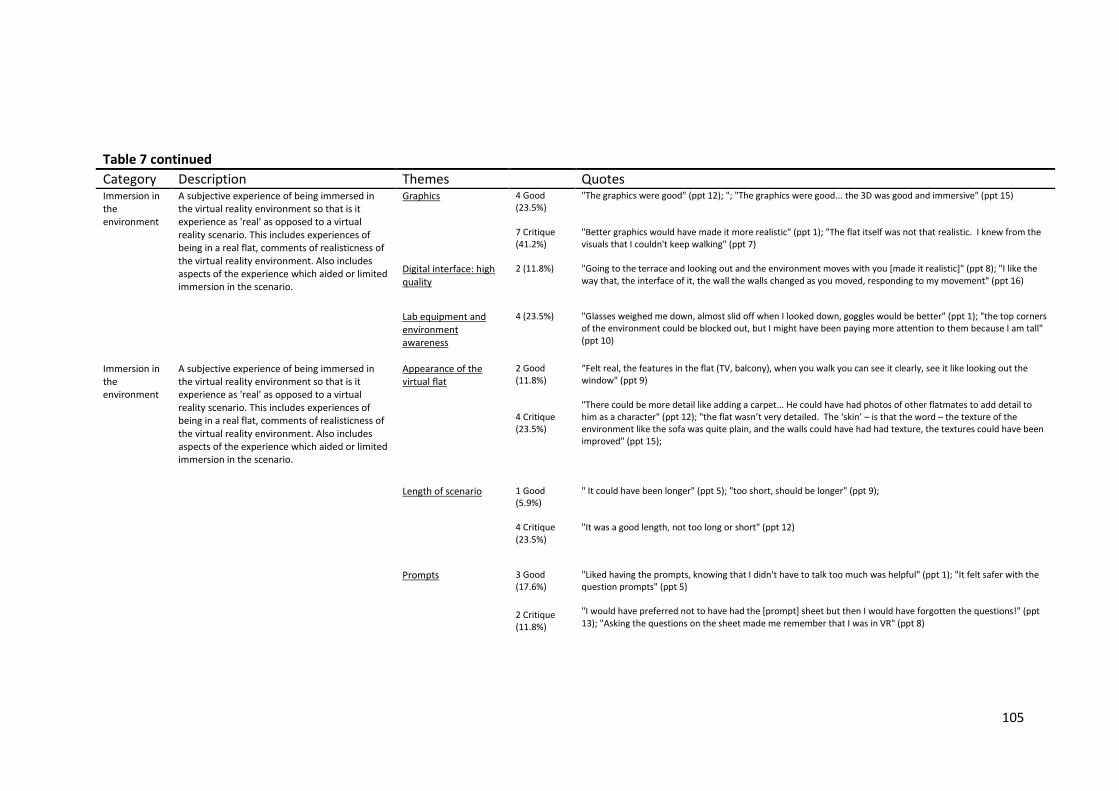
105
Table 7 continued
Category Description Themes Quotes
Immersion in the environment
A subjective experience of being immersed in the virtual reality environment so that is it experience as 'real' as opposed to a virtual reality scenario. This includes experiences of being in a real flat, comments of realisticness of the virtual reality environment. Also includes aspects of the experience which aided or limited immersion in the scenario.
Graphics
4 Good (23.5%) 7 Critique (41.2%)
"The graphics were good" (ppt 12); "; "The graphics were good... the 3D was good and immersive" (ppt 15) "Better graphics would have made it more realistic" (ppt 1); "The flat itself was not that realistic. I knew from the visuals that I couldn't keep walking" (ppt 7)
Digital interface: high quality
2 (11.8%) "Going to the terrace and looking out and the environment moves with you [made it realistic]" (ppt 8); "I like the way that, the interface of it, the wall the walls changed as you moved, responding to my movement" (ppt 16)
Lab equipment and environment awareness
4 (23.5%) "Glasses weighed me down, almost slid off when I looked down, goggles would be better" (ppt 1); "the top corners of the environment could be blocked out, but I might have been paying more attention to them because I am tall" (ppt 10)
Immersion in the environment
A subjective experience of being immersed in the virtual reality environment so that is it experience as 'real' as opposed to a virtual reality scenario. This includes experiences of being in a real flat, comments of realisticness of the virtual reality environment. Also includes aspects of the experience which aided or limited immersion in the scenario.
Appearance of the virtual flat
2 Good (11.8%) 4 Critique (23.5%)
“Felt real, the features in the flat (TV, balcony), when you walk you can see it clearly, see it like looking out the window" (ppt 9) "There could be more detail like adding a carpet... He could have had photos of other flatmates to add detail to him as a character" (ppt 12); "the flat wasn’t very detailed. The ‘skin’ – is that the word – the texture of the environment like the sofa was quite plain, and the walls could have had had texture, the textures could have been improved" (ppt 15);
Length of scenario
1 Good (5.9%) 4 Critique (23.5%)
" It could have been longer" (ppt 5); "too short, should be longer" (ppt 9); "It was a good length, not too long or short" (ppt 12)
Prompts
3 Good (17.6%)
2 Critique (11.8%)
"Liked having the prompts, knowing that I didn't have to talk too much was helpful" (ppt 1); "It felt safer with the question prompts" (ppt 5) "I would have preferred not to have had the [prompt] sheet but then I would have forgotten the questions!" (ppt 13); "Asking the questions on the sheet made me remember that I was in VR" (ppt 8)
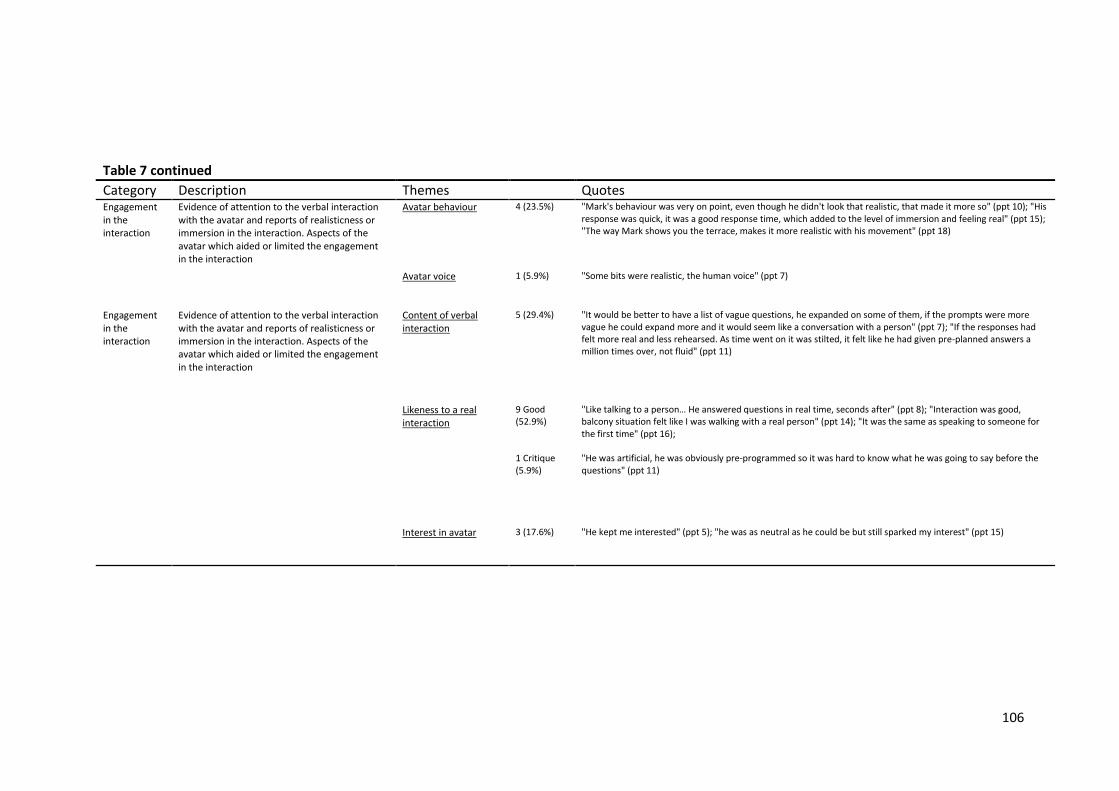
106
Table 7 continued
Category Description Themes Quotes
Engagement in the interaction
Evidence of attention to the verbal interaction with the avatar and reports of realisticness or immersion in the interaction. Aspects of the avatar which aided or limited the engagement in the interaction
Avatar behaviour
4 (23.5%) "Mark's behaviour was very on point, even though he didn't look that realistic, that made it more so" (ppt 10); "His response was quick, it was a good response time, which added to the level of immersion and feeling real" (ppt 15); "The way Mark shows you the terrace, makes it more realistic with his movement" (ppt 18)
Avatar voice
1 (5.9%) "Some bits were realistic, the human voice" (ppt 7)
Engagement in the interaction
Evidence of attention to the verbal interaction with the avatar and reports of realisticness or immersion in the interaction. Aspects of the avatar which aided or limited the engagement in the interaction
Content of verbal interaction
5 (29.4%) "It would be better to have a list of vague questions, he expanded on some of them, if the prompts were more vague he could expand more and it would seem like a conversation with a person" (ppt 7); "If the responses had felt more real and less rehearsed. As time went on it was stilted, it felt like he had given pre-planned answers a million times over, not fluid" (ppt 11)
Likeness to a real interaction
9 Good (52.9%) 1 Critique (5.9%)
"Like talking to a person… He answered questions in real time, seconds after" (ppt 8); "Interaction was good, balcony situation felt like I was walking with a real person" (ppt 14); "It was the same as speaking to someone for the first time" (ppt 16); "He was artificial, he was obviously pre-programmed so it was hard to know what he was going to say before the questions" (ppt 11)
Interest in avatar
3 (17.6%) "He kept me interested" (ppt 5); "he was as neutral as he could be but still sparked my interest" (ppt 15)
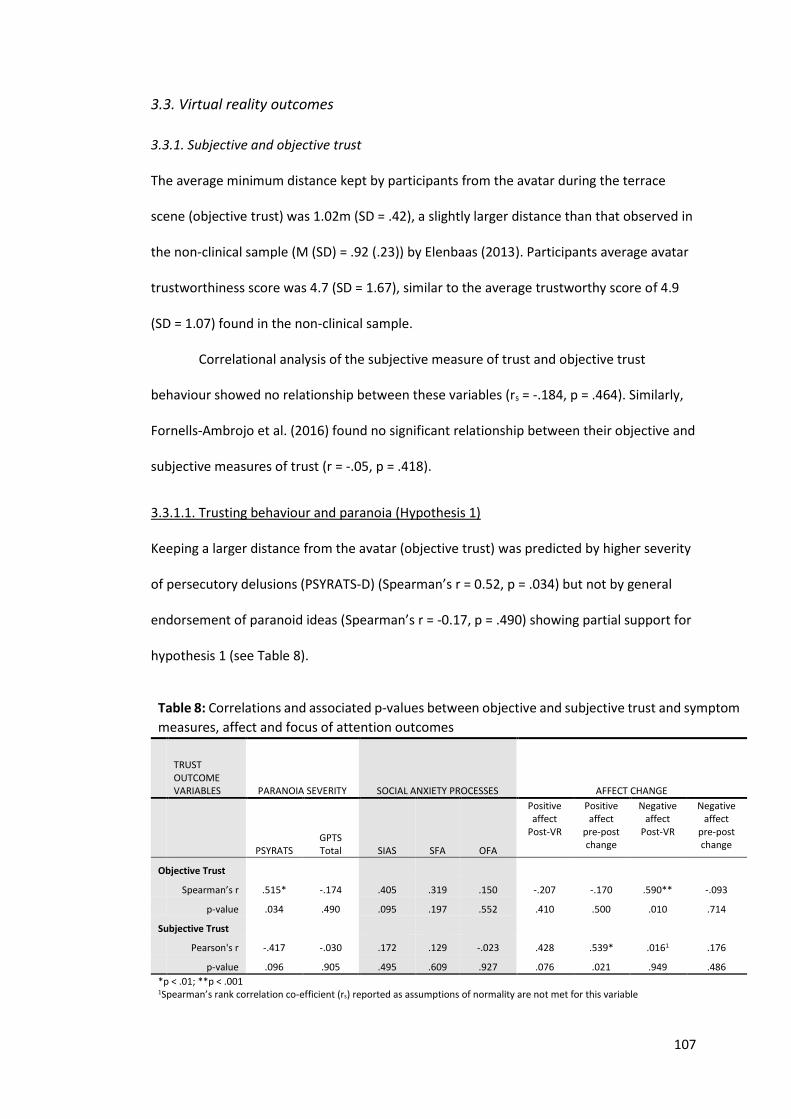
107
3.3. Virtual reality outcomes
3.3.1. Subjective and objective trust
The average minimum distance kept by participants from the avatar during the terrace
scene (objective trust) was 1.02m (SD = .42), a slightly larger distance than that observed in
the non-clinical sample (M (SD) = .92 (.23)) by Elenbaas (2013). Participants average avatar
trustworthiness score was 4.7 (SD = 1.67), similar to the average trustworthy score of 4.9
(SD = 1.07) found in the non-clinical sample.
Correlational analysis of the subjective measure of trust and objective trust
behaviour showed no relationship between these variables (rs = -.184, p = .464). Similarly,
Fornells-Ambrojo et al. (2016) found no significant relationship between their objective and
subjective measures of trust (r = -.05, p = .418).
3.3.1.1. Trusting behaviour and paranoia (Hypothesis 1)
Keeping a larger distance from the avatar (objective trust) was predicted by higher severity
of persecutory delusions (PSYRATS-D) (Spearman’s r = 0.52, p = .034) but not by general
endorsement of paranoid ideas (Spearman’s r = -0.17, p = .490) showing partial support for
hypothesis 1 (see Table 8).
Table 8: Correlations and associated p-values between objective and subjective trust and symptom
measures, affect and focus of attention outcomes
TRUST OUTCOME VARIABLES PARANOIA SEVERITY SOCIAL ANXIETY PROCESSES AFFECT CHANGE
PSYRATS GPTS Total SIAS SFA OFA
Positive affect
Post-VR
Positive affect
pre-post change
Negative affect
Post-VR
Negative affect
pre-post change
Objective Trust
Spearman’s r .515* -.174 .405 .319 .150 -.207 -.170 .590** -.093
p-value .034 .490 .095 .197 .552 .410 .500 .010 .714
Subjective Trust
Pearson's r -.417 -.030 .172 .129 -.023 .428 .539* .0161 .176
p-value .096 .905 .495 .609 .927 .076 .021 .949 .486
*p < .01; **p < .001
1Spearman’s rank correlation co-efficient (rs) reported as assumptions of normality are not met for this variable
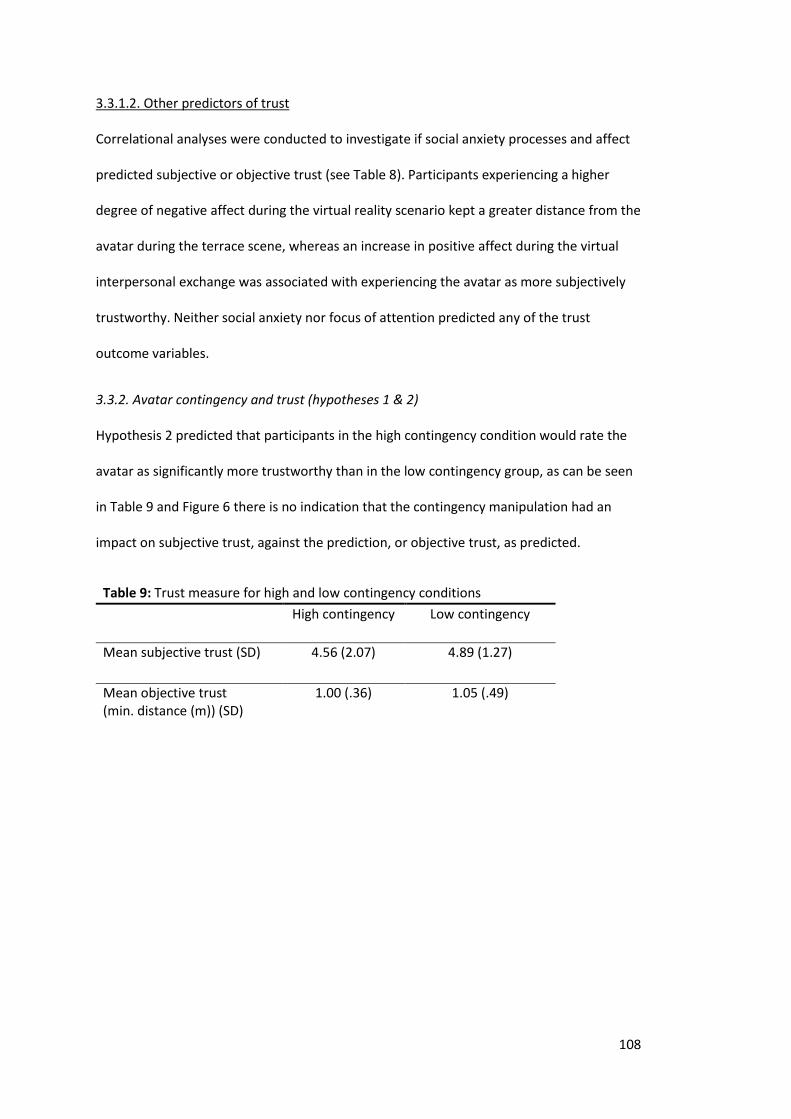
108
3.3.1.2. Other predictors of trust
Correlational analyses were conducted to investigate if social anxiety processes and affect
predicted subjective or objective trust (see Table 8). Participants experiencing a higher
degree of negative affect during the virtual reality scenario kept a greater distance from the
avatar during the terrace scene, whereas an increase in positive affect during the virtual
interpersonal exchange was associated with experiencing the avatar as more subjectively
trustworthy. Neither social anxiety nor focus of attention predicted any of the trust
outcome variables.
3.3.2. Avatar contingency and trust (hypotheses 1 & 2)
Hypothesis 2 predicted that participants in the high contingency condition would rate the
avatar as significantly more trustworthy than in the low contingency group, as can be seen
in Table 9 and Figure 6 there is no indication that the contingency manipulation had an
impact on subjective trust, against the prediction, or objective trust, as predicted.
Table 9: Trust measure for high and low contingency conditions
High contingency Low contingency
Mean subjective trust (SD) 4.56 (2.07) 4.89 (1.27)
Mean objective trust (min. distance (m)) (SD)
1.00 (.36) 1.05 (.49)
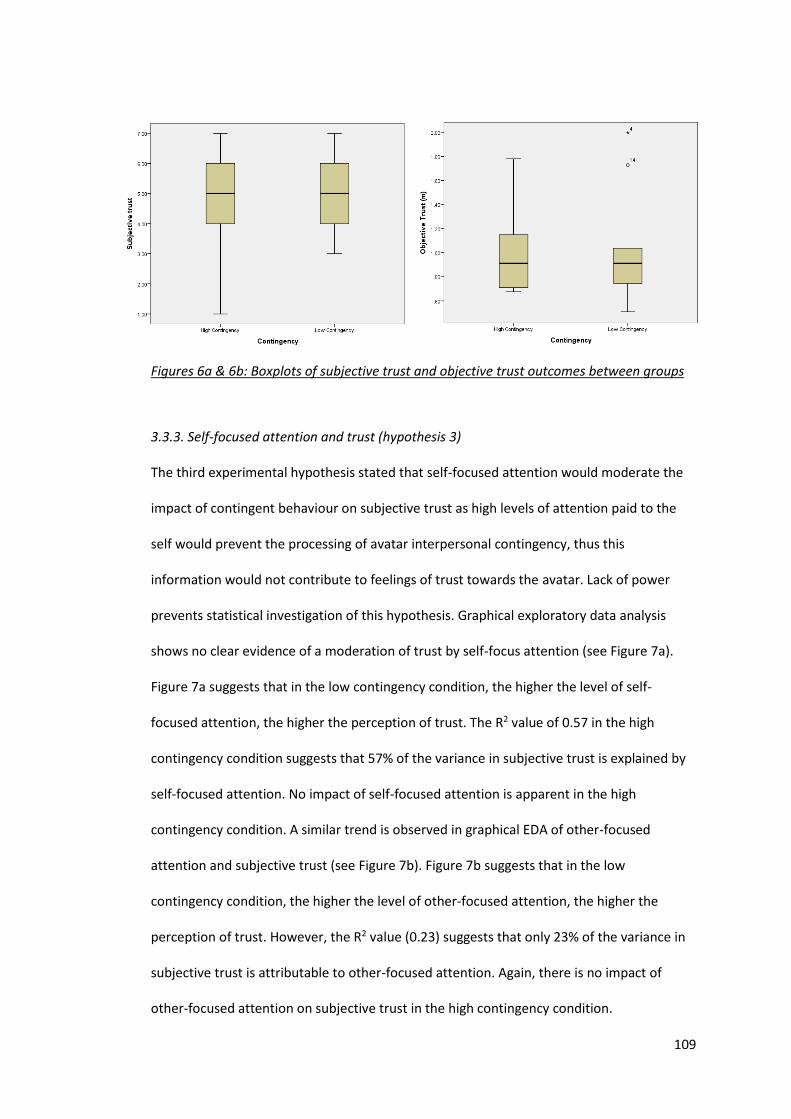
109
Figures 6a & 6b: Boxplots of subjective trust and objective trust outcomes between groups
3.3.3. Self-focused attention and trust (hypothesis 3)
The third experimental hypothesis stated that self-focused attention would moderate the
impact of contingent behaviour on subjective trust as high levels of attention paid to the
self would prevent the processing of avatar interpersonal contingency, thus this
information would not contribute to feelings of trust towards the avatar. Lack of power
prevents statistical investigation of this hypothesis. Graphical exploratory data analysis
shows no clear evidence of a moderation of trust by self-focus attention (see Figure 7a).
Figure 7a suggests that in the low contingency condition, the higher the level of self-
focused attention, the higher the perception of trust. The R2 value of 0.57 in the high
contingency condition suggests that 57% of the variance in subjective trust is explained by
self-focused attention. No impact of self-focused attention is apparent in the high
contingency condition. A similar trend is observed in graphical EDA of other-focused
attention and subjective trust (see Figure 7b). Figure 7b suggests that in the low
contingency condition, the higher the level of other-focused attention, the higher the
perception of trust. However, the R2 value (0.23) suggests that only 23% of the variance in
subjective trust is attributable to other-focused attention. Again, there is no impact of
other-focused attention on subjective trust in the high contingency condition.
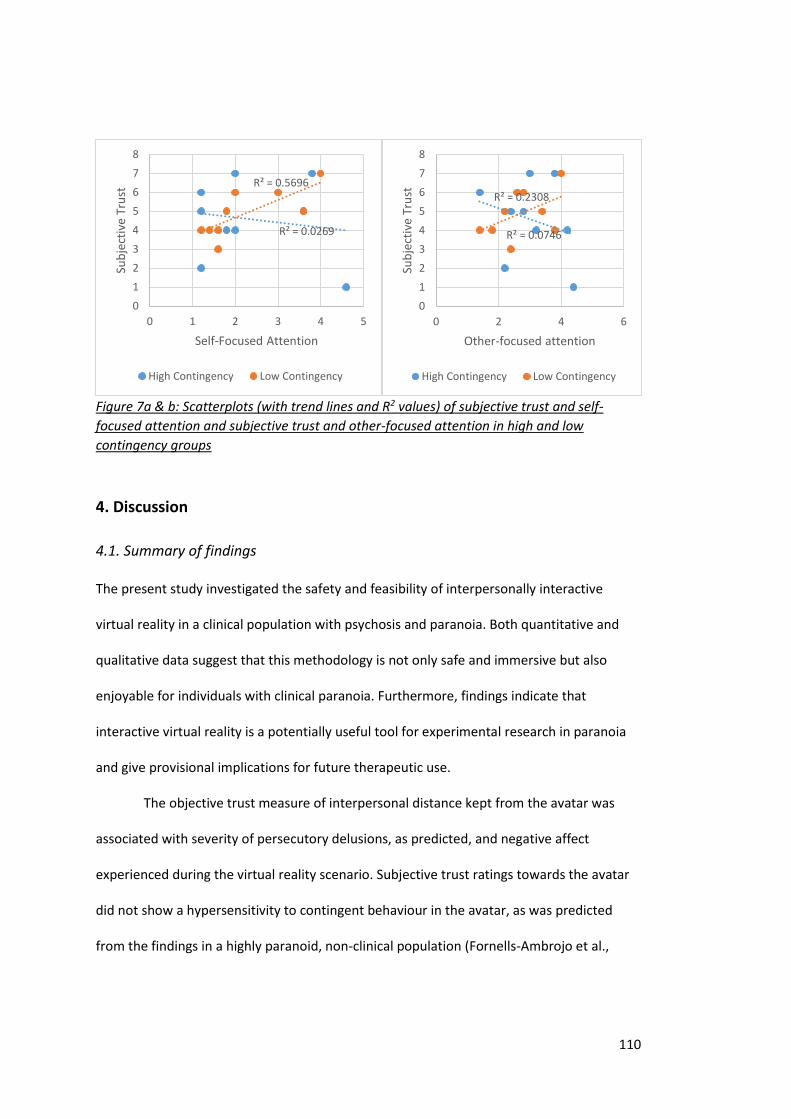
110
Figure 7a & b: Scatterplots (with trend lines and R2 values) of subjective trust and self-
focused attention and subjective trust and other-focused attention in high and low
contingency groups
4. Discussion
4.1. Summary of findings
The present study investigated the safety and feasibility of interpersonally interactive
virtual reality in a clinical population with psychosis and paranoia. Both quantitative and
qualitative data suggest that this methodology is not only safe and immersive but also
enjoyable for individuals with clinical paranoia. Furthermore, findings indicate that
interactive virtual reality is a potentially useful tool for experimental research in paranoia
and give provisional implications for future therapeutic use.
The objective trust measure of interpersonal distance kept from the avatar was
associated with severity of persecutory delusions, as predicted, and negative affect
experienced during the virtual reality scenario. Subjective trust ratings towards the avatar
did not show a hypersensitivity to contingent behaviour in the avatar, as was predicted
from the findings in a highly paranoid, non-clinical population (Fornells-Ambrojo et al.,
R² = 0.0269
R² = 0.5696
0
1
2
3
4
5
6
7
8
0 1 2 3 4 5
Sub
ject
ive
Tru
st
Self-Focused Attention
High Contingency Low Contingency
R² = 0.0746
R² = 0.2308
0
1
2
3
4
5
6
7
8
0 2 4 6
Sub
ject
ive
Tru
st
Other-focused attention
High Contingency Low Contingency
111
2016). Considering the lack of power in the current study, and the lack of correcting for
multiple comparisons, only tentative conclusions can be drawn from this observation.
The present study also investigated the potential role of state focus of attention in
clinical paranoia and its impact on interpersonal experiences. The study’s findings of a
positive association with self- and other-focus of attention and a lack of influence of self-
focused attention on trust may highlight a complexity in the process of self-focused
attention and its role in clinical phenomena such as paranoia.
4.1.1. Interactive VR: a viable tool for people with psychosis who experience paranoia
Similar to conclusions drawn by Fornells-Ambrojo et al. (2008), the current study’s virtual
reality scenario was shown to be a safe research tool to use with individuals with clinical
paranoia. Only one participant reported brief effects of simulator sickness and only a small
minority of participants verbally reported low-level experiences of anxiety during the
scenario.
Overall, positive affect was found to be significantly higher than negative affect
experienced by participants. Furthermore, a significant reduction in post-VR negative affect
was also found. This supports the proposal that virtual reality does not create discomfort,
including anxiety, in participants with clinical paranoia (Fornells-Ambrojo et al., 2008). In
fact, the observed increases in positive affect, particularly excitement, and the positive
feedback given indicates that the large majority of participants enjoyed their virtual reality
experience.
The feasibility of interactive virtual reality as a research tool in clinical paranoia is
also supported by the study’s findings. Participants experienced a sense of presence in the
virtual reality world, comparable to clinical populations with paranoia in non-interactive
virtual reality paradigms (Fornells-Ambrojo et al., 2008) and non-clinical participants in the
same scenario (Fornells-Ambrojo et al., 2016). Participants also reported finding the overall
experience “realistic” and “immersive”. Of particular importance, thematic analysis of
112
interview responses showed good evidence for participant’s engagement and immersion in
the interaction with the avatar. Numerous participants likened their interaction with the
avatar to a real-life interpersonal encounter, with some commenting that the avatar’s body
language and behaviour particularly added to their immersion in the interaction. This gives
promise for its future use as a tool to investigate potential trait and ‘in situ’ factors
impacting on interpersonal experiences in paranoia.
The current clinical sample were shown to pay less attention to the content of the
conversation with the avatar compared to the non-clinical sample, albeit the majority still
evidenced good attention. Lower levels of attention is arguably expected from a clinical
population, considering impaired attention is proposed to be a fundamental cognitive
deficit in patients with schizophrenia (Fioravanti et al., 2005; Neuchterlein et al., 1991).
The indication of reduced attention in the current clinical sample is also supported by
research showing that paranoid delusions are associated with impaired cognitive
performance i.e. executive functioning, tendency to jump to conclusions and theory of
mind (ToM) deficits (Bentall et al., 2009). This highlights a possible issue in the future use of
verbally interactive virtual reality in clinical populations with paranoia, as it requires a
degree of both attention (executive function) and reasoning about the mental state of
others (ToM). It also highlights that individuals with clinical paranoia may have reduced
attention to verbal content during therapeutic interactions and this should be considered
by clinicians during therapy.
Some participants reported that the quality of the graphics of the virtual reality
scenario detracted from their immersion in the environment, as did wearing the visual
equipment. Constant development of virtual reality technology, primarily for the gaming
industry, gives great promise for future developments of virtual reality as a clinical research
and therapeutic tool. For example, the newly developed Oculus Rift is an inexpensive,
consumer headset that can be used with a high-end computer, rather than the elaborate
113
and expensive virtual reality laboratories currently used. This technology has been shown
to enable enhanced visual graphics and a superior immersive experience in virtual
environments (Desai et al., 2014). In future, this could provide a more immersive
experience in interactive virtual reality and improve the validity of interpersonal responses
elicited by avatars in virtual reality scenarios.
4.1.2. No evidence of hypersensitivity to contingency in a clinically paranoid sample
Based on the findings by Fornells-Ambrojo et al. (2016) and the assumption that paranoia
exists on a continuum (Chapman & Chapman, 1980; Claridge, 1997; van Os et al., 2009), the
current study hypothesised that a hypersensitivity to the highly contingent avatar would be
observed in the self-report measures of trust in the clinical sample but not in distance kept
from the avatar. Exploratory data analysis gave no evidence that the contingency
manipulation influenced subjective or trust behaviour.
4.1.2.1 Safety behaviours and interpersonal distance
People with persecutory delusions keep a “safe” distance from the avatar regardless of
avatar responsiveness level i.e. they maintain a distance from the avatar that minimises
feelings of discomfort or prevents the activation of a threat response. Interestingly, this is
in line with Fornells-Ambrojo et al (2016) non-clinical study but also with data from
naturalistic settings, such as an experience sampling study in which paranoid thinking was
found to be immune to social context (familiarity) in people with high paranoia (Collip et
al., 2011). Furthermore, a recent study found that state paranoid experiences in people
with schizophrenia predicted greater interpersonal distance in a stop-distance paradigm
compared to individuals with schizophrenia and low paranoia and non-clinical controls
(Schoretsanitis, Kutynia, Stegmayer, Strik & Walther, 2016).
The minimum distance kept from the avatar was significantly associated with
severity of delusion and post-VR negative affect, indicative of the employment of greater
114
interpersonal safety behaviours in individuals with more severe persecutory delusions and
those experiencing greater emotional discomfort. Safety behaviours, such as interpersonal
distance kept during a verbal exchange, are performed with the aim of protecting against a
feared threat, and not only prevent disconfirmation of paranoid beliefs (Freeman et al.,
2007), but also are likely to elicit confirmatory evidence, for example by giving the
interlocutor the impression that one is less trusting or interested in them as signalled by
keeping farther away during the communicative exchange. Further research could
investigate the role of contingency in more ambiguous or threatening environments given
that Veling et al (2016) reported increased paranoia in virtual reality scenarios showing
higher levels of hostility, population and ethnic density in comparison to less socially
stressful scenes. However, it is also possible that more subtle environmental cues, such as
interpersonal responsiveness, do not influence trusting behaviour.
4.1.2.2 Subjective trust
No hypersensitivity was found towards the highly contingent avatar based on self-report
trust towards the virtual flatmate in a clinical sample with persecutory delusions. A number
of possible explanations are now considered.
It is possible that a type II error has occurred in the current study due to lack of
power and a true hypersensitivity to contingency has not been detected. However, it is also
plausible that the previous findings by Fornells-Ambrojo et al. (2016) are not true for a
clinical population with paranoia. It is important to consider that not all processes relevant
to paranoid ideation may exist on the entire paranoia spectrum and factors specific to
clinical populations may further influence the formation of persecutory delusions. For
example, attribution biases and ToM deficits are predominantly reported in populations
with acute paranoid delusions compared to remitted, other clinical and non-clinical
populations; and there is mixed evidence for their presence along the paranoia continuum
(e.g. Kettle, O’Brien-Simpson & Allen, 2008; Mehl et al., 2010; McKay, Langdon & Coltheart,
115
2005; Diez-Alegría et al., 2006; Lincoln et al., 2010). This is perhaps why correlations were
observed between severity of persecutory delusions (PSYRATS-D) and outcome measures
of objective trust and other-focused attention, but not between the amount of paranoid
delusions reported (GPTS). The PSYRATS-D measures the severity of delusions across a
number of dimensions, including distress and disruption to daily living, whereas the GPTS
measures frequency and endorsement of paranoia beliefs. It is plausible that the PSYRATS-
D is more sensitive to the presence of mechanisms relevant to persecutory delusions in
comparison to the GPTS. Principally, the PSYRATS-D may be more sensitive to the presence
of safety behaviours associated with interpersonal distance kept from the avatar, and
hypervigilance to external threat, an associated phenomenon in persecutory delusions
(Freeman, Garety & Phillips, 2000; Freeman et al., 2002), which may explain the observed
association with other-focused attention.
Blakemore et al. (2003) proposed that clinical individuals with paranoia over-
attribute contingent behaviour. It is possible that a misperception of contingent behaviour
in the low contingency condition therefore levelled the perceptions of subjective trust
across the two conditions. The non-significant difference in participants’ detection of
contingency in the high and low contingency groups potentially supports this theory, but
the sample size is too small to clearly establish if a misperception of contingency existed in
the clinical sample.
Another explanation is that reasoning biases present in a clinical population were
influencing subjective appraisals of trust towards the avatar, irrespective of the avatar’s
behavioural contingency. A reasoning bias identified as a contributory factor in the
occurrence of paranoid delusions is jumping to conclusions (JTC) (Bentall et al., 2009;
Garety & Freeman, 1999; Garety et al., 2013). Associated with working memory (Freeman
et al., 2014; Garety et al., 2013; Lunt et al., 2012), JTC is the process of limited information
gathering before reaching a conclusion. The positive relationship found between subjective
116
trust and positive emotions experienced in the virtual reality environment may be
indicative of participants basing their perceptions of trust on their affective state during the
virtual interaction, without using further interpersonal information (i.e. contingency) to
reach their conclusion. This is further supported by the literature that suggests that
attribution biases are present in individuals with persecutory delusions during both positive
and negative events (Lincoln, Mehl, Exner, Lindenmeyer & Rief, 2010).
4.1.3. Social anxiety and self-focussed attention in people with paranoia: a complex story
The clinical literature suggests that a subset of individuals with persecutory delusions have
significant levels of social anxiety and that this may contribute to the occurrence of
paranoid ideation (Lysaker et al., 2010). As self-focused attention has been implicated as a
key process in social anxiety and, to a lesser extent, psychosis, it was hypothesised that
higher self-focus attention would be associated with higher social anxiety in the current
sample. Despite half of the current sample self-reporting clinical levels of social anxiety,
only a minority of individuals reported high levels of self-focused attention during the
virtual reality scenario and the relationship between social anxiety and self-focused
attention was non-significant. Consideration of the pleasant nature and low level of
subjective distress observed during the virtual reality environment provides some
explanation for this finding. Glick et al. (2011) found that the relationship between social
anxiety and state self-focused attention was partially mediated by experiential distress in a
non-clinical population high in social anxiety. Furthermore, Clark & Wells (1995) propose
that the relevant processes of self-focused attention are activated when an individual
enters a “feared social situation”. It is therefore plausible that the current sample,
particularly those scoring high in social anxiety, were not experiencing levels of distress
intense enough to trigger heightened levels of self-focused attention during the virtual
reality scenario, hence no association was found. The findings that the virtual reality
scenario was a mostly positive experience with minimal levels of negative affect reported,
117
and the significant reduction in negative affect by the end of the scenario, supports this
hypothesis. In addition, participants were instructed to ‘speak’ with the avatar (using the
question prompts). This forced contact may have prevented participants fully engaging in
attention directed towards the self.
Based on Clark & Wells’ (1995) model of social anxiety that proposed that self-
focused attention limits the processing of external socially relevant information and
supportive empirical evidence, it was hypothesised that self-focused attention would be
negatively associated with other-focused attention. However, the data contradicted this
prediction, showing instead the participants who paid greater attention to themselves also
reported paying greater attention to their external environment, including the avatar.
Further inspection of the literature on self-focused attention reveals inconsistencies
between whether self-focused attention does, in fact, limited other-focused attention. For
example, Panayiotou & Vrana (1998) found that self-focused manipulation in a socially
anxious group did not decrease attention to the environment but may have enhanced it.
Holzman & Valentiner (2016) found that high socially anxious individuals demonstrated
higher levels of both self- and other-focused attention compared to those low in social
anxiety. Both studies contradict the assertion that focus of attention is one-directional.
Spurr & Stopa (2002) highlight the complexity of self-focused attention in their
review of the literature. The authors emphasised that the mechanistic function of self-
focused attention in social anxiety cannot be explained simply by the presence of attention
to the self. The content of self-focused attention is highlighted to play a crucial role in
influencing appraisals of social situations. In Carver & Scheier’s (1982; 2012) cybernetic
theory of self-regulation, a distinction is made between two types of self-focused attention
based on content: private self-consciousness (i.e. focus on psychological aspects of
themselves, such as thoughts, feelings and attitudes) and public self-consciousness (i.e.
awareness of themselves being processed as social objects, such as the impression they are
118
making on another). Public self-consciousness has been shown to be a strong predictor of
social anxiety (Darvill, Johnson & Danko, 1992).
As it would seem that the mechanism by which self-focused attention impacts
upon social anxiety is complex, it is fair to assume that a similar complexity exists in its role
in clinical paranoia. Rietdijk et al. (2009) reflect on the complexities of the relationship
between social phobia and paranoid ideation in the general population. They propose the
two phenomena may share psychological mechanisms i.e. subject of attention, heightened
self-consciousness, scanning the environment, overestimating the impact of behaviour and
self-reference and confirmation biases. However, the shared mechanisms are driven by
different motives: fear of rejection versus fear of persecution, which lead to different
psychological outcomes.
Should a positive relationship between self- and other-focus of attention truly exist
in clinically paranoid populations, this might suggest a more general state of higher
awareness (both to self and others) experienced by some in social interactions, influenced
by factors specific to processes of paranoid ideation e.g. hypervigilance to threat. The
significant positive correlation found between other-focused attention and severity of
delusion may suggest that other-focus of attention is driven by factors more relevant to
delusional processes than those of social anxiety. Furthermore, the literature on self-
focused attention places great emphasis on its influence on self-perception, rather than
perceptions of another. It is important for future research to further investigate the
relationship between self- and other-focus of attention in social interactions in individuals
with clinical paranoia and how this might impact on their interpersonal experiences.
4.1.4. Lack of influence of self-focused attention in trust perception
Against hypotheses, no influence of self-focused attention in trust perception was found.
Again, this finding is possibly due to lack of power. However, possible explanations could be
drawn from considering the content of self- and other-focused attention.
119
Carver & Scheier’s (1982; 2012) cybernetic theory of self-regulation proposes that
self-focus attention may provide a feedback cycle which allows a person to become aware
of processes towards a goal and take appropriate action, effecting changes if there is a
discrepancy between the perceived standard of behaviour and actual behaviour. The
greater the discrepancy, the greater the distress experienced in a social interaction.
Furthermore, the extent to which self-focused attention negatively impacts on perceptions
of a social interaction is dependent on whether the content of self-consciousness is positive
or negative. It is plausible that the pleasantness of the interaction with the avatar, and the
fact that the avatar would not respond to any nervousness in the participants, was
incorporated into a feedback loop of social performance that minimised negative self-
focused attention assessed in the FAQ e.g. anxiety, memories of past social failures. Further
investigation into the content of participants’ focus of attention (e.g. positive or negative,
public or private self-consciousness) might give further insight into the role of self- and
other-focused attention in interpersonal experiences in paranoia.
Graphical exploratory data analysis (EDA) of focus of attention and subjective trust
suggested that there is potentially a link between focus of attention and trust in the low
contingency condition. Conclusions drawn from this must be very tentative due to the small
sample. However, Fornells-Ambrojo et al. (2016) found that dismissive attachment
predicted greater subjective trust in the non-clinical sample. Potentially, the low
contingency condition was more likely to elicit an insecure attachment response to the
avatar, hence the greater attention paid to the self (private self-consciousness) and the
other, the greater the subjective trust rating.
4.2. Limitations
The current findings must be interpreted in the context of a number of limitations. Whilst
the sample size allowed for adequate exploration of the feasibility of the interactive virtual
reality environment in a clinical population with paranoia and overall associations with
120
paranoia, a clear limitation of the study is a sample size without enough statistical power to
detect effects of contingency manipulation or self-focused attention. Therefore any
conclusions drawn about contingency and focus of attention in clinical paranoia can only be
very tentative. Exploratory data analysis (EDA) was employed to allow a more exploratory
approach to potential trends emerging from the data. However, small-n EDA remains
susceptible to biases in the data from outliers.
The current study also used multiple statistical tests to explore correlations
between outcome measures. This will have increased the likelihood that a type I error may
have occurred in the analysis i.e. rejecting a null hypothesis (H0) when it is true. Applying
Bonferroni corrections (Cabin & Mitchell, 2000) would have minimised the chance of type I
errors occurring, yet applying these corrections would have rendered most of the
significant tests non-significant. There is no formal consensus for when Bonferroni
corrections should be used (Perneger, 1998) and it is noted that applying Bonferonni
corrections increases the likelihood of type II errors (i.e. accepting H0 when it is false), thus
reducing the power of a study (Nakagawa, 2004). Hence, the decision was made not to use
these corrections in the current study.
The qualitative feedback from participants helped enrich findings from this study,
particularly enabling firmer conclusions to be drawn about the feasibility of interactive
virtual reality. However, a comment must be made about the potential for response bias.
The interview was conducted by the researchers with whom participants had conducted all
other research tasks. This may have influenced greater positive feedback about their
experience or a with-holding of negative feedback about their experience.
The pleasant nature of the scenario, reflected by the PANAS and participant
feedback, could be considered to limit the generalisability of findings. It is proposed that
social cognitive biases are greatly exacerbated in clinical individuals with paranoia when
there is a perceived threat to self or under conditions of stress (Bentall et al., 2001; Lincoln,
121
Lange, Burau, Exner & Moritz, 2010; Lincoln, Peter, Schäfer & Moritz, 2009). Similarly,
research has found that the impact of self-focused attention on social appraisals is
mediated by experiential distress (Glick et al. 2011). It is difficult to determine the impact of
interpersonal contingency or self-focused attention on trust if the virtual reality scenario
was more ambiguous or anxiety provoking. Virtual reality experiments that have used more
ambiguous paradigms have found clinical participants with paranoia experience paranoid
ideation towards avatars (Fornells-Ambrojo et al., 2008). It may be that if a threshold of
experiential discomfort is reached, cognitive factors relevant to clinical paranoia become
more influential on subjective interpersonal experiences, such as trust.
Clearly, the study’s all-male sample contributes to limitations in the studies
generalizability. Significant gender differences have been found in sense of presence
experienced in virtual reality, with men experiencing a higher sense of spatial presence,
perceived realism and sense of immersion in the environment (Felnhofer et al., 2012). This
limits the assertion that interactive virtual reality is a feasible research methodology for
both men and women with clinical paranoia, particularly with regards to a sense of
presence in the environment and interaction. Furthermore, the salience of paranoid
ideation may vary between clinical individuals with paranoia, both in the current sample
and wider population, based on the dissonance between their idiosyncratic belief system
and the presence of a Caucasian, male avatar.
4.3. Future research and clinical implications
In the current study, one participant was quoted saying “The technology is impressive, in
two years tech will be able to be used for mental health to help people that can't get out of
the house. They can use it to gradually get out, talk to people. It could be used
therapeutically, would be really helpful." Although this is perhaps a distant future
implication for interactive virtual reality as a therapeutic tool in paranoia, it coincides with
the emergence of exposure-based virtual reality being effectively used as a therapeutic tool
122
with individuals with persecutory delusions (Freeman et al., 2016) and other mental health
conditions such as social phobia (Klinger et al., 2005). Interpersonally interactive virtual
reality may prove to be a useful therapeutic tool in addition to exposure-based
interventions for individuals with clinical paranoia, particularly those with very limited
social contact.
However, future research needs to expand on the feasibility of interactive virtual
reality in clinical populations with paranoia. Addressing possible gender differences in
senses of presence needs to be explored with a mixed gender clinical sample. Furthermore,
as attention to content was highlighted as a potential issue to the feasibility of the
interaction, future research should aim to further investigate the impact of severity and
chronicity of psychotic illness on engagement in the virtual reality interaction including
psychosis populations other than that of just first-episode.
The role of interpersonal contingency in perceptions of trust in paranoia remains
unclear. To truly investigate whether hypersensitivity to interpersonal contingency does
exist in clinical individuals with paranoia, the current study needs to be replicated with a
sample size large enough to reach satisfactory power. Particular focus should be given to
evidence that either supports paranoia processes on a continuum or suggests that there
are features of paranoid delusions that are exclusive to clinical populations. Similarly, the
role of interpersonal contingency and trust needs further exploration in a more ambiguous
or anxiety-provoking social interaction. This would potentially allow for further conclusions
to be drawn about the impact of affective state on cognitive processes related to paranoid
such as self-focused attention and reasoning biases.
123
References
Bailenson, J. N., Blascovich, J., Beall, A. C., & Loomis, J. M. (2001). Equilibrium theory revisited:
Mutual gaze and personal space in virtual environments. Presence, 10(6), 583-598.
Bailenson, J. N., Blascovich, J., Beall, A. C., & Loomis, J. M. (2003). Interpersonal distance in
immersive virtual environments. Personality and Social Psychology Bulletin, 29(7), 819-
833.
Bailenson, J. N., Yee, N., Patel, K., & Beall, A. C. (2008). Detecting digital chameleons. Computers
in Human Behavior, 24(1), 66-87.
Barker, C., Pistrang, N., & Elliott, R. (2016). Research Methods in Clinical Psychology: An
Introduction for Students and Practitioners, Third Edition. Chichester: John Wiley &
Sons. doi: 10.1002/9781119154082.ch1
Bartholomew, K., & Horowitz, L. M. (1991). Attachment styles among young adults: a test of a
four-category model. Journal of Personality and Social Psychology, 61(2), 226.
Bentall, R. P., Corcoran, R., Howard, R., Blackwood, N., & Kinderman, P. (2001). Persecutory
delusions: a review and theoretical integration. Clinical Psychology Review, 21(8), 1143-
1192.
Bentall, R. P., de Sousa, P., Varese, F., Wickham, S., Sitko, K., Haarmans, M., & Read, J. (2014).
From adversity to psychosis: pathways and mechanisms from specific adversities to
specific symptoms. Social psychiatry and psychiatric epidemiology, 49(7), 1011-1022.
Bentall, R. P., Kinderman, P., & Kaney, S. (1994). The self, attributional processes and abnormal
beliefs: Towards a model of persecutory delusions. Behav Res Ther, 32(3), 331-341.
Bentall, R. P., Rowse, G., Shryane, N., Kinderman, P., Howard, R., Blackwood, N., Moore, R., &
Corcoran, R. (2009). The cognitive and affective structure of paranoid delusions: A
transdiagnostic investigation of patients with schizophrenia spectrum disorders and
depression. Archives of General Psychiatry, 66(3), 236-247.
124
Berry, K., Barrowclough, C., & Wearden, A. (2007). A review of the role of adult attachment
style in psychosis: Unexplored issues and questions for further research. Clinical
Psychology Review, 27(4), 458-475. doi: http://dx.doi.org/10.1016/j.cpr.2006.09.006
Birchwood, M., Trower, P., Brunet, K., Gilbert, P., Iqbal, Z., & Jackson, C. (2007). Social anxiety
and the shame of psychosis: a study in first episode psychosis. Behav Res Ther, 45(5),
1025-1037.
Blakemore, S.-J., Sarfati, Y., Bazin, N., & Decety, J. (2003). The detection of intentional
contingencies in simple animations in patients with delusions of persecution.
Psychological Medicine, 33(08), 1433-1441.
Bögels, S. M., & Lamers, C. (2002). The causal role of self-awareness in blushing-anxious,
socially-anxious and social phobics individuals. Behaviour Research and Therapy,
40(12), 1367-1384.
Bögels, S. M., Rijsemus, W., & De Jong, P. J. (2002). Self-focused attention and social anxiety:
The effects of experimentally heightened self-awareness on fear, blushing, cognitions,
and social skills. Cognitive Therapy and Research, 26(4), 461-472.
Braun, V., & Clarke, V. (2006). Using thematic analysis in psychology. Qualitative research in
psychology, 3(2), 77-101.
Brüne, M. (2005). “Theory of mind” in schizophrenia: a review of the literature. Schizophrenia
Bulletin, 31(1), 21-42.
Burgoon, J. K., Buller, D. B., Dillman, L., & Walther, J. B. (1995). Interpersonal deception. Human
communication research, 22(2), 163-196.
Cabin, R. J., & Mitchell, R. J. (2000). To Bonferroni or not to Bonferroni: when and how are the
questions. Bulletin of the Ecological Society of America, 81(3), 246-248.
Carver, C. S., & Scheier, M. F. (1981). The self-attention-induced feedback loop and social
facilitation. Journal of Experimental Social Psychology, 17(6), 545-568.
Carver, C. S., & Scheier, M. F. (1982). Control theory: A useful conceptual framework for
personality–social, clinical, and health psychology. Psychological bulletin, 92(1), 111.
125
Carver, C. S., & Scheier, M. F. (2012). Attention and self-regulation: A control-theory approach
to human behavior: Springer Science & Business Media.
Cassano, G. B., Pini, S., Saettoni, M., & Dell’Osso, L. (1999). Multiple anxiety disorder
comorbidity in patients with mood spectrum disorders with psychotic features.
American Journal of Psychiatry.
Chapman, L. J., & Chapman, J. P. (1980). Scales for Rating Psychotic and Psychotic-like
Experiences as Continua. Schizophrenia Bulletin, 6(3), 476-489.
Claridge, G. E. (1997). Schizotypy: Implications for illness and health. Oxford: Oxford University
Press.
Clark, D. M., & Wells, A. (1995). A cognitive model of social phobia. In Heimburg, R. G.,
Liebowitz, D. A., Hope, D. A., & Schneier, F. R. (Eds.). Social phobia: Diagnosis,
assessment, and treatment, 69-93. New York: The Guilford Press.
Cohen, S. (2004). Social relationships and health. American psychologist, 59(8), 676.
Collip, D., Oorschot, M., Thewissen, V., Van Os, J., Bentall, R., & Myin-Germeys, I. (2011). Social
world interactions: how company connects to paranoia. Psychological Medicine,
41(05), 911-921.
Cosoff, S. J., & Julian Hafner, R. (1998). The prevalence of comorbid anxiety in schizophrenia,
schizoaffective disorder and bipolar disorder. Australian and New Zealand Journal of
Psychiatry, 32(1), 67-72.
Crawford, J. R., & Henry, J. D. (2004). The Positive and Negative Affect Schedule (PANAS):
Construct validity, measurement properties and normative data in a large non‐clinical
sample. British Journal of Clinical Psychology, 43(3), 245-265.
Cutting, J. (1997). Principles of Psychopathology Two Worlds, Two Minds, Two Hemispheres.
Oxford: Oxford University Press.
Daly, J. A., Vangelisti, A. L., & Lawrence, S. G. (1989). Self-focused attention and public speaking
anxiety. Personality and Individual Differences, 10(8), 903-913.
126
Darvill, T. J., Johnson, R. C., & Danko, G. P. (1992). Personality correlates of public and private
self consciousness. Personality and Individual Differences, 13(3), 383-384.
Desai, P. R., Desai, P. N., Ajmera, K. D., & Mehta, K. (2014). A review paper on oculus rift-A
virtual reality headset. arXiv preprint arXiv:1408.1173.
Diez-Alegría, C., Vázquez, C., Nieto-Moreno, M., Valiente, C., & Fuentenebro, F. (2006).
Personalizing and externalizing biases in deluded and depressed patients: Are
attributional biases a stable and specific characteristic of delusions? British Journal of
Clinical Psychology, 45(4), 531-544. doi: 10.1348/014466505X86681
Diez‐Alegría, C., Vázquez, C., Nieto‐Moreno, M., Valiente, C., & Fuentenebro, F. (2006).
Personalizing and externalizing biases in deluded and depressed patients: Are
attributional biases a stable and specific characteristic of delusions? British Journal of
Clinical Psychology, 45(4), 531-544.
Drake, R., Haddock, G., Tarrier, N., Bentall, R., & Lewis, S. (2007). The Psychotic Symptom Rating
Scales (PSYRATS): their usefulness and properties in first episode psychosis.
Schizophrenia Research, 89(1-3), 119-122. doi: 10.1016/j.schres.2006.04.024
Elenbaas, M. (2013). Paranoia and the role of interpersonal contingency in the experience of
trust and perceived empathy in interpersonal encounters. Unpublished Doctoral Thesis.
University College London.
Faul, F., Erdfelder, E., Lang, A. G., & Buchner, A. (2007). G* Power 3: A flexible statistical power
analysis program for the social, behavioral, and biomedical sciences. Behavior research
methods, 39(2), 175-191.
Felnhofer, A., Kothgassner, O. D., Beutl, L., Hlavacs, H., & Kryspin-Exner, I. (2012). Is virtual
reality made for men only? Exploring gender differences in the sense of presence.
Proceedings of the International Society on Presence Research, Philadelphia, USA.
Fenigstein, A., & Vanable, P. A. (1992). Paranoia and self-consciousness. Journal of Personality
and Social Psychology, 62(1), 129.
127
Fioravanti, M., Carlone, O., Vitale, B., Cinti, M. E., & Clare, L. (2005). A meta-analysis of cognitive
deficits in adults with a diagnosis of schizophrenia. Neuropsychology review, 15(2), 73-
95.
Fornells-Ambrojo, M., Barker, C., Swapp, D., Slater, M., Antley, A., & Freeman, D. (2008). Virtual
reality and persecutory delusions: Safety and feasibility. Schizophr Res, 104(1–3), 228-
236. doi: http://dx.doi.org/10.1016/j.schres.2008.05.013
Fornells-Ambrojo, M., Elenbaas, M., Barker, C., Swapp, D., Navarro, X., Rovira, A., Sanahuja, J., &
Slater, M. (2016). Hypersensitivity to Contingent Behavior in Paranoia: A New Virtual
Reality Paradigm. The Journal of nervous and mental disease, 204(2), 148-152.
Freeman, D., Bradley, J., Antley, A., Bourke, E., DeWeever, N., Evans, N., Černis, E., Sheaves, B.,
Waite, F., Dunn, G., Slater, M., Clark, D. (2016). Virtual reality in the treatment of
persecutory delusions: randomised controlled experimental study testing how to
reduce delusional conviction. The British Journal of Psychiatry, doi:
10.1192/bjp.bp.115.176438
Freeman, D., & Garety, P. A. (2000). Comments on the content of persecutory delusions: Does
the definition need clarification? British Journal of Clinical Psychology, 39(4), 407-414.
Freeman, D., Garety, P. A., Bebbington, P., Slater, M., Kuipers, E., Fowler, D., Green, C., Jordan,
J., Ray, K., & Dunn, G. (2005). The psychology of persecutory ideation II: a virtual reality
experimental study. The Journal of nervous and mental disease, 193(5), 309-315.
Freeman, D., Garety, P. A., Bebbington, P. E., Smith, B., Rollinson, R., Fowler, D., Kuipers, E., Ray,
K., & Dunn, G. (2005). Psychological investigation of the structure of paranoia in a non-
clinical population. The British Journal of Psychiatry, 186(5), 427-435.
Freeman, D., Garety, P. A., Kuipers, E., Fowler, D., & Bebbington, P. E. (2002). A cognitive model
of persecutory delusions. British Journal of Clinical Psychology, 41(4), 331-347.
Freeman, D., Garety, P. A., Kuipers, E., Fowler, D., Bebbington, P. E., & Dunn, G. (2007). Acting
on persecutory delusions: The importance of safety seeking. Behaviour Research and
Therapy, 45(1), 89-99.
128
Freeman, D., Garety, P. A., & Phillips, M. L. (2000). An examination of hypervigilance for
external threat in individuals with generalized anxiety disorder and individuals with
persecutory delusions using visual scan paths. The Quarterly Journal of Experimental
Psychology: Section A, 53(2), 549-567.
Freeman, D., Pugh, K., Antley, A., Slater, M., Bebbington, P., Gittins, M., Dunn, G., Kuipers, E.,
Fowler, D., & Garety, P. (2008). Virtual reality study of paranoid thinking in the general
population. The British Journal of Psychiatry, 192(4), 258-263.
Freeman, D., Pugh, K., Vorontsova, N., Antley, A., & Slater, M. (2010). Testing the continuum of
delusional beliefs: an experimental study using virtual reality. Journal of Abnormal
Psychology, 119(1), 83.
Freeman, D., Slater, M., Bebbington, P. E., Garety, P. A., Kuipers, E., Fowler, D., Met, A., Read,
C., Jordan, J., & Vinayagamoorthy, V. (2003). Can virtual reality be used to investigate
persecutory ideation? The Journal of nervous and mental disease, 191(8), 509-514.
Freeman, D., Startup, H., Dunn, G., Černis, E., Wingham, G., Pugh, K., Cordwell, J., Mander, H., &
Kingdon, D. (2014). Understanding jumping to conclusions in patients with persecutory
delusions: working memory and intolerance of uncertainty. Psychological Medicine,
44(14), 3017-3024.
Frith, C. D., & Corcoran, R. (1996). Exploring ‘theory of mind’ in people with schizophrenia.
Psychological Medicine, 26(03), 521-530.
Garety, P., Joyce, E., Jolley, S., Emsley, R., Waller, H., Kuipers, E., Bebbington, P., Fowler, D.,
Dunn, G., & Freeman, D. (2013). Neuropsychological functioning and jumping to
conclusions in delusions. Schizophrenia Research, 150(2), 570-574.
Garety, P. A., & Freeman, D. (1999). Cognitive approaches to delusions: a critical review of
theories and evidence. British Journal of Clinical Psychology, 38(2), 113-154.
Glick, D. M., & Orsillo, S. M. (2011). Relationships among social anxiety, self-focused attention,
and experiential distress and avoidance. Journal of Cognitive & Behavioral
Psychotherapies, 11(1), 1-12.
129
Green, C. E. L., Freeman, D., Kuipers, E., Bebbington, P., Fowler, D., Dunn, G., & Garety, P. A.
(2008). Measuring ideas of persecution and social reference: the Green et al. Paranoid
Thought Scales (GPTS). Psychological Medicine, 38(01), 101-111. doi:
doi:10.1017/S0033291707001638
Hackmann, A., Clark, D. M., & McManus, F. (2000). Recurrent images and early memories in
social phobia. Behaviour Research and Therapy, 38(6), 601-610.
Haddock, G., McCarron, J., Tarrier, N., & Faragher, E. (1999). Scales to measure dimensions of
hallucinations and delusions: the psychotic symptom rating scales (PSYRATS).
Psychological Medicine, 29(04), 879-889.
Hardy, A. Computerised Interventions for Thinking and Anxiety in Delusions (CITADEL) Trial. In:
ClinicalTrials.gov [Internet]. Bethesda (MD): National Library of Medicine (US). 2000-
[cited 2016 Sept 17]. Available from: http://clinicaltrials.gov/show/NCT01920685 NLM
Identifier: NCT01920685.
Hayduk, L. A. (1983). Personal space: Where we now stand. Psychological bulletin, 94(2), 293.
Holzman, J. B., & Valentiner, D. P. (2016). Self-focused attention affects subsequent processing
of positive (but not negative) performance appraisals. Journal of behavior therapy and
experimental psychiatry, 50, 295-302.
Hope, D. A., Heimberg, R. G., & Klein, J. F. (1990). Social anxiety and the recall of interpersonal
information. Journal of Cognitive Psychotherapy, 4(2), 185-195.
Ingram, R. E. (1990). Self-focused attention in clinical disorders: review and a conceptual model.
Psychological bulletin, 107(2), 156.
Kaney, S., & Bentall, R. P. (1989). Persecutory delusions and attributional style. British Journal of
Medical Psychology, 62(2), 191-198.
Kendler, K. S., McGuire, M., Gruenberg, A. M., & Walsh, D. (1995). Schizotypal symptoms and
signs in the Roscommon Family Study: their factor structure and familial relationship
with psychotic and affective disorders. Archives of General Psychiatry, 52(4), 296-303.
130
Kendon, A. (1970). Movement coordination in social interaction: Some examples described.
Acta psychologica, 32, 101-125.
Kettle, J. W., O'Brien-Simpson, L., & Allen, N. B. (2008). Impaired theory of mind in first-episode
schizophrenia: comparison with community, university and depressed controls.
Schizophr Res, 99(1), 96-102.
Kettle, J. W. L., O'Brien-Simpson, L., & Allen, N. B. (2008). Impaired theory of mind in first-
episode schizophrenia: comparison with community, university and depressed
controls. Schizophrenia Research, 99(1–3), 96-102.
Kimble, C. E., & Zehr, H. D. (1982). Self-consciousness, information load, self-presentation, and
memory in a social situation. The Journal of Social Psychology, 118(1), 39-46.
Klinger, E., Bouchard, S., Légeron, P., Roy, S., Lauer, F., Chemin, I., & Nugues, P. (2005). Virtual
reality therapy versus cognitive behavior therapy for social phobia: A preliminary
controlled study. Cyberpsychology & behavior, 8(1), 76-88.
Konings, M., Bak, M., Hanssen, M., Van Os, J., & Krabbendam, L. (2006). Validity and reliability
of the CAPE: A self‐report instrument for the measurement of psychotic experiences in
the general population. Acta Psychiatrica Scandinavica, 114(1), 55-61.
Lawlor, C., Hall, K., & Ellett, L. (2015). Paranoia in the therapeutic relationship in cognitive
behavioural therapy for psychosis. Behavioural and cognitive psychotherapy, 43(04),
490-501.
Lecomte, T., Corbière, M., Ehmann, T., Addington, J., Abdel-Baki, A., & MacEwan, B. (2014).
Development and preliminary validation of the First Episode Social Functioning Scale
for early psychosis. Psychiatry Research, 216(3), 412-417.
Lincoln, T., Peter, N., Schäfer, M., & Moritz, S. (2009). Impact of stress on paranoia: an
experimental investigation of moderators and mediators. Psychological Medicine,
39(07), 1129-1139.
131
Lincoln, T. M., Lange, J., Burau, J., Exner, C., & Moritz, S. (2010). The effect of state anxiety on
paranoid ideation and jumping to conclusions. An experimental investigation.
Schizophrenia Bulletin, 36(6), 1140-1148.
Lincoln, T. M., Mehl, S., Exner, C., Lindenmeyer, J., & Rief, W. (2010). Attributional Style and
Persecutory Delusions. Evidence for an Event Independent and State Specific External-
Personal Attribution Bias for Social Situations. Cognitive Therapy and Research, 34(3),
297-302. doi: 10.1007/s10608-009-9284-4
Lunt, L., Bramham, J., Morris, R. G., Bullock, P. R., Selway, R. P., Xenitidis, K., & David, A. S.
(2012). Prefrontal cortex dysfunction and ‘Jumping to Conclusions’: Bias or deficit?
Journal of neuropsychology, 6(1), 65-78.
Lürling, M., Waajen, G., & van Oosterhout, F. (2014). Humic substances interfere with
phosphate removal by lanthanum modified clay in controlling eutrophication. Water
research, 54, 78-88.
Lysaker, P. H., Salvatore, G., Grant, M. L., Procacci, M., Olesek, K. L., Buck, K. D., Giuseppe, N., &
Dimaggio, G. (2010). Deficits in theory of mind and social anxiety as independent paths
to paranoid features in schizophrenia. Schizophrenia Research, 124(1), 81-85.
Mattick, R. P., & Clarke, J. C. (1998). Development and validation of measures of social phobia
scrutiny fear and social interaction anxiety. Behaviour Research and Therapy, 36(4),
455-470.
McKay, R., Langdon, R., & Coltheart, M. (2005). Paranoia, persecutory delusions and
attributional biases. Psychiatry Research, 136(2), 233-245.
Mehl, S., Rief, W., Lüllmann, E., Ziegler, M., Kesting, M.-L., & Lincoln, T. M. (2010). Are theory of
mind deficits in understanding intentions of others associated with persecutory
delusions? The Journal of nervous and mental disease, 198(7), 516-519.
Michail, M., & Birchwood, M. (2009). Social anxiety disorder in first-episode psychosis:
incidence, phenomenology and relationship with paranoia. The British Journal of
Psychiatry, 195(3), 234-241.
132
Nakagawa, S. (2004). A farewell to Bonferroni: the problems of low statistical power and
publication bias. Behavioral Ecology, 15(6), 1044-1045.
Neuchterlein, K. H., Dawson, M. E., Ventura, J., Miklowitz, D., & Konishi, G. (1991). 9.
Information-processing anomalies in the early course of schizophrenia and bipolar
disorder. Schizophr Res, 5(3), 195-196.
Pallanti, S., Quercioli, L., & Hollander, E. (2004). Social anxiety in outpatients with schizophrenia:
a relevant cause of disability. American Journal of Psychiatry.
Panayiotou, G., & Vrana, S. R. (1998). Effect of self-focused attention on the startle reflex, heart
rate, and memory performance among socially anxious and nonanxious individuals.
Psychophysiology, 35(03), 328-336.
Perneger, T. V. (1998). What's wrong with Bonferroni adjustments. British Medical Journal, 316
(7139), 1236-1238.
Peters, L. (2000). Discriminant validity of the social phobia and anxiety inventory (SPAI), the
social phobia scale (SPS) and the social interaction anxiety scale (SIAS). Behaviour
Research and Therapy, 38(9), 943-950.
Power, M., Champion, L., & Aris, S. (1988). The development of a measure of social support: the
Significant Others (SOS) Scale. British Journal of Clinical Psychology, 27(4), 349-358.
Rempel, J. K., Holmes, J. G., & Zanna, M. P. (1985). Trust in close relationships. Journal of
Personality and Social Psychology, 49(1), 95.
Rietdijk, J., van Os, J., Graaf, R. d., Delespaul, P., & Gaag, M. v. d. (2009). Are social phobia and
paranoia related, and which comes first? Psychosis, 1(1), 29-38. doi:
10.1080/17522430802654105
Rinck, M., Rörtgen, T., Lange, W.-G., Dotsch, R., Wigboldus, D. H., & Becker, E. S. (2010). Social
anxiety predicts avoidance behaviour in virtual encounters. Cognition and Emotion,
24(7), 1269-1276.
Russell, D. W. (1996). UCLA Loneliness Scale (Version 3): Reliability, validity, and factor
structure. Journal of personality assessment, 66(1), 20-40.
133
Schoretsanitis, G., Kutynia, A., Stegmayer, K., Strik, W., & Walther, S. (2016). Keep at bay!–
Abnormal personal space regulation as marker of paranoia in schizophrenia. European
Psychiatry, 31, 1-7.
Siris, S., Pollack, S., Bermanzohn, P., & Stronger, R. (2000). Adjunctive imipramine for a broader
group of post-psychotic depressions in schizophrenia. Schizophr Res, 44(3), 187-192.
Slater, M., Steed, A., McCarthy, J., & Maringelli, F. (1998). The Virtual Ante-Room: Assessing
Presence Through Expectation and Surprise, Virtual Environments' 98. Paper presented
at the Eurographics Workshop Proceedsings Series, eds M. Goebel, U. Lang, J. Lanauer,
M. Wapler.
Sprong, M., Schothorst, P., Vos, E., Hox, J., & Van Engeland, H. (2007). Theory of mind in
schizophrenia meta-analysis. The British Journal of Psychiatry, 191(1), 5-13.
Spurr, J. M., & Stopa, L. (2002). Self-focused attention in social phobia and social anxiety.
Clinical Psychology Review, 22(7), 947-975.
Valmaggia, L. R., Freeman, D., Green, C., Garety, P., Swapp, D., Antley, A., Prescott, C., Fowler,
D., Kuipers, E., Bebbington, P., Slater, M., Broome, M., & McGuire, P. (2007). Virtual
reality and paranoid ideations in people with an ‘at-risk mental state’ for psychosis. The
British Journal of Psychiatry, 191(51), 63-68.
van Baaren, R. B., Decety, J., Dijksterhuis, A., van der Leij, A., & van Leeuwen, M. L. (2009). Being
imitated: consequences of nonconsciously showing empathy. The social neuroscience
of empathy, 31-42.
Van Os, J., Linscott, R. J., Myin-Germeys, I., Delespaul, P., & Krabbendam, L. (2009). A systematic
review and meta-analysis of the psychosis continuum: evidence for a psychosis
proneness–persistence–impairment model of psychotic disorder. Psychological
Medicine, 39(02), 179-195.
Veling, W., Pot-Kolder, R., Counotte, J., van Os, J., & van der Gaag, M. (2016). Environmental
Social Stress, Paranoia and Psychosis Liability: A Virtual Reality Study. Schizophrenia
Bulletin, sbw031.
134
Voges, M., & Addington, J. (2005). The association between social anxiety and social functioning
in first episode psychosis. Schizophrenia Research, 76(2), 287-292.
Vrijsen, J. N., Lange, W.-G., Dotsch, R., Wigboldus, D. H., & Rinck, M. (2010). How do socially
anxious women evaluate mimicry? A virtual reality study. Cognition and Emotion, 24(5),
840-847.
Watson, D., Clark, L. A., & Tellegen, A. (1988). Development and validation of brief measures of
positive and negative affect: the PANAS scales. Journal of Personality and Social
Psychology, 54(6), 1063.
Webber, M. P., & Huxley, P. J. (2007). Measuring access to social capital: The validity and
reliability of the Resource Generator-UK and its association with common mental
disorder. Social Science & Medicine, 65(3), 481-492.
Wegner, D. M., & Giuliano, T. (1980). Arousal-induced attention to self. Journal of Personality
and Social Psychology, 38(5), 719.
Woody, S. R. (1996). Effects of focus of attention on anxiety levels and social performance of
individuals with social phobia. Journal of Abnormal Psychology, 105(1), 61-69.
Woody, S. R., Chambless, D. L., & Glass, C. R. (1997). Self-focused attention in the treatment of
social phobia. Behaviour Research and Therapy, 35(2), 117-129.
Woody, S. R., & Rodriguez, B. F. (2000). Self-focused attention and social anxiety in social
phobics and normal controls. Cognitive Therapy and Research, 24(4), 473-488.
Yee, N., & Bailenson, J. (2007). The Proteus effect: The effect of transformed self‐representation
on behavior. Human communication research, 33(3), 271-290.

135
Part 3: Critical Appraisal
136
1. Introduction
This critical appraisal will review observations made during the processes of this research,
both in the empirical study and in conducting the systematic review. The appraisal will also
incorporate personal reflections. Firstly, it will consider observations of potential biases
that exist in clinical literature, particularly those relevant to the dissemination of clinical
research. Secondly, the benefits and challenges of recruiting from clinical populations are
explored. Reflections are made about the positive impact of involving service users in
research. Further reflections explore the impact recruitment challenges may have on
encouraging research with clinical populations and thus the development of clinical
knowledge. Finally, the concept of statistical power is considered. The possible restrictions
that more orthodox methods of statistics may have on developing our knowledge of
‘harder to reach’ populations are explored.
2. A reflection on biases in clinical research
My pre-training research experience had been in contributing to the cognitive model of
persecutory delusions (Freeman et al., 2002). As a result, I was dedicated to pursuing a
doctoral thesis project that investigated mechanisms of paranoia and involved researching
a clinical population. Having been given the opportunity to do this, I noticed from early on
in the research process that my personal experience had created a bias in my wish to
investigate paranoia within the context of the aforementioned cognitive model. Despite a
more open-minded approach to my clinical practice, I became aware that in research I was
perhaps more wedded to a particular model than I should be. I observed that even with the
insight of having this potential bias, it was at times difficult to remove myself from the wish
to provide evidence for a model I had previously been invested in. This led to an overall
reflection about the biases that can arise in clinical psychology, even with the best
intentions to remain neutral.
137
The process of conducting a systematic literature review evoked particular
reflections on publication bias. Publication bias is originally defined as the selective
publishing of studies with a particularly outcome, usually favouring significant results over
those accepting a null hypothesis. In mental health research, particular focus has been
given to selective publication of positive outcomes in clinical trials investigating the efficacy
of anti-depressants (Robinson, 2008; Turner, Matthews, Linardatos, Tell & Rosenthal,
2008). Whilst this research highlighted the potential for corruption of research due to the
economic incentives of pharmaceutical companies, it also indicated that publication biases
throughout mental health research may be distorting scientific and public knowledge about
the mechanisms and treatment of clinical conditions (Rothstein, Sutton & Borenstein,
2005).
Further conceptualisation of publication biases highlights numerous potential
mechanisms of information suppression beyond the original definition. These include
language bias (selective inclusion of studies published in English); familiarity bias (selective
inclusion of studies from one’s own discipline) and outcome bias (selective reporting of
some outcomes but not others in clinical studies) (Rothstein, Sutton & Borenstein, 2005).
The broader term of ‘dissemination bias’ has been suggested to encapsulate all of these
potential biases (Song et al., 2010). Holding these biases in mind, as well as potential
personal biases, proved useful when conducting the systematic literature review.
A clear observation from the literature review was the dominance of a particular
research group in clinical trials of psychological treatments impacting on paranoia. The
original intent of the literature review was to only be a meta-analysis. However, it was clear
from conducting preliminary literature searches to form the research question that a meta-
analysis in isolation would limit the broader picture of treatments for paranoia. Yet, even
with a wider synthesis, a dissemination bias towards this research group continued to exist.
This promoted a reflection on the impact of research resources and the narrative in clinical
138
research that the gold standard of randomised controlled trails (RCTs) overshadows
smaller-scale research in the same field. It would seem that larger research groups have the
resources to conduct larger scale research with methodology (e.g. multi-site RCTs) that is
viewed as superior to other studies (e.g. pilots and case-studies) by authors who do not
have access to the same resources, particularly financial. Whilst RCTs included in the
literature review predominantly used unbiased methodology e.g. blinding, preplanned
analysis etc., there remains a clear potential for the suppression of research of other
therapeutic interventions for paranoia.
This observation drew a number of parallels with the experience of recruiting a
clinical sample for the current empirical study. Whilst the importance of conducting
research on clinical populations, particularly those considered ‘hard to reach’, is clear,
there were many challenges involved in recruiting from a population of individuals with
psychosis and paranoia within a NHS setting.
3. The highs and lows of conducting research with clinical populations
3.1. The need to engage clinical populations in experimental research
The benefits of conducting research in clinical populations are clear. As was reflected in
parts of the empirical study and literature review, there are only so many conclusions that
can be drawn from investigating non-clinical samples with sub-clinical threshold symptoms.
There are many factors both within and beyond mental health diagnoses that can be
specific to individuals from a clinical population, such as cognitive deficits associated with
schizophrenia (Heinrichs, Walter, Zakzanis & Konstantine, 1998), the experience and impact
of societal stigma (Corrigan, Druss & Perlick, 2014) and an increased likelihood of having
experience childhood adversity or trauma (e.g. Edwards, Holden, Felitti & Anda, 2003). The
conclusions drawn in both the systematic review and empirical study of this thesis suggest
that there are psychological factors which are exclusive to persecutory delusions. Whilst
139
such conclusions in no way disregard the hypothesis of a continuum of paranoia (e.g.
Chapman & Chapman, 1980; Claridge, 1997; van Os et al., 2009), they call for greater
empirical research on the understanding of the similarities and differences between sub-
clinical and clinical paranoia. This, of course, requires recruiting from a clinical population.
3.2. The barriers to recruiting clinical participants
Problems with recruitment in psychiatric populations are well documented, both
anecdotally and in the literature (Patel, Doku & Tennakoon, 2003). They have been shown
to disrupt schedules for research projects, preoccupy staff, reduce the ability to detect
therapeutic differences and can result in a trial being abandoned (Ashery & McAuliffe,
1992). Furthermore, factors such as non-response and selection biases can mean that
eligible participants entering studies influence the validity of the representativeness of the
clinical population being studied (Woods, Ziedonis, Sernyak, Diaz & Rosenheck, 2000;
Hulley, Cummings, Browner, Grady & Newman, 2001). This is principally based on the
concept that those who do not respond after being contacted are different from people
who do participate. Armstrong et al. (1992) explored characteristics associated with poor
response rate in clinical populations and found that some main factors adversely affecting
response rates were: older age, male gender, non-Caucasian ethnicity, urban residence,
unemployment or low education/occupation status, low family income, smoker and high
use of medical care. Perhaps with some exceptions, these characteristics capture a
significant proportion of individuals with psychosis (Castle & Murray, 1991; Marwaha &
Johnson, 2004; Ruhrmann et al., 2010; Sundquist, Frank & Sundquist, 2004).
However, from the experience of conducting the current research, there were a
number of challenges and barriers to recruitment that were not directly related to the
service users themselves. In the early stages of the study, ethical and NHS Research and
Development (R&D) approval, for obvious and appropriate reasons, was a lengthy
procedure that required specific restrictions on recruitment strategies. Participants could
140
only be recruited from Early Intervention in Psychosis services (EIS) pre-named in the
ethical application. Experience from a previous role as a research assistant had highlighted
the critical importance of engaging service team members. It was similarly apparent for the
current project that recruitment hinged on the engagement of service team members in
approaching their service users to suggest the research to them. Furthermore, it became
clear that the presence of the researchers in the clinical teams was an important factor in
the number of referrals received. This highlighted a critical learning point in conducting
research: efforts to engage health care professions in clinical research are as important as
engaging the service users. Furthermore, engagement of either takes time - time that is not
always available to health care professionals attempting to conduct research whilst also
balancing clinical caseloads.
Two distinct barriers in engaging health care professionals became apparent.
Recent re-structuring of many EIS teams has seen dramatic increases in the caseloads, and
therefore workloads, of care coordinators (Belling et al., 2011). Although efforts were made
on the researchers’ behalf to minimise any work required of care coordinators to aid
recruitment, it was clear that holding our research in mind and approaching service users
was burdensome for many health care professionals. In addition, differences were
experienced in care coordinators perceptions of the usefulness of research.
Understandably, those who viewed research as less integral to clinical care were less
inclined to refer service uses or encourage their clients to engage in the research. A greater
presence of the researchers in the teams enabled a greater alliance to be formed with
team members. This alliance became helpful in combatting negative views about research
in certain team members and thus improved recruitment. However, time constraints for
the project and the researchers meant resources to fully engage many of the EIS teams
were not possible, highlighting the time resources necessary to reach recruitment targets
in quantitative research in clinical populations.
141
Many clinical research trials employ junior researchers to undertake recruitment in
order to meet necessary targets for statistical power (Dowling & Weiner, 1997). However,
this is not a widely available option for many clinical psychologists wishing to conduct
research in clinical populations. Without these resources, researchers can run the risk of
under-recruitment and therefore under-powered findings. This then impacts upon the
acceptability and generalisability of conclusions and the wider dissemination of knowledge
within clinical psychology (e.g. publications). It is barriers such as these that stand to
potentially discourage researchers from attempting to conduct research in clinical
populations unless they have the resources more commonly seen in larger, well-establish
research groups. This arguably contributes to dissemination biases and impoverished
knowledge, particularly in populations considered “hard-to-reach”.
3.3. The benefits of recruiting clinical populations
As previously discussed, it is important to investigate the continuum of psychological
phenomena and whether there are distinct features of clinical conditions that set
individuals who suffer from these conditions apart from non-clinical populations. However,
there are other benefits of recruiting from clinical populations that were experienced
during this research that warrant specific reflections.
As the researcher, I was overwhelmed by the enthusiasm and effort participants
showed to take part in our research. Some travelled for over an hour and were quite
insistent that they did not wish to be paid for participation; the opportunity to try virtual
reality was incentive enough. Others informed us that they very rarely left the house or
socialised with others, but were motivated to be involved in something that might not only
help them but would also help other people who use mental health services. Some also
used the experiment as a space to talk about current serious difficulties that we were able
to feed back to the care coordinators and promote more support for that individual during
a time of need. Overall, my sense as a researcher during the experiments was that engaging
142
this clinical population was providing them with an opportunity to do something ‘out of the
ordinary’ and altruistic – something that was clearly meaningful to them.
There is some research that explores the importance of people with mental health
difficulties having the opportunity to help others. The helper-therapy principle (Reissman,
1965; 1990) proposes; assuming an individual has a worthwhile contribution to make, a
greater sense of self-efficacy and capability can be promoted. Furthermore, the theory
suggests that when individuals are put in an active role, rather than a passive recipient role
they can: impact on wellbeing (Mead & Copeland, 2000), combat feelings of dependence,
engender a sense of status in an individual, and encourage a greater sense of positive self-
identity (Reissman, 1990; Salzer & Shear, 2002; Skovholt, 1974). This feels particularly
relevant in a group of individuals who can experience some of the more severe forms of
stigma amongst mental health difficulties (Brohan, Elgie, Sartorius & Thornicroft, 2010).
Engagement in activities of value in young people with psychosis has also been found to
have a positive impact on their wellbeing (Lal et al., 2013). Qualitative analysis found the
key factors which made activities meaningful were a sense of making a contribution,
expressing thoughts and emotions and additionally, connecting and belonging.
For numerous reasons, research might not be an enjoyable or meaningful activity
for all individuals with psychosis or, indeed, other mental health conditions. However, my
experience of conducting research with individuals that are perhaps more difficult to
engage is that, selection biases aside, the majority of individuals from clinical populations
who take part will enjoy the process. Furthermore, this did not feel like a narrative that was
shared by the healthcare professionals. Many were reluctant to approach their clients to
suggest the research, assuming it would be burdensome, distressing or disinteresting for
the person. In order to amend the common consensus amongst researchers and clinicians
that recruiting from clinical populations has many challenges; a step should be taken in
clinical psychology to understand the dynamics of these difficulties from three key
143
perspectives: the participants, the referring clinicians and the researchers. It may well be
that there are misunderstandings and miscommunications than can be reduced or avoided
in the future. With hope, a greater understanding of the benefits and barriers of engaging
clinical populations in research will improve recruitment and therefore increase the
likelihood and frequency of clinical research from many, independent researchers.
4. The issue of power – Baseyian vs Orthodox statistics in ‘hard to reach’
populations
Whether recruiting from a non-clinical or clinical population, the importance of achieving a
sample size with enough power to reliably detect an effect becomes a prominent, if not
overwhelming, concern in a researcher’s mind. The emphasis on achieving power in a
sample is largely driven by the logic of orthodox statistics, as developed by Jerzy Neyman
and Egon Pearson in the 1930s. Orthodox statistics primarily function from the assumption
that probabilities are long-run relative frequencies (Dienes, 2008), which in turn require an
indefinitely large series of events that constitutes as a ‘collective’ (von Mises, 1957). These
collectives are often populations (e.g. gender, culture, specified clinical diagnosis) that can
be used to predict the likelihood that an observed event (e.g. a study’s finding) would occur
in that collective and in comparison to other collectives (e.g. a non-clinical population),
thus allowing for the accepting or rejection of a null hypothesis. It is an incredibly useful
mathematical and theoretical application that strengthens the certainty with which we can
understand and treat psychological phenomena.
In orthodox statistics, the concept of statistical power proposes that with prior
knowledge of the effect size of an observable phenomenon and defined parameters to
reduce type I and type II error (α and β), a researcher can determine the sample size
needed to reliably reject the null hypothesis in the event of statistically significant results
(Ellet, 2010). Reflections on this process during the empirical research began to pose
questions about whether an emphasis on statistical power becomes overly restrictive when
144
researching ‘hard to reach’ populations or when exploring hypotheses with little prior
research from which to estimate an effect size. Arguably, if one cannot know the a priori
effect size or whether it exists in a relatively unknown ‘collective’, one cannot accurately
assume the sample size calculation is correct. This then places an arbitrary restriction on
the interpretation of findings.
Bayesian statistics suggest a slightly different approach can be taken within
quantitative research which minimizes the importance of power. Barker, Pistrang & Elliott
(2016) remark than the there is some merit in the application of Bayesian thought in clinical
psychology research as it proposes that any data is useful and that small-N studies should
not be avoided. However, Bayesian theories also concede that the larger the sample size,
the more the study will add to prior knowledge (Dienes, 2011; 2014; Edwards, Lilford,
Braunholtz & Jackson, 1997). Whilst both Bayesian and Orthodox statistics have their
merits and limitations, the latter is a far more widely accepted approach in clinical
psychology. This poses the question of how much research defined as underpowered has
either gone unpublished or received minimal attention in literature, despite it plausibly
adding to valuable knowledge. Furthermore, a fixation on statistical power is arguably
limiting our knowledge of ‘harder-to-reach’ clinical or societal populations. This could be
compounding the difficulties and discouragements faced by researchers attempting to
recruit from these populations, contributing to a wider dissemination bias in clinical
psychology.
145
References
Armstrong, B. K., White, E. & Saracci, R. (1992). Principles of Exposure Measurement in
Epidemiology. Oxford: Oxford University Press.
Ashery, R. S., & McAuliffe, W. E. (1992). Implementation issues and techniques in randomized
trials of outpatient psychosocial treatments for drug abusers: recruitment of subjects.
The American journal of drug and alcohol abuse, 18(3), 305-329.
Barker, C., Pistrang, N., & Elliott, R. (2016). Research Methods in Clinical Psychology: An
Introduction for Students and Practitioners, Third Edition. Chichester: John Wiley &
Sons. doi: 10.1002/9781119154082.ch1
Belling, R., Whittock, M., McLaren, S., Burns, T., Catty, J., Jones, I. Rose, D., & Wykes, T. (2011).
Achieving continuity of care: facilitators and barriers in community mental health
teams. Implementation Science, 6(1), doi: 10.1186/1748-5908-6-23
Brohan, E., Elgie, R., Sartorius, N., & Thornicroft, G. (2010). Self-stigma, empowerment and
perceived discrimination among people with schizophrenia in 14 European countries:
the GAMIAN-Europe study. Schizophrenia research, 122(1), 232-238.
Castle, D. J., & Murray, R. M. (1991). The neurodevelopmental basis of sex differences in
schizophrenia. Psychological medicine, 21(03), 565-575.
Chapman, L. J., & Chapman, J. P. (1980). Scales for Rating Psychotic and Psychotic-like
Experiences as Continua. Schizophrenia Bulletin, 6(3), 476-489.
Claridge, G. E. (1997). Schizotypy: Implications for illness and health. Oxford: Oxford University
Press.
Corrigan, P. W., Druss, B. G., & Perlick, D. A. (2014). The impact of mental illness stigma on
seeking and participating in mental health care. Psychological Science in the Public
Interest, 15(2), 37-70.
Dienes, Z. (2011). Bayesian versus orthodox statistics: Which side are you on?. Perspectives on
Psychological Science, 6(3), 274-290.
146
Dienes, Z. (2014). Using Bayes to get the most out of non-significant results. Frontiers in
psychology, 5, 781. doi: 10.3389/fpsyg.2014.00781
Dowling, G. A., & Wiener, C. L. (1997). Roadblocks encountered in recruiting patients for a study
of sleep disruption in Alzheimer's disease. Image: The Journal of Nursing Scholarship,
29(1), 59-64.
Edwards, V. J., Holden, G. W., Felitti, V. J., & Anda, R. F. (2003). Relationship between multiple
forms of childhood maltreatment and adult mental health in community respondents:
results from the adverse childhood experiences study. American Journal of Psychiatry,
160(8), 1453-1460.
Edwards, S. J. L., Lilford, R. J., Braunholtz, D., & Jackson, J. (1997). Why “underpowered” trials
are not necessarily unethical. The Lancet, 350(9080), 804-807.
Freeman, D., Garety, P. A., Kuipers, E., Fowler, D., & Bebbington, P. E. (2002). A cognitive model
of persecutory delusions. British Journal of Clinical Psychology, 41(4), 331-347.
Heinrichs, R. W., & Zakzanis, K. K. (1998). Neurocognitive deficit in schizophrenia: a quantitative
review of the evidence. Neuropsychology, 12(3), 426-445.
Hulley, S. B., Cimmings, S. R., Browner, W. S., Grady, D., & Newman, T. (2001). Designing Clinical
Research. An Epidemiologic Approach (2nd Ed.). London: Lippincott Williams and
Wilkins.
Lal, S., Ungar, M., Leggo, C., Malla, A., Frankish, J., & Suto, M. J. (2013). Well-being and
engagement in valued activities: Experiences of young people with psychosis. OTJR:
occupation, participation and health, 33(4), 190-197.
Marwaha, S., & Johnson, S. (2004). Schizophrenia and employment. Social psychiatry and
psychiatric epidemiology, 39(5), 337-349.
Patel, M. X., Doku, V., & Tennakoon, L. (2003). Challenges in recruitment of research
participants. Advances in Psychiatric Treatment, 9(3), 229-238.
Reissman, F. (1965). The “helper” therapy principle. Social Work, 10, 27–32.
147
Reissman, F. (1990). Restructuring help: a human services paradigm for the 1990s. American
Journal of Community Psychology, 18, 221–230
Robinson, D. S. (2008). Evidence-based medicine and publication bias. Primary psychiatry, 15(8),
30-33.
Rothstein, H. R., Sutton, A. J., & Borenstein, M. (Eds.). (2006). Publication bias in meta-analysis:
Prevention, assessment and adjustments. Chichester: John Wiley & Sons.
Ruhrmann, S., Schultze-Lutter, F., Salokangas, R. K., Heinimaa, M., Linszen, D., Dingemans, P.,
Birchwood, M., Patterson, P., Juckel, G., Heinz, A., Morrison, A., Lewis, S., Graf von
Reventlow, H., & Klosterkötter, J. (2010). Prediction of psychosis in adolescents and
young adults at high risk: results from the prospective European prediction of psychosis
study. Archives of general psychiatry, 67(3), 241-251.
Salzer, M. S., & Shear, S. L. (2002). Identifying consumer-provider benefits in evaluations of
consumer-delivered services. Psychiatric rehabilitation journal, 25(3), 281.
Skovholt, T. M. (1974). The client as helper: A means to promote psychological growth. The
Counseling Psychologist, 4(3), 58-64.
Song, F., Parekh, S., Hooper, L., Loke, Y. K., Ryder, J., Sutton, A. J., Hing, C., Kwok, C., Pang, C., &
Harvey, I. (2010). Dissemination and publication of research findings: an updated
review of related biases. Health Technology Assessment, 14(8), 1-193.
Sundquist, K., Frank, G., & Sundquist, J. (2004). Urbanisation and incidence of psychosis and
depression. The British Journal of Psychiatry, 184(4), 293-298.
Turner, E. H., Matthews, A. M., Linardatos, E., Tell, R. A., & Rosenthal, R. (2008). Selective
publication of antidepressant trials and its influence on apparent efficacy. New England
Journal of Medicine, 358(3), 252-260.
Van Os, J., Linscott, R. J., Myin-Germeys, I., Delespaul, P., & Krabbendam, L. (2009). A systematic
review and meta-analysis of the psychosis continuum: evidence for a psychosis
148
proneness–persistence–impairment model of psychotic disorder. Psychological
Medicine, 39(02), 179-195.
von Mises, R. (1957). Probability, statistics and truth. London: Macmillan.
Woods, S. W., Ziedonis, D. M., Sernyak, M. J., Diaz, E., & Rosenheck, R. A. (2000). Characteristics
of participants and nonparticipants in medication trials for treatment of schizophrenia.
Psychiatric services, 51(1), 79-84.

149
Appendices

150
Appendix 1: Quality Rating Scale (Yates et al., 2005)
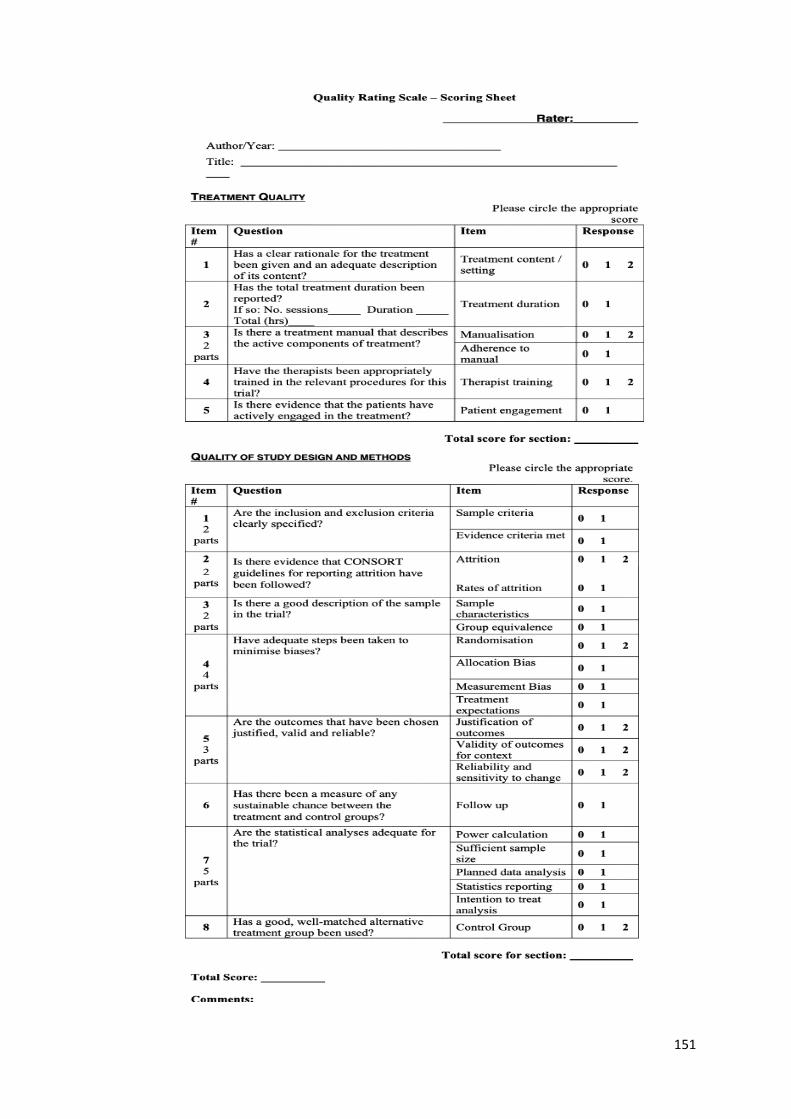
151

152
Appendix 2: Table of individual item quality rating scores for included
studies
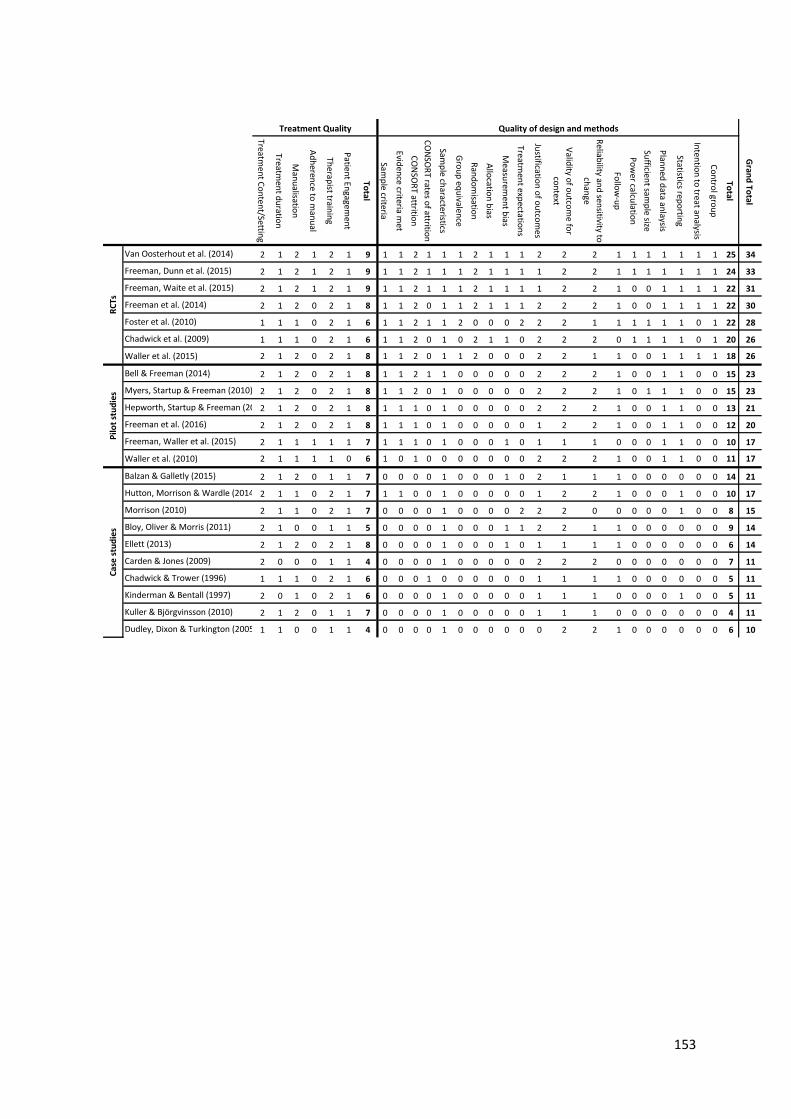
153
Treatmen
t Co
nten
t/Setting
Treatmen
t du
ration
Man
ualisatio
n
Ad
heren
ce to m
anu
al
Therap
ist trainin
g
Patien
t Engagem
ent
Total
Samp
le criteria
Eviden
ce criteria met
CO
NSO
RT attritio
n
CO
NSO
RT rates o
f attrition
Samp
le characteristics
Gro
up
equ
ivalence
Ran
do
misatio
n
Allo
cation
bias
Measu
remen
t bias
Treatmen
t expectatio
ns
Justificatio
n o
f ou
tcom
es
Valid
ity of o
utco
me fo
r
con
text
Reliab
ility and
sensitivity to
chan
ge
Follo
w-u
p
Po
wer calcu
lation
Sufficien
t samp
le size
Plan
ned
data an
laysis
Statistics repo
rting
Inten
tion
to treat an
alysis
Co
ntro
l grou
p
Total
Van Oosterhout et al. (2014) 2 1 2 1 2 1 9 1 1 2 1 1 1 2 1 1 1 2 2 2 1 1 1 1 1 1 1 25 34
Freeman, Dunn et al. (2015) 2 1 2 1 2 1 9 1 1 2 1 1 1 2 1 1 1 1 2 2 1 1 1 1 1 1 1 24 33
Freeman, Waite et al. (2015) 2 1 2 1 2 1 9 1 1 2 1 1 1 2 1 1 1 1 2 2 1 0 0 1 1 1 1 22 31
Freeman et al. (2014) 2 1 2 0 2 1 8 1 1 2 0 1 1 2 1 1 1 2 2 2 1 0 0 1 1 1 1 22 30
Foster et al. (2010) 1 1 1 0 2 1 6 1 1 2 1 1 2 0 0 0 2 2 2 1 1 1 1 1 1 0 1 22 28
Chadwick et al. (2009) 1 1 1 0 2 1 6 1 1 2 0 1 0 2 1 1 0 2 2 2 0 1 1 1 1 0 1 20 26
Waller et al. (2015) 2 1 2 0 2 1 8 1 1 2 0 1 1 2 0 0 0 2 2 1 1 0 0 1 1 1 1 18 26
Bell & Freeman (2014) 2 1 2 0 2 1 8 1 1 2 1 1 0 0 0 0 0 2 2 2 1 0 0 1 1 0 0 15 23
Myers, Startup & Freeman (2010) 2 1 2 0 2 1 8 1 1 2 0 1 0 0 0 0 0 2 2 2 1 0 1 1 1 0 0 15 23
Hepworth, Startup & Freeman (2011)2 1 2 0 2 1 8 1 1 1 0 1 0 0 0 0 0 2 2 2 1 0 0 1 1 0 0 13 21
Freeman et al. (2016) 2 1 2 0 2 1 8 1 1 1 0 1 0 0 0 0 0 1 2 2 1 0 0 1 1 0 0 12 20
Freeman, Waller et al. (2015) 2 1 1 1 1 1 7 1 1 1 0 1 0 0 0 1 0 1 1 1 0 0 0 1 1 0 0 10 17
Waller et al. (2010) 2 1 1 1 1 0 6 1 0 1 0 0 0 0 0 0 0 2 2 2 1 0 0 1 1 0 0 11 17
Balzan & Galletly (2015) 2 1 2 0 1 1 7 0 0 0 0 1 0 0 0 1 0 2 1 1 1 0 0 0 0 0 0 14 21
Hutton, Morrison & Wardle (2014) 2 1 1 0 2 1 7 1 1 0 0 1 0 0 0 0 0 1 2 2 1 0 0 0 1 0 0 10 17
Morrison (2010) 2 1 1 0 2 1 7 0 0 0 0 1 0 0 0 0 2 2 2 0 0 0 0 0 1 0 0 8 15
Bloy, Oliver & Morris (2011) 2 1 0 0 1 1 5 0 0 0 0 1 0 0 0 1 1 2 2 1 1 0 0 0 0 0 0 9 14
Ellett (2013) 2 1 2 0 2 1 8 0 0 0 0 1 0 0 0 1 0 1 1 1 1 0 0 0 0 0 0 6 14
Carden & Jones (2009) 2 0 0 0 1 1 4 0 0 0 0 1 0 0 0 0 0 2 2 2 0 0 0 0 0 0 0 7 11
Chadwick & Trower (1996) 1 1 1 0 2 1 6 0 0 0 1 0 0 0 0 0 0 1 1 1 1 0 0 0 0 0 0 5 11
Kinderman & Bentall (1997) 2 0 1 0 2 1 6 0 0 0 0 1 0 0 0 0 0 1 1 1 0 0 0 0 1 0 0 5 11
Kuller & Björgvinsson (2010) 2 1 2 0 1 1 7 0 0 0 0 1 0 0 0 0 0 1 1 1 0 0 0 0 0 0 0 4 11
Dudley, Dixon & Turkington (2005) 1 1 0 0 1 1 4 0 0 0 0 1 0 0 0 0 0 0 2 2 1 0 0 0 0 0 0 6 10
Gran
d To
tal
Quality of design and methodsTreatment Quality
RC
TsP
ilot
stu
die
sC
ase
stu
die
s

154
Appendix 3: Summary of Joint Project and Each Researcher’s Contribution
155
The virtual reality paradigm was developed and used in a previous doctoral thesis
project by Dr Maikke Elenbaas, submitted in 2013. The two researchers on this joint
thesis project were Gail Wingham (author) and Hannah Reidy, both supervised by Dr
Miriam Fornells-Ambrojo and Professor Chris Barker. The current author’s project
focused on virtual reality feasibility and contingency manipulation (two conditions:
high vs low contingency) and self-focused attention in the development of trust in
paranoia. The joint researcher (HR) focused on the impact of social capital and social
connectedness in the development of trust in paranoia, treating the high and low
contingency conditions as one condition.
In designing the experiment, researchers independently selected measures that
were related to their separate experimental hypotheses. The only measures shared
by the researchers in their independent projects were the objective measure of trust
(distance kept from avatar), Sense of Presence questionnaire (Slater et al., 1998) and
attention checks (Elenbass, 2014; Fornells-Ambrojo et al., 2016). The semi-structure
interview and debrief was designed by both researchers but there was no overlap of
the data used from this measure in the separate empirical papers. The order of the
experiment measures and procedures was collaborative decided upon by both
researchers.
Both researchers collective designed all project documents, including information
sheets, consent forms and posters. Ethical and R&D approval was also a joint effort
between the researchers.
For recruitment, researchers each targeted two Early Intervention in Psychosis (EIS)
teams in order to promote the research study and gain referrals from as wider scope
as possible. Screening of referrals was largely shared between researchers, or
dictated by prior engagement with a care coordinator or service-user. Researchers
shared the responsibility of escorting participants to and from the testing location
when needed and jointly conducted each experiment.
Each empirical paper was written independent by the respective authors.

156
Appendix 4: Ethical Approval
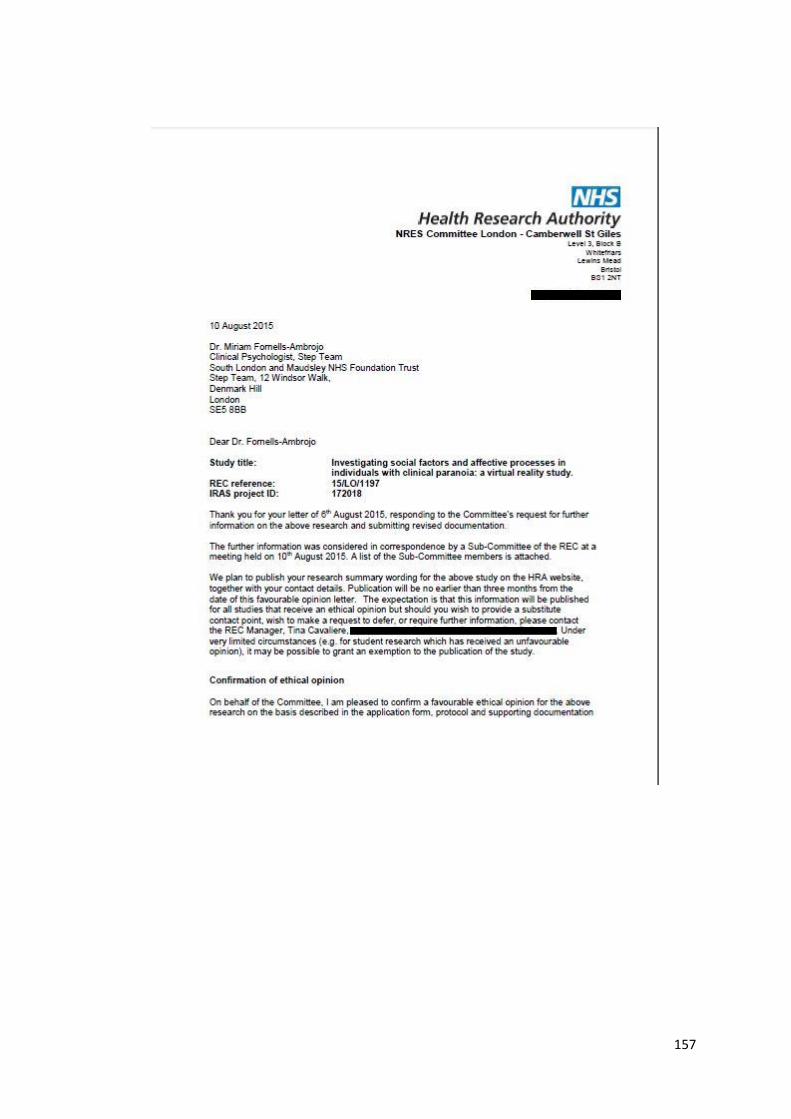
157
158
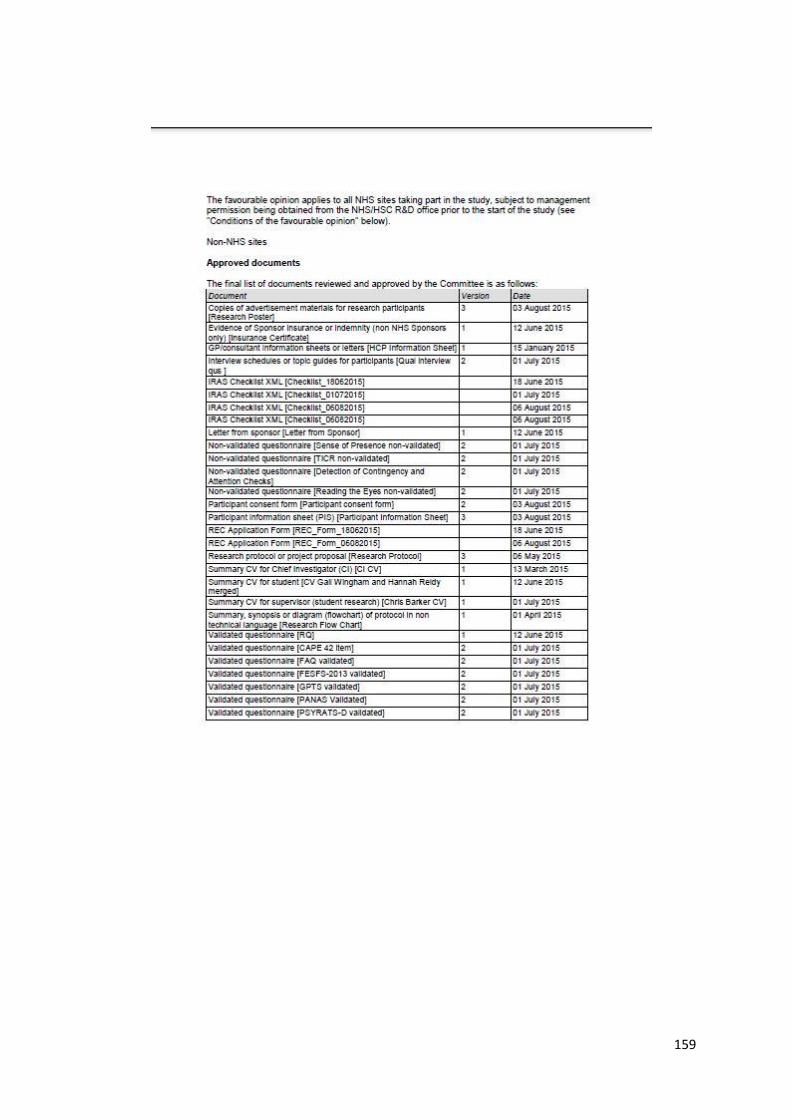
159
160
161
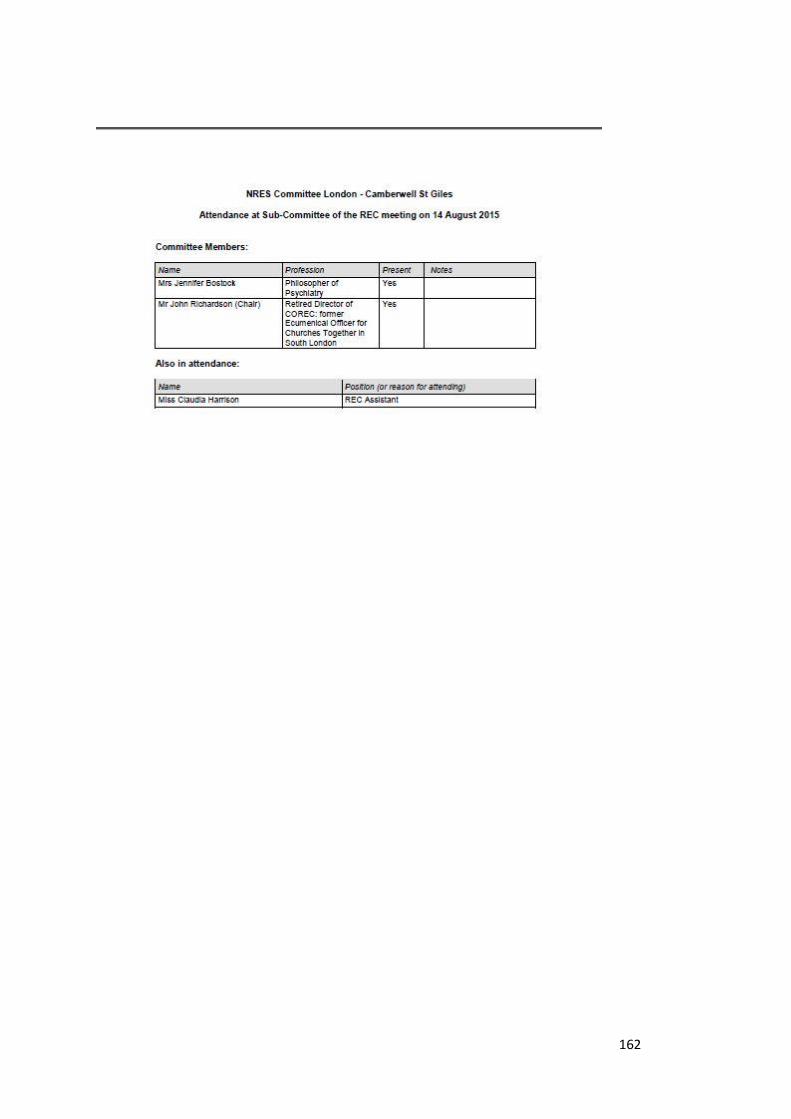
162

163
Appendix 5: Participant Information Sheet
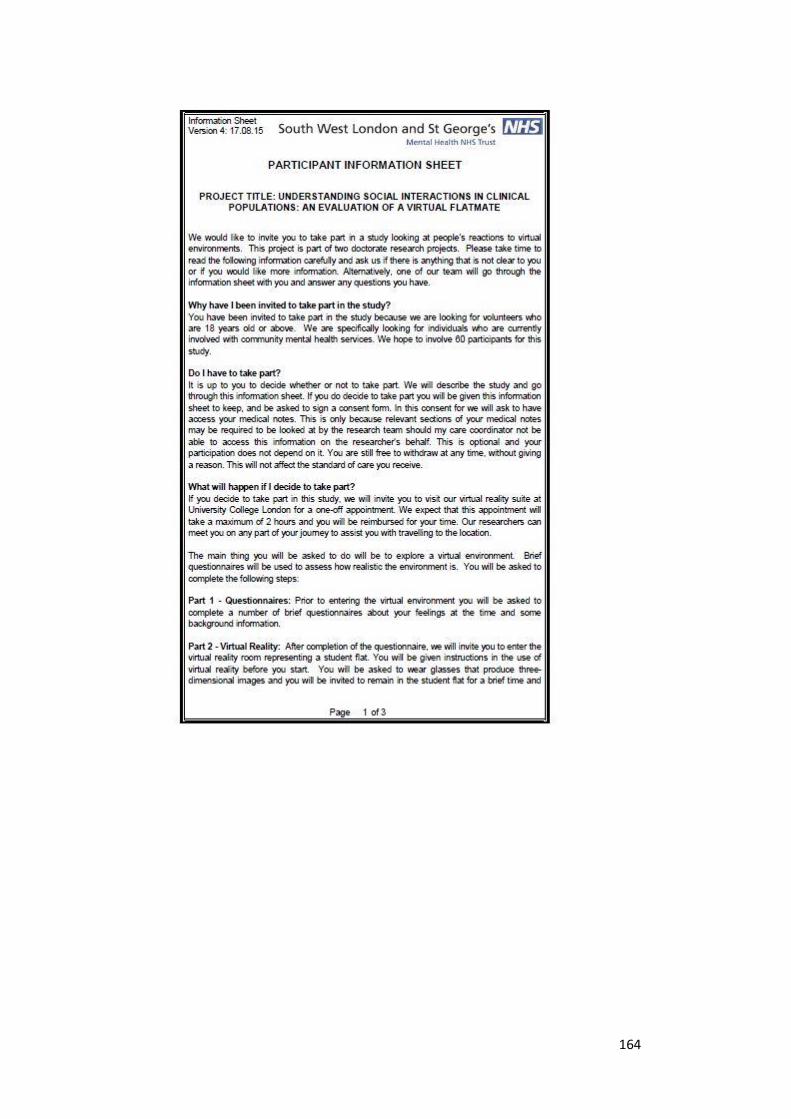
164
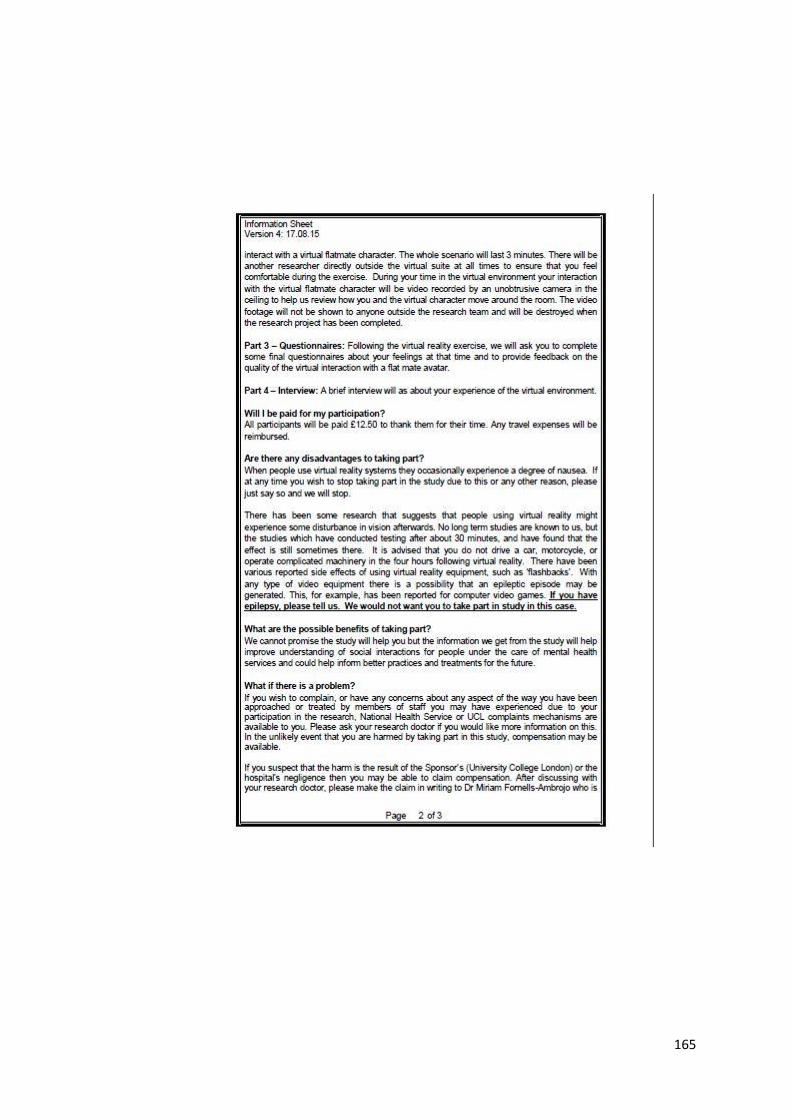
165
166

167
Appendix 6: Participant Consent Form
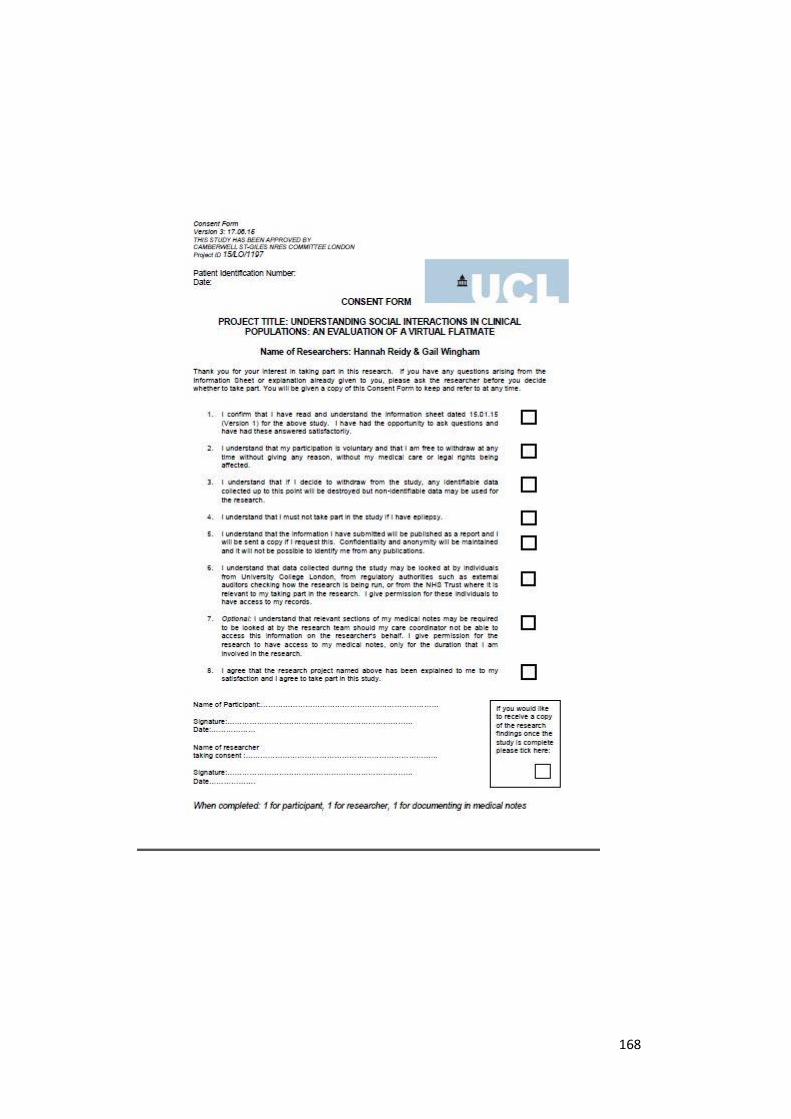
168

169
Appendix 7: Green et al. Paranoid Thoughts Scale
(Green et al., 2008)

170
Version 2 01.07.15
GPTS
Participant no: Instructions: Please read each of the statements carefully. They refer to thoughts and feelings you may have had about others over the last month. Think about the last month and indicate the extent of these feelings from 1 (Not at all) to 5 (Totally). Please complete both Part A and Part B. (N.B. Please do not rate items according to any experiences you may have had under the influence of drugs.)
Part A
Statement Not at all
Somewhat
Extremely
1. I spent time thinking about friends gossiping about me
1 2 3 4 5
2. I often heard people referring to me 1 2 3 4 5
3. I have been upset by friends and colleagues judging me critically
1 2 3 4 5
4. People definitely laughed at me behind my back
1 2 3 4 5
5. I have been thinking a lot about people avoiding me
1 2 3 4 5
6. People have been dropping hints for me 1 2 3 4 5
7. I believed that certain people were not what they seemed
1 2 3 4 5
8. People talking about me behind my back upset me
1 2 3 4 5
9. I was convinced that people were singling me out
1 2 3 4 5
10. I was certain that people have followed me
1 2 3 4 5
11. Certain people were hostile towards me personally
1 2 3 4 5
12. People have been checking up on me 1 2 3 4 5
13. I was stressed out by people watching me
1 2 3 4 5
14. I was frustrated by people laughing at me
1 2 3 4 5
15. I was worried by people’s undue interest in me
1 2 3 4 5
16. It was hard to stop thinking about people talking about me behind my back
1 2 3 4 5
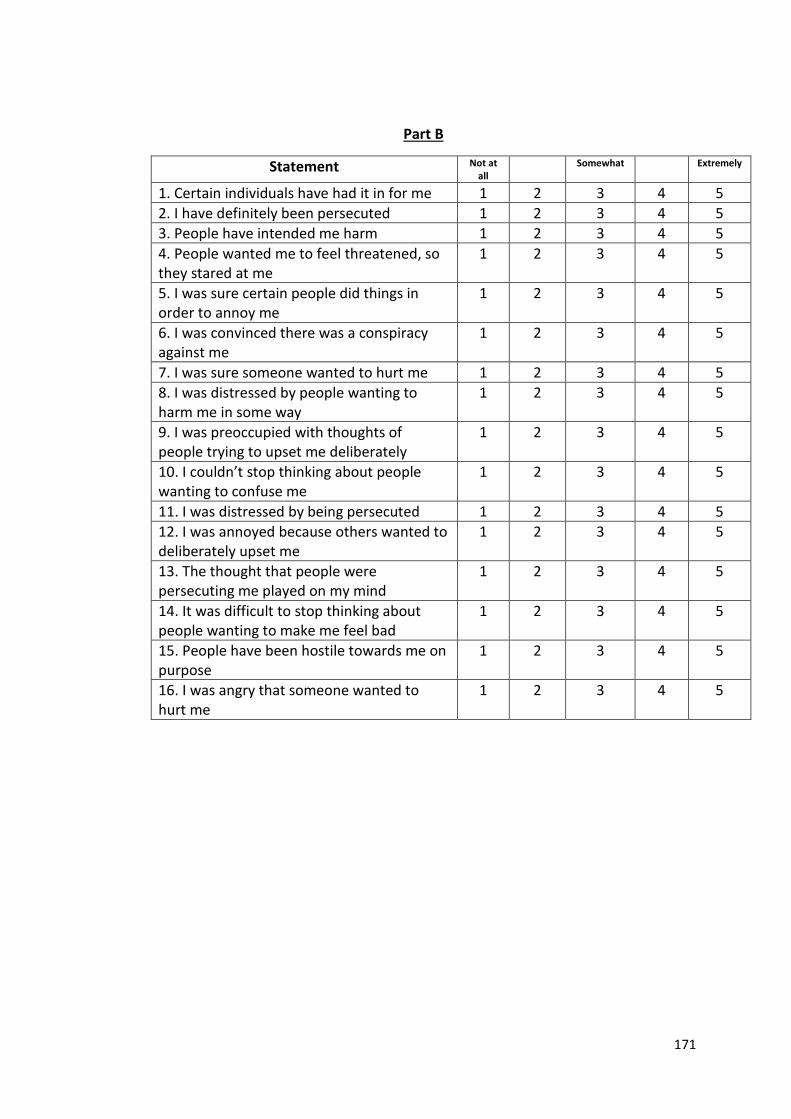
171
Part B
Statement Not at all
Somewhat
Extremely
1. Certain individuals have had it in for me 1 2 3 4 5
2. I have definitely been persecuted 1 2 3 4 5
3. People have intended me harm 1 2 3 4 5
4. People wanted me to feel threatened, so they stared at me
1 2 3 4 5
5. I was sure certain people did things in order to annoy me
1 2 3 4 5
6. I was convinced there was a conspiracy against me
1 2 3 4 5
7. I was sure someone wanted to hurt me 1 2 3 4 5
8. I was distressed by people wanting to harm me in some way
1 2 3 4 5
9. I was preoccupied with thoughts of people trying to upset me deliberately
1 2 3 4 5
10. I couldn’t stop thinking about people wanting to confuse me
1 2 3 4 5
11. I was distressed by being persecuted 1 2 3 4 5
12. I was annoyed because others wanted to deliberately upset me
1 2 3 4 5
13. The thought that people were persecuting me played on my mind
1 2 3 4 5
14. It was difficult to stop thinking about people wanting to make me feel bad
1 2 3 4 5
15. People have been hostile towards me on purpose
1 2 3 4 5
16. I was angry that someone wanted to hurt me
1 2 3 4 5

172
Appendix 8: Prompt sheet for virtual reality scenario

173
1. What do you like about flat
sharing?
2. How do you choose flatmates?
3. What makes a good flatmate?
4. What’s the best thing about this
flat?

174
Appendix 9: Full script of conversation with avatar

175
A=Avatar
P=Participant
A: Hi my name is Mark thanks for coming. What’s your name?”
P: (Tells avatar their name)
A: Thanks, OK I’m ready!
P: What do you like about flat sharing?
A: I enjoy meeting new people... I have made new friends this way...its great getting
to know them, have a laugh... mhm... and it helps to keep the cost of living low so
you can live in a better area!
P: What do you ask potential flatmates before going ahead?
A: Well, I always meet them in person and get a sense of what they are like... I ask
them what they are looking for in a shared flat, what is a typical day like for them,
what music they like, if they smoke, if they are lazy about house chores... mhm.. If
they like having friends around ... Oh, yeah it is also good to ask them what has
been their best and worse experience of flat sharing!
P: In your experience... who makes a great flatmate?
A: Mhm... good question... don’t know... I’m trying to think ....someone how is
easygoing, friendly and fun but who also can give you space... It is also good to
have something in common with them, like love for sport, or music...It’s hard to
answer because I think it really depends on the person... I’ve got on with people
who were completely different from me, sometimes it just works.
P: What is the best thing about your flat?
A: The terrace and the view! Come and have a look! (moves to the window)
A: It’s amazing to have all this outside space, in the summer we practically live
outside! We have great BBQs....
(Phone rings – avatar answers and speaks discreetly on the phone)
A: Hello? Okay..yeah I can be there!okay bye.
A: Oh, sorry but I need to go now... anyway thank you for coming and maybe we
can continue the interview some other time?
P: (Answers)
SCENARIO ENDS

176
Appendix 10: The Psychotic Symptoms Rating Scale – Delusions
(PSYRATS-D; Haddock et al., 1999)
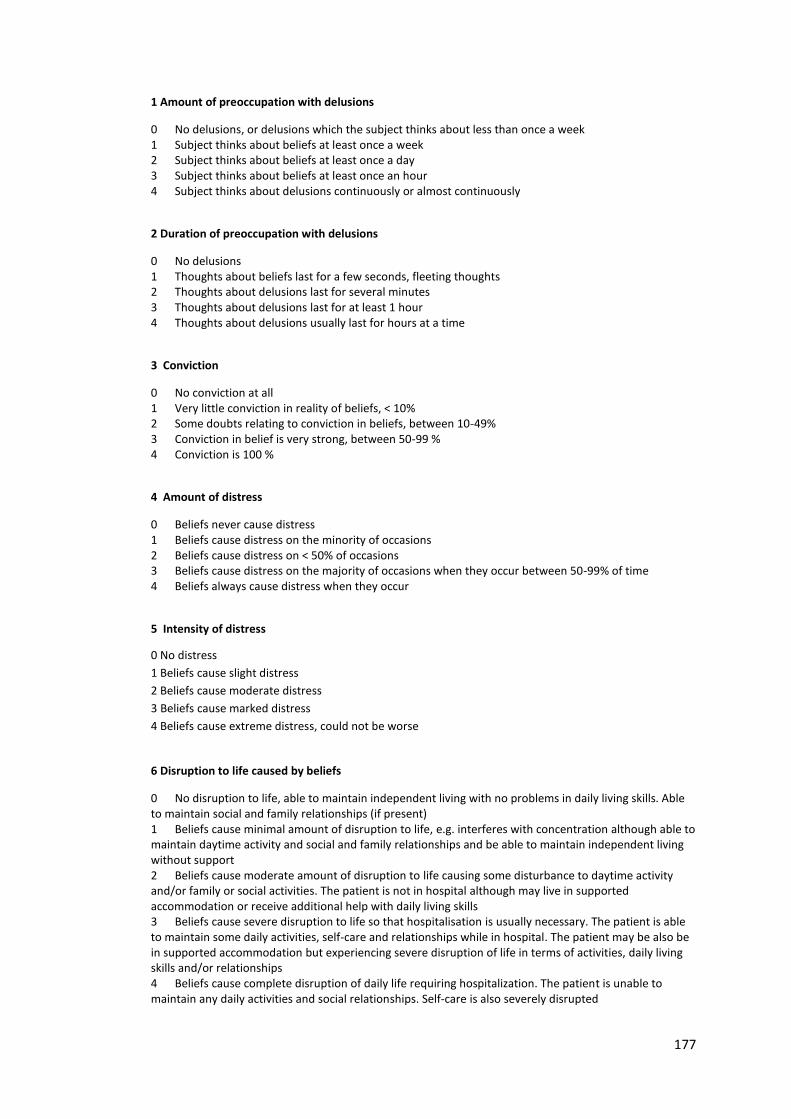
177
1 Amount of preoccupation with delusions
0 No delusions, or delusions which the subject thinks about less than once a week 1 Subject thinks about beliefs at least once a week 2 Subject thinks about beliefs at least once a day 3 Subject thinks about beliefs at least once an hour 4 Subject thinks about delusions continuously or almost continuously
2 Duration of preoccupation with delusions
0 No delusions 1 Thoughts about beliefs last for a few seconds, fleeting thoughts 2 Thoughts about delusions last for several minutes 3 Thoughts about delusions last for at least 1 hour 4 Thoughts about delusions usually last for hours at a time
3 Conviction
0 No conviction at all 1 Very little conviction in reality of beliefs, < 10% 2 Some doubts relating to conviction in beliefs, between 10-49% 3 Conviction in belief is very strong, between 50-99 % 4 Conviction is 100 %
4 Amount of distress
0 Beliefs never cause distress 1 Beliefs cause distress on the minority of occasions 2 Beliefs cause distress on < 50% of occasions 3 Beliefs cause distress on the majority of occasions when they occur between 50-99% of time 4 Beliefs always cause distress when they occur
5 Intensity of distress
0 No distress
1 Beliefs cause slight distress
2 Beliefs cause moderate distress
3 Beliefs cause marked distress
4 Beliefs cause extreme distress, could not be worse
6 Disruption to life caused by beliefs
0 No disruption to life, able to maintain independent living with no problems in daily living skills. Able to maintain social and family relationships (if present) 1 Beliefs cause minimal amount of disruption to life, e.g. interferes with concentration although able to maintain daytime activity and social and family relationships and be able to maintain independent living without support 2 Beliefs cause moderate amount of disruption to life causing some disturbance to daytime activity and/or family or social activities. The patient is not in hospital although may live in supported accommodation or receive additional help with daily living skills 3 Beliefs cause severe disruption to life so that hospitalisation is usually necessary. The patient is able to maintain some daily activities, self-care and relationships while in hospital. The patient may be also be in supported accommodation but experiencing severe disruption of life in terms of activities, daily living skills and/or relationships 4 Beliefs cause complete disruption of daily life requiring hospitalization. The patient is unable to maintain any daily activities and social relationships. Self-care is also severely disrupted

178
Appendix 11: Social Interaction Anxiety Scale
(SIAS; Mattick & Clarke, 1998)
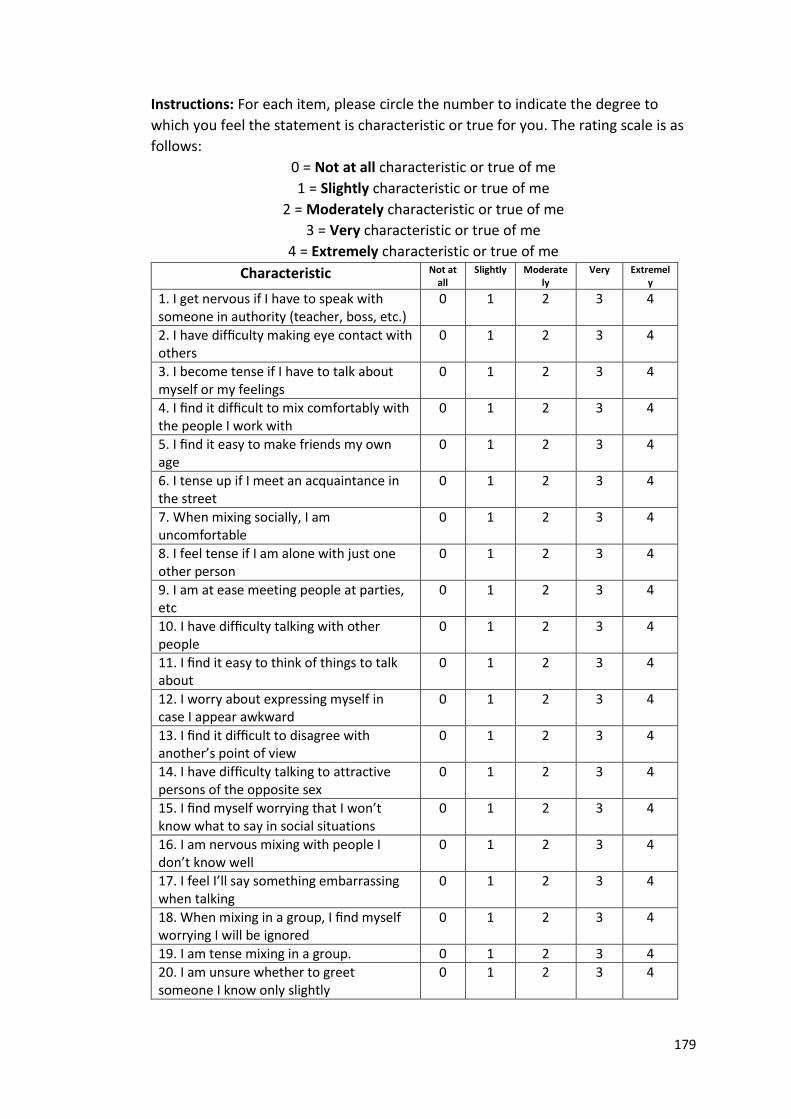
179
Instructions: For each item, please circle the number to indicate the degree to
which you feel the statement is characteristic or true for you. The rating scale is as
follows:
0 = Not at all characteristic or true of me
1 = Slightly characteristic or true of me
2 = Moderately characteristic or true of me
3 = Very characteristic or true of me
4 = Extremely characteristic or true of me
Characteristic Not at all
Slightly Moderately
Very Extremely
1. I get nervous if I have to speak with someone in authority (teacher, boss, etc.)
0 1 2 3 4
2. I have difficulty making eye contact with others
0 1 2 3 4
3. I become tense if I have to talk about myself or my feelings
0 1 2 3 4
4. I find it difficult to mix comfortably with the people I work with
0 1 2 3 4
5. I find it easy to make friends my own age
0 1 2 3 4
6. I tense up if I meet an acquaintance in the street
0 1 2 3 4
7. When mixing socially, I am uncomfortable
0 1 2 3 4
8. I feel tense if I am alone with just one other person
0 1 2 3 4
9. I am at ease meeting people at parties, etc
0 1 2 3 4
10. I have difficulty talking with other people
0 1 2 3 4
11. I find it easy to think of things to talk about
0 1 2 3 4
12. I worry about expressing myself in case I appear awkward
0 1 2 3 4
13. I find it difficult to disagree with another’s point of view
0 1 2 3 4
14. I have difficulty talking to attractive persons of the opposite sex
0 1 2 3 4
15. I find myself worrying that I won’t know what to say in social situations
0 1 2 3 4
16. I am nervous mixing with people I don’t know well
0 1 2 3 4
17. I feel I’ll say something embarrassing when talking
0 1 2 3 4
18. When mixing in a group, I find myself worrying I will be ignored
0 1 2 3 4
19. I am tense mixing in a group. 0 1 2 3 4
20. I am unsure whether to greet someone I know only slightly
0 1 2 3 4

180
Appendix 12: Subjective Measure of Trust
181
How TRUSTWORTHY did Mark come across?
Not at
all
Very
much
1 2 3 4 5 6 7

182
Appendix 13: Focus of Attention Questionnaire
(FAQ; Woody, 1996)
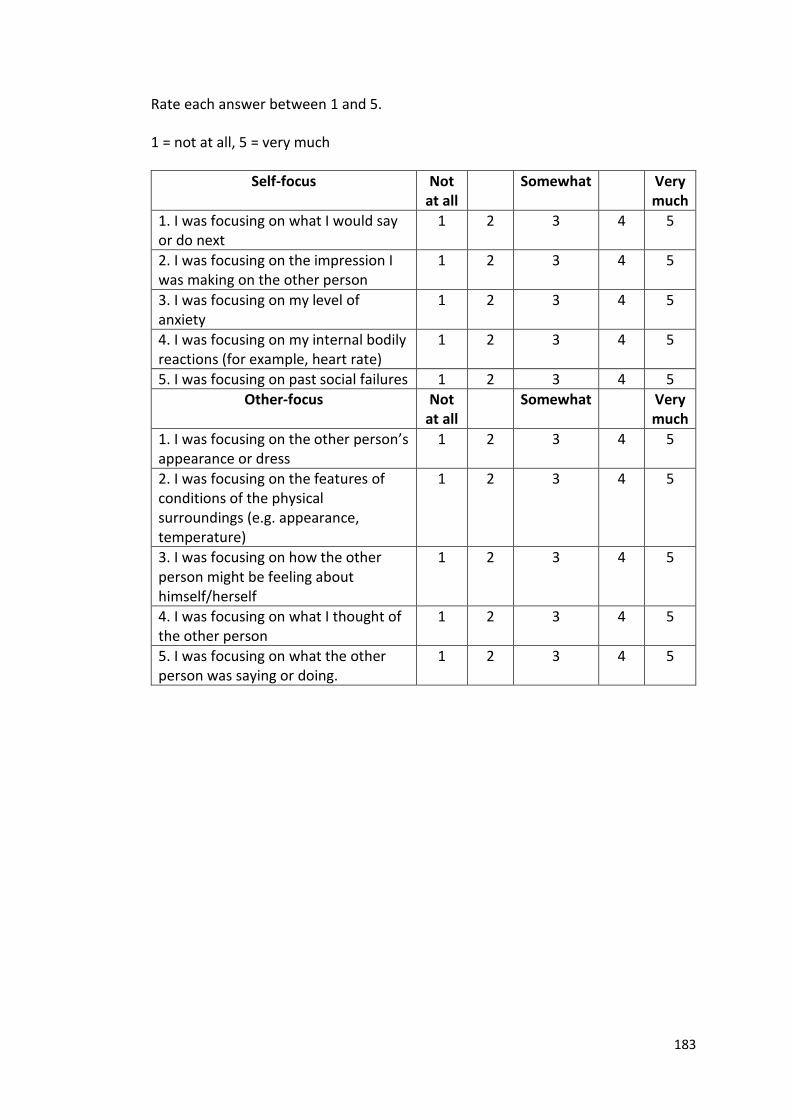
183
Rate each answer between 1 and 5.
1 = not at all, 5 = very much
Self-focus Not at all
Somewhat Very much
1. I was focusing on what I would say or do next
1 2 3 4 5
2. I was focusing on the impression I was making on the other person
1 2 3 4 5
3. I was focusing on my level of anxiety
1 2 3 4 5
4. I was focusing on my internal bodily reactions (for example, heart rate)
1 2 3 4 5
5. I was focusing on past social failures 1 2 3 4 5
Other-focus Not at all
Somewhat Very much
1. I was focusing on the other person’s appearance or dress
1 2 3 4 5
2. I was focusing on the features of conditions of the physical surroundings (e.g. appearance, temperature)
1 2 3 4 5
3. I was focusing on how the other person might be feeling about himself/herself
1 2 3 4 5
4. I was focusing on what I thought of the other person
1 2 3 4 5
5. I was focusing on what the other person was saying or doing.
1 2 3 4 5

184
Appendix 14: Detection of Contingency and Attention Checks
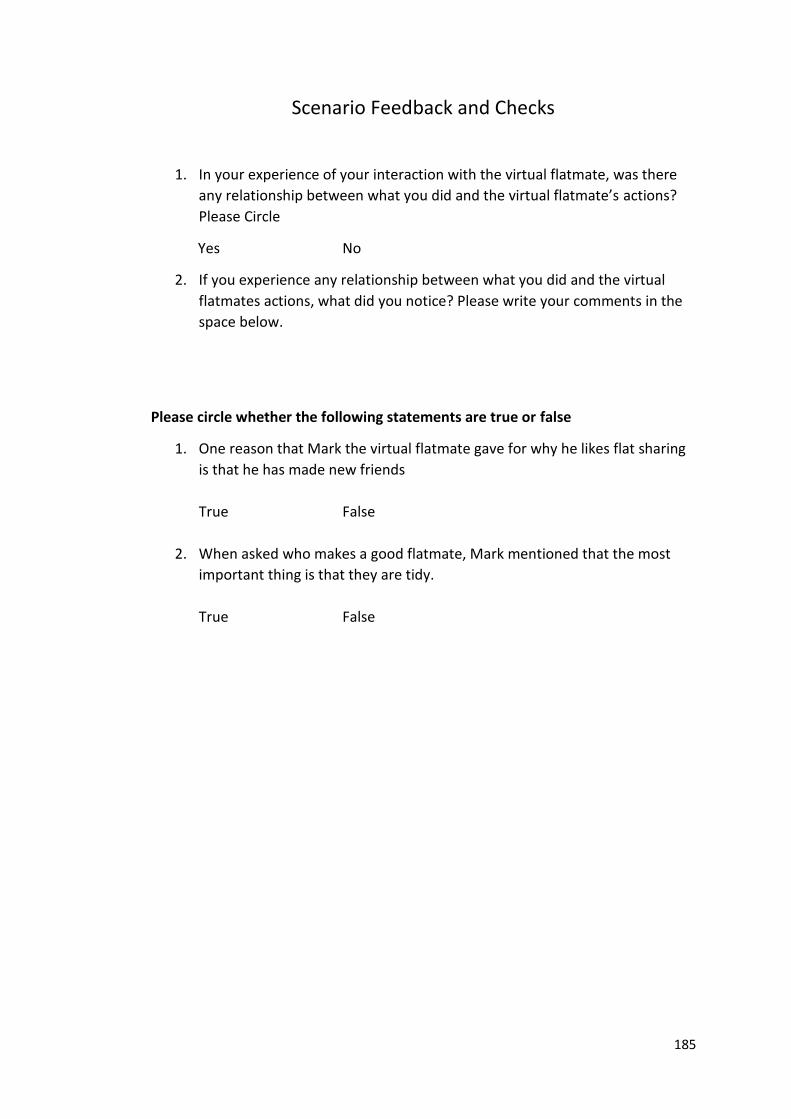
185
Scenario Feedback and Checks
1. In your experience of your interaction with the virtual flatmate, was there
any relationship between what you did and the virtual flatmate’s actions?
Please Circle
Yes No
2. If you experience any relationship between what you did and the virtual
flatmates actions, what did you notice? Please write your comments in the
space below.
Please circle whether the following statements are true or false
1. One reason that Mark the virtual flatmate gave for why he likes flat sharing
is that he has made new friends
True False
2. When asked who makes a good flatmate, Mark mentioned that the most
important thing is that they are tidy.
True False

186
Appendix 15: Sense of Presence Questionnaire
(Slater et al., 1998)
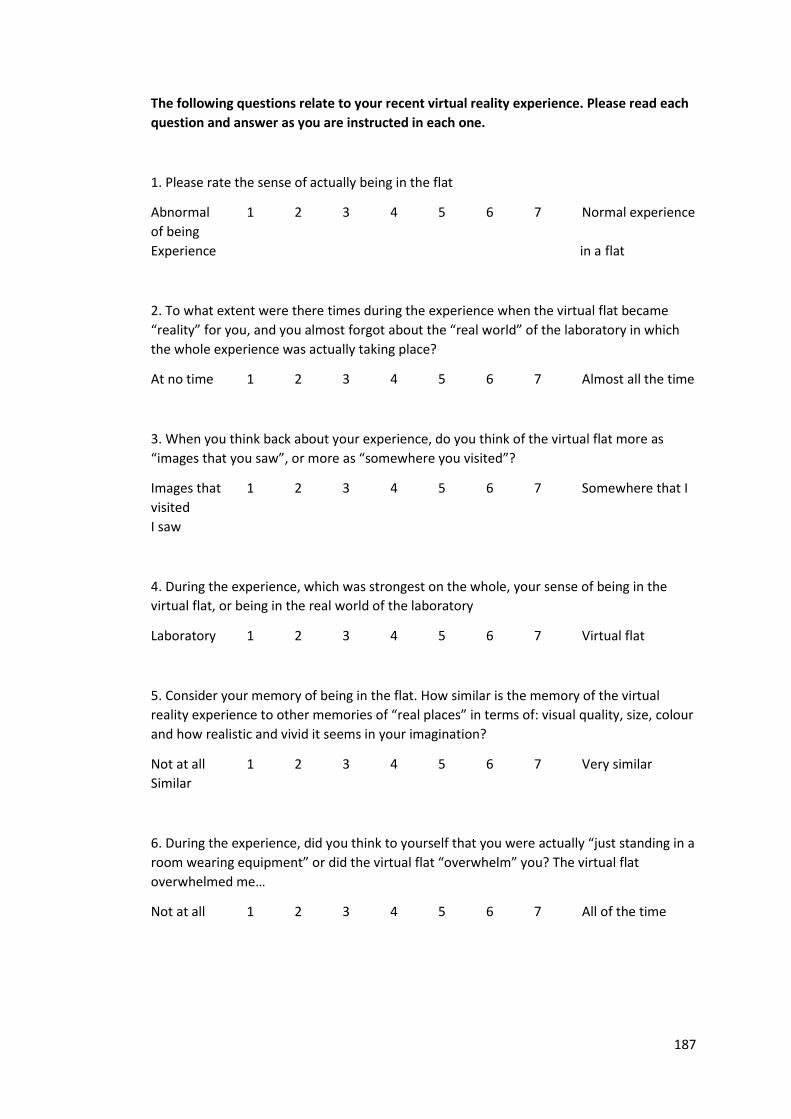
187
The following questions relate to your recent virtual reality experience. Please read each
question and answer as you are instructed in each one.
1. Please rate the sense of actually being in the flat
Abnormal 1 2 3 4 5 6 7 Normal experience
of being
Experience in a flat
2. To what extent were there times during the experience when the virtual flat became
“reality” for you, and you almost forgot about the “real world” of the laboratory in which
the whole experience was actually taking place?
At no time 1 2 3 4 5 6 7 Almost all the time
3. When you think back about your experience, do you think of the virtual flat more as
“images that you saw”, or more as “somewhere you visited”?
Images that 1 2 3 4 5 6 7 Somewhere that I
visited
I saw
4. During the experience, which was strongest on the whole, your sense of being in the
virtual flat, or being in the real world of the laboratory
Laboratory 1 2 3 4 5 6 7 Virtual flat
5. Consider your memory of being in the flat. How similar is the memory of the virtual
reality experience to other memories of “real places” in terms of: visual quality, size, colour
and how realistic and vivid it seems in your imagination?
Not at all 1 2 3 4 5 6 7 Very similar
Similar
6. During the experience, did you think to yourself that you were actually “just standing in a
room wearing equipment” or did the virtual flat “overwhelm” you? The virtual flat
overwhelmed me…
Not at all 1 2 3 4 5 6 7 All of the time

188
Appendix 16: Semi-Structured Qualitative Interview
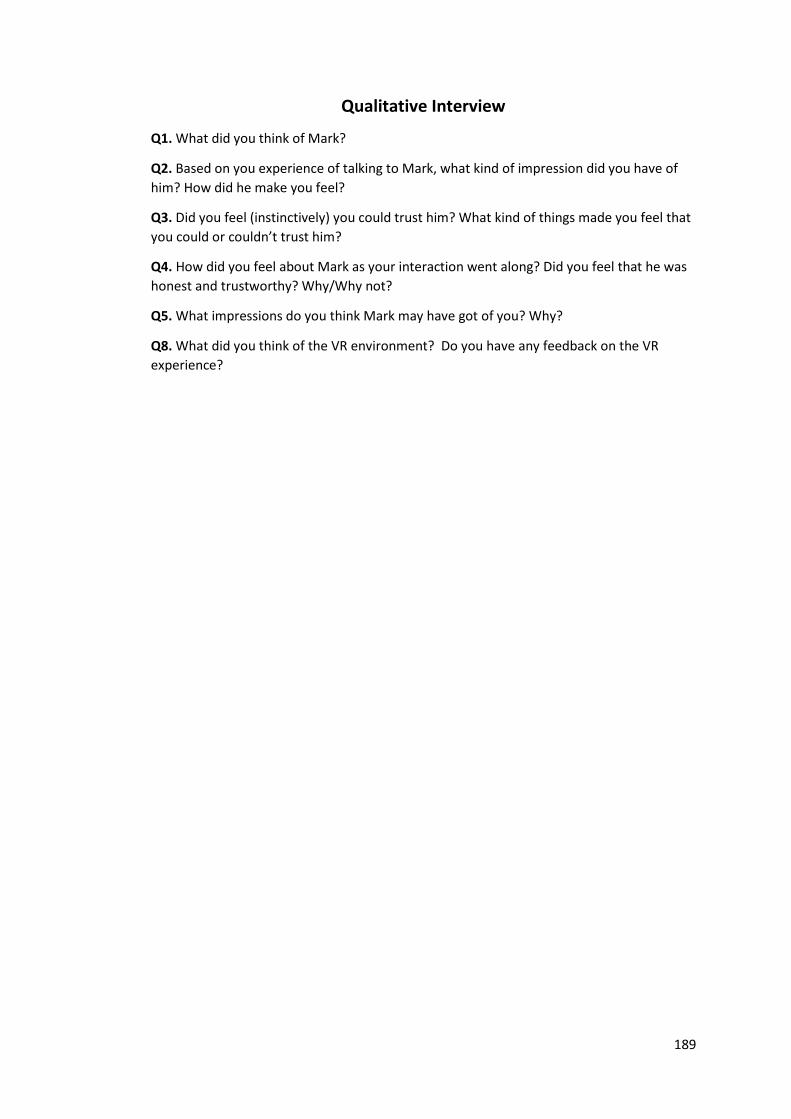
189
Qualitative Interview
Q1. What did you think of Mark?
Q2. Based on you experience of talking to Mark, what kind of impression did you have of
him? How did he make you feel?
Q3. Did you feel (instinctively) you could trust him? What kind of things made you feel that
you could or couldn’t trust him?
Q4. How did you feel about Mark as your interaction went along? Did you feel that he was
honest and trustworthy? Why/Why not?
Q5. What impressions do you think Mark may have got of you? Why?
Q8. What did you think of the VR environment? Do you have any feedback on the VR
experience?