Embed Size (px)
Citation preview

THE ROLE OF INTENSITY OF INTERVAL
TRAINING ON FAT OXIDATION AND
EATING BEHAVIOUR IN
OVERWEIGHT/OBESE MEN
Shaea Ayed Alkahtani, MSc.
Submitted in fulfilment of the requirements for the degree of
Doctor of Philosophy
Institute of Health and Biomedical Innovation
Faculty of Health
Queensland University of Technology
2012

Page i
Keywords
Appetite sensations; compensatory responses; eating behaviour; fat oxidation;
food intake; interval training; liking and wanting; obesity

Page ii
Abstract
The increasing prevalence of obesity in society has been associated with a
number of atherogenic risk factors such as insulin resistance. Aerobic training is often
recommended as a strategy to induce weight loss, with a greater impact of high-intensity
levels on cardiovascular function and insulin sensitivity, and a greater impact of
moderate-intensity levels on fat oxidation. Anaerobic high-intensity (supramaximal)
interval training has been advocated to improve cardiovascular function, insulin
sensitivity and fat oxidation. However, obese individuals tend to have a lower tolerance
of high-intensity exercise due to discomfort. Furthermore, some obese individuals may
compensate for the increased energy expenditure by eating more and/or becoming less
active. Recently, both moderate- and high-intensity aerobic interval training have been
advocated as alternative approaches. However, it is still uncertain as to which approach
is more effective in terms of increasing fat oxidation given the issues with levels of
fitness and motivation, and compensatory behaviours. Accordingly, the objectives of this
thesis were to compare the influence of moderate- and high-intensity interval training on
fat oxidation and eating behaviour in overweight/obese men.
Two exercise interventions were undertaken by 10-12 overweight/obese men to
compare their responses to study variables, including fat oxidation and eating behaviour
during moderate- and high-intensity interval training (MIIT and HIIT). The acute
training intervention was a methodological study designed to examine the validity of
using exercise intensity from the graded exercise test (GXT) - which measured the
intensity that elicits maximal fat oxidation (FATmax) - to prescribe interval training
during 30-min MIIT. The 30-min MIIT session involved 5-min repetitions of workloads
20% below and 20% above the FATmax. The acute intervention was extended to
involve HIIT in a cross-over design to compare the influence of MIIT and HIIT on
eating behaviour using subjective appetite sensation and food preference through the
liking and wanting test. The HIIT consisted of 15-sec interval training at 85 %VO2peak
interspersed by 15-sec unloaded recovery, with a total mechanical work equal to MIIT.
The medium term training intervention was a cross-over 4-week (12 sessions)
MIIT and HIIT exercise training with a 6-week detraining washout period. The MIIT
sessions consisted of 5-min cycling stages at ±20% of mechanical work at 45
%VO2peak, and the HIIT sessions consisted of repetitive 30-sec work at 90 %VO2peak
and 30-sec interval rests, during identical exercise sessions of between 30 and 45 mins.

Page iii
Assessments included a constant-load test (45 %VO2peak for 45 mins) followed by 60-
min recovery at baseline and the end of 4-week training, to determine fat oxidation rate.
Participants’ responses to exercise were measured using blood lactate (BLa), heart rate
(HR) and rating of perceived exertion (RPE) and were measured during the constant-
load test and in the first intervention training session of every week during training.
Eating behaviour responses were assessed by measuring subjective appetite sensations,
liking and wanting and ad libitum energy intake.
Results of the acute intervention showed that FATmax is a valid method to
estimate VO2 and BLa, but is not valid to estimate HR and RPE in the MIIT session.
While the average rate of fat oxidation during 30-min MIIT was comparable with the
rate of fat oxidation at FATmax (0.16 ±0.09 and 0.14 ±0.08 g/min, respectively), fat
oxidation was significantly higher at minute 25 of MIIT (P≤0.01). In addition, there was
no significant difference between MIIT and HIIT in the rate of appetite sensations after
exercise, but there was a tendency towards a lower rate of hunger after HIIT. Different
intensities of interval exercise also did not affect explicit liking or implicit wanting.
Results of the medium-term intervention indicated that current interval training
levels did not affect body composition, fasting insulin and fasting glucose. Maximal
aerobic capacity significantly increased (P≤0.01) (2.8 and 7.0% after MIIT and HIIT
respectively) during GXT, and fat oxidation significantly increased (P≤0.01) (96 and
43% after MIIT and HIIT respectively) during the acute constant-load exercise test. RPE
significantly decreased after HIIT greater than MIIT (P≤0.05), and the decrease in BLa
was greater during the constant-load test after HIIT than MIIT, but this difference did not
reach statistical significance (P=0.09). In addition, following constant-load exercise,
exercise-induced hunger and desire to eat decreased after HIIT greater than MIIT but
were not significant (p value for desire to eat was 0.07). Exercise-induced liking of high-
fat sweet (HFSW) and high-fat non-sweet (HFNS) foods increased after MIIT and
decreased after HIIT (p value for HFNS was 0.09). The intervention explained 12.4% of
the change in fat intake (p = 0.07).
This research is significant in that it confirmed two points in the acute study.
While the rate of fat oxidation increased during MIIT, the average rate of fat oxidation
during 30-min MIIT was comparable with the rate of fat oxidation at FATmax. In
addition, manipulating the intensity of acute interval exercise did not affect appetite
sensations and liking and wanting. In the medium-term intervention, constant-load

Page iv
exercise-induced fat oxidation significantly increased after interval training, independent
of exercise intensity. In addition, desire to eat, explicit liking for HFNS and fat intake
collectively confirmed that MIIT is accompanied by a greater compensation of eating
behaviour than HIIT.
Findings from this research will assist in developing exercise strategies to
provide obese men with various training options. In addition, the finding that
overweight/obese men expressed a lower RPE and decreased BLa after HIIT compared
with MIIT is contrary to the view that obese individuals may not tolerate high-intensity
interval training. Therefore, high-intensity interval training can be advocated among the
obese adult male population. Future studies may extend this work by using a longer-term
intervention.

Page v
Table of Contents
1 GENERAL INTRODUCTION ..................................................................................... 6
2 LITERATURE REVIEW ........................................................................................... 11
2.1 Introduction ................................................................................................................................ 11
2.2 Interval training .......................................................................................................................... 13 2.2.1 Classification of interval exercise ................................................................................... 13 2.2.2 Recovery interval ............................................................................................................ 15 2.2.3 Interval exercise among the obese .................................................................................. 17
2.3 The prescription of aerobic exercise training using GXT .......................................................... 20 2.3.1 Methods of exercise prescription using GXT ................................................................. 20 2.3.2 Responses of physiological parameters during GXT and exercise training, and their
limitations ....................................................................................................................... 22 2.3.3 Summary of methods of exercise prescription ................................................................ 30
2.4 Insulin sensitivity and exercise .................................................................................................. 31 2.4.1 Introduction of obesity and insulin resistance................................................................. 31 2.4.2 Relationship between fat oxidation, insulin sensitivity and exercise .............................. 32 2.4.3 Effect of exercise intensity on insulin sensitivity ........................................................... 33 2.4.4 Effect of interval training on insulin sensitivity .............................................................. 34 2.4.5 Effect of exercise training on lipid profile ...................................................................... 36 2.4.6 Summary of insulin sensitivity and exercise .................................................................. 37
2.5 Fat oxidation and exercise intensity ........................................................................................... 38 2.5.1 Use of indirect calorimetry to estimate substrate oxidation ............................................ 38 2.5.2 Effect of intensity on fat oxidation during and after exercise ......................................... 39 2.5.3 Optimal intensity for fat oxidation and energy expenditure ........................................... 40 2.5.4 Comparison between moderate-intensity continuous training and high-intensity interval
training on fat oxidation .................................................................................................. 41 2.5.5 Summary of fat oxidation and exercise .......................................................................... 45
2.6 Compensatory responses to exercise intervention ..................................................................... 46 2.6.1 Components of total energy expenditure ........................................................................ 46 2.6.2 Effects of the components of energy expenditure on compensatory responses .............. 47 2.6.3 Summary of energy expenditure components ................................................................. 49
2.7 Eating behaviour ........................................................................................................................ 51 2.7.1 Introduction .................................................................................................................... 51 2.7.2 Appetite sensation and food intake ................................................................................. 53 2.7.3 Nutrient preferences........................................................................................................ 58 2.7.4 Substrate oxidation, food intake and nutrient preferences .............................................. 62 2.7.5 Summary of the interaction between nutrient preferences, appetite sensations and food
rewards ........................................................................................................................... 65
2.8 General summary ....................................................................................................................... 67
3 EXPERIMENT 1-A: FAT OXIDATION DURING GXT AT MFO COMPARED
WITH MIIT 69
3.1 Introduction ................................................................................................................................ 69
3.2 Hypotheses ................................................................................................................................. 71
3.3 Method ....................................................................................................................................... 71 3.3.1 Participant characteristics ............................................................................................... 71 3.3.2 Body composition ........................................................................................................... 72 3.3.3 Familiarisation and pre-test preparation ......................................................................... 72 3.3.4 Experimental design ....................................................................................................... 73 3.3.5 Data management ........................................................................................................... 74 3.3.6 Statistical analysis ........................................................................................................... 77
3.4 Results ........................................................................................................................................ 78 3.4.1 Descriptive characteristics and physiological variables .................................................. 78

Page vi
3.4.2 Fat oxidation ................................................................................................................... 79 3.4.3 Physiological and psychological variables ..................................................................... 81
3.5 Discussion .................................................................................................................................. 83 3.5.1 The main finding ............................................................................................................ 83 3.5.2 Fat oxidation during MIIT and in comparison with MFO .............................................. 83 3.5.3 Physiological and psychological variables during MIIT in comparison with MFO ....... 85 3.5.4 Summary ......................................................................................................................... 87
4 EXPERIMENT 1-B: A COMPARISON BETWEEN THE ACUTE EFFECTS OF
MIIT AND HIIT ON APPETITE AND NUTRIENT PREFERENCES ....................................... 88
4.1 Introduction ................................................................................................................................ 88
4.2 Hypotheses ................................................................................................................................. 90
4.3 Methods ..................................................................................................................................... 90 4.3.1 Participant characteristics ............................................................................................... 90 4.3.2 Familiarisation and pre-test preparation ......................................................................... 90 4.3.3 Experimental design ....................................................................................................... 90 4.3.4 Data management of the MIIT and HIIT sessions .......................................................... 91 4.3.5 Eating behaviour measures ............................................................................................. 92 4.3.6 Statistical analysis ........................................................................................................... 94
4.4 Results ........................................................................................................................................ 95 4.4.1 Exercise duration, mechanical work, physiological variables and RPE ......................... 95 4.4.2 Eating behaviour ............................................................................................................. 96
4.5 Discussion ................................................................................................................................ 100 4.5.1 The main finding .......................................................................................................... 100 4.5.2 Duration of exercise, mechanical work, BLa and RPE ................................................. 100 4.5.3 Eating behaviour ........................................................................................................... 102 4.5.4 Summary ....................................................................................................................... 105
5 EXPERIMENT 2-A: A COMPARISON BETWEEN THE MEDIUM-TERM
EFFECTS OF MIIT AND HIIT ON FAT OXIDATION, INSULIN SENSITIVITY AND
PHYSIOLOGICAL VARIABLES ................................................................................................. 106
5.1 Introduction .............................................................................................................................. 106
5.2 Hypotheses ............................................................................................................................... 109
5.3 Methods ................................................................................................................................... 110 5.3.1 Participant characteristics ............................................................................................. 110 5.3.2 Body composition ......................................................................................................... 110 5.3.3 Familiarisation and pre-intervention preparation .......................................................... 112 5.3.4 Experimental design ..................................................................................................... 112 5.3.5 Assessment tests ........................................................................................................... 113 5.3.6 Training intervention .................................................................................................... 115 5.3.7 Data management ......................................................................................................... 116 5.3.8 Non-exercise activity thermogenesis (NEAT) .............................................................. 118 5.3.9 Statistical analysis ......................................................................................................... 118
5.4 Results ...................................................................................................................................... 120 5.4.1 Descriptive data of exercise training sessions............................................................... 120 5.4.2 Body composition and blood profile............................................................................. 121 5.4.3 Fat oxidation ................................................................................................................. 123 5.4.4 Physiological variables during graded exercise test (GXT) .......................................... 127 5.4.5 The changes in BLa, HR and RPE ................................................................................ 129 5.4.6 NEAT and severity of fatigue symptoms ...................................................................... 136
5.5 Discussion ................................................................................................................................ 138 5.5.1 The main finding .......................................................................................................... 138 5.5.2 Fat oxidation during GXT and the constant-load test ................................................... 138 5.5.3 Blood glucose and insulin sensitivity ........................................................................... 140 5.5.4 Cardiorespiratory fitness at maximal power, LT and MFO during a GXT ................... 142

Page vii
5.5.5 Responses of BLa, HR and RPE during the constant-load test, and the time course of
their change during interval training sessions ............................................................... 144 5.5.6 NEAT ........................................................................................................................... 145 5.5.7 Summary ....................................................................................................................... 146
6 EXPERIMENT 2-B: A COMPARISON BETWEEN THE MEDIUM-TERM
EFFECTS OF MIIT AND HIIT ON APPETITE AND FOOD INTAKE ................................... 148
6.1 Introduction .............................................................................................................................. 148
6.2 Hypotheses ............................................................................................................................... 150
6.3 Methods ................................................................................................................................... 151 6.3.1 Participant characteristics ............................................................................................. 151 6.3.2 Design of training intervention ..................................................................................... 151 6.3.3 Use of constant-load exercise test to assess eating behaviour and substrate oxidation . 151 6.3.4 Data management ......................................................................................................... 153 6.3.5 Statistical analysis:........................................................................................................ 154
6.4 Results ...................................................................................................................................... 156 6.4.1 Food intake and nutrient preferences during test meal ................................................. 156 6.4.2 Appetite sensations, and interaction with food intake .................................................. 159 6.4.3 Liking and wanting ....................................................................................................... 162 6.4.4 Interaction between fat intake and substrate oxidation ................................................. 165
6.5 Discussion ................................................................................................................................ 170 6.5.1 The main finding .......................................................................................................... 170 6.5.2 Appetite sensation ......................................................................................................... 170 6.5.3 Food intake and the role of appetite sensations ............................................................ 171 6.5.4 Role of CHO oxidation on food intake after HIIT ........................................................ 172 6.5.5 Nutrient preferences after MIIT .................................................................................... 173 6.5.6 Liking and wanting, and the preferences of high-fat food after MIIT .......................... 174 6.5.7 Role of fat oxidation on fat preference after MIIT ....................................................... 175 6.5.8 Summary ....................................................................................................................... 176
7 CONCLUSIONS ........................................................................................................ 177
7.1 Summary .................................................................................................................................. 177
7.2 Implications, limitations and future studies ............................................................................. 179
8 APPENDICES ............................................................................................................ 183
8.1 Appendix A: The influence of MIIT and HIIT on eating behaviour ........................................ 183
8.2 Appendix B: Severity of Fatigue Symptoms questionnaire ..................................................... 191
9 REFERENCES .......................................................................................................... 192

Page viii
List of Figures
Figure 1-1. An overview of the thesis. .................................................................................................. 10
Figure 3-1. Bland-Altman plot of the mean and difference of fat oxidation during MIIT and MFO. ... 80
Figure 3-2. Rate of fat oxidation during the MIIT session. There were significant differences between
fat oxidation at minutes 25 and 5 at 0.05 and between minutes 25 and 15 at 0.01. ...................... 81
Figure 3-3. The responses of VO2, HR and RPE every 5-min during MIIT; data represented as mean
±SEM. .......................................................................................................................................... 82
Figure 4-1. Delta values of pre- and post-measures of appetite sensations during the MIIT and HIIT
sessions; data represented as mean ±SEM. ................................................................................... 97
Figure 4-2. Delta values of pre- and post-measures of explicit liking during the MIIT and HIIT
sessions; data represented as Mean ±SEM ................................................................................... 98
Figure 4-3. Delta values of pre- and post-measures of implicit wanting during the MIIT and HIIT
sessions; data represented as mean ±SEM. ................................................................................... 99
Figure 4-4. Delta values of pre- and post-measures of mean frequency of choice during the MIIT and
HIIT sessions; data represented as mean ±SEM. .......................................................................... 99
Figure 5-1. Curve of fat oxidation rate (g/min) against relative exercise intensity (%VO2peak) during
graded exercise test (GXT) at weeks 0 (solid line) and 4 (dotted line) in MIIT (a) and HIIT (b);
data represented as mean ±SEM, but SD was used in the rate of fat oxidation. ......................... 124
Figure 5-2. the responses of fat oxidation during the constant-load exercise test in MIIT (a) and HIIT
(b), and the average rate of fat oxidation during the test at weeks 0 (dark grey) and 4 (light grey)
in MIIT and HIIT (c); data represented as mean ±SD. ............................................................... 125
Figure 5-3. the responses of respiratory exchange ratio (RER) during the constant-load exercise test in
MIIT (a) and HIIT (b), and the average RER during the test at weeks 0 (dark grey) and 4 (light
grey) in MIIT and HIIT (c); data represented as mean ±SEM.................................................... 126
Figure 5-4. The concentration of blood lactate (BLa) during constant-load exercise test at week 0
(solid line) and week 4 (dotted line) in MIIT (a) and HIIT (b); data represented as mean ±SEM.130
Figure 5-5. Heart rate (HR) during constant-load exercise test at week 0 (solid line) and week 4
(dotted line) in MIIT (a) and HIIT (b); data represented as mean ±SD. ..................................... 131
Figure 5-6. The rate of perceived exertion (RPE) during constant-load exercise test at week 0 (solid
line) and week 4 (dotted line) in MIIT (a) and HIIT (b); data represented as mean ±SEM. ...... 132
Figure 5-7. The concentration of blood lactate (BLa) during 4-week training of MIIT (a) and HIIT (b);
data collected in the first exercise session of every week; data represented as mean ±SEM. Note:
workload at 30 mins of MIIT was lower than workload at 5 and 15 mins of MIIT ................... 133
Figure 5-8. Heart rate (HR) during 4-week training of MIIT (a) and HIIT (b); data collected in the first
exercise session of every week; data represented as mean ±SD. Note: workload at 30 mins of
MIIT was lower than workload at 5 and 15 mins of MIIT. ........................................................ 134
Figure 5-9. The rate of perceived exertion (RPE) during 4-week training of MIIT (a) and HIIT (b);
data collected in the first exercise session of every week; data represented as mean ±SEM. Note:
workload at 30 mins of MIIT was lower than workload at 5 and 15 mins of MIIT. .................. 135
Figure 5-10. Average step counts per day at week 0 and 4 in MIIT (dark bars) and HIIT (bright bars);
there were no significant effect of intensity or time on step counts; data represented as mean
±SD; sample size = 8 (two participants were excluded). ............................................................ 136
Figure 6-1. A schematic of the appetite test day protocol. Note that the exercise was a constant-load
exercise session. ......................................................................................................................... 153
Figure 6-2. Food intake (g) and energy intake (kcal) of food eaten (a), and total amount of nutrient
component (CHO and fat) (b), and nutrient intake relative to total energy intake (c); data
represented as mean ±SEM; §: the interaction between intensity and time on fat eaten (g)
approached significance (p = 0.07). ............................................................................................ 157

Page ix
Figure 6-3 Delta fasting appetite sensations (week 4-0) for MIIT and HIIT; data represented as mean
±SEM. ........................................................................................................................................ 159
Figure 6-4. ΔMedium term-Ex appetite sensations in MIIT and HIIT; data represented as mean ±SEM.160
Figure 6-5. Hunger (a) and fullness (b) at meal time (60-min recovery) and total amount of food eaten
at weeks 0 and 4 in MIIT and HIIT; data represented as mean ±SEM. ...................................... 161
Figure 6-6. Delta fasting liking (a), wanting (b), and frequency of food preferences (c) in MIIT and
HIIT; data represented as mean ±SEM; MIIT: moderate-intensity interval training; HIIT: high-
intensity interval training; Δ: resting values at week 4 – resting values at week 0. §: the
interaction between intensity and time on HFSW (P= 0.09). ..................................................... 163
Figure 6-7. ΔMedium term-Ex for explicit liking (a), implicit wanting (b) and frequency of food
preferences (c) in MIIT and HIIT; data represented as mean ±SEM; MIIT: moderate-intensity
interval training; HIIT: high-intensity interval training; ΔMedium term-Ex: difference between
Acute-Exe in week 4 and Acute-Exe in week 0; §: the interaction between intensity and time on
HFNS (P= 0.09). ......................................................................................................................... 164
Figure 6-8. The interaction between the intervention and resting CHO (a) and fat (b) oxidation (g/min)
on fat intake (g); data represented as mean ±SEM; .................................................................... 166
Figure 6-9. The interaction between the intervention and exercise-induced CHO (a) and fat (b)
oxidation (g/min) on fat intake (g); data represented as mean ±SEM. ....................................... 167
Figure 6-10. The interaction between the intervention and recovery CHO (a) and fat (b) oxidation
(g/min) on fat intake (g); data represented as mean ±SEM. ....................................................... 168
Figure 8-1. The individual data of amount of food and fat intake in grams and total energy intake of
test meal at weeks 0 and 4 in MIIT and HIIT. ............................................................................ 185
Figure 8-2. Delta value of Acute-Ex liking in MIIT (a) and HIIT (b); data represented as mean ±SEM.186
Figure 8-3. Delta value of Acute-Ex wanting in MIIT (a) and HIIT (b); data represented as mean
±SEM. ........................................................................................................................................ 187
Figure 8-4. Delta value of Acute-Exe food preferences in MIIT (a) and HIIT (b); data represented as
mean ±SEM. ............................................................................................................................... 188
Figure 8-5. Individual correlations between delta (difference between weeks 0 and 4) fat intake (g)
and substrate oxidation (g/min) during rest (a), exercise (b) and recovery (c) in MIIT. ............ 189
Figure 8-6. Individual correlations between delta (difference between weeks 0 and 4) fat intake (g) and
substrate oxidation (g/min) during rest (a), exercise (b) and recovery (c) in HIIT. .................... 190
Figure 8-7. The 7-item Severity of Fatigue Symptoms questionnaire (Chalder Fatigue Questionnaire)
to estimate the severity of fatigue symptoms. ............................................................................ 191

Page x
List of Tables
Table 2-1. Findings of studies that used interval training among the obese population ........................ 19
Table 3-1. Descriptive characteristics of study participants. Data expressed as mean, ±SEM and
range. ............................................................................................................................................ 78
Table 3-2. Physiological variables at maximal volitional exhaustion. Data expressed as mean, ±SEM
and range. ..................................................................................................................................... 78
Table 3-3. Physiological variables at maximal fat oxidation (MFO). Data expressed as mean, ±SEM
and range. ..................................................................................................................................... 79
Table 3-4. Comparison between substrate oxidation at MFO and MIIT. Data expressed as mean
±SEM. .......................................................................................................................................... 79
Table 3-5. Comparisons between the first and second half of MIIT and MFO in physiological and
psychological variables. Data expressed as mean ±SEM. ............................................................ 82
Table 4-1. Description and categories of photographic food stimuli .................................................... 93
Table 4-2. Exercise duration and mechanical work during MIIT and HIIT. Data expressed as mean
±SEM. .......................................................................................................................................... 95
Table 4-3. Responses of physiological variables and RPE during MIIT and HIIT. Data expressed as
mean ±SEM. ................................................................................................................................. 96
Table 5-1. Timeline of study presented in weeks. ............................................................................... 113
Table 5-2. Exercise duration and mechanical work during MIIT and HIIT. Data expressed as mean
±SEM. ........................................................................................................................................ 120
Table 5-3. Body composition at weeks 0 and 4 in MIIT and HIIT. Data expressed as mean ±SEM,
absolute and percentage differences. .......................................................................................... 121
Table 5-4. Blood profile at weeks 0 and 4 in MIIT and HIIT. Data expressed as mean ±SEM, absolute
and percentage differences. ........................................................................................................ 122
Table 5-5. Physiological variables at maximal and submaximal levels during GXT at weeks 0 and 4 in
MIIT and HIIT. Data expressed as mean ±SEM, absolute and percentage differences. ............ 128
Table 5-6. Responses to the 7-item Severity of Fatigue Symptoms Questionnaire using Likert Scale at
weeks 0 and 4 in MIIT and HIIT. Data expressed as mean ±SEM, absolute and percentage
differences. ................................................................................................................................. 137
Table 6-1. Test meal energy and macronutrient intake for MIIT and HIIT. Data expressed as mean
±SEM, absolute and percentage differences. .............................................................................. 158
Table 6-2. The calculated accumulative change of 12-training sessions in nutrient intake and substrate
oxidation, based on data from the test meal and substrate oxidation during the constant-load
exercise test at weeks 0 and 4. .................................................................................................... 158
Table 6-3. Post hoc analysis for eating behaviour variables. .............................................................. 169
Table 8-1. Nutrient composition of test meal provided at the end of constant-load test at weeks 0 and 4
of MIIT and HIIT. ...................................................................................................................... 184

Page xi
List of Abbreviations
%BF Relative body fat
ACSM American College of Sports Medicine
Acute-Ex Difference between the end of acute exercise and pre-exercise value
ADP Air-displacement plethysmography
AEE Activity energy expenditure
AT Anaerobic threshold
ATP Adenosine triphosphate
a-vO2 difference Arterial-mixed venous oxygen difference
BIA Bioelectrical impedance analysis
BIS Bioimpedance spectroscopy
BLa Concentration of blood lactate
BMI Body mass index
BMR Basal metabolic rate
C Celsius
CAD Coronary artery disease
CFQ Chalder Fatigue Questionnaire
CHD Coronary heart disease
CHO Carbohydrate
cm Centimetre
CO2 Carbon dioxide
CV Coefficient of variance
CVD Cardiovascular diseases
DLW Doubly labelled water
DXA Dual-energy X-ray absorptiometry
EE Energy expenditure
EI Energy intake
EPOC Excess post exercise oxygen consumption
FATmax The intensity of maximal fat oxidation
FFA Free fatty acid
FFM Fat-free mass
FM Fat mass
FQ Food quotient
g Gram
GXT Graded exercise test
H+ Hydrogen ion
HbA1c Glycated haemoglobin
HCO3- Bicarbonate
HDL-C High density lipoprotein cholesterol
HFNS High-fat non-sweet
HFSW High-fat sweet
HIIT High-intensity interval training
HOMA-IR The homeostasis model assessment of insulin resistance
HR Heart rate
hr Hour
HRmax Maximum heart rate
HRpeak Peak heart rate
HRR Heart rate reserve
HSL Hormone sensitive lipase
IMGT Intramuscular triglycerides
kcal Kilocalorie
kg Kilogram
km Kilometre
L Litre
lb Pound
LDL-C Low density lipoprotein cholesterol
LFNS Low-fat non-sweet
LFSW Low-fat sweet
LT Lactate threshold

Page ii
LT1 First lactate threshold
LT2 Second lactate threshold
Medium term-Ex Difference between Acute-Ex in weeks 0 and 4
MET Metabolic equivalent
MFO Maximal fat oxidation
mg Milligram
MIIT Moderate-intensity interval training
min Minute
MJ megajoule
MLSS Maximal lactate steady state
MS Metabolic syndrome
NEAT Non-exercise activity thermogenesis
NEFA Non-esterified fatty acids
NIH National Institutes of Health
O2 Oxygen
PCr Phosphocreatine
PGC-1α Peroxisome proliferator-activated receptor y coactivator 1 α
Q Cardiac output
Ra The rate of free fatty acid appearance
REE Resting energy expenditure
RER Respiratory exchange ratio
RMR Resting metabolic rate
RPE Rating of perceived exertion
RPEave Average RPE
RPEend RPE at the end of session
rpm Revolutions per minute
RQ Respiratory quotient
sec Second
SPA Spontaneous physical activity
SV Stroke volume
T2D Type 2 diabetes
TBW Total body water
TC Total cholesterol
TC/HDL-C Ratio of total cholesterol to HDL-cholesterol
TEE Total energy expenditure
TEF The thermic effect of food
TG Triglycerides
VAS Visual Analogue Scale
VCO2 The volume of CO2 produced per minute
VE The volume of air expired per minute
VO2 The volume of oxygen consumption
VO2max Maximal oxygen uptake
VO2peak Peak oxygen uptake
VO2R Oxygen consumption reserve
vs Versus
VT Ventilatory threshold
W Watt
WC Waist circumference
WHO World Health Organization
WHR Waist-to-hip ratio
Wmax Maximal workload in Watts
WtHR Waist-to-height ratio
Δ Delta

Page 3
Statement of Original Authorship
The work contained in this thesis has not been previously submitted to meet
requirements for an award at this or any other higher education institution. To the best of
my knowledge and belief, the thesis contains no material previously published or written
by another person except where due reference is made.
Signature:
Date: 25/11/2012
QUT Verified Signature
Page 4
List of publication and presentation
Oral presentation
- A comparison between the effect of 4-week moderate- and high-intensity training on fat
oxidation and insulin sensitivity in obese men. QUT Exercise and Nutrition Conference.
Brisbane, Australia, 17 February 2012.
- A comparison between the effect of moderate- and high-intensity interval training on appetite
and food intake in obese men. IHBI Inspire Post graduate Students Conference. Brisbane,
Australia, 24-26 November 2011
- An overview of the differences between a graded exercise test and a moderate-intensity
interval training session in substrate oxidation and physiological variables in obese men. IHBI
Inspire Post graduate Students Conference. Gold Coast, Australia, 24-26 November 2010.
- Mechanical work and metabolic stress in response to high- and low-intensity interval exercise
among obese men. 2010 Asics Conference of Science and Medicine in Sport. Sports Medicine
Australia. Port Douglas, Australia, 3-6 November 2010.
- Comparison of energy expenditure and fat oxidation from a graded exercise test with a
moderate-intensity interval training session in obese men. International Sports Science and
Sports Medicine Conference. Newcastle Upon Tyne, England, 19-21 August 2010.
- The association/disassociation between physiological variables during different doses of
interval exercise among overweight/obese men. The 10th scientific meeting of Straddie
Conference. Brisbane, North Stradbroke Island, Australia, 6-8 April 2010.
Poster presentation
- Nutrient preferences and appetite sensations in responses to high- and moderate-intensity
interval exercise in obese men. ANZOS Annual Scientific Meeting. Sydney, Australia, 21-23
October 2010.
Conference proceedings
- S. Alkahtani, A. Hills, N. Byrne and King N. Nutrient preferences and appetite sensations in
responses to high- and moderate-intensity interval exercise in obese men. Obesity Research &
Clinical Practice. 4 (1), 2010, p. S5.
- S. Alkahtani, A. Hills, N. Byrne and King N. Mechanical work and metabolic stress in response
to high- and low-intensity interval exercise among obese men. Journal of Science and Medicine
in Sport, 13 (6) Supplement December 2010, pp. 24-25.
- S. Alkahtani, A. Hills, N. King and N. Byrne. Comparison of energy expenditure and fat
oxidation from a graded exercise test with a moderate-intensity interval training session in
obese men. British Journal of Sport Medicine. 44 (14), November 2010.
Publications
- Alkahtani, S., Byrne, N., Hills, A., King, N. Exercise intensity of acute interval exercise does not
affect appetite and nutrient preferences in overweight and obese males. Appetite, underreview.
- Shaea A. Alkahtani, Nuala M. Byrne, Andrew P. Hills, Neil A. King. The compensations of eating
behaviour were greater after moderate- than high-intensity interval training in obese men.
Med Sci Sports Exerc, unverreivew.
- Shaea A. Alkahtani, Neil A. King, Andrew P. Hills, Nuala M. Byrne. Comparing fat oxidation in an
exercise test with moderate-intensity interval exercise. Med Sci Sports Exerc, unverreivew.
- Shaea A. Alkahtani, Neil A. King, Andrew P. Hills, Nuala M. Byrne. Effect of interval training
intensity on fat oxidation and blood lactate in obese men, preparation.

Page 5
Acknowledgments
I am pleased to take this opportunity to acknowledge the great support from my
supervisors Prof Nuala Byrne, Prof Neil King and Prof Andrew Hills. Thank you for
accepting my proposal to become involved in the Energy Metabolism Group, for sharing
your knowledge with me and for guiding me through the program to the completion of
my doctoral degree. Special thanks go to the external examiners, final seminar panel, Dr
Ian Stewart and Dr Jonathan Peake, and my confirmation seminar panel, Dr Christopher
Askew and Dr Rachel Wood.
I would like to thank all participants, staff and institutes at QUT, with whom I
met and worked. Affiliations and Institutes include the Institute of Health and
Biomedical Innovation and their laboratories, School of Exercise and Nutrition Sciences,
Research Student Centre, Health Services Office, Research Methods Group,
International Student Services and Health Clinics. Special thanks go to specific people
for their contributions in data collection, data analysis statistical consultations or editing
consultations, including Dr Rachel Wood, Connie Wishart, Dimitrios Vagenas, Peter
Nelson, Dr Martin Reese and the Energy Metabolism Group members. Thanks again to
the participants for their patience in adhering to the study requirements.
Financial support was generously given by the University of Dammam in Saudi
Arabia, and operated by the Cultural Mission of the Royal Embassy of Saudi Arabia in
Canberra. The partial contribution of the sponsor in study expenses is appreciated.
Family support definitely helps to bear the load of studying abroad for several
years. I appreciate the consideration of my family - Mum, Dad, brothers and sisters.
Special thank goes to my devoted wife Asma Alkahtani who was closely supportive and
patient during my PhD journey.
Without those great people and those prestigious academic and government
affiliations, achieving the award of PhD degree would not have been possible.
Page 6
1 General introduction
Obesity, worldwide, has increased rapidly in recent decades including in
Australia (WHO, 2008). In 1995, it was estimated that 38% of Australian men were
overweight and 18% were obese (Department of Health and Ageing, 2008). In 2005,
results from the National Health Survey revealed that more than half of Australian adults
were either overweight or obese, and this prevalence had increased by 16% over the
previous 15 years (Australian Bureau of Statistics, 2008). These trends have resulted in
Australia being referred to as one of the fattest nations in the developed world
(Department of Health and Ageing, 2008) or possibly the world’s most overweight
nation (McLean, 2008). Diabetes Australia (2006) estimated that the direct economic
cost of obesity (BMI > 30 kg/m2) in 2005 would be AU$ 3.7 billion and AU$ 17 billion
for the four major diseases linked to obesity (Type 2 diabetes (T2D), cardiovascular
diseases (CVD), osteoarthritis and cancer). In addition to T2D and CVD, obesity is
commonly associated with other co-morbid conditions such as hypertension and
hyperglycaemia (Atlantis, Lange & Wittert, 2009; Colagiuri, 2010; Zimmet, Magliano,
Matsuzawa, Alberti & Shaw, 2005). Therefore, the increasing prevalence of obesity is
having a direct impact on the healthcare costs of individuals and governments (Withrow
& Alter, 2011).
Obesity influences a range of metabolic, physiological and mechanical functions,
such that obese individuals are less physically fit than their non-obese counterparts
(Hulens, Vansant, Lysens, Claessens & Muls, 2001). Obesity has been implicated in the
impairment of skeletal muscle metabolism (Corpeleijn, Saris & Blaak, 2009; Galgani,
Moro & Ravussin, 2008; Sparks et al., 2009) and alteration of respiratory mechanics (De
Lorey, Wyrick & Babb, 2005). Obesity also has a potentially profound effect on soft-
tissue structures which increases pain and discomfort (Wearing, Hennig, Byrne, Steele &
Hills, 2006), so that obese individuals develop strategies to reduce mechanical work on
the lower extremities (Browning & Kram, 2009). The obese may display several
kinematic and kinetic dysfunctions in walking patterns during their gait cycle, which
creates a higher energy transfer ratio (Shultz, Anner & Hills, 2009). Therefore, they may
avoid engaging in physical activity. Obese individuals also commonly need a longer
time to recover from physical activity (Hulens et al., 2001). Low levels of physical

Page 7
fitness have been associated with the risk of cardiovascular mortality (Adabag et al.,
2008). For example, individuals with metabolic syndrome but a high level of fitness
have lower C-reactive protein concentrations than individuals with a low fitness level
(Aronson et al., 2004). The modern lifestyle has contributed to increases in sitting time
and a decline in free-living activity, both of which are considered contributors to obesity
(Levine, Vander Weg, Hill & Klesges, 2006; Speakman & Selman, 2003). Furthermore,
it has been suggested that there is a dose-response relationship between the level of
inactivity and risk of becoming obese (Fox & Hillsdon, 2007; Hamilton, Hamilton &
Zderic, 2007; Jackson, Djafarian, Stewart & Speakman, 2009). Physical inactivity has
become a worldwide problem, with national prevalence values ranging from 23% in
Sweden to 96% in Brazil (an average of 53%) for men (Sisson & Katzmarzyk, 2008).
Therefore, individuals need to have sufficient motivation to make healthier options and
adhere to them (Hill, Peters, Catenacci & Wyatt, 2008).
While the volume of exercise (total energy expenditure) including exercise in
both aerobic moderate- and high-intensity domains is the main factor featured in most
recommendations for the purpose of weight management (Brooks, Butte, Rand, Flatt &
Caballero, 2004; Donnelly et al., 2009; Garber et al., 2011; Goldberg & King, 2007;
Hills & Byrne, 2004; Saris et al., 2003), the intensity of exercise could have a specific
impact on factors related to long-term weight management such as exercise-induced fat
oxidation. Acute intervention studies demonstrated that adipose tissue can deliver
sufficient amounts of nonesterified fatty acids (NEFA) to working muscles during
moderate-intensity exercise, whereas there is inhibition of lipolysis during high-intensity
exercise because of the failure of adipose tissue to deliver sufficient amounts of free fatty
acid (associated with reduced blood flow to adipose tissue) and an inability of muscles to
use them (Frayn, 2010). Although high-intensity exercise reportedly induced a greater
amount of fat oxidation than moderate-intensity exercise during a 6-hr post-exercise
period, the sum of fat oxidation during 300-kcal-induced exercise and post-exercise was
greater at moderate- than high-intensity treatment (Pillard et al., 2010). In a 12-week
intervention, aerobic training at 65%VO2max increased fat oxidation in healthy
sedentary women (Zarins et al., 2009), whereas obese individuals significantly increased
exercise-induced fat oxidation after moderate- (40%VO2max) but not high-intensity
training (70%VO2max) (Van Aggel-Leijssen, Saris, Wagenmakers, Senden & Van Baak,
2002).

Page 8
Anaerobic high-intensity interval training, consisting of 4×6 repeated Wingate
Tests interspersed by 4-min recovery, has been suggested to increase protein content
linked to oxidative capacity in skeletal muscle in a very short time frame (Gibala, 2009;
Gibala & McGee, 2008; Whyte, Gill & Cathcart, 2010). Unlike anaerobic interval
training which requires high motivational commitment, aerobic interval training can be
performed at intensities below maximal volitional exhaustion aerobic power and above
workloads corresponding to the highest rate of fat oxidation (Achten, Gleeson &
Jeukendrup, 2002) and/or the lactate threshold (Laursen & Jenkins, 2002) which occurs
when the muscular lactate production rate exceeds the lactate elimination rate (Binder et
al., 2008). Training in this aerobic interval zone can increase endurance capacity
(Talanian, Galloway, Heigenhauser, Bonen & Spriet, 2007) with enjoyment of the
exercise being maintained, as assessed using the Physical Activity Enjoyment Scale
(Bartlett et al., 2011). Aerobic interval training, therefore, has been used to improve
health in various sedentary patients including the obese (Guelfi, Jones & Fournier, 2007;
Schjerve et al., 2008; Wisloff et al., 2007). However, a limited number of studies have
examined the role of aerobic interval training on fat oxidation (Malatesta, Werlen,
Bulfaro, Cheneviere & Borrani, 2009b; Venables & Jeukendrup, 2008). Surprisingly,
moderate-intensity interval training did not increase exercise-induced fat oxidation after
a 4-week intervention although identical moderate-intensity continuous training
increased exercise-induced fat oxidation by 44% compared with the baseline (Venables
& Jeukendrup, 2008). It can be assumed that either food intake changed during the
interval training intervention, or alternate interval workloads of 20% above and 20%
below the intensity of maximal fat oxidation negated the expected increase in fat
oxidation during moderate-intensity exercise. It is important to replicate Venables and
Jeukendrup’s study to confirm whether moderate-intensity interval training is an
effective strategy to increase exercise-induced fat oxidation. The first aim of the current
thesis was to examine whether fat oxidation increased during an acute moderate-
intensity interval bout prior to undertaking a medium-term intervention that compared
the effect of moderate- and high-intensity aerobic interval training on fat oxidation.
Compensatory eating behaviour in response to exercise is a potential reason for
lower than expected weight loss (King et al., 2007a). Wide variations in weight loss
were seen in exercise interventions (Barwell, Malkova, Leggate & Gill, 2009; Donnelly,
Jacobsen, Heelan, Seip & Smith, 2000), with a large proportion of the variation

Page 9
attributed to compensation of eating behaviours (King, Hopkins, Caudwell, Stubbs &
Blundell, 2008). Compensatory responses in eating behaviour could be attributed to
automatic biological mechanisms that drive increased food intake to resist energy
deficits (King et al., 2007a). Behavioural mechanisms can also explain the compensatory
responses in eating behaviour through food rewards (King et al., 2007a). The current
thesis hypothesised that food intake would increase after high-intensity interval training
to a greater extent than after moderate-intensity interval training because the perception
of obese individuals to high-intensity training will induce food rewards. This assumption
is supported by the finding that increasing the intensity to 10% above the self-selected
speed decreased the rate of pleasure of exercise among overweight women (Ekkekakis &
Lind, 2006). The perceived exertion of high-intensity exercise increased (Lambert,
Gibson & Noakes, 2005) and could influence the eating behaviour response. It is
acknowledged that it is difficult to discriminate between the effect of biological
mechanisms (i.e. energy deficit that leads to weight loss) and the effect of psychological
mechanisms (i.e. perceived effort related to food reward) on eating behaviour in long-
term weight loss-induced intervention. Therefore, the present research examined the
responses of eating behaviour components that may contribute to the lack of weight loss
including increases in hunger and food intake and alterations in taste and nutrient
preference (Blundell et al., 2005; Finlayson et al., 2011; King et al., 2008) during
medium-term 4-week training.
With the potential benefits of interval training for improving both metabolic
health and exercise capacity, the primary objective of this thesis was to investigate the
roles of different intensities of interval training on fat oxidation and eating behaviour in
overweight/obese men. The first experiment assessed the response of fat oxidation
during acute moderate-intensity interval exercise compared with a graded exercise test
(GXT), and also assessed the responses of appetite and nutrient preferences to acute
moderate- and high-intensity interval exercise. The second experiment compared the
improvement in fasting and exercise-induced fat oxidation after cross-over 4-week
moderate- and high-intensity interval training, and also compared the compensation of
appetite and food intake after the interventions. Figure 1-1 is a schematic of the study
designs of this thesis. This thesis contributes to the evaluation of interval training in
overweight/obese men in terms of fat oxidation and dietary compensatory responses.

Page 10
Figure 1-1. An overview of the thesis.
• 12 overweight/obese men
– Graded exercise test (GXT)
– Moderate-intensity interval
exercise (MIIT)
– High-intensity interval exercise
(HIIT)
Acute experiment
Study 1: A comparison between the effect of
GXT and MIIT on fat oxidation
Study 2: A comparison between the effect of
MIIT and HIIT on appetite and nutrient
preferences
10 overweight/obese men
4-week moderate- and high-
intensity interval exercise (MIIT
and HIIT)
Medium-term experiment
Study 3: A comparison between the effect of
medium-term MIIT and HIIT on fat oxidation
Study 4: A comparison between the effect of
medium-term MIIT and HIIT on appetite and
food intake

Page 11
2 Literature review
2.1 Introduction
Obesity is associated with the occurrence of Type 2 diabetes (T2D) (Kramer et
al., 2010). This interaction between obesity and T2D is triggered by insulin resistance
which is partially attributed to the disproportionate balance between the increase in fatty
acid availability and the decrease in utilisation of fatty acid in the mitochondria in
skeletal muscles (Koves et al., 2008; Rogge, 2009; Schenk, Harber, Shrivastava, Burant
& Horowitz, 2009). In addition, as the rates of exercise-induced fat oxidation
significantly explained the variance in insulin resistance among males of different
ethnicity (Hall et al., 2010), promoting aerobic training has been advocated to maximise
fat oxidation and improve insulin sensitivity in the obese population. For example,
engagement in 12 weeks of aerobic training increased resting fat oxidation and lipid
utilisation which in turn attenuated insulin resistance in older obese individuals
(Solomon et al., 2008). In addition, high-intensity interval training is suggested to
increase mitochondrial oxidative capacity and insulin sensitivity more effectively (i.e.
less volume) than continuous aerobic training (Gibala & McGee, 2008). While the
original proposed high-intensity interval exercise is a repeated Wingate Test protocol,
moderate- and high-intensity levels, ranging between 44 and 100%VO2max, have also
been suggested to achieve desirable improvements in fat oxidation and insulin sensitivity
(Earnest, 2008; Tonna et al., 2008; Venables & Jeukendrup, 2008). Therefore, the first
section of this literature review will discuss the effect of moderate- and high-intensity
interval training on fat oxidation and insulin sensitivity.
Moderate- and high-intensity interval training could differently influence
physiological and psychological responses during exercise. Markers such as BLa, HR
and RPE are commonly used to monitor physiological and psychological stress during
structured aerobic training (Seiler, Joranson, Olesen & Hetlelid, 2011). These markers
and substrate oxidation are also used to prescribe exercise training. Exercise intensities
prescribed are usually based on selected intensity during GXT, however several
limitations have been reported regarding basing intensities from GXT when applied to
continuous aerobic training (Baron et al., 2003; Carey, Tofte, Pliego & Raymond, 2009;

Page 12
Thompson & West, 1998). Therefore, the first section of this literature review will also
discuss the prescription of interval training using GXT.
The second section of the literature review will discuss the concept of
compensatory responses during exercise intervention which may occur through reducing
non-exercise activity thermogenesis (NEAT). NEAT can be monitored using movement
sensors (Colley, Hills, King & Byrne, 2010) including pedometers (Sugden et al., 2008).
Moreover, compensatory responses to exercise intervention can also occur as a result of
increasing the amount food intake or changing the components of nutrient intake (King
et al., 2007a). This pattern of dietary compensation can be monitored through
individuals’ eating behaviour which includes appetite sensations, liking and wanting,
food intake and nutrient preferences. While several studies investigated the influence of
different intensities of continuous training on compensatory responses, the impact of
different intensities of interval training is unclear. This section will review previous
studies, and will discuss proposed mechanisms that could explain the compensatory
responses.
Accordingly, the current chapter will include several sections outlined as follows:
Introduction to interval training
Prescription of interval training using GXT.
Impact of interval training on:
o Fat oxidation
o Insulin sensitivity
Compensatory behavioural responses including:
o NEAT
o Eating behaviour

Page 13
2.2 Interval training
2.2.1 Classification of interval exercise
Interval exercise describes repeated short efforts completed at an intensity above
the level of the lactate threshold (LT) accompanied by recovery intervals lasting from
several seconds to about 5 mins (Laursen & Jenkins, 2002). The workload undertaken
during interval exercise training can be varied by modifying the duration of work
intervals and rest or recovery periods. When high-intensity workloads are accompanied
with longer rest periods, participants are able to perform a greater volume of high-
intensity exercise than can be endured during continuous exercise (Astrand, Astrand,
Christensen & Hedman, 1960a, 1960b; Essen, 1978; Essen & Kaijser, 1978; Margaria,
Oliva, Di Prampero & Cerretelli, 1969). For example, with long rest/recovery periods
(e.g. 4-5 mins), short bursts (10–30 secs) of interval exercise can be performed at
supramaximal loads (McCartney et al., 1986) as high as 1000 W (250%VO2max)
(Gibala et al., 2006). Therefore, interval training enables individuals to exercise at
supramaximal intensity levels above VO2max, which is termed anaerobic interval
training (Billat, Blondel & Berthoin, 1999).
Anaerobic interval exercise can improve aerobic and anaerobic capacity. In
particular, short work:rest exercise can utilise the contribution of aerobic and anaerobic
pathways (Billat, 2001b; Tabata et al., 1997). For example, aerobic turnover is reported
to contribute to the later stages of supramaximal exercise intervals (Billaut, Giacomoni
& Falgairette, 2003), due to a reduced anaerobic energy yield (Gaitanos, Williams,
Boobis & Brooks, 1993). Tabata et al. (1996) compared continuous exercise training at
70%VO2max with anaerobic short interval exercise at 170%VO2max (eight sets of 20-
sec work with 10-sec rest). Both types of training improved aerobic capacity, and the
interval training increased anaerobic capacity by 28%. Although aerobic and anaerobic
pathways contribute to providing energy during supramaximal interval exercise (Hansen,
Shriver & Schoeller, 2005), the relative contribution is still an issue of controversy
(Billaut & Bishop, 2009).
A decrease in work efficiency is expected during repeated supramaximal trials.
For example, in a protocol which consisted of four sessions of 30-sec cycling at a 100
rpm with 4-min rest intervals, power declined at least 40% in the last two sessions
(McCartney et al., 1986), and power declined 27% in the tenth stage of 6-sec all-out

Page 14
cycling with 30-sec recovery (Gaitanos et al., 1993). Billaut et al. (2003) examined two
sessions of 8-sec all-out cycling with different recovery durations (15, 30, 60, 120 and
240 secs). Peak power slightly decreased after a 15-sec rest protocol, and total work
efficiency decreased after 15-sec and 30-sec rest protocols. Margaria et al. (1969) found
a strong relationship between time of rest intervals and total time of supramaximal work.
A decline in power could be more related to workload than recovery time. The reason
for the work deficit may be related to several factors such as phosphagen depletion, ionic
factors, acid-base balance and blood lactate values (Billaut et al., 2003). These studies
confirmed the difficulty of anaerobic interval training which might not be tolerated by
the obese population. A recent study used the repeated Wingate-protocol model among
the obese, and the researchers agreed that manipulating supramaximal exercise in the
obese population may increase the risk of side effects (Whyte et al., 2010). Therefore,
aerobic interval exercise that is performed at intensities below VO2max could be the
appropriate training option among obese individuals. Aerobic interval exercise protocols
as 15 secs at 100%VO2max with 15-sec interval rests (Guiraud et al., 2010) or alternate
by ±7%HRmax around 67%HRmax (Kang et al., 2005) were perceived as easier than
matched continuous workload as indicated by RPE.
Aerobic interval exercise can be divided into three intensity levels: below LT,
between LT and maximum lactate steady state (MLSS), and between MLSS and
VO2max (Xu & Rhodes, 1999). MLSS is an exercise threshold that represents the
highest balance between BLa production and remotion during 30-min constant-load
exercise (Billat, 2001a), and a value of 3 mmol/L has been suggested to represent MLSS
based on 50W increments and 3-min stage length (Beneke, 2003). The intensity of
exercise determined at the differences between MLSS and 100%VO2max (Δ50%) was
found to better stimulate aerobic metabolism during interval exercise (Demarie,
Koralsztein & Billat, 2000). In addition, training at or near to the maximal aerobic level
can increase VO2max, and time spent at this level during training is strongly correlated
to the amplitude of improvement in VO2max (Bishop, Edge, Thomas & Mercier, 2008;
Denadai, Ortiz, Greco & De Mello, 2006; Esfarjani & Laursen, 2007; Helgerud et al.,
2007; Midgley & Mc Naughton, 2006).
The improvement in aerobic capacity after aerobic high-intensity interval
training can be attributed to peripheral adaptation (increases in oxidative and glycolytic
enzyme activity) or central adaptation (the increase in plasma volume and the

Page 15
improvement in heat tolerance) (Laursen & Jenkins, 2002). Daussin et al. (2007; 2008)
compared two 8-week continuous and interval trainings in a cross-over design. The
interval exercise sessions consisted of consequent stages of 5 mins and each stage
consisted of 4-min exercise at ventilatory threshold ending with 1 min at 90 %VO2max.
Continuous exercise was matched to yield similar EE during similar exercise durations.
Continuous training improved muscular capillary density and increased vascular
conductance and arteriovenous difference greater than interval exercise. However, only
interval exercise improved mitochondrial function which seems to be the determinant in
VO2 kinetics, VO2max and cardiac output. VO2max increased by 9% after continuous
training which was attributed to peripheral adaptation, and increased by 15% after
interval exercise which was attributed to central and peripheral adaptation.
The length of exercise interval stages can also affect the responses of
physiological variables (Rozenek, Funato, Kubo, Hoshikawa & Matsuo, 2007). Studies
have compared short work: rest ratios such as 6:9, 8:12, 12:18 and 24:36 sec
(Christmass, Dawson & Arthur, 1999a; Price & Halabi, 2005; Trapp, Chisholm &
Boutcher, 2007). These studies were in agreement that at the same workload of interval
exercise, the longer the stages were, the more BLa increased. In 1960, Astrand and
colleagues compared different durations of the same work:rest ratio of intermittent
cycling (30:30 secs, 1:1, 2:2 and 3:3 mins) at 100%VO2max for a 1-hr period. The
intermittent outcomes were respectively as follows: VO2 (2.9, 2.93, 4.4 and 4.6 L/min),
HR (150, 167, 178 and 188 beats/min) and BLa (2.2, 5.0, 10.5 and 13.2 mmol/L). The
maximum continuous work was sustained for only 9 mins and resulted in 4.6 L/min of
VO2, 190 beats/min of HR and 16.5 mmol/L of BLa (Astrand, Rodahl, Dahl &
Stromme, 2003). According to this data, a 1-min work and rest could be used as a cut-off
between short and long aerobic interval exercise, and the major differences between
short and long interval exercise were VO2 and BLa. Therefore, aerobic interval exercise
can be divided into two categories: short and long aerobic interval exercise. Short
aerobic interval exercise consists of work duration of up to 1 min with a similar or longer
rest time. Long aerobic interval exercise consists of work duration between 1 min to 5
mins and rest of the same period or longer.
2.2.2 Recovery interval
During interval exercise, stored Adenosine Triphosphate (ATP) in the muscles
provides 1.6%, Phosphocreatine (PCr) hydrolysis provides 16.3% and glycolysis

Page 16
provides 82.1% of the ATP demands, which evoke lactate secretion (Lambert & Flynn,
2002). PCr content availability and the rate of PCr resynthesis were postulated to reduce
BLa (Balsom, Ekblom, Soerlund, Sodln & Hultman, 2007). It is suggested that the
ability to reload myoglobin during rest intervals can delay BLa production during
interval exercise (Billat, 2001a). Recovery interval length is a crucial factor that affects
glycolysis, PCr resynthesis and the secretion of BLa.
In the long interval recovery, PCr can be fully replenished in less than 3 mins
(Billaut et al., 2003). In addition, Blonc et al. (1998) suggested that an arbitrary 5-min
recovery period is sufficient to perform the force-velocity test. PCr concentration
decreased to less than 5% after 30-sec maximal cycling at 100 rpm, and increased to
95% of the initial resting level after a 4-min recovery period (McCartney et al., 1986).
Essen et al. (1977) reported that the recovery interval should last more than 15 secs to
allow a reasonable time for PCr resynthesis; the intensity of exercise in Essen’s study
was 100%VO2max. According to Billat (2001a), the early work of Margaria et al. in
1969 suggested that 25 secs is the minimal time to resynthesise PCr in interval exercise
at intensity above maximal aerobic capacity. Therefore, minimal recovery time required
to resynthesise PCr is correlated to intensity of the exercise performed.
Recovery intervals, being characterised as either active or passive, critically
affect the outcomes of short and long aerobic interval exercise. For example, young
active males ran four times intermittently at 12 km/hr for 4 mins with 4-min active or
passive recovery. It was found that BLa was significantly higher after passive recovery
interval exercise than after active recovery interval exercise by 38% (Mandroukas et al.,
2011). Miladi et al. (2011) designed an experiment to have two series of four intermittent
exercise of 30-sec work and 30-sec rest followed by continuous supramaximal exercise
at 120%Wmax, separated by 4-min recovery with either passive, active or dynamic
stretching. Both types of active recovery increased VO2 and HR and decreased BLa
compared with passive recovery. Furthermore, the dynamic stretching recovery
increased the time of continuous supramaximal exercise compared with the active and
passive recovery.
On the other hand, Dupont and Berthoin (2004) compared active and passive
interval training at 120%VO2max for 15:15 secs work:rest. Participants maintained the
passive-recovery session to exhaustion and attained time above 90%VO2max for a
longer time than the active-recovery exercise. Participants spent longer at a level above

Page 17
90%VO2max during active-recovery exercise when time is expressed as a percentage
relative to time to exhaustion. Moreover, long aerobic interval exercise (work:rest ratio
of 2:2 or 3:3 mins) could elicit better outcomes when using a passive rest (Billat, 2001a).
Passive rest recovery could explain the superiority of the improvement of VO2max after
high-intensity continuous exercise and long interval exercise compared with short
interval exercise, although the latter also improves VO2max (Franch, Madsen, Djurhuus
& Pedersen, 1998). With this contradiction between studies of passive and active
recovery intervals, passive recovery is unavoidable in some circumstances such as
short interval training on a treadmill or manual braked ergometer when altering
speed or workload is difficult during a very short time period.
2.2.3 Interval exercise among the obese
There is growing interest in using interval training to improve health although its
effectiveness in weight management is not yet evident. For example, the 2009 ASCM
Position Statement on weight management did not discuss interval exercise (Donnelly et
al., 2009), but the latest ACSM Position Statement of physical activity emphasised the
importance of interval training in improving physical fitness and preventing disease.
Interval training can improve cardiorespiratory fitness and blood glucose greater than
steady-state training, but it is less effective in improving resting HR, body composition
and total cholesterol/HDL ratio. From the available short-term studies, the expert panel
of ACSM found that interval training is ‘a promise for adults’ (Garber et al., 2011).
Few studies have used interval exercise in the obese (Roffey, Byrne & Hills,
2007b; Saris & Schrauwen, 2004; Schjerve et al., 2008; Venables & Jeukendrup, 2008)
although this form of activity has been suggested for the obese population (Malatesta et
al., 2009b) to enhance fat loss including central fat (Trapp, Chisholm, Freund &
Boutcher, 2008). Researchers used either a long duration of work and rest with a
moderate-intensity or a shorter duration of work and rest with a higher intensity. Each
design has a number of advantages; for example, high-intensity training could help to
increase blood flow, and a long recovery interval could help to regenerate PCr (Billaut et
al., 2003; Lambert & Flynn, 2002; Tomlin & Wenger, 2001). Table 2-1 summarises
previous studies that investigated interval exercise among the obese.
The few studies using either high-intensity with short stages or moderate-
intensity with long stages have not provided clear conclusions regarding the potential
Page 18
effect of either intensities of interval training. For example, there is only one study that
has used the Wingate protocol among the obese (Whyte et al., 2010). Although this
study found a significant improvement in metabolic and physiological markers, it did not
include a control group. Another study found moderate-intensity interval exercise was
less effective than continuous moderate-intensity exercise in improving fat oxidation
during continuous exercise (Venables & Jeukendrup, 2008). In addition, several studies
have examined interval exercise at the levels between LT and VO2max in the obese. One
study found a similar adaptation to continuous training (Roffey et al., 2007b). Another
study reported that high-intensity interval training did not improve insulin sensitivity and
fat oxidation. However, this study used combined intensity with a restricted CHO diet
program and did not include an exercise-only group (Sartor et al., 2010). Few studies
have investigated the impacts of interval training on VO2max and fat oxidation in the
obese population, and the findings of these studies were not consistent. In addition, it is
important to investigate the influence of interval training on eating behaviours such as
appetite sensations and nutrient preferences to evaluate the effectiveness of interval
training in weight management.
In summary, interval exercise can be categorised as either aerobic or anaerobic
exercise. High-intensity aerobic interval training could be more appropriate for the obese
than anaerobic interval exercise. Whether high-intensity interval training is more
effective than moderate-intensity interval training on improving fat oxidation is not clear,
and the influence of interval training on eating behaviour has not been tested. It is
important that the intensity and length of work and recovery be considered in the design
of aerobic interval training protocols as they can affect physiological responses.

Page 19
Table 2-1. Findings of studies that used interval training among the obese population
Study
reference
Participant
characteristics
Experimental design Findings
(Whyte et
al., 2010)
Overweight/ obese
sedentary males
Six sessions of repeated Wingate-
based protocol, with no control
group.
Increased
VO2max, fat
oxidation and
insulin
sensitivity
(Sartor et
al., 2010)
Overweight/ obese
sedentary adults
14-day CHO diet restriction alone
and combined with 4-min exercise
at 90% VO2peak with 3-min
recovery rest repeated 10 times for
3 sessions per week
Exercise
increased
VO2max but not
fat oxidation
and insulin
sensitivity
(Venables
&
Jeukendrup,
2008)
Obese males 5-min ±20% FATmax for 30-60
mins for four weeks, compared
with continuous at FATmax
Better fat
oxidation after
continuous
protocol
(Trapp et
al., 2008)
Sedentary healthy
women
BMI = 23.2 ±2.0
kg/m2
%BF = 35.1 ±2.7
8:12 secs at 70%VO2peak for 20
mins for 15 weeks, compared with
60 %VO2peak for 20-40 mins
A greater
reduction in
central fat after
HIIE
(Schjerve et
al., 2008)
Obese individuals 4-min 85-95%HRmax, 3-min
active recovery for 40 mins for 12
weeks, compared with 60-
70%HRmax
The superiority
of HIIE to
improve:
aerobic
capacity,
endothelial
function and
markers of MS
(Tonna et
al., 2008)
Obese patients
with Metabolic
Syndrome
4-min 90%HRmax, 3-min 70
%HRmax for 40 mins for 16
weeks, compared with continuous
at 70 %HRmax
(Saris &
Schrauwen,
2004)
Obese males 2.5-min 80% Wmax, 2.5-min 50%
Wmax for 3×30 mins, acute
exercise in two days, compared
with 38% Wmax continuously for
60 mins three times in two days
No differences
in 24-hr EE and
substrate
oxidation
(Roffey et
al., 2007b)
Obese males 1-min 85% VO2max, 1-min rest
for 12 weeks, compared with
60%VO2max training at FATmax
Similar
improvements
(Kaminsky
& Whaley,
1993)
Obese individuals 3-min 90% VO2peak, 3-min 30%
VO2peak for 30 min, acute
exercise, compared with
60%VO2peak
Significant
increase in
EPOC after
HIIE
VO2max: maximal aerobic capacity; Wmax: maximal workload; EE: energy expenditure;
FATmax: intensity that elicits maximal fat oxidation; BMI: body mass index; %BF: the
percentage of body fat to body weight. EPOC: excess post-exercise oxygen consumption;
HIIE: high-intensity interval exercise.

Page 20
2.3 The prescription of aerobic exercise training using GXT
2.3.1 Methods of exercise prescription using GXT
Cardiorespiratory fitness refers to the ability to produce energy aerobically using
large muscles over a prolonged period (Heyward, 2002; Whaley, Brubaker & Otto,
2006). Cardiorespiratory function reflects the integration of pulmonary ventilation,
pulmonary diffusion, transportation of O2 and carbon dioxide (CO2) and gas exchange at
the muscle level. Collectively, these processes reflect the ability of the heart to deliver O2
to working muscles and the ability of muscle tissue to extract and utilise O2 (Whaley et
al., 2006; Wilmore & Costill, 2004). VO2max is the maximal oxygen uptake by the body
during maximal exertion (Wilmore & Costill, 2004). Higher maximal aerobic power is
associated with reduced mortality, with each additional metabolic equivalent (MET) at
maximum is associated with a 17% increase in survival (Le, Mitiku, Hadley, Myers &
Froelicher, 2010). Measuring VO2max using a gas analysis exchange system while
performing a GXT is considered a robust method of evaluating cardiovascular function
(Wasserman, Hansen, Sue, Stringer & Whipp, 2005).
Aerobic exercise training can be prescribed during GXT through the relationship
between physiological variables (VO2, HR, BLa), maximal fat oxidation (MFO) or RPE
and mechanical work (Hofmann & Tschakert, 2011; Meyer, Gassler & Kindermann,
2007; Robertson, 2004), and several test designs have been suggested using these
markers. For example, exercise intensity is commonly expressed relative to VO2max
(%VO2max), and HR is a common physiological marker used to monitor exercise
intensity. The use of HR is based on the assumption of a linear relationship between VO2
and HR (above 110 beats/min) during aerobic exercise (Howley, 2001). However, there
are several limitations for the use of %VO2max and %HRmax in prescribing exercise
training. For example, different exercise testing protocols can result in differences in the
VO2max value and the VO2-HR relationship obtained (Roffey, Byrne & Hills, 2007a). In
addition, while prescribing exercise intensity as a %VO2max, it does not count
individual variation in resting VO2. It was found that the Bruce protocol underestimated
workload by 1 to 3 METs at a given %HR reserve (%HRR) (Cunha, Midgley, Monteiro
& Farinatti, 2010). Percentage of oxygen uptake reserve (%VO2R) and %HRR refer
to levels of equivalent intensity, which increases the accuracy of exercise
prescription (Whaley et al., 2006). The equivalent correspondence between %HRR and

Page 21
%VO2R but not %VO2max has been proven in healthy lean (Swain & Leutholtz, 1997)
and obese (Byrne & Hills, 2002) adults.
Exercise intensity relative to VO2max or HRmax may not reflect individual
metabolic capability (Hofmann & Tschakert, 2011). For example, describing exercise
training according to %HRmax and %VO2max corresponded to a wide range of
intensities relative to LT in the obese population (Achten et al., 2002). Hollmann (2001)
developed submaximal parameters to assess aerobic performance, and termed the
ventilatory method as a 'point of optimal ventilatory efficiency' and referred to the lactate
method as 'endurance performance limited'. Wasserman tested the relationship between
ventilation and oxygen uptake, and established the term 'anaerobic threshold'.
Wasserman and colleagues then improved methods to detect and interpret the anaerobic
threshold (AT) (Wasserman et al., 2005), which can be calculated using different
approaches (Gaskill et al., 2001). Moreover, the use of the ventilatory threshold (VT) has
been suggested as a means for improving the accuracy of exercise prescription
(Salvadego et al., 2010). To date, the response of blood lactate to exercise is still
controversial in terms of its mechanism and detection (Weltman, 1995). Several methods
of LT detection have been suggested (Bishop, Jenkins & Mackinnon, 1998; Davis,
Rozenek, DeCicco, Carizzi & Pham, 2007; Yoshida, Chida, Ichioka & Suda, 1987), but
there is no universally accepted procedure to attain a BLa curve (Faude, Kindermann &
Meyer, 2009). Despite this inconsistency, the response of BLa during GXT is commonly
considered the best marker to prescribe exercise training.
Two main transition breakpoints: the aerobic (first lactate – LT1) and anaerobic
(second lactate – LT2) thresholds can be determined by individual BLa and
corresponding respiratory and metabolic variables, and can divide exercise training into
three phases. The first phase corresponds to BLa of ≤ 2 mmol/L, and training at this
phase can improve fat oxidation particularly in untrained individuals, but it may not
improve physical fitness as the intensity of this phase is low. In the second phase, BLa
and ventilatory responses increase, and VO2 will consequently have a new higher steady-
state corresponding with a steady-state of BLa that slightly decreases during prolonged
exercise sessions. Training in this phase often increases fat oxidation and physical
fitness, and training at the upper level of this phase is recommended to improve aerobic
capacity but not fat oxidation which could be negligible at the level of second LT. The
last phase is the anaerobic phase where there is no steady-state in metabolic and

Page 22
physiological responses until volitional exhaustion, and CHO source is the predominant
energy supply (Binder et al., 2008; Bircher & Knechtle, 2004; Bourdon, 2000; Carey,
2009; Faude et al., 2009; Wasserman et al., 2005; Yoshida et al., 1987).
The concept of exercise intensity influencing substrate oxidation and energy
metabolism has been widely recognised (Jeukendrup, Saris & Wagenmakers, 1998). The
exercise intensity (FATmax) that elicits MFO during GXT has been determined among a
homogeneous group (Achten et al., 2002), which allows selection of this intensity in a
single-test protocol. However, there were wide variations in MFO in homogeneous
groups, which increase the error of generalising the use of MFO test. Bircher et al.
(2005) found the range of MFO (35-75 %VO2max) was wider than the range of blood
lactate at MFO (1.5-3.5 mmol/L) although VO2 at LT was similar to VO2 at MFO.
Therefore, at LT some participants worked at a level that was higher than MFO level and
some participants worked below the MFO level. It seems challenging to define the
intensity zone of MFO in homogeneous groups due to the wide inter-individual variation
(Meyer, Folz, Rosenberger & Kindermann, 2009). Achten et al. (2002) agreed with the
obstacle of determining a defined intensity of MFO relative to HRmax or VO2max
because of the inter-individual variations.
Rating of perceived exertion (RPE) can also be used to prescribe exercise
training during GXT, using the Borg 6-20 or the OMNI scale (Robertson, 2004). The use
of RPE to determine exercise intensity is based on the established corresponding
relationship between RPE and HR during incremental exercise (Howley, 2001). RPE is
generated by neural drive from the motor cortex area as well as physiological feedback
from the periphery (Lambert et al., 2005; St Clair Gibson et al., 2003). Therefore, it is
used to properly estimate the tolerance to exercise, and to avoid overtraining and
overloading in lieu of physiological equipment-based markers (Garcin & Billat, 2001).
Moreover, RPE provides a flexible means to exchange exercise intensities and
modalities such as running and cycling. These are called cross-modal target RPE and
serve to promote long-term program adherence without compromising target
physiological levels (Robertson, 2004).
2.3.2 Responses of physiological parameters during GXT and exercise training,
and their limitations
The main limitations of using GXT to prescribe exercise training are the effects
of GXT protocol and exercise duration on the kinetics of physiological, psychological

Page 23
and substrate markers. The relationship between physiological variables during GXT and
exercise training can be influenced by the GXT protocol used. For example, RPE was
determined during GXT using the Bruce and Blake protocols, and participants then
exercised for 8 mins at matched workloads at 40 and 70 %HRR. Rates of BLa were not
different in the low-intensity exercise sessions compared with Bruce and Blake tests
(1.5, 1.6 and 1.3 mmol/L respectively), but BLa was significantly lower during the Bruce
protocol than during the Blake test and high-intensity exercise sessions (1.8, 2.8 and 3.0
mmol/L respectively) (Moreau, Whaley, Ross & Kaminsky, 1999). The GXT protocol
with longer stages could match BLa during exercise session although other factors such
as the type of activity can also affect the level of BLa. For example, BLa identified at LT
during the GXT was significantly higher than BLa during the tap dance choreography
session although both tests consist of 3-min exercise with 1-min rest (Oliveira et al.,
2010).
The increase in physiological variables during high-intensity exercise is
recognised, displaying an exponential increase relative to a linear increase in exercise
intensity, which is termed as ‘physiological stress’ (Norton, Norton & Sadgrove, 2010).
The impact of physiological stress may not be pronounced during moderate-intensity
exercise levels below LT, yet it can terminate exercise training during high-intensity
levels above LT. For example, the slow component of VO2 is a steady-state response
which occurs when individuals exercise at levels above lactate threshold and below
critical power point (Grassi, 2006). In addition, cardiovascular drift is a phenomenon
mainly characterised by an increase in HR and decrease in stroke volume during steady-
state exercise, which was proposed to partially explain the increase in RPE (Coyle,
1998). The mechanisms of the responses of these variables during steady-state exercise
will be discussed.
2.3.2.1 Responses of physiological variables (BLa, VO2 and HR) during GXT and
exercise training
Exercise performance requires energy which is predominantly supplied by an
oxidative pathway – aerobic metabolism (McArdle, Katch & Katch, 2001). While O2
can supply energy demand during low-intensity exercise below LT, O2 supply cannot
meet energy demand during high-intensity exercise above LT. Consequently, reliance on
anaerobic energy pathway results in the increase of VCO2, VE, CHO oxidation, RER
and BLa production, accompanied by slow continued increase in O2 (Wasserman et al.,

Page 24
2005). During exercise training above LT, muscle acidity, BLa and VE increase resulted
in intolerance to exercise (Grassi, 2006). Physical stress during exercise is categorised
into three levels according to the concentration of arterial lactate: moderate-intensity
exercise where BLa does not increase and performance can be comfortably sustained in
a true steady-state, high-intensity exercise where there is no steady-state but
development of a metabolic acidosis and thirdly, intense exercise where BLa increases to
the point of exhaustion (Binder et al., 2008).
Findings of several studies concurred regarding the effect of intensity on the
responses of BLa. For example, BLa did not significantly differ between the end of a 15-
min exercise session and at 50%VO2max during GXT (1.65 and 1.65 mmol/L
respectively) in women, but values taken at 75%VO2max during GXT were significantly
lower than values at the end of the 15-min exercise session (2.58 and 4.65 mmol/L
respectively) (Steffan, Elliott, Miller & Fernhall, 1999). In addition, moderate-intensity
continuous exercise at 50 W for 30 mins increased blood lactate from 1.2 to 1.35
mmol/L, and high-intensity continuous exercise at 100 W increased blood lactate from
1.72 to 7.03 mmol/L (Erdmann, Tahbaz, Lippl, Wagenpfeil & Schusdziarra, 2007). In
Steffan et al.’s study, BLa remained flat at minute 3 and minute 15 of exercise session at
50%VO2max, where it increased linearly at minute 3 and remained increasing up to
minute 15 with significant differences compared with rest and minute 3 during exercise
at 75%VO2max in sedentary women (Steffan et al., 1999).
The ability to endure a high level of BLa and sustained anaerobic exercise
performance can be attained by exercise training (McArdle et al., 2001). Therefore,
physiological responses to high-intensity exercise may differ between trained and
untrained individuals and between obese and lean individuals. For example, when obese
adolescents exercised at 40, 60 and 80%VO2max for 10 mins, the VO2 slow components
occurred in most obese individuals at 60%VO2max and occurred at 80%VO2 in all
participants. Further, 12 out of the 14 obese participants did not complete the session at
80%VO2max whereas all of the lean participants completed the session (Salvadego et
al., 2010). Moreover, high levels of physical fitness may attenuate the pattern of BLa but
not VO2 and HR. For example, well-trained cyclists were able to keep BLa constant at
MLSS for 60-min cycling, although HR and RPE drifted up from the beginning with a
significant increase at minute 30 whereas VO2 increased at minute 50 (Lajoie,
Laurencelle & Trudeau, 2000). Meyer et al. (2007) found that VO2 did not change

Page 25
during 1 hr of a constant-load moderate-intensity exercise bout, however when
intensities were greater than 50%VO2max there were significant differences in VO2
between the latest time of the session at minutes 40-60 and the earliest time of the
session at minutes 10-30. HR also significantly increased after 30 mins when intensity
was above 50%VO2max, and BLa had a steady-state pattern at intensities 43-70
%VO2max during 1-hr cycling in trained individuals (Meyer et al., 2007).
The slow component of VO2 reflects the decrease of exercise tolerance and the
increase of skeletal muscle fatigue (Grassi, 2006). Therefore, the slope of slow
component is linearly and inversely correlated with time to exhaustion (Salvadego et al.,
2010). The VO2-mechanical work slope is linear during steady-state, and was
approximately 10 ml/min/W in healthy individuals (Wasserman et al., 2005). The
estimated increase in VO2 is 9-10 ml/min/W during steady-state exercise, and is 11-17
ml/min/W during the slow component. The contributions of slow component VO2 were
3.2 ml/min/W (22.9%) and 4.5 ml/min/W (29.2%) during 30-min cycling at 40%ΔLT-
VO2max and 60%ΔLT-VO2max respectively (i.e. percentage of workloads were
determined using workload at LT as baseline and VO2max as maximal workload)
(Bearden, Henning, Bearden & Moffatt, 2004). One theoretical metabolism that
increases the slow component VO2 is the recruitment of type II muscle fibres, which
have lower oxidative enzyme capacity and greater glycolytic enzyme activity resultant in
greater VO2 cost (Schneider, Spring & Pagoto, 2009). Wasserman et al. (2005) outlined
six factors that cause the slow increase in VO2 after a 3-min steady-state, including
recruiting low-efficient fast-twitch muscle fibres and recruiting additional muscle
groups.
The increase in HR during steady-state exercise is attributed to factors including
alterations in cardio and vascular function, increase in core temperature, activity of the
sympathetic nervous system, increase in circulating norepinephrine concentrations, and
hyperthermia (Coyle, 1998). Exercise training at moderate-intensity level is not expected
to increase CV drift. For example, the DREW Study aimed to train obese middle-aged
women at HR that is associated with 50%VO2max. Although the change in CV drift was
significant, it was observed only in 0.8 % of exercise sessions and was within 4
beats/min. The average change in exercise intensity ranged from 0.01-0.04 METs and
change in treadmill speed ranged from 0.01-0.05 mph (Mikus, Earnest, Blair & Church,
2009). During 30-min high-intensity exercise, HR significantly increased to a greater

Page 26
extent than a corresponding level during GXT (Carey et al., 2009). A similar trend was
also found during exercise at MLSS (Baron et al., 2003; Baron et al., 2008). However, it
is important to note that different modes of exercise such as kayaking and tap dancing
resulted in similar VO2 and HR during GXT and exercise training (Bishop, 2004;
Oliveira et al., 2010).
2.3.2.2 Response of RPE during GXT and exercise training
One school of thought suggests that an exercise session is terminated by an
integrative homoeostatic control that is predicted by the central governor model to
maintain the basal homoeostasis rather than a failure of the homoeostatic system
including cardiorespiratory, metabolic and acid-base systems (Hampson, St Clair
Gibson, Lambert & Noakes, 2001; Lambert et al., 2005). For example, when trained
individuals performed exercise at maximal lactate steady state (MLSS) until exhaustion
(55 ±8.5 mins), VO2, VCO2, RER and ventilatory RPE did not vary. In addition, BLa did
not change in the first 15 mins and then slightly decreased until the termination of
exercise, whereas HR, general RPE and muscle RPE significantly increased (Baron et
al., 2008). This research highlights the importance of considering the perceptual effort
that is associated with physiological stress during exercise.
The majority of studies suggest that the RPE-HR relationship ranges between
r=0.8 - 0.9, and it is generally proposed that cardiovascular markers such as RER, HR,
VE and VO2 can regulate RPE at ≥ 70%VO2max and peripheral markers such as BLa,
catecholamine and glucose mediate RPE at ≤ 70%VO2max (Robertson, 1982). The
strongest correlation coefficient between RPE and HR was found during moderate-
intensity (50%VO2max) compared with low-intensity (30%VO2max) and high-intensity
(70%VO2max) continuous exercise in older women (Wenos, Wallace, Surburg &
Morris, 1996). Psycharakis (2011) found a strong correspondence between RPE and
%HRmax, while BLa correlated with RPE only at the high-intensity levels during
interval incremental training in elite swimmers. Recently, Pires et al. (2011) investigated
the influence of cardiovascular and peripheral mediators on RPE during exhausted
sessions at four intensities: the first increase of BLa (LT1), lactate threshold (LT2), 50%
of the distance between LT1 and LT2 (TT50%) and 25% of the distance between LT2 and
Wpeak (TW25%). While cardiovascular markers such as VO2, VE, RER and HR
correlated with RPE only at TW25% , BLa correlated with RPE at TT50% , LT2 and TW25%,
and none of the markers correlated with RPE at LT1. All these variables were excluded

Page 27
during the regression, and RPE was explained by glucose at TT50%, dopamine at LT2 and
noradrenalin at TW25%. This study suggested the importance of cerebral glucose at low
to moderate-intensities, and the association between cardiovascular markers and RPE
seems coincidental which is mediated by sympathetic activity. Therefore, the RPE-HR
and the RPE-BLa relationship is influenced by exercise intensity, demonstrating stronger
RPE-BLa relationship at high-intensity levels.
The association between RPE-BLa at GXT and exercise training could be
stronger than the association between RPE-HR. For example, RPE was able to conduct
different intensities of 30-min constant-load sessions based on BLa at 2.5 and 4 mmol/L
and LT measured during GXT (Steed, Gaesser & Weltman, 1994). Nine recreationally
active males ran for 30 mins at RPE corresponding to BLa at 2.5 and 4 mmol/L, and
physiological measures were taken every 5 mins. While the values of VO2 and BLa from
GXT were not different with exercise training, HR was significantly lower at all time
measures during the exercise sessions at 4.0 mmol/L, and was significantly lower in the
first 20 mins of the exercise session at 2.5 mmol/L, although it linearly increased with
time (Stoudemire et al., 1996). These studies were in line with the hypothesis that RPE
and BLa are associated and RPE and HR are uncoupled (Stoudemire et al., 1996).
It is inappropriate to generalise the RPE-HR or the RPE-BLa relationship to
different contexts. For example, RPE is different in response to exhausting incremental
and prolonged continuous exercise (Garcin, Vautier, Vandewalle, Wolff & Monod,
1998). RPE was also found to be lower during running than during cycling (Capodaglio,
2001), and during high-intensity interval exercise compared with matched workload of
moderate-intensity continuous exercise (Guiraud et al., 2010). It was also suggested that
the RPE-HR and the RPE-BLa relationship during low- and high-intensity levels were
found in cycling but not running (Duncan & Howley, 1998; Lazaar et al., 2004). Thirty
minutes of an outdoor track run at RPE corresponding to 2.5 mmol/L, BLa were
significantly higher at track running (6.9, 6.3 and 5.8 mmol/L at minute 10, 20 and 30
respectively), and HR were significantly higher at track running (182.6 and 182.9
beats/min at minutes 10 and 20 respectively) but not at minute 30 (181 beats/min)
compared with HR at 2.5 mmol/L during GXT (173 beats/min) (Thompson & West,
1998). Therefore, it is difficult to generalise RPE from GXT to different contexts of
exercise training.

Page 28
2.3.2.3 Responses of substrate oxidation during GXT and exercise training
Carbohydrate (CHO) oxidation significantly increases with increases in exercise
intensity (Romijn, Klein, Coyle, Sidossis & Wolfe, 1993b), in both obese individuals
and athletes (2004). The relationship between exercise intensity and CHO oxidation is
bilinear. For example, CHO oxidation increased at intensities between 60 and
70%Wmax, and increased further at intensities between 70 and 80 %Wmax in triathletes
(Capostagno & Bosch, 2010). On the other hand, fat oxidation reached the greatest rate
during the moderate-intensity level to shape an inverted U-curve during GXT (Achten &
Jeukendrup, 2004). For example, the rate of fat oxidation increased from low-intensity
exercise when at 25%VO2max to reach the highest level at moderate-intensity exercise
when at 65%VO2max and declined during high-intensity exercise when at 85%VO2max
(Romijn et al., 1993a).
Fat oxidation increases with time during exercise training, however there are
individual differences. For example, fat oxidation significantly increased after 30 mins of
continuous exercise in active healthy adults (Cheneviere, Borrani, Ebenegger, Gojanovic
& Malatesta, 2009a) and recreational athletes (Meyer et al., 2007). In sedentary
individuals, although fat oxidation increased with time during exercise, the increase in
fat oxidation was not linear. For example, fat oxidation significantly increased in the first
15 mins in non-obese and obese women, but slightly dropped in the non-obese group
and no significant change was detected between minutes 15 and 30 in all groups
(Kanaley, Weatherup-Dentes, Alvarado & Whitehead, 2001). Muscleoxidative capacity
rather than FFA availability may explain the decline of fat oxidation during exercise
training. For example, plasma FFA concentration increased during exercise sustained for
more than 30 mins, but this did not correspond with a proportional increase in fat
oxidation. This means fat oxidation is not limited by FFA availability during prolonged
exercise; rather it might be limited by muscle’s oxidative ability and the FFA transport
capacity (Romijn et al., 1993a). Haufe et al. (2010) suggested that fat oxidation in the
obese is limited by the skeletal muscle mass and oxidative capacity rather than
availability of free fatty acid in visceral and intramyocellular fat.
Recommendations have been made to address limitations of the incremental
MFO protocol. These limitations include carry-over fatigue which may influence the
latest stages and the length of incremental stages which may influence the rate of fat
oxidation (Meyer et al., 2007). The test should involve five stages throughout the first

Page 29
increase of blood lactate and maximal steady-state of BLa. The length of each stage
should capture the slow component of VO2 (e.g. 6 mins), and allow 5-min break
intervals to attenuate carry-over fatigue (Meyer et al., 2007). Dumortier et al. (2003)
suggested a four-stage protocol with 6-min length for each stage in obese individuals
with metabolic syndrome. It is recommended that stage length should be at least 3 mins
to reach lactate steady-state level (Bircher et al., 2005). Stisen et al. (2006) suggested a
3-min stage length and 10 %VO2max increments, which would allow six to nine stages
during the test. In addition, Macrae et al. (1995) found consistent negligible changes of
VCO2 (≤0.1 L/min) and VE (≤ 0.5 L/min) at minutes 5 and 6. Therefore, longer stages
can produce a steady state, but require higher increments. Shorter stages with lower
increments are more precise in selecting FATmax, but require a long test to attain a
steady state in every stage.
Values of MFO have been determined among trained individuals, with a high
level of variation. For example, Meyer et al. (2007) determined MFO at 64 %VO2max
among athletes, but found a wide variation of 55-95% individual aerobic threshold, and
also determined MFO at 62.5 and 59.6 among men and women (Meyer et al., 2009).
Achten et al. (2002) determined MFO at 64%VO2max and 74%HRmax in moderately
trained cyclists. Carey et al. (2004) determined MFO at 54.2%VO2max in well-trained
runners. Stisen et al. (2006) determined MFO at 56%VO2max in endurance trained
women (VO2max = 59 ml/kg/min) and 53%VO2max in untrained women (VO2max =
53 ml/kg/min). In this study, gender and physical fitness of untrained participants could
explain part of the similarity in fat oxidation rate between the groups. Obese individuals
have a lower aerobic capacity than their leaner counterparts. Therefore, the rate of MFO
was determined between 0.12 and 0.4 g/min, and intensity of MFO was determined to
range between 28 and 65 %VO2max (Bircher & Knechtle, 2004; Deriaz et al., 2001;
Dumortier et al., 2003; Haufe et al., 2010; Perez-Martin et al., 2001; Rosenkilde,
Nordby, Nielsen, Stallknecht & Helge, 2010). This is similar to the conclusion of Haufe
et al. (2010) who reported that the rate of MFO ranges between 0.16 and 0.56 g/min, and
the intensity of MFO ranges between 30 and 65 %VO2max among the obese.
The protocol of MFO test was modified in terms of initial and incremental
workloads among untrained obese individuals to meet their fitness levels (Bircher et al.,
2005; Haufe et al., 2010; Perez-Martin et al., 2001). For example, Bircher and Knechtle
(2004) started the test with 100 W in the athletes and 40 W in the obese. Roffey et al.

Page 30
(2007b) adapted Achten’s protocol among obese men to start with 50 W followed by
increments of 30 W. Haufe et al. (2010) designed the protocol to start the workload at 25
W, with increments of 25 W every 2 mins. Perez-Martin et al. (2001) suggested a
protocol of four 6-min steady-state workloads at 30, 40, 50 and 60%Wmax-predicted
with a warm-up stage at 20%Wmax. Bircher et al. (2005) compared two protocols; one
was defined as 35 W increments for 3 mins and a total of 20 mins and the other
increased according to HR and was 26 W increments for 5 mins and a total of 45 mins,
and found significant differences in MFO in men.
2.3.3 Summary of methods of exercise prescription
Several methods have been used to prescribe exercise training, including GXT.
Although this test should precisely reflect the level of aerobic performance of
participants, the reference method that determines training intensity such as fixed and
individual LT, and %HRmax and HRR, can affect the accuracy of exercise prescription
(i.e. exercise intensity). Moreover, the use of GXT to prescribe exercise training at low-
to moderate-intensity levels seems to be valid based on the responses of most
physiological variables except fat oxidation.

Page 31
2.4 Insulin sensitivity and exercise
2.4.1 Introduction of obesity and insulin resistance
Insulin resistance, hypertriglyceridaemia, low HDL-C and elevated LDL-C are
major public-health issues worldwide (Alberti, Zimmet & Shaw, 2005). Specifically,
T2D and obesity are amongst the biggest challenges to health care systems in both
developed and developing countries (Gastaldelli, 2008). The prevalence of diabetes for
all age groups worldwide was estimated to be 171 million in 2000 and is predicted to be
366 million in 2030 (Wild, Roglic, Green, Sicree & King, 2004). Insulin resistance has
increased rapidly in proportion to the increase in obesity. For example, men with a BMI
≥ 35 kg/m2 have a 42-fold increased chance of developing diabetes compared with men
who have a BMI ≤ 23 kg/m2 (Gill & Cooper, 2008). It is estimated that approximately
86% of T2D patients are obese (Aucott, 2008), and 90% of T2D patients have a BMI >
23 kg/m2 (Kopelman, 2007). Therefore, the increase in obesity may lead to an
irreversible ‘diabetes epidemic’ (Wild et al., 2004).
Several mechanisms have explained the enhancement of insulin resistance and
T2D in the obese. The first mechanism is adipose tissue functioning as an endocrine
organ and releasing pro-inflammatory cytokines, which is vital in the understanding of
metabolic pathogenesis (Despres, 2006). Cytokines can regulate appetite, energy
balance, lipid metabolism, blood pressure and angiogenesis, and they are strongly
associated with insulin resistance and endothelial dysfunction to increase the risks of
CVD (Bakhai, 2008). Abdominal fat accumulation is hypothesised to release
inflammatory cytokines from visceral tissues to the liver, which can enhance insulin
resistance (Despres, 2006). Therefore, fat distribution is considered the main factor
associated with regional insulin resistance, and abdominal obesity has become a key
marker of metabolic syndrome and the development of cardiovascular disease (Klein et
al., 2004; Phillips & Prins, 2008) as well as the rate of morbidity and mortality (Pi-
Sunyer, 2002).
The second mechanism of insulin resistance is the relationship between fatty acid
metabolism and insulin resistance, which has been attributed to complementary
pathways (Corpeleijn et al., 2009; Galgani et al., 2008). For example, lipid overload may
cause insulin resistance in skeletal muscles, liver and heart, whereas the impairment of
mitochondrial lipid oxidation in skeletal muscles can diminish insulin sensitivity in

Page 32
muscles (Rogge, 2009; Ye, Gao, Yin & He, 2007). It has been reported that an increase
in hepatic fat is associated with hepatic insulin resistance, and fat deposition within
skeletal muscle is hypothesised to lead to muscle insulin resistance (Klein, Mayer,
Schebendach & Walsh, 2007). Although fat deposition can affect insulin sensitivity in
specific organs, fat mass reduction can help to improve glucose metabolism in the whole
body. For example, fat mass reduction decreased IMTG in pre-diabetic individuals
(Corpeleijn et al., 2008), and reducing IMTG in morbidly obese patients enhanced
insulin-mediated whole-body glucose disposal (Greco et al., 2002).
2.4.2 Relationship between fat oxidation, insulin sensitivity and exercise
The relationship between FM and fat oxidation is very close; for each 10 kg FM
there is an increase in fat oxidation approximately 0.8 g/h or 20g/d (Schutz, Tremblay,
Weinsier & Nelson, 1992). In addition, it is well established that the increase of fat
oxidation is proposed to reduce RQ, and this should lead to weight reduction because
individuals with a higher RQ are more likely to gain weight compared to those with
lower RQ (Ravussin, 1995). However, this theoretical relationship cannot be generalised
to the obese population because obesity is associated with an impaired utilisation of fat.
Therefore, the increase in FM in the obese does not induce fat oxidation in muscles.
Several complementary mechanisms have explained the impairment of fat
utilisation in the obese, including skeletal muscle fatty acid oxidation characteristics, a
blunted adipose tissue lipolytic response during catecholamine stimulation,
intramuscular FFA concentration and the impairment of mitochondrial function. These
mechanisms have been termed ‘metabolic inflexibility’ (Bajpeyi et al., 2009; Blaak &
Saris, 2002; Rogge, 2009; Sparks et al., 2009). It was estimated that the rate of fat
oxidation during rest is 10-20 µmol/min, whereas the rate of fatty acid mobilisation in
abdominal obesity is 400-600 µmol/min (Horowitz, 2007). Therefore, the relationship
between FFA availability in the circulation and FFA oxidation in the muscles and the
liver are disproportionate in the obese, and this has a consequent implication of insulin
resistance (Katsanos, 2004). The storage of fat in non-adipose tissues such as muscles
and the liver is hypothesised to cause insulin resistance in these tissues (Horowitz &
Klein, 2000; Shulman, 2000). It increases the availability of fat in these tissues, and the
increase of fat will compensate for the reduction of glucose being the main fuel source
for mitochondria cells. In turn, this may cause the development of T2D (Corpeleijn et al.,
2009).

Page 33
Exercise can improve fatty acid mobilisation and oxidation, which minimises the
chances of T2D developing. For example, fatty acid partitioning may contribute to fuel
mitochondrial oxidative capacity after exercise, which would result in improving insulin
sensitivity (Horowitz, 2007). Exercise can also increase mitochondrial size and
distribution in the skeletal muscles (Rogge, 2009). In addition, endurance exercise
training resulted in an increase in the removal of fatty acids from adipose tissue, which
may prevent toxic regional fatty acid accumulation (Horowitz & Klein, 2000). The
regulation of hepatic lipid accumulation is one hypothesis of the potential effect of
exercise on hepatic insulin action (Katsanos, 2004). Moreover, Blaak and Saris (2002)
addressed the question of whether disturbed and blunted fat oxidation in the obese is
adaptive to training or is a primary event of obesity. Berggren et al. (2008) investigated
the effects of gastric bypass surgery that led to weight loss of 50 kg on fat oxidation, and
then investigated the effect of 10 consecutive days of stationary cycling at 70% VO2max
for 60 mins per session on fat oxidation among a post-surgical weight loss group, an
obese group and a lean group. The researchers found no change in fat oxidation between
the obese group and the weight loss group, whereas exercise training improved fat
oxidation in skeletal muscle in all three study groups. This means that the improvement
in fat oxidation in the body could be related to improvement in oxidative muscle
capacity rather than reduction in fat mass.
Not all studies found an association between fat mobilisation and oxidation and
insulin sensitivity after aerobic exercise training. For example, reduction of hepatic and
visceral fat and improvements in hepatic and peripheral insulin sensitivity resultant from
12 weeks of aerobic exercise was not accompanied by change in fat oxidation,
particularly among the obese (Van Der Heijden, Sauer & Sunehag, 2010). Furthermore,
Blaak and Saris (2002) assumed that increased insulin sensitivity after the exercise
intervention, which increases the reliance on CHO oxidation, could reduce fat oxidation
during rest time. Therefore the impairment of fatty acid utilisation in the obese may
disrupt the effects of aerobic exercise training on fat mobilisation and oxidation and
subsequent insulin sensitivity.
2.4.3 Effect of exercise intensity on insulin sensitivity
Exercise can influence systemic glucose homeostasis via the effect of an insulin-
induced muscle glucose uptake and glucose metabolism (Wojtaszewski et al., 2003).
After acute exercise, insulin action starts in the working muscle, which involves glucose

Page 34
transport, glycogen synthesis and glycogen synthase activation (Wojtaszewski, Nielsen
& Richter, 2002). The 2010 Position Statement of ACSM and The American Diabetes
Association (ADA) demonstrated strong evidence of the role of aerobic training on the
control of blood glucose and the prevention of T2D along with a positive effect on lipid
metabolism, whereby it appears that the intensity of exercise is not as important a factor
as the volume of exercise (Colberg et al., 2010). Another review agreed that there is a
lack of large studies that compare the effect of different intensities on glucose
metabolism, but a well-conducted meta-analysis has shown that exercise intensity is a
better predictor than exercise volume of HbA1c (Zanuso, Jimenez, Pugliese, Corigliano
& Balducci, 2010). The level of exercise intensity that is proposed to prevent T2D is not
definite (Gill & Cooper, 2008).
Moderate- and high-intensity exercise trainings were found to be effective. For
example, three sessions per week, expending 400 kcal per session at moderate intensity
(60%VO2max) and high intensity (80%VO2max) resulted in the same improvement in
glucose metabolism among sedentary men after 24 weeks of training (O'Donovan,
Kearney, Nevill, Woolf-May & Bird, 2005). Three different amounts of exercise (low-
volume moderate-intensity, low-volume vigorous-intensity and high-volume vigorous-
intensity) similarly improved insulin sensitivity after eight months of training among
overweight/obese participants (Bajpeyi et al., 2009). However, 15 days after the last bout
of exercise, it was found that only the high volume of exercise showed an improvement
in insulin sensitivity. On the other hand, some studies suggested the superiority of either
moderate- or high-intensity training. For example, moderate-intensity aerobic training
for eight weeks improved insulin sensitivity among overweight, insulin-resistant
individuals and T2D patients (De Filippis et al., 2006). A low-intensity exercise session
was found to be significantly superior to a high-intensity exercise session for reducing
hyperglycaemia during a 24-hr post-exercise period among longstanding T2D patients
(Manders, Van Dijk & Van Loon, 2010). Moreover, high-intensity exercise could be
more effective than prolonged exercise for the regulation of hepatic activated protein
kinase (AMPK) and AMPK-associated mechanisms, which improve insulin resistance
(Katsanos, 2004).
2.4.4 Effect of interval training on insulin sensitivity
Several studies found that six sessions of supramaximal interval training
significantly increased muscle oxidative and glucose transport capacities (Gibala &

Page 35
McGee, 2008). For example, this form of training significantly increased insulin
sensitivity in healthy individuals as assessed using the hyperinsulinaemic euglycaemic
clamp technique (Richards et al., 2010). It significantly increased insulin sensitivity by
23% in healthy sedentary and recreationally active men using Cederholm index (Babraj
et al., 2009) and also significantly increased fasting insulin by 24.6% in obese men
(Whyte et al., 2010). The intensity of exercise was reduced to a more practical protocol,
and was also effective in improving insulin sensitivity. For example, six sessions of
aerobic interval training, where each session consisted of 8-12 repetitions of 60-sec
interval exercise corresponding to 100 %VO2max with interval rests of 75 sec, increased
skeletal muscle oxidative capacity and GLUT4 protein content in healthy men (Little,
Safdar, Wilkin, Tarnopolsky & Gibala, 2010). In addition, the same protocol reduced
hyperglycaemia in people with T2D (Gibala & Little, 2010).
Although 16 weeks of high-intensity interval exercise at 90%HRmax
significantly increased fasting blood glucose and insulin sensitivity (HOMA) compared
with moderate-intensity continuous exercise training at 70%HRmax (Tonna et al., 2008),
Schjerve et al. (2008) found that neither high-intensity interval exercise nor moderate-
intensity continuous exercise improved insulin and glucose C-peptide after 12 weeks of
exercise training. However, in this study, resistance training improved VO2max similarly
as did continuous aerobic training. In addition, all blood profiles were not affected by
high-intensity interval training even though the endothelial function improved after this
form of exercise. Furthermore, some moderate-intensity interval training did not find an
effect on insulin sensitivity. For example, glucose area under the curve decreased after
continuous training at MFO for four weeks and interval training at ±20% MFO among
obese individuals, and insulin area under the curve decreased only after continuous
training and was significant compared with the baseline. This reduction in insulin area
under the curve was associated with the significant increase in insulin sensitivity index
after continuous training (Venables & Jeukendrup, 2008).
Two factors may explain differences in the effectiveness of interval training on
insulin sensitivity. Firstly, methods of insulin measurements differ in their ability to
detect improvements in whole-body insulin sensitivity after training. For example,
several studies did not find changes in fasting glucose (Babraj et al., 2009; Venables &
Jeukendrup, 2008; Whyte et al., 2010) and fasting insulin (Babraj et al., 2009; Venables
& Jeukendrup, 2008) although insulin sensitivity using other indices were statistically

Page 36
improved. Secondly, exercise training may indirectly affect insulin sensitivity through
impacts on other metabolic markers. For example, many studies suggested a negative
correlation between insulin sensitivity and the circulating concentration of non-esterified
fatty acids (NEFA) in response to exercise training, including high-intensity interval
exercise (Babraj et al., 2009). However other factors such as the effect of the sympathetic
nervous system and improvements in aerobic enzymes and mitochondrial capacity may
better explain the improvement in insulin sensitivity (Richards et al., 2010). Moreover,
the ability of high-intensity exercise to deplete glycogen in the muscles may also explain
the potential effect of high-intensity interval exercise on insulin sensitivity. CHO deficit
after acute exercise can enhance insulin sensitivity (Newsom et al., 2010). The depletion
of glycogen, particularly when followed by an incomplete repletion, is suggested to
improve insulin sensitivity. High-intensity interval exercise did not significantly affect
insulin sensitivity; rather, the reduced CHO diet and restricted diet improved oral
glucose insulin sensitivity, which indicates the superior effect of exogenous rather than
endogenous factors (Sartor et al., 2010). Therefore, the improvement in insulin-related
metabolic markers in response to exercise may explain the alteration in insulin
sensitivity.
2.4.5 Effect of exercise training on lipid profile
Exercise can improve plasma lipid and lipoprotein profiles (Durstine, Grandjean,
Cox & Thompson, 2002). Precisely, aerobic exercise training that uses large muscles,
unlike resistance training, seems to be effective in improving blood lipid profile
(Durstine et al., 2001; LeMura et al., 2000). For example, aerobic exercise training
significantly improved TG and HDL-C, whereas resistance training alone or in
combination with aerobic training for 16 weeks did not improve lipid profile (LeMura et
al., 2000). Aerobic training for eight weeks significantly improved TG and HDL-C, and
this improvement was sustained for 4-week post training (Stergioulas & Filippou, 2006).
Furthermore, according to a number of well-controlled studies, exercise volume and EE
seem to be the main determinants of lipid profile improvement (Durstine et al., 2001;
Katsanos, 2006). Aerobic training, at for example 24 to 32 km per week of brisk
walking, expends approximately 1,200-2,200 kcal per week, and is expected to increase
HDL-C about 2-3 mg/dl and reduce TG about 5-20 mg/dl; with fewer changes in TC and
LDL-C (Durstine et al., 2002; Durstine et al., 2001).

Page 37
Increasing exercise intensity could lead to an improvement in lipid profile. For
example, a community-based trial found that achieving the recommended level of
moderate-intensity physical activity did not change TC and TG among healthy men aged
40-65 years (Perkins, Owen, Kearney & Swaine, 2009). The increase in exercise
intensity can replete IMTG, enhance TG clearance and activate the enzyme lipoprotein
lipase (LPL) (Katsanos, 2006). Among different intensities, HDL-C increased for 24 hrs
after an exercise session at 75%VO2max (Visich et al., 1996). In addition, the STRRIDE
Study suggested that the sustained HDL-C level after 15 days detraining is intensity-
dependent (Slentz et al., 2007). Moreover, strenuous endurance training increased the
rate of triglyceride-fatty acid (TG-FA) cycling during rest time, which increases fatty
acid circulation in rest time, and a portion of this fatty acid can be used readily at the
onset of exercise (Romijn et al., 1993b). Twelve weeks of high-intensity aerobic exercise
training at 75% VO2max improved resting substrate oxidation to promote lipid
utilisation among older obese adults (Solomon et al., 2008).
Exercise and sports performed intermittently was intuitively proposed to
beneficially affect postprandial lipaemia, but further research is required to support this
intuition (Katsanos, 2006) as six sessions of supramaximal interval training did not affect
fasting TG, NEFA, TC and HDL-C (Whyte et al., 2010). High-intensity interval training
at 90%VO2max for 14 days did not improve lipid profiles among obese individuals, but
high CHO diet and/or restricted energy intake significantly improved lipid profiles
(Sartor et al., 2010). Therefore, the effect of interval exercise, independent of intensity,
on lipid profiles is unclear.
2.4.6 Summary of insulin sensitivity and exercise
Obesity is associated with insulin resistance. The mechanisms include but are not
limited to the impairment of fat oxidation, such that the improvement in fat oxidation
after exercise training is not often associated with an improvement in insulin sensitivity.
Moreover, although aerobic exercise training tends to improve insulin sensitivity, studies
are not consistent in determining the level of exercise intensity and the length of exercise
training that is required to improve insulin sensitivity. Several studies found an
improvement in insulin sensitivity after high-intensity interval training. It is
acknowledged that fasting insulin and glucose are less sensitive methods to detect
improvement in insulin sensitivity compared with some other methods. Furthermore, it

Page 38
was found that aerobic training with minimal EE of 1,200 kcal per week can improve
HDL-C and TG with less consistent effects on LDL-C and TC.
2.5 Fat oxidation and exercise intensity
2.5.1 Use of indirect calorimetry to estimate substrate oxidation
The respiratory quotient (RQ) refers to the quantity of CO2 produced in relation
to O2 consumed at the tissues level, and respiratory exchange ratio (RER) refers to CO2
expired in relation to O2 inspired at the lung level, such that RER values reflect RQ
values (Jeukendrup & Wallis, 2005). The chemical compositions (CHO, fat and protein)
being oxidised under different conditions can be estimated via RER because the amount
of O2 required to oxidise one mole of chemical components are different (McArdle et al.,
2001). For example, RER is expected to be 0.78 – 0.80 when at rest, which reflects a
high amount of fat in the mixture of fuels (Wilmore & Costill, 2004). Furthermore, the
indirect calorimetry method is considered a robust method to estimate the whole body
substrate metabolism (Jeukendrup & Wallis, 2005), and many stoichiometric equations
were proposed to calculate fat and CHO oxidation (Brouwer, 1957; Frayn, 1983;
Jeukendrup & Wallis, 2005; Livesey & Elia, 1988).
The principles of stoichiometric equations are important to understand in order to
avoid their limitations during the estimation of substrate oxidation in different exercise
conditions. Stoichiometric equations were developed under resting conditions and
therefore are not recommended for use during high-intensity exercise. During high-
intensity exercise, there is a shift in the acid-base balance which changes the size of the
bicarbonate pool at exercise intensities above 75% VO2max. Furthermore, throughout
high-intensity exercise, glycolytic flux increases which in turn increases the lactate
concentration in muscles; lactate would then move to extracellular fluid to increase
hydrogen ions (H+) which would be buffered by bicarbonate (HCO3
-), and that reaction
would increase non-oxidative CO2 which would increase the output of CO2 production.
As a result, an overestimation of CHO oxidation and an underestimation of fat oxidation
is expected if a stoichiometric equation is used in high-intensity exercise (Frayn, 1983;
Jeukendrup & Wallis, 2005).
There is a potential instability of the plasma HCO3- in the first 10 mins of interval
exercise above LT level, but constant values of VE, VCO2 and RER were observed
between minutes 22.5 and 90 (Christmass, Dawson, Passeretto & Arthur, 1999b). The

Page 39
potential instability of the plasma HCO3- in the first 10 mins was confirmed during
different durations of exercise intervals (Christmass et al., 1999a; Christmass, Dawson,
Goodman & Arthur, 2001). Similarly, significant differences in the HCO3- pool was
observed during the first hour of the post-exercise recovery period compared with the
second and third hours after 34-min interval and 60-min continuous exercise (Malatesta
et al., 2009b). These observations suggested that the use of stoichiometric equations in
interval exercise could produce acceptable and valid values providing calculations only
involving stable HCO3- states either during or after exercise.
2.5.2 Effect of intensity on fat oxidation during and after exercise
There are no differences between low- and high-intensity exercises in the 24-hr
post-exercise fat oxidation levels. For example, comparing two isocaloric exercise
sessions at low- (45%VO2max) and high- (65%VO2max) intensity with the control
resting trial, men participants efficiently utilised fat in low-intensity more than in high-
intensity trial, and fat utilisation tended to be greater in the 24-hr post low-intensity trial,
although both intensities were higher than the control trial (Henderson et al., 2007).
Melanson and colleagues performed a series of experiments to investigate the effect of
different intensities of exercise on the 24-hr post-exercise fat oxidation among different
populations, with the provision of the pre-experiment diet and the inclusion of a control
rest trial. The researchers found no differences in 24-hr fat oxidation between high-
intensity (70%VO2max), low-intensity (40%VO2max) and control rest treatments. In
addition, fat oxidation during low-intensity exercise was greater than the other
treatments, and 24-hr EE and CHO oxidation were higher during exercise than during
control treatment in moderately active individuals (Melanson et al., 2002). The
researchers’ findings were similar in obese and lean individuals. In addition, 24-hr RQ
was higher during high-intensity treatment only in lean individuals (Melanson et al.,
2009a), and 24-hr RQ did not alter among diet-induced weight loss obese individuals
(Melanson et al., 2009a). No differences in 24-hr RQ and 24-hr fat oxidation were found
between exercise and control treatments among youngsters and the elderly (Melanson,
Donahoo, Grunwald & Schwartz, 2007).
Interval exercise can affect the 24-hr fat oxidation in the same way as continuous
exercise. There were no significant differences in the 24-hr fat oxidation between high-
intensity interval exercise and moderate-intensity continuous exercise. For example,
Treuth et al. (1996) compared moderate-intensity exercise at 50%VO2max and high-

Page 40
intensity interval exercise at 100%VO2max for 2 mins with 2-min rest intervals. Fat
oxidation significantly increased during moderate-intensity exercise compared with the
high-intensity exercise. However, fat oxidation that increased in the post-exercise period
resulted in similar 24-hr fat oxidation between both treatments. Saris and Schrauwen
(2004) conducted a similar protocol of Treuth et al.’s study and concluded the same
findings in the obese population.
The conclusions from the previous studies (Saris et al., 2003; Solomon et al.,
2008; Volek, Vanheest & Forsythe, 2005) are that the intensity of exercise is not critical
in the accumulative fat oxidation. Furthermore, the previous studies found that fat loss
cannot be attributed to the direct effect of intensity on fat oxidation such as in moderate-
intensity exercise, specifically if an energy balance is maintained (Melanson et al.,
2009a). Consequently, TEE during exercise and in the 24-hr post exercise may well be
the determinant of weight loss. However, the criticism of these studies includes the use
of artificially controlled environments that do not reflect free-living eating behaviour. In
addition, experiments longer than 24 hrs are required to better reflect the medium-term
effect (Smith, 2009).
2.5.3 Optimal intensity for fat oxidation and energy expenditure
Increasing exercise intensity 10% above MFO was suggested to increase EE
without compromising the fat oxidation rate. For example, Roffey et al. (2007b)
suggested that training at 10% above FATmax can yield a higher EE than at the level of
FATmax with no significant differences in fat oxidation between these intensities. Carey
(2009) determined an overlapping area between the fat burning zone and the aerobic
training zone. Training at the highest level of the fat burning zone and the lowest level of
aerobic training zone can help to reduce body weight and improve physical fitness in the
same training program. In individuals with adequate levels of aerobic capacity, the
absolute rate of fat being oxidised at low- and high-intensity exercise are similar (Hansen
et al., 2005), but the rate of fat oxidation relative to EE at low-intensity expectedly was
higher than during high-intensity (Carey, 2009). In addition, different intensities (55-95
% of the individual anaerobic threshold) did not significantly affect the fat oxidation rate
during a 1-hr constant-load exercise session, but EE was significantly different between
these different intensities among recreational athletes (Meyer et al., 2007). Therefore, the
optimal exercise intensity for weight loss among moderately to highly trained

Page 41
individuals is the intensity that can attain the highest combination of fat oxidation and
EE.
In contrast, when MFO was determined at 40 %VO2max in the obese, training at
higher intensities such as 47 and 58%VO2max resulted in increasing CHO oxidation and
RQ with the decrease of fat oxidation (Deriaz et al., 2001). In addition, MFO was
determined at 65%VO2max in obese men, and training at this intensity resulted in similar
relative and absolute fat contribution to EE as in trained men, but when individuals
exercised at 75%VO2max, the contribution of fat oxidation to EE was higher among
trained than in untrained men (Bircher & Knechtle, 2004). In obese boys, walking at a
speed of 4 km/hr at moderate-intensity levels was recommended more than walking at a
speed of 6 km/hr, as it oxidised more fat (Maffeis et al., 2005). However in this study,
absolute fat oxidation did not change with different speeds among the first tertile (i.e. the
least obese) (0.17 and 0.17 g/min at speeds of 4 and 6 km/hr respectively), and fat
oxidation declined among the third tertile (i.e. the most obese) at higher speed (0.15 and
0.09 g/min at speeds of 4 and 6 km/hr respectively).
Cheveniere et al. (2009b) developed a model to describe fat oxidation kinetics
during incremental exercise, and used three independent variables including dilatation,
symmetry and translation which refer to the expansion and skew of the curve as well as
the shift of the curve’s centre rightwards. The curve and the peak of fat oxidation shifted
to the right in the trained, such that trained individuals utilised greater fat at high-
intensity levels compared with the untrained. The researchers concluded that when MFO
occurs at higher intensity, the curve of fat oxidation becomes dilated and the FATmax
zone tended to be larger.
2.5.4 Comparison between moderate-intensity continuous training and high-
intensity interval training on fat oxidation
It is suggested that the intensity of training can impact on fat oxidation. In acute
exercise bouts, moderate-intensity continuous exercise can increase the reliance on fat
oxidation during exercise (Melanson et al., 2009a), whereas high-intensity exercise can
increase fat oxidation in the post-exercise period (Saris & Schrauwen, 2004). In chronic
training, a moderate-intensity continuous exercise program can increase the reliance on
fat oxidation during exercise (Amati, Dube, Shay & Goodpaster, 2008). High-intensity
interval training has been found to increase fat oxidation in the same way as moderate-
intensity continuous training (Gibala et al., 2006). The influence of moderate-intensity

Page 42
continuous and high-intensity interval training on fat oxidation will be discussed to
illustrate whether there are any differences in using these two forms.
2.5.4.1 Mechanisms of fat oxidation during moderate-intensity training
While many studies found significant increases in fat oxidation after moderate-
intensity training, increasing training intensity among healthy sedentary non-obese
individuals can also improve fat oxidation, but not in the obese individuals. For example,
Van Aggel-Leijssen et al. (2002) found that fat oxidation significantly increased after 12
weeks of moderate-intensity training (40%VO2max) but did not change after high-
intensity training (70%VO2max) in obese men. Sixteen months of aerobic exercise
training at 60-75%VO2max did not change the rate of fat oxidation at rest among
overweight adults (Potteiger, Kirk, Jacobsen & Donnelly, 2008). Twelve weeks of
aerobic training at 70%VO2max three times per week did not alter RQ and substrate
oxidation in obese adolescents, but it did in lean adolescents (Van Der Heijden et al.,
2010). Twelve weeks of aerobic training at 65%VO2max increased fat oxidation by
9.2% of the baseline value in healthy sedentary women (Zarins et al., 2009). This reflects
the low aerobic capacity level and fat oxidation zone in the obese compared with their
leaner counterparts (Maffeis et al., 2005; Perez-Martin et al., 2001).
An increase in rate of FFA appearance (Ra) was found after moderate-intensity
training, and a decrease was found after high-intensity training (Van Aggel-Leijssen et
al., 2002). Plasma FFA supplied most of fat oxidation during low intensity exercise such
as at 25%VO2max, but Ra progressively declined with the increase of exercise intensity
from 65 to 85%VO2max by 45-50% and remained declined throughout 30 mins of high-
intensity exercise at 85%VO2max (Romijn et al., 1993a; Romijn, Coyle, Sidossis, Zhang
& Wolfe, 1995). The greatest supply of plasma FFA occurs at low-intensity exercise
such as at 25%VO2max, and equal contribution of plasma FFA and IMTG supply fat
oxidation during moderate-intensity exercise such as at 65%VO2max (Romijn et al.,
1993a). However, the contribution of IMTG to fat oxidation is minimal during high-
intensity exercise such as at 85%VO2max, and plasma FFA seems to partially explain
the reduction of the rate of fat oxidation (Romijn et al., 1995). For example, when lipid-
heparin was infused to restore plasma FFA, total fat oxidation increased by 27% and fat
contribution to EE increased from 27 to 35%EE compared with the control trial. This
suggested that the failure of FFA mobilisation to increase caused the decline of fat
oxidation at high-intensity exercise, such as at 85%VO2max (Romijn et al., 1995).

Page 43
The increase in fat oxidation rate during low-intensity training is attributed to the
increase in non-plasma fatty acid oxidation either via the utilisation of IMTG or very low
density lipoprotein during exercise (Van Aggel-Leijssen et al., 2002). The failure of
increasing fat oxidation after high-intensity training in the obese population was
attributed to impaired mobilisation and oxidation of IMTG (Potteiger et al., 2008).
Although the shortage in FFA circulation to supply EE demands enhances the release of
IMTG stores (Kanaley, Mottram, Scanlon & Jensen, 1995), the impairment of using
IMTG was reported during high-intensity exercise (Romijn et al., 1995). The rate of
turnover of IMTG is the determinant of IMTG utilisation; highly-trained individuals can
utilise IMTG while inactive individuals have a low rate of turnover of IMTG so they
develop insulin resistance (Moro, Bajpeyi & Smith, 2008). Although it was estimated
that IMTG contribution to non-plasma fatty acid sources is higher among the obese
compared with lean sedentary individuals during exercise (Goodpaster, Wolfe & Kelley,
2002) due to the higher storage of TG in muscles among the obese (Phillips et al., 1996),
the ability to utilise this source is limited and fat oxidation rate may decrease during
exercise sessions (Kanaley et al., 2001).
2.5.4.2 Mechanisms of fat oxidation during high-intensity interval training
The enhancement of oxidative enzymes was found in the post-exercise period of
high-intensity interval exercise. For example, a total of 2 mins of 30-sec all-out interval
cycling, or a total of 8 mins of 90%HRmax greatly enhanced peroxisome proliferator-
activated receptor y coactivator 1α (PGC-1α) during the post-exercise duration, in the
same way as 1 hr of moderate-intensity exercise training (De Filippis et al., 2006;
Gibala, 2009; Gibala & Little, 2010). Short intervention of low-volume high-intensity
interval training in comparison with steady-state endurance training showed a similar
increase in PGC-1α (Burgomaster et al., 2008). Likewise, high-intensity aerobic interval
training enhanced PGC-1α (Schjerve et al., 2008). These metabolic adaptations after
high-intensity interval training were reported in obese and T2D patients (Gibala & Little,
2010; Whyte et al., 2010). Gibala and McGee (2008) summarised their findings of
skeletal muscle responses to high-intensity interval training. They reported an increase in
muscle oxidative capacity assessed using the protein content of mitochondrial enzymes
such as citrate synthase and cytochrome oxidase, and an increase in muscle glycogen
contents and the capacity for pyruvate oxidation with a decrease in muscle
glycogenolysis and lactate accumulation.

Page 44
The summary of Gibala and McGee (2008) which suggested an improvement in
the enzymes of fat oxidation and glycogen contents and attenuation of the concentration
of BLa may not be observed in all exercise experiments. For example, Talanian et al.
(2007) found similar findings in terms of muscle mitochondrial oxidative enzymes that
improve fat oxidative, but found no changes in resting glycogen contents after seven
sessions of interval exercise at 90%VO2max. Moreover, two other studies did not find an
improvement in fat oxidation after interval training, but one study tested interval exercise
in combination with diet (Sartor et al., 2010) and the other tested moderate not high-
intensity interval training (Venables & Jeukendrup, 2008).
Several studies were inconsistent in reporting increases in either CHO oxidation
or fat oxidation during and after acute high-intensity interval exercise bouts. For
example, Christmass et al. (1999b) found that fat oxidation was almost three times lower
and carbohydrate oxidation was almost 1.2 times higher during interval exercise
compared with continuous exercise. In addition, CHO oxidation during high-intensity
interval exercise was significantly higher than CHO oxidation rate during moderate-
intensity continuous exercise (Malatesta et al., 2009b). On the other hand, the increase in
glycerol concentration reflecting greater reliance of fat source including IMTG was
reported during high-intensity aerobic interval exercise in trained and untrained
individuals, with a greater amount in the trained group (Trapp et al., 2007). Furthermore,
high-intensity interval exercise increases the reliance on both aerobic and anaerobic
sources during exercise training (Hansen et al., 2005). The activity of muscle glycolytic
enzymes, reflecting the increase in CHO oxidation, and the enhancement of 3-
hydroxyacyl coenzyme A dehydrogenase (HADH) enzyme activity, reflecting an
increase in fat oxidation, were observed in a greater amount after a high-intensity
interval program compared with an endurance training program (Tremblay, Simoneau &
Bouchard, 1994b). Therefore, the contribution of fat and CHO sources during high-
intensity interval exercise is equivocal.
The increase in BLa is believed to inhibit muscle utilisation of FFAs (Christmass
et al., 1999b). For example, the accumulation of BLa and corresponding decrement of
pH is proposed as inhibiting the transport of FFA to the mitochondria due to the
inhibition of activity of CPT1 enzyme (Stisen et al., 2006), and the attenuation of blood
lactate at moderate- and high-intensity exercise in trained individuals can explain the
increase in the utilisation of fat oxidation during high-intensity exercise (Stisen et al.,

Page 45
2006). Nevertheless, Tremblay et al. (1994b) observed the neutral effect of lactate during
high-intensity interval training. They attributed this finding to the potency of the interval
exercise model, but did not provide explanations for this assumption. Trapp et al. (2007)
have explained the possible enzymatic mechanisms of high-intensity interval exercise to
reduce lactate concentration, but they could not explain why a high-level of lactate did
not inhibit fat utilisation. Intuitively, the lactate shuttle phenomenon that has been
suggested to support CHO substrate during marathon running (Brooks, 2007) opens the
window for probable utilisation of lactate as the fuel source during high-intensity interval
exercise.
2.5.5 Summary of fat oxidation and exercise
MFO occurs at lower levels of exercise intensity in obese individuals compared
with their lean and trained counterparts. In addition, obese individuals have a limited fat
oxidation zone, such that they may not be able to target fat oxidation and physical fitness
when exercising at the fat oxidation zone. Moreover, moderate-intensity exercise
oxidises a greater amount of fat during the session, and high-intensity exercise oxidises a
greater amount of fat in the post-exercise period, such that the combined exercise and
post-exercise fat oxidation over 24-hr were equal in moderate- and high-intensity
exercise sessions. Training at moderate-intensity levels can improve fat oxidation,
whereas training at high-intensity levels can increase the fat oxidation rate in lean but not
obese individuals. Unlike high-intensity constant-load exercise, high-intensity interval
training could increase the rate of fat oxidation similar to moderate-intensity continuous
training.

Page 46
2.6 Compensatory responses to exercise intervention
Metabolic and behavioural responses to exercise intervention can affect the
success of intervention in improving health and reducing weight. Variables that interact
with energy balance such as eating behaviour or free-living (non-exercise) expenditure
are important to evaluate the success of exercise intervention. It was reported that the
compensatory response to high-volume was greater than low- and medium-volume
energy-induce training of equal intensity, in sedentary overweight/obese postmenopausal
women (Church et al., 2009). The impact of exercise intensity on compensatory response
is unclear. This section will discuss the compensations of NEAT and eating behaviour in
response to moderate- and high-intensity exercise, either continuous or interval. The first
part will discuss the components of EE, with the demonstration of the effect of exercise
on free-living activities.
2.6.1 Components of total energy expenditure
There are three components of human daily total energy expenditure (TEE):
basal metabolic rate (BMR), the thermic effect of food (TEF) and activity energy
expenditure (AEE) (Levine, 2007). BMR is the energy expended to sustain basal
metabolism and contributes to 60-75% of TEE. It can be estimated via the measurement
of resting metabolic rate (RMR) using indirect calorimetry to measure resting energy
expenditure (REE), (Poehlman, 1989). TEF is the energy that is expended in response to
a meal due to digestion and absorption, which accounts for a further 10% of TEE. The
remaining proportion of TEE is associated with AEE. AEE can be divided into volitional
exercise activity thermogenesis and non-exercise activity thermogenesis (NEAT), and
NEAT is the most variable component of TEE (Levine, 2007).
AEE represents the energy expended above REE, and it can be calculated by
dividing TEE by REE to reflect physical activity level (PAL) which ranges between 1.2
and 2.5 (Westerterp, 2008). The doubly labelled water (DLW) technique has been used
to assess TEE of individuals, and the relationship between deficits in EE and obesity
(Byrne, Hills, Roffey & Colley, 2006). Although aspects of this relationship such as
adaptive thermogenesis and diet-induced thermogenesis are still unclear (Prentice,
2007), it appears that levels of daily physical activity is a key factor in changing body
weight (Levine, 2004). It was concluded that, the decrease in daily physical activity in

Page 47
recent decades as a consequence of the modern lifestyle has led to the decrease in energy
expenditure levels (Heini, Minghelli, Diaz, Prentice & Schutz, 1996).
Structured exercise training involves planned activities to improve or maintain
one or more of the health-related components of physical fitness (Howley, 2001).
Engaging in exercise training can not only increase EE during exercise, but can also
indirectly affect PAL via the positive effects on RMR and physical fitness, which could
enhance free-living physical activity (Speakman & Selman, 2003). However, the
variability of AEE has been attributed to NEAT as the majority of people did not engage
in regular exercise training or trained for < 2 hrs per week which accounts for about 100
kcal/day (Levine et al., 2006). NEAT includes all activities and muscular contraction to
maintain posture and perform movement other than volitional exercise activity (Levine,
2004; Levine, Melanson, Westerterp & Hill, 2001; Westerterp, 2006). Increasing the
time of free-living physical activity is recommended to reduce body weight and to
improve glucose metabolism (Kriska et al., 2006). For example, several follow-up
longitudinal studies have supported the association between the increase of leisure-time
activity and the decrease in body weight (Basterra-Gortari et al., 2009).
2.6.2 Effects of the components of energy expenditure on compensatory responses
Energy expenditure components including RMR, TEF and NEAT were proposed
to contribute to energy balance and investigation of these components allows speculation
about the variability in weight changes amongst individuals. For example, accumulated
EE during exercise was the best TEE component to explain 36% of individual variability
in body weight (Barwell et al., 2009). In addition, RMR increased after overfeeding
trials, but it did not explain the differences between individuals (Joosen, Bakker &
Westerterp, 2005). RMR could not explain changes in body weight among responders
and non-responders; however, these two groups demonstrated different directions in
changes in RMR, which could be effective in the long term (King et al., 2008). While the
changes in RMR and TEF were minimal in corresponding to the amount of fat
accumulation after overfeeding, weight-resistant subjects automatically increased NEAT
which can prevent weight-gain (Levine, Eberhardt & Jensen, 1999). However, although
the physical activity index and NEAT slightly changes in some studies, it did not explain
weight and fat mass gained over a long period of time (Eckel et al., 2006).

Page 48
2.6.2.1 Compensation of NEAT during training intervention
Exercise training may enhance NEAT through increasing the subjective feeling
of energy (King et al., 2007a). Exercise facilitates the release of endorphins in the brain,
which enhances the feeling of well-being (Westerterp, 2008). In addition, the
improvement of physical fitness level can enhance free-living activity (Speakman &
Selman, 2003). On the other hand, a weight loss setback in compensation for the
increase of energy expenditure was observed with large variability between participants
(King et al., 2008). Body weight could be defended in obese people in response to an
energy deficit via adapting RMR and reducing energy expenditure by reducing free-
living physical activity (Martin et al., 2007).
In a short duration of a 7-day exercise intervention, TEE decreased
approximately 0.3-0.6 MJ/day during high-volume exercise and 0.3-0.4 during medium-
volume exercise, but the researchers assumed that this was due to fatigue rather than a
compensation of energy balance (Stubbs et al., 2002a). NEAT decreased 67% in
response to a walking intervention in obese women, but body pain and dietary reporting
bias explained 78% of the variance of compensation, and it was unclear whether subjects
were less active in their daily activities and whether that reduction affected TEE (Colley,
2005). Therefore, NEAT may decrease in medium-term training intervention due to
fatigue.
On the other hand, the STRRIDE Study found that a longer duration of eight
months increased TEE among middle-aged overweight and obese individuals, and
different exercise volume and intensity did not significantly affect NEAT (Hollowell et
al., 2009); this could be attributed to the improvement of physical fitness. A recent study
used a synchronised accelerometry and heart rate to capture the changes of NEAT in
response to 6-month exercise intervention in sedentary, middle-aged and overweight
men (Turner, Markovitch, Betts & Thompson, 2010). The researchers found that there
was a trend of increasing NEAT in the exercise group (P=0.09) although intensity
increased from 50-70 %VO2max during the intervention, and attributed the
compensation occurred in the study to the increase in energy intake.
2.6.2.2 Measurement of NEAT
Walking is an important component of NEAT, and correlates to EE (Browning
& Kram, 2005). A large body of research supports the use of motion sensors to measure
changes in physical activity levels during lifestyle interventions (Colley, 2005; De Vries

Page 49
et al., 2009). There are three main types of motion sensors which can monitor daily free-
living activity: 3-planes (triaxial) accelerometers which can measure different directional
movements (e.g. RT3), 1-plane (uniaxial) accelerometers which counts different
velocities of one directional movement through ‘activity counts’ (e.g. ActiGraph), and
the pedometer which is the simplest and cheapest movement sensor that counts total
daily steps but not the velocity of movement. Pedometers are considered the most
sensitive sensor to walking behaviour (Tudor-Locke & Lutes, 2009). The accuracy of a
pedometer to monitor free walking was evident at normal walking, but reduced among
chronic heart failure patients when they walked at low-level speeds between 40 to 60
m/min (Jehn et al., 2010), which is the same criticism for the accelerometers (Sirard,
Melanson, Li & Freedson, 2000). In addition, pedometers distinguished the levels of
physical activity between obese and normal-weight pregnant women (Renault,
Norgaard, Andreasen, Secher & Nilas, 2010). The US President’s Council on Physical
Fitness and Sports reported the correlation between uniaxial accelerometers and
pedometers to be between 0.8 and 0.9 (Tudor-Locke, 2002) or median of (r = 0.86)
(Tudor-Locke, Williams, Reis & Pluto, 2002).
The magnitude of step counts amongst obese T2D middle-aged men and women
was 6,135 ±3,865 steps/day (De Greef, Deforche, Tudor-Locke & De Bourdeaudhuij,
2010), and was 4,194 steps/day ranged between 1,346 and 19,032 in sedentary obese
T2D men (Bjorgaas et al., 2005). The sedentary cut-off is 5,000 steps/day, and the
active-level cut-off is 10,000 steps/day (McKay et al., 2009). The influence of work and
non-work days on the amount of steps is influenced by job characteristics. For example,
a sedentary job led to lower step counts during work days than non-work days in
somewhat active employees (step counts of 9,290 ±3,732 steps/day) (De Cocker, De
Bourdeaudhuij & Cardon, 2010). In one study, the average step counts among healthy
sedentary (school secretaries) women was 7,220 steps/day, and walking for 30 min
increased the total daily steps by approximately 3,000 steps/day (Wilde, Sidman &
Corbin, 2001).
2.6.3 Summary of energy expenditure components
The components of daily EE consist of AEE, RMR and TEF, and the
components of AEE including structured exercise training and NEAT can affect energy
balance. Medium-term studies between four to eight weeks found a decrease in NEAT
during exercise intervention. Longer-period interventions found an increase in NEAT

Page 50
which may be attributed to the increase in physical fitness. Movement sensors including
pedometers are valid methods to detect changes in walking which is the main component
of free-living activity.

Page 51
2.7 Eating behaviour
2.7.1 Introduction
Compensatory metabolic and behavioural responses can occur in response to
negative energy balance, which explains the variability in weight loss among individuals
(King et al., 2007a). Achieving a high volume of EE can be used as a weight loss
strategy. For example, moderate-intensity exercise such as brisk walking for 90 mins per
day can expend 500-kcal per day in order to lose 3500 kcal per week (Donnelly et al.,
2009; USDA & HHS, 2008). However, some individuals may demonstrate high levels
of dietary compensation which could undermine their actual weight loss. In one study,
achieving a high level of EE led to the target weight loss in men and women when
dietary counselling was provided (Ross et al., 2000; Ross et al., 2004). However, another
study found that in the absence of dietary counselling, men were able to reduce their
body weight (Donnelly et al., 2000; Donnelly et al., 2003). This study explained the
variation between genders in the weight loss, but it did not explain the variation between
individuals in each group. For example, the changes in body weight in half of the men’s
group (between -4 and +3 kg) were lower than the other half of the group (between -6
and -14 kg), and the same trend held true for women (Donnelly & Smith, 2005). King et
al. (2008) reported a similar range of individual variation in weight loss (between -14.7
and +1.7 kg), and divided the participants into two groups, compensators and non-
compensators, based on their actual weight loss relative to their predicted weight loss.
Compensators lost (-1.5 ±2.5 kg) and non-compensators lost (-6.3 ±3.2 kg). Therefore,
dietary compensatory responses can offset the effectiveness of the volume of EE on
body weight among some individuals.
Several studies investigated the compensatory responses during moderate-
intensity continuous training (Jakicic, Wing & Winters-Hart, 2002), with the effect of
different volume of EE on the variation in weight changes among individuals (Church et
al., 2009). Although the effect of different intensities (Jakicic, Marcus, Gallagher,
Napolitano & Lang, 2003) and different forms (i.e. interval vs. continuous) of training
(Trapp et al., 2008) on weight loss were investigated, these studies used either a 3-day
diet record or food frequency questionnaire. In addition, they did not analyse the
components of eating behaviour that could explain change in dietary compensation.
Therefore, the current section of this literature review will cover the influence of

Page 52
different intensities of acute and chronic aerobic interval exercise on food intake and
nutrient preferences by focusing on the following:
Food intake and appetite sensations
Liking and wanting
Nutrient preferences and substrate oxidation

Page 53
2.7.2 Appetite sensation and food intake
2.7.2.1 Introduction of appetite sensations and food intake
Appetite sensation is a specific term used to describe state motivation to eat. This
includes hunger, fullness, desire to eat and prospective food consumption (Sorensen,
Moller, Flint, Martens & Raben, 2003). Appetite sensations can be measured using a
Visual Analogue Scale (VAS) (Finlayson, King & Blundell, 2007a). A VAS can be used
to predict aspects of eating behaviour, has good reproducibility under controlled
conditions (Stubbs et al., 2000), and is considered a useful method to predict acute and
overall EI in various clinical contexts (Drapeau et al., 2005; Drapeau et al., 2007). It is
suggested that the sensation of hunger is the trigger (the drive) to seek food. However,
food intake involves a complex interplay of hunger signalling and satiety signalling that
integrates with the hypothalamus (Blundell & Gillett, 2001). In addition, food intake is
influenced by various environmental and psychological factors. For example, hedonic
system (non-homeostatic) can modulate not only food preferences but also the temporal
expression of appetite sensations (Blundell, 2006). Therefore, subjective appetite and
food intake measures can vary particularly in free-living conditions (Blundell et al.,
2010).
2.7.2.2 Acute effect of exercise intensity on appetite sensations and food intake
Some studies have suggested that exercise does not result in automatic increase
in hunger and EI (King, Snell, Smith & Blundell, 1996). The dose of EE during acute
exercise is often too small to trigger food intake. Therefore, King et al. (1997b)
manipulated a high dose of acute exercise session but did not find a compensatory
response in EI the following day. Accordingly, caution should be applied when using the
term 'negative energy balance', as a single bout (i.e. one day) does not represent adequate
time to detect body response to changes in energy balance (Blundell, Stubbs, Hughes,
Whybrow & King, 2003; Hopkins, King & Blundell, 2010). Using relative EI and
subtracting exercise-induced EE from EI is suggested to evaluate energy balance in
response to acute exercise compared with a resting condition (King, Burley & Blundell,
1994).
Several studies examined the effect of exercise intensity on hunger and EI. For
example, high-intensity exercise resulted in a transitory suppression of hunger (Broom,
Batterham, King & Stensel, 2009; King & Blundell, 1995). Two running sessions, in the
morning and afternoon, on the treadmill at approximately 70% HRmax for 50 mins

Page 54
(equivalent EE = 1200 kcal) did not increase the average daily hunger and EI in the
training and following day compared with non-exercise conditions (King, Lluch, Stubbs
& Blundell, 1997a). Moreover, relative EI during a high intensity exercise session (75
%VO2max) was significantly lower than during moderate-intensity and control sessions,
but it should be noted that relative EI in this study takes exercise duration into account
(Imbeault, Saint-Pierre, Almeras & Tremblay, 1997). The post-exercise levels of hunger
and fullness were not different among study treatments. Furthermore, high-intensity
long-duration exercise resulted in a greater negative relative EI compared with high-
intensity short-duration exercise and the resting control sessions (King et al., 1994). In
addition, Kissileff et al. (1990) found that a meal consumed after strenuous exercise (620
g) was smaller than after moderate-intensity exercise (724 g) in non-obese but not in
obese women. Therefore, high-intensity exercise suppressed hunger in the short period
after exercise but did not affect daily average hunger. In addition, the reduction in food
intake after high-intensity exercise is also affected by the duration of exercise and the
degree of body weight.
Moderate-intensity exercise can affect appetite sensations and EI in a similar
manner to high-intensity exercise, which confirms the role of exercise training
independent of exercise intensity. For example, healthy young males showed that
absolute and relative EI 30-min after high-intensity (75%VO2max) and moderate-
intensity (50%VO2max) exercise were lower than control (i.e. rest) treatment. Hunger
during both exercise sessions was significantly lower than in the control session (Ueda et
al., 2009b). Two intermittent exercise sessions, in the morning and afternoon, at 40
%VO2max (10×15 mins interspersed by 5-min rest) and 80 %VO2max (10×7.5 mins
interspersed by 10-min rest) (equivalent EE = 1000 kcal) did not increase the average
daily hunger and EI in exercise compared with non-exercise conditions (Wuorinen,
2008). A moderate-intensity exercise session of brisk walking decreased the desire to eat
and prospective food consumption, and increased fullness and satiety compared with the
resting session. However, this did not affect the food intake in obese women (Tsofliou,
Pitsiladis, Malkova, Wallace & Lean, 2003). Moderate-intensity exercise also
suppressed hunger, compared with the response of hunger during a control resting trial
(Cheng, Bushnell, Cannon & Kern, 2009; Martins, Morgan, Bloom & Robertson, 2007),
but this effect was short-lived and disappeared after 1 hr, so that absolute EI was higher
in the exercise group compared with the resting trial, but relative EI in the exercise

Page 55
treatment was lower than the resting condition (Martins et al., 2007). In addition, relative
EI decreased by 439 kcal after 60 mins of brisk walking compared with the control (i.e.,
resting) trial in a group of young fit men (King, Wasse, Broom & Stensel, 2010). These
studies showed that aerobic exercise, rather than exercise intensity affects suppressed
appetite and reduced relative EI.
It is important to consider that external factors such as exercise forms, exercise
duration and time of meal eaten can also interact with exercise intensity and alter the
response of appetite sensations and EI. For example, 60 mins with 20-min aerobic and
20-min muscle conditioning exercise increased hunger and prospective food
consumption and decreased satiety and fullness in healthy normal-weight women, but
did not affect EI such that relative EI was lower during exercise than during rest
treatment (Maraki et al., 2005). In two experiments involving two hours of exercise,
hunger and EI were significantly higher than the rest condition, and EI compensated for
exercise-induced EE which was 500 kcal (Verger, Lanteaume & Louis-Sylvestre, 1992).
It was also found that the longer the delay of the meal provided (30, 60 and 120 mins),
the higher the amount of energy consumed (Verger et al., 1992; Verger, Lanteaume &
Louis-Sylvestre, 1994). Therefore, different exercise contexts can differently influence
appetite sensations and EI.
In summary, high-intensity exercise constantly suppressed appetite sensations.
There are also a number of studies which found that moderate-intensity exercise
suppressed appetite sensations. Exercise does not alter food intake, therefore exercise
leads to negative energy balance independent of exercise intensity when considering
relative EI. However, these findings are subject to several external factors which may
interact with exercise to alter the response of appetite sensations and EI.
2.7.2.3 Medium-term effect of exercise training on appetite sensations and food
intake
The medium-term effect of interval training on food intake was investigated in
the long-term studies (≥ 12 weeks), with inconsistent findings. For example, interval
training for 12-24 weeks compared with moderate-intensity continuous trainings
similarly decreased body weight (Tonna et al., 2008), did not decrease body weight and
did not change EI (Donnelly et al., 2000; Roffey et al., 2007b; Tremblay et al., 1994b) or
decreased body weight only after interval training although macronutrient and EI did not
change (Trapp et al., 2008). In addition, the influence of different intensities on food

Page 56
intake was tested in continuous training. Moderate- and high-intensity aerobic training
for seven weeks did not cause changes in food intake among women compared with the
control group. However, high-intensity training tended to decrease food intake more than
moderate-intensity training (213.1 kcal/day vs. 120.8 kcal/day) (Dickson-Parnell &
Zeichner, 1985). Jakicic et al. (2003) also found that different combinations of intensity
and duration for 12 weeks accompanied by reduced EI in overweight sedentary women
significantly reduced body weight with no differences between groups. There were
likewise no significant differences between groups in the pattern of change for EI and
percentage of fat intake relative to EI at weeks 6 and 12. Therefore, the intensity of
aerobic training, either interval or continuous does not affect food intake.
All of the previously mentioned studies used a food frequency questionnaire or a
food record method which have limitations that undermine the reliability of EI
assessment. For example, a decrease in EI during training intervention (i.e. negative
energy balance) was found in trained adolescents although body weight did not change.
This was attributed to the underreporting of food intake (Ambler et al., 1998). Studies
that compared EI using the dietary intake record method with EE using DLW method in
obese participants found differences of more than 30% between the two methods
(Colley, 2005; Goris, Westerterp-Plantenga & Westerterp, 2000; Roffey et al., 2007b).
Using other methods of food intake assessments such as a test meal will include sensory
aspects such as taste, smell, texture and sound that may impact on the choice and amount
of food consumed (Rolls, 2007). The design of a test meal and the time when the meal is
provided can affect the outcome of an experiment. Offering a wide variety of food in
buffet style may not be a sensitive strategy for the purpose of nutrient selection because
it promotes interest in different foods and increases food intake (Blundell et al., 2010). In
addition, meal timing in the post-exercise period can affect nutrient choice. For example,
participants preferred protein intake 30-min after prolonged exercise, which was
attributed to having a specific appetite for protein because of muscle tissue breakdown
(Verger et al., 1994).
It was reported that 65% of short-term (2-5 days) exercise studies did not show
changes in EI, 19% reported an increase and 16% reported a decrease in EI, which could
be attributed to the short-term period that does not allow EI to track the increase in EE
(King et al., 1997b). A series of well-controlled studies between 7-14 days were
performed to investigate the responses of EI to exercise-induced EE during medium- and

Page 57
high-volume exercise compared with non-exercise treatment. The main findings were
that exercise training led to negative energy balance especially at high-volume treatment
in men, and EI increased about 30% to compensate for the exercise-induced energy
deficit in women during a 7-day intervention (Stubbs et al., 2002a; Stubbs et al., 2002b).
In the longer study of 14 days, EI accounted for 30% of the compensation in EE in men
and women (Whybrow et al., 2008). While these studies quantified the initial dietary
compensation during moderate-intensity intervention with different volumes, there is
lack of studies that monitor the alteration in eating behaviour during medium-term
interval training with different intensities.
The responses of appetite sensations to medium-term training intervention may
be controlled by the reduction in body weight and the improvement in peripheral
signalling. Studies that monitored the change in EI in response to exercise-induced EE
during 7-14 days did not find a coupling change in appetite sensations and EI. When
participants completed a questionnaire at the conclusion of each day they reported an
increase in average hunger throughout exercise days compared with rest days (Stubbs et
al., 2002a; Stubbs et al., 2002b; Whybrow et al., 2008). In a 6-week program of reduced-
dietary intake combined with skill-based physical activity and a behavioural program
with obese children, King et al. (2007b) found subjective sensations of appetite were
sensitive to a medium-term negative energy balance. However, there was a significant
reduction in body weight (8.3 kg) in this study, so appetite sensations could respond to
this reduction in body weight rather than any effects of exercise. The effect of 12-week
aerobic training on fasting and average daily hunger was tested in a subsequent study
(King et al., 2009). Fasting and daily hunger were increased in non-responders whose
actual weight loss were lower than the predicted weight loss. Responders did not
experience an increase in daily hunger but did experience a significant increase in fasting
hunger. The researchers suggested a dual-process of appetite regulation in response to
weight loss-induced exercise training; an increase in hunger to compensate for the
energy deficit, and an increase in satiety as a consequence of appetite signalling
regulation. In conclusion, medium-term training studies found coupling responses of
appetite sensations and negative energy balance especially in the fasting measure.
However, the effect of medium-term training on appetite sensations exists only among
some individuals and may be subject to the improvement in appetite signalling.

Page 58
Appetite could be regulated by two types of peripheral signals: acute signals also
known as 'episodic signals' such as ghrelin and peptide hormones and constant signals or
'tonic signals' such as leptin and insulin (Blundell, 2006; Martins, Robertson & Morgan,
2008b). Although exercise-induced EE could trigger the peripheral signals, which plays
a role in the regulation of hunger sensations (Borer, Wuorinen, Chao & Burant, 2005),
the obese populations show an increase in postprandial insulin resistance (i.e. the rise in
the blood glucose level after eating) which can affect the regulation of appetite in the
obese (Flint et al., 2007). In addition, obese individuals have a strong craving for foods
that are sweet and high in fat such as chocolate, cookies and ice cream (Drewnowski &
Holden-Wiltse, 1992). The preference for palatable food is suggested to strongly
enhance the opioid peptide and consequently increase hunger and food intake
(Drewnowski & Holden-Wiltse, 1992; Sorensen et al., 2003). Therefore, change in the
nutrient preferences of high-fat sweet, energy-dense food among the obese in response to
training should be considered as a key factor in improving eating behaviour.
2.7.3 Nutrient preferences
2.7.3.1 Determinants of nutrient preferences during training
Few studies investigated the influence of intermittent training (i.e. multiple 10-15
mins exercise sessions (Jakicic et al., 2001)) on nutrient preferences. In one study, 16
months of moderate-intensity aerobic training did not significantly alter the
macronutrient composition measured intermittently at months 3, 6, 9, 12 and 16 in the
male and female groups compared with controls (Donnelly et al., 2003). The researchers
also tested the effect of intermittent exercise on macronutrient intake in women, and
found no changes in macronutrient intake after 32 weeks of brisk walking 3×10 mins per
session, five times per week (Snyder, Donnelly, Jabobsen, Hertner & Jakicic, 1997).
However, they found a significant decrease in fat intake with no change in CHO intake
at months 9 and 16 during 2×15 mins per session, five times per week of brisk walking
(Donnelly et al., 2000). Donnelly at al. (2000) did not find changes in macronutrient
intake during continuous exercise for 30 mins per session, three times per week. These
studies suggested the role of frequency of exercise, rather than the form of exercise, on
nutrient selections. There is lack of studies that investigate the effect of interval training
on nutrient preferences. Understanding the effect of interval training on hedonic
responses and food reward will provide a better explanation of any changes in nutrient
preferences.
Page 59
2.7.3.2 Liking and wanting
2.7.3.2.1 The principal of the liking and wanting procedure
Behavioural and physiological studies show that excessive food intake might not
be related to physiological needs. Non-homoeostatic stimuli such as an explicit pleasure
of eating can also increase food intake (Mela, 2006), as the cortico-limbic system
(cognitive, rewarding, hedonic and emotional neural processes) affects the hypothalamus
as much as metabolic signals (leptin, ghrelin and obestatin) (Zheng & Berthoud, 2007).
A further investigation suggested that under specific circumstances such as repeated
exposures to palatable foods, susceptible individuals will increase the motivation to these
foods, which is explained by Incentive Sensation Theory (Berthoud, 2004; Finlayson,
King & Blundell, 2007b). Therefore, the importance of “wanting” has been suggested to
understand food reward.
The interaction between body sensory and neurophysiological systems in
response to food cues has two main pathways - liking and wanting. Liking is the
anticipated response to food which can be termed as orosensory stimuli, explicit liking of
foods, hedonic experience, the explicit pleasure of eating or an acutely perceived
hedonic reaction, and it depends on opioid activation in specific limbic forebrain
structures (Berridge, 2009). Wanting is an internal need for food regardless of the
palatability of such food, which can be termed incentive salience and non-hedonic
reward of food, reinforcement value of food, non-homoeostatic stimuli or unconscious
effect (Finlayson et al., 2007b; Mela, 2006), and it depends on mesocorticolimbic
dopamine activity (Berridge, 2009). In eating behaviour, wanting is the first perception
of a desire to eat. Therefore, imagination, expectation, cognition, prediction and
memorisation are not involved in an incentive salience or “wanting”. These different
actions of wanting, whether salient or cognitive are mediated by different regions in the
brain and may expectedly result in different desires. Incentive salience, or “wanting", is
mediated by simple brain mechanisms (Berridge, 2009). In conclusion, liking and
wanting in human eating behaviour is a psychological concept demonstrating food
reward, reflecting two operational neural pathways and represented by behavioural
responses (Finlayson & Dalton, 2011).
The experimental procedure of liking and wanting in humans has been developed
to test these food reward mediators based on the response to the combination of taste and
fat content (sweet and non-sweet food, and high- and low fat food) (Finlayson et al.,

Page 60
2007a). This procedure succeeded in dissociating liking and wanting in fed and fasting
states in humans (Finlayson, King & Blundell, 2008). For example, in hunger states,
explicit liking declined for all food categories with greater reduction in savoury relative
to sweet stimuli, and implicit wanting decreased for all food categories, particularly
sweet stimuli. In fed states, explicit liking and implicit wanting decreased with greater
reduction in non-sweet foods. Although this paradigm does not include some other
sensory factors, taste and fat content are suggested as strong advocators of eating.
Taste contributes to satiety, satiation and the thermic effect of food and reward
value. Studies have tested the influence of palatability, determined by the sensory
properties of food such as taste, smell and visual appearance, on appetite and food intake
in laboratory environments. However, the magnitude of this effect on appetite and food
intake in the real-life environments is not clear (Sorensen et al., 2003). Taste is
composed of four perceptions - sweet, salty, sour and bitter. The addition of these
sensory aspects to food affects its palatability. For example, adding sweet to high fat
food increases the palatability of this energy-dense food. Similarly, bitter and sour tastes
are not palatable so will not be accepted, but adding salt to high fat snacks increases the
consumption of this type of food such as in fast food (Nasser, 2001). The energy-density
of food can affect its palatability and consequently the amount of food intake (Kral &
Rolls, 2004; Wardle, 2007). Evidence suggests that the effect of food-density on intake
amount is stronger than other stimuli such as food composition and food presentation
(Rolls, 2009). Manipulating the same food with different contents of fat resulted in
increasing food intake only for dense food in obese and lean individuals (Rolls, 2007).
When non-obese individuals were exposed to similar foods with different nutrient
compositions, high-fat food was rated the highest while high-protein food was rated the
least pleasant food. However, there were not significant differences in the overall
pleasantness of food (Poppitt, McCormack & Buffenstein, 1998).
2.7.3.2.2 The impact of exercise training on liking and wanting
It was found that exercise enhanced the preference for high-fat sweet food
among compensatory individuals whose actual weight loss was lower than predicted
weight loss. Exercise can lead to the consumption of energy-dense food among some
individuals to reward themselves. Therefore, exercise alone may not be an adequate
strategy for weight loss among this population (Finlayson, Bryant, Blundell & King,
2009), as high-fat food can more easily abolish the post-exercise energy deficit when

Page 61
compared with low-fat and mixed food (King & Blundell, 1995; Tremblay, Almeras,
Boer, Kranenbarg & Despres, 1994a). Hunger and explicit liking did not explain this
tendency among compensatory individuals. Rather, implicit wanting explained this
preference for high-fat sweet food (Finlayson et al., 2009). Implicit wanting was higher
among the obese in the perception of energy needs whereas liking was similar in obese
and lean people in some studies (Finlayson et al., 2007b). Therefore, implicit wanting
may distinguish individuals who are subject to compensate exercise-induced EE by
enhancing the preference of energy-dense food.
Finlayson et al. (2011) investigated the effect of a 12-week supervised exercise
intervention on food rewards and liking and wanting in 34 sedentary obese males and
females. They divided participants into responders and non-responders according to
changes in body composition relative to measured energy expended during exercise.
Responders had a lower BMI, greater fat mass loss and a greater negative energy
balance. Explicit liking significantly increased in non-responders at week 12 in all food
categories with no changes among responders. There were significant differences
between groups in explicit wanting, with a specific increase for high-fat sweet food in
week 0 among non-responders, and non-responders also expressed a specific increase in
high-fat sweet food. The change in acute exercise performed in week 0 did not alter in
week 12, but the baseline values increased among non-responders.
The impact of exercise intensity on food reward is unclear. In animal studies, a
relationship between a small amount of vigorous exercise and brain substrates stimuli
that facilitate rewards for eating has been reported in rats with anorexia (Lett, Grant &
Gaborko, 1996). While this relationship was observed in rats with anorexia, the role of
food reward to increase the preference to energy-dense food during high-intensity
exercise is uncertain in humans. Average RPE during exercise can capture the
anticipation of effort at the beginning of exercise, cardiovascular and metabolic signals
during exercise and the continuous update of anticipated safe exercise duration (Tucker,
2009). Therefore, it may provide expectation of whether participants reward themselves
by increasing food intake and selecting energy-dense food. The perception of
overweight/obese participants to high-intensity interval training could increase perceived
effort. For example, in a study when participants were informed that the intensity of
exercise is high, overall RPE increased although actual exercise intensity was lower than
their expectation (Lambert et al., 2005). However, it was reported that cognitive signals
Page 62
and cerebral glucose mediates RPE at low to moderate-intensities, whereas peripheral
signals mediate RPE at high intensities (Pires et al., 2011). For example, changes in
peripheral markers and glycolytic activation such as CHO oxidation explained 70% of
the increase in RPE when exercise intensity increased above preferred selected speed
(transferred from moderate to high levels) (Willis, Ganley & Herman, 2005). Therefore,
the response of food reward could be predominant during moderate-intensity interval
training, particularly among obese individuals who are less physically active than their
lean counterparts (Hulens et al., 2001) and have greater hedonic preferences and stronger
sensations to food taste (Blundell et al., 2005). It could be assumed that food reward will
induce greater preferences of energy-dense food after moderate- than high-intensity
interval training.
2.7.4 Substrate oxidation, food intake and nutrient preferences
Respiratory quotient (RQ) was proposed to associate with the effect of exercise
on the change in body weight. For example, RQ explained 5-7% of the variance in body
weight change (Barwell et al., 2009; Galgani & Ravussin, 2008). Individuals with a
higher RER had a 2.5 times greater chance of gaining 5 kg or more in the long-term
compared with their counterparts with a lower RER, particularly in the non-obese group
(Seidell, Muller, Sorkin & Andres, 1992; Zurlo et al., 1990). Moreover, men with a
lower RQ during exercise had a smaller increase of EI relative to EE during exercise
compared with men with a higher RQ (Almeras, Lavallee, Despres, Bouchard &
Tremblay, 1995). Therefore, the post-exercise energy balance is influenced by the rate of
RQ during exercise. When individuals with a high RQ exercised and were exposed to a
high-fat meal, they increased their energy and fat intake and consumed an adequate
quantity of CHO, compared with individuals with low RQ (Tremblay, Plourde, Despres
& Bouchard, 1989). Therefore, a high rate of RQ can be associated with energy-dense
food intake after exercise.
Another predictor of weight change related to RQ is food quotient (FQ) which
reflects the macronutrient composition of foods. When EE during exercise compensated
for FQ corresponding to RQ during exercise, there was no difference between the
exercise and control condition in total EE and post-exercise substrate utilisation
(Tremblay et al., 1989). Post-exercise macronutrient oxidation is dependent on post-
exercise macronutrient intake (Dionne, Van Vugt & Tremblay, 1999). Therefore, the
equivalent mean of FQ and RQ is important to consider. Swinburn and Ravussin (1993)

Page 63
addressed the same concept with an emphasis on fat balance due to its impact on weight
balance and fat storage, which suggested the importance of fat balance in order to attain
energy balance (Swinburn & Ravussin, 1993; White et al., 1996). Recently, CHO
oxidation and CHO balance has been proposed as a better predictor of weight changes
and fat accumulation than fat oxidation (Eckel et al., 2006).
Humans are more efficient at oxidising excess CHO than excess fat due to the
limited storage capacity of CHO as glycogen (500-1000 g) and because converting CHO
to fat is rare and only occurs in extreme conditions (Horton et al., 1995; Joosen &
Westerterp, 2006). CHO oxidation after a high-CHO meal was 2 to 3-fold higher than fat
oxidation after a high-fat meal, and lasted for a longer period of time (Raben, Agerholm-
Larsen, Flint, Holst & Astrup, 2003). Afterwards, any surplus in EI above the total
energy balance will be converted to fat (Swinburn & Ravussin, 1993). Therefore, CHO
balance was a stronger predictor of the long-term fat accumulation and weight gain than
fat balance, which means individuals who have a tighter CHO balance will maintain a
stable weight (Eckel et al., 2006). Twenty-four-hour CHO oxidation correlated with
daily EI or weight maintenance energy needs (%EN-WM), and explained 32% of the
variance of EI and 15% of the variance of three days of food intake expressed as a %EN-
WM, which can influence short-term weight changes. In contrast, neither fat oxidation
nor fat balance correlated to daily EI or %EN-WM (Pannacciulli et al., 2001).
Several mechanisms such as glycogen depletion and glucose homeostasis can
explain the role of CHO balance in weight stability. Evidence from animal experiments
suggested the relationship between glycogen storage and body weight, which can be
explained by the balance between glucose oxidation and CHO availability (Flatt, 1996).
Individuals with a tendency towards glycogen depletion would experience increased
hunger and have a positive CHO and energy balance (Eckel et al., 2006). Moreover,
Feinle et al. (2002) emphasised the role of ingested CHO in stimulating insulin, glucose
and gastrointestinal hormones which play important roles in satiety and food intake.
Fasting glucose and insulin were correlated with the adjusted 24-hr CHO oxidation
(Pannacciulli et al., 2001). Moreover, Galgani and Ravussin (2008) concluded that
genetic variables of either behavioural pathways that increase appetite or substrate
oxidation that deplete CHO storage during food absent periods are the main factors that
control and regulate food intake and weight stability. For example, post-obese
participants showed a significantly lower fat:CHO oxidation ratio compared with lean

Page 64
participants who had never been obese. This could be attributed to an inherited metabolic
abnormality that predisposes some individuals to obesity (Astrup, Buemann, Christensen
& Toubro, 1994). Therefore, CHO oxidation correlates with food intake, but the effect
on nutrient preferences is unclear, particularly among the obese who have greater
hedonic preferences to energy-dense food (Mela, 2001) during rest and exercise (George
& Morganstein, 2003).
2.7.4.1 Further factors that impact on nutrient preferences
It is important to recognise that some other factors can interact with exercise to
influence nutrient preferences. Psychological factors can affect the selection of nutrient
composition after exercise (Bellisle, 1999). For example, low-intensity, short-duration
exercise such as a 15-min brisk walk reduced chocolate urges among regular chocolate
eaters, which showed the effect of small dose of exercise on mood (Taylor & Oliver,
2009). Using a multi-dimensional conceptualisation of chocolate cravings, light short
exercise significantly reduced the desire to eat chocolate, and may have increased control
of overeating (Taylor & Oliver, 2009). In addition, a recent review suggested the
influence of physical activity on cognitive and neurobiological signalling which alter the
brain's neurobiological substrates and consequently modify eating behaviour (Joseph,
Alonso-Alonso, Bond, Pascual-Leone & Blackburn, 2011). Apart from the measurement
of implicit wanting and the indication of RPE, the influence of psychological mediators
on nutrient preferences was not investigated in the current thesis.
Gender can be associated with the effect of exercise on nutrient preference. For
example, Ambler et al. (1998) found that exercise training did not alter nutrient intake
composition in men, however training increased fat intake and decreased CHO intake in
women. Women decreased CHO intake by 7.6% and protein by 8.8% with no change in
fat intake after seven weeks of aerobic training (Barwell et al., 2009). Women consumed
more fat and protein after high- and low-intensity exercise than the control session.
There were significant differences between high-intensity exercise and the control
session in fat and protein intake, and daily CHO intake also significantly increased in the
high-intensity exercise session (Pomerleau, Imbeault, Parker & Doucet, 2004). Elder and
Roberts (2007) concluded that a slight trend of an increase in fat intake may occur
among women and CHO intake may accrue among men after chronic exercise.
The interaction between the duration of exercise session and the time when a
meal is consumed after training can also affect nutrient preferences. For example,

Page 65
prolonged moderate-intensity exercise did not alter the percentage of nutrient
components consumed immediately after the exercise session in young fit male and
female participants. However, the absolute amount of food intake was significantly
higher than the rest group. Subsequently, the percentage of protein eaten decreased,
CHO increased and fat did not change in meals consumed 1 and 2 hrs after the exercise
(Verger et al., 1992). In this study the increase in food came from CHO selection, which
corresponded to the rate of hunger (Verger et al., 1992). In a similar experiment, the
absolute and percentage increase of protein consumed 30 mins after the exercise was
confirmed, and the differences in absolute fat and CHO intake were attributed to the
increase in the total amount of food eaten (Verger et al., 1994). Therefore, caution should
be applied when interpreting the current research which involves overweight or obese
men, and when exercise duration is between 30 and 45 mins.
2.7.5 Summary of the interaction between nutrient preferences, appetite
sensations and food rewards
Exercise may indirectly increase food intake via changes in meal size, an
increase in hunger and alterations in nutrient preferences (King et al., 2007a). The
selection of high-fat food after exercise is reported to increase the energy density of the
diet which increases EI, whereas consuming low-fat high-CHO foods after the exercise
did not affect energy balance (King & Blundell, 1995). For example, when individuals
were exposed to high-fat food, they increased their fat intake by 171 g/day and EI by
1148 kcal/day, however, when they were exposed to high-CHO food, they increased
CHO intake by 138 g/day (Tremblay et al., 1994a). King et al (2008) found that non-
responders, who lost less weight than predicted, increased nutrient fat intake from 32.6 to
34.9 %EI, whereas the responders did not change their nutrient fat intake at week 0 and
12 of the intervention.
Elder and Roberts (2007) explained the interaction between metabolic, hunger
and taste perception in accumulative training. Insulin sensitivity and lipolysis capacity in
adipose tissue increases, resulting in the stability of fuel circulating so that hunger
decreases and a negative energy balance occurs. However, some studies found an
increase in hunger after substantial weight loss, which could be an unconscious response
to protect the body from the reduction in body weight (Martins, Morgan & Truby,
2008a). Sorensen et al. (2003) reported inconsistent findings in the relationship between

Page 66
hedonic preferences and appetite sensations, and concluded that hedonic affects food
intake independent of appetite sensation responses.
There is evidence that reward – non-homeostatic - systems and hypothalamic
hunger – homeostatic - systems are related. For example, sensory factors such as taste
may affect liking and increase pleasure in eating, and metabolic factors such as hunger
and satiety may affect wanting and trigger desire to eat (Finlayson et al., 2007a). Both
liking and wanting can also be simultaneously affected to increase food intake. For
example, the palatability of food increases liking, enhances anticipated wanting and
increases hunger and food intake (Finlayson et al., 2007a). Therefore, nutrient
preference, appetite sensations and liking and wanting can represent different integrated
systems of eating behaviour, and these components can reflect the state of eating
behaviour.
While the conceptual framework of the influence of food on satiety cascade has
been established, which can further explain the inhibition of eating, decline in hunger
and increase in fullness (Blundell et al., 2010), the mechanism that operates the response
of hunger and satiety signalling to acute and medium-term exercise intervention has not
been established (Martins et al., 2007; Martins et al., 2008b). Therefore, it is important to
evaluate the effect of interval training on eating behaviour components such as appetite
sensations, hedonic responses, food reward and nutrient preferences. This consideration
of the components of eating behaviour is important in obesity studies in order to create
the balance between health outcomes and compensatory responses.

Page 67
2.8 General summary
This chapter has reviewed the current literature regarding moderate- and high-
intensity interval training in terms of [1] methodological approaches to prescribing and
monitoring interval training, [2] the influence of interval training on health parameters,
and [3] the behavioural compensatory responses that may occur as a consequence of
interval training.
The use of the GXT method to prescribe interval training has some limitations
related to the effect of time on physiological (VO2, HR, BLa), psychological (RPE) and
substrate (fat oxidation) variables during exercise training. The effect of time is more
pronounced during high-intensity levels, except for fat oxidation which could have a
greater increase during moderate-intensity exercise. Previous studies did not examine the
response of fat oxidation during interval training, and whether the response is similar to
continuous training.
The influence of interval training on health outcomes has been examined through
the comparison between high-intensity interval and moderate-intensity continuous
trainings in most studies. High-intensity interval training can improve physical fitness
including VO2max, LT and BLa clearance rates to a greater extent than moderate-
intensity continuous training. Some recent research reported that high-intensity interval
training can improve insulin sensitivity, but these studies did not include a control group.
Moreover, while aerobic training, either interval or continuous, can increase fasting
and/or exercise-induced fat oxidation, training intensities appear to result in similar
increases in fat oxidation.
The review examined evidence of interval and continuous training on
compensatory responses in NEAT and eating behaviour. NEAT reportedly decreased
during training independent of exercise intensity. While most studies that examined the
effect of training intensity on food intake used a food diary, several studies used other
features and methodologies such as appetite sensations, liking and wanting, and test
meals. Appetite sensations are suppressed after acute high-intensity sessions, but the
effects of training intensities on appetite sensations have not been tested. A few studies
found a trend of a decrease in food intake after high-intensity training. In addition, the
effect of exercise training on nutrient preferences and liking and wanting is unclear.

Page 68
Findings of the current literature review can help formulate many of the
hypotheses of the current thesis. However, the effects of different intensities of medium-
term (3-12 weeks) interval training on eating behaviour components are not clear. The
same holds true for the response of fat oxidation to acute moderate-intensity interval
exercise.

Page 69
3 Experiment 1-A: Fat oxidation during
GXT at MFO compared with MIIT
3.1 Introduction
With the growing prevalence of obesity and metabolic disorders such as T2D
(Gastaldelli, 2008; Wild et al., 2004), there is increasing interest in determining factors
that maximise fat oxidation during exercise training to induce weight loss in obese adults
(Corpeleijn et al., 2009). Aerobic exercise is commonly advocated to improve whole
body fat oxidation (Zarins et al., 2009), with the highest rates of fat oxidation repeatedly
seen with moderate-intensity aerobic exercise (Melanson et al., 2002; Romijn, Coyle,
Sidossis, Rosenblatt & Wolfe, 2000; Saris et al., 2003). Moderate-intensity exercise
training is commonly undertaken as a continuous bout at a constant mechanical
workload. However, for some individuals constant load work can be difficult to perform
for the duration required to attain an adequate training dose. Therefore, participation in
multiple short bouts of 10-15 mins was advocated in sedentary individuals who perceive
barriers to continuous exercise (Jakicic et al., 2001; Jakicic, Wing, Butler & Robertson,
1995; Murphy, Blair & Murtagh, 2009). Recently, there has been growing interest in
using shorter interval stages in the diabetic and obese populations (Boutcher, 2011;
Earnest, 2008; Hansen, Dendale, Van Loon & Meeusen, 2010), which involves repeated
bouts between 30 secs and 5 mins and interspersed by similar durations of rest or low-
intensity bouts (Laursen & Jenkins, 2002). Obese women perceived moderate-intensity
interval exercise (i.e. alternated 80 and 120%VT every 2 mins for 32 mins) as being less
hard than continuous exercise (i.e. 100%VT for 32 mins) (Coquart et al., 2008).
Therefore, obese individuals could use moderate-intensity interval exercise instead of
moderate-intensity continuous exercise to improve compliance to training.
The intensity (FATmax) that elicits MFO during a GXT has been suggested as a
reference method to prescribe exercise training where optimising fat oxidation is the goal
(Achten et al., 2002). The main advantage of the FATmax test is that the MFO is
determined with the use of a single GXT protocol, rather than undertaking several
constant load tests performed with different workloads on different days (Meyer et al.,
2007). However, a possible limitation of this approach is that fat oxidation increases

Page 70
significantly with exercise duration during continuous exercise (Cheneviere et al., 2009a;
Meyer et al., 2007). Therefore, the rate of fat oxidation reflected in a 3-5 min GXT
protocol, will likely underestimate the actual fat oxidation which occurs with prolonged
continuous exercise. Given the interest in moderate-intensity interval training as a
strategy for improving exercise compliance, it would be valuable to know if the FATmax
test is a valid means of prescribing moderate-intensity interval training. In contrary to
continuous exercise, moderate-intensity interval training may not induce exercise
duration-related drift in fat oxidation, and may be more closely related to the fat
oxidation values seen in 3-5 min stages of GXT protocols. Although this assumption is
intuitive, there is evidence that the impacts of moderate-intensity continuous and interval
training on fat oxidation are different. Venables and Jeukendrup (2008) investigated the
effect of 4-week moderate-intensity interval training which consisted of 5 mins at 20%
above FATmax, alternated with 5 mins at 20% below FATmax on fat oxidation in obese
men, compared with moderate-intensity continuous training at the level of FATmax.
They found interval training did not increase fat oxidation during a 30-min constant-load
test compared with the baseline although the same participants were able to increase fat
oxidation by 44% after continuous training.
The mechanical workloads for continuous aerobic training are commonly
prescribed by the relationships between physiological variables (VO2, HR, BLa) and
mechanical work (Hofmann & Tschakert, 2011) and between the rating of perceived
exertion (RPE) and mechanical work (Robertson, 2004) that are derived during a GXT.
The use of GXT as a means of reference for exercise training has been shown to be valid
in studies where the physiological responses (VO2, HR, BLa) to constant-load moderate-
intensity exercise relate well to the responses in the GXT (Salvadego et al., 2010; Steed
et al., 1994). It is important to confirm whether the relationship between mechanical
work and physiological variables (VO2, HR and BLa) and between mechanical work and
RPE during an exercise session of moderate-intensity interval training relate to the
physiological-mechanical work and psychological-mechanical work relationships in the
GXT.
Highly trained individuals may require exercise durations of more than 30 mins
to detect alterations in physiological variables and fat oxidation (Cheneviere et al.,
2009a; Lajoie et al., 2000; Meyer et al., 2007). However, several studies used the
duration of 30 mins for the moderate-intensity continuous exercise session to compare

Page 71
physiological and psychological responses during the exercise session with GXT in
untrained individuals (Erdmann et al., 2007; Steffan et al., 1999; Stoudemire et al.,
1996). The aim of the current study was to determine the comparability of fat oxidation,
physiological variables (VO2, HR and BLa) and rating of perceived effort (RPE)
corresponding with FATmax derived from a GXT with these same variables during a
30-min moderate-intensity interval exercise training (MIIT) session consisting of 5-min
stages at 20% above then 20% below FATmax. A second aim was to investigate if fat
oxidation increases over time in a 30-min MIIT session.
3.2 Hypotheses
1) The rate of fat oxidation (g/min) corresponding with FATmax determined from
the GXT will not differ from the average rate of fat oxidation during 30-min
moderate-intensity interval training (MIIT) at ±20% FATmax.
2) The rate of fat oxidation (g/min) will not increase with time during the MIIT.
3) There will be no significant differences in the physiological responses (VO2, HR
and BLa) which correspond with FATmax determined from the GXT as
compared with MIIT at ±20% FATmax.
4) There will be no significant difference in RPE which corresponds with FATmax
determined from the GXT when compared with MIIT at ±20% FATmax.
3.3 Method
3.3.1 Participant characteristics
Participants were 12 sedentary overweight/obese men who met the following
criteria: body mass index (BMI) > 25 kg/m2; 20-45 years of age; sedentary as defined as
having participated in regular exercise for a total of less than 60 mins per week within
the last six months including work-related physical activity; not classified as having a
metabolic risk according to the ATPIII panel identification (Marchesini et al., 2004); not
being Type 2 diabetic; being a non-smoker or having ceased smoking more than two
years previously, being euthyroid; and being ambulatory. Participants were recruited
from the staff and student population at Queensland University of Technology (QUT)
and the Brisbane metropolitan region via e-mail and flyers posted on community
noticeboards.

Page 72
Individuals who expressed an interest in the project were telephoned to receive
information about the requirements and expectations of the study, and to confirm their
eligibility. This was followed by a face-to-face meeting at the Institute of Health and
Biomedical Innovation (IHBI) at QUT. Volunteers who agreed to participate signed a
consent form and were asked to gain medical clearance from a general practitioner prior
to undertaking the study. Medical clearance confirmed the safety of the individual to
perform a maximal exercise test. The study protocol was approved by the Human
Research Ethics Committee at QUT (HREC No. 0900000338).
3.3.2 Body composition
3.3.2.1 Anthropometry
Height was measured without shoes to the nearest 0.5 cm using a Harpenden
stadiometer. Body weight was measured to the nearest 0.1 kg on a Wedderburn
electronic scale, and BMI (kg/m2) was calculated by dividing body weight (kg) by height
squared (m2).
3.3.2.2 Fat mass measures
FM was estimated using the ImpTM
SFB7 tetra polar bioimpedance spectroscopy
(BIS) (ImpediMed Limited, Queensland, Australia). The device utilises Cole-Cole
modelling with Hanai mixture theory to determine the relationship between resistance
and body fluid, and generates empirically derived equations (Cox-Reijven & Soeters,
2000; De Lorenzo, Andreoli, Matthie & Withers, 1997; Kyle et al., 2004). FFM and FM
values are automatically computed by the device. This device has been validated
against TBW in healthy individuals and is shown to be valid (Moon et al., 2008; Wabel,
Chamney, Moissl & Jirka, 2009).
Participants were asked to void before the test, and then lie supine, extending
their arms by their sides, hands resting next to their body with palms down, and with
their legs slightly apart. Electrode sites on the skin were wiped with alcohol and allowed
to dry. Electrodes were applied to the wrist, the ankle and the dorsal surface of the right
hand and foot.
3.3.3 Familiarisation and pre-test preparation
All participants participated in familiarisation sessions which had three aims: to
predict their VO2max using the ACSM submaximal ergometer test (Heyward, 2002), to
familiarise them with interval exercise consisting of alternating low and high intensity

Page 73
workloads, and to familiarise them with breathing through a Hans-Rudolph mouth-piece
while wearing a nose-clip during cycling exercise. Cadence was set at 70 rpm for all
participants across the whole study.
All tests were performed using a braked cycle ergometer (Monark Bike E234,
Monark Exercise AB, Sweden). As the starting workload for some participants needed to
be lower than 70 W, the weight basket of the bike which weighed 1 kg was removed and
replaced with a wire weight holder that weighed 0.1 kg. Workloads were varied (i.e.
managed by changing weights during all exercise sessions).
3.3.4 Experimental design
The study was a repeated-measures design. Each of the 12 participants
completed two sessions: a GXT to determine MFO and VO2max and a moderate-
intensity interval exercise session.
All participants were asked to maintain their normal dietary intake between tests,
and to replicate their food intake as closely as possible on the day before the exercise
tests. Participants were also asked to abstain from strenuous exercise and the
consumption of caffeine and alcohol in the previous 24 hrs. They were instructed to wear
lightweight, comfortable clothing during the tests. All tests were undertaken after an
overnight fast and were run in an air-conditioned laboratory with the temperature held
constant at 21°C.
The tests were performed on a braked cycle ergometer (Monark Bike E234,
Monark Exercise AB, Sweden). Seat position was adjusted so that the knee was slightly
flexed (about 5˚ less than maximal leg extension) with the ball of the foot on the pedal,
and the handlebar was adjusted so that the participant was in an upright position.
Participants were instructed to maintain cadence at 70 rpm during all tests. The Hans-
Rudolf mouthpiece and head support, nose-clip and Polar heart rate chest strap were
worn. Expired air was collected and heart rate was monitored during tests.
3.3.4.1 MFO and VO2max protocol
The FATmax graded cycle ergometry protocol is adapted from a protocol
described by Achten et al. (2002). Participants cycled at 35 W for 4 mins followed by a
4-min rest interval. At the end of each 4-min exercise stage, the Hans Rudolph
mouthpiece and nose clip was removed. Participants remained seated on the cycle
ergometer during the rest interval while fingertip blood lactate samples were collected

Page 74
and perceived effort determined using the Borg Scale 6-20. At the end of the rest interval
the work rate was increased by 17.5 W and the participant cycled at the new workload
for 4 mins. The discontinuous sequence of 4-min work-rest stages with 17.5 W
increments in workload continued until the workload at which RER reached 1.0 and
remained above 1.0 during the final 2 mins of exercise. After a 4-min rest, participants
commenced the second phase of the test designed to determine maximal aerobic power.
Participants cycled for a minute at a workload two increments lower than the intensity at
which an RER of 1.0 was reached, after which the mechanical work was increased by
17.5 W every minute until volitional exhaustion. Fingertip blood lactate samples were
collected at the end of this period. MFO and the intensity of exercise that elicited MFO
(FATmax) were determined for each participant by examining individual relationships
between fat oxidation rate (g/min) and workload.
3.3.4.2 Moderate-intensity interval training (MIIT)
The mechanical work during the MIIT session consisted of 5-min stages at 20%
above the mechanical work of FATmax alternated with 20% below the mechanical work
of FATmax (±20 %FATmax) for 30 mins. Participants started the exercise session with
the higher workload (+20%FATmax) followed by lower workload (˗20%FATmax).
All participants were seated in a chair for 5 mins after their arrival at the
laboratory. Participants were then asked to sit on a braked cycle ergometer for a further
5-min. Expired air was collected and heart rate was monitored for 5 mins during seated
rest, and fingertip blood lactate samples were collected at the end of this period.
Participants completed an unloaded 5-min warm-up at cadence of 70 rpm before they
started the MIIT session. RPE was recorded every 5 mins, and fingertip blood lactate
samples were collected at the end of the MIIT session.
3.3.5 Data management
3.3.5.1 Data management of indirect calorimetry
3.3.5.1.1 Gas analyser calibration prior all tests
The Parvo Medics Analyser Module (TrueOne®2400, Metabolic Measurement
System, Parvo Medics, Inc. USA) was used in the measurement of respiratory gas
exchange. The calibration of the system was undertaken prior to each test. The
configuration of flowmeter calibration was performed using the 5-stroke method to
measure ventilation which was verified using a certified 3 L calibration syringe.

Page 75
Calibration was accepted when the average difference was ≤ 2.0% and the difference
between low and high volumes was ≤ 5.0%. Oxygen and carbon dioxide gas analysers
were calibrated using known standard gas concentrations (4.01% CO2, 15.99% O2). Gas
calibration was performed to obtain the new conversion factors for the computer. The
TrueOne®2400 is equipped with the Auto-Cal feature. Moreover, the TrueOne®2400 is
attached to the Polar interface module that enables heart rate signals to be received from
the Polar chest strap worn by the participant.
3.3.5.1.2 Data management of gas exchange
Expired breaths were collected, and VO2, VCO2, RER and HR were averaged
automatically for every 30 secs via the Parvo Medics Analyser. Data were then exported
to an Excel file. The last 2 mins of each exercise stage of the MFO test where RER <1.0
were averaged. Workload, VO2, VCO2, HR, RER, BLa, %HRmax and %VO2max were
calculated at the point of MFO. In addition, the last 30 secs of each minute during
continuous stage was used to attain VO2, VCO2, RER and HR. Workload, VO2, VCO2,
HR, RER, and BLa were calculated at the point of VO2max. During the MIIT session,
the last 2 mins of each 5-min stage of exercise was averaged.
Five threshold criteria were used to determine if maximal aerobic power was
achieved. The primary criterion is plateau in VO2, which is commonly defined as a
change of less than 150 ml/min or 2.1 ml/kg/min between two successive mechanical
work stages, which equates ~ 50% of the expected increase in VO2 when treadmill grade
increases by 2.5% (Taylor, Buskirk & Henschel, 1955). As the workload increment in
this study (17.5 W) equates with only ~55% of the workload on which the common
plateau determination is based, it is inappropriate to use this threshold to evaluate this
criterion. However using the same method as defined by Taylor et al. (1955), a plateau in
the current study was deemed to have been achieved if the difference in VO2 between
the last two completed incremental stages was lower than 50% of the change in VO2
(ml/kg/min) seen across stages during the MFO test where wattage increased by 17.5 W.
The average 50% increment of VO2 was 1.6 ±0.9 ml/kg/min (R2= 0.95 ±0.06). The
secondary criteria were HR ±10 beats/min relative to age-predicted HRmax (220 – age),
RER ≥ 1.10 and BLa ≥ 8 mmol/L, and volitional fatigue as determined by an RPE>18.
3.3.5.1.3 Fat oxidation and energy expenditure during GXT and MIIT
VO2, VCO2 and RER during MIIT and MFO were used to predict fat and CHO
oxidation and EE.

Page 76
Rates of fat and CHO oxidation (g/min) were calculated using stoichiometric
equations of the energy equivalents of oxygen for non-protein RQ and percent
kilocalories and grams derived from CHO and lipid (VO2 is in L/min) developed by
Frayn (1983) as follows:
Total fat oxidation = 1.67 VO2 – 1.67 VCO2
Total CHO oxidation = 4.55 VCO2 – 3.21 VO2
Where VO2 and VCO2 are measured in litres per minute
The energy expenditure (EE) during MIIT and MFO were calculated using the
abbreviated Weir equation (Weir, 1990):
EEWeir (kcal/min) = ((1.106 × RER) + 3.941) × VO2 , where VO2 is in L/min
Substrate oxidation and physiological variables were expressed as 5-min
intervals. In addition, to allow a comparison with studies that used short durations (~15
mins), 30-min MIIT was divided into two 15-min durations. Therefore, the first three 5-
min stages substrate oxidation and physiological variables were averaged to obtain the
average of first half of MIIT (representing 2 × +20%FATmax and 1 × ˗20%FATmax),
and the second three 5-min stages were averaged to obtain the average of second half of
MIIT (representing 1 × +20%FATmax and 2 × ˗20%FATmax).
A scatter plot of the difference in fat oxidation between MIIT and MFO (MIIT –
MFO) versus mean fat oxidation of MIIT and MFO was constructed using Bland-
Altman method. Mean and standard deviation of difference (SDdiff) between MIIT and
MFO in fat oxidation was computed, and reference lines of the zero bias line and 95%
upper (0 + 1.96 × SDdiff) and 95% lower (0 – 1.96 × SDdiff) the zero line were overlaid on
the scatter plot.
3.3.5.2 Blood lactate
Fingertip blood lactate samples were taken within 20 secs of finishing the
relevant exercise stages. Duplicate 0.5 ml samples of capillary blood were obtained via
the finger prick method. Blood lactate concentrations were subsequently analysed via an
ultraviolet endpoint method using the spectrophotometric assay procedure as outlined by
Fink and Costill (1990).

Page 77
3.3.6 Statistical analysis
Data are presented as mean values and standard error of mean (SEM), unless
otherwise indicated. Paired t-tests were used to compare physiological and psychological
variables and substrate oxidation during MIIT and GXT and during first and second half
of the MIIT session. One-way repeated-measures ANOVA was used to assess the effect
of time on fat oxidation. The Microsoft Excel program (version 12.0, 2007, Microsoft
Corporation, Seattle, WA, USA) was used to compile the main results. Statistical
analyses were carried out with SPSS for Windows (version 18.0.1, 2010, PASW
Statistics SPSS, Chicago, IL, USA).
Post hoc power analysis was calculated using G*Power program (Version 3.1.3;
Franz Faul, University of Kiel, Germany, 2010). The difference between two dependent
means was computed using the outcomes of fat oxidation during MFO and MIIT, and fat
oxidation during MFO and the second half of MIIT. Effect size, power and required
sample size to attain power of 0.8 at alpha level of 0.05 were calculated.

Page 78
3.4 Results
3.4.1 Descriptive characteristics and physiological variables
Descriptive anthropometric and body composition measures are presented in
Table 3-1. With reference to the GXT, five threshold criteria were used to determine if
maximal aerobic power was achieved. Four out of 12 participants reached a plateau in
VO2max, nine reached their predicted HRmax, and the three other participants did not
reach this criterion even when the test was repeated. All participants reached the
RERmax, BLa max and RPEmax criteria. Table 3-2 shows the physiological variables at
maximal volitional exhaustion.
Table 3-1. Descriptive characteristics of study participants. Data expressed as mean, ±SEM
and range.
Variables Mean ±SEM Range
Age (year) 29.0 ±1.2 23-38
Height (cm) 174.6 ±2.4 157.5 – 192.0
Weight (kg) 88.5 ±3.1 70.0 – 104.5
BMI (kg/m2) 29.1 ±0.7 25.5 – 35.1
Fat mass (%) 31.7 ±1.3 25.7 – 35.3
BMI: body mass index.
Table 3-2. Physiological variables at maximal volitional exhaustion. Data expressed as
mean, ±SEM and range.
Variables Mean ±SEM Range
VO2peak (ml/kg/min) 31.8 ±1.6 23.7 – 40.9
HRpeak (beat/min) 187 ±3 170 - 202
Wmax 221 ±12 164 – 308
RERpeak 1.2 ±0.02 1.12 – 1.32
BLa peak 12.1 ±0.4 10.1 – 14.5
RPEpeak 19.6 ±0.2 18 – 20
VO2peak: peak oxygen consumption; HRpeak: peak heart rate; RERpeak: peak respiratory
exchange ratio; BLa peak: peak blood lactate concentration; RPEpeak: peak rate of
perceived exertion; Wmax: maximal workload.

Page 79
Physiological variables were determined at MFO to use in the comparison with
MIIT, and were expressed relative to physiological values determined at VO2peak. Table
3-3 shows the physiological variables at MFO.
Table 3-3. Physiological variables at maximal fat oxidation (MFO). Data expressed as mean,
±SEM and range.
Variables Mean ±SEM Range
VO2 (ml/kg/min) 10.8 ±0.7 7.7 – 15.6
%VO2peak 34 ±0.02 23 – 46
HR (beat/min) 104 ±2 85 – 115
%HRpeak 55 ±0.01 46 – 62
FATmax (W) 50 ±5 34 – 92
%Wmax 23 ±2.0 17 – 33
BLa (mmol/L) 1.9 ±0.1 1.2 – 2.7
RPE 8.0 ±0.4 7.0 – 11.0
%Wmax: percentage relative to maximal workload; %VO2peak: percentage relative to peak
oxygen consumption; %HRpeak: percentage relative to peak heart rate; BLa: blood lactate
concentration; RPE: rate of perceived exertion; FATmax: workload at maximal fat oxidation.
3.4.2 Fat oxidation
As shown in Table 3-4, fat and CHO oxidation and EE did not differ
significantly between MIIT and MFO. Energy expenditure did not change significantly
over the MITT session. The increase in fat oxidation did not reach significance, but CHO
oxidation was significantly higher in the first half of MIIT compared with the second
half (P≤0.01).
Table 3-4. Comparison between substrate oxidation at MFO and MIIT. Data expressed as
mean ±SEM.
Variables
GXT MIIT
MFO First half
(0 – 15 mins)
Second half
(15 – 30 mins)
Fat oxidation (g/min) 0.14 0.08 0.15 0.09 0.17 0.09
CHO oxidation (g/min) 0.84 0.2 0.91 0.2 ‡ 0.82 0.2
EE (kcal/min) 4.5 1.0 4.8 0.3 4.8 0.3
MFO: maximal fat oxidation; MIIT: moderate-intensity interval exercise; CHO:
carbohydrate; EE: energy expenditure
‡ Significant difference between first half and second half of MIIT session (P≤0.01).

Page 80
The Bland-Altman plot (Figure 3-1) shows that only one participant fell outside
the 95% limits of agreement. It also shows that there is no systematic bias in the
difference between MFO and MIIT, such that data shows a random nature of the bias
around the zero bias line and a further regression analysis is not required. Intra-class
Correlation Coefficient (ICC) between fat oxidation during MIIT and MFO was 0.53.
Post hoc power analysis revealed that the effect size in the difference between fat
oxidation at MFO and second half of MIIT was 0.38 and power was 0.22. Fifty seven
participants are required to attain power of 0.8 at an alpha level of 0.05. Taking into
account average fat oxidation during 30-min MIIT, 138 participants are required to attain
power of 0.8 alpha level of 0.05.
Figure 3-1. Bland-Altman plot of the mean and difference of fat oxidation during MIIT and
MFO.
As shown in Figure 3-2, with the data expressed in 5-min epochs, there was a
significant effect of time on fat oxidation during the MIIT session (P≤0.01). Post hoc
comparisons revealed a significantly higher rate of fat oxidation at minute 25 compared
with minutes 5 (P≤0.05) and 15 (P≤0.01). These differences were no longer evident at
minute 30 of MIIT.
-0.2
-0.15
-0.1
-0.05
0
0.05
0.1
0.15
0.2
0 0.05 0.1 0.15 0.2 0.25 0.3 0.35 0.4
Dif
fere
nce
fat
oxi
dat
ion
bet
wee
n M
IIT
and
MFO
(g/
min
)
Mean fat oxidation of MIIT and MFO (g/min)

Page 81
Figure 3-2. Rate of fat oxidation during the MIIT session. There were significant differences
between fat oxidation at minutes 25 and 5 at 0.05 and between minutes 25 and 15 at 0.01.
Data are represented as mean ±SEM.
3.4.3 Physiological and psychological variables
VO2 measured during the first and second half of MIIT was not significantly
different from VO2 at MFO. HR in the first half of MIIT was not significantly different
from HR at MFO, but HR during the second half the MIIT was significantly higher than
HR at MFO (P≤0.05). The change in HR from the first to second half of MIIT did not
reach significance.
RPE data is presented both as the average of the three measures taken during the
first and second half of the MIIT session (RPEave), and as the measure taken at the end
of the first half (15 mins) and the end of the second half (30 mins) of the MIIT session
(RPEend). The average of the first and second half of MIIT with RPE at MFO (P≤ 0.01),
and the RPEend were significantly higher than MFO data (P≤ 0.01). RPE (RPEave and
RPEend) increased significantly over the MIIT session (P≤0.01). Table 3-5 shows the
comparisons between the first and second half of MIIT and MFO in physiological and
psychological variables, and 5-min intervals of VO2, HR and RPE during MIIT are
shown in Figure 3-3.
0
0.05
0.1
0.15
0.2
0.25
5 10 15 20 25 30
fat
oxi
dat
ion
rat
e (g
/min
)
Interval exercise bout (min)
Fat oxidation
** (15) * (5)

Page 82
Table 3-5. Comparisons between the first and second half of MIIT and MFO in physiological
and psychological variables. Data expressed as mean ±SEM.
Variables
GXT MIIT
MFO First half
( 0 – 15 mins)
Second half
( 15 – 30 mins)
VO2 (ml/kg/min) 10.8 0.7 11.1 1.4 11.1 1.4
HR (beat/min) 104 2 105 2 108 ± 2*
BLa (mmol/L) 1.9 0.1 NA 1.9 0.3
RPEave (6-20) 8.0 ± 0.4 10.0 ± 0.6 ** 13.0 ± 1.0 ** ‡
RPEend (6-20) 8.0 ± 0.4 11.5 ± 0.7 ** 13.2 ± 1.1 ** ‡
VO2: oxygen consumption; HR: heart rate; BLa: blood lactate concentration; RPEave:
average of rate of perceived exertion; RPEend: rate of perceived exertion measured at the
end of first and second half of MIIT; GXT: graded exercise test; MIIT: moderate-intensity
interval training session; NA: not applicable as it was not measured.
* Significant difference between first and second half at MIIT and GXT (P≤0.05).
** Significant difference between first and second half at MIIT and GXT (P≤0.01).
‡ Significant difference between first half and second half during MIIT (P≤0.01).
Figure 3-3. The responses of VO2, HR and RPE every 5-min during MIIT; data represented as
mean ±SEM.
VO2: oxygen consumption; HR: heart rate; RPE: rate of perceived exertion.
80
85
90
95
100
105
110
115
120
8
9
10
11
12
13
14
15
5 10 15 20 25 30
Hea
rt r
ate
(bea
t/m
in)
VO
2 (
ml/
kg/m
in)
& R
PE
(6-2
0)
Exercise duration (min)
VO2 RPE HR

Page 83
3.5 Discussion
3.5.1 The main finding
The main finding of this study was that while average fat oxidation during MIIT
was not different from MFO, fat oxidation did increase during the first 25 minutes of the
30-min MIIT session. The rate of fat oxidation at 25 mins of MIIT exercise was
significantly greater than values seen at 5 and 15 mins of exercise. The rate of fat
oxidation after 25 mins did not change, such that it was not statistically different from
any other time point.
A second aim of the current study was to determine the comparability of
physiological markers (VO2, HR and BLa) and rating of perceived effort (RPE)
corresponding with MFO derived from a GXT with these same variables during a 30-
min moderate-intensity interval training (MIIT) session consisting of 5-min stages at
20% above then 20% below FATmax. The average VO2 during the first and second half
of 30-min MIIT were not different to the VO2 value at MFO during the GXT. BLa taken
at the end of MIIT also was not different from BLa taken at MFO. In contrast, HR
during the second half of the MIIT session reached values statistically higher than HR at
MFO, although the magnitude of increase was relatively small (< 4%). The most notable
difference between the MFO determined in the GXT and the MIIT session was the
rating of perceived exertion. Compared with the RPE at MFO during the GXT (8.0 ±
0.4), the average RPE during the MIIT session was significantly higher after 15 mins
(11.5 ± 0.7), and increased further after 30 mins of MIIT (13.2 ± 1.1).
3.5.2 Fat oxidation during MIIT and in comparison with MFO
There was no significant difference between the average rate of fat oxidation
during MIIT and MFO. Bland-Altman also demonstrated agreement between the two
methods in the rate of fat oxidation. The range between the 95% upper and 95% lower
limits of agreement in the difference between MIIT and MFO in the rate of fat oxidation
was large (i.e., ±100%MFO). These data suggested that FATmax zone (i.e., workload at
±20%FATmax) does not represent fat oxidation zone (i.e. rate of fat oxidation at
±20%MFO) as there was a wide variation in the rate of fat oxidation among participants.
Moreover, there was an increase in fat oxidation over the 30 mins MIIT session. This
indicates that the effect of exercise duration on fat oxidation that has been well reported
to occur during continuous exercise (Capostagno & Bosch, 2010; Cheneviere et al.,
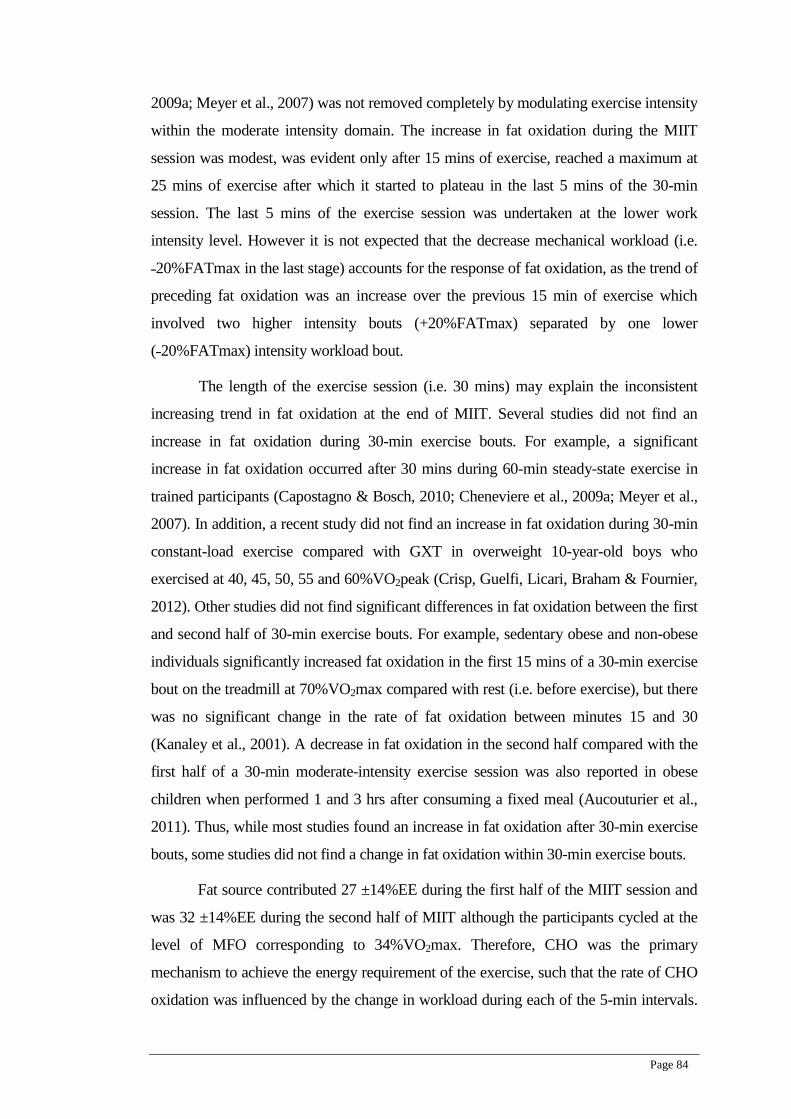
Page 84
2009a; Meyer et al., 2007) was not removed completely by modulating exercise intensity
within the moderate intensity domain. The increase in fat oxidation during the MIIT
session was modest, was evident only after 15 mins of exercise, reached a maximum at
25 mins of exercise after which it started to plateau in the last 5 mins of the 30-min
session. The last 5 mins of the exercise session was undertaken at the lower work
intensity level. However it is not expected that the decrease mechanical workload (i.e.
˗20%FATmax in the last stage) accounts for the response of fat oxidation, as the trend of
preceding fat oxidation was an increase over the previous 15 min of exercise which
involved two higher intensity bouts (+20%FATmax) separated by one lower
(˗20%FATmax) intensity workload bout.
The length of the exercise session (i.e. 30 mins) may explain the inconsistent
increasing trend in fat oxidation at the end of MIIT. Several studies did not find an
increase in fat oxidation during 30-min exercise bouts. For example, a significant
increase in fat oxidation occurred after 30 mins during 60-min steady-state exercise in
trained participants (Capostagno & Bosch, 2010; Cheneviere et al., 2009a; Meyer et al.,
2007). In addition, a recent study did not find an increase in fat oxidation during 30-min
constant-load exercise compared with GXT in overweight 10-year-old boys who
exercised at 40, 45, 50, 55 and 60%VO2peak (Crisp, Guelfi, Licari, Braham & Fournier,
2012). Other studies did not find significant differences in fat oxidation between the first
and second half of 30-min exercise bouts. For example, sedentary obese and non-obese
individuals significantly increased fat oxidation in the first 15 mins of a 30-min exercise
bout on the treadmill at 70%VO2max compared with rest (i.e. before exercise), but there
was no significant change in the rate of fat oxidation between minutes 15 and 30
(Kanaley et al., 2001). A decrease in fat oxidation in the second half compared with the
first half of a 30-min moderate-intensity exercise session was also reported in obese
children when performed 1 and 3 hrs after consuming a fixed meal (Aucouturier et al.,
2011). Thus, while most studies found an increase in fat oxidation after 30-min exercise
bouts, some studies did not find a change in fat oxidation within 30-min exercise bouts.
Fat source contributed 27 ±14%EE during the first half of the MIIT session and
was 32 ±14%EE during the second half of MIIT although the participants cycled at the
level of MFO corresponding to 34%VO2max. Therefore, CHO was the primary
mechanism to achieve the energy requirement of the exercise, such that the rate of CHO
oxidation was influenced by the change in workload during each of the 5-min intervals.

Page 85
This low level of the contribution of fat to exercise-induced EE at moderate-intensity
levels may not be related to body fat as there was a trend for obese individuals to use fat
greater than their leaner counterparts who had similar VO2max level (48.2 and 45.5
ml/kg FFM/min in lean and obese respectively) (Goodpaster et al., 2002). In addition,
sedentary obese and lean children demonstrated a low contribution of fat oxidation to EE
(< 20%) during 30-min moderate-intensity exercise (Aucouturier et al., 2011). Physical
activity level could explain the low contribution of fat during exercise. This conclusion is
supported by the finding of Romijn et al. (1993b) that the availability of FFA during
exercise training does not proportionally reflect the rate of fat oxidation, and fat
oxidation during exercise was limited by the muscle’s oxidative capacity and FFA
transport capacity. In addition, muscle oxidative capacity can explain the differences
between active and inactive individuals to sustain aerobic performance for a longer
period (Hawley & Holloszy, 2009).
In conclusion, the increase in fat oxidation during a 30-min moderate-intensity
interval exercise did not nullify the validity of MFO in estimating the average of fat
oxidation in the whole session.
3.5.3 Physiological and psychological variables during MIIT in comparison with
MFO
The physiological variables studied (VO2, HR and BLa) during MIIT were not
different to the values found at MFO during GXT. The one exception was the small but
statistically significant increase in HR in second half of the MIIT session. Several studies
have found that VO2 is stable during moderate-intensity training in trained and untrained
individuals (Meyer et al., 2007; Scott, 2005; Stoudemire et al., 1996). Although VO2
corresponded to the interval workload in a similar pattern with HR and was similar to the
expected response during continuous (Whaley et al., 2006) and interval exercise (Green
et al., 2006; Seiler & Sjursen, 2004), it is accepted that HR could increase during
exercise training despite stable VO2 values (Coyle, 1998; Wasserman et al., 2005). For
example, when eight healthy men cycled for 30 mins at a fixed exercise intensity
corresponding to 120 beats/min, HR significantly increased from 112 in minute 3 to 122
in minute 30 despite VO2 remaining stable (Kimura, Matsuura, Arimitsu, Yunoki &
Yano, 2010). A similar result was found when healthy individuals ran on a treadmill at a
self-selected light-intensity for 30 mins; HR significantly increased by 12 beats/min

Page 86
throughout the session while speed and VO2 did not change (Kilpatrick, Robertson,
Powers, Mears & Ferrer, 2009).
BLa at the end of MIIT session was not different from BLa at MFO, which was
in agreement with the work of Steffan et al. (1999) who found no statistical difference
between BLa during GXT and at the end of 15 mins of moderate-intensity exercise,
which were taken at equivalent intensities at 50%VO2max. The mean value of BLa
measured at the end of MIIT and at MFO was 1.9 mmol/L, which was in agreement with
Bircher et al. (2005) who found strong correlations between workloads at MFO and a
fixed value of BLa at 2 mmol/L. Instead of using fixed values such as 2 mmol/L, some
studies determined the intensity that elicits MFO based on the difference between the
first increase in BLa during exercise (LT1) and rest values. BLa at the end of a MIIT
session was 0.6 mmol/L above the rest value. Two studies found no differences between
BLa at MFO and LT1 defined as 0.4 and 0.5 mmol/L above BLa at rest (Bircher &
Knechtle, 2004; Roffey et al., 2007b). When LT1defined as 1 mmol/L above the rest
value, the correlation between VO2 at MFO and VO2 at LT1was strong in trained
individuals, but was modest in the obese (Bircher & Knechtle, 2004). Therefore, fixed
BLa at 2 mmol/L and relative BLa at 0.5 mmol/L above rest values were the most
representative references for moderate-intensity interval exercise among obese men to
exercise at the level of MFO.
RPE at MFO and during the MIIT session were significantly different, which
confirmed the previous finding that RPE increased during exercise (Fanchini et al.,
2011). The responses of RPE during MIIT revealed two important trends. Firstly, RPE
increased linearly with time by one unit every 5-min interval during the MIIT session,
but started to plateau in the last 5 mins such that the increase was only 0.4 unit. Green et
al. (2006) investigated interval exercise for 2-min work at LT with 3-min recovery
intervals, and found RPE increased by one unit in each work stage except the last stage
as the increase was only 0.5 unit. This reflects the functioning of RPE as it does not only
reflect the immediate peripheral afferents but also it estimates the end of exercise
(Lambert et al., 2005; St Clair Gibson et al., 2003). Therefore, the difference at the end
of training could be attributed to other factors apart from physiological effort. Secondly,
there were comparable outcomes in the value of RPE when using the end of first and
second half or using the average of each stage. Kilpatrick et al. (2009) found that RPE
taken after the exercise session related well to the finishing minute of the exercise

Page 87
session, and was higher than the first half and the average of the whole 30-min exercise
session. While Kilpatrick et al.’s study found the measure of RPE at the end of a 30-min
exercise session did not reflect the average of the whole session, the current study added
a new finding and confirmed that RPE at the end of the shorter duration of 15 mins
reflected the average RPE.
3.5.4 Summary
Mechanical work corresponding to variables such as VO2, BLa, HR, RPE and fat
oxidation from GXT is commonly used to prescribe exercise training. The validity of
these variables measured at MFO during GXT to prescribe interval training was
examined in this study. The increase in fat oxidation during MIIT did not affect the
relationship between MFO and the rate of fat oxidation during the first and second half
of MIIT session. In addition, VO2 and BLa displayed comparable values during MFO
and MIIT, HR statistically increased in the second half of the 30-min MIIT session and
RPE linearly increased during MIIT.

Page 88
4 Experiment 1-B: A comparison between
the acute effects of MIIT and HIIT on
appetite and nutrient preferences
4.1 Introduction
It is well established that manipulating the duration of high-intensity work bouts
and the work-to-rest ratio can enable high volumes of work to be undertaken in a shorter
time frame than can be achieved with continuous low-intensity workloads (1960a,
1960b; Essen, 1978; 1978; Margaria et al., 1969). More recently, a small volume of
repeated high-intensity exercise compared with a large volume of steady-state moderate-
intensity exercise was found to induce comparable metabolic adaptations in skeletal
muscle (Gibala & Little, 2010; Gibala et al., 2006). While these studies suggested that
high-intensity interval exercise improves physical fitness and metabolic adaptation, the
effect of this form of training on energy intake and energy balance remains uncertain.
High-intensity exercise increases perceived exertion which could lead to an increase in
food intake due to a feeling of reward. There is some evidence to suggest that exercise
leads to an increase in snack intake (Werle, Wansink & Payne, 2011) and that exercise
promotes a preference for high-fat, sweet foods among some individuals (Finlayson et
al., 2009). Therefore, high-intensity exercise could be viewed as a futile exercise
prescription for weight loss. Without exception these findings are based on studies
employing medium term moderate-intensity continuous exercise sessions or acute single
bouts of continuous exercise. A key issue is whether high-intensity short-duration
interval exercise will exert the same effects on food intake and appetite as moderate-
intensity long-duration interval sessions.
High-intensity exercise has been shown to suppress hunger in the immediate
post-exercise period (King et al., 1994; King et al., 1997b). Two studies found a greater
reduction in fat mass after high-intensity interval training than in moderate-intensity
continuous training. This reduction was attributed to the influence of high-intensity
interval exercise on appetite suppression (Trapp et al., 2008; Tremblay et al., 1994b),
however, this hypothesis has not been empirically tested. While the effect of exercise on
appetite sensations is important, it can be argued that its effect on food intake – that is the

Page 89
amount of calories ingested – is more important. In line with this is the effect of exercise
on macronutrient intake. For example, high-intensity exercise increased the consumption
of fat food in the day following exercise training compared with moderate-intensity
exercise in normal weight adults (Klausen et al., 1999), whereas prolonged moderate-
intensity exercise did not affect macronutrient intake in lean males (King et al., 1997a).
Of the evidence available, one study demonstrated that obese individuals increased their
fat intake during rest and after exercise compared with their non-obese counterparts
(George & Morganstein, 2003), and the effect of exercise intensity on EI was found only
among non-obese participants (Kissileff et al., 1990).
A relatively new experimental platform designed to examine taste and nutrient
preferences is the liking and wanting procedure. Liking is the anticipated response to
food or the explicit pleasure of eating, and wanting is an internal need for food regardless
of the palatability of such food (Finlayson et al., 2007b; Mela, 2006). The liking and
wanting procedure can be used to examine the impact of exercise on food preferences
through explicit hedonic preferences and implicit motivation towards the fat content and
taste of foods. Implicit wanting could also reflect the role of non-homoeostasis such as
exercise-induced food reward on nutrient preferences. The liking and wanting test
differentiated between individuals susceptible to acute exercise-induced increased
preference for high-fat sweet foods (Finlayson et al., 2009). The impact of exercise
intensity on liking and wanting has not been tested. Therefore, the inclusion of explicit
liking and implicit wanting in this study helped to determine the rate of palatability and
reward of fat sweet food in response to moderate- and high-intensity interval exercise.
The objective of this study was to examine the effect of moderate- and high-
intensity interval training (MIIT and HIIT) on appetite sensations and nutrient
preferences among overweight/obese men using VAS and liking and wanting methods.
While HIIT could suppress appetite, it may increase liking and wanting for energy-dense
food due to increased food reward. The manipulation of MIIT and HIIT assumes a
greater physiological and psychological stress during HIIT compared with MIIT.
Monitoring the responses of physiological variables such as VO2, HR and BLa can
quantify the training dose of MIIT and HIIT. While high-intensity steady-state exercise
can increase VO2, HR and BLa, the responses of these variables are affected by the
durations of exercise and rest intervals during high-intensity interval exercise
(Christmass et al., 1999a; Price & Halabi, 2005; Trapp et al., 2007). Psychological
Page 90
responses such as RPE can be used to monitor immediate perceived effort during
exercise (Ratel, Duche & Williams, 2006; St Clair Gibson et al., 2003), but its response
during interval exercise has not been assessed. There is little agreement on the interval
intensity threshold that is tolerated and can improve physiological parameters in the
obese, but high-intensity interval training up to 85%VO2max has been frequently used
(Roffey et al., 2007b; Schjerve et al., 2008). It has been suggested that recovery intervals
should last more than 15 secs when training at 100%VO2max to allow an adequate time
for PCr resynthesis (Essen & Kaijser, 1978). As 15-sec training interval is a fast
alteration in workload, it is important to quantify mechanical work based on the exercise
completed rather than the volume of exercise prescribed. Cycling distance can be used to
precisely calculate the level of mechanical work achieved. Cycling distance, RPE and
physiological variables including VO2, HR and BLa were recorded and discussed.
4.2 Hypotheses
1) Appetite sensations will be significantly lower after HIIT compared with MIIT.
2) Liking and wanting of high-fat sweet food will be significantly higher after HIIT
compared with MIIT.
4.3 Methods
4.3.1 Participant characteristics
The same cohort from Experiment 1-A participated in the current study. Refer to
section 3.3.1 for relevant information regarding recruitment, eligibility criteria, medical
screening and ethics.
4.3.2 Familiarisation and pre-test preparation
All participants participated in familiarisation sessions as explained in section
3.3.3. In addition, the preparation of equipment and the pre-test phase were explained in
the same section 3.3.3.
4.3.3 Experimental design
The experiment was conducted with a counterbalanced measures design. Each of
the 12 participants completed three exercise sessions: a graded exercise test to determine
maximal aerobic power (VO2max) and MFO, and two different interval exercise tests
(moderate-intensity interval training and high-intensity interval training).

Page 91
4.3.3.1 MFO and VO2max protocol
The MFO and VO2max graded cycle ergometry protocol was followed, as
previously explained in section 3.3.4.1.
4.3.3.2 Moderate-intensity interval training (MIIT)
The mechanical work of the MIIT session consisted of 5-min stages at ±20% of
mechanical work at MFO (FATmax) for 30 mins. Information regarding determination
of workload ±20%FATmax was presented in section 3.3.4.2.
4.3.3.3 High-intensity interval training (HIIT)
The HIIT session consisted of 15-sec high-intensity work at 85%VO2peak and
15-sec low-intensity work at 0 W – unloaded cycling (i.e., unloaded cycling during a 5-
min warm up was 25 ±4%VO2peak). Participants were instructed to use the monitor on
the handlebar to maintain a cadence of 70 rpm. The researcher advised participants about
the change in workload, and when the required durations (i.e., 15 and 45 secs, and 30
and 60 secs) were completed. The workload was adjusted by the researcher in
accordance with the time intervals.
To calculate the total time required for the HIIT session, total accumulated
workloads at MIIT were determined; workload at high-intensity (+20 %FATmax) × 15
mins + workload at low-intensity (˗20 %FATmax) × 15 mins. Every minute during HIIT
consisted of 30-sec cycling at the workload corresponding to 85%VO2peak and 30-sec
unloaded cycling. The workload at 85%VO2peak was halved to calculate the mean
workload in 1 min. The accumulated workload at MIIT was divided by the calculated
workload per minute at HIIT to calculate the total time required for the HIIT session.
4.3.4 Data management of the MIIT and HIIT sessions
All participants arrived at the laboratory early in the morning after overnight
fasting and were seated for 5 mins. Following this, they completed computer-based
appetite sensations and liking and wanting tests. Participants were then asked to sit on an
electromagnetically-braked cycle ergometer (Monark Bike E234, Monark Exercise AB,
Sweden) for a further 5 mins. Seat position was adjusted so that the knee was lightly
flexed about 5˚ from maximal leg extension with the ball of the foot on the pedal, and
the handlebar was adjusted so that the participant was in an upright position. A Hans-
Rudolf mouthpiece and head support, nose-clip and Polar heart rate chest strap were
worn. Expired air was collected and heart rate was monitored during the whole session.

Page 92
Participants completed an unloaded 5-min warm-up at cadence of 70 rpm and VO2 at 25
±4%VO2peak. Participants then randomly proceeded to either MIIT or HIIT. At the end
of the exercise session, appetite sensations and liking and wanting measures were again
completed. Fingertip blood lactate samples were collected at the end of the exercise
period, and after 10 and 20 mins in the post-exercise period.
Data management of indirect calorimetry measures was explained in section
3.3.5.1, and blood lactate samples were analysed using the same method in section
3.3.5.2. The actual mechanical work using total distance (km) was monitored and
recorded every 5 mins. If participants did not complete 5 mins during the last stage of
HIIT because of the end of exercise session, the distance of that stage was adjusted
accordingly. Likewise, RPE was determined every 5 mins. The percentage of exercise
duration was used instead of actual exercise duration, and RPE at 16.5, 33.3, 50, 66.6,
83.3 and 100 % exercise duration were recorded. If there was no data of RPE at any
point, preceding and following values of RPE were summed and then divided by 2.
Energy expenditure was calculated for MIIT only and followed the procedure detailed in
section 3.3.5.1.3. Energy expenditure for HIIT was not calculated because of the
limitation of using indirect calorimetry during short interval exercise (i.e. 15-sec
intervals).
4.3.5 Eating behaviour measures
4.3.5.1 Appetite measures
Subjective appetite sensations have been traditionally measured using a paper
and pen version of the VAS. A computerised version has been developed and validated
(Stubbs et al., 2000). Similar to the paper and pen version, there is a 100mm horizontal
straight line with two extremes stated and anchored at either end. For example, when the
question is ‘How hungry do you feel?’ (0) means not hungry at all, and (100) means as
hungry as I have ever felt. All participants used this procedure immediately before and
after each exercise session to record subjective appetite sensations for hunger, desire to
eat and fullness.
4.3.5.2 Food preferences (liking and wanting) measures
Liking and wanting were assessed using a computer-based paradigm (E-prime v
1.1.4) (Finlayson et al., 2007a). This paradigm uses 20 photographed food stimuli
varying along two dimensions, fat (high or low) and taste (sweet or non-sweet). In

Page 93
addition, the paradigm provides the opportunity to present either separate generic
categories: high-fat (HF), low-fat (LF), non-sweet (NS), and sweet (SW), or combined
categories: high-fat non-sweet (HFNS), low-fat non-sweet (LFNS), high-fat sweet
(HFSW) and low-fat sweet (LFSW). Table 4-1 shows foods selected in the current
project. The procedure integrates the separate task elements in order to fully randomise
explicit and implicit trials. The software is programmed to centre the cursor between
each trial to produce consistent response times, and questions are presented in
contrasting colours to encourage discrimination.
Table 4-1. Description and categories of photographic food stimuli
HFNS LFNS HFSW LFSW
Pork pie Ham Doughnut Jelly (jello)
Chips (French
fries)
Spaghetti in sauce Blueberry Rich tea biscuits
Sausages Potatoes Cream cake Fruit salad
Cheese- biscuits Bread roll Cream slice Marshmallows
Cheddar cheese Chicken breast Shortbread Jelly babies
HFNS: high-fat non-sweet; LFNS: low-fat non-sweet; HFSW: high-fat sweet; LFSW: low-
fat sweet
4.3.5.2.1 Measurement of liking
Twenty photographed food stimuli were individually displayed on the computer
monitor. Underneath each picture was a 100-unit VAS with two extreme ends (‘not at
all’ to ‘extremely’) to capture introspective hedonic measures. Additionally, underneath
the VAS was a statement asking “how pleasant would it be to experience a mouthful of
this food now?”. Participants used the computer mouse to respond to the statement by
moving a centred cursor along the VAS line. After each response, a continue button
automatically appeared to cycle to the next food photograph. The responses were
collated and a mean response for each category of food (e.g. high-fat sweet) was
automatically calculated.
4.3.5.2.2 Measurement of wanting
The program was designed to measure a forced choice task between two stimuli
(foods) presented in pairs on the screen, from each of the four categories. Participants
were asked to choose the food they ‘would most like to eat now’. Specified keys on the
computer keyboard were used to select one of the foods, the program then automatically
cycled to the next pair of foods until all pairs of stimuli (N=150) had been presented. The
time taken to select a food (reaction time) was automatically measured in milliseconds.

Page 94
This was labelled the implicit wanting measure which participants were unaware of. The
program is designed to calculate the frequency of selections for each category, with a
possible range of 0-75, to compare with the other categories.
4.3.5.3 Data management of eating behaviour
Data of appetite sensations and liking and wanting were calculated and presented
as follows:
Delta values were calculated by subtracting the post- from the pre-exercise measures
during the measurement of appetite sensations and liking and wanting.
Pooled mean reflects the average means of four food categories (HFNS, HFSW,
LFNS and LFSW) during the measurement of liking and wanting.
Data of food categories can be expressed separately (HF, LF, NS, and SW) or
combined (HFNS, HFSW, LFNS and LFSW), and the combined value is mostly
used unless otherwise mentioned.
4.3.6 Statistical analysis
Data were presented as mean values and standard error of mean (SEM), unless
otherwise indicated. Mixed linear model univariate ANOVA was used to assess the main
effects of intensity and time and the interaction of intensity and time on the variables of
appetite sensations, liking and wanting, RPE and distance cycling during MIIT and
HIIT. Paired t-test was used to compare distance cycling and BLa during MIIT and
HIIT. The Microsoft Excel program (version 12.0, 2007, Microsoft Corporation, Seattle,
WA, USA) was used to compile the main results. Statistical analyses were carried out
with SPSS for Windows (version 18.0.1, 2010, PASW Statistics SPSS, Chicago, IL,
USA).
Post hoc power analysis was calculated using G*Power program (Version 3.1.3;
Franz Faul, University of Kiel, Germany, 2010). Repeated measures ANOVA within-
between interaction was computed by inserting partial eta squared of the interaction
between intensity and time on eating behaviour variables, and computing the correlation
among repeated measures. Effect size, power and required sample size to attain power of
0.8 at alpha level of 0.05 were calculated.

Page 95
4.4 Results
4.4.1 Exercise duration, mechanical work, physiological variables and RPE
The duration of MIIT (30 mins) was constant between participants, whereas the
duration of HIIT varied between participants. The prescribed duration of HIIT was based
on the levels of MFO in three categories. Two participants whose MFO < 30 %VO2peak
completed the HIIT session in 9-13 mins, four participants whose MFO > 35 %VO2peak
completed the HIIT session in 24.5-26.5 mins and the remaining six participants whose
MFO ≥ 30 - ≤ 35 %VO2peak completed the HIIT session in 15.5-17.5 mins. Table 4-2
shows exercise duration and workload for the MIIT and HIIT sessions.
The mean VO2 and HR during HIIT were significantly higher compared with
MIIT. BLa measured immediately after the exercise was also higher during HIIT. RPE
was significantly affected by time (p ≤ 0.001), but there was no effect of interaction
between intensity and time on RPE (P=0.8). Energy expenditure during MIIT was 144
7 kcal. Table 4-3 shows the responses of physiological variables and RPE during MIIT
and HIIT.
Table 4-2. Exercise duration and mechanical work during MIIT and HIIT. Data expressed as
mean ±SEM.
Variables MIIT HIIT
Duration of session (min) 30 ‡ 18.47 ±1.25
Duration of exercise (min) 30 ‡ 9.24 ±0.54
Total distance (km) 14.1 ±0.4 ‡ 8.8 ±0.8
Upper workload (W) 60 ±5 161±6
Lower workload (W) 40 ±5 0
‘unloaded cycling’
Mean workload (W) 50 ±5 80 ±6 ‡
Calculated workload per session (W) 1488 ±79 1492±152
MIIT: moderate-intensity interval training; HIIT: high-intensity interval training.
‡ Significant difference between MIIT and HIIT (p ≤ 0.001).

Page 96
Table 4-3. Responses of physiological variables and RPE during MIIT and HIIT. Data
expressed as mean ±SEM.
Variables MIIT HIIT
Average of
work/rest
BLa end of session (mmol/L) 1.9 ±0.1 3.1 ±0.3 ‡
RPE 11.5 ±0.4 12.4±0.5
VO2 (ml/kg/min) 11.1 ±0.6 15.2 ±0.6 ‡
%VO2peak 34 ±3 48 ±3‡
HR (beats/min) 106 ±2 124 ±3 ‡
MIIT: moderate-intensity interval training; HIIT: high-intensity interval training; BLa:
concentration of blood lactate; RPE: rating of perceived exertion; VO2: the volume of
oxygen consumption; HR: heart rate.
‡ Significant difference between MIIT and HIIT (p ≤ 0.001).
4.4.2 Eating behaviour
Although data management has been explained in the methods section, a brief
explanation is given to facilitate the understanding of the abbreviations used in this
section. Delta values were calculated by subtracting the post- from the pre-exercise
measures. Pooled mean reflects the average means of four food categories (HFNS,
HFSW, LFNS and LFSW). Data of food categories can be expressed separately as HF,
LF, NS, and SW or combined as HFNS, HFSW, LFNS and LFSW, and the combined
values will be used unless otherwise mentioned.
4.4.2.1 Appetite sensations
The main effect of time on hunger approached significance (p = 0.054), but there
were no significant interactions between intensity and time on appetite sensation
variables. Mean delta values of appetite sensations during the MIIT and HIIT sessions
are shown in Figure 4-1.

Page 97
Figure 4-1. Delta values of pre- and post-measures of appetite sensations during the MIIT and
HIIT sessions; data represented as mean ±SEM.
VAS: visual analogue scale; MIIT: moderate-intensity interval training; HIIT: high-intensity
interval training.
4.4.2.2 Liking and wanting
4.4.2.2.1 Explicit liking
Explicit liking increased for all food categories after both exercise sessions. The
pooled means of explicit liking during MIIT and HIIT were similar; pre-measures were
43 ±19.2mm and 40.6 ±17.9mm, and post-measures were 51.7 ±21.2mm and 49.2
±21.3mm respectively. There was a significant effect of time on explicit liking (p ≤
0.001). The significant effects of time on explicit liking included HFSW (p ≤ 0.01),
LFSW (p ≤ 0.01) and LFNS foods (p ≤ 0.05), but not for HFNS foods. The interaction
between intensity and time was not significant (e.g. alpha value of the interaction
between intensity and time on HFSW was 0.2). Figure 4-2 shows delta values of pre-
and post-measures of explicit liking during the MIIT and HIIT sessions.
4.4.2.2.2 Implicit wanting
There were significant decreases in reaction time – implicit wanting - for all food
categories after both intensities of exercise (p ≤ 0.001). A decrease in reaction time
reflects a faster response. The analysis of the effect of time and intensity on nutrient and
taste food categories revealed significant effects of time on HFNS food (p ≤ 0.05),
HFSW food (p ≤ 0.05), LFNS food (p ≤ 0.05) and LFSW food (p ≤ 0.01). The pooled
-40
-30
-20
-10
0
10
20
30
40
Hunger Fullness Desire to eat
VA
S (m
m)
MIIT HIIT

Page 98
means of implicit wanting were not significantly different in MIIT and HIIT (pre-
measures were 1624 ±589ms and 1435 ±630ms and post-measures were 1292 ±359ms
and 1259 ±409ms respectively). Figure 4-3 shows delta values of pre- and post-measures
of implicit wanting during the MIIT and HIIT sessions.
4.4.2.2.3 Frequency of food
There were no significant effects of time or intensity on relative frequency of
choice. Separate analysis of taste and nutrient did not provide any significant effects of
time. Figure 4-4 shows delta values of pre- and post-measures of mean frequency of
choice during the MIIT and HIIT sessions.
Post hoc power analysis revealed that the only two variables which require a
sample size less than 50 participants to attain power of 0.8 at an alpha level of 0.05 were
hunger (n=44) and explicit liking for HFSW food (n=32). The effect size in the
difference between MIIT and HIIT in hunger was 0.4 and power was 0.24, and the effect
size in the difference between MIIT and HIIT in explicit liking for HFSW food was 0.20
and power was 0.40. It should be noted that the correlation among repeated measures
was r=0.6 for explicit liking for HFSW food, and r=0.1 for hunger.
Figure 4-2. Delta values of pre- and post-measures of explicit liking during the MIIT and HIIT
sessions; data represented as Mean ±SEM
MIIT: moderate-intensity interval training; HIIT: high-intensity interval training.
-20.0
-15.0
-10.0
-5.0
0.0
5.0
10.0
15.0
20.0
25.0
HFNS HFSW LFNS LFSW
Δ L
ikin
g (m
m)
MIIT HIIT

Page 99
Figure 4-3. Delta values of pre- and post-measures of implicit wanting during the MIIT and HIIT
sessions; data represented as mean ±SEM.
MIIT: moderate-intensity interval training; HIIT: high-intensity interval training.
Figure 4-4. Delta values of pre- and post-measures of mean frequency of choice during the MIIT
and HIIT sessions; data represented as mean ±SEM.
MIIT: moderate-intensity interval training; HIIT: high-intensity interval training.
-600
-500
-400
-300
-200
-100
0
100
200
HFNS HFSW LFNS LFSW
Δ W
anti
ng
(mse
c)
MIIT HIIT
-20.0
-15.0
-10.0
-5.0
0.0
5.0
10.0
15.0
20.0
25.0
HFSA HFSW LFSA LFSW
Δ p
refe
ren
ce (
freq
)
MIIT HIIT

Page 100
4.5 Discussion
4.5.1 The main finding
The hypotheses of this study were that appetite sensations would be significantly
lower after HIIT than MIIT, and liking and wanting of high fat, sweet foods would be
significantly higher after HIIT. The main findings were that Δ hunger was lower after
HIIT compared with MIIT, but the difference between MIIT and HIIT did not reach
significance. In addition, there were no significant differences between MIIT and HIIT
in liking and wanting.
4.5.2 Duration of exercise, mechanical work, BLa and RPE
There was a strong correlation between distance cycled during MIIT and HIIT,
which means that the shift between high- and low-intensity every 15 secs during HIIT
did not affect participants’ ability to maintain the revolution speed. This was in
agreement with Roffey et al. (2007b) who found an agreement between calculated and
actual mechanical work. Recording cycling distance to calculate actual mechanical work
is a useful method to monitor the adherence to prescribed mechanical work, compared
with other methods used to monitor actual metabolic effort. For example, some studies
monitored exercise intensity during interval and continuous trainings through the
adjustment of heart rate every 10 mins by approximately 2-3% targeted HR (Gorostiaga,
Walter, Foster & Hickson, 1991; Mikus et al., 2009). However, HR during exercise
training is affected by several factors such as sympathetic nervous system activity and an
increase in circulating norepinephrine concentrations, as well as hyperthermia and
dissipation of heat (Wasserman et al., 2005). In addition, the limitation of using indirect
calorimetry during high-intensity and/or short interval training was previously explained
(Jeukendrup & Wallis, 2005). Therefore, using the method of cycling distance in the
current study confirmed that obese individuals maintained prescribed mechanical work
during HIIT similar to MIIT.
The mean exercise duration during HIIT was 39% lower than MIIT, which was
similar to some previous studies. For example, instead of exercising for 1 hr at
38%VO2max, individuals need only half of this time when training at 80%VO2max with
intervals of 50%VO2max (Saris & Schrauwen, 2004). Similarly, individuals can replace
1 hr of training at 45 %VO2max with 35 mins of interval training at 80%VO2max with
intervals of 40%VO2max (Malatesta et al., 2009a). However, there was a wide range of

Page 101
individual variability in the difference of exercise duration between MIIT and HIIT due
to the differences in MFO levels. The duration of HIIT was only 17% lower than MIIT
among individuals whose MFO was higher than 35%VO2peak, while it was 70% lower
than MIIT among individuals whose MFO was lower than 30%VO2peak.
The responses of physiological variables, including VO2, HR and BLa, during
HIIT was within the extensive aerobic (Bourdon, 2000) light (Binder et al., 2008) to
moderate (Faude et al., 2009) training zones. The mean mechanical work during HIIT
can explain the responses of physiological variables during HIIT. Although HIIT was set
at 85 %VO2peak corresponding to a workload of 161 W, the mean intensity of HIIT was
48%VO2max and the mean workload was 80 W. This was in agreement with studies
which found that the mean value of exercise intensity was 65-70%VO2max when the
interval exercise (model 1:1.5) was set at 120%VO2max (Christmass et al., 1999a; Price
& Halabi, 2005; Trapp et al., 2007). Moreover, the work:rest duration of interval
exercise (15:15 secs) could contribute to the low rate of BLa at the end of HIIT. It was
reported that interval exercise of 30:30 secs is characterised as a difficult approach
compared with a shorter approach of 15:15 sec model (Billat, 2001a). Trapp et al. (2007)
found that BLa increased by double after a 24:36 sec interval exercise model compared
with a 8:12 sec model in untrained individuals. Price and Halabi (2005) compared
interval exercise of 6:9, 12:18 and 24:36 sec at 120%VO2max for 40 mins; BLa ranged
between 4 and 6 mmol/L, and was higher during the longer model. Therefore, the current
design of 15:15 sec interval training also contributed to the decrease in BLa.
RPE increased gradually during MIIT and HIIT although the physiological
response was statistically higher during HIIT. The similarity in the increase in RPE
during MIIT and HIIT could be attributed to two main factors. Firstly, the duration of
exercise was longer during MIIT than HIIT, which can contribute to increased overall
RPE. It was reported that RPE is affected by the duration and intensity of exercise
(Garcin et al., 1998). For example, in activities such as swimming where duration
(distance) of exercise was not expected to affect the session-RPE, the relationship
between distance and RPE was significant (Wallace, Slattery & Coutts, 2009). Secondly,
the increase in RPE at low-intensity can be attributed to psychological effects including
the perception of obese sedentary individuals of exercise training. It could be assumed
that the participation in exercise independent of exercise intensity substantially increases
RPE because the participants who are sedentary and obese perceive exercise in general

Page 102
as hard and uncomfortable. This assumption is supported by the study of Ekkekakis and
Lind (2006) who reported that a small increase in exercise intensity just above preferred
selected speed increased the feeling of discomfort in obese individuals more than their
lean counterparts.
4.5.3 Eating behaviour
4.5.3.1 Appetite sensations
The difference between pre and post-exercise hunger was lower after HIIT
compared with MIIT, but was not significant. Therefore, the first hypothesis was not
confirmed. The lower rate of hunger after HIIT was concordant with King et al. (1995;
1997a) who found a transitory suppression of hunger after high-intensity exercise. One
explanation of the lack of significance is the difference in the duration of exercise
sessions between treatments. The difference between treatments was 15 mins, such that
the manipulation of short exercise duration might not be sufficient to reveal a difference
between treatments in appetite sensations. Several studies reported contradictory
findings of the effect of moderate-intensity exercise on hunger, including an effect of
moderate-intensity exercise (Cheng et al., 2009; Martins et al., 2007; Tsofliou et al.,
2003), an effect of exercise independent of exercise intensity (Imbeault et al., 1997;
Ueda, Yoshikawa, Katsura, Usui & Fujimoto, 2009a; Wuorinen, Burant & Borer, 2008)
and no effect of exercise (King et al., 2010; Pomerleau et al., 2004). While the mean
value of hunger was lower after HIIT compared with MIIT, it is unclear whether MIIT
suppresses hunger compared with the non-exercise condition as it was not examined.
Only one study compared 60 mins of continuous exercise at 50 %VO2max with 60 mins
of intermittent exercise (30 mins at 50 %VO2max, and 30-min intervals consisting of 1
min at 70%VO2max alternating 3 mins at 40 %VO2max), and found a greater
suppression of hunger immediately after intermittent exercise (Reger, Allison & Kurucz,
1984). It was not explained whether the effect on hunger was due to the intermittent
protocol or the intensity. Therefore, it is difficult to draw a conclusion about the effect of
different intensities of interval exercise on the suppression of hunger.
4.5.3.2 Liking and wanting
Explicit liking increased for all four food categories after MIIT and HIIT.
Finlayson et al. (2008) found explicit liking increased for all food categories in the
hungry state and decreased in the satiated state. In a separate study by Finlayson, explicit
liking increased after a 50-min exercise and non-exercise period, and decreased after the

Page 103
test meal compared to after exercise and non-exercise (Finlayson et al., 2009). In the
present study implicit wanting decreased for all four food categories after MIIT and
HIIT. This was similar to Finlayson et al. (2009) who found that implicit wanting
decreased for all food categories after acute exercise. These results suggested that the
responses of explicit liking after exercise can be attributed to the effect of time, and
explicit liking and implicit wanting responded to interval exercise in similar way as to
constant-load exercise.
Finlayson et al.’s study (2009) reported that non-compensators, whose relative
energy intake (REI) were the same or less than exercise-induced EE, showed stable
values of implicit wanting after 50 mins of exercise at 70%HRmax whereas
compensators showed a greater decrease. The faster reaction time of implicit wanting
among the compensators reflected a stronger trigger to increase desire to eat after
exercise. In comparison with the present study, the percentage decreases in implicit
wanting were 13% after 18-min HIIT and 20% after 30-min MIIT compared with 45%
among compensators after 50-min moderate-intensity continuous exercise. Although the
current participants showed lower levels of implicit wanting compared with the
compensators in Finlayson et al.’s study, the duration of exercise was different in these
three conditions.
There were similar responses in explicit liking and implicit wanting in the
preferences of HFNS, HFSW and LFNS but not LFSW after MIIT and HIIT despite the
lack of statistical significance, such that the highest rates in explicit liking were the
fastest stimuli in implicit wanting. These responses did not reveal any specific tendency
for sweet or fat content. For example, while there was an increase in explicit liking for
SW food, implicit wanting did not show the same trends. Likewise, there was a decrease
in implicit wanting for LF food, but there was no corresponding trend in explicit liking.
The reciprocal responses between explicit liking and implicit wanting for HFSW food
after HIIT reflected a strong influence on the reward system. It was reported that the
complete reward response is enhanced with the trigger of liking and wanting (Berridge,
2009; Finlayson et al., 2007b). The increased explicit liking and decreased implicit
wanting for HFSW food after HIIT implied a negative effect of exercise on body weight,
as inappropriate food choices such as energy-dense food could minimise the beneficial
effects of exercise in weight management (Bellisle, 1999; Lluch, King & Blundell,
1998).

Page 104
Implicit wanting and explicit liking were not sensitive to the different exercise
manipulations of MIIT and HIIT, which can be attributed to two main reasons. The first
reason is that the volume of exercise (e.g. EE was 144.47.0 kcal during MIIT) was
insufficient to induce an energy deficit compared with other studies that usually
manipulated a large dose of exercise-induced EE. For example, an energy deficit in the
short-term (one day) was induced through manipulating a large dose of exercise-induced
EE (1200 kcal) of two sessions of training at 70%HRmax for 50 mins for each session
(King et al., 1997a). It was found that a large dose of EE induced an increase in EI in the
medium-term, whereas a low dose of EE did not increase EI (Whybrow et al., 2008).
Moreover, the responses of RPE during MIIT and HIIT were similar, which can reflect
that the contribution of longer duration with lower intensity in MIIT was similar to the
contribution of higher intensity with shorter duration in HIIT. It is important that implicit
wanting is a psychological trigger that is derived from neurotransmission rather than
physiological cues or homeostatic processes (Finlayson et al., 2008; Lemmens et al.,
2009). Therefore, it could be affected by non-homeostatic factors such as the increased
perceived exertion to a greater extent than homeostatic factors such as exercise-induced
EE.
It is important to quantify the contribution of homeostatic and non-homeostatic
factors to nutrient preferences. While homeostasis is determined by the volume of
exercise, regardless of the combination of exercise intensity and duration, the role of
these components (i.e., intensity and duration) on non-homeostatic factors is unclear. For
example, a 15-min moderate-intensity exercise session significantly attenuated taste
craving, in comparison with the rest control condition (Taylor & Oliver, 2009), which
can be attributed to a psychological effect. In another study, however, the researchers
found that a 30-min period of moderate-intensity exercise increased the palatability of
both sweet and sour solutions (Horio & Kawamura, 1998), and a different study found
that manipulating high- or moderate-intensity exercise did not affect macronutrient
selection in comparison with the control session (Erdmann et al., 2007). A critical review
concluded that no effects on macronutrient selection were found after moderate-intensity
exercise lasting less than 2 hrs, and the effects exerted by exercise on nutrient
preferences were inconsistent for prolonged exercise lasting more than 2 hrs (Elder &
Roberts, 2007). In conclusion, the current study did not detect a difference in nutrient
preferences between MIIT and HIIT, which can be attributed to the combination of

Page 105
homeostatic and non-homeostatic effects through the small dose of exercise-induced EE
and the similar increase in perceived exertion during both conditions. Future studies
could use different combinations of the intensity and duration of interval exercise that
may facilitate a difference in nutrient preferences.
4.5.4 Summary
Appetite sensations showed a greater suppression of hunger after HIIT, but the
difference between MIIT and HIIT was not significant. Manipulating intensity during
interval exercise did not statistically affect nutrient preferences – liking and wanting. The
low dose of EE suggested the small induction of homeostatic factors, and the longer
duration of MIIT increased RPE which suggested the increase of non-homeostatic
effects during MIIT. These two factors could contribute to the lack of statistical
difference between MIIT and HIIT in the effects on liking and wanting.

Page 106
5 Experiment 2-A: A comparison between
the medium-term effects of MIIT and
HIIT on fat oxidation, insulin sensitivity
and physiological variables
5.1 Introduction
Obesity is closely related with development of insulin resistance, and the
relationship is, in part, mediated through impairment of fat oxidation. Exercise is
advocated as a strategy to improve skeletal muscle fat oxidation (Koves et al., 2008;
Rogge, 2009). It has been demonstrated that the uptake and oxidation of free fatty acid
increases during moderate-intensity exercise, whereas the delivery, uptake and oxidation
of free fatty acid is limited during high-intensity exercise (Frayn, 2010). In contrast,
high-intensity exercise results in greater post-exercise fat oxidation than is found with
moderate-intensity exercise (Pillard et al., 2010). While the differential impact of
moderate versus high-intensity continuous training on fat oxidation has been well
established from several medium-term studies (Amati et al., 2008; Maffeis et al., 2005;
Van Aggel-Leijssen et al., 2002; Zarins et al., 2009), it is not clear if the same responses
are demonstrated during interval training. It also remains to be determined if there is an
association between exercise training-induced changes in fat oxidation and insulin
sensitivity with interval training. Therefore, it is important to examine if different
intensities of interval training have differential effects on fat oxidation and insulin
sensitivity.
Previous studies have not compared the effect of different exercise intensities of
interval training on fat oxidation. Comparison has been made between 4-week moderate-
intensity continuous exercise at intensity that elicits maximal fat oxidation (FATmax)
versus moderate-intensity interval training at ±20%FATmax in obese adults. The
findings revealed that exercise-induced fat oxidation increased after continuous training
whereas it did not change after interval training (Venables & Jeukendrup, 2008).
Another study has compared six sessions of high volume, moderate-intensity continuous
exercise at 65%VO2max (total time commitment was 10.5 hrs) with low volume,
supramaximal interval training (repeated Wingate Test of total time commitment of 2.5

Page 107
hrs), and found similar adaptations in muscle oxidative capacity after both trainings
(Gibala et al., 2006). The comparisons between post and pre high-intensity interval
training were also tested in healthy adults, and findings included a significant increase in
exercise-induced fat oxidation after seven sessions of interval training at 90%VO2max
(Talanian et al., 2007) and significant increases in the maximal activity of cytochrome c
oxidase (COX) and the protein content of COX subunits II and IV after six sessions of
interval training at VO2max (Little et al., 2010). Another study compared pre- with post-
assessment of 6-session supramaximal interval exercise intervention in sedentary
overweight/obese men (Whyte et al., 2010). In this study, there was a significant increase
in resting fat oxidation at 24-hr post training, but the significance did not remain at 72-hr
post training. The current study design uses different intensities of interval training with
the same total mechanical work.
The rate of exercise-induced fat oxidation is commonly assessed using indirect
calorimetry during a prolonged constant-load moderate-intensity exercise (Amati et al.,
2008; Zarins et al., 2009), and the maximal fat oxidation (MFO) can be assessed using
the FATmax test which involves incremental exercise stages (Achten et al., 2002).
Interestingly, in the comparison between moderate-intensity continuous exercise versus
moderate-intensity interval training, a constant-load exercise test was able to detect a
significant increase in fat oxidation after continuous training, whereas the rates of MFO
at FATmax did not change after either interval or continuous training (Venables &
Jeukendrup, 2008). It could be argued that the specificity of continuous exercise in
moderate-intensity continuous training and constant-load exercise test contributes to the
finding of this study. This finding increases the possibility that different forms of training
intervention, such as long stages of moderate-intensity interval training compared with
short stages of high-intensity interval training, can affect the validity of the exercise-
induced fat oxidation test.
High-intensity interval exercise was proposed to provide a greater stimulus for
improving insulin sensitivity than moderate-intensity continuous training due to its
effects on metabolic pathways associated with cardiorespiratory fitness, lipid oxidation
and mitochondrial biogenesis (Earnest, 2008; Hawley & Gibala, 2009). Gibala and Little
(2010) have shown that six sessions of supramaximal interval training performed over
two weeks, can significantly increase insulin sensitivity. While this protocol increased
insulin sensitivity in the 72-hr period after the last training bout in recreationally active

Page 108
individuals (Richards et al., 2010), the same design did not significantly decrease fasting
and area under the curve of glucose over the same time period in obese sedentary
individuals (Whyte et al., 2010). Four weeks of moderate-intensity interval training at
±20%FATmax did not increase the whole body insulin sensitivity index (Venables &
Jeukendrup, 2008). This study found a significant increase in insulin sensitivity after
moderate-intensity continuous training, which was partially attributed to the increased fat
oxidation after continuous training. Although high-intensity interval training at
90%HRmax increased insulin sensitivity to a greater extent than matched training
volume of moderate-intensity continuous training at 70%HRmax in obese patients with
the metabolic syndrome, this intervention lasted 16 weeks (Tonna et al., 2008). It is not
clear whether aerobic high-intensity interval training performed at 90%VO2max can
improve insulin sensitivity to a greater extent than moderate-intensity interval training in
a relatively short intervention (12 sessions) in obese individuals.
Evidence suggests that time spent during interval training at maximal velocity or
maximal power output is a key factor in improving VO2max (Billat, 2001a). For
example, a comparison has been made between eight weeks of four training models:
short and long stages of interval training at 90-95 %HRmax and continuous trainings at
70 and 85 %HRmax. VO2max significantly increased only after short and long work-to-
rest ratio at 90-95 %HRmax (Helgerud et al., 2007). However, obese individuals may
find training at maximal and supramaximal levels are less tolerable compared with
moderate-intensity training. For example, imposing a speed at just 10% higher than the
self-selected speed reduced the pleasure of exercise in obese compared to non-obese
sedentary women (Ekkekakis & Lind, 2006). Monitoring BLa, HR and RPE during
training sessions will demonstrate the level of physical stress that participants experience
during training (Norton et al., 2010). Recently, a comparison was made between three
training programs, interval training of 4×8 mins at 90%VO2max, interval training of 4×4
mins at VO2max and interval training of 4×16 mins at LT in moderately trained cyclists.
Interval training that included 4×8 mins bouts increased the workload at a constant-load
exercise test and reduced RPE during 7-week training sessions greater than the other
training protocols (Seiler et al., 2011). Unlike trained individuals, obese participants may
not be able to tolerate interval training at high-intensity levels for 4-8 mins. Therefore, if
high-intensity short-stages interval training (i.e., training at 90%VO2max for 30-sec
intervals) can increase aerobic capacity and decrease BLa and RPE, it will provide obese

Page 109
individuals with an easier training option than high-intensity long-stages interval
training.
The compensation for energy-induced training by reducing daily activity levels is
a possible strategy that sedentary individuals may use during structured training
interventions (King et al., 2007a), taking into account that obese individuals commonly
need a longer time to recover from physical activity (Hulens et al., 2001). Monitoring
behavioural responses through NEAT will demonstrate the effect of prescribed training
on daily activity levels (Colley et al., 2010). Recently, it has been found that acute
exercise at moderate- and high-intensity levels does not affect NEAT in
overweight/obese men (Alahmadi, Hills, King & Byrne, 2011). In medium-term
training, NEAT significantly decreased during an 8-week walking intervention in obese
women (Colley, 2005). However, with a longer period of intervention, NEAT is
expected to increase due to the increase in physical fitness levels (Hollowell et al., 2009;
Turner et al., 2010). Therefore, NEAT may be expected to decrease in a 4-week
intervention, unless there is a rapid increase in physical fitness (Speakman & Selman,
2003) or strong effects of other perceptual factors such as subjective feeling of energy
(King et al., 2007a).
The primary objective of this study was to compare four weeks of moderate-
intensity with high-intensity interval training (MIIT and HIIT) on exercise-induced fat
oxidation and fasting insulin and glucose. The second aim was to compare the effect of
interval training intensity on BLa, HR and RPE. Secondary aims include a comparison
between the effect of MIIT and HIIT on VO2max and NEAT.
5.2 Hypotheses
1) Maximal rate of fat oxidation (MFO) determined during a graded exercise test
(GXT) will significantly increase after HIIT to a greater extent than MIIT.
2) The rate of fat oxidation during a constant-load test at 45% VO2max will
significantly increase after MIIT to a greater extent than HIIT.
3) Insulin sensitivity will significantly increase after HIIT to a greater extent than
MIIT.
4) BLa and RPE will significantly decrease with HIIT to a greater extent than with
MIIT.

Page 110
5) Maximal oxygen consumption (VO2max) during GXT will significantly increase
after HIIT to a greater extent than after MIIT.
6) Non-exercise activity thermogenesis at week 4 will significantly decrease during
HIIT to a greater extent than during MIIT.
5.3 Methods
5.3.1 Participant characteristics
Participants were 10 sedentary overweight/obese men. The participants were
recruited for this study, using the same criteria that were used in the acute experiment
(section 3.3.1). The procedure followed the same instructions as in section 3.3.1 in terms
of recruitment, communication and medical. All participants signed a consent form and
attained medical clearance from a general practitioner prior to undertaking the study. The
study protocol was approved by the Human Research Ethics Committee at QUT (HREC
No. 1000000160).
5.3.2 Body composition
Anthropometric and fat mass (FM) measures were completed in the Exercise
Physiology laboratories at IHBI, QUT. All anthropometric and FM measures were
completed by the principal researcher, except Dual-energy X-ray Absorptiometry (DXA)
which was completed by a qualified technician. All participants were instructed to wear
lightweight clothing without any metal such as zips. The participants were reminded to
wear the same clothing for all testing sessions. In addition, participants were instructed to
abstain from strenuous exercise in the 24 hrs proceeding the testing sessions.
Anthropometric and FM measures were undertaken after an overnight fast or at least 5
hrs after the last meal.
5.3.2.1 Anthropometry
Height was measured without shoes to the nearest 0.5 cm using a Harpenden
stadiometer. Body weight was measured to the nearest 0.1 kg on a Wedderburn
electronic scale, and BMI (kg/m2) was calculated by dividing body weight (kg) by height
squared (m2).
Waist circumference was taken at the level of the narrowest point between the
lower costal border and the iliac crest, with the participant standing with arms folded
across the chest. If there was no obvious narrowing then the measurement was taken at

Page 111
the mid-point between these two landmarks. The hip circumference was taken at the
level of the greatest posterior protuberance of the buttocks perpendicular to the long axis
of the trunk, which usually corresponds anteriorly with level of the symphysis pubis. The
participant assumed the same position as for the waist measurement, but standing upright
with feet together. Waist-to-hip ratio (WHR) was calculated as waist circumference (cm)
divided by hip circumference (cm). Circumference measures were taken three times,
using a metal tape, and the median of these measurements was used.
5.3.2.2 Fat mass measures
TBW was predicted using the Imp™ SFB7 tetra polar bioimpedance BIS device
which utilises Cole modelling with Hanai mixture theory to determine TBW from
impedance data, and FM are then calculated on the Imp™ SFB7. Refer to section 3.3.2.2
for further details. The term BIA is more commonly used than BIS, so BIA will be used
in the result to refer to the measure of BIS.
FM and FFM were determined using DXA (DPX-Plus, Lunar Corp, Madison,
WI, USA) which was used only in the baseline as a gold standard reference measure. In
this technique, two distinct low-energy X-ray beams (constant x-ray source equal to 76
KVp with dual-energy peaks of 38 and 62 KeV) produce photons which penetrate bone
and soft tissue areas to a depth of ~30cm. Computer software reconstructs the attenuated
x-ray beams pixel by pixel to generate an image of the underlying tissues and thereby
quantify bone mineral content, FM and FFM. All scans were analysed using the DPZ-L
adult software (version 1.33; Lunar Corporation, Madison, WI).
Participants were asked to void their bladders before the test, and were required
to remain motionless in the supine position with their hands by their sides for
approximately 5-10 mins while the scanning arm of the DXA passed over their entire
body from head to toe. Quality assurance was assessed regularly by analysing a phantom
spine, and daily calibrations were performed before all scans using a calibration block
provided by the manufacturer (Lunar Corporation, Madison, WI). Immediately after the
DXA measure, the BIS measure was undertaken. Electrode sites on the skin were wiped
with alcohol and allowed to dry. Electrodes were applied to the wrist, the ankle and the
dorsal surface of the left hand and foot.

Page 112
5.3.3 Familiarisation and pre-intervention preparation
All participants participated in familiarisation sessions which had three aims: to
predict their VO2max using ACSMs submaximal ergometer test (Heyward, 2002), to
familiarise them to interval exercise consisting of alternating low and high intensity
workloads, and to familiarise them to breathing through the Hans-Rudolph mouth-piece
while wearing a nose-clip during cycling exercise.
All the experimental tests were performed using a braked cycle ergometer
(Monark Bike E234, Monark Exercise AB, Sweden). Refer to section 3.3.3 for further
details of operation of cadence and weight load management.
5.3.4 Experimental design
The study employed a cross-over design, and involved two 4-week exercise
training interventions consisted of 12 cycling sessions in each intervention (moderate-
intensity interval training (MIIT) or high-intensity interval training (HIIT)), separated by
6-week detraining wash-out. Three assessments were taken at week 0 (pre-intervention)
and week 4 (post-intervention), and were composed of a graded exercise test (GXT) to
determine maximal fat oxidation (MFO) and a maximal aerobic capacity (VO2max),
constant-load moderate-intensity bout followed by a 1-hr recovery to determine substrate
oxidation rate, and blood collection to measure insulin, glucose and lipid levels. Table 5-
1 shows the timeline of the study presented in weeks.

Page 113
Table 5-1. Timeline of study presented in weeks.
Week Measures Details
1 – (0) Pre-assessment 1 Week 0: step counts + 3 assessments
2 Intervention 1 12 cycling sessions either MIIT or HIIT
3
4
5 Step counts
6 – (4) Post-assessment 1 Week 4: 3 assessments
7 Detraining wash-out Free-living detraining period
8
9
10
11
12
13 – (0) Pre-assessment 2 Week 0: step counts + 3 assessments
14 Intervention 2 12 cycling sessions either MIIT or HIIT
15
16
17 Step counts
18 – (4) Post-assessment 2 Week 4: 3 assessments
5.3.5 Assessment tests
Participants were asked to maintain their habitual diet, activity and alcohol intake
during their participation in the current project. On the pre-assessment day, participants
were asked to abstain from any kind of exercise or physical work, and to abstain from
consuming alcohol, caffeine or salty food. The participants recorded their food and drink
intake on the day before the first assessment, and were asked to have the same food
before all remaining assessment tests. The first assessment was blood collection, and on
the following day, participants performed MFO and VO2max test. MFO and VO2max
test and blood collection were performed after overnight fasting. Constant-load exercise
testing was performed in the afternoon at approximately 1 pm, 48 hrs after the MFO and
VO2max test, and participants were asked to have their breakfast at least 5 hrs before the
test. Tests were run in an air-conditioned university laboratory.
5.3.5.1 MFO and VO2max test
The MFO graded cycle ergometry protocol is adapted from a protocol described
by Achten et al. (2002). Participants followed the same protocol used in section 3.3.4.1.

Page 114
In brief, participants cycled at 35 W for 4-min with a 4-min rest-period. Once the rest
period was completed, the work rate was increased by 17.5 W from the previous stage
and the participants cycled at the new workload for a further 4 min. The discontinuous
sequence of 4-min work-rest stages with 17.5 W increments in workload continued until
the workload at which RER reached 1.0 and remained above 1.0 during the final 2 mins
of exercise. The second phase thereafter continued to increase by 17.5 W every minute
until volitional exhaustion to obtain a measurement of VO2max.
5.3.5.2 Constant-load test
The constant-load test was performed at 45 %VO2max for 45 mins at cadence of
70 rpm followed by 60-min recovery. Participants were asked to sit on a braked cycle
ergometer (Monark Bike E234, Monark Exercise AB, Sweden). Seat position was
adjusted so that the knee was lightly flexed about 5˚ at maximal leg extension with the
ball of the foot on the pedal, and the handlebar was adjusted so that the participant was in
an upright position. Head support plus mouthpiece and nose-clip and Polar chest strap
were worn. Expired gas was collected and heart rate was monitored during 5 min the
resting phase (-5 to 0), intermittently between minutes (10 to 15), (25 to 30) and (40 to
45) during the exercise phase and intermittently between minutes (+15 to +30) and (+45
to +60) during the recovery phase. In the recovery phase, participants were seated calmly
on a chair, and were not allowed to do any activities. Fingertip blood lactate samples
were collected, and Borg scale 6-20 was undertaken at minutes 0, 15, 30, 45, +30 and
+60.
5.3.5.3 Blood collection
Venous blood samples were collected from an antecubital vein by a trained
phlebotomist at the Health Services Clinic of Queensland University of Technology.
Blood was collected into four standard collection tubes (two SST and two fluoride
oxalate) and transported in a refrigerated vessel to a pathology laboratory (Royal
Brisbane and Women’s Hospital, Queensland Health, QLD, Australia). Analyses of the
blood samples were performed using standard analysis procedures to assess the
following components of the fasting blood profile: total cholesterol (TC), high-density
lipoprotein cholesterol (HLD-C), triglycerides (TG), plasma insulin and plasma glucose.
Homeostatic model assessment of insulin resistance (HOMA-IR) was calculated using
the following formula: [fasting Glucose (mmol/L) x fasting Insulin (mU/L)] / 22.5

Page 115
Blood collection was performed pre-intervention and two to four days post-
intervention. All blood collection samples were taken after an overnight fast, and
participants were instructed to abstain from strenuous exercise in the preceding 24 hrs.
Participants were asked to rest in the supine position before blood collection, and the
principal researcher accompanied participants in all blood collection tests.
5.3.6 Training intervention
5.3.6.1 Design and preparation – pilot study
The training bouts of MIIT and HIIT were designed to be similar in duration and
mechanical work, but varying in exercise intensity. Therefore, instead of using MFO
which had large inter-individual variability in the acute experiment (refer to section
3.4.1; Table 3.3), a fixed intensity relative to VO2peak was used. Passive rest intervals,
with no cycling, were also included to attain equal physiological effort (i.e. although
unloaded cycling is set at 0 W, approximately 7 ml/kg/min of oxygen is consumed). The
total mechanical work and total time of exercise sessions in MIIT and HIIT were equal.
Therefore, cycling duration of HIIT was half the cycling duration of MIIT.
To attain a tolerable length of high-intensity interval training, three participants
from the acute experiment volunteered to undertake two random 30-min interval
exercise bouts, including work:rest intervals of either 30:30-sec or 1:1-min (for more
detail of short aerobic interval exercise, refer to section 2.2). Workload was set at 90% of
their measured VO2peak, using their data from the previous experiment. At the end of 1-
min work periods in the last 10 mins, all participants reported RPE between 18 and 20,
and HR reached predicted HRmax for one participant and 95% of predicted HRmax for
another one. One participant could not maintain cycling speed at 70 rpm. HIIT therefore
consisted of 30: 30-sec work:rest intervals.
5.3.6.2 Training sessions
All participants participated in 12 supervised cycling exercise sessions, three
exercise sessions per week. The duration of exercise started with 30 mins in the first
week, and increased by 5 mins every week to reach 45 min in the last week. All exercise
sessions started with unloaded 5-min warm-up cycling and ended with unloaded 5-min
cool-down cycling at a cadence of 70 rpm. The actual mechanical work including total
distance (km) and HR were monitored in all 12 exercise sessions. In the first exercise

Page 116
sessions of each week, HR, RPE and fingertip BLa samples were collected and recorded
before the exercise, at minutes 5, 15 and 30 and at the end of the exercise session.
Moderate-intensity interval exercise (MIIT) was determined at 45%VO2max, and
high-intensity interval exercise (HIIT) was determined at 90%VO2max. The simple
linear regression between VO2 and workload was performed and the slope and intercept
were calculated to determine the individual workloads that represent 45 and 90
%VO2max. Participants randomly proceeded to either MIIT or HIIT in a counter-
balanced order.
The MIIT session consisted of 5-min cycling stages at ±20% of mechanical work
at 45 %VO2max. After the workload was determined at 45%VO2max, the workload was
multiplied by ± 0.2 to determine the ±20% workload of 45%VO2max. The participants
started every exercise session with a workload at 20% above 45%VO2max for 5 mins,
followed by 5 mins with a workload at 20% below 45%VO2max, and consequently
changed until the end of exercise session. Weight was changed every 5 mins to match
the required workload, and the researcher was responsible for changing the weight every
5 mins. Participants were required to monitor time and cadence on the fitness screen and
to keep cadence at 70 rpm for the entire exercise time.
The HIIT session consisted of a 30-sec work at 90%VO2max and 30-sec passive
recovery interval rests per minute. The 30-sec exercise was repeated 30 times per 30-min
session in the first week and was repeated 45 times per 45-min session in the fourth
week. The researcher supervised all sessions and encouraged participants to stop at 30
secs and start at the beginning of the subsequent minute till the end of the exercise.
Participants were instructed to monitor time and cadence on the fitness screen in the
handlebars, and to cycle as fast as possible at the beginning of each minute so as to get to
the goal cadence of 70 rpm within 2 secs, and then were required to keep their cadence at
70 rpm for the entire exercise time.
5.3.7 Data management
5.3.7.1 Data management of indirect calorimetry
5.3.7.1.1 Gas analyser calibration
The Parvo Medics Analyser Module (TrueOne®2400, Metabolic Measurement
System, Parvo Medics, Inc. USA) was used in the measurement of respiratory gas

Page 117
exchange. The calibration of the system was undertaken prior to each test. Refer to
section 3.3.5.1.1 for details of gas and flowmeter calibration.
5.3.7.1.2 Data management of gas exchange
Expired breaths were collected, and VO2, VCO2, RER and HR were averaged for
every 30 sec automatically via the Parvo Medics Analyser. Data were then exported to
an Excel file. The last 2-min of each exercise stage where RER <1.0 during the
discontinuous phase were averaged. Workload, VO2, VCO2, HR, RER, BLa, %HRmax
and %VO2max were calculated manually at the point of MFO.
The first increase in blood lactate (LT1) was calculated as the first power output
preceding an increase in plasma lactate concentration of > 0.4 mmol/L above resting
levels (Yoshida et al., 1987). The lactate threshold (LT2) was calculated from mean BLa
taken at the end of each completed stage during the discontinuous phase. It was
calculated using the Dmod method defined as the point that yields the maximal
perpendicular distance from a curve representing power output and lactate concentration
to the line formed by the two end points of the curve (Bishop et al., 1998).
The last 30 secs of each minute during the continuous stage were used to attain
VO2, VCO2, RER and HR. Workload, VO2, VCO2, HR, RER, BLa were calculated at
the point of VO2max. Five threshold criteria were used to determine maximal aerobic
performance as discussed in section 3.3.5.1.2. Individual 50% increment of VO2 was
used to calculate the VO2 plateau, and its average was 1.25 ± 0.3 ml/kg/min (R2= 0.96
±0.09) in pre-MIIT and HIIT.
During the constant-load test, VO2, VCO2, RER as well as HR were averaged for
every 30 secs automatically via the Parvo Medics Analyser. Data were then exported to
an Excel file. The average of 5 mins during rest, 5 mins at minutes 10 to 15, 25 to 30 and
40 to 45 during exercise and 15 mins at minute +15 to +30 and +45 to +60 during the
recovery period were calculated.
5.3.7.1.3 Substrate oxidation and energy expenditure during GXT and constant-load
test
VO2, VCO2 and RER during the constant-load exercise test and GXT were used
to predict fat oxidation and EE. Rate of fat oxidation was calculated using stoichiometric
equations of the thermal equivalents of oxygen for non-protein RQ and percent

Page 118
kilocalories and grams derived from CHO and lipid (VO2 is in L/min) as explained in
section 3.3.5.1.3.
5.3.7.2 Blood lactate
Fingertip blood lactate samples were taken within 20 seconds of finishing stages
as required in the study design. The procedure for BLa measurement was explained in
section 3.3.5.2.
5.3.8 Non-exercise activity thermogenesis (NEAT)
5.3.8.1 Step counts
A 5-function digital pedometer (Walk, Elite W4LTM
, Walk4Life, Inc.) was worn
by each participant for five days (three weekdays and two week-end days) prior to the
commencement of each intervention at week 0 and during week 4 of each intervention.
All pedometers were set on the same standard setting, and every participant used the
same device in all phases of step-count monitoring. Participants were asked to clip the
device to their waistband in line with their right hip, and to wear the device for the whole
day except for periods when sleeping or to avoid contact with water. The participants
were provided with a sheet to record time on when wearing the device and to record step
counts every day.
5.3.8.2 Physical fatigue symptoms
The seven items of the physical fatigue symptoms assessment of the Chalder
Fatigue Questionnaire (CFQ) Scale (Chalder et al., 1993) were completed in week 0 and
during the training intervention in week 4. Likert scores from 1 to 4, indicating better
than usual, no more than usual, worse than usual and much worse than usual, were used
to calculate participants’ responses. Participants’ responses were evaluated by comparing
each of seven items in weeks 0 and 4 in both intervention treatments, so there was not a
total score for physical fatigue symptoms.
5.3.9 Statistical analysis
Data are presented as mean values and standard error of mean (SEM), unless
otherwise indicated. A mixed linear model univariate ANOVA was used to assess the
interaction between intensity (MIIT and HIIT) and time (weeks 0 and 4) on body
composition, insulin sensitivity, substrate oxidation and physiological variables.

Page 119
In the constant-load exercise test, time point (data collected during the test at 15,
30 and 45 mins) was added as a fixed factor to univariate analysis, but the interaction of
this factor with intensity or time was not computed. Furthermore, the averages of fat
oxidation and RER during the constant-load test was calculated, the training order in the
cross-over design was added as a fixed factor, and the interaction between this factor and
intensity and time was computed. In the training sessions, period (data collected during
weeks 1, 2, 3 and 4) was added as a fixed factor to univariate analysis, and the
interaction between period and intensity was computed.
The Microsoft Excel program (version 12.0, 2007, Microsoft Corporation,
Seattle, WA, USA) was used to compile the main results. Statistical analyses were
carried out with SPSS for Windows (version 18.0.1, 2010, PASW Statistics SPSS,
Chicago, IL, USA).
Post hoc power analysis was calculated using G*Power program (Version 3.1.3;
Franz Faul, University of Kiel, Germany, 2010). Repeated measures ANOVA within-
between interaction was computed by inserting partial eta squared of the interaction
between intensity and time on the rate of fat oxidation during the constant-load exercise
test, and computing the correlation among repeated measures. Effect size, power and
required sample size to attain power of 0.8 at alpha level of 0.05 were calculated.

Page 120
5.4 Results
5.4.1 Descriptive data of exercise training sessions
The workload and time of exercise sessions were matched between MIIT and
HIIT sessions. As a result, average distance and time of cycling interval stages per
session during HIIT was significantly lower than MIIT (P≤0.001). Table 5-2 shows
descriptive data of exercise sessions during 12 sessions of MIIT and HIIT. Total energy
expenditure for 12 training sessions was predicted using participants’ energy expenditure
data from the constant-load exercise test at week 0, and was approximately 6.4 kcal/min
× 450 mins = 2880 kcal.
Table 5-2. Exercise duration and mechanical work during MIIT and HIIT. Data expressed as
mean ±SEM.
Variables MIIT HIIT
Total duration of exercise (min/12 sessions) 450 450
Average time of exercise (min/session) 37.5 18.7
Average distance (km/session) 18.3 ±0.2 ‡ 8.9 ±0.1
Mean workload (W) 76 ±4 71 ±5
MIIT: moderate-intensity interval training; HIIT: high-intensity interval training.
‡ Significant difference between MIIT and HIIT (P≤0.001).

Page 121
5.4.2 Body composition and blood profile
There were no significant effects of intensity and time of MIIT and HIIT on body
composition and blood profile. Table 5-3 shows body composition variables, and Table
5-4 shows blood profile markers at weeks 0 and 4 in MIIT and HIIT.
Table 5-3. Body composition at weeks 0 and 4 in MIIT and HIIT. Data expressed as mean
±SEM, absolute and percentage differences.
Variables
MIIT HIIT
Week
0
Week
4
Chang
e
(%)
Week
0
Week
4
Chang
e
(%)
Weight (kg) 88.6
±2.4
88.9
±2.4
+0.3
(0.3)
89.2
±2.5
89.3
±2.4
+0.1
(0.1)
BMI (kg/m2)
30.7
±1.1
30.8
±1.1
+0.1
(0.3)
30.9
±1.0
30.9
±1.0
0.0
(0.0)
WC-Narrowest (cm) 94.1
±2.0
94.7
±2.0
+0.6
(0.6)
94.4
±2.0
95.2
±2.1
+0.8
(0.8)
Waist to hip ratio 0.87
±0.01
0.88
±0.01
+0.01
(1.1)
0.86
±0.01
0.87
±0.01
+0.01
(1.1)
Fat mass (kg) 31.0
±1.5
30.2
±1.8
-0.8
(-2.6)
30.9
±1.6
31.2
±1.8
+0.3
(0.9)
Fat mass (%) 34.9
±1.1
33.7
±1.5
-1.2
(-3.4)
34.5
±1.2
34.8
±1.3
+0.3
(0.8)
MIIT: moderate-intensity interval training; HIIT: high-intensity interval training; BMI: body
mass index; WC: waist circumference.
Note: There were no significant differences between weeks 0 and 4 or between MIIT and
HIIT

Page 122
Table 5-4. Blood profile at weeks 0 and 4 in MIIT and HIIT. Data expressed as mean ±SEM,
absolute and percentage differences.
Variables
MIIT HIIT
Week 0 Week 4 Change
(%) Week 0 Week 4
Change
(%)
Glucose (mmol/L) 5.0
±0.2
5.0
±0.2
0.0
(0.0)
4.9
±0.2
5.1
±0.2 +0.2
(+4.0)
Insulin (mU/L) 12.2
±1.7
11.8
±1.0
-0.4
(-3.2)
13.0
±2.1
13.9
±2.0
+0.9
(+6.9)
HOMA-IR 2.7
±0.7
2.6
±0.5
-0.1
(-3.7)
2.8
±0.9
3.2
±1.0
+0.4
(+14.2)
Triglycerides
(mmol/L)
1.3
±0.4
1.4
±0.5
+0.1
(7.6)
1.9
±1.2
1.9
±0.6
0.0
(0.0)
TC (mmol/L) 5.0
±0.5
5.0
±0.5
0.0
(0.0)
5.3
±0.5
5.2
±0.4
-0.1
(-1.8)
HDL (mmol/L) 1.0
±0.04
1.0
±0.04
0.0
(0.0)
1.1
±0.04
1.0
±0.04
-0.1
(-9.0)
TC/HDL ratio 5.0
±0.2
5.2
±0.2
+0.2
(+4.0)
5.2
±0.2
5.5
±0.2
+0.3
(+3.7)
TC: total cholesterol; HDL: high density lipoprotein; mU/L: milli international units/litre; HOMA-IR: the homeostasis model assessment of insulin resistance.
Note: There were no significant differences between weeks 0 and 4 or between MIIT and
HIIT

Page 123
5.4.3 Fat oxidation
5.4.3.1 MFO during GXT
The effect of time on MFO was significant (P≤0.01), but the interaction between
intensity and time was not significant. MFOs for pre-intervention were 0.13 ±0.07 g/min
and 0.10 ±0.10 g/min, and post-intervention were 0.17 ±0.09 g/min and 0.18 ±0.06
g/min for MIIT and HIIT respectively. Figure 5-1 shows the curve of fat oxidation.
5.4.3.2 Fat oxidation during constant-load exercise test
The effect of time on the rate of exercise-induced fat oxidation was significant
(P≤ 0.001), whereas the interaction between intensity and time on the rate of fat
oxidation was not significant. As the effect of intensity on fat oxidation was also
significant (P≤ 0.01), the rates of fat oxidation during 15, 30 and 45 mins were averaged
and the training order in the cross-over design was added as a fixed factor. There was no
significant effect of training order on fat oxidation, and the interaction between training
order and time and the interaction between training order and intensity were not
significant. In addition, paired t test revealed that there was no significant difference
between MIIT and HIIT in delta fat oxidation (i.e. delta represents the difference
between average fat oxidation in weeks 4 and 0). Figure 5-2 shows the responses of fat
oxidation during the constant-load exercise test in MIIT (a) and HIIT (b), and the
average rate of fat oxidation during the same test at weeks 0 and 4 (c).
The effect of time on respiratory exchange ratio (RER) was significant (P≤
0.001), whereas the interaction between intensity and time on RER was not significant.
Similar to fat oxidation, the effect of intensity on RER was significant (P≤ 0.01), but
there was no significant effect of training order on RER, and the interaction between
training order and time and the interaction between training order and intensity were not
significant. Paired t test revealed that there was no significant difference between MIIT
and HIIT in delta RER. Figure 5-3 shows the RER during the constant-load test in MIIT
(a) and HIIT (b), and the average RER during the test (c).
Post hoc power analysis, computed using partial eta squared = 0.038 and
correlation among repeated measures = 0.6, revealed that the effect size of the interaction
between intensity and time on fat oxidation was 0.19 and power was 0.30. Thirty
participants are required to attain power of 0.80.

Page 124
a)
b)
Figure 5-1. Curve of fat oxidation rate (g/min) against relative exercise intensity
(%VO2peak) during graded exercise test (GXT) at weeks 0 (solid line) and 4 (dotted line) in
MIIT (a) and HIIT (b); data represented as mean ±SEM, but SD was used in the rate of fat
oxidation.
MIIT: moderate-intensity interval training; HIIT: high-intensity interval training.
0
0.05
0.1
0.15
0.2
0.25
20% 30% 40% 50% 60% 70%
Fat
oxi
dat
ion
rat
e (g
/min
)
Exercise intensity (%VO2peak)
MIIT-week 0 MIIT-week 4
0
0.05
0.1
0.15
0.2
0.25
20% 30% 40% 50% 60% 70%
Fat
oxi
dat
ion
rat
e (g
/min
)
Exercise intensity (%VO2peak)
HIIT-week 0 HIIT-week 4

Page 125
a)
b)
c)
Figure 5-2. the responses of fat oxidation during the constant-load exercise test in MIIT (a)
and HIIT (b), and the average rate of fat oxidation during the test at weeks 0 (dark grey) and
4 (light grey) in MIIT and HIIT (c); data represented as mean ±SD.
The effect of time on fat oxidation was significant (p≤ 0.001), and there was no significant
difference between MIIT and HIIT in delta fat oxidation.
MIIT: moderate-intensity interval training; HIIT: high-intensity interval training
0
0.05
0.1
0.15
0.2
0.25
0.3
0 15 30 45 +30 +60 Rat
e o
f fa
t o
xid
atio
n (
g/m
in)
Duration of exercise (min)
MIIT - week 0 MIIT- week 4
0
0.05
0.1
0.15
0.2
0.25
0.3
0 15 30 45 +30 +60
Rat
e o
f fa
t o
xid
atio
n (
g/m
in)
Duration of exercise (min)
HIIT - week 0 HIIT- week 4
0
0.05
0.1
0.15
0.2
0.25
MIIT HIIT
Fat
oxi
dat
ion
rat
e (g
/min
)
Week 0 Week 4

Page 126
a)
b)
c)
Figure 5-3. the responses of respiratory exchange ratio (RER) during the constant-load
exercise test in MIIT (a) and HIIT (b), and the average RER during the test at weeks 0 (dark
grey) and 4 (light grey) in MIIT and HIIT (c); data represented as mean ±SEM.
The effect of time on RER was significant (p≤ 0.001), and there was no significant difference
between MIIT and HIIT in delta RER.
MIIT: moderate-intensity interval training; HIIT: high-intensity interval training.
0.70
0.80
0.90
1.00
1.10
0 15 30 45 +30 +60
Res
pir
ato
ry e
xch
ange
rat
io-
RER
Duration of exercise (min)
MIIT - week 0 MIIT-week 4
0.70
0.80
0.90
1.00
1.10
0 15 30 45 +30 +60 Res
pir
ato
ry e
xch
ange
rat
io-
RER
Duration of exercise (min)
HIIT - week 0 HIIT- week 4
0.90
0.92
0.94
0.96
0.98
1.00
MIIT HIIT
RER
week 0 week 4

Page 127
5.4.4 Physiological variables during graded exercise test (GXT)
With reference to the GXT, five threshold criteria were used to determine
maximal aerobic performance. Three out of 10 participants in MIIT and five out of 10
participants in HIIT reached a plateau in VO2max; nine reached their predicted HRmax
prior to both interventions. All participants reached the RERmax, BLa max and RPEmax
criteria prior to MIIT and HIIT. The post-measures were comparable with pre-measures
except for two participants who did not reach RPEmax after HIIT although they reached
other criteria.
There were significant effects of time on VO2peak expressed as absolute or
relative to body weight (P≤ 0.01 and 0.05) and on Wmax (P≤0.001), whereas there were
no significant effects of time on RERpeak, HRpeak, BLa peak and RPEpeak. Only
workload at L2 was significantly affected by the interaction between time and intensity,
which means workload at L2 was significantly greater after HIIT than MIIT (P≤0.01).
There was no significant effect of intensity and time on workload at MFO, expressed as
absolute workload (W) or relative to peak VO2 (%VO2peak). Table 5-5 shows
physiological responses at maximal and submaximal aerobic capacity during GXT.
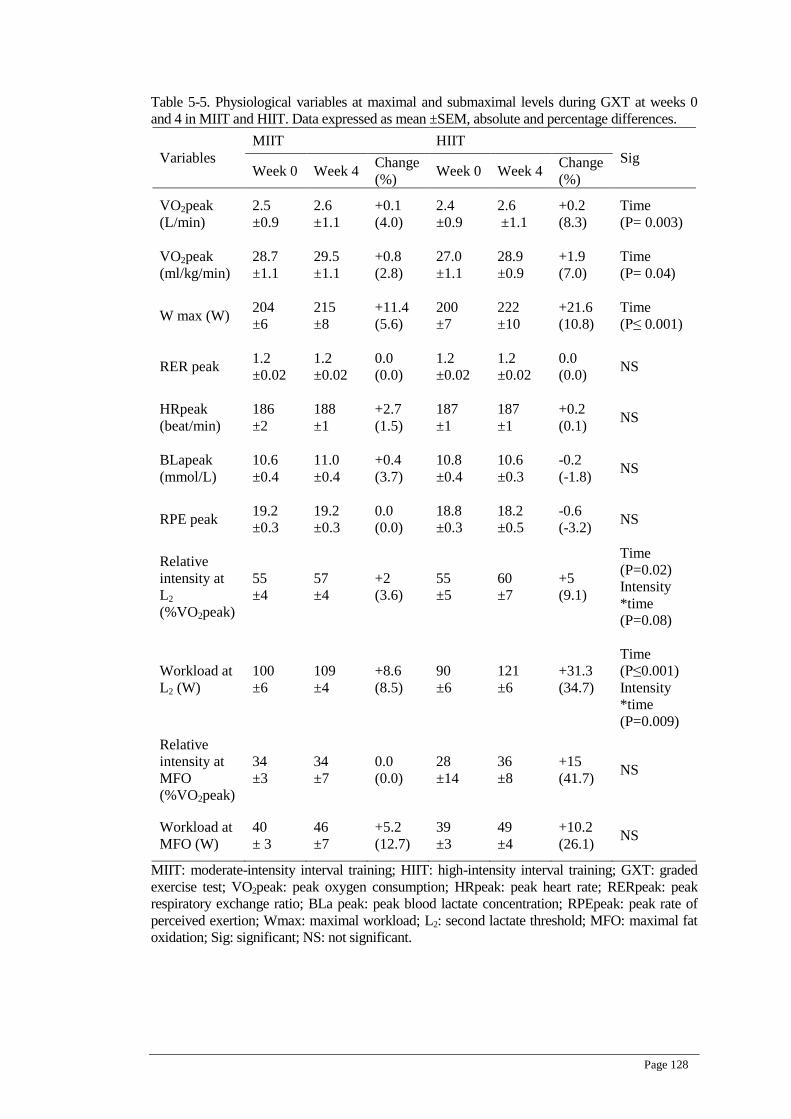
Page 128
Table 5-5. Physiological variables at maximal and submaximal levels during GXT at weeks 0
and 4 in MIIT and HIIT. Data expressed as mean ±SEM, absolute and percentage differences.
Variables
MIIT HIIT
Sig Week 0 Week 4
Change
(%) Week 0 Week 4
Change
(%)
VO2peak
(L/min)
2.5
±0.9
2.6
±1.1
+0.1
(4.0)
2.4
±0.9
2.6
±1.1
+0.2
(8.3)
Time
(P= 0.003)
VO2peak
(ml/kg/min)
28.7
±1.1
29.5
±1.1
+0.8
(2.8)
27.0
±1.1
28.9
±0.9
+1.9
(7.0)
Time
(P= 0.04)
W max (W) 204
±6
215
±8
+11.4
(5.6)
200
±7
222
±10
+21.6
(10.8)
Time
(P≤ 0.001)
RER peak 1.2
±0.02
1.2
±0.02
0.0
(0.0)
1.2
±0.02
1.2
±0.02
0.0
(0.0) NS
HRpeak
(beat/min)
186
±2
188
±1
+2.7
(1.5)
187
±1
187
±1
+0.2
(0.1) NS
BLapeak
(mmol/L)
10.6
±0.4
11.0
±0.4
+0.4
(3.7)
10.8
±0.4
10.6
±0.3
-0.2
(-1.8) NS
RPE peak 19.2
±0.3
19.2
±0.3
0.0
(0.0)
18.8
±0.3
18.2
±0.5
-0.6
(-3.2) NS
Relative
intensity at
L2
(%VO2peak)
55
±4
57
±4
+2
(3.6)
55
±5
60
±7
+5
(9.1)
Time
(P=0.02)
Intensity
*time
(P=0.08)
Workload at
L2 (W)
100
±6
109
±4
+8.6
(8.5)
90
±6
121
±6
+31.3
(34.7)
Time
(P≤0.001)
Intensity
*time
(P=0.009)
Relative
intensity at
MFO
(%VO2peak)
34
±3
34
±7
0.0
(0.0)
28
±14
36
±8
+15
(41.7) NS
Workload at
MFO (W)
40
± 3
46
±7
+5.2
(12.7)
39
±3
49
±4
+10.2
(26.1) NS
MIIT: moderate-intensity interval training; HIIT: high-intensity interval training; GXT: graded
exercise test; VO2peak: peak oxygen consumption; HRpeak: peak heart rate; RERpeak: peak
respiratory exchange ratio; BLa peak: peak blood lactate concentration; RPEpeak: peak rate of
perceived exertion; Wmax: maximal workload; L2: second lactate threshold; MFO: maximal fat
oxidation; Sig: significant; NS: not significant.

Page 129
5.4.5 The changes in BLa, HR and RPE
5.4.5.1 During the constant-load test
BLa, HR and RPE significantly decreased during the constant-load exercise test
after MIIT and HIIT, revealing a significant effect of time (P≤ 0.05, 0.01 and 0.001 for
BLa, HR and RPE respectively). BLa was lower during HIIT than MIIT but the
interaction between intensity and time was not significant (P=0.09). The interaction
between time and intensity on RPE was significant (P≤ 0.05) revealing a greater
decrease after HIIT than MIIT (-1.3 unit in MIIT vs -2.7 unit in HIIT). Figures 5-4, 5-5
and 5-6 show the responses of BLa, HR and RPE respectively during constant-load
exercise test at weeks 0 and 4 in MIIT (a) and HIIT (b).
5.4.5.2 During training sessions
BLa, HR and RPE were monitored and collected at the first session of every
week in minutes 5, 15 and 30 during MIIT and HIIT. These variables were also collected
at the end of exercise bouts, but as the workload at the end of MIIT was 20% either
above or below 45 %VO2peak, data at this point was not included in statistical analysis.
The values of BLa and HR were significantly higher during HIIT than MIIT (P≤
0.001), but there was no significant difference in RPE between MIIT and HIIT. While
BLa and HR corresponded to the workload during MIIT, RPE significantly increased
with exercise duration independent of intensity (P≤ 0.001). Moreover, all variables (BLa,
HR and RPE) declined during the 12-exercise sessions in MIIT and HIIT revealing
significant effects of training period (weeks) (P≤ 0.001). Post hoc comparisons revealed
that significant decreases in BLa and HR were detected in week 4 (after nine sessions)
compared with weeks 1 and/or 2 (P≤ 0.001), whereas the statistical decrease in RPE was
detected from week 3 (after six sessions) compared with week 1 (P≤ 0.001).
The interaction between intensity and training period (weeks) on RPE was
significant (P≤ 0.05). Although this interaction also effected HR (P≤ 0.05), changes in
HR were not consistent. For example, the average HR values were 131, 128, 129 and
124 beats/min in weeks 1, 2, 3 and 4 during MIIT, and were 139, 141, 134 and 132
beats/min in weeks 1, 2, 3 and 4 during HIIT. Interestingly the effect of this interaction
on average HR (pooled time of 5,15 and 30 min) was not significant (P=0.1). Figures 5-
7, 5-8 and 5-9 show the responses of BLa, HR and RPE respectively during 4-week
training sessions of MIIT (a) and HIIT (b).

Page 130
a)
b)
Figure 5-4. The concentration of blood lactate (BLa) during constant-load exercise test at
week 0 (solid line) and week 4 (dotted line) in MIIT (a) and HIIT (b); data represented as
mean ±SEM.
There was a significant effect of time (p≤ 0.05). The interaction between intensity and time
was not significant (P=0.09).
MIIT: moderate-intensity interval training; HIIT: high-intensity interval training.
0
1
2
3
4
5
6
0 15 30 45 +30 +60
Blo
od
lact
ate
con
cen
trat
ion
(m
mo
l/L)
Duration of exercise (min)
MIIT - week 0 MIIT- week 4
0
1
2
3
4
5
6
0 15 30 45 +30 +60
Blo
od
lact
ate
con
cen
trat
ion
(m
mo
l/L)
Duration of exercise (min)
HIIT - week 0 HIIT- week 4

Page 131
a)
b)
Figure 5-5. Heart rate (HR) during constant-load exercise test at week 0 (solid line) and week
4 (dotted line) in MIIT (a) and HIIT (b); data represented as mean ±SD.
There was a significant effect of time (p≤ 0.01).
MIIT: moderate-intensity interval training; HIIT: high-intensity interval training.
70
80
90
100
110
120
130
140
150
0 15 30 45 +30 +60
Hea
rt r
ate
(bea
t/m
in)
Duration of exercise (min)
MIIT - week 0 MIIT- week 4
70
80
90
100
110
120
130
140
150
0 15 30 45 +30 +60
Hea
rt r
ate
(bea
t/m
in)
Duration of exercise (min)
HIIT- week 0 HIIT- week 4

Page 132
a)
b)
Figure 5-6. The rate of perceived exertion (RPE) during constant-load exercise test at week 0
(solid line) and week 4 (dotted line) in MIIT (a) and HIIT (b); data represented as mean
±SEM.
There was a significant effect of time (p≤ 0.001). The interaction between time and intensity
was significant (p≤ 0.05).
MIIT: moderate-intensity interval training; HIIT: high-intensity interval training.
5
6
7
8
9
10
11
12
13
14
15
0 15 30 45 +30 +60
Rat
e o
f p
erce
ived
exe
rtio
n (
6-2
0)
Duration of exercise (min)
MIIT - week 0 MIIT - week 4
5
6
7
8
9
10
11
12
13
14
15
0 15 30 45 +30 +60
Rat
e o
f p
erce
ived
exe
rtio
n (
6-2
0)
Duration of exercise (min)
HIIT - week 0 HIIT - week 4

Page 133
a)
b)
Figure 5-7. The concentration of blood lactate (BLa) during 4-week training of MIIT (a) and
HIIT (b); data collected in the first exercise session of every week; data represented as mean
±SEM. Note: workload at 30 mins of MIIT was lower than workload at 5 and 15 mins of
MIIT
There was a significant effect of training period (weeks) (p≤ 0.001).
MIIT-1-4: moderate-intensity interval training at weeks 1, 2, 3 and 4; HIIT-1-4: high-
intensity interval training at week 1, 2, 3 and 4.
2
3
4
5
6
7
8
MIIT_week 1 MIIT_week 2 MIIT_week 3 MIIT_week 4
Blo
od
lact
ate
con
cen
trat
ion
(m
mo
l/L)
5 mins 15 mins 30 mins
2
3
4
5
6
7
8
HIIT_week 1 HIIT_week 2 HIIT_week 3 HIIT_week 4
Blo
od
lact
ate
con
cen
trat
ion
(m
mo
l/L)
5 mins 15 mins 30 mins

Page 134
a)
b)
Figure 5-8. Heart rate (HR) during 4-week training of MIIT (a) and HIIT (b); data collected
in the first exercise session of every week; data represented as mean ±SD. Note: workload at
30 mins of MIIT was lower than workload at 5 and 15 mins of MIIT.
There was a significant effect of training period (weeks) (p≤ 0.001).
MIIT-1-4: moderate-intensity interval training at weeks 1, 2, 3 and 4; HIIT-1-4: high-
intensity interval training at week 1, 2, 3 and 4.
100
110
120
130
140
150
160
MIIT_week 1 MIIT_week 2 MIIT_week 3 MIIT_week 4
Hea
rt r
ate
(bea
ts/m
in)
5 mins 15 mins 30 mins
100
110
120
130
140
150
160
170
HIIT_week 1 HIIT_week 2 HIIT_week 3 HIIT_week 4
Hea
rt r
ate
(bea
ts/m
in)
5 mins 15 mins 30 mins

Page 135
a)
b)
Figure 5-9. The rate of perceived exertion (RPE) during 4-week training of MIIT (a) and
HIIT (b); data collected in the first exercise session of every week; data represented as mean
±SEM. Note: workload at 30 mins of MIIT was lower than workload at 5 and 15 mins of
MIIT.
There was a significant effect of training period (weeks) (p≤ 0.001), and an interaction
between intensity and training period (weeks) on RPE (p≤ 0.05).
MIIT-1-4: moderate-intensity interval training at weeks 1, 2, 3 and 4; HIIT-1-4: high-
intensity interval training at week 1, 2, 3 and 4.
6
7
8
9
10
11
12
13
MIIT_week 1 MIIT_week 2 MIIT_week 3 MIIT_week 4
The
rate
of
per
ceiv
ed e
xert
ion
(6
-20
)
5 mins 15 mins 30 mins
6
7
8
9
10
11
12
13
14
HIIT_week 1 HIIT_week 2 HIIT_week 3 HIIT_week 4
The
rate
of
per
ceiv
ed e
xert
ion
(6
-20
)
5 mins 15 mins 30 mins

Page 136
5.4.6 NEAT and severity of fatigue symptoms
NEAT increased at week 4 during interval training compared with baseline
values at week 0, but the increase in average steps per day was not significant.
Participants wore pedometers for 14 (SD ±1) hrs and 15±2 hrs at weeks 0 and 4 in MIIT,
and for 16 ±2 hrs and 14 ±3 hrs at weeks 0 and 4 in HIIT. There were missing data for
two participants at either week 4 of MIIT or weeks 0 and 4 of HIIT. Excluding these two
participants did not change the statistical outcome. Figure 5-10 shows step counts per
day at weeks 0 and 4 in MIIT and HIIT for eight participants.
The responses of participants to a severity of fatigue symptoms questionnaire are
shown in Table 5-6, taken at week 0 and at week 4. The responses to questions 6 and 7
were significant (p ≤ 0.01 and 0.05). The Severity of Fatigue Symptoms questionnaire is
shown in Appendix B, Figure 8-7.
Figure 5-10. Average step counts per day at week 0 and 4 in MIIT (dark bars) and HIIT (bright
bars); there were no significant effect of intensity or time on step counts; data represented as
mean ±SD; sample size = 8 (two participants were excluded).
MIIT: moderate-intensity interval training; HIIT: high-intensity interval training.
0
2000
4000
6000
8000
10000
12000
14000
week 0 week 4
Step
co
un
ts p
er d
ay
MIIT HIIT

Page 137
Table 5-6. Responses to the 7-item Severity of Fatigue Symptoms Questionnaire using Likert
Scale at weeks 0 and 4 in MIIT and HIIT. Data expressed as mean ±SEM, absolute and
percentage differences.
Variables
MIIT HIIT
Sig Week 0 Week 4
Change
(%) Week 0 Week 4
Change
(%)
Problem
with
tiredness
2.2
±0.3
1.9
±0.4
-0.3
(-13.0)
2.0
±0.4
2.0
±0.3
0.0
(0.0) NS
Need to rest
more
2.0
±0.3
1.9
±0.4
-0.1
(-5.0)
2.1
±0.5
2.3
±0.3
+0.2
(9.5) NS
Feel sleepy 2.1
±0.2
2.1
±0.5
0.0
(0.0)
2.4
±0.4
1.9
±0.5
-0.5
(-20.8) NS
Problems
starting
things
1.8
±0.3
1.7
±0.5
-0.1
(-5.5)
2.2
±0.2
1.7
±0.3
-0.5
(-22.7)
Time
(P= 0.051)
Lacking in
energy
2.0
±0.4
1.8
±0.4
-0.2
(-10.0)
2.0
±0.5
1.8
±0.4
-0.2
(-10.0) NS
Less strength
in muscles
2.0
±0.3
1.8
±0.4
-0.2
(-10.0)
2.1
±0.4
1.5
±0.4
-0.6
(-28.5)
Time
(P= 0.004)
Feel weak 2.0
±0.3
1.8
±0.3
-0.2
(-10.0)
2.1
±0.5
1.6
±0.4
-0.5
(-23.8)
Time
(P= 0.042)
MIIT: moderate-intensity interval training; HIIT: high-intensity interval training; Sig: significant;
NS: not significant.
Likert scores were inverted to continuous scale as follows: 1= better than usual, 2= no more than
usual, 3= worse than usual and 4= much worse than usual.

Page 138
5.5 Discussion
5.5.1 The main finding
The primary aim of this study was to investigate the effect of MIIT and HIIT on
fat oxidation. Results revealed that the intervention significantly increased exercise-
induced fat oxidation during a GXT and the constant-load moderate-intensity exercise
test. Although MFO during a GXT was higher after HIIT, and the rate of fat oxidation
during the constant-load exercise test was higher after MIIT, these trends were small and
insignificant.
The second aim was to investigate the effect of training condition on the
responses of BLa, HR and RPE. Results revealed that BLa, HR and RPE significantly
decreased during training sessions and during the constant-load moderate-intensity
exercise test in MIIT and HIIT. RPE significantly decreased after HIIT to a greater
extent than MIIT. BLa also decreased after HIIT to a greater extent than MIIT but the
difference did not approach significance.
Secondary aims included the influence of MIIT and HIIT on insulin sensitivity,
cardiorespiratory fitness and NEAT. The intervention had no significant impact on
insulin sensitivity. There were significant increases in VO2peak, Wmax and workloads at
LT. Although VO2peak, Wmax was higher after HIIT than MIIT, the difference between
training intensities was not significant. The change in workload at LT was significantly
greater after HIIT than MIIT. VO2 and workloads at MFO increased after the
intervention, but did not approach significance. NEAT, using the amount of daily step
counts measured by pedometer, slightly increased during the intervention, but this
increase was not significant.
5.5.2 Fat oxidation during GXT and the constant-load test
Since the work of Romijn et al. (1993a), moderate-intensity exercise has been
advocated as a training strategy to increase fat oxidation, particularly among sedentary
obese individuals who had greater rates of fat oxidation during acute low-intensity
exercise than high-intensity exercise (Steffan et al., 1999; Stisen et al., 2006). More
specifically, Achten et al. (2002) determined the intensity that elicits maximal fat
oxidation, proposing that the use of this intensity in training can increase fat oxidation
and promote weight loss. However, Gibala et al. (2009) confirmed that six sessions of

Page 139
supramaximal interval training undertaken within two weeks can increase muscle
oxidative capacity and fat metabolism-related protein content. In line with this, the
current study found that 12 sessions of interval training undertaken within four weeks, of
either repeated 30-sec high-intensity at 90%VO2peak or alternated 5-min moderate-
intensity exercise at ±20% of workload at 45%VO2peak, significantly increased
medium-term exercise-induced fat oxidation in overweight/obese men, with no
difference identified between training intensities. In concordance with HIIT, Talanian et
al. (2007) found that seven sessions of long work-to-rest ratio of high-intensity interval
training at 90%VO2max significantly increased exercise-induced fat oxidation in
moderately active women. To the contrary with MIIT, Venables and Jeukendrup (2008)
did not find an increase in exercise-induced fat oxidation after 12 sessions of alternated
5-min exercise at ±20% of FATmax in obese men, whereas fat oxidation increased after
continuous moderate-intensity training.
While there is a lack of studies that compare different intensities of interval
training, studies that used continuous training did not find moderate-intensity training to
be more favourable for obese individuals to increase fat oxidation. For example, Van
Aggel-Leijssen et al. (2002) found a significant increase in exercise-induced fat
oxidation after moderate-intensity aerobic training at 40%VO2max for 12 weeks in obese
men, whereas no change was found after high-intensity aerobic training at 70%VO2max.
However, there was no significant difference between groups in the change of fat
oxidation. The participants also started the moderate-intensity training with a lower level
of fat oxidation than high-intensity training, whereas the levels of post-training fat
oxidation were comparable between moderate and high-intensity training groups.
Another study found that aerobic training at 70%VO2max for 16 weeks did not increase
resting and exercise-induced fat oxidation in obese women (Kanaley et al., 2001), but
this study did not include a low-intensity group or lean group. Several studies have also
reported that 24-hr fat oxidation did not differ between moderate- and high-intensity
exercise in continuous (Hansen et al., 2005; Melanson et al., 2007; Melanson, MacLean
& Hill, 2009b) and interval (Saris & Schrauwen, 2004; Treuth et al., 1996) exercise. In
conclusion, there are no consistent findings supporting the view that moderate-intensity
training can increase fat oxidation to a greater extent than high-intensity exercise in the
obese population.

Page 140
The current finding of similar effectiveness of moderate- and high-intensity
interval training on fat oxidation is supported by theoretical explanation of the
mechanism of mitochondrial signalling pathways during moderate- and high-intensity
training. Different mitochondrial signalling pathways during moderate- and high-
intensity training can target PGC-1α mRNA transcription which is considered a ‘master
switch’ for substrate oxidation in the mitochondria (Laursen, 2010). The high-intensity
of endurance training such as HIIT can increase the mitochondrial oxidative capacity and
consequently improve fat oxidation potential through the AMP-activated protein kinase
pathway, and the high-volume of endurance training such as MIIT can increase the
mitochondrial oxidative capacity through the calcium-calmodulin kinases pathway
(Laursen, 2010). Wang et al. (2009) compared high-intensity interval training at
120%VO2max for 12 secs with 18-sec recovery intervals at 20%VO2max and moderate-
intensity continuous exercise at 67%VO2max for 90 mins in sedentary individuals, and
found identical increases in the mRNA content for major regulators of mitochondrial
biogenesis (peroxisome proliferator- activated receptor (PPAR) and PGC-1α) and lipid
metabolism (pyruvate dehydrogenase kinase isozyme 4 (PDK4)). Burgomaster et al.
(2008) found a similar adaptation in the level of PGC-1α after six sessions of low-
volume sprint intervals for 30 secs of maximal capacity and high-volume endurance
training at 65%VO2max for 60 mins.
The trend of a greater increase in constant-load exercise-induced fat oxidation
after MIIT and a greater increase in maximal fat oxidation during a GXT after HIIT can
be attributed to the specificity between exercise training and exercise test forms.
Venables and Jeukendrup (2008) found that 30 mins of continuous exercise testing at 50
%VO2max detected an improvement in fat oxidation by 44% (0.1 g/min) after four
weeks of moderate-intensity continuous training whereas MFO during GXT did not
detect this improvement (0.02 g/min). Unlike Venables and Jeukendrup’s study, there
was a significant increase in fat oxidation using graded and constant-load exercise tests
in the current study. The specificity between training and test forms had a small effect on
the outcome but was not significant, and a GXT was able to detect a significant increase
in MFO after interval training.
5.5.3 Blood glucose and insulin sensitivity
The current intervention had no effect on blood glucose and insulin sensitivity,
which could be attributed to the volume of training. The current finding was in

Page 141
agreement with a previous meta-analysis review which found that the statistical and
clinical effects of aerobic training on glucose metabolism require at least eight weeks
(Zanuso et al., 2010). For example, 4-week training, consisting of 12 sessions with two
to three 15-min cycling per session performed at progressive intensities of 50-70
%VO2peak, had no impact on HOMA-IR in sedentary obese adults (Johnson et al.,
2009). Twelve weeks of moderate-intensity continuous exercise and high-intensity
interval exercise similarly decreased glucose concentration in untrained men (Nybo et
al., 2010). Tonna et al. (2008) found significant effects of 16-week high-intensity
interval training on insulin sensitivity in obese patients with metabolic syndrome. On the
other hand, the current finding was not in agreement with Gibala et al. (Gibala & Little,
2010; Hawley & Gibala, 2009) who found significant improvement in glucose
metabolism after six sessions of supramaximal interval training. The intensity of training
in these studies is not comparable with the current study. In conclusion, the current study
suggested that the volume of 12 sessions of moderate- and high-intensity interval
training undertaken within four weeks are not enough to reduce fasting glucose
concentration in obese men.
The method of fasting glucose and insulin could also contribute to the current
finding of unchanged insulin sensitivity after interval training. Blood glucose after
overnight fasting represents a basal steady state, whereas dynamic testings that involve
oral glucose solutions or meals increase glucose and induce the secretion of insulin in the
plasma (Muniyappa, Lee, Chen & Quon, 2008). The measurement of fasting plasma
glucose and insulin was the less sensitive method that can detect changes in glucose and
insulin metabolism compared with other methods such as the hyperinsulinaemic
euglycaemic clamp technique (Richards et al., 2010), Cederholm index (Babraj et al.,
2009) and Matsuda index (Venables & Jeukendrup, 2008). The sensitivity of the method
of glucose and insulin measures may explain the variations between studies.
The significant increase in fat oxidation measured during constant-load exercise
was not associated with an improvement in fasting blood glucose and insulin sensitivity,
which was in agreement with some previous studies. For example, marked elevation in
oxidative capacity did not improve insulin sensitivity further than the loss of body
weight (Schenk et al., 2009). Ten weeks of aerobic training in obese individuals with and
without T2D similarly improved whole-body fat oxidation and muscle oxidative
capacity, and the change in fat oxidation was not correlated with changes in insulin

Page 142
sensitivity (Mogensen, Vind, Holund, Beck-Nielsen & Sahlin, 2009). Moreover, fat
oxidation decreased faster than insulin sensitivity after exercise cessation (Rimbert et al.,
2009). These data suggested that several factors, apart from fat oxidation (Williams et
al., 2010), can affect insulin sensitivity. These factors include hormonal mediators
(Kraemer & Castracane, 2007), inflammatory markers (Balducci et al., 2010) and the
change in body weight (Dube et al., 2011; Sjoberg, Brinkworth, Wycherley, Noakes &
Saint, 2011).
The changes in lipid profiles were not significant, and there was no tendency for
improvement in any lipid marker. The duration of the current interval training sessions
was 112 mins/week, and the total EE was 645 kcal/week as calculated using the
constant-load exercise test at the baseline. This was lower than the minimal proposed
volume for exercise training (1,200 kcal/week) to improve TG and HDL-C (Durstine et
al., 2002; Durstine et al., 2001). For example, the TC/HDL-C ratio decreased after
moderate-intensity continuous training in untrained men when they trained for 150
mins/week for 12 weeks, while it did not change after high-intensity interval training that
lasted 40 mins/week including a 20 mins/week warm-up activity (Nybo et al., 2010).
Another factor that can improve HDL-C during interval training is the length of work
stage. For example, Musa et al. (2009) found HDL-C increased by 18% after high-
intensity interval training at 90 %HRmax consisting of 4 × 800m run for eight weeks in
untrained young men, and this improvement was attributed to the length of interval work
as well as the volume of training. Generally speaking, high-volume aerobic training was
found to be effective in improving TG and HDL-C but not TC and LDL-C (Durstine et
al., 2002; Durstine et al., 2001; LeMura et al., 2000; Riedl et al., 2010; Stergioulas &
Filippou, 2006).
5.5.4 Cardiorespiratory fitness at maximal power, LT and MFO during a GXT
Three transition breakpoints reflect cardiorespiratory fitness during GXT,
including maximal volitional power, anaerobic lactate threshold and aerobic lactate
threshold (Binder et al., 2008). The intensity that elicits aerobic lactate threshold is
equivalent to the intensity that elicits MFO (Bircher & Knechtle, 2004). The influences
of MIIT and HIIT on these transition breakpoints were examined, and results revealed
that VO2peak increased 1.9 ml/kg/min (7%) after HIIT. This was in agreement with
previous studies that have reported increases in VO2max ranging between 5 and 15%
after a medium-term high-intensity aerobic interval training (Demarle et al., 2003;

Page 143
Esfarjani & Laursen, 2007; Ingul, Tjonna, Stolen, Stoylen & Wisloff, 2010; Nybo et al.,
2010). The increase in VO2peak after MIIT was 0.8 ml/kg/min (2.8%). This finding was
in line with the suggestion that high intensity training is essential to improve VO2max,
and duration cannot compensate for intensity (Midgley & Mc Naughton, 2006; Wenger
& Bell, 1986). Helgerud et al. (2007) found that the improvements in VO2max after
eight weeks of either short (work-to-rest ratio was 15:15-sec) or long (work-to-rest ratio
was 30:30-sec) interval training at 90-95%HRmax were significantly greater than
continuous training either at a long slow distance (70%HRmax) or LT (85%HRmax) in
moderately active males. The increases in VO2max were 1 ml/kg/min (1.7%) after the
slow distance training, 1.2 ml/kg/min (2.0%) after the LT training, 3.9 ml/kg/min (5.5%)
after short high-intensity interval training and 4.9 ml/kg/min (7.2%) after long high-
intensity interval training.
Interval training was effective in increasing the workload at LT, but did not
significantly affect workload at MFO (FATmax). Workloads at LT significantly
increased after HIIT (34%) and MIIT (8%), and the difference between trainings was
also significant. It was found that training for 10 weeks at velocity at maximal oxygen
uptake (vVO2max) improved LT to a greater extent than matched supramaximal and
continuous training (11.7, 4.1 and 1.9% respectively) (Esfarjani & Laursen, 2007).
Moreover, adding one training session of high-intensity interval exercise at 110-120
%Wmax for 30 secs with 3.5-min active recovery to habitual aerobic training over six
weeks significantly increased LT by 4.2% and 17 W (Dalleck et al., 2010). Involving 2-
day interval sessions increased LT by 8.2% and 31 W which was significantly different
in comparison with the baseline and 1-day group (Dalleck et al., 2010). The increases in
FATmax were not significant in MIIT (12%) and HIIT (26%). This reflects the
decreased sensitivity of low-intensity exercise levels to demonstrate the improvement in
aerobic capacity that was detected at LT and VO2peak. It was reported that high-
intensity interval and moderate-intensity continuous training resulted in changes in HR
during a walking test at 6.5 km/hr with no change in fat oxidation, whereas changes in
HR and fat oxidation were observed during a running test at 9.5 km/hr (Nybo et al.,
2010). The occurrence of MFO in the initial discontinuous stages of GXT (i.e. low
workload at approximately 34 %VO2peak) can explain the absence of significance in the
change in workload at MFO level.

Page 144
5.5.5 Responses of BLa, HR and RPE during the constant-load test, and the time
course of their change during interval training sessions
The curve of BLa during the constant-load test in pre and post MIIT and HIIT
demonstrated three main trends. First, it decreased in the pre- and post-intervention after
the initial increase during the session, representing a normal stabilisation during
moderate-intensity exercise, and demonstrating that pyruvate is consumed aerobically
more than its generation via anaerobic glycolysis (Beneke, Leithuser & Ochentel, 2011).
Second, it increased in the initial 15-min exercise then started to decrease in the pre-
intervention because of the initial oxygen deficit, but it did not increase at the beginning
of the constant-load exercise test in the post-HIIT, which could be attributed to the rapid
increase in VO2 uptake in the onset of exercise and reflects an improvement in aerobic
capacity after HIIT (Jones & Carter, 2000). Lastly, the curves of BLa were different
between MIIT and HIIT in the pre-intervention, but they were apparently similar in the
post-intervention, and BLa at HIIT was lower than MIIT. The similarity between MIIT
and HIIT in the shape of BLa curve supports the proposal of the importance of aerobic
training to improve BLa, and the lower concentration of BLa after HIIT than MIIT
supports the proposal of the importance of intensity in improving BLa (Beneke et al.,
2011). High-intensity interval training for four weeks decreased metabolic markers and
enzymes associated with the accumulation of BLa during exercise, and increased the
activity of markers and enzymes associated with BLa removal in the post-exercise
period (Messonnier, Freund, Denis, Feasson & Lacour, 2006). In addition, five weeks of
interval training at 100%VO2max significantly decreased the concentration of plasma
lactate at the end of a fixed-load exercise test (Bishop et al., 2008).
The reduction in BLa was associated with the decrease in RPE. The relationship
between BLa and RPE at high-intensity levels has been found in some previous studies
(Seiler et al., 2011). It was reported that RPE is mediated by psychological factors during
moderate-intensity, and mediated by physiological variables during high-intensity
training (Coutts, Rampinini, Marcora, Castagna & Impellizzeri, 2009; Pires et al., 2011).
Therefore, the association between BLa and RPE after high-intensity training reflects
peripheral metabolic adaptations that collectively attenuate RPE (Hampson et al., 2001;
Tucker, 2009). These peripheral adaptations include increased glycogen content during
rest, reduced glycogenolysis and reduced lactate accumulation, which were detected
after six weeks of interval training at 90%VO2peak in untrained participants (Perry,
Heigenhauser, Bonen & Spriet, 2008).

Page 145
The time course of changes in BLa, HR and RPE, as measured in the first session
of every week’s training, revealed that the reductions in BLa and HR occurred after nine
sessions, while the reduction in RPE was evident after six sessions in MIIT and HIIT.
Few studies have investigated the time course of physiological adaptation during aerobic
training. For example, HR during exercise in young and older women significantly
decreased by 10 and 4 beats/min respectively at week 3 (after nine sessions) of training
at 70%VO2max, with no further changes in weeks 6, 9 and 12 (Murias, Kowalchuk &
Paterson, 2010). A significant reduction in submaximal HR was found after three
sessions performed in one week, and a further decrease was found after three weeks, but
BLa did not change during an incremental test at weeks 1 and 3 after training at
70%VO2max for 45 mins per session, and LT did not change after one week of training
but significantly increased at week 3 in sedentary young men (Ziemba et al., 2003).
While the time course of the adaptation of HR was in agreement with previous studies,
there is a lack of studies that demonstrate the time course of the changes in BLa.
The key parameters of aerobic fitness and endurance performance are maximal
and submaximal VO2 and BLa (Jones & Carter, 2000). In addition, there is an
association between the change in BLa during exercise training and the stability in the
level of VO2 (Garcin et al., 2006; Mujika, 2010). Therefore, it is important to compare
the time course that is required to reduce BLa with the time course that is required to
improve VO2 in previous studies, as it was not measured during training sessions in the
current study. Several studies have found that aerobic high-intensity interval training of
six and seven sessions improved VO2max (Little et al., 2010; Talanian et al., 2007). Nine
sessions of continuous aerobic training at 70%VO2max improved VO2max in older and
young men (Murias et al., 2010). VO2max did not change after one week of aerobic
training at 70%VO2max for 45 mins three times per week, but significantly increased
after three weeks, and submaximal O2 uptake did not change at weeks 1 and 3 (Ziemba
et al., 2003). Collectively, the current result and previous studies suggest that nine
sessions are adequate to improve physiological markers related to aerobic performance.
5.5.6 NEAT
The count of steps at baseline was 6,224 and 5,461 respectively prior to MIIT
and HIIT. The participants did not reach 10,000 steps which is the recommended daily
physical activity (McKay et al., 2009), as the participants were sedentary. The daily steps
did not significantly change, but a slight increase during the intervention was found.

Page 146
Colley et al. (2010) found that vigorous physical activity measured by an accelerometer
increased, but time spent in sedentary and moderate activity also increased during an 8-
week walking intervention in obese women. The compensation in NEAT in Colley et
al.’s study was correlated with physical fitness at baseline, which means the walking
intervention fatigued those women who were initially unfit (Colley et al., 2010), whereas
the current participants can be considered as individuals who did not compensate
exercise-induced EE by reducing free-living physical activity (King et al., 2007b). The
current result is in agreement with studies which found that different volumes of
moderate-intensity training did not affect daily steps using step counters (Church et al.,
2009) and different intensities and volumes also did not affect NEAT using
accelerometers (Alahmadi et al., 2011; Hollowell et al., 2009).
Combined physiological and psychological indices that improved physical
fitness, relieved physical stress and reduced fatigue can explain the slight increase in
NEAT during MIIT and HIIT. The severity of fatigue symptoms was examined using
the 7-item questionnaire. Results revealed significant increases in the feeling of muscle
strength during MIIT and HIIT. Moreover, the significant reductions in BLa and RPE
during the exercise sessions that were found at week 3 during both MIIT and HIIT
suggest that participants were able to undertake the sessions with less physiological
stress, and may also have experienced less physical fatigue. Therefore, the increase in
physiological markers could directly impact NEAT through the improvement in physical
fitness and muscle strength, and also could indirectly impact NEAT through the effect on
perceived exertion and the feeling of strength. However, while physical fitness can
explain the increase in NEAT, the slightly greater increase in the mean values of step
counts during MIIT than HIIT cannot be explained via the physiological adaptation only.
Further investigation is required to determine the intensity threshold that could cause
fatigue.
5.5.7 Summary
Twelve sessions of MIIT and HIIT exercise performed in four weeks resulted in
statistically significant improvements in exercise-induced fat oxidation, with
improvements being independent of exercise intensity. BLa decreased during the
constant-load test and training sessions of HIIT to a greater extent than MIIT, and the
decrease in BLa was associated with the decrease in RPE. There was also a greater
increase in cardiorespiratory fitness after HIIT compared with MIIT. This study,

Page 147
therefore, concluded that high-intensity interval training is appropriate for healthy obese
men in order to increase fat oxidation and physical fitness and to decrease BLa and RPE.

Page 148
6 Experiment 2-B: A comparison between
the medium-term effects of MIIT and
HIIT on appetite and food intake
6.1 Introduction
It is recommended that weight loss intervention programs should incorporate
reductions in EI and increases in EE (Donnelly et al., 2009; Seagle, Strain, Makris &
Reeves, 2009). For example, a combination of increased high volume of EE and dietary
counselling has been shown to achieve target weight loss in men and women (Ross et al.,
2000; Ross et al., 2004). However, several studies without dietary intervention,
involving moderate-intensity continuous training reported a lower than predicted weight
loss (Donnelly et al., 2000; Ross & Janssen, 2001). High-intensity interval training has
also resulted in variable changes in body weight (Tonna et al., 2008; Trapp et al., 2008;
Tremblay et al., 1994b). These variations in weight change could be partly explained by
compensatory eating behaviour responses (King et al., 2007a).
The compensation of eating behaviour components such as appetite sensations,
food intake and nutrient preferences could explain individual variations in exercise-
induced weight loss. For example, the individual variability in weight loss following 12
weeks of supervised exercise was attributed to behavioural responses through the
increase in EI and the average daily hunger in the compensator group whose actual
weight loss was lower than their predicted weight loss (King et al., 2008). Change in
food or nutrient preference could be a strong contributor to increased compensatory food
intake, which in turn will undermine the impact of exercise on weight loss. Nutrient
preferences can be examined using the liking and wanting procedure introduced by
Berridge (2009) who separated the mediators of food reward in the brain into liking
(hedonic effective) and wanting (incentive salience motivation). Finlayson et al. (2007a)
designed a computer-based paradigm to assess the distinction between liking and
wanting for food taste and fat content in humans. Finlayson et al. (2011) found that
responders who experienced equal to or more than the expected weight reduction did not
show any change in liking for food stimuli after 12 weeks of training, while non-
responders’ liking increased independent of taste and fat content, and non-responders

Page 149
also showed a specific increase in high fat sweet food. Therefore, these eating
behaviours were able to discriminate between individuals according to their weight loss
in response to training intervention.
While most studies that have examined the compensatory responses used
moderate-intensity training (Barwell et al., 2009; King et al., 2008), the impact of
different intensities of interval training on compensatory dietary response has not been
fully examined. Church et al. (2009) compared three exercise groups based on the
volume of weekly EE (4, 8 and 12 kcal/kg/week) at moderate-intensity levels in
sedentary overweight women for 12 weeks. Compensatory responses occurred in the 12
kcal/kg/week group only. Another study also confirmed the dietary compensation at the
high volume of moderate-intensity steady-state exercise over 14 days (Whybrow et al.,
2008). Investigating the influence of different intensities of interval training on EI is
important because there is growing evidence to support the idea that high-intensity
interval training can reduce body fat mass more effectively than steady-state endurance
training (Boutcher, 2011). The proposed theories tend to focus on physiological
mechanisms such as fat oxidation. While several studies did not find an effect of exercise
intensity on 24-hr post-exercise fat oxidation (Melanson et al., 2009a; Melanson et al.,
2009b), suppressed appetite was proposed to contribute to the reduction in body fat mass
after high-intensity interval training, but has not yet been examined (Boutcher, 2011).
A few studies have examined the effect of different intensities of acute and
medium-term continuous exercise on one of the eating behaviour components, but the
findings of these studies were equivocal. A robust finding is the short-lived suppression
of hunger after an acute single bout of high-intensity continuous exercise (King et al.,
1994; King et al., 1997b). However, the effect of different intensities of medium-term
exercise on fasting and post-exercise-induced hunger has not been examined. An
increase in fat intake among normal-weight adults in the day following acute high-
intensity exercise compared with a moderate-intensity exercise session has been shown,
but this increase was insufficient to significantly affect EI (Klausen et al., 1999). In
contrast, a 7-week study which compared low- and high-intensity training found a
greater reduction in food intake after high-intensity training but this did not reach
statistical significance (Dickson-Parnell & Zeichner, 1985). Jakicic et al. (2003)
investigated the effect of different combinations of intensity and duration on body
weight and EI at weeks 6 and 12 of the intervention in overweight women, and did not

Page 150
find any influence of the intervention or differences between treatments on EI and the
percentage of fat reduction. In short, the effect of different intensities of medium-term
exercise on eating behaviour is unclear, and the role of interval training has not been
examined.
Physiological factors such as substrate oxidation have been proposed as factors
influencing changes in nutrient preferences and food intake (Flatt, 1987, 1996). For
example, a positive relationship between RQ and food intake was reported in lean
individuals (Kissileff et al., 1990). Similarly, another study found that low RQ (high fat
oxidation) was inversely correlated with food intake (Almeras et al., 1995). It should be
noted that this study only recruited 11 participants who were divided into two subgroups
based on relatively small differences in exercise-induced RQ (0.93 and 0.91), and the
energy cost of exercise was significantly different between groups. While these studies
revealed a possible directional relationship between exercise-induced substrate oxidation
and EI, the role of exercise intensity remains unclear. Six weeks of high-intensity
interval training at 90 %VO2peak for 1 hr three days per week increased muscle
glycogen content, reduced CHO oxidation and increased fat oxidation in untrained
individuals (Perry et al., 2008). These physiological adaptations reflected an increase in
CHO availability which can regulate the level of glucose, gastrointestinal hormones and
the rate of satiety (Pannacciulli et al., 2001). It also implied a decrease in food intake
according to the proposal of Flatt (1987, 1996). Therefore, it is possible that high-
intensity interval training will result in a greater decrease in food intake compared with
moderate-intensity interval training.
The aim of this study was to compare the influence of four weeks of moderate-
and high-intensity interval training (MIIT and HIIT) on fasting and acute exercise-
induced appetite sensations, fasting and acute exercise-induced liking and wanting and
acute exercise-induced food intake and nutrient preferences in 10 overweight/obese men.
6.2 Hypotheses
1) Fasting and acute exercise-induced hunger and desire to eat will significantly
decrease after HIIT, but will not change after MIIT.
2) Fasting and acute exercise-induced fat preferences will significantly decrease
after HIIT, but will not change after MIIT.

Page 151
3) Acute exercise-induced food intake will significantly decrease after HIIT, but
will not change after MIIT.
6.3 Methods
6.3.1 Participant characteristics
Participants were 10 sedentary overweight/obese men who were involved in
Experiment 2-A (refer to section 5.3.1). All participants signed a consent form and
attained medical clearance from a general practitioner prior to undertaking the study. The
study protocol was approved by the Human Research Ethics Committee at QUT (HREC
No. 1000000160).
6.3.2 Design of training intervention
The study employed a cross-over design, and involved two 4-week training
interventions consisted of 12-cycling sessions in each intervention (MIIT or HIIT)
separated by a 6-week detraining wash-out. The intensity of MIIT and HIIT were
determined at 45 and 90%VO2peak respectively. The exercise sessions were performed
three times per week, and the duration of exercise started with 30 mins in the first week,
and increased by 5 mins every week to 45 mins in the fourth week. All exercise sessions
started with unloaded 5-min warm-up cycling and ended with unloaded 5-min cool-
down cycling at cadence of 70 rpm. All exercise sessions were performed in a university
exercise laboratory under the supervision of the principal researcher. The participants
were asked to maintain their habitual diet, activity and alcohol intake during their
participation in the current project, and were asked to inform the principal researcher if
there was any change in their lifestyle behaviours. For further details of the exercise
training intervention, refer to section 5.3.6.
6.3.3 Use of constant-load exercise test to assess eating behaviour and substrate
oxidation
The acute and medium term (4 weeks) assessment of eating behaviour and
substrate oxidation occurred at week 0 (pre-intervention) and week 4 (post-intervention).
The acute effects were assessed using a constant-load moderate-intensity exercise test
followed by 1-hr recovery and a test meal. This fixed constant-load exercise bout was
different to the exercise sessions in the MIIT and HIIT. The constant-load exercise test
was performed in the afternoon at approximately 1:00 pm, and participants were asked
to not eat at least 5 hrs before the test. Tests were run in a ventilated air-conditioned

Page 152
laboratory where temperature was set at 21˚C. On the pre-assessment day, participants
were asked to abstain from any kind of exercise or physical work, and to abstain from
consuming alcohol and caffeine. All participants recorded their food and drink intake in
the 24 hrs preceding the first test, and were asked to adhere to the same dietary intake
preceding the three repeated tests during the experiment.
The constant-load test was performed at 45%VO2max at a cadence of 70 rpm for
45 mins followed by 60-min recovery. The procedure of cycling followed the
instructions in section 5.3.5.2 using a braked cycle ergometer (Monark Bike E234,
Monark Exercise AB, Sweden). The constant-load test was divided into six phases: one
rest phase (-5 – 0), three exercise phases (15, 30 and 45 min) and two recovery phases
(+30 and +60). Expired air was collected during the 5-min resting phase (-5 – 0),
intermittently between minutes (10-15), (25-30) and (40-45) during exercise phase and
intermittently between minutes (+15 - +30) and (+45 - +60) during the recovery phase.
Liking and wanting were measured at the rest, the end of exercise and the end of
recovery phases, whereas appetite sensations were measured at the end of all six phases.
After completion of the recovery phase, a test meal was provided to examine the effect
of medium-term MIIT and HIIT on energy and nutrient intake during food consumption.
Figure 6-1 provides a schematic diagram of the protocol.
The test meal comprised eight types of food in order to present the two factors of
fat content (high and low) and taste (sweet and non-sweet); similar to the food stimuli
presented in the liking and wanting test. The nutrient composition of the test meal is
displayed in Appendix A, Table 8.1. The participants were not informed about the
nutrient and energy content of the food.

Page 153
Figure 6-1. A schematic of the appetite test day protocol. Note that the exercise was a constant-
load exercise session.
VAS: Visual Analogue Scale.
6.3.4 Data management
6.3.4.1 Data management of indirect calorimetry
The Parvo Medics Analyser Module (TrueOne®2400, Metabolic Measurement
System, Parvo Medics, Inc. USA) was used in the measurement of respiratory gas
exchange. The calibration of the system was undertaken prior to each test. Refer to
section 3.3.5.1.1 for details of gas and flowmeter calibration.
Expired air was collected, and VO2, VCO2 and RER data were averaged every
30 secs automatically via the Parvo Medics Analyser. Data were then exported to an
Excel file. Fat and CHO oxidation rates (g/min) were calculated using stoichiometric
equations of the thermal equivalents of oxygen for non-protein RQ and percent
kilocalories and grams derived from CHO and lipid (VO2 is in L/min) as explained in
section 3.3.5.1.3. The outcomes included VO2, VCO2 and RER, fat oxidation and CHO
oxidation. The calculation included the average of 5-min measure during rest, the
averages of intermittent 5-min measures at 10-15, 25-30 and 40-45 mins during exercise
and the averages of intermittent 15-min measures at +15 - +30 and +45 - +60 during the
recovery period.
6.3.4.2 Data management of eating behaviour
6.3.4.2.1 Data management of appetite sensations, and liking and wanting
Subjective appetite sensations were measured using computer-based VAS, and
liking and wanting were assessed by using a computer-based paradigm. The process was
the same as described in section 4.3.5. Variables of appetite sensations (hunger, desire to
eat and fullness) and liking and wanting (explicit liking, implicit wanting and the

Page 154
frequency of food choice) were measured immediately before and after the constant-load
exercise test in weeks 0 and 4. Therefore, changes in fasting, acute exercise-induced and
medium term-induced exercise were calculated using the formulas below:
1) Fasting: difference between resting value, immediately before the constant-load
test, in weeks 4 and 0.
∆Fasting = Fasting 4 - Fasting 0
2) Acute-Ex: difference between end of acute exercise and resting value.
∆AcuteEx = End-Ex - Rest
3) Medium term-Ex: difference between Acute-Ex in week 4 and Acute-Ex in
week 0.
ΔMedium termEx= ∆Acute-Ex 4 - ∆Acute-Ex 0
6.3.4.2.2 Data management of food intake
All eight food-types were provided in separate bowls, and bowls were weighed
to the nearest 0.1g on a digital scale before and after eating. The fat, CHO and protein
values of each food were used based on the manufacturers’ nutritional information, to
calculate the total amounts of energy and macronutrient consumed.
6.3.5 Statistical analysis:
Data are presented as mean values and standard error of mean (SEM), unless
otherwise indicated. A mixed linear model univariate ANOVA was used to assess the
interaction between time (weeks 0 and 4) and intensity (MIIT and HIIT) on fasting and
∆Acute-Ex appetite sensations, liking and wanting and food intake during MIIT and
HIIT. Substrate oxidation (fat and CHO) and appetite sensations (hunger, desire to eat
and fullness) were inserted as a covariate in the analysis of the linear model univariate
ANOVA. The Microsoft Excel program (version 12.0, 2007, Microsoft Corporation,
Seattle, WA, USA) was used to compile the main results. Statistical analyses were
carried out with SPSS for Windows (version 18.0.1, 2010, PASW Statistics SPSS,
Chicago, IL, USA).
Post hoc power analysis was calculated using G*Power program (Version 3.1.3;
Franz Faul, University of Kiel, Germany, 2010). Repeated measures ANOVA within-
between interaction was computed by inserting partial eta squared of the interaction

Page 155
between intensity and time on eating behaviour variables, and computing the correlation
among repeated measures. Effect size, power and required sample size to attain power of
0.8 at an alpha level of 0.05 were calculated.

Page 156
6.4 Results
6.4.1 Food intake and nutrient preferences during test meal
The test meal was provided after the acute constant-load exercise test at weeks 0
and 4, such that the interaction between intensity and time will present the medium-term
effect of MIIT and HIIT induced by the acute constant-load exercise test (i.e. the
difference between week 4 and 0). There was no significant interaction between intensity
and time on food intake – the amount of food eaten (g), EI and macronutrient intake. The
interaction between intensity and time on fat intake was not statistically significant (p =
0.07); and the effect size (partial Eta squared) was 12.4%. Fat eaten (g) increased by
38% in MIIT and decreased by 16% in HIIT. The percentage contribution of
macronutrients to energy intake (%EI) did not change after HIIT, whereas energy intake
from fat increased by 11% after MIIT.
Figure 6-2 displays the medium-term changes in food intake (g) and EI (kcal) of
food eaten, the total amount of nutrient intake (g) and the energy of nutrient intake
expressed as percentage of total EI, which was induced by the acute constant-load
exercise test. Further, Table 6-1 shows the medium-term changes in energy and nutrient
intake. As the calculation of medium-term change in EI was computed using the
differences between acute constant-load exercise test in weeks 0 and 4, the values of
delta nutrient intake and delta substrate oxidation were multiplied by 12 (i.e. the total
number of training sessions) to calculate the accumulated changes in exercise-induced
fat balance (fat intake and fat oxidation) (Table 6-2). Moreover, the individual changes
in total amount of food and fat eaten (g) and EI of meal (kcal) are displayed in Appendix
A, Figure 8-1.
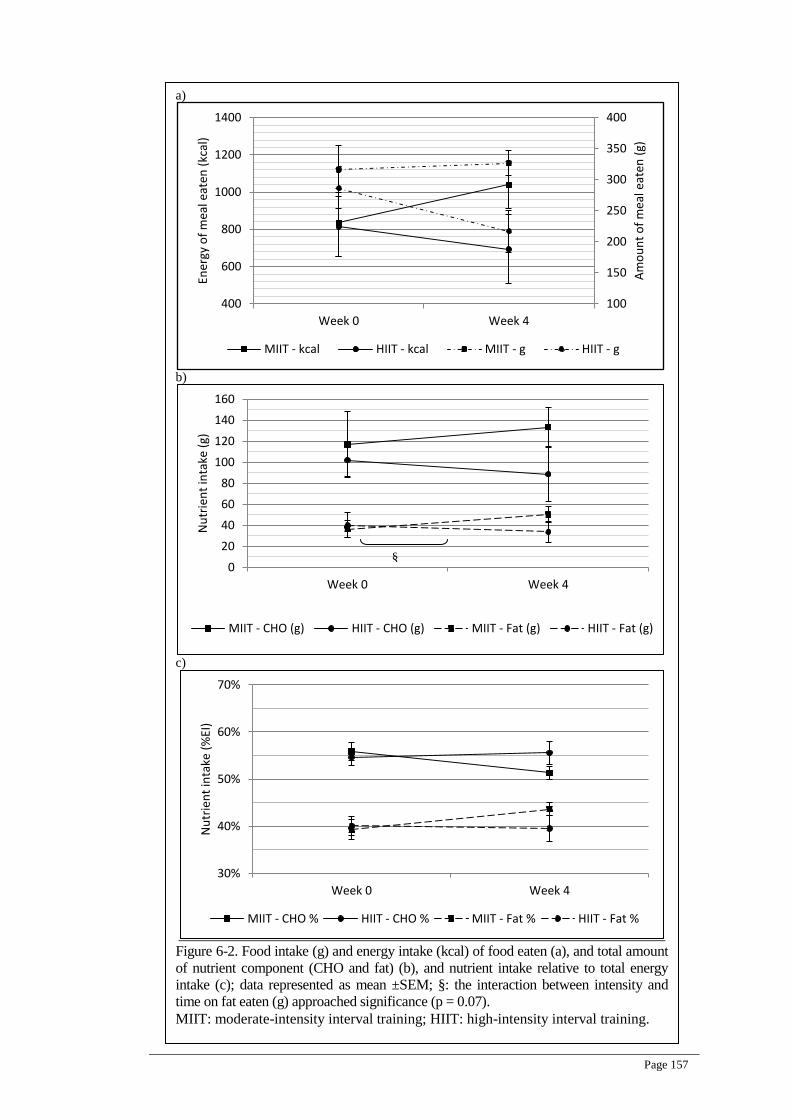
Page 157
a)
b)
c)
Figure 6-2. Food intake (g) and energy intake (kcal) of food eaten (a), and total amount
of nutrient component (CHO and fat) (b), and nutrient intake relative to total energy
intake (c); data represented as mean ±SEM; §: the interaction between intensity and
time on fat eaten (g) approached significance (p = 0.07).
MIIT: moderate-intensity interval training; HIIT: high-intensity interval training.
100
150
200
250
300
350
400
400
600
800
1000
1200
1400
Week 0 Week 4
Am
ou
nt
of
mea
l eat
en (
g)
Ener
gy o
f m
eal e
aten
(kc
al)
MIIT - kcal HIIT - kcal MIIT - g HIIT - g
0
20
40
60
80
100
120
140
160
Week 0 Week 4
Nu
trie
nt
inta
ke (
g)
MIIT - CHO (g) HIIT - CHO (g) MIIT - Fat (g) HIIT - Fat (g)
30%
40%
50%
60%
70%
Week 0 Week 4
Nu
trie
nt
inta
ke (
%EI
)
MIIT - CHO % HIIT - CHO % MIIT - Fat % HIIT - Fat %
§

Page 158
Table 6-1. Test meal energy and macronutrient intake for MIIT and HIIT. Data expressed as
mean ±SEM, absolute and percentage differences.
Variables
MIIT HIIT
week 0 week 4 Change
(%) week 0 week 4
Change
(%)
Total food eaten (g) 316
±37
326
±20
+10
(3)
286
±32
216
±33
-70
(-24)
Total fat eaten (g) 36
±8
50
±7
+14
(38)
40
±11
33
±10
-7
(-16)
Total CHO eaten (g) 116
±31
133
±18
+17
(14)
102
±15
88
±25
-14
(-13)
Total protein eaten
(g)
11
±2
14
±2
+3
(27)
12
±3
10
±3
-2
(-20)
Total energy intake
(kcal)
834
±183
1038
±127
+204
(24)
814
±162
693
±187
-121
(-15)
Fat intake relative to
total energy intake
(%EI)
39
±4
44
±3
+5
(11)
40
±4
39
±5
-1
(-3)
CHO intake relative
to total energy intake
(%EI)
56
±5
51
±3
-5
(-8)
55
±4
56
±6
+1
(2)
Protein intake
relative to total
energy intake (%EI)
5
±1
5
±1
0
(0)
5
±1
5
±1
0
(0)
MIIT: moderate-intensity interval training; HIIT: high-intensity interval training; CHO:
carbohydrate.
Note: There were no significant differences between weeks 0 and 4 or between MIIT and
HIIT
Table 6-2. The calculated accumulative change of 12-training sessions in nutrient intake and
substrate oxidation, based on data from the test meal and substrate oxidation during the
constant-load exercise test at weeks 0 and 4.
MIIT: moderate-intensity interval training; HIIT: high-intensity interval training; CHO:
carbohydrate; EI: energy intake
Calculated accummulative12-training
sessions MIIT HIIT
Food eaten (g) +112 -840
Fat eaten (g) +166 -75
CHO eaten (g) +159 -160
EI (kcal) +2445 -1458
Fat oxidation (g) +22 +9
CHO oxidation (g) -81 -49

Page 159
6.4.2 Appetite sensations, and interaction with food intake
Appetite sensations were assessed before and after the acute constant-load
exercise test at weeks 0 and 4. Therefore, an interaction between intensity and time
would reflect the medium-term effect of MIIT and HIIT on fasting appetite (i.e. ∆Fasting
= Fasting 4 - Fasting 0), and the medium-term effect induced by the acute constant-load
exercise test (i.e. ΔMedium term-Ex= ∆Acute-Ex 4 - ∆Acute-Ex 0).
6.4.2.1 Fasting appetite sensations (∆Fasting)
The effect of time approached statistical significance for ∆Fasting hunger and
desire to eat (p = 0.058 and 0.051 respectively), but there was no significant interaction
between intensity and time on ∆Fasting appetite sensations. Figure 6-3 shows delta
fasting appetite sensations for MIIT and HIIT.
Figure 6-3 Delta fasting appetite sensations (week 4-0) for MIIT and HIIT; data represented as
mean ±SEM.
MIIT: moderate-intensity interval training; HIIT: high-intensity interval training; Δ: resting
values at week 4 – resting values at week 0.
6.4.2.2 Medium-term responses of appetite sensations induced by the acute constant-
loadexercisetest(ΔMediumterm-Ex)
There were no significant effects of time on ΔMedium term-Ex appetite
sensations. The interaction between intensity and time on ΔMedium term-Ex approached
significance for desire to eat (p = 0.07). Figure 6-4 shows ΔMedium term-Ex appetite
sensations for MIIT and HIIT.
-30
-20
-10
0
10
20
30
Hunger Fullness Desire to eat
Δ f
asti
ng
app
etit
e se
nst
ion
s (m
m)
MIIT HIIT

Page 160
Figure 6-4. ΔMedium term-Ex appetite sensations in MIIT and HIIT; data represented as mean
±SEM.
§: the interaction between intensity and time on desire to eat approached significance (p = 0.07).
MIIT: moderate-intensity interval training; HIIT: high-intensity interval training;
ΔMedium term-Ex = ∆Acute-Exe 4 - ∆Acute-Exe 0.
6.4.2.3 The role of appetite sensations on food intake
Appetite sensations measured immediately before the meal time, at the end of
60-min recovery period during the constant-load test, could not explain any medium-
term changes in food intake. The interaction between time and fullness, independent of
intensity, on the amount of food intake was statistically significant (P ≤ 0.01). Figure 6-5
shows the test meal energy intake, and fullness or hunger at the 60-min recovery period.
-30
-20
-10
0
10
20
30
Hunger Fullness Desire to eat
Δ m
ediu
m t
erm
-Ex
app
etit
e se
nst
ion
s (m
m)
MIIT HIIT
§

Page 161
a)
b)
Figure 6-5. Hunger (a) and fullness (b) at meal time (60-min recovery) and total amount of
food eaten at weeks 0 and 4 in MIIT and HIIT; data represented as mean ±SEM.
The interaction between fullness and time on food intake was significant (p ≤ 0.01).
MIIT: moderate-intensity interval training; HIIT: high-intensity interval training.
100
150
200
250
300
350
400
450
30
40
50
60
70
80
90
Week 0 Week 4
Am
ou
nt
of
mea
l eat
en (
g)
Hu
nge
r (m
m)
MIIT - Hunger HIIT - Hunger MIIT - g HIIT - g
100
150
200
250
300
350
400
450
0
10
20
30
40
50
Week 0 Week 4
Am
ou
nt
of
mea
l eat
en (
g)
Fulln
ess
(mm
)
MIIT - fullness HIIT - fullness MIIT - g HIIT - g

Page 162
6.4.3 Liking and wanting
Liking and wanting were assessed before and after the acute constant-load
exercise test at weeks 0 and 4, such that the interaction between intensity and time would
represent the medium-term effect of MIIT and HIIT in fasting (i.e. ∆Fasting = Fasting 4 -
Fasting 0) and the medium-term effect induced by the acute constant-load exercise test
(i.e. ΔMedium term-Ex= ∆Acute-Ex 4 - ∆Acute-Ex 0).
6.4.3.1 Fasting liking and wanting (∆Fasting)
The interaction between intensity and time on ΔFasting explicit liking was not
significant, but the interaction between intensity and time on ΔFasting explicit liking for
HFSW food approached significance (p = 0.09). ΔFasting explicit liking for HFSW food
increased after MIIT and decreased after HIIT. The interaction between intensity and
time on ΔFasting implicit wanting was not significant. The effects of time on fasting
implicit wanting were significant for HFNS, LFNS, LF and NS foods (p ≤ 0.05), and
approached significance for LFSW, HF and SW foods (p = 0.06, 0.07 and 0.053
respectively). The interaction between intensity and time on ΔFasting frequency of food
preferences was not significant. Figure 6-6 shows ΔFasting explicit liking, implicit
wanting and frequency of food preferences in MIIT and HIIT.
6.4.3.2 Medium-term responses of explicit liking, implicit wanting and frequency of
food preferences(ΔMediumterm-Ex)
The interaction between intensity and time on ΔMedium term-Ex explicit liking
for HFNS food approached significance of (p = 0.09), whereas the interaction between
intensity and time on ΔMedium term-Ex implicit wanting and ΔMedium term-Ex
frequency of food preferences were not significant in all food categories. Delta value of
ΔMedium term-Ex of explicit liking, implicit wanting and frequency of food preferences
are presented in Figure 6-7. Further data on the values of Acute-Ex of explicit liking,
implicit wanting and frequency of food preferences are presented in Appendix A,
Figures 8-2, 8-3 and 8-4.
Page 163
a)
b)
c)
Figure 6-6. Delta fasting liking (a), wanting (b), and frequency of food preferences (c) in
MIIT and HIIT; data represented as mean ±SEM; MIIT: moderate-intensity interval training;
HIIT: high-intensity interval training; Δ: resting values at week 4 – resting values at week 0.
§: the interaction between intensity and time on HFSW (P= 0.09).
-20
-15
-10
-5
0
5
10
15
20
25
HFNS HFSW LFNS LFSW
Δ F
asti
ng
likin
g (m
m)
MIIT HIIT
§
-800
-600
-400
-200
0
200
400
HFNS HFSW LFNS LFSW
Δ F
asti
ng
wan
tin
g (m
sec)
MIIT HIIT
-15
-10
-5
0
5
10
15
HFNS HFSW LFNS LFSW
Δ F
asti
ng
pre
fere
nce
(fr
eq)
MIIT HIIT

Page 164
a)
b)
c)
Figure 6-7. ΔMedium term-Ex for explicit liking (a), implicit wanting (b) and frequency of
food preferences (c) in MIIT and HIIT; data represented as mean ±SEM; MIIT: moderate-
intensity interval training; HIIT: high-intensity interval training; ΔMedium term-Ex:
difference between Acute-Exe in week 4 and Acute-Exe in week 0; §: the interaction
between intensity and time on HFNS (P= 0.09).
-20
-15
-10
-5
0
5
10
15
20
25
HFNS HFSW LFNS LFSW
Δ M
ediu
m t
erm
-Ex
likin
g (m
m)
MIIT HIIT
§
-400
-200
0
200
400
600
HFNS HFSW LFNS LFSW
Δ M
ediu
m t
erm
-Ex
wan
tin
g (m
sec)
MIIT HIIT
-15
-10
-5
0
5
10
15
HFNS HFSW LFNS LFSW
Δ M
ediu
m t
erm
-Ex
pre
fere
nce
(fr
eq)
MIIT HIIT

Page 165
6.4.4 Interaction between fat intake and substrate oxidation
Figures 6-8, 6-9 and 6-10 show the interaction between intensity and time on fat
intake (g) and substrate oxidation (g/min) during rest, exercise and recovery respectively.
These Figures show that there were no interactions between changes in substrate
oxidation and changes in fat eaten. In line with this, statistical analysis revealed that there
was an interaction between time and resting CHO oxidation on fat intake (P=0.008),
which means resting CHO oxidation increased after the intervention independent of
intensity. There was also an interaction between intensity and exercise-induced CHO
oxidation (P=0.009), which means exercise-induced CHO oxidation was higher in MIIT
at weeks 0 and 4, independent of time. In addition, there was an interaction between time
and resting fat oxidation (P=0.04), which means fat oxidation increased after the
intervention, independent of intensity.

Page 166
a)
b)
Figure 6-8. The interaction between the intervention and resting CHO (a) and fat (b)
oxidation (g/min) on fat intake (g); data represented as mean ±SEM;
MIIT: moderate-intensity interval training; HIIT: high-intensity interval training.
0
10
20
30
40
50
60
0.00
0.05
0.10
0.15
0.20
0.25
0.30
0.35
0.40
Week 0 Week 4
Fat
eate
n (
g)
Res
tin
g C
HO
oxi
dat
ion
(g/
min
)
MIIT - rest CHO oxid HIIT - rest CHO oxid
MIIT - Fat (g) HIIT - Fat (g)
0
10
20
30
40
50
60
-0.10
-0.05
0.00
0.05
0.10
0.15
0.20
0.25
Week 0 Week 4
Fat
eate
n (
g)
Res
tin
g fa
t o
xid
atio
n (
g/m
in)
MIIT - rest FAT oxid HIIT - rest FAT oxid
MIIT - Fat (g) HIIT - Fat (g)

Page 167
a)
b)
Figure 6-9. The interaction between the intervention and exercise-induced CHO (a) and fat
(b) oxidation (g/min) on fat intake (g); data represented as mean ±SEM.
MIIT: moderate-intensity interval training; HIIT: high-intensity interval training.
0
10
20
30
40
50
60
0.70
0.90
1.10
1.30
1.50
1.70
1.90
2.10
2.30
2.50
Week 0 Week 4
Fat
eate
n (
g)
Ave
exe
rcis
e C
HO
oxi
dat
ion
(g/
min
)
MIIT - Exe CHO oxid HIIT - Exe CHO oxid
MIIT - Fat (g) HIIT - Fat (g)
0
10
20
30
40
50
60
-0.20
-0.15
-0.10
-0.05
0.00
0.05
0.10
0.15
0.20
0.25
0.30
0.35
0.40
Week 0 Week 4
Fat
eate
n (
g)
Ave
exe
rcis
e fa
t o
xid
atio
n (
g/m
in)
MIIT - Exe FAT oxid HIIT - Exe FAT oxid
MIIT - Fat (g) HIIT - Fat (g)

Page 168
a)
b)
Figure 6-10. The interaction between the intervention and recovery CHO (a) and fat (b)
oxidation (g/min) on fat intake (g); data represented as mean ±SEM.
MIIT: moderate-intensity interval training; HIIT: high-intensity interval training.
0
10
20
30
40
50
60
-0.20
-0.10
0.00
0.10
0.20
0.30
0.40
0.50
Week 0 Week 4
Fat
eate
n (
g)
Ave
rec
ove
ry C
HO
oxi
dat
ion
(g/
min
)
MIIT - Rec CHO oxid HIIT - Rec CHO oxid
MIIT - Fat (g) HIIT - Fat (g)
0
10
20
30
40
50
60
-0.10
-0.05
0.00
0.05
0.10
0.15
0.20
0.25
Week 0 Week 4
Fat
eate
n (
g)
Ave
rec
ove
ry f
at o
xid
atio
n (
g/m
in)
MIIT - Rec FAT oxid HIIT - Rec FAT oxid
MIIT - Fat (g) HIIT - Fat (g)

Page 169
As several eating behaviour variables approached significance of 0.07 and 0.09,
post hoc power analysis was done for these variables to identify required sample size to
attain power 0.8 at an alpha level of 0.05 as shown in Table 6-3.
Table 6-3. Post hoc analysis for eating behaviour variables.
Variables Partial eta
squared
Effect size
f
Correlation
among
repeated
measures
Power for
the current
sample size
( n = 10)
Required
sample size
to attain
power of
0.80
Medium-term exercise-
induced food intake 0.08 0.29 0.50 0.56 16
Medium-term exercise-
induced fat intake 0.12 0.36 0.55 0.72 12
Medium term-Ex explicit
liking for HFNS 0.11 0.35 0.22 0.46 20
Fasting explicit liking for
HFSW 0.10 0.33 0.64 0.66 14
Fasting desire to eat 0.11 0.35 0.53 0.70 12

Page 170
6.5 Discussion
6.5.1 The main finding
The main finding of the current study was that there was more of a trend towards
a compensatory response in eating after MIIT than after HIIT. This was reflected in
desire to eat, fasting explicit liking for HFNS food, explicit liking for HFSW food, and
fat intake after the medium term training.
6.5.2 Appetite sensation
HIIT suppressed Medium term-Ex hunger and desire to eat which approached
significance, however, did not affect fullness. The outcomes were in agreement with
previous studies that suggested transitory suppression of hunger in response to acute
high-intensity exercise known as ‘exercise-induced anorexia’ (King & Blundell, 1995;
King et al., 1994; King et al., 1997a; Kissileff et al., 1990). However, the current study
was not in agreement with other acute-exercise studies that found a similar suppression
of hunger after high- and low-intensity exercise greater than rest treatment in men (Ueda
et al., 2009a) or no effect of different intensities of exercise on hunger in women
(Pomerleau et al., 2004). It should be noted that the present medium-term intervention
had the same trends of appetite sensations to the trends during the acute intervention
(refer to section 4.4.3.1), with greater suppression of Medium term-Ex hunger and desire
to eat after HIIT.
Several studies did not find any notable effects of moderate-intensity short- and
medium-term training on appetite sensations (Martins et al., 2008a; Stubbs et al., 2002a;
Stubbs et al., 2002b; Whybrow et al., 2008). Although some reported an effect of 6-week
moderate-intensity training sessions on appetite sensations, these studies involved either
diet regimes or were undertaken by restrained eaters (King et al., 2007b; Martins et al.,
2008b). Therefore, previous acute-exercise studies were in line with the suppression of
hunger after HIIT, and previous medium-term moderate-intensity studies suggested that
exercise training did not induce changes in appetite sensations. It can be concluded that
interval training did not increase Medium term-Ex appetite sensations, and the
suppression of Medium term-Ex hunger and desire to eat were found after HIIT.
In contrast with Medium term-Ex effects, interval training increased fasting
hunger and desire to eat, with HIIT having a higher impact. This was in agreement with
the study which found that fasting hunger and prospective food consumption increased
Page 171
after six weeks of training in adolescents (Thivel et al., 2011). In addition, King et al.
(2009) found that non-responders who did not attain the theoretical weight loss,
experienced increased fasting and average daily hunger. The increase in fasting hunger
and desire to eat were in agreement with previous medium-term studies.
6.5.3 Food intake and the role of appetite sensations
Medium-term food intake that was induced by an acute constant-load exercise
decreased by 70-g after HIIT, and increased by 10-g after MIIT; however the difference
between the two treatments was not statistically significant. This tendency of the
decrease in food intake after HIIT was not confirmed in some previous studies. For
example, Kissileff et al. (1990) found that meals consumed after strenuous exercise were
smaller than these after moderate-intensity exercise in non-obese (-104g) but not in
obese (- 49g) women. In contrast, another study found that food intake did not increase
after moderate-intensity exercise at 50W (+8g) and after high-intensity exercise at 100
W (+3g) compared with the rest condition in sedentary individuals (Erdmann et al.,
2007). Although some studies found that high-intensity training tended to decrease EI
greater than moderate-intensity training (Dickson-Parnell & Zeichner, 1985) and non-
exercise treatment (Thivel et al., 2011), it is unclear whether the reduction in energy
intake was due to a reduction in the amount of food eaten or a change in macronutrient
components.
The current data revealed that fasting and Medium term-Ex appetite sensations
did not contribute to the change in food intake. Only appetite sensations measured
immediately before consuming the meal correlated with food intake, but did not explain
the effect of exercise intensity on food intake. The current weak association between
hunger and food intake was in agreement with most previous studies. For example, it
was reported that exercise-induced hunger did not correlate with food intake after acute
high-intensity exercise (King et al., 1997a; Pomerleau et al., 2004) moderate-intensity
exercise (Tsofliou et al., 2003) and medium-term training (Whybrow et al., 2008).
Recently, Finlayson et al. (2009) did not find any interaction between exercise-induced
hunger and food intake in rest and after moderate-intensity exercise.
Medium-term fullness that was measured immediately before consuming the
meal, at the end of the 60-min recovery period after acute constant-load exercise,
explained the change in food intake between weeks 0 and 4 independent of training

Page 172
intensity (i.e. the interactions between fullness and time on food intake). It has been
suggested that fullness is a strong predictor of overall and relative daily EI (Drapeau et
al., 2005). Another study found that fullness but not hunger was a strong index of high-
fibre foods compared with low-fibre foods (Raben et al., 2003). In addition, some
theories such as the glucostatic theory of appetite (Chaput & Tremblay, 2009) suggested
the importance of satiety and fullness in controlling food intake, and the change in
satiety linked peripheral metabolic signalling with food intake (Hopkins et al., 2010).
Furthermore, it is important to discuss the effect of CHO availability on fullness and
food intake during HIIT as resting CHO oxidation increased after HIIT. It was reported
that the relationship between CHO availability and satiety is evident (Feinle et al., 2002).
6.5.4 Role of CHO oxidation on food intake after HIIT
As the participants increased medium-term acute constant-load exercise-induced
fat oxidation and decreased exercise-induced CHO oxidation after HIIT, the increase in
resting CHO oxidation after HIIT (see Figure 6-8a) could be attributed to the increase in
CHO availability during HIIT. This assumption was proposed based on two main
findings. The first finding is that CHO oxidation is sensitive to the change in muscle
glycogen content and CHO availability. For example, individuals may decrease CHO
oxidation and increase fat oxidation in order to preserve hepatic glycogen content
(Galgani & Ravussin, 2008). CHO overfeeding for four days resulted in higher CHO
oxidation than isocaloric feeding in humans (Minehira et al., 2003). Stubbs et al. (1993)
investigated the effect of negative CHO balance on day 1 on food intake on day 2.
Although this study did not confirm the effect of low glycogen content on food intake,
there was a decrease in CHO oxidation to conserve the low level of CHO availability.
Moreover, a positive CHO balance was reported in the day after a glycogen-lowering
exercise, which could be attributed to a surplus compensation of CHO intake to restore
muscle glycogen depletion (Veldhorst, Westerterp, Van Vught & Westerterp-Plantenga,
2010). These studies showed evidence that the increase in CHO oxidation occurs as a
response to the alterations in CHO availability. Therefore, although resting CHO
oxidation did not explain the change in food intake after HIIT, the increase in resting
CHO oxidation may reflect a positive CHO availability which can theoretically explain
the tendency of the decrease in food intake after HIIT.
The second finding which suggested an increase in CHO availability during HIIT
is that high-intensity aerobic training can contribute to increased muscle glycogen

Page 173
content. For example, six sessions of sprint interval training increased muscle glycogen
content by 50% in young healthy men (Burgomaster, Heigenhauser & Gibala, 2006).
Another study found that fat balance was lower and CHO balance was higher during
high-energy turnover (energy maintenance after 60-min exercise) than low-energy
turnover (energy maintenance with no prior exercise). This means that when the energy
expended is immediately replaced, CHO balance is more positive than if exercise was
not performed. However, the assumed increase in glycogen content which increased
resting CHO oxidation after HIIT did not statistically induce the decrease in food intake.
This could be attributed to the magnitude (intensity, duration and frequency) of HIIT to
manipulate the consumption of CHO which increases glycogen content. During the HIIT
session, the participants exercised at 90 %VO2peak for 20 min and rested for 20 min (30
sec exercise and 30 sec rest). This duration of exercise is not expected to deplete
glycogen storage (Flatt, 1987). In addition, the number of sessions (12 sessions) during
HIIT may not have manipulated the increase in the content of glycogen to a level that
can markedly reduce food intake. For example, although glycogenolysis reduced by 12%
during a 60-min cycling test after seven sessions of high-intensity interval training,
resting muscle glycogen content did not change as the number of sessions were small
(Talanian et al., 2007). Therefore, the alteration in CHO availability during HIIT was too
small to induce a statistical reduction in food intake.
6.5.5 Nutrient preferences after MIIT
Medium-term acute constant-load exercise-induced EI increased by 24% after
MIIT. This increase in EI after MIIT could be attributed to the change in nutrient
preferences as fat intake increased by 13.9 g (38%) whereas food intake increased only
by 3%. Therefore, while the small decrease in fat intake after HIIT could be attributed to
the decrease in food intake, it seems that fat intake after MIIT was not affected by food
intake. This implies that moderate-intensity interval training has a tendency to induce the
preference toward fat foods. In addition, these results suggested that nutrient selection
can play a greater role than food intake on EI. Therefore, the calculated accumulative
changes in EI in meals consumed after 12 exercise sessions was +2445 kcal in MIIT and
-1458 kcal in HIIT.
The ability of moderate-intensity training to influence nutrient preferences was
not confirmed in previous acute and medium-term studies. For example, a moderate-
intensity exercise bout for 1 hr compared with the rest condition did not alter
Page 174
macronutrient intake of a buffet meal consumed 1-hr after the exercise (Martins et al.,
2007). Several acute studies that involved brisk walking for 60 mins (King et al., 2010),
cycling at 60 %VO2max for 90 mins (Almeras et al., 1995) and cycling at 70 %VO2max
for 45 mins (Jokisch, Coletta & Raynor, 2011) did not find changes in exercise-induced
nutrient preferences. Likewise, two long-term moderate-intensity training interventions,
one intermittent (Snyder et al., 1997) and one continuous (Donnelly et al., 2003), did not
find significant alterations in the preferences for fat and CHO intake. Therefore, few
available studies of acute moderate-intensity exercise within a 60-min period and long-
term moderate-intensity training did not confirm the potential of moderate-intensity
exercise to alter nutrient selection.
6.5.6 Liking and wanting, and the preferences of high-fat food after MIIT
Fasting explicit liking showed that the preference of HFSW food increased after
MIIT and decreased after HIIT. Likewise, the preference for Medium term-Ex HFNS
food decreased after HIIT (≤ -10 mm), and increased after MIIT (≥ +5 mm). In addition,
the preference for Medium term-Ex HFSW food increased after MIIT (≥ +10 mm).
These results of fasting and Medium term-Ex explicit liking for energy-dense food can
be used as a predicted marker of weight loss. For example, Finlayson et al. (2011) found
that individuals who did not lose the expected weight after exercise (i.e. non-responders)
experienced an increase in exercise-induced explicit liking for HFSW food (+10 mm).
Responders reported a decrease in exercise-induced explicit liking for HFSW stimuli at
the baseline in week 0 (-10 mm). In week 12, the researchers found that non-responders
experienced an increase in exercise-induced explicit liking in all food categories (≥10
mm), and responders’ explicit liking did not increase at week 12. Therefore, the increase
in Medium term-Ex explicit liking for HFSW food after MIIT was in agreement with the
increase in medium-term exercise-induced explicit liking for HFSW food in non-
responders. It could be stated that the increase in fasting and Medium term-Ex explicit
liking for energy-dense food after MIIT is a marker of a compensatory response to an
exercise-induced program.
The intervention did not affect fasting and Medium term-Ex frequency of food
selection. There were different directional effects to increase the HFNS and decrease the
HFSW food category in HIIT, but these trends were very small (within ±5 freq).
Finlayson et al. (2011) found that the relative preferences for food in responders and
non-responders to an exercise-induced weight loss program did not change in response

Page 175
to exercise sessions at the baseline and at the end of an exercise intervention (within
range of ±4 freq). An exception in that study was that responders showed negative and
non-responders showed positive responses to HFSW stimuli at the baseline (≥ 5 and ≤ 5
freq). The current interval training did not change the pattern of frequency of food
selection. In addition, the small changes in frequency of food selection were in
agreement with the acute MIIT and HIIT (refer to section 4.4.3.2.3).
In conclusion, the increase in the explicit liking of fat stimuli after MIIT in
combination with the increase in fat intake after MIIT confirmed the trend of increasing
fat preferences after MIIT.
6.5.7 Role of fat oxidation on fat preference after MIIT
It is not expected that the increase in fat oxidation after MIIT induced the
consumption of fat food. Fat does not have the same mechanisms of CHO (Joosen &
Westerterp, 2006) and protein (Griffioen-Roose et al., 2012) to increase food intake and
compensate nutrient deficit. Fat reserves are very large in the human body (Flatt, 1995;
Galgani & Ravussin, 2008). In an acute study, there was a relationship between CHO
intake and 6-hr postprandial CHO oxidation, whereas no relationship was found between
fat oxidation and fat intake (Burton, Malkova, Caslake & Gill, 2010). Furthermore, the
increase in fat oxidation after MIIT is a marker which reflects the stability in body
weight in the long-term. It was reported that the low rate of fat oxidation can lead to the
increase in body weight due to the susceptibility to store excess energy as fat (fat
balance) (Zurlo et al., 1990) and to have a greater tendency to deplete glycogen (CHO
balance) (Flatt, 1987; Pannacciulli et al., 2007). Therefore, the increase in fat oxidation
after MIIT did not induce the preference for fat intake.
It is important to consider that the change in substrate oxidation was small. The
participants predominantly relied on CHO (70-75 %EE) during the acute constant-load
exercise test at weeks 0 and 4 of MIIT and HIIT, such that the change in the medium-
term exercise-induced fat oxidation in MIIT was 12 kcal greater than in HIIT, and the
change in the medium-term exercise-induced CHO oxidation in MIIT was 12 kcal lower
than in HIIT. This small change in substrate oxidation after the intervention was similar
to a previous study in the obese. For example, fat oxidation was 0.11 g/min and CHO
oxidation was 0.08 g/min at the baseline, and after six sprint interval sessions fat
oxidation was 0.13 and 0.12 g/min and CHO oxidation was 0.03 and 0.05 g/min at 24-hr

Page 176
and 72-hr after the intervention in obese men (Whyte et al., 2010). It was reported that
sedentary obese individuals have an impaired ability to oxidise fat in skeletal muscles
(Corpeleijn et al., 2009), therefore they rely predominantly on CHO particularly when
the demand on energy increases (Hopkins et al., 2010). Therefore, substrate oxidation
might not explain the increase in fat eaten after MIIT.
The increase in fat eaten after MIIT could be driven by psychological rather than
physiological factors. The assumption of the role of psychological factors during low-
intensity exercise is based on the findings that peripheral factors can affect human
perception at high-intensity levels, whereas psychological factors such as cerebral
activity and cognitive processes affect the perception during low-intensity exercise
(Lambert et al., 2005; Pires et al., 2011; St Clair Gibson et al., 2003). Psychological
factors may explain the increase in fat intake after MIIT, but this was not tested.
6.5.8 Summary
The tendencies of eating behaviour including Medium term-Ex hunger and
desire to eat, fasting and Medium term-Ex explicit liking for energy-dense food,
medium-term constant-load exercise-induced food and fat intake collectively suggested
that HIIT is a better strategy than MIIT to minimise the compensation of eating
behaviour during interval training. Moreover, while fullness at meal time correlated with
food intake but could not distinguish the effect of exercise intensity on food intake, the
change in resting CHO oxidation theoretically but not statistically explained the decrease
in food intake after HIIT. In contrast, changes in resting and exercise-induced, recovery-
induced substrate oxidation did not statistically or theoretically explain the increase in fat
intake after MIIT. Alternatively, the preference toward fat food after MIIT may be
attributed to other factors such as psychological mediators.

Page 177
7 Conclusions
7.1 Summary
Moderate-intensity training has been advocated for its potential to increase whole
body fat oxidation. High-intensity interval training may also increase exercise-induced
fat oxidation, skeletal muscle fuel content and fatty acid transport proteins (Talanian et
al., 2007). Understanding which intensity has a greater effect on increasing fat oxidation
is important to prescribe appropriate exercise intensities for long-term weight
management. Understanding behavioural responses of obese individuals during high-
intensity interval training is also important, as they may increase their food intake or
develop preferences for energy-dense food because of increased food reward. It has been
reported that while some individuals increase energy expenditure through structured
aerobic training, they encounter various obstacles in changing their eating behaviour to
reduce energy intake, and some of them increase energy intake (King et al., 2008). The
objectives of this thesis were to investigate the influence of moderate- and high-intensity
interval training (MIIT and HIIT) on fat oxidation and eating behaviour in
overweight/obese men. The studies in this thesis involved two training interventions
designed to examine the acute and medium-term effects of moderate- and high-intensity
interval training on fat oxidation and eating behaviour.
The acute-bout experiment compared MFO from GXT with fat oxidation during
MIIT, and compared the influence of MIIT and HIIT on appetite and nutrient
preferences. Nutrient preferences were measured using the liking and wanting test
(Finlayson et al., 2007a). Results suggested that MFO can be used to estimate the
average rate of fat oxidation during 30-min MIIT even though fat oxidation increased
with time demonstrating significant difference at minute 25 of the MIIT session. Results
also revealed that subjective sensations of hunger were higher after MIIT than HIIT, but
the difference was not significant. This trend was in agreement with the finding that
high-intensity exercise can suppress hunger (King et al., 1994). Explicit liking increased
and implicit wanting decreased after both treatments reflecting a similar reported effect
of moderate-intensity continuous exercise (Finlayson et al., 2009), but the difference
between treatments did not reach significance.
Page 178
The first objective of the medium-term intervention was to compare the effect of
4-week MIIT and HIIT on fat oxidation. The assessments in medium-term training
involved a GXT and a constant-load exercise test. The rate of fat oxidation during the
constant-load test and MFO during a GXT significantly increased after MIIT and HIIT,
independent of exercise intensity. In contrast with the view that moderate-intensity
training is more favourable for obese individuals to increase fat oxidation, the current
finding was in agreement with studies which found that high-intensity interval training is
effective in increasing fat oxidation in moderately trained non-obese individuals
(Talanian et al., 2007). There was a trend for a greater increase in constant-load exercise-
induced fat oxidation after MIIT and a trend of a greater increase in MFO after HIIT.
This could be attributed to the specificity between MIIT and constant-load exercise test
and between HIIT and GXT, but this effect was not significant.
The second objective of the medium-term intervention was to examine the
influences of 4-week MIIT and HIIT on eating behaviour including appetite sensations,
liking and wanting, food intake and nutrient preferences. The assessment of eating
behaviour components were conducted during the constant-load exercise that was
followed by the test meal, and data included fasting and exercise-induced responses.
Results revealed that constant-load exercise-induced hunger and desire to eat decreased
after medium-term HIIT. The decrease in hunger after HIIT was in agreement with
studies that found a suppression of hunger after acute exercise sessions (King et al.,
1997a). The decrease in desire to eat after HIIT compared with MIIT approached
significance. Post hoc power analysis suggested that increasing sample size by two
participants would have a power of 0.8 at an alpha level of 0.05. This emphasised the
importance of using larger sample sizes in future studies.
Medium-term change in acute constant-load exercise-induced food intake
slightly decreased after HIIT whereas it did not change after MIIT. This trend of
decreasing food intake after high-intensity exercise was previously found in a few acute
studies (King et al., 1994; Kissileff et al., 1990). A possible explanation of changes in
food intake is the effect of appetite sensations. The current study revealed that changes in
hunger and desire to eat correlated to the change in food intake, but only fullness at meal
time contributed to the effect of time on food intake independent of exercise intensity
(i.e. the interaction between fullness and time - the difference in fullness between week 4

Page 179
and 0). It should be noted that the change in food intake was small, so that the interaction
between fullness and intensity was not significant.
Medium-term change in acute constant-load exercise-induced fat intake
increased after MIIT, and differences between MIIT and HIIT approached significance.
Several physiological and psychological factors have been suggested to explain changes
in nutrient preference, including the role of substrate oxidation. Changes in substrate
oxidation after MIIT, however, did not contribute to the changes in fat intake. The
increase in fat intake after MIIT was also associated with the increase in fasting explicit
liking for HFSW food and medium-term exercise-induced explicit liking for HFSW
food. It has been reported that individuals who did not respond to an exercise-induced
weight loss program increased explicit liking of HFSW food (Finlayson et al., 2011).
In summary, this thesis investigated the role of two intensities of interval training
on fat oxidation and eating behaviour. The acute experiment showed that MFO from
GXT was valid to predict the average of 30-min MIIT even though fat oxidation
significantly increased during MIIT. In addition, there was a trend for hunger to decrease
after HIIT, but the difference between MIIT and HIIT did not reach significance. The
medium-term experiment revealed that exercise-induced fat oxidation increased after the
intervention, independent of exercise intensity. In addition, there was a suppression of
hunger and desire to eat, a decrease in explicit liking of high fat foods and a decrease in
food intake after HIIT. In contrast, there was an increase in explicit liking of high fat
food and an increase in fat intake after MIIT.
7.2 Implications, limitations and future studies
The results of the first study suggested that fat oxidation during MIIT is not
compromised by exercise intensity. Therefore, given the potential for interval training to
improve compliance to exercise, the real world implication is that MIIT may be a useful
training strategy when the goal is to increase fat oxidation for obese individuals who
experience continuous exercise to be difficult. Moreover, 12 sessions of MIIT and HIIT
exercise performed in four weeks resulted in statistically significant improvements in
exercise-induced fat oxidation, with improvements being independent of exercise
intensity. BLa and RPE decreased during the constant-load test and training sessions of
HIIT to a greater extent than MIIT. Therefore, the real world implication of this study is
that high-intensity interval training could be more appropriate for healthy obese men

Page 180
during training-induced fat oxidation. Lastly, exercise-induced changes in eating
behaviour, including medium term changes in hunger and desire to eat, explicit liking
for energy-dense food, food and fat intake, suggested that HIIT is a better strategy than
MIIT to moderate compensatory responses during interval training. Monitoring diet is
also recommended during MIIT as the preferences for energy-dense food can reduce the
benefit of exercise training.
A limitation of this thesis was that the comparison was made between MFO
during a GXT and the rate of fat oxidation during the moderate-intensity interval
exercise bout. The assumption is that fat oxidation increases during moderate-intensity
continuous exercise bouts, based on findings of previous studies (Cheneviere et al.,
2009a; Meyer et al., 2007). A recent study did not find an increase in fat oxidation
during a 30-min constant-load exercise bout among obese adolescents (Crisp et al.,
2012). Including a moderate-intensity continuous exercise bout in the acute experiment
in the current thesis would have provided more robust data of whether fat oxidation
increases during 30-min moderate-intensity constant-load exercise in obese adults.
Further, the current acute MIIT is an alternated workload bout, with no rest intervals
involved. Examination of the response of fat oxidation during moderate-intensity
interval exercise that includes rest intervals in the obese population would be useful.
In the medium-term experiment, two methodological points should be
considered. Firstly, participants started HIIT at levels of fat oxidation that were higher
than with MIIT. This could be attributed to day-to-day variations of fat oxidation. The
effect of day-to-day variations on the changes in fat oxidation after training was not
examined. This could be overcome by assessing the variations and reproducibility in
daily fasting fat oxidation and how aerobic training affects it. Secondly, the intensity of
the constant-load test was set at 45% of pre-training VO2peak, and results expectedly
showed that VO2peak increased by 7% after HIIT and increased by 2.8% after MIIT.
Future studies could examine the responses of fat oxidation during two separate acute
constant-load exercise bouts that are set at a relative intensity of pre-training VO2peak
and post-training VO2peak. This will also examine the effect of change in VO2max on
the rate of fat oxidation during a constant-load exercise test.
The improvement in VO2max is correlated with time spent at maximal aerobic
levels, which is correlated with the length of interval training (Astrand et al., 2003;
Wakefield & Glaister, 2009). Investigating the tolerance of obese individuals to train for

Page 181
1- or 2-min intervals is recommended. It can also be speculated that including interval
training in other types of training interventions such as circuit training could be effective.
For example, a recent study found that adding strength training to interval training can
maximise the beneficial effects of exercise in improving vascular reactivity and
cardiopulmonary parameters in chronic heart failure patients (Anagnostakou et al.,
2011).
In the measurement of eating behaviour during the constant-load exercise test,
participants were instructed to refrain from eating and drinking for 5 hrs before the test
that started at 1:00 pm. It is typical to instruct participants to arrive at the laboratory at
8:00 am to be provided with a standard breakfast so that meal to exercise interval and
breakfast intake are standardised. However, the participants were already involved in a
high level of commitment. This extra load would have been burdensome. Participants
were also asked to record food intake 24-hr pre-test, and to replicate the same food
consumed before subsequent follow-up tests. The validity of self-reported food intake is
a challenge in nutrition research, and a more robust procedure is needed.
While the acute experiment revealed that the manipulation of moderate and high-
intensity interval training did not affect appetite and liking and wanting, the difference
between medium-term training of MIIT and HIIT on the effect on desire to eat and
explicit liking for energy-dense food approached significance. Whether this effect would
also be found over a long-term period is unclear. A recent review suggested that exercise
can regulate eating behaviour through cognitive and neurobiological signalling in the
long-term, such that physical activity is hypothesised to alter the brain's neurobiological
substrates to consequently modify eating behaviour and achieve weight loss (Joseph et
al., 2011). The improvement in physical fitness in the long-term intervention may also
affect reward system. For example, cognitive factors, such as belief that improving
physical fitness reduces the need for high-fat food and selecting healthy food is required
to gain health, could influence reward system (Werle et al., 2011). Future studies should
examine the effects of long-term moderate- and high-intensity interval training
interventions on eating behaviour.
It has been suggested that high-intensity interval training has a greater effect on
fat loss compared with steady-state moderate-intensity exercise (Boutcher, 2011). This
review suggested that the effect of high-intensity interval exercise on fat oxidation and
appetite suppression could explain the reduction in fat mass. The work of this thesis

Page 182
demonstrated that moderate- and high-intensity interval trainings have the same effects
on exercise-induced fat oxidation, but high-intensity interval exercise had a favourable
effect on appetite sensations and nutrient preferences. The proportional contribution of
the rate of exercise-induced fat oxidation and the compensation of eating behaviour on
weight loss is uncertain. It was suggested that change in resting substrate oxidation
contributed 7% of the change in weight loss, exercise-induced energy expenditure
contributed 36% of the changes in weight loss and the remaining was attributed to
undetermined factors (Church et al., 2009). Whether changes in exercise-induced fat
oxidation and eating behaviour can explain the change in fat mass during weight loss-
induced intervention has to be examined.

Page 183
8 Appendices
8.1 Appendix A: The influence of MIIT and HIIT on eating behaviour
With the same categories of liking and wanting, a selected ad libitum meal was
provided after the constant-load test at weeks 0 and 4 in MIIT and HIIT. The nutrient
composition of the test meal is displayed in Table 8-1. Individual variations in the
influence of MIIT and HIIT on food and fat intake and EI are displayed in Figure 8-1.
Delta values of medium-term training (ΔMedium term-Ex) of explicit liking,
implicit wanting and frequency of food choice were displayed in Chapter 6 (section
6.6.3.2). ΔMedium term-Ex was calculated through the difference between Acute-Ex in
weeks 4 and 0. Delta values of acute exercise (ΔAcute-Ex) was calculated as the
difference between end of acute exercise and resting value, which are displayed in
Figure 8-2, 8-3 and 8-4 for explicit liking, implicit wanting and frequency of food choice
respectively.
Individual correlations between delta (difference between weeks 0 and 4) fat
intake and substrate oxidation (fat and CHO oxidation) during rest, exercise and
recovery after MIIT and HIIT are displayed in Figure 8-5 and 8-6.

Page 184
Table 8-1. Nutrient composition of test meal provided at the end of constant-load test at
weeks 0 and 4 of MIIT and HIIT.
LFNS: low-fat non-sweet; LFSW: low-fat sweet; HFNS: high-fat non-sweet; HFSW: high-
fat sweet; CHO: carbohydrate; g: gram; kcal: kilocalorie.
Category Food Brand Nutrient content (g/100 g)
Percentage energy
content (%kcal)
Fat CHO Protein Fat CHO Protein
LFNS
Carrot Lady 0.1 8.2 0.6 3 91 6
Rice
crackers Damora 2.9 83.8 8.0 7 86 8
LFSW
Fruit
sweets Dominion 0.1 83.8 8.0 0 99 1
Apple Red skin 0.2 11.0 0.3 4 94 2
HFNS
Butter
twists
Specially selected
29.5 49.6 11.1 53 39 8
Chips Smith’s 31.9 46 8.4 57 37 6
HFSW
Shortbread Belmont 25.3 65.1 5.6 26 68 7
Milk
chocolate
bar
Choceux 33.7 51.9 7.7 56 38 5

Page 185
Figure 8-1. The individual data of amount of food and fat intake in grams and total energy intake
of test meal at weeks 0 and 4 in MIIT and HIIT.
MIIT: moderate-intensity interval training; HIIT: high-intensity interval training.
0
100
200
300
400
500
MIIT - 0 MIIT - 4
Foo
d e
aten
(g)
0
100
200
300
400
500
HIIT - 0 HIIT - 4
Foo
d e
aten
(g)
0
20
40
60
80
100
120
140
160
MIIT - 0 MIIT - 4
Fat
eate
n (
g)
0
20
40
60
80
100
120
140
160
HIIT - 0 HIIT - 4
Fat
eate
n (
g)
0
500
1000
1500
2000
2500
MIIT - 0 MIIT - 4
EI (
kcal
)
0
500
1000
1500
2000
2500
HIIT - 0 HIIT - 4
EI (
kcal
)

Page 186
a)
b)
Figure 8-2. Delta value of Acute-Ex liking in MIIT (a) and HIIT (b); data represented as
mean ±SEM.
MIIT: moderate-intensity interval training; HIIT: high-intensity interval training; ΔAcute-
Ex: difference between end of acute exercise and resting value.
-20
-15
-10
-5
0
5
10
15
20
25
HFNS HFSW LFNS LFSW
Δ A
cute
-Ex
likin
g (m
m)
MIIT - week 0 MIIT - week 4
-20
-15
-10
-5
0
5
10
15
20
25
HFNS HFSW LFNS LFSW
Δ A
cute
-Ex
likin
g (m
m)
HIIT - week 0 HIIT - week 4

Page 187
a)
b)
Figure 8-3. Delta value of Acute-Ex wanting in MIIT (a) and HIIT (b); data represented as
mean ±SEM.
MIIT: moderate-intensity interval training; HIIT: high-intensity interval training; ΔAcute-
Ex: difference between end of acute exercise and resting value.
-600
-400
-200
0
200
400
HFNS HFSW LFNS LFSW
Δ A
cute
-Ex
wan
tin
g (m
sec)
MIIT - week 0 MIIT - week 4
-600
-400
-200
0
200
400
HFNS HFSW LFNS LFSW
Δ A
cute
-Ex
wan
tin
g (m
sec)
HIIT - week 0 HIIT - week 4

Page 188
a)
b)
Figure 8-4. Delta value of Acute-Exe food preferences in MIIT (a) and HIIT (b); data
represented as mean ±SEM.
MIIT: moderate-intensity interval training; HIIT: high-intensity interval training; ΔAcute-
Ex: difference between end of acute exercise and resting value.
-15
-10
-5
0
5
10
15
HFNS HFSW LFNS LFSW
Δ A
cute
-Ex
pre
fere
nce
(fr
eq)
MIIT - week 0 MIIT - week 4
-15
-10
-5
0
5
10
15
HFNS HFSW LFNS LFSW
Δ A
cute
-Ex
pre
fere
nce
(fr
eq)
HIIT - week 0 HIIT - week 4

Page 189
8.2 a)
b)
c)
Figure 8-5. Individual correlations between delta (difference between weeks 0 and 4) fat
intake (g) and substrate oxidation (g/min) during rest (a), exercise (b) and recovery (c) in
MIIT.
MIIT: moderate-intensity interval training; CHO: carbohydrate.
-20
-10
0
10
20
30
40
-0.10 -0.05 0.00 0.05 0.10 0.15 0.20 0.25
Δ F
at in
take
(g)
Δ Substrate oxidation (g/min)
Rest fat oxidation-MIIT Rest CHO oxidation-MIIT
-20
-10
0
10
20
30
40
-0.50 -0.40 -0.30 -0.20 -0.10 0.00 0.10 0.20
Δ F
at in
take
(g)
Δ Substrate oxidation (g/min)
Exe-induced fat oxidation-MIIT Exe-induced CHO oxidation-MIIT
-20
-10
0
10
20
30
40
-0.40 -0.30 -0.20 -0.10 0.00 0.10 0.20
Δ F
at in
take
(g)
Δ Substrate oxidation (g/min)
Recovery fat oxidation-MIIT Recovery CHO oxidation-MIIT

Page 190
a)
b)
c)
Figure 8-6. Individual correlations between delta (difference between weeks 0 and 4) fat
intake (g) and substrate oxidation (g/min) during rest (a), exercise (b) and recovery (c) in
HIIT.
HIIT: high-intensity interval training; CHO: carbohydrate.
-40
-30
-20
-10
0
10
20
-0.10 -0.05 0.00 0.05 0.10 0.15 0.20 0.25
Δ F
at in
take
(g)
Δ Substrate oxidation (g/min)
Rest fat oxidation-HIIT Rest CHO oxidation-HIIT
-40
-30
-20
-10
0
10
20
-0.50 -0.40 -0.30 -0.20 -0.10 0.00 0.10 0.20
Δ F
at in
take
(g)
Δ Substrate oxidation (g/min)
Exe-induced fat oxidation-HIIT Exe-induced CHO oxidation-HIIT
-40
-30
-20
-10
0
10
20
-0.10 -0.05 0.00 0.05 0.10 0.15 0.20 0.25
Δ F
at in
take
(g)
Δ Substrate oxidation (g/min)
Recovery fat oxidation-HIIT Rcovery CHO oxidation-HIIT

Page 191
Appendix B: Severity of Fatigue Symptoms questionnaire
Severity of Fatigue Symptoms questionnaire was used to assess fatigue during
MIIT and HIIT, which is shown in Figure 8-7.
1- Do you have problems with tiredness?
Better than usual
No more than usual
Worse than usual
Much worse than usual
2- Do you need to rest more?
Better than usual
No more than usual
Worse than usual
Much worse than usual
3- Do you feel sleepy or drowsy?
Better than usual
No more than usual
Worse than usual
Much worse than usual
4- Do you have problems starting things?
Better than usual
No more than usual
Worse than usual
Much worse than usual
5- Are you lacking in energy?
Better than usual
No more than usual
Worse than usual
Much worse than usual
6- Do you have less strength in your muscles?
Better than usual
No more than usual
Worse than usual
Much worse than usual
7- Do you feel weak?
Better than usual
No more than usual
Worse than usual
Much worse than usual
Figure 8-7. The 7-item Severity of Fatigue Symptoms questionnaire (Chalder Fatigue Questionnaire)
to estimate the severity of fatigue symptoms.

Page 192
9 References
Achten, J., Gleeson, M., & Jeukendrup, A. (2002). Determination of the exercise intensity that elicits
maximal fat oxidation. Medicine And Science In Sports And Exercise, 34(1), 92-97.
Achten, J., & Jeukendrup, A. (2004). Optimizing fat oxidation through exercise and diet. Nutrition
20(7-8), 716-727.
Adabag, A., Grandits, G., Prineas, R., Crow, R., Bloomfield, H., & Neaton, J. (2008). Relation of
heart rate parameters during exercise test to sudden death and all-cause mortality in
asymptomatic men. American Journal of Cardiology, 101(10), 1437-1443.
Alahmadi, M., Hills, A., King, N., & Byrne, N. (2011). Exercise intensity influences nonexercise
activity thermogenesis in overweight and obese adults. Medicine And Science In Sports And
Exercise, 43(4), 624-631.
Alberti, K., Zimmet, P., & Shaw, J. (2005). The metabolic syndrome - a new worldwide definition.
Lancet, 366(9491), 1059-1062.
Almeras, N., Lavallee, N., Despres, J., Bouchard, C., & Tremblay, A. (1995). Exercise and energy
intake: effect of substrate oxidation. Physiology & Behavior, 57(5), 995-1000.
Amati, F., Dube, J., Shay, C., & Goodpaster, B. (2008). Separate and combined effects of exercise
training and weight loss on exercise efficiency and substrate oxidation. Journal Of Applied
Physiology, 105(3), 825-831.
Ambler, C., Eliakim, A., Brasel, J., Lee, W., Burke, G., & Cooper, D. (1998). Fitness and the effect of
exercise training on the dietary intake of healthy adolescents. International Journal Of
Obesity And Related Metabolic Disorders, 22(4), 354-362.
Anagnostakou, V., Chatzimichail, K., Dimopoulos, S., Karatzanos, E., Papazachou, O., Tasoulis, A., .
. . Nanas, S. (2011). Effects of Interval Cycle Training With or Without Strength Training on
Vascular Reactivity in Heart Failure Patients. Journal of Cardiac Failure, 17(7), 585-591.
Aronson, D., Sella, R., Sheikh-Ahmad, M., Kerner, A., Avizohar, O., Rispler, S., . . . Brook, G.
(2004). The association between cardiorespiratory fitness and C-reactive protein in subjects
with the metabolic syndrome. Journal Of The American College Of Cardiology, 44(10),
2003-2007.
Astrand, I., Astrand, P., Christensen, E., & Hedman, R. (1960a). Intermittent muscular work. Acta
Physiologica Scandinavica, 48, 448-453.
Astrand, I., Astrand, P., Christensen, E., & Hedman, R. (1960b). Myohemoglobin as an oxygen-store
in man. Acta Physiologica Scandinavica, 48, 454-460.
Astrand, P., Rodahl, K., Dahl, H., & Stromme, S. (2003). Textbook of Work Physiology (4th ed.).
Champaign, IL: Human Kinetics.
Astrup, A., Buemann, B., Christensen, N., & Toubro, S. (1994). Failure to increase lipid oxidation in
response to increasing dietary fat content in formerly obese women. The American Journal
Of Physiology, 266(4, Pt 1), E592-599.
Atlantis, E., Lange, K., & Wittert, G. (2009). Chronic disease trends due to excess body weight in
Australia. Obesity Reviews, 10(5), 543-553.
Aucott, L. (2008). Influences of weight loss on long-term diabetes outcomes. The Proceedings Of The
Nutrition Society, 67(1), 54-59.
Aucouturier, J., Isacco, L., Thivel, D., Fellmann, N., Chardigny, J., Duclos, M., & Duche, P. (2011).
Effect of time interval between food intake and exercise on substrate oxidation during
exercise in obese and lean children. Clinical Nutrition, 30(6), 780-785.
Australian Bureau of Statistics. (2008). Overweight and Obesity in Adults, Australia, 2004-05.
Canberra, ACT.
Babraj, J., Vollaard, N., Keast, C., Guppy, F., Cottrell, G., & Timmons, J. (2009). Extremely short
duration high intensity interval training substantially improves insulin action in young
healthy males. BMC Endocrine Disorders, 9, 3.
Bajpeyi, S., Tanner, C., Slentz, C., Duscha, B., McCartney, J., Hickner, R., . . . Houmard, J. (2009).
Effect of exercise intensity and volume on persistence of insulin sensitivity during training
cessation. Journal Of Applied Physiology, 106(4), 1079-1085.

Page 193
Bakhai, A. (2008). Adipokines-targeting a root cause of cardiometabolic risk. Quarterly Journal of
Medicine, 101(10), 767-776.
Balducci, S., Zanuso, S., Nicolucci, A., Fernando, F., Cavallo, S., Cardelli, P., . . . Pugliese, G. (2010).
Anti-inflammatory effect of exercise training in subjects with type 2 diabetes and the
metabolic syndrome is dependent on exercise modalities and independent of weight loss.
Nutrition, Metabolism and Cardiovascular Diseases, 20(8), 608-617.
Balsom, P., Ekblom, B., Soerlund, K., Sodln, B., & Hultman, E. (2007). Creatine supplementation and
dynamic high-intensity intermittent exercise. Scandinavian Journal Of Medicine And Science
In Sports, 3(3), 143-149.
Baron, B., Dekerle, J., Robin, S., Neviere, R., Dupont, L., Matran, R., . . . Pelayo, P. (2003). Maximal
lactate steady state does not correspond to a complete physiological steady state.
International Journal Of Sports Medicine, 24(8), 582-587.
Baron, B., Noakes, T., Dekerle, J., Moullan, F., Robin, S., Matran, R., & Pelayo, P. (2008). Why does
exercise terminate at the maximal lactate steady state intensity? British Journal Of Sports
Medicine, 42(10), 828-833.
Bartlett, J., Close, G., MacLaren, D., Gregson, W., Drust, B., & Morton, J. (2011). High-intensity
interval running is perceived to be more enjoyable than moderate-intensity continuous
exercise: implications for exercise adherence. Journal Of Sports Sciences, 29(6), 547-553.
Barwell, N., Malkova, D., Leggate, M., & Gill, J. (2009). Individual responsiveness to exercise-
induced fat loss is associated with change in resting substrate utilization. Metabolism:
Clinical and Experimental, 58(9), 1320-1328.
Basterra-Gortari, F., Bes-Rastrollo, M., Pardo-Fernandez, M., Forga, L., Martinez, J., & Martanez-
Gonzalez, M. (2009). Changes in weight and physical activity over two years in Spanish
alumni. Medicine And Science In Sports And Exercise, 41(3), 516-522.
Bearden, S., Henning, P., Bearden, T., & Moffatt, R. (2004). The slow component of VO2 kinetics in
very heavy and fatiguing square-wave exercise. European Journal Of Applied Physiology,
91(5-6), 586-594.
Bellisle, F. (1999). Food choice, appetite and physical activity. Public Health Nutrition, 2(3A), 357-
361.
Beneke, R. (2003). Methodological aspects of maximal lactate steady state implications for
performance testing. European Journal Of Applied Physiology, 89(1), 95-99.
Beneke, R., Leithuser, R., & Ochentel, O. (2011). Blood lactate diagnostics in exercise testing and
training. International Journal Of Sports Physiology And Performance, 6(1), 8-24.
Berggren, J., Boyle, K., Chapman, W., & Houmard, J. (2008). Skeletal muscle lipid oxidation and
obesity: influence of weight loss and exercise. American Journal Of Physiology.
Endocrinology And Metabolism, 294(4), E726-E732.
Berridge, K. (2009). 'Liking' and 'wanting' food rewards: brain substrates and roles in eating disorders.
Physiology & Behavior, 97(5), 537-550.
Berthoud, H. (2004). Mind versus metabolism in the control of food intake and energy balance.
Physiology & Behavior, 81(5), 781-793.
Billat, L. (2001a). Interval training for performance: a scientific and empirical practice. Special
recommendations for middle- and long-distance running. Part I: aerobic interval training.
Sports Medicine, 31(1), 13-31.
Billat, L. (2001b). Interval training for performance: a scientific and empirical practice. Special
recommendations for middle- and long-distance running. Part II: anaerobic interval training.
Sports Medicine, 31(2), 75-90.
Billat, V., Blondel, N., & Berthoin, S. (1999). Determination of the velocity associated with the
longest time to exhaustion at maximal oxygen uptake. European Journal Of Applied
Physiology And Occupational Physiology, 80(2), 159-161.
Billaut, F., & Bishop, D. (2009). Muscle fatigue in males and females during multiple-sprint exercise.
Sports Medicine, 39(4), 257-278.
Billaut, F., Giacomoni, M., & Falgairette, G. (2003). Maximal intermittent cycling exercise: effects of
recovery duration and gender. Journal Of Applied Physiology, 95(4), 1632-1637.
Binder, R., Wonisch, M., Corra, U., Cohen-Solal, A., Vanhees, L., Saner, H., & Schmid, J. (2008).
Methodological approach to the first and second lactate threshold in incremental
cardiopulmonary exercise testing. European Journal Of Cardiovascular Prevention And
Rehabilitation, 15(6), 726-734.
Bircher, S., & Knechtle, B. (2004). Relationship between fat oxidation and lactate threshold in athletes
and obese women and men. Journal of Sports Science and Medicine, 3(3), 174-181.

Page 194
Bircher, S., Knechtle, B., & Knecht, H. (2005). Is the intensity of the highest fat oxidation at the
lactate concentration of 2 mmol L(-1)? A comparison of two different exercise protocols.
European Journal of Clinical Investigation, 35(8), 491-498.
Bishop, D. (2004). The validity of physiological variables to assess training intensity in kayak
athletes. International Journal Of Sports Medicine, 25(1), 68-72.
Bishop, D., Edge, J., Thomas, C., & Mercier, J. (2008). Effects of high-intensity training on muscle
lactate transporters and postexercise recovery of muscle lactate and hydrogen ions in women.
American Journal Of Physiology. Regulatory, Integrative And Comparative Physiology,
295(6), R1991-R1998.
Bishop, D., Jenkins, D., & Mackinnon, L. (1998). The relationship between plasma lactate parameters,
Wpeak and 1-h cycling performance in women. Medicine And Science In Sports And
Exercise, 30(8), 1270-1275.
Bjorgaas, M., Vik, J., Saeterhaug, A., Langlo, L., Sakshaug, T., Mohus, R., & Grill, V. (2005).
Relationship between pedometer-registered activity, aerobic capacity and self-reported
activity and fitness in patients with type 2 diabetes. Diabetes, Obesity & Metabolism, 7(6),
737-744.
Blaak, E., & Saris, W. (2002). Substrate oxidation, obesity and exercise training. Best Practice &
Research Clinical Endocrinology & Metabolism, 16(4), 667-678.
Blonc, S., Casas, H., Duche, P., Beaune, B., & Bedu, M. (1998). Effect of recovery duration on the
force-velocity relationship. International Journal Of Sports Medicine, 19(4), 272-276.
Blundell, J. (2006). Perspective on the central control of appetite. Obesity, 14 Suppl 4, 160S-163S.
Blundell, J., De Graaf, C., Hulshof, T., Jebb, S., Livingstone, B., Lluch, A., . . . Westerterp, M. (2010).
Appetite control: methodological aspects of the evaluation of foods. Obesity Reviews, 11(3),
251-270.
Blundell, J., & Gillett, A. (2001). Control of food intake in the obese. Obesity Research, 9, 263S-
270S.
Blundell, J., Stubbs, R., Golding, C., Croden, F., Alam, R., Whybrow, S., . . . Lawton, C. (2005).
Resistance and susceptibility to weight gain: individual variability in response to a high-fat
diet. Physiology & Behavior, 86(5), 614-622.
Blundell, J., Stubbs, R., Hughes, D., Whybrow, S., & King, N. (2003). Cross talk between physical
activity and appetite control: does physical activity stimulate appetite? The Proceedings Of
The Nutrition Society, 62(3), 651-661.
Borer, K., Wuorinen, E., Chao, C., & Burant, C. (2005). Exercise energy expenditure is not
consciously detected due to oro-gastric, not metabolic, basis of hunger sensation. Appetite,
45(2), 177-181.
Bourdon, P. (2000). Blood lactate transition thresholds: concepts and controversies. In C. Gore (Ed.),
Physiological tests for elite athletes, Ausralian Sports Comission (pp. 50-65). Champaign,
IL: Human Kinetics.
Boutcher, S. (2011). High-intensity intermittent exercise and fat loss. Journal Of Obesity, 868305-
868315. doi: 10.1155/2011/868305
Brooks, G. (2007). Lactate: link between glycolytic and oxidative metabolism. Sports Medicine, 37(4-
5), 341-343.
Brooks, G., Butte, N., Rand, W., Flatt, J., & Caballero, B. (2004). Chronicle of the Institute of
Medicine physical activity recommendation: how a physical activity recommendation came
to be among dietary recommendations. American Journal of Clinical Nutrition, 79(5), 921-
930.
Broom, D., Batterham, R., King, J., & Stensel, D. (2009). Influence of resistance and aerobic exercise
on hunger, circulating levels of acylated ghrelin, and peptide YY in healthy males. American
Journal Of Physiology. Regulatory, Integrative And Comparative Physiology, 296(1), R29-
R35.
Brouwer, E. (1957). On simple formulae for calculating the heat expenditure and the quantities of
carbohydrate and fat oxidized in metabolism of men and animals, from gaseous exchange
(Oxygen intake and carbonic acid output) and urine-N. Acta Physiologica Et
Pharmacologica Neerlandica, 6, 795-802.
Browning, R., & Kram, R. (2005). Energetic cost and preferred speed of walking in obese vs. normal
weight women. Obesity Research, 13(5), 891-899.
Browning, R., & Kram, R. (2009). Pound for pound: Working out how obesity influences the
energetics of walking. Journal Of Applied Physiology, 106(6), 1755-1756.

Page 195
Burgomaster, K., Heigenhauser, G., & Gibala, M. (2006). Effect of short-term sprint interval training
on human skeletal muscle carbohydrate metabolism during exercise and time-trial
performance. Journal Of Applied Physiology, 100(6), 2041-2047.
Burgomaster, K., Howarth, K., Phillips, S., Rakobowchuk, M., Macdonald, M., McGee, S., & Gibala,
M. (2008). Similar metabolic adaptations during exercise after low volume sprint interval and
traditional endurance training in humans. The Journal Of Physiology, 586(1), 151-160.
Burton, F., Malkova, D., Caslake, M., & Gill, J. (2010). Substrate metabolism, appetite and feeding
behaviour under low and high energy turnover conditions in overweight women. The British
Journal Of Nutrition, 104(8), 1249-1259.
Byrne, N., & Hills, A. (2002). Relationships between HR and VO2 in the obese. Medicine And Science
In Sports And Exercise, 34(9), 1419-1427.
Byrne, N., Hills, A., Roffey, D., & Colley, R. (2006). Tools for physical activity measurement: cutting
the cloth to fit. In A. Hills, N. King & N. Byrne (Eds.), Physical Activity and Obesity (pp. 33-
50). London, UK: Smith-Gordon.
Capodaglio, E. (2001). Comparison between the CR10 Borg's scale and the VAS (visual analogue
scale) during an arm-cranking exercise. Journal Of Occupational Rehabilitation, 11(2), 69-
74.
Capostagno, B., & Bosch, A. (2010). Higher fat oxidation in running than cycling at the same exercise
intensities. International Journal Of Sport Nutrition And Exercise Metabolism 20(1), 44-55.
Carey, A., Bruce, C., Sacchetti, M., Anderson, M., Olsen, D., Saltin, B., . . . Febbraio, M. (2004).
Interleukin-6 and tumor necrosis factor-alpha are not increased in patients with Type 2
diabetes: evidence that plasma interleukin-6 is related to fat mass and not insulin
responsiveness. Diabetologia, 47(6), 1029-1037.
Carey, D. (2009). Quantifying differences in the "fat burning" zone and the aerobic zone: implications
for training. Journal Of Strength And Conditioning Research, 23(7), 2090-2095.
Carey, D., Tofte, C., Pliego, G., & Raymond, R. (2009). Transferability of running and cycling
training zones in triathletes: implications for steady-state exercise. Journal Of Strength And
Conditioning Research, 23(1), 251-258.
Chalder, T., Berelowitz, G., Pawlikowska, T., Watts, L., Wessely, S., Wright, D., & Wallace, E.
(1993). Development of a fatigue scale. Journal Of Psychosomatic Research, 37(2), 147-153.
Chaput, J., & Tremblay, A. (2009). The glucostatic theory of appetite control and the risk of obesity
and diabetes. International Journal Of Obesity, 33(1), 46-53.
Chen, L., Magliano, D., Balkau, B., Colagiuri, S., Zimmet, P., Tonkin, A., . . . Shaw, J. (2010).
AUSDISK: an Australian type 2 diabetes risk assessment tool based on demographic,
lifestyle and simple anthropometric measures. Tha Medical Journal Australia, 192(5), 274.
Cheneviere, X., Borrani, F., Ebenegger, V., Gojanovic, B., & Malatesta, D. (2009a). Effect of a 1-hour
single bout of moderate-intensity exercise on fat oxidation kinetics. Metabolism: Clinical
And Experimental, 58(12), 1778-1786.
Cheneviere, X., Malatesta, D., Peters, E., & Borrani, F. (2009b). A mathematical model to describe fat
oxidation kinetics during graded exercise. Medicine And Science In Sports And Exercise,
41(8), 1615-1625.
Cheng, M., Bushnell, D., Cannon, D., & Kern, M. (2009). Appetite regulation via exercise prior or
subsequent to high-fat meal consumption. Appetite, 52(1), 193-198.
Christmass, M., Dawson, B., & Arthur, P. (1999a). Effect of work and recovery duration on skeletal
muscle oxygenation and fuel use during sustained intermittent exercise. European Journal Of
Applied Physiology And Occupational Physiology, 80(5), 436-447.
Christmass, M., Dawson, B., Goodman, C., & Arthur, P. (2001). Brief intense exercise followed by
passive recovery modifies the pattern of fuel use in humans during subsequent sustained
intermittent exercise. Acta Physiologica Scandinavica, 172(1), 39-52.
Christmass, M., Dawson, B., Passeretto, P., & Arthur, P. (1999b). A comparison of skeletal muscle
oxygenation and fuel use in sustained continuous and intermittent exercise. European
Journal Of Applied Physiology And Occupational Physiology, 80(5), 423-435.
Church, T., Martin, C., Thompson, A., Earnest, C., Mikus, C., & Blair, S. (2009). Changes in weight,
waist circumference and compensatory responses with different doses of exercise among
sedentary, overweight postmenopausal women. Plos One, 4(2), e4515-e4515.
Colagiuri, S. (2010). Diabesity: therapeutic options. Diabetes, Obesity & Metabolism, 12(6), 463-473.
Colberg, S., Sigal, R., Fernhall, B., Regensteiner, J., Blissmer, B., Rubin, R., . . . Braun, B. (2010).
Exercise and Type 2 Diabetes: The American College of Sports Medicine and the American
Diabetes Association joint position statement executive summary. Diabetes Care, 33(12),
2692-2696.

Page 196
Colley, R. (2005). Quantifying the effect of exercise on total energy expenditure in obese women.
(Unpublished doctoral dissertation), Queensland University of Technology, Brisbane, QLD.
Colley, R., Hills, A., King, N., & Byrne, N. (2010). Exercise-induced energy expenditure:
Implications for exercise prescription and obesity. Patient Education and Counseling, 79(3),
327-332.
Coquart, J., Lemaire, C., Dubart, A., Luttembacher, D., Douillard, C., & Garcin, M. (2008).
Intermittent versus continuous exercise: Effects of perceptually lower exercise in obese
women. Medicine And Science In Sports And Exercise, 40(8), 1546-1553.
Corpeleijn, E., Mensink, M., Kooi, M., Roekaerts, P., Saris, W., & Blaak, E. (2008). Impaired skeletal
muscle substrate oxidation in glucose-intolerant men improves after weight loss. Obesity,
16(5), 1025-1032.
Corpeleijn, E., Saris, W., & Blaak, E. (2009). Metabolic flexibility in the development of insulin
resistance and type 2 diabetes: effects of lifestyle. Obesity Reviews, 10(2), 178-193.
Coutts, A., Rampinini, E., Marcora, S., Castagna, C., & Impellizzeri, F. (2009). Heart rate and blood
lactate correlates of perceived exertion during small-sided soccer games. Journal Of Science
And Medicine In Sport, 12(1), 79-84.
Cox-Reijven, P., & Soeters, P. (2000). Validation of bio-impedance spectroscopy: Effects of degree of
obesity and ways of calculating volumes from measured resistance values. International
Journal Of Obesity, 24(3), 271-280.
Coyle, E. (1998). Cardiovascular drift during prolonged exercise and the effects of dehydration.
International Journal Of Sports Medicine, 19 (Suppl 2), S121-S124.
Crisp, N., Guelfi, K., Licari, M., Braham, R., & Fournier, P. (2012). Does exercise duration affect
Fatmax in overweight boys? European Journal Of Applied Physiology, 112(7), 2557-2564.
Cunha, F., Midgley, A., Monteiro, W., & Farinatti, P. (2010). Influence of cardiopulmonary exercise
testing protocol and resting VO2 assessment on %HRmax, %HRR, %VO2max and %VO2R
relationships. International Journal Of Sports Medicine, 31(5), 319-326.
Dalleck, L., Bushman, T., Crain, R., Gajda, M., Koger, E., & Derksen, L. (2010). Dose-response
relationship between interval training frequency and magnitude of improvement in lactate
threshold. International Journal Of Sports Medicine, 31(8), 567-571.
Daussin, F., Ponsot, E., Dufour, S., Lonsdorfer-Wolf, E., Doutreleau, S., Geny, B., . . . Richard, R.
(2007). Improvement of VO2max by cardiac output and oxygen extraction adaptation during
intermittent versus continuous endurance training. European Journal Of Applied Physiology,
101(3), 377-383.
Daussin, F., Zoll, J., Dufour, S., Ponsot, E., Lonsdorfer-Wolf, E., Doutreleau, S., . . . Richard, R.
(2008). Effect of interval versus continuous training on cardiorespiratory and mitochondrial
functions: relationship to aerobic performance improvements in sedentary subjects. American
Journal Of Physiology. Regulatory, Integrative And Comparative Physiology, 295(1), R264-
272.
Davis, J., Rozenek, R., DeCicco, D., Carizzi, M., & Pham, P. (2007). Comparison of three methods
for detection of the lactate threshold. Clinical Physiology & Functional Imaging, 27(6), 381-
384.
De Cocker, K., De Bourdeaudhuij, I., & Cardon, G. (2010). The effect of a multi-strategy workplace
physical activity intervention promoting pedometer use and step count increase. Health
Education Research, 25(4), 608-619.
De Filippis, E., Cusi, K., Ocampo, G., Berria, R., Buck, S., Consoli, A., & Mandarino, L. (2006).
Exercise-induced improvement in vasodilatory function accompanies increased insulin
sensitivity in obesity and type 2 diabetes mellitus. The Journal Of Clinical Endocrinology
And Metabolism, 91(12), 4903-4910.
De Greef, K., Deforche, B., Tudor-Locke, C., & De Bourdeaudhuij, I. (2010). A cognitive-
behavioural pedometer-based group intervention on physical activity and sedentary
behaviour in individuals with type 2 diabetes. Health Education Research, 25(5), 724-736.
De Lorenzo, A., Andreoli, A., Matthie, J., & Withers, P. (1997). Predicting body cell mass with
bioimpedance by using theoretical methods: a technological review. Journal Of Applied
Physiology, 82(5), 1542-1558.
De Lorey, D., Wyrick, B., & Babb, T. (2005). Mild-to-moderate obesity: implications for respiratory
mechanics at rest and during exercise in young men. International Journal Of Obesity, 29(9),
1039-1047.
De Vries, S., Van Hirtum, H., Bakker, I., Hopman-Rock, M., Hirasing, R., & Van Mechelen, W.
(2009). Validity and reproducibility of motion sensors in youth: a systematic update.
Medicine And Science In Sports And Exercise, 41(4), 818-827.

Page 197
Demarie, S., Koralsztein, J., & Billat, V. (2000). Time limit and time at VO2max during a continuous
and an intermittent run. The Journal Of Sports Medicine And Physical Fitness, 40(2), 96-102.
Demarle, A., Heugas, A., Slawinski, J., Tricot, V., Koralsztein, J., & Billat, V. (2003). Whichever the
initial training status, any increase in velocity at lactate threshold appears as a major factor in
improved time to exhaustion at the same severe velocity after training. Archives Of
Physiology And Biochemistry 111(2), 167-176.
Denadai, B., Ortiz, M., Greco, C., & De Mello, M. (2006). Interval training at 95% and 100% of the
velocity at VO2max: effects on aerobic physiological indexes and running performance.
Applied Physiology, Nutrition, And Metabolism, 31(6), 737-743.
Department of Health and Ageing. (2008). Promoting healthy weight. Australia Government -
Department of Health and Ageing Retrieved from
http://www.health.gov.au/internet/main/Publishing.nsf/Content/health-pubhlth-strateg-
hlthwt-obesity.htm.
Deriaz, O., Dumont, M., Bergeron, N., Despres, J., Brochu, M., & Prudhomme, D. (2001). Skeletal
muscle low attenuation area and maximal fat oxidation rate during submaximal exercise in
male obese individuals. International Journal Of Obesity And Related Metabolic Disorders,
25(11), 1579-1584.
Despres, J. (2006). Is visceral obesity the cause of the metabolic syndrome? Annals Of Medicine,
38(1), 52-63.
Diabetes Australia. (2006). The economic costs of obesity from
http://www.diabetesaustralia.com.au/PageFiles/7872/Theeconomiccostofobesity2006.pdf
Dickson-Parnell, B., & Zeichner, A. (1985). Effects of a short-term exercise program on caloric
consumption. Health Psychology, 4(5), 437-448.
Dionne, I., Van Vugt, S., & Tremblay, A. (1999). Postexercise macronutrient oxidation: a factor
dependent on postexercise macronutrient intake. The American Journal Of Clinical Nutrition,
69(5), 927-930.
Donnelly, J., Blair, S., Jakicic, J., Manore, M., Rankin, J., & Smith, B. (2009). American College of
Sports Medicine Position Stand. Appropriate physical activity intervention strategies for
weight loss and prevention of weight regain for adults. Medicine And Science In Sports And
Exercise, 41(2), 459-471.
Donnelly, J., Jacobsen, D., Heelan, K., Seip, R., & Smith, S. (2000). The effects of 18 months of
intermittent vs. continuous exercise on aerobic capacity, body weight and composition, and
metabolic fitness in previously sedentary, moderately obese females. International Journal
Of Obesity And Related Metabolic Disorders, 24(5), 566-572.
Donnelly, J., Kirk, E., Jacobsen, D., Hill, J., Sullivan, D., & Johnson, S. (2003). Effects of 16 mo of
verified, supervised aerobic exercise on macronutrient intake in overweight men and women:
the Midwest Exercise Trial. The American Journal Of Clinical Nutrition, 78(5), 950-956.
Donnelly, J., & Smith, B. (2005). Is exercise effective for weight loss with ad libitum diet? Energy
balance, compensation, and gender differences. Exercise and Sport Sciences Reviews, 33(4),
169-174.
Drapeau, V., Blundell, J., Therrien, F., Lawton, C., Richard, D., & Tremblay, A. (2005). Appetite
sensations as a marker of overall intake. British Journal Of Nutrition, 93(2), 273-280.
Drapeau, V., King, N., Hetherington, M., Doucet, E., Blundell, J., & Tremblay, A. (2007). Appetite
sensations and satiety quotient: predictors of energy intake and weight loss. Appetite, 48(2),
159-166.
Drewnowski, A., & Holden-Wiltse, J. (1992). Taste responses and food preferences in obese women:
effects of weight cycling. International Journal Of Obesity And Related Metabolic
Disorders, 16(9), 639-648.
Dube, J., Amati, F., Toledo, F., Stefanovic-Racic, M., Rossi, A., Coen, P., & Goodpaster, B. (2011).
Effects of weight loss and exercise on insulin resistance, and intramyocellular triacylglycerol,
diacylglycerol and ceramide. Diabetologia, 54(5), 1147-1156.
Dumortier, M., Brandou, F., Perez-Martin, A., Fedou, C., Mercier, J., & Brun, J. (2003). Low
intensity endurance exercise targeted for lipid oxidation improves body composition and
insulin sensitivity in patients with the metabolic syndrome. Diabetes & Metabolism, 29(5),
509-518.
Duncan, G., & Howley, E. (1998). Metabolic and perceptual responses to short-term cycle training in
children. Pediatric Exercise Science, 10(2), 110-122.
Dupont, G., & Berthoin, S. (2004). Time spent at a high percentage of VO2max for short intermittent
runs: active versus passive recovery. Canadian Journal Of Applied Physiology, 29 Suppl, S3-
S16.

Page 198
Durstine, J., Grandjean, P., Cox, C., & Thompson, P. (2002). Lipids, lipoproteins, and exercise.
Journal Of Cardiopulmonary Rehabilitation, 22(6), 385-398.
Durstine, J., Grandjean, P., Davis, P., Ferguson, M., Alderson, N., & DuBose, K. (2001). Blood lipid
and lipoprotein adaptations to exercise: a quantitative analysis. Sports Medicine, 31(15),
1033-1062.
Earnest, C. (2008). Exercise interval training: an improved stimulus for improving the physiology of
pre-diabetes. Medical Hypotheses, 71(5), 752-761.
Eckel, R., Hernandez, T., Bell, M., Weil, K., Shepard, T., Grunwald, G., . . . Hill, J. (2006).
Carbohydrate balance predicts weight and fat gain in adults. The American Journal Of
Clinical Nutrition, 83(4), 803-808.
Ekkekakis, P., & Lind, E. (2006). Exercise does not feel the same when you are overweight: the
impact of self-selected and imposed intensity on affect and exertion. International Journal Of
Obesity, 30(4), 652-660.
Elder, S., & Roberts, S. (2007). The effects of exercise on food intake and body fatness: a summary of
published studies. Nutrition Reviews, 65(1), 1-19.
Erdmann, J., Tahbaz, R., Lippl, F., Wagenpfeil, S., & Schusdziarra, V. (2007). Plasma ghrelin levels
during exercise - effects of intensity and duration. Regulatory Peptides, 143(1-3), 127-135.
Esfarjani, F., & Laursen, P. (2007). Manipulating high-intensity interval training: effects on VO2max,
the lactate threshold and 3000 m running performance in moderately trained males. Journal
Of Science And Medicine In Sport, 10(1), 27-35.
Essen, B. (1978). Studies on the regulation of metabolism in human skeletal muscle using intermittent
exercise as an experimental model. Acta physiologica Scandinavica, 454(Suppl), 1-32.
Essen, B., Hagenfeldt, L., & Kaijser, L. (1977). Utilization of blood-borne and intramuscular
substrates during continuous and intermittent exercise in man. The Journal Of Physiology,
265(2), 489-506.
Essen, B., & Kaijser, L. (1978). Regulation of glycolysis in intermittent exercise in man. The Journal
Of Physiology, 281, 499-511.
Fanchini, M., Azzalin, A., Castagna, C., Schena, F., McCall, A., & Impellizzeri, F. (2011). Effect of
bout duration on exercise intensity and technical performance of small-sided games in
soccer. Journal Of Strength And Conditioning Research, 25(2), 453-458.
Faude, O., Kindermann, W., & Meyer, T. (2009). Lactate threshold concepts: how valid are they?
Sports Medicine, 39(6), 469-490.
Feinle, C., O'Donovan, D., & Horowitz, M. (2002). Carbohydrate and satiety. Nutrition Reviews,
60(6), 155-169.
Fink, W., & Costill, D. (1990). Analytic methods for the measurement of human performance.
Muncie, IN: Ball State University.
Finlayson, G., Bryant, E., Blundell, J., & King, N. (2009). Acute compensatory eating following
exercise is associated with implicit hedonic wanting for food. Physiology & Behavior, 97(1),
62-67.
Finlayson, G., Caudwell, P., Gibbons, C., Hopkins, M., King, N., & Blundell, J. (2011). Low fat loss
response after medium-term supervised exercise in obese is associated with exercise-induced
increase in food reward. Journal Of Obesity, 1, 1-8.
Finlayson, G., & Dalton, M. (2011). Current progress in the assessment of 'liking' vs. 'wanting' food in
human appetite. Comment on '"You say it's liking, I say it's wanting...". On the difficulty of
disentangling food reward in man'. Appetite, 58(1), 373.
Finlayson, G., King, N., & Blundell, J. (2007a). Is it possible to dissociate 'liking' and 'wanting' for
foods in humans? A novel experimental procedure. Physiology & Behavior, 90(1), 36-42.
Finlayson, G., King, N., & Blundell, J. (2007b). Liking vs. wanting food: importance for human
appetite control and weight regulation. Neuroscience And Biobehavioral Reviews, 31(7),
987-1002.
Finlayson, G., King, N., & Blundell, J. (2008). The role of implicit wanting in relation to explicit
liking and wanting for food: implications for appetite control. Appetite, 50(1), 120-127.
Flatt, J. (1987). Dietary fat, carbohydrate balance, and weight maintenance: effects of exercise. The
American Journal Of Clinical Nutrition, 45(Suppl 1), 296-306.
Flatt, J. (1995). Use and storage of carbohydrate and fat. The American Journal Of Clinical Nutrition,
61(Suppl 4), 952S-959S.
Flatt, J. (1996). Carbohydrate balance and body-weight regulation. The Proceedings Of The Nutrition
Society, 55(1B), 449-465.
Flint, A., Gregersen, N., Gluud, L., Moller, B., Raben, A., Tetens, I., . . . Astrup, A. (2007).
Associations between postprandial insulin and blood glucose responses, appetite sensations

Page 199
and energy intake in normal weight and overweight individuals: a meta-analysis of test meal
studies. The British Journal Of Nutrition, 98(1), 17-25.
Fox, K., & Hillsdon, M. (2007). Physical activity and obesity. Obesity Reviews, 8 (Suppl 1), 115-121.
Franch, J., Madsen, K., Djurhuus, M., & Pedersen, P. (1998). Improved running economy following
intensified training correlates with reduced ventilatory demands. Medicine And Science In
Sports And Exercise, 30(8), 1250-1256.
Frayn, K. (1983). Calculation of substrate oxidation rates in vivo from gaseous exchange. Journal Of
Applied Physiology: Respiratory, Environmental And Exercise Physiology, 55(2), 628-634.
Frayn, K. (2010). Fat as a fuel: emerging understanding of the adipose tissue-skeletal muscle axis.
Acta Physiologica, 199(4), 509-518.
Gaitanos, G., Williams, C., Boobis, L., & Brooks, S. (1993). Human muscle metabolism during
intermittent maximal exercise. Journal Of Applied Physiology, 75(2), 712-719.
Galgani, J., Moro, C., & Ravussin, E. (2008). Metabolic flexibility and insulin resistance. American
Journal Of Physiology. Endocrinology And Metabolism, 295(5), E1009-1017.
Galgani, J., & Ravussin, E. (2008). Energy metabolism, fuel selection and body weight regulation.
International Journal Of Obesity (2005), 32 Suppl 7, S109-119.
Garber, C., Blissmer, B., Deschenes, M., Franklin, B., Lamonte, M., Lee, I., . . . Swain, D. (2011).
Quantity and quality of exercise for developing and maintaining cardiorespiratory,
musculoskeletal, and neuromotor fitness in apparently healthy adults: guidance for
prescribing exercise. Medicine And Science In Sports And Exercise, 43(7), 1334-1359.
Garcin, M., & Billat, V. (2001). Perceived exertion scales attest to both intensity and exercise
duration. Perceptual And Motor Skills, 93(3), 661-671.
Garcin, M., Mille-Hamard, L., Duhamel, A., Boudin, F., Reveillere, C., Billat, V., & Lhermitte, M.
(2006). Factors associated with perceived exertion and estimated time limit at lactate
threshold. Perceptual And Motor Skills, 103(1), 51-66.
Garcin, M., Vautier, J., Vandewalle, H., Wolff, M., & Monod, H. (1998). Ratings of perceived
exertion (RPE) during cycling exercises at constant power output. Ergonomics, 41(10), 1500-
1509.
Gaskill, S., Ruby, B., Walker, A., Sanchez, O., Serfass, R., & Leon, A. (2001). Validity and reliability
of combining three methods to determine ventilatory threshold. Medicine And Science In
Sports And Exercise, 33(11), 1841-1848.
Gastaldelli, A. (2008). Abdominal fat: does it predict the development of type 2 diabetes? The
American Journal Of Clinical Nutrition, 87(5), 1118-1119.
George, V., & Morganstein, A. (2003). Effect of moderate intensity exercise on acute energy intake in
normal and overweight females. Appetite, 40(1), 43-46.
Gibala, M. (2009). Molecular responses to high-intensity interval exercise. Applied Physiology,
Nutrition, And Metabolism, 34(3), 428-432.
Gibala, M., & Little, J. (2010). Just hit it! A time-efficient exercise strategy to improve muscle insulin
sensitivity. The Journal Of Physiology, 588(Pt 18), 3341-3342.
Gibala, M., Little, J., Van Essen, M., Wilkin, G., Burgomaster, K., Safdar, A., . . . Tarnopolsky, M.
(2006). Short-term sprint interval versus traditional endurance training: similar initial
adaptations in human skeletal muscle and exercise performance. The Journal Of Physiology,
575(Pt 3), 901-911.
Gibala, M., & McGee, S. (2008). Metabolic adaptations to short-term high-intensity interval training:
A little pain for a lot of gain? Exercise and Sport Sciences Reviews, 36(2), 58-63.
Gibala, M., McGee, S., Garnham, A., Howlett, K., Snow, R., & Hargreaves, M. (2009). Brief intense
interval exercise activates AMPK and p38 MAPK signaling and increases the expression of
PGC-1alpha in human skeletal muscle. Journal Of Applied Physiology, 106(3), 929-934.
Gill, J., & Cooper, A. (2008). Physical activity and prevention of type 2 diabetes mellitus. Sports
Medicine, 38(10), 807-824.
Goldberg, J., & King, A. (2007). Physical activity and weight management across the lifespan. Annual
Review Of Public Health, 28, 145-170.
Goodpaster, B., Wolfe, R., & Kelley, D. (2002). Effects of obesity on substrate utilization during
exercise. Obesity Research, 10(7), 575-584.
Goris, A., Westerterp-Plantenga, M., & Westerterp, K. (2000). Undereating and underrecording of
habitual food intake in obese men: selective underreporting of fat intake. American Journal
of Clinical Nutrition, 71(1), 130-134.
Gorostiaga, E., Walter, C., Foster, C., & Hickson, R. (1991). Uniqueness of interval and continuous
training at the same maintained exercise intensity. European Journal Of Applied Physiology
And Occupational Physiology, 63(2), 101-107.

Page 200
Grassi, B. (2006). Oxygen uptake kinetics: Why are they so slow? And what do they tell us? Journal
Of Physiology And Pharmacology, 57 Suppl 10, 53-65.
Greco, A., Mingrone, G., Giancaterini, A., Manco, M., Morroni, M., Cinti, S., . . . Ferrannini, E.
(2002). Insulin resistance in morbid obesity: reversal with intramyocellular fat depletion.
Diabetes, 51(1), 144-151.
Green, J., McLester, J., Crews, T., Wickwire, P., Pritchett, R., & Lomax, R. (2006). RPE association
with lactate and heart rate during high-intensity interval cycling. Medicine And Science In
Sports And Exercise, 38(1), 167-172.
Griffioen-Roose, S., Mars, M., Siebelink, E., Finlayson, G., Tome, D., & De Graaf, C. (2012). Protein
status elicits compensatory changes in food intake and food preferences. American Journal of
Clinical Nutrition, 95(1), 32-38.
Guelfi, K., Jones, T., & Fournier, P. (2007). New insights into managing the risk of hypoglycaemia
associated with intermittent high-intensity exercise in individuals with type 1 diabetes
mellitus: implications for existing guidelines. Sports Medicine, 37(11), 937-946.
Guiraud, T., Nigam, A., Juneau, M., Meyer, P., Gayda, M., & Bosquet, L. (2010). Acute Responses to
High-Intensity Intermittent Exercise in CHD Patients. Medicine And Science In Sports And
Exercise, 43(2), 211-217.
Hall, L., Moran, C., Milne, G., Wilson, J., MacFarlane, N., Forouhi, N., . . . Gill, J. (2010). Fat
oxidation, fitness and skeletal muscle expression of oxidative/lipid metabolism genes in
South Asians: implications for insulin resistance? Plos One, 5(12), e14197-e14197.
Hamilton, M., Hamilton, D., & Zderic, T. (2007). Role of low energy expenditure and sitting in
obesity, metabolic syndrome, type 2 diabetes, and cardiovascular disease. Diabetes, 56(11),
2655-2667.
Hampson, D., St Clair Gibson, A., Lambert, M., & Noakes, T. (2001). The influence of sensory cues
on the perception of exertion during exercise and central regulation of exercise performance.
Sports Medicine, 31(13), 935-952.
Hansen, D., Dendale, P., Van Loon, L., & Meeusen, R. (2010). The impact of training modalities on
the clinical benefits of exercise intervention in patients with cardiovascular disease risk or
type 2 diabetes mellitus. Sports Medicine, 40(11), 921-940.
Hansen, K., Shriver, T., & Schoeller, D. (2005). The effects of exercise on the storage and oxidation
of dietary fat. Sports Medicine, 35(5), 363-373.
Haufe, S., Engeli, S., Budziarek, P., Utz, W., Schulz-Menger, J., Hermsdorf, M., . . . Jordan, J. (2010).
Determinants of Exercise-induced Fat Oxidation in Obese Women and Men. Hormone and
Metabolic Research, 42(3), 215-221.
Hawley, J., & Gibala, M. (2009). Exercise intensity and insulin sensitivity: how low can you go?
Diabetologia, 52(9), 1709-1713.
Hawley, J., & Holloszy, J. (2009). Exercise: it's the real thing! Nutrition Reviews, 67(3), 172-178.
Heini, A., Minghelli, G., Diaz, E., Prentice, A., & Schutz, Y. (1996). Free-living energy expenditure
assessed by two different methods in rural Gambian men. European Journal Of Clinical
Nutrition, 50(5), 284-289.
Helgerud, J., Haydal, K., Wang, E., Karlsen, T., Berg, P., Bjerkaas, M., . . . Hoff, J. (2007). Aerobic
high-intensity intervals improve VO2max more than moderate training. Medicine And
Science In Sports And Exercise, 39(4), 665-671.
Henderson, G., Fattor, J., Horning, M., Faghihnia, N., Johnson, M., Mau, T., . . . Brooks, G. (2007).
Lipolysis and fatty acid metabolism in men and women during the postexercise recovery
period. The Journal Of Physiology, 584(Pt 3), 963-981.
Heyward, V. (2002). Advanced Fitness Assessment and Exercise Prescription (4th ed.). Champaign,
IL: Human Kinetics.
Hill, J., Peters, J., Catenacci, V., & Wyatt, H. (2008). International strategies to address obesity.
Obesity Reviews, 9 (Suppl 1), 41-47.
Hills, A., & Byrne, N. (2004). Physical activity in the management of obesity. Clinics In
Dermatology, 22(4), 315-318.
Hofmann, P., & Tschakert, G. (2011). Special needs to prescribe exercise intensity for scientific
studies. Cardiology Research And Practice, 209302-209312. doi: 10.4061/2011/209302
Hollmann, W. (2001). 42 years ago-development of the concepts of ventilatory and lactate threshold.
Sports Medicine, 31(5), 315-320.
Hollowell, R., Willis, L., Slentz, C., Topping, J., Bhakpar, M., & Kraus, W. (2009). Effects of
exercise training amount on physical activity energy expenditure. Medicine And Science In
Sports And Exercise, 41(8), 1640-1644.

Page 201
Hopkins, M., King, N., & Blundell, J. (2010). Acute and long-term effects of exercise on appetite
control: is there any benefit for weight control? Current Opinion In Clinical Nutrition And
Metabolic Care, 13(6), 635-640.
Horio, T., & Kawamura, Y. (1998). Influence of physical exercise on human preferences for various
taste solutions. Chemical Senses, 23(4), 417-421.
Horowitz, J. (2007). Exercise-induced alterations in muscle lipid metabolism improve insulin
sensitivity. Exercise and Sport Sciences Reviews, 35(4), 192-196.
Horowitz, J., & Klein, S. (2000). Lipid metabolism during endurance exercise. The American Journal
Of Clinical Nutrition, 72(2 Suppl), 558S-563.
Horton, T., Drougas, H., Brachey, A., Reed, G., Peters, J., & Hill, J. (1995). Fat and carbohydrate
overfeeding in humans: different effects on energy storage. The American Journal Of
Clinical Nutrition, 62(1), 19-29.
Howley, E. (2001). Type of activity: resistance, aerobic and leisure versus occupational physical
activity. Medicine And Science In Sports And Exercise, 33(6 Suppl), S364.
Hulens, M., Vansant, G., Lysens, R., Claessens, A., & Muls, E. (2001). Exercise capacity in lean
versus obese women. Scandinavian Journal Of Medicine And Science In Sports 11(5), 305-
309.
Imbeault, P., Saint-Pierre, S., Almeras, N., & Tremblay, A. (1997). Acute effects of exercise on
energy intake and feeding behaviour. The British Journal Of Nutrition, 77(4), 511-521.
Ingul, C., Tjonna, A., Stolen, T., Stoylen, A., & Wisloff, U. (2010). Impaired cardiac function among
obese adolescents: effect of aerobic interval training. Archives of Pediatrics & Adolescent
Medicine, 164(9), 852-859.
Jackson, D., Djafarian, K., Stewart, J., & Speakman, J. (2009). Increased television viewing is
associated with elevated body fatness but not with lower total energy expenditure in children.
The American Journal Of Clinical Nutrition, 89(4), 1031-1036.
Jakicic, J., Clark, K., Coleman, E., Donnelly, J., Foreyt, J., Melanson, E., . . . Volpe, S. (2001).
American College of Sports Medicine position stand. Appropriate intervention strategies for
weight loss and prevention of weight regain for adults. Medicine And Science In Sports And
Exercise, 33(12), 2145-2156.
Jakicic, J., Marcus, B., Gallagher, K., Napolitano, M., & Lang, W. (2003). Effect of exercise duration
and intensity on weight loss in overweight, sedentary women - A randomized trial. Journal
Of The American Medical Association, 290(10), 1323-1330.
Jakicic, J., Wing, R., Butler, B., & Robertson, R. (1995). Prescribing exercise in multiple short bouts
versus one continuous bout - effects on adherence, cardiorespiratory fitness, and weight-loss
in overweight women. International Journal of Obesity, 19(12), 893-901.
Jakicic, J., Wing, R., & Winters-Hart, C. (2002). Relationship of physical activity to eating behaviors
and weight loss in women. Medicine And Science In Sports And Exercise, 34(10), 1653-
1659.
Jehn, M., Schmidt-Trucksoss, A., Schuster, T., Hanssen, H., Halle, M., & Kohler, F. (2010).
Pedometer accuracy in patients with chronic heart failure. International Journal Of Sports
Medicine, 31(3), 186-191.
Jeukendrup, A., Saris, W., & Wagenmakers, A. (1998). Fat metabolism during exercise: a review. Part
I: fatty acid mobilization and muscle metabolism. International Journal Of Sports Medicine,
19(4), 231-244.
Jeukendrup, A., & Wallis, G. (2005). Measurement of substrate oxidation during exercise by means of
gas exchange measurements. International Journal Of Sports Medicine, 26 (Suppl 1), S28-
37.
Johnson, N., Sachinwalla, T., Walton, D., Smith, K., Armstrong, A., Thompson, M., & George, J.
(2009). Aerobic exercise training reduces hepatic and visceral lipids in obese individuals
without weight loss. Hepatology, 50(4), 1105-1112.
Jokisch, E., Coletta, A., & Raynor, H. (2011). Acute energy compensation and macronutrient intake
following exercise in active and inactive males who are normal weight. Appetite, 58(2), 722-
729.
Jones, A., & Carter, H. (2000). The effect of endurance training on parameters of aerobic fitness.
Sports Medicine, 29(6), 373-386.
Joosen, A., Bakker, A., & Westerterp, K. (2005). Metabolic efficiency and energy expenditure during
short-term overfeeding. Physiology & Behavior, 85(5), 593-597.
Joosen, A., & Westerterp, K. (2006). Energy expenditure during overfeeding. Nutrition &
Metabolism, 3, 25-25.

Page 202
Joseph, R., Alonso-Alonso, M., Bond, D., Pascual-Leone, A., & Blackburn, G. (2011). The
neurocognitive connection between physical activity and eating behaviour. Obesity Reviews,
12, 800-812.
Kaminsky, L., & Whaley, M. (1993). Effect of interval-type exercise on exess postexercise oxygen
consumption (EPOC) in obese and normal-weight women. Medicine, Exercise, Nutrition And
Health, 2, 106-111.
Kanaley, J., Mottram, C., Scanlon, P., & Jensen, M. (1995). Fatty acid kinetic responses to running
above or below lactate threshold. Journal Of Applied Physiology, 79(2), 439-447.
Kanaley, J., Weatherup-Dentes, M., Alvarado, C., & Whitehead, G. (2001). Substrate oxidation during
acute exercise and with exercise training in lean and obese women. European Journal Of
Applied Physiology, 85(1-2), 68-73.
Kang, J., Chaloupka, E., Mastrangelo, M., Hoffman, J., Ratamess, N., & O'Connor, E. (2005).
Metabolic and perceptual responses during spinning cycle exercise. Medicine And Science In
Sports And Exercise, 37(5), 853-859.
Katsanos, C. (2004). Lipid-induced insulin resistance in the liver: role of exercise. Sports Medicine,
34(14), 955-965.
Katsanos, C. (2006). Prescribing aerobic exercise for the regulation of postprandial lipid metabolism :
current research and recommendations. Sports Medicine, 36(7), 547-560.
Kilpatrick, M., Robertson, R., Powers, J., Mears, J., & Ferrer, N. (2009). Comparisons of RPE before,
during, and after self-regulated aerobic exercise. Medicine And Science In Sports And
Exercise, 41(3), 682-687.
Kimura, T., Matsuura, R., Arimitsu, T., Yunoki, T., & Yano, T. (2010). Effect of blood volume in
resting muscle on heart rate upward drift during moderately prolonged exercise. Journal of
Physiological Anthropology, 29(6), 205-210.
King, J., Wasse, L., Broom, D., & Stensel, D. (2010). Influence of brisk walking on appetite, energy
intake, and plasma acylated ghrelin. Medicine And Science In Sports And Exercise, 42(3),
485-492.
King, N., & Blundell, J. (1995). High-fat foods overcome the energy expenditure induced by high-
intensity cycling or running. European Journal Of Clinical Nutrition, 49(2), 114-123.
King, N., Burley, V., & Blundell, J. (1994). Exercise-induced suppression of appetite: effects on food
intake and implications for energy balance. European Journal Of Clinical Nutrition, 48(10),
715-724.
King, N., Caudwell, P., Hopkins, M., Byrne, N., Colley, R., Hills, A., . . . Blundell, J. (2007a).
Metabolic and behavioral compensatory responses to exercise interventions: barriers to
weight loss. Obesity, 15(6), 1373-1383.
King, N., Caudwell, P., Hopkins, M., Stubbs, J., Naslund, E., & Blundell, J. (2009). Dual-process
action of exercise on appetite control: increase in orexigenic drive but improvement in meal-
induced satiety. The American Journal Of Clinical Nutrition, 90(4), 921-927.
King, N., Hester, J., & Gately, P. (2007b). The effect of a medium-term activity- and diet-induced
energy deficit on subjective appetite sensations in obese children. International Journal Of
Obesity (2005), 31(2), 334-339.
King, N., Hopkins, M., Caudwell, P., Stubbs, R., & Blundell, J. (2008). Individual variability
following 12 weeks of supervised exercise: identification and characterization of
compensation for exercise-induced weight loss. International Journal Of Obesity (2005),
32(1), 177-184.
King, N., Lluch, A., Stubbs, R., & Blundell, J. (1997a). High dose exercise does not increase hunger
or energy intake in free living males. European Journal Of Clinical Nutrition, 51(7), 478-
483.
King, N., Snell, L., Smith, R., & Blundell, J. (1996). Effects of short-term exercise on appetite
responses in unrestrained females. European Journal Of Clinical Nutrition, 50(10), 663-667.
King, N., Tremblay, A., & Blundell, J. (1997b). Effects of exercise on appetite control: implications
for energy balance. Medicine And Science In Sports And Exercise, 29(8), 1076-1089.
Kissileff, H., Pi-Sunyer, F., Segal, K., Meltzer, S., & Foelsch, P. (1990). Acute effects of exercise on
food intake in obese and nonobese women. The American Journal Of Clinical Nutrition,
52(2), 240-245.
Klausen, B., Toubro, S., Ranneries, C., Rehfeld, J., Holst, J., Christensen, N., & Astrup, A. (1999).
Increased intensity of a single exercise bout stimulates subsequent fat intake. International
Journal Of Obesity And Related Metabolic Disorders, 23(12), 1282-1287.
Klein, D., Mayer, L., Schebendach, J., & Walsh, B. (2007). Physical activity and cortisol in Anorexia
Nervosa. Psychoneuroendocrinology, 32(5), 539-547.

Page 203
Klein, S., Burke, L., Bray, G., Blair, S., Allison, D., Pi-Sunyer, X., . . . Eckel, R. (2004). Clinical
implications of obesity with specific focus on cardiovascular disease: a statement for
professionals from the American Heart Association Council on Nutrition, Physical Activity,
and Metabolism: endorsed by the American College of Cardiology Foundation. Circulation,
110(18), 2952-2967.
Kopelman, P. (2007). Health risks associated with overweight and obesity. Obesity Reviews, 8 (Suppl
1), 13-17.
Koves, T., Ussher, J., Noland, R., Slentz, D., Mosedale, M., Ilkayeva, O., . . . Muoio, D. (2008).
Mitochondrial overload and incomplete fatty acid oxidation contribute to skeletal muscle
insulin resistance. Cell Metabolism, 7(1), 45-56.
Kraemer, R., & Castracane, V. (2007). Exercise and humoral mediators of peripheral energy balance:
ghrelin and adiponectin. Experimental Biology And Medicine, 232(2), 184-194.
Kral, T., & Rolls, B. (2004). Energy density and portion size: their independent and combined effects
on energy intake. Physiology & Behavior, 82(1), 131-138.
Kramer, H., Cao, G., Dugas, L., Luke, A., Cooper, R., & Durazo-Arvizu, R. (2010). Increasing BMI
and waist circumference and prevalence of obesity among adults with Type 2 diabetes: the
National Health and Nutrition Examination Surveys. Journal Of Diabetes And Its
Complications, 24(6), 368-374.
Kriska, A., Edelstein, S., Hamman, R., Otto, A., Bray, G., Mayer-Davis, E., . . . Regensteiner, J.
(2006). Physical activity in individuals at risk for diabetes: Diabetes Prevention Program.
Medicine And Science In Sports And Exercise, 38(5), 826-832.
Kyle, U., Bosaeus, I., De Lorenzo, A., Deurenberg, P., Elia, M., Gomez, J., . . . Pichard, C. (2004).
Bioelectrical impedance analysis - part I: review of principles and methods. Clinical
Nutrition, 23(5), 1226-1243.
Lajoie, C., Laurencelle, L., & Trudeau, F. (2000). Physiological responses to cycling for 60 minutes at
maximal lactate steady state. Canadian Journal of Applied Physiology, 25(4), 250-261.
Lambert, C., & Flynn, M. (2002). Fatigue during high-intensity intermittent exercise: application to
bodybuilding. Sports Medicine, 32(8), 511-522.
Lambert, E., Gibson, A., & Noakes, T. (2005). Complex systems model of fatigue: integrative
homoeostatic control of peripheral physiological systems during exercise in humans. British
Journal of Sports Medicine, 39(1), 52-62.
Laursen, P. (2010). Training for intense exercise performance: high-intensity or high-volume training?
Scandinavian Journal Of Medicine & Science In Sports, 20, 1-10.
Laursen, P., & Jenkins, D. (2002). The scientific basis for high-intensity interval training: optimising
training programmes and maximising performance in highly trained endurance athletes.
Sports Medicine, 32(1), 53-73.
Lazaar, N., Esbri, C., Gandon, N., Ratel, S., Dore, E., & Duche, P. (2004). Modalities of submaximal
exercises on ratings of perceived exertion by young girls: a pilot study. Perceptual And
Motor Skills, 99(3 Pt 2), 1091-1096.
Le, V., Mitiku, T., Hadley, D., Myers, J., & Froelicher, V. (2010). Exercise capacity at submaximal
heart rate and prognosis. International Journal Of Cardiology, 142(2), 145-151.
Lemmens, S., Schoffelen, P., Wouters, L., Born, J., Martens, M., Rutters, F., & Westerterp-Plantenga,
M. (2009). Eating what you like induces a stronger decrease of 'wanting' to eat. Physiology &
Behavior, 98(3), 318-325.
LeMura, L., von Duvillard, S., Andreacci, J., Klebez, J., Chelland, S., & Russo, J. (2000). Lipid and
lipoprotein profiles, cardiovascular fitness, body composition, and diet during and after
resistance, aerobic and combination training in young women. European Journal Of Applied
Physiology, 82(5-6), 451-458.
Lett, B., Grant, V., & Gaborko, L. (1996). A small amount of wheel running facilitates eating in
nondeprived rats. Behavioral Neuroscience, 110(6), 1492-1495.
Levine, J. (2004). Nonexercise activity thermogenesis (NEAT): environment and biology. American
Journal of Physiology-Endocrinology and Metabolism, 286(5), E675-E685.
Levine, J. (2007). Nonexercise activity thermogenesis-liberating the life-force. Journal Of Internal
Medicine, 262(3), 273-287.
Levine, J., Eberhardt, N., & Jensen, M. (1999). Role of nonexercise activity thermogenesis in
resistance to fat gain in humans. Science, 283(5399), 212-214. doi:
10.1126/science.283.5399.212
Levine, J., Melanson, E., Westerterp, K., & Hill, J. (2001). Measurement of the components of
nonexercise activity thermogenesis. American Journal of Physiology-Endocrinology and
Metabolism, 281(4), E670-E675.

Page 204
Levine, J., Vander Weg, M., Hill, J., & Klesges, R. (2006). Non-exercise activity thermogenesis: the
crouching tiger hidden dragon of societal weight gain. Arteriosclerosis, Thrombosis, And
Vascular Biology, 26(4), 729-736.
Little, J., Safdar, A., Wilkin, G., Tarnopolsky, M., & Gibala, M. (2010). A practical model of low-
volume high-intensity interval training induces mitochondrial biogenesis in human skeletal
muscle: potential mechanisms. The Journal Of Physiology, 588(Pt 6), 1011-1022.
Livesey, G., & Elia, M. (1988). Estimation of energy expenditure, net carbohydrate utilization, and net
fat oxidation and synthesis by indirect calorimetry: evaluation of errors with special reference
to the detailed composition of fuels. The American Journal Of Clinical Nutrition, 47(4), 608-
628.
Lluch, A., King, N., & Blundell, J. (1998). Exercise in dietary restrained women: no effect on energy
intake but change in hedonic ratings. European Journal Of Clinical Nutrition, 52(4), 300-
307.
Macrae, H., Noakes, T., & Dennis, S. (1995). Role of Decreased Carbohydrate Oxidation on Slower
Rises in Ventilation with Increasing Exercise Intensity after Training. European Journal Of
Applied Physiology And Occupational Physiology, 71(6), 523-529.
Maffeis, C., Zaffanello, M., Pellegrino, M., Banzato, C., Bogoni, G., Viviani, E., . . . Tata, L. (2005).
Nutrient oxidation during moderately intense exercise in obese prepubertal boys. The Journal
Of Clinical Endocrinology And Metabolism, 90(1), 231-236.
Malatesta, D., Vismara, L., Menegoni, F., Galli, M., Romei, M., & Capodaglio, P. (2009a).
Mechanical external work and recovery at preferred walking speed in obese subjects.
Medicine And Science In Sports And Exercise, 41(2), 426-434.
Malatesta, D., Werlen, C., Bulfaro, S., Cheneviere, X., & Borrani, F. (2009b). Effect of high-intensity
interval exercise on lipid oxidation during postexercise recovery. Medicine And Science In
Sports And Exercise, 41(2), 364-374.
Manders, R., Van Dijk, J., & Van Loon, L. (2010). Low-intensity exercise reduces the prevalence of
hyperglycemia in type 2 diabetes. Medicine And Science In Sports And Exercise, 42(2), 219-
225.
Mandroukas, A., Heller, J., Metaxas, T., Sendelides, T., Riganas, C., Vamvakoudis, E., . . .
Mandroukas, K. (2011). Cardiorespiratory and metabolic alterations during exercise and
passive recovery after three modes of exercise. Journal Of Strength And Conditioning
Research, 25(6), 1664-1672.
Maraki, M., Tsofliou, F., Pitsiladis, Y., Malkova, D., Mutrie, N., & Higgins, S. (2005). Acute effects
of a single exercise class on appetite, energy intake and mood. Is there a time of day effect?
Appetite, 45(3), 272-278.
Marchesini, G., Forlani, G., Cerrelli, F., Manini, R., Natale, S., Baraldi, L., . . . Melchionda, N.
(2004). WHO and ATPIII proposals for the definition of the metabolic syndrome in patients
with Type 2 diabetes. Diabetic Medicine, 21(4), 383-387.
Margaria, R., Oliva, R., Di Prampero, P., & Cerretelli, P. (1969). Energy utilization in intermittent
exercise of supramaximal intensity. Journal Of Applied Physiology 26(6), 752-756.
Martin, C., Heilbronn, L., de Jonge, L., DeLany, J., Volaufova, J., Anton, S., . . . Ravussin, E. (2007).
Effect of calorie restriction on resting metabolic rate and spontaneous physical activity.
Obesity, 15(12), 2964-2973.
Martins, C., Morgan, L., Bloom, S., & Robertson, M. (2007). Effects of exercise on gut peptides,
energy intake and appetite. The Journal Of Endocrinology, 193(2), 251-258.
Martins, C., Morgan, L., & Truby, H. (2008a). A review of the effects of exercise on appetite
regulation: an obesity perspective. International Journal Of Obesity (2005), 32(9), 1337-
1347.
Martins, C., Robertson, M., & Morgan, L. (2008b). Effects of exercise and restrained eating behaviour
on appetite control. The Proceedings Of The Nutrition Society, 67(1), 28-41.
McArdle, W., Katch, F., & Katch, V. (2001). Exercise Physiology - Energy, Nutrition and Human
Performance (5th ed.). Baltimore, MD: Lippincott Williams & Wilkins.
McCartney, N., Spriet, L., Heigenhauser, G., Kowalchuk, J., Sutton, J., & Jones, N. (1986). Muscle
power and metabolism in maximal intermittent exercise. Journal Of Applied Physiology,
60(4), 1164-1169.
McKay, J., Wright, A., Lowry, R., Steele, K., Ryde, G., & Mutrie, N. (2009). Walking on
prescription: the utility of a pedometer pack for increasing physical activity in primary care.
Patient Education And Counseling, 76(1), 71-76.
McLean, T. (2008). Obesity epidemic puts Australians above Americans Retrieved December 21,
2008, from http://baker.edu.au/News.aspx?newsID=91&TopicID=654

Page 205
Mela, D. (2001). Determinants of food choice: relationships with obesity and weight control. Obesity
Research, 9 (Suppl 4), 249S-255S.
Mela, D. (2006). Eating for pleasure or just wanting to eat? Reconsidering sensory hedonic responses
as a driver of obesity. Appetite, 47(1), 10-17.
Melanson, E., Donahoo, W., Grunwald, G., & Schwartz, R. (2007). Changes in 24-h substrate
oxidation in older and younger men in response to exercise. Journal Of Applied Physiology,
103(5), 1576-1582.
Melanson, E., Gozansky, W., Barry, D., Maclean, P., Grunwald, G., & Hill, J. (2009a). When energy
balance is maintained, exercise does not induce negative fat balance in lean sedentary, obese
sedentary, or lean endurance-trained individuals. Journal Of Applied Physiology, 107(6),
1847-1856.
Melanson, E., MacLean, P., & Hill, J. (2009b). Exercise improves fat metabolism in muscle but does
not increase 24-h fat oxidation. Exercise And Sport Sciences Reviews, 37(2), 93-101.
Melanson, E., Sharp, T., Seagle, H., Horton, T., Donahoo, W., Grunwald, G., . . . Hill, J. (2002).
Effect of exercise intensity on 24-h energy expenditure and nutrient oxidation. Journal Of
Applied Physiology, 92(3), 1045-1052.
Messonnier, L., Freund, H., Denis, C., Feasson, L., & Lacour, J. (2006). Effects of training on lactate
kinetics parameters and their influence on short high-intensity exercise performance.
International Journal of Sports Medicine, 27(1), 60-66.
Meyer, T., Folz, C., Rosenberger, F., & Kindermann, W. (2009). The reliability of fat. Scandinavian
Journal Of Medicine & Science In Sports, 19(2), 213-221.
Meyer, T., Gassler, N., & Kindermann, W. (2007). Determination of "Fatmax"with 1 h cycling
protocols of constant load. Applied Physiology, Nutrition, And Metabolism, 32(2), 249-256.
Midgley, A., & Mc Naughton, L. (2006). Time at or near VO2max during continuous and intermittent
running. A review with special reference to considerations for the optimisation of training
protocols to elicit the longest time at or near VO2max. The Journal Of Sports Medicine And
Physical Fitness, 46(1), 1-14.
Mikus, C., Earnest, C., Blair, S., & Church, T. (2009). Heart rate and exercise intensity during
training: observations from the DREW Study. British Journal Of Sports Medicine, 43(10),
750-755.
Miladi, I., Temfemo, A., Mandengue, S., & Ahmaidi, S. (2011). Effect of recovery mode on exercise
time to exhaustion, cardiorespiratory responses, and blood lactate after prior, intermittent
supramaximal exercise. Journal Of Strength And Conditioning Research, 25(1), 205-210.
Minehira, K., Bettschart, V., Vidal, H., Vega, N., Di Vetta, V., Rey, V., . . . Tappy, L. (2003). Effect
of carbohydrate overfeeding on whole body and adipose tissue metabolism in humans.
Obesity Research, 11(9), 1096-1103.
Mogensen, M., Vind, B., Holund, K., Beck-Nielsen, H., & Sahlin, K. (2009). Maximal lipid oxidation
in patients with type 2 diabetes is normal and shows an adequate increase in response to
aerobic training. Diabetes, Obesity & Metabolism, 11(9), 874-883.
Moon, J., Tobkin, S., Roberts, M., Dalbo, V., Kerksick, C., Bemben, M., . . . Stout, J. (2008). Total
body water estimations in healthy men and women using bioimpedance spectroscopy: a
deuterium oxide comparison. Nutrition & Metabolism, 5, 7-7.
Moreau, K., Whaley, M., Ross, J., & Kaminsky, L. (1999). The effects of blood lactate concentration
on perception of effort during graded and steady state treadmill exercise. International
Journal Of Sports Medicine, 20(5), 269-274.
Moro, C., Bajpeyi, S., & Smith, S. (2008). Determinants of intramyocellular triglyceride turnover:
implications for insulin sensitivity. American Journal Of Physiology. Endocrinology And
Metabolism, 294(2), E203-213.
Mujika, I. (2010). Intense training: the key to optimal performance before and during the taper.
Scandinavian Journal of Medicine & Science in Sports, 20, 24-31.
Muniyappa, R., Lee, S., Chen, H., & Quon, M. (2008). Current approaches for assessing insulin
sensitivity and resistance in vivo: advantages, limitations, and appropriate usage. American
Journal Of Physiology. Endocrinology And Metabolism, 294(1), E15-E26.
Murias, J., Kowalchuk, J., & Paterson, D. (2010). Time course and mechanisms of adaptations in
cardiorespiratory fitness with endurance training in older and young men. Journal Of Applied
Physiology, 108(3), 621-627.
Murphy, M., Blair, S., & Murtagh, E. (2009). Accumulated versus continuous exercise for health
benefit: A review of empirical studies. Sports Medicine, 39(1), 29-43.

Page 206
Musa, D., Adeniran, S., Dikko, A., & Sayers, S. (2009). The effect of a high-intensity interval training
program on high-density lipoprotein cholesterol in young men. Journal Of Strength And
Conditioning Research, 23(2), 587-592.
Nasser, J. (2001). Taste, food intake and obesity. Obesity Reviews, 2(4), 213-218.
Newsom, S., Schenk, S., Thomas, K., Harber, M., Knuth, N., Goldenberg, N., & Horowitz, J. (2010).
Energy deficit after exercise augments lipid mobilization but does not contribute to the
exercise-induced increase in insulin sensitivity. Journal Of Applied Physiology, 108(3), 554-
560.
Norton, K., Norton, L., & Sadgrove, D. (2010). Position statement on physical activity and exercise
intensity terminology. Journal Of Science And Medicine In Sport, 13(5), 496-502.
Nybo, L., Sundstrup, E., Jakobsen, M., Mohr, M., Hornstrup, T., Simonsen, L., . . . Krustrup, P.
(2010). High-intensity training versus traditional exercise interventions for promoting health.
Medicine And Science In Sports And Exercise 42(10), 1951-1958.
O'Donovan, G., Kearney, E., Nevill, A., Woolf-May, K., & Bird, S. (2005). The effects of 24 weeks
of moderate- or high-intensity exercise on insulin resistance. European Journal Of Applied
Physiology, 95(5-6), 522-528.
Oliveira, S., Simres, H., Moreira, S., Lima, R., Almeida, J., Ribeiro, F., . . . Campbell, C. (2010).
Physiological responses to a tap dance choreography: comparisons with graded exercise test
and prescription recommendations. Journal Of Strength And Conditioning Research, 24(7),
1954-1959.
Pannacciulli, N., Cantatore, F., Minenna, A., Bellacicco, M., Giorgino, R., & De Pergola, G. (2001).
C-reactive protein is independently associated with total body fat, central fat, and insulin
resistance in adult women. International Journal Of Obesity And Related Metabolic
Disorders, 25(10), 1416-1420.
Pannacciulli, N., Salbe, A., Ortega, E., Venti, C., Bogardus, C., & Krakoff, J. (2007). The 24-h
carbohydrate oxidation rate in a human respiratory chamber predicts ad libitum food intake.
The American Journal Of Clinical Nutrition, 86(3), 625-632.
Perez-Martin, A., Dumortier, M., Raynaud, E., Brun, J., Fedou, C., Bringer, J., & Mercier, J. (2001).
Balance of substrate oxidation during submaximal exercise in lean and obese people.
Diabetes & Metabolism, 27(4 Pt 1), 466-474.
Perkins, G., Owen, A., Kearney, E., & Swaine, I. (2009). Biomarkers of cardiovascular disease risk in
40-65-year-old men performing recommended levels of physical activity, compared with
sedentary men. British Journal Of Sports Medicine, 43(2), 136-141.
Perry, C., Heigenhauser, G., Bonen, A., & Spriet, L. (2008). High-intensity aerobic interval training
increases fat and carbohydrate metabolic capacities in human skeletal muscle. Applied
Physiology, Nutrition, And Metabolism, 33(6), 1112-1123.
Phillips, D., Caddy, S., Ilic, V., Fielding, B., Frayn, K., Borthwick, A., & Taylor, R. (1996).
Intramuscular triglyceride and muscle insulin sensitivity: evidence for a relationship in
nondiabetic subjects. Metabolism: Clinical And Experimental, 45(8), 947-950.
Phillips, L., & Prins, J. (2008). The link between abdominal obesity and the metabolic syndrome.
Current Hypertension Reports, 10(2), 156-164.
Pi-Sunyer, F. (2002). The obesity epidemic: pathophysiology and consequences of obesity. Obesity
Research, 10(Suppl 2), 97S-104s.
Pillard, F., Van Wymelbeke, V., Garrigue, E., Moro, C., Crampes, F., Guilland, J., . . . Brondel, L.
(2010). Lipid oxidation in overweight men after exercise and food intake. Metabolism:
Clinical And Experimental, 59(2), 267-274.
Pires, F., Lima-Silva, A., Bertuzzi, R., Casarini, D., Kiss, M., Lambert, M., & Noakes, T. (2011). The
influence of peripheral afferent signals on the rating of perceived exertion and time to
exhaustion during exercise at different intensities. Psychophysiology, 48(9), 1284-1290.
Poehlman, E. (1989). A review: exercise and its influence on resting energy metabolism in man.
Medicine And Science In Sports And Exercise, 21(5), 515-525.
Pomerleau, M., Imbeault, P., Parker, T., & Doucet, E. (2004). Effects of exercise intensity on food
intake and appetite in women. The American Journal Of Clinical Nutrition, 80(5), 1230-
1236.
Poppitt, S., McCormack, D., & Buffenstein, R. (1998). Short-term effects of macronutrient preloads
on appetite and energy intake in lean women. Physiology & Behavior, 64(3), 279-285.
Potteiger, J., Kirk, E., Jacobsen, D., & Donnelly, J. (2008). Changes in resting metabolic rate and
substrate oxidation after 16 months of exercise training in overweight adults. International
Journal Of Sport Nutrition And Exercise Metabolism, 18(1), 79-95.

Page 207
Prentice, A. (2007). Are defects in energy expenditure involved in the causation of obesity? Obesity
Reviews, 8 (Suppl 1), 89-91.
Price, M., & Halabi, K. (2005). The effects of work-rest duration on intermittent exercise and
subsequent performance. Journal Of Sports Sciences, 23(8), 835-842.
Psycharakis, S. (2011). A longitudinal analysis on the validity and reliability of ratings of perceived
exertion for elite swimmers. Journal Of Strength And Conditioning Research, 25(2), 420-
426.
Raben, A., Agerholm-Larsen, L., Flint, A., Holst, J., & Astrup, A. (2003). Meals with similar energy
densities but rich in protein, fat, carbohydrate, or alcohol have different effects on energy
expenditure and substrate metabolism but not on appetite and energy intake. The American
Journal Of Clinical Nutrition, 77(1), 91-100.
Ratel, S., Duche, P., & Williams, C. (2006). Muscle fatigue during high-intensity exercise in children.
Sports Medicine, 36(12), 1031-1065.
Ravussin, E. (1995). Metabolic differences and the development of obesity. Metabolism, 44(Suppl 3),
12-14.
Reger, W., Allison, T., & Kurucz, R. (1984). Exercise, post-exercise metabolic rate and appetite.
Sport, Health, And Nutrition, 2, 117-123.
Renault, K., Norgaard, K., Andreasen, K., Secher, N., & Nilas, L. (2010). Physical activity during
pregnancy in obese and normal-weight women as assessed by pedometer. Acta Obstetricia Et
Gynecologica Scandinavica, 89(7), 956-961.
Richards, J., Johnson, T., Kuzma, J., Lonac, M., Schweder, M., Voyles, W., & Bell, C. (2010). Short-
term sprint interval training increases insulin sensitivity in healthy adults but does not affect
the thermogenic response to beta-adrenergic stimulation. The Journal Of Physiology, 588(Pt
15), 2961-2972.
Riedl, I., Yoshioka, M., Nishida, Y., Tobina, T., Paradis, R., Shono, N., . . . St-Amand, J. (2010).
Regulation of skeletal muscle transcriptome in elderly men after 6 weeks of endurance
training at lactate threshold intensity. Experimental Gerontology, 45(11), 896-903.
Rimbert, V., Vidal, H., Duche, P., Debard, C., Giraudet, C., Boirie, Y., . . . Morio, B. (2009). Rapid
down-regulation of mitochondrial fat metabolism in human muscle after training cessation is
dissociated from changes in insulin sensitivity. FEBS Letters, 583(17), 2927-2933.
Robertson, R. (1982). Central signals of perceived exertion during dynamic exercise. Medicine And
Science In Sports And Exercise, 14(5), 390-396.
Robertson, R. (2004). Perceived Exertion for Practitioners. Champaign IL: Human Kinetics.
Roffey, D., Byrne, N., & Hills, A. (2007a). Effect of stage duration on physiological variables
commonly used to determine maximum aerobic performance during cycle ergometry.
Journal Of Sports Sciences, 25(12), 1325-1335.
Roffey, D., Byrne, N., & Hills, A. (2007b). Exercise intensity, exercise training and energy
metabolism in overweight and obese males. (Doctoral dissertation). Retrieved from
http://eprints.qut.edu.au/17823/1/Darren_Roffey_Thesis.pdf
Rogge, M. (2009). The role of impaired mitochondrial lipid oxidation in obesity. Biological Research
For Nursing, 10(4), 356-373.
Rolls, B. (2009). The relationship between dietary energy density and energy intake. Physiology &
Behavior, 97(5), 609-615.
Rolls, E. (2007). Understanding the mechanisms of food intake and obesity. Obesity Reviews, 8
(Suppl 1), 67-72.
Romijn, J., Coyle, E., Sidossis, L., Gastaldelli, A., Horowitz, J., Endert, E., & Wolfe, R. (1993a).
Regulation of endogenous fat and carbohydrate metabolism in relation to exercise intensity
and duration. The American Journal Of Physiology, 265(3 Pt 1), E380-391.
Romijn, J., Coyle, E., Sidossis, L., Rosenblatt, J., & Wolfe, R. (2000). Substrate metabolism during
different exercise intensities in endurance-trained women. Journal Of Applied Physiology
88(5), 1707-1714.
Romijn, J., Coyle, E., Sidossis, L., Zhang, X., & Wolfe, R. (1995). Relationship between fatty acid
delivery and fatty acid oxidation during strenuous exercise. Journal Of Applied Physiology,
79(6), 1939-1945.
Romijn, J., Klein, S., Coyle, E., Sidossis, L., & Wolfe, R. (1993b). Strenuous endurance training
increases lipolysis and triglyceride-fatty acid cycling at rest. Journal Of Applied Physiology,
75(1), 108-113.
Rosenkilde, M., Nordby, P., Nielsen, L., Stallknecht, B., & Helge, J. (2010). Fat oxidation at rest
predicts peak fat oxidation during exercise and metabolic phenotype in overweight men.
International Journal Of Obesity (2005), 34(5), 871-877.
Page 208
Ross, R., Dagnone, D., Jones, P., Smith, H., Paddags, A., Hudson, R., & Janssen, I. (2000). Reduction
in obesity and related comorbid conditions after diet-induced weight loss or exercise-induced
weight loss in men. A randomized, controlled trial. Annals Of Internal Medicine, 133(2), 92-
103.
Ross, R., & Janssen, I. (2001). Physical activity, total and regional obesity: dose-response
considerations. Medicine And Science In Sports And Exercise, 33(6), S521-S527.
Ross, R., Janssen, I., Dawson, J., Kungl, A., Kuk, J., Wong, S., . . . Hudson, R. (2004). Exercise-
induced reduction in obesity and insulin resistance in women: a randomized controlled trial.
Obesity Research, 12(5), 789-798.
Rozenek, R., Funato, K., Kubo, J., Hoshikawa, M., & Matsuo, A. (2007). Physiological responses to
interval training sessions at velocities associated with VO2max. Journal Of Strength And
Conditioning Research, 21(1), 188-192.
Salvadego, D., Lazzer, S., Busti, C., Galli, R., Agosti, F., Lafortuna, C., . . . Grassi, B. (2010). Gas
exchange kinetics in obese adolescents. Inferences on exercise tolerance and prescription.
American Journal Of Physiology. Regulatory, Integrative And Comparative Physiology,
299(5), R1298-R1305.
Saris, W., Blair, S., Van Baak, M., Eaton, S., Davies, P., Di Pietro, L., . . . Wyatt, H. (2003). How
much physical activity is enough to prevent unhealthy weight gain? Outcome of the IASO 1st
Stock Conference and consensus statement. Obesity Reviews, 4(2), 101-114.
Saris, W., & Schrauwen, P. (2004). Substrate oxidation differences between high- and low-intensity
exercise are compensated over 24 hours in obese men. International Journal Of Obesity And
Related Metabolic Disorders, 28(6), 759-765.
Sartor, F., De Morree, H., Matschke, V., Marcora, S., Milousis, A., Thom, J., & Kubis, H. (2010).
High-intensity exercise and carbohydrate-reduced energy-restricted diet in obese individuals.
European Journal Of Applied Physiology, 110(5), 893-903.
Schenk, S., Harber, M., Shrivastava, C., Burant, C., & Horowitz, J. (2009). Improved insulin
sensitivity after weight loss and exercise training is mediated by a reduction in plasma fatty
acid mobilization, not enhanced oxidative capacity. The Journal Of Physiology, 587(Pt 20),
4949-4961.
Schjerve, I., Tyldum, G., Tjonna, A., Stolen, T., Loennechen, J., Hansen, H., . . . Wisloff, U. (2008).
Both aerobic endurance and strength training programmes improve cardiovascular health in
obese adults. Clinical Science, 115(9), 283-293.
Schneider, K., Spring, B., & Pagoto, S. (2009). Exercise and energy intake in overweight, sedentary
individuals. Eating Behaviors, 10(1), 29-35.
Schutz, Y., Tremblay, A., Weinsier, R., & Nelson, K. (1992). Role of fat oxidation in the long-term
stabilization of body weight in obese women. The American Journal Of Clinical Nutrition,
55(3), 670-674.
Scott, C. (2005). Contribution of anaerobic energy expenditure to whole body thermogenesis.
Nutrition & Metabolism, 2(1), 14-14.
Seagle, H., Strain, G., Makris, A., & Reeves, R. (2009). Position of the American Dietetic
Association: weight management. Journal Of The American Dietetic Association, 109(2),
330-346.
Seidell, J., Muller, D., Sorkin, J., & Andres, R. (1992). Fasting respiratory exchange ratio and resting
metabolic rate as predictors of weight gain: the Baltimore Longitudinal Study on Aging.
International Journal Of Obesity And Related Metabolic Disorders, 16(9), 667-674.
Seiler, S., Joranson, K., Olesen, B., & Hetlelid, K. (2011). Adaptations to aerobic interval training:
interactive effects of exercise intensity and total work duration. Scandinavian Journal Of
Medicine And Science In Sports. doi: 10.1111/j.1600-0838.2011.01351.x
Seiler, S., & Sjursen, J. (2004). Effect of work duration on physiological and rating scale of perceived
exertion responses during self-paced interval training. Scandinavian Journal Of Medicine &
Science In Sports, 14(5), 318-325.
Shulman, G. (2000). Cellular mechanisms of insulin resistance. The Journal Of Clinical Investigation,
106(2), 171-176.
Shultz, S., Anner, J., & Hills, A. (2009). Paediatric obesity, physical activity and the musculoskeletal
system. Obesity Reviews, 10(5), 576-582.
Sirard, J., Melanson, E., Li, L., & Freedson, P. (2000). Field evaluation of the Computer Science and
Applications, Inc. physical activity monitor. Medicine And Science In Sports And Exercise,
32(3), 695-700.
Sisson, S., & Katzmarzyk, P. (2008). International prevalence of physical activity in youth and adults.
Obesity Reviews, 9(6), 606-614.

Page 209
Sjoberg, N., Brinkworth, G., Wycherley, T., Noakes, M., & Saint, D. (2011). Moderate weight loss
improves heart rate variability in overweight and obese adults with type 2 diabetes. Journal
Of Applied Physiology, 110(4), 1060-1064.
Slentz, C., Houmard, J., Johnson, J., Bateman, L., Tanner, C., McCartney, J., . . . Kraus, W. (2007).
Inactivity, exercise training and detraining, and plasma lipoproteins. STRRIDE: a
randomized, controlled study of exercise intensity and amount. Journal Of Applied
Physiology, 103(2), 432-442.
Smith, S. (2009). Beyond the bout--new perspectives on exercise and fat oxidation. Exercise And
Sport Sciences Reviews, 37(2), 58-59.
Snyder, K., Donnelly, J., Jabobsen, D., Hertner, G., & Jakicic, J. (1997). The effects of long-term,
moderate intensity, intermittent exercise on aerobic capacity, body composition, blood lipids,
insulin and glucose in overweight females. International Journal Of Obesity And Related
Metabolic Disorders, 21(12), 1180-1189.
Solomon, T., Sistrun, S., Krishnan, R., Del Aguila, L., Marchetti, C., O'Carroll, S., . . . Kirwan, J.
(2008). Exercise and diet enhance fat oxidation and reduce insulin resistance in older obese
adults. Journal Of Applied Physiology, 104(5), 1313-1319.
Sorensen, L., Moller, P., Flint, A., Martens, M., & Raben, A. (2003). Effect of sensory perception of
foods on appetite and food intake: a review of studies on humans. International Journal Of
Obesity And Related Metabolic Disorders, 27(10), 1152-1166.
Sparks, L., Ukropcova, B., Smith, J., Pasarica, M., Hymel, D., Xie, H., . . . Smith, S. (2009). Relation
of adipose tissue to metabolic flexibility. Diabetes Research And Clinical Practice, 83(1),
32-43.
Speakman, J., & Selman, C. (2003). Physical activity and resting metabolic rate. The Proceedings Of
The Nutrition Society, 62(3), 621-634.
St Clair Gibson, A., Baden, D., Lambert, M., Lambert, E., Harley, Y., Hampson, D., . . . Noakes, T.
(2003). The conscious perception of the sensation of fatigue. Sports Medicine, 33(3), 167-
176.
Steed, J., Gaesser, G., & Weltman, A. (1994). Rating of perceived exertion and blood lactate
concentration during submaximal running. Medicine And Science In Sports And Exercise,
26(6), 797-803.
Steffan, H., Elliott, W., Miller, W., & Fernhall, B. (1999). Substrate utilization during submaximal
exercise in obese and normal-weight women. European Journal Of Applied Physiology And
Occupational Physiology, 80(3), 233-239.
Stergioulas, A., & Filippou, D. (2006). Effects of physical conditioning on lipids and arachidonic acid
metabolites in untrained boys: a longitudinal study. Applied Physiology, Nutrition, And
Metabolism, 31(4), 432-441.
Stisen, A., Stougaard, O., Langfort, J., Helge, J., Sahlin, K., & Madsen, K. (2006). Maximal fat
oxidation rates in endurance trained and untrained women. European Journal Of Applied
Physiology, 98(5), 497-506.
Stoudemire, N., Wideman, L., Pass, K., McGinnes, C., Gaesser, G., & Weltman, A. (1996). The
validity of regulating blood lactate concentration during running by ratings of perceived
exertion. Medicine And Science In Sports And Exercise, 28(4), 490-495.
Stubbs, R., Hughes, D., Johnstone, A., Rowley, E., Reid, C., Elia, M., . . . Blundell, J. (2000). The use
of visual analogue scales to assess motivation to eat in human subjects: a review of their
reliability and validity with an evaluation of new hand-held computerized systems for
temporal tracking of appetite ratings. The British Journal Of Nutrition, 84(4), 405-415.
Stubbs, R., Murgatroyd, P., Goldberg, G., & Prentice, A. (1993). Carbohydrate balance and the
regulation of day-to-day food intake in humans. The American Journal Of Clinical Nutrition,
57(6), 897-903.
Stubbs, R., Sepp, A., Hughes, D., Johnstone, A., Horgan, G., King, N., & Blundell, J. (2002a). The
effect of graded levels of exercise on energy intake and balance in free-living men,
consuming their normal diet. European Journal Of Clinical Nutrition, 56(2), 129-140.
Stubbs, R., Sepp, A., Hughes, D., Johnstone, A., King, N., Horgan, G., & Blundell, J. (2002b). The
effect of graded levels of exercise on energy intake and balance in free-living women.
International Journal Of Obesity And Related Metabolic Disorders, 26(6), 866-869.
Sugden, J., Sniehotta, F., Donnan, P., Boyle, P., Johnston, D., & McMurdo, M. (2008). The feasibility
of using pedometers and brief advice to increase activity in sedentary older women-a pilot
study. BMC Health Services Research, 8, 169-169.
Swain, D., & Leutholtz, B. (1997). Heart rate reserve is equivalent to %VO2 reserve, not to %VO2max.
Medicine And Science In Sports And Exercise, 29(3), 410-414.

Page 210
Swinburn, B., & Ravussin, E. (1993). Energy balance or fat balance? The American Journal Of
Clinical Nutrition, 57(Suppl 5), 766S-770S.
Tabata, I., Irisawa, K., Kouzaki, M., Nishimura, K., Ogita, F., & Miyachi, M. (1997). Metabolic
profile of high intensity intermittent exercises. Medicine And Science In Sports And Exercise,
29(3), 390-395.
Tabata, I., Nishimura, K., Kouzaki, M., Hirai, Y., Ogita, F., Miyachi, M., & Yamamoto, K. (1996).
Effects of moderate-intensity endurance and high-intensity intermittent training on anaerobic
capacity and VO2max. Medicine And Science In Sports And Exercise, 28(10), 1327-1330.
Talanian, J., Galloway, S., Heigenhauser, G., Bonen, A., & Spriet, L. (2007). Two weeks of high-
intensity aerobic interval training increases the capacity for fat oxidation during exercise in
women. Journal Of Applied Physiology, 102(4), 1439-1447.
Taylor, A., & Oliver, A. (2009). Acute effects of brisk walking on urges to eat chocolate, affect, and
responses to a stressor and chocolate cue: An experimental study. Appetite, 52(1), 155-160.
Taylor, H., Buskirk, E., & Henschel, A. (1955). Maximal oxygen intake as an objective measure of
cardio-respiratory performance. Journal Of Applied Physiology, 8(1), 73-80.
Thivel, D., Isacco, L., Rousset, S., Boirie, Y., Morio, B., & Duche, P. (2011). Intensive exercise: a
remedy for childhood obesity? Physiology & Behavior, 102(2), 132-136.
Thompson, D., & West, K. (1998). Ratings of perceived exertion to determine intensity during
outdoor running. Canadian Journal Of Applied Physiology 23(1), 56-65.
Tomlin, D., & Wenger, H. (2001). The relationship between aerobic fitness and recovery from high
intensity intermittent exercise. Sports Medicine, 31(1), 1-11.
Tonna, A., Lee, S., Rognmo, O., Stolen, T., Bye, A., Haram, P., . . . Wisloff, U. (2008). Aerobic
interval training versus continuous moderate exercise as a treatment for the metabolic
syndrome: a pilot study. Circulation, 118(4), 346-354.
Trapp, E., Chisholm, D., & Boutcher, S. (2007). Metabolic response of trained and untrained women
during high-intensity intermittent cycle exercise. American Journal Of Physiology.
Regulatory, Integrative And Comparative Physiology, 293(6), R2370-2375.
Trapp, E., Chisholm, D., Freund, J., & Boutcher, S. (2008). The effects of high-intensity intermittent
exercise training on fat loss and fasting insulin levels of young women. International Journal
Of Obesity, 32(4), 684-691.
Tremblay, A., Almeras, N., Boer, J., Kranenbarg, E., & Despres, J. (1994a). Diet composition and
postexercise energy balance. The American Journal Of Clinical Nutrition, 59(5), 975-979.
Tremblay, A., Plourde, G., Despres, J., & Bouchard, C. (1989). Impact of dietary fat content and fat
oxidation on energy intake in humans. The American Journal Of Clinical Nutrition, 49(5),
799-805.
Tremblay, A., Simoneau, J., & Bouchard, C. (1994b). Impact of exercise intensity on body fatness and
skeletal muscle metabolism. Metabolism: Clinical And Experimental, 43(7), 814-818.
Treuth, M., Hunter, G., & Williams, M. (1996). Effects of exercise intensity on 24-h energy
expenditure and substrate oxidation. Medicine And Science In Sports And Exercise, 28(9),
1138-1143.
Tsofliou, F., Pitsiladis, Y., Malkova, D., Wallace, A., & Lean, M. (2003). Moderate physical activity
permits acute coupling between serum leptin and appetite-satiety measures in obese women.
International Journal Of Obesity and Related Metabolic Disorders, 27(11), 1332-1339.
Tucker, R. (2009). The anticipatory regulation of performance: the physiological basis for pacing
strategies and the development of a perception-based model for exercise performance. British
Journal of Sports Medicine, 43(6), 392-400.
Tudor-Locke, C. (2002). Taking steps toward increased physical activity: Using pedometers to
measure and motivate. President's Council On Physical Fitness And Sports Retrieved from
https://www.presidentschallenge.org/informed/digest/docs/200206digest.pdf.
Tudor-Locke, C., & Lutes, L. (2009). Why do pedometers work?: a reflection upon the factors related
to successfully increasing physical activity. Sports Medicine, 39(12), 981-993.
Tudor-Locke, C., Williams, J., Reis, J., & Pluto, D. (2002). Utility of pedometers for assessing
physical activity: convergent validity. Sports Medicine, 32(12), 795-808.
Turner, J., Markovitch, D., Betts, J., & Thompson, D. (2010). Nonprescribed physical activity energy
expenditure is maintained with structured exercise and implicates a compensatory increase in
energy intake. The American Journal Of Clinical Nutrition, 92(5), 1009-1016.
Ueda, S., Yoshikawa, T., Katsura, Y., Usui, T., & Fujimoto, S. (2009a). Comparable effects of
moderate intensity exercise on changes in anorectic gut hormone levels and energy intake to
high intensity exercise. The Journal Of Endocrinology, 203(3), 357-364.

Page 211
Ueda, S., Yoshikawa, T., Katsura, Y., Usui, T., Nakao, H., & Fujimoto, S. (2009b). Changes in gut
hormone levels and negative energy balance during aerobic exercise in obese young males.
The Journal Of Endocrinology, 201(1), 151-159.
USDA & HHS. (2008). Dietary guidelines for Americans Retrieved August 11, 2009, from
http://www.health.gov/dietaryguidelines/dga2005/document/html/chapter4.htm
Van Aggel-Leijssen, D., Saris, W., Wagenmakers, A., Senden, J., & Van Baak, M. (2002). Effect of
exercise training at different intensities on fat metabolism of obese men. Journal of Applied
Physiology, 92(3), 1300-1309.
Van Der Heijden, G., Sauer, P., & Sunehag, A. (2010). Twelve weeks of moderate aerobic exercise
without dietary intervention or weight loss does not affect 24-h energy expenditure in lean
and obese adolescents. The American Journal Of Clinical Nutrition, 91(3), 589-596.
Veldhorst, M., Westerterp, K., Van Vught, A., & Westerterp-Plantenga, M. (2010). Presence or
absence of carbohydrates and the proportion of fat in a high-protein diet affect appetite
suppression but not energy expenditure in normal-weight human subjects fed in energy
balance. The British Journal Of Nutrition, 104(9), 1395-1405.
Venables, M., & Jeukendrup, A. (2008). Endurance training and obesity: effect on substrate
metabolism and insulin sensitivity. Medicine And Science In Sports And Exercise, 40(3),
495-502.
Verger, P., Lanteaume, M., & Louis-Sylvestre, J. (1992). Human intake and choice of foods at
intervals after exercise. Appetite, 18(2), 93-99.
Verger, P., Lanteaume, M., & Louis-Sylvestre, J. (1994). Free food choice after acute exercise in men.
Appetite, 22(2), 159-164.
Visich, P., Goss, F., Gordon, P., Robertson, R., Warty, V., Denys, B., & Metz, K. (1996). Effects of
exercise with varying energy expenditure on high-density lipoprotein-cholesterol. European
Journal Of Applied Physiology And Occupational Physiology, 72(3), 242-248.
Volek, Vanheest, J., & Forsythe, C. (2005). Diet and exercise for weight loss: a review of current
issues. Sports Medicine, 35(1), 1-9.
Wabel, P., Chamney, P., Moissl, U., & Jirka, T. (2009). Importance of whole-body bioimpedance
spectroscopy for the management of fluid balance. Blood Purification, 27(1), 75-80.
Wakefield, B., & Glaister, M. (2009). Influence of work-interval intensity and duration on time spent
at a high percentage of VO2max during intermittent supramaximal exercise. Journal Of
Strength And Conditioning Research, 23(9), 2548-2554.
Wallace, L., Slattery, K., & Coutts, A. (2009). The ecological validity and application of the session-
RPE method for quantifying training loads in swimming. Journal Of Strength And
Conditioning Research, 23(1), 33-38.
Wang, L., Psilander, N., Tonkonogi, M., Ding, S., & Sahlin, K. (2009). Similar expression of
oxidative genes after interval and continuous exercise. Medicine And Science In Sports And
Exercise, 41(12), 2136-2144.
Wardle, J. (2007). Eating behaviour and obesity. Obesity Reviews, 8 (Suppl 1), 73-75.
Wasserman, K., Hansen, J., Sue, D., Stringer, W., & Whipp, B. (2005). Principles of Exercise Testing
and Interpretation (4th ed.). Baltimore, MD: Lippincott Williams & Wilkins
Wearing, S., Hennig, E., Byrne, N., Steele, J., & Hills, A. (2006). Musculoskeletal disorders
associated with obesity: a biomechanical perspective. Obesity Reviews, 7(3), 239-250.
Weir, J. (1990). New methods for calculating metabolic rate with special reference to protein
metabolism. 1949. Nutrition, 6(3), 213-221.
Weltman, A. (1995). The Blood Lactate Response to Exercise (Vol. 4): Human Kinetics.
Wenger, H., & Bell, G. (1986). The interactions of intensity, frequency and duration of exercise
training in altering cardiorespiratory fitness. Sports Medicine, 3(5), 346-356.
Wenos, D., Wallace, J., Surburg, P., & Morris, H. (1996). Reliability and comparison of RPE during
variable and constant exercise protocols performed by older women. International Journal
Of Sports Medicine, 17(3), 193-198.
Werle, C., Wansink, B., & Payne, C. (2011). Just thinking about exercise makes me serve more food.
Physical activity and calorie compensation. Appetite, 56(2), 332-335.
Westerterp, K. (2006). Non exercise associated thermogenesis: is it an obligatory or a facultative
phenomenon? In A. Hills, N. King & N. Byrne (Eds.), Physical Activity and Obesity (pp. 63-
70). London, UK: Smith-Gordon.
Westerterp, K. (2008). Physical activity as determinant of daily energy expenditure. Physiology &
Behavior, 93(4-5), 1039-1043.
Whaley, M., Brubaker, P., & Otto, R. (2006). ACSM's Guidlines for Exercise Testine and
Prescreption (7th ed.). Baltimore, MD: Lippincott Williams & Wilkins

Page 212
White, M., Bouchard, G., Buemann, B., Almeras, N., Despres, J., Bouchard, C., & Tremblay, A.
(1996). Reproducibility of 24-h energy expenditure and macronutrient oxidation rates in an
indirect calorimeter. Journal Of Applied Physiology, 80(1), 133-139.
WHO. (2008). Obesity and overweight Retrieved August 8, 2011, from
http://www.who.int/mediacentre/factsheets/fs311/en/
Whybrow, S., Hughes, D., Ritz, P., Johnstone, A., Horgan, G., King, N., . . . Stubbs, R. (2008). The
effect of an incremental increase in exercise on appetite, eating behaviour and energy balance
in lean men and women feeding ad libitum. The British Journal Of Nutrition, 100(5), 1109-
1115.
Whyte, L., Gill, J., & Cathcart, A. (2010). Effect of 2 weeks of sprint interval training on health-
related outcomes in sedentary overweight/obese men. Metabolism: Clinical And
Experimental, 59(10), 1421-1428.
Wild, S., Roglic, G., Green, A., Sicree, R., & King, H. (2004). Global prevalence of diabetes:
estimates for the year 2000 and projections for 2030. Diabetes Care, 27(5), 1047-1053.
Wilde, B., Sidman, C., & Corbin, C. (2001). A 10,000-step count as a physical activity target for
sedentary women. Research Quarterly For Exercise And Sport, 72(4), 411-414.
Williams, E., Tapp, R., Magliano, D., Shaw, J., Zimmet, P., & Oldenburg, B. (2010). Health
behaviours, socioeconomic status and diabetes incidence: the Australian Diabetes Obesity
and Lifestyle Study (AusDiab). Diabetologia, 53(12), 2538-2545.
Willis, W., Ganley, K., & Herman, R. (2005). Fuel oxidation during human walking. Metabolism:
Clinical And Experimental, 54(6), 793-799.
Wilmore, J., & Costill, D. (2004). Physiology of Sport and Exercise (3rd ed.). Champaign, IL: Human
Kinetics.
Wisloff, U., Stoylen, A., Loennechen, J., Bruvold, M., Rognmo, O., Haram, P., . . . Skjaerpe, T.
(2007). Superior cardiovascular effect of aerobic interval training versus moderate
continuous training in heart failure patients: a randomized study. Circulation, 115(24), 3086-
3094.
Withrow, D., & Alter, D. (2011). The economic burden of obesity worldwide: a systematic review of
the direct costs of obesity. Obesity Reviews, 12(2), 131-141.
Wojtaszewski, J., Jorgensen, S., Frosig, C., MacDonald, C., Birk, J., & Richter, E. (2003). Insulin
signalling: effects of prior exercise. Acta Physiologica Scandinavica, 178(4), 321-328.
Wojtaszewski, J., Nielsen, J., & Richter, E. (2002). Effect of acute exercise on insulin signaling and
action in humans. Journal Of Applied Physiology, 93(1), 384-392.
Wuorinen, E. (2008). Varied exercise intensity and the effects on appetite and food consumption in
lean young women. Appetite, 51(2), 409-409.
Wuorinen, E., Burant, C., & Borer, K. (2008). No effect of catecholamines on appetite as a result of
varied exercise intensity. Appetite, 51(2), 410-410.
Xu, F., & Rhodes, E. (1999). Oxygen uptake kinetics during exercise. Sports Medicine, 27(5), 313-
327.
Ye, J., Gao, Z., Yin, J., & He, Q. (2007). Hypoxia is a potential risk factor for chronic inflammation
and adiponectin reduction in adipose tissue of ob/ob and dietary obese mice. American
Journal Of Physiology. Endocrinology And Metabolism, 293(4), E1118-1128.
Yoshida, T., Chida, M., Ichioka, M., & Suda, Y. (1987). Blood lactate parameters related to aerobic
capacity and endurance performance. European Journal Of Applied Physiology And
Occupational Physiology, 56(1), 7-11.
Zanuso, S., Jimenez, A., Pugliese, G., Corigliano, G., & Balducci, S. (2010). Exercise for the
management of type 2 diabetes: a review of the evidence. Acta Diabetologica, 47(1), 15-22.
Zarins, Z., Wallis, G., Faghihnia, N., Johnson, M., Fattor, J., Horning, M., & Brooks, G. (2009).
Effects of endurance training on cardiorespiratory fitness and substrate partitioning in
postmenopausal women. Metabolism: Clinical And Experimental, 58(9), 1338-1346.
Zheng, H., & Berthoud, H. (2007). Eating for pleasure or calories. Current Opinion In Pharmacology,
7(6), 607-612.
Ziemba, A., Chwalbinska-Moneta, J., Kaciuba-Uscilko, H., Kruk, B., Krzeminski, K., Cybulski, G., &
Nazar, K. (2003). Early effects of short-term aerobic training. Journal of Sports Medicine
and Physical Fitness, 43(1), 57-63.
Zimmet, P., Magliano, D., Matsuzawa, Y., Alberti, G., & Shaw, J. (2005). The metabolic syndrome: a
global public health problem and a new definition. Journal Of Atherosclerosis And
Thrombosis, 12(6), 295-300.

Page 213
Zurlo, F., Lillioja, S., Esposito-Del Puente, A., Nyomba, B., Raz, I., Saad, M., . . . Ravussin, E.
(1990). Low ratio of fat to carbohydrate oxidation as predictor of weight gain: study of 24-h
RQ. The American Journal Of Physiology, 259(5 Pt 1), E650-657.


![Lesson 20. BUZZ-CUT CL:C-[thick] CURLEY-HAIR CUTE-[sugar] EYES FACE-[LOOK-LIKE, appearance, looks] FAT-[obese] FOOL](https://img.pdfslide.us/doc/110x75/56649dd95503460f94acf1ae/lesson-20-buzz-cut-clc-thick-curley-hair-cute-sugar-eyes-face-look-like.jpg)