Embed Size (px)
Citation preview

The Role of Intellectual Property Rights in EncouragingForeign Direct Investment and Technology Transfer
Keith E. MaskusProfessor of Economics
University of Colorado, Boulder
Prepared for the Conference “Public-Private Initiatives After TRIPS: Designing a Global Agenda”
Brussels, July 16-19, 1997
Contact Information: Keith E. Maskus, Department of Economics, Campus Box 256,University of Colorado, Boulder, CO 80309-0256, USA.Telephone: (303) 492-7588 Telefax: (303)492-8960 Email: [email protected]
forthcoming in Duke Journal of Comparative and International Law, 1998

1
1. Introduction
The global system of intellectual property rights (IPRs) is undergoing profoundchange as we approach the next century. Numerous developing countries recently haveundertaken significant strengthening of their IPRs regimes. Regional tradingarrangements, such as the North American Free Trade Agreement and a series ofPartnership Agreements under negotiation between the European Union and variousEastern European and Middle Eastern nations, now pay significant attention to issues ofregulatory convergence, with particular emphasis on intellectual property rights. Mostimportant is the introduction of the multilateral agreement on trade-related intellectualproperty rights, or TRIPs, within the World Trade Organization (WTO). Under the termsof TRIPs, discussed further below, current and future WTO members must adopt andenforce strong and non-discriminatory minimum standards of protection for intellectualproperty. Finally, while considerable controversy persists over international means ofprotecting key information technologies, including databases and electronic informationtransfer, there is an evident commitment to achieving strong protection in these areas.
That the international system is moving toward markedly stronger IPRs is not asurprise when viewed in the context of economic globalization, which is the transcendentcommercial and political force of this era. Globalization is the process in which nationaland regional markets are more tightly integrated through the reduction of government andnatural barriers to trade, investment, and technology flows. In this global economy, thecreation of knowledge and its adaptation to product designs and production techniques areincreasingly essential for commercial competitiveness and economic growth. Thissituation acquires growing political saliency in light of the fact that the internationalmobility of capital and technology have risen markedly relative to that of most types oflabor. Accordingly, globalization tends to invest its largest rewards in creative andtechnically skilled workers and to place its largest pressures on lower-skilled workers.
To clarify discussion, it is important to distinguish various concepts associatedwith globalization. First, the mechanisms by which markets become more integratedinclude changes in both natural forces and government policies. Key trends in naturalforces, associated with various forms of technological changes, consist of reductions ininternational transportation costs, improvements in global communications, and massiveincreases in computational power permitted by the microprocessor. Equally importantare changes in government policies that allow international firms greater access todomestic markets. Expansions in market access come through trade liberalization,deregulation of investment and licensing restrictions, provision of establishment rights inservices, privatization of state-owned enterprises, adoption of freely-traded currencies,and tax reform. The central feature of policy making in many emerging economies in the1990s has been a sharp shift toward improving market access, through both unilateralpolicy reform and adherence to regional and multilateral trade agreements.
Second, the channels through which globalization affects economies includeexpanded trade in merchandise and services, greater international portfolio investment and

2
foreign direct investment (FDI), and formal product and technology licensing. Foreigndirect investment -- the establishment or acquisition of producing subsidiaries abroad bymultinational enterprises (MNEs) sufficient to afford an important degree of managementcontrol -- is particularly important because it is both a source of capital and a provider ofknowledge about production techniques.
In truth, these channels are responses to globalization but, at least in the publiceye, are generally viewed as determinants of the ultimate outcomes of the process. Theseoutcomes include, in the first instance, stronger tendencies toward arbitrage ofinternational prices of goods and tradable services and greater access by consumers andfirms in each liberalizing country to new and more varied products and technologies oninternational markets. In turn, such economies experience strong increases in competition,reductions in domestic market power of formerly concentrated industrial concerns, re-allocations of economic resources into areas of greatest comparative advantage, decliningproduction costs in sectors with increasing returns to scale, and contraction or eliminationof uncompetitive firms. This last possibility, what economists label firm exit, is a keysource of efficiency gains in liberalizing economies but poses a strong political forceagainst deregulation.
Over the long term, stronger competitive pressures also tend to encourageadoption of frontier technologies and development of high-quality, differentiated productsfor both domestic production and export. Indeed, recent experiences in Chile, Mexico,Korea, and Taiwan point toward the need for meeting rigorous quality demands in orderto break into export markets as a key component of innovation and product adaptation.The stronger markets encouraged by liberalization could lead to a permanently highergrowth rate. This process explains why countries with outward-oriented commercialpolicies have outperformed other developing economies in recent decades.
While there is now considerable evidence to support this optimistic view ofglobalization, such gains do not come without potential costs. Foremost among these isthat greater competition changes demands for labor in each country, with unskilledworkers bearing the brunt of competitive pressures through declining real wages or risingunemployment. Also important are potential abuses of market power to the extent thatlarger international firms are placed into a position of market dominance by virtue of theirmarketing advantages or technological superiority, though the likelihood of such abusesoccurring diminishes with stronger international competition.
This brief review of globalization suggests that emerging countries have strong andgrowing interests in attracting trade, FDI, and technological expertise, although suchencouragements must be tempered by accompanying programs to build local skills andensure that the benefits of competition actually arise. In this context, intellectual propertyrights are an important element in a broader policy package that governments indeveloping economies should design with a view toward maximizing the benefits ofexpanded market access and promoting dynamic competition in which local firms take partmeaningfully. This broad package would include promoting political stability and
3
economic growth, encouraging flexible labor markets and building labor skills, continuingto liberalize markets, and developing forward-looking regulatory regimes in services,investment, intellectual property, and competition policy.
It is beyond the scope of this paper to consider each of these issues in detail andtheir complex interrelationships. Rather, I focus here on issues of attracting FDI andtechnology, with a particular emphasis on the role of IPRs in this process. In the nextsection I overview recent trends in international investment and licensing, using U.S. dataas a particular illustration. I then analyze the main determinants of FDI, both in theory andaccording to the available economic evidence. A similar treatment is provided forlicensing. In the third section I discuss, from the standpoint of an emerging economy, thepotential benefits and costs of incoming FDI and technology transfer, focusing on issues ofinformation spillovers and diffusion. Throughout, the impact of IPRs is considered. Withthis background, in the fourth section I present the broad outlines of a pro-competitivestrategy for attracting investment and technology. Inevitably, such strategies varysomewhat across countries by level of economic development and technological capabilitybut there are important common denominators. In a final section I conclude withobservations on the role of IPRs in linking developing countries to an information-basedglobal economy.
2. Determinants of Foreign Direct Investment and Technology Transfer
Multinational enterprises make multifaceted decisions regarding means by whichthey can serve foreign markets. Firms may choose simply to export at arm’s-length to aparticular country or region. Alternatively, they may decide to undertake FDI, whichrequires selecting where to invest, in what kind of facilities, whether to purchase existingoperations or construct new plants (so-called “greenfield investments”), which productiontechniques to pursue, and how large an equity position to take with potential localpartners. Firms may prefer a joint venture with some defined share of input costs,technology provision, and profits or losses. Finally, MNEs may opt to license atechnology, product, or service, leading to complicated issues of bargaining over licensefees and royalty payments.
These decisions are jointly determined and, for any firm, the outcome depends on ahost of complex factors regarding local markets and regulations. In this section I discussthe most significant of these factors for attracting FDI, licensing, and technology transfer,and review the available economic evidence. Intellectual property rights clearly play animportant role in these processes, though its importance varies by industry and marketstructure.
2a. A Brief Overview of Recent Data
It is helpful to begin with a glance at recent international data on FDI andlicensing. Reliable and comprehensive data on these flows are not compiled by manycountries, so the overview is constrained by limited data availability.
4
In Table 1 I list aggregate figures on FDI inflows and outflows, in millions ofdollars, for representative nations from the IMF’s Balance of Payments Statistics. Oneimmediate observation is that reported FDI data are quite volatile. For example, whileinward FDI into the United States remained fairly steady at between $48 billion and $60billion between 1987 and 1995, outward FDI more than tripled from 1990 to 1995.Japan’s outward FDI rose sharply in the late 1980s but fell by more than half between1990 and 1995. This volatility suggests that one should be cautious about makinginferences on the basis of a single year of data. Further, it indicates that FDI flows arestrongly influenced in the short term by macroeconomic factors, such as fluctuations in thebusiness cycle and shifts in exchange rates. While this fact should be kept in mind, I ammore concerned here with microeconomic determinants of FDI.
Despite the volatility in these figures, it is clear that the last decade has seensharply rising FDI flows in both the developed countries and most of these key developingcountries.1 Spain experienced a dramatic increase in inward FDI in the late 1980s after itsaccession to the European Union but this inflow has since moderated. The UnitedKingdom continues to be a net supplier of FDI, but annual investment in that country hasdoubled over the period. Japan remains, in relation to its GNP, a very small recipient ofinward FDI but a large supplier of outward FDI. Indeed, it is this feature -- Japan’sremarkable effective closure to FDI -- that continues to characterize it as unique amongdeveloped economies. Poland’s rapid liberalization and deregulation program and itsincreasing commercial ties with Western Europe led to a 40-fold increase in inward FDI inthe early 1990s.
As is well-known, FDI in China has mushroomed in recent years, rising by a factorof ten between 1990 and 1995 according to the IMF’s figures. Its receipt of nearly $36billion in FDI in 1995 marks China as easily the largest destination for investment in thedeveloping world. It received 52% of the inward FDI in 1995 among the developingcountries listed here, a share that rose dramatically from 15% in 1990. Malaysia,Indonesia, and Thailand have all received rising inward FDI flows, while Thailand’sinvestment abroad rose sharply in the 1990s. Singapore became a significant supplier ofFDI in this decade as well.
There are two African countries listed, Kenya and Egypt. Both display decliningtrends in inward FDI over the last decade, indicative of severe economic problems in thatcontinent. In contrast, Mexico experienced a sharp rise in FDI in the 1990s, some of itundoubtedly related to negotiation and passage of NAFTA. Brazil and Chile receivedsimilar large increases in FDI since 1990.
From this review it appears that the last decade has been a period of substantiallyrising FDI, with a larger proportion of investment flowing to the emerging economies.
1 These figures are in nominal dollars and are not adjusted for inflation or changes in realexchange rates.

5
China is particularly noteworthy in this context. The one dark spot on this trend is thedeclining ability of very poor and inward-looking economies, such as those in Africa, toattract investment. Overall, the summary points to rapid growth and increasing opennessas key encouraging factors.
In Table 2 I provide figures, taken from the same source, on net receipts (creditsless debits) for royalties and licensing fees, other business services, and direct investmentincome. Royalties and license fees are the most direct measure available of internationalearnings on patents, trademarks, copyrights, and trade secrets. Note that these fees couldbe imperfect measures of the value of technology exchange. Within the multinational firm,the fees charged a subsidiary may be dependent on international tax structures. Further,optimal pricing of information is a complex problem and receipts of license fees andinvestment income may be poor indicators of the economic value of intellectual assets.Nonetheless, these data are worth considering.
The United States remains, by far, the largest recipient of such fees, earning a net$20.7 billion in 1995. The United Kingdom is also a net recipient. However, Japan,Germany, and Spain pay out more in royalties and fees than they take in, indicating thatthey are net purchasers of technologies and product designs. It is no surprise that all ofthe developing economies for which such data are reported are also net payers of royaltiesand license fees, as befits their status as technology importers. The interesting fact is thatfor every such country (except, perhaps, India) there was a marked rise in such netpayments over the last decade. Thus, it appears that the international exploitation ofintellectual property is becoming increasingly important in the process of globalization.
The United States publishes the most extensive data on FDI by country andindustry. Thus, in Table 3 I list the stock of U.S.-owned foreign capital (foreigninvestment position at historical cost) for key countries. The foreign investment positionis a more informative measure of investment activity than is current FDI, because the latterflow is so variable. The top row demonstrates that U.S. ownership of foreign directcapital nearly tripled from 1985 to 1994.2 Thus, again we find that FDI has grownremarkably in recent years.
Despite the increasing attractiveness of developing economies as destinationcountries, the bulk of U.S. investment remains in the developed countries. The EuropeanUnion (12 countries) actually increased its share of U.S. investment stock from 36% to41% over the period, while Japan’s share rose from four percent to six percent. It issurprising to note that by 1994 the United Kingdom had supplanted Canada as the host ofthe largest U.S. foreign investment position, with Canada’s share falling considerably overthe period. The combined shares of Europe, Canada, and Japan sum to 66.9% of theglobal American foreign capital stock in 1994.
2 Because these data are in nominal dollars at historical cost, they should be viewed withcaution.

6
It is likely that recent relative increases in investment will change these shares overtime in favor of the emerging economies. As it is, each country or region listed exceptAfrica saw a large increase in the U.S.-owned capital stock. China’s share of the U.S.FDI position tripled and the investment stock in Hong Kong doubled in the 1990s.Mexico’s share also rose sharply, which likely is partly a result of NAFTA, as did Chile’s.As a continent, Africa experienced an absolute decline in the investment stock (indicatinga sizable disinvestment) over the period, with its share falling from 2.6% to 0.9%.
The African experience points out that the distribution of FDI in developingcountries remains uneven. This trend was particularly acute in the 1980s, as documentedin Amirahmadi and Wu (1994). In that decade, a total of 15 countries received 80% of allFDI inflows to the developing areas. These flows were highly concentrated within regionsas well. For example, Singapore, China, Hong Kong, Malaysia, Indonesia, China, Korea,Taiwan, and Thailand absorbed over 90% of investment in Asian developing countriesover the decade. While this concentration has moderated somewhat in the 1990s, it is stillin evidence.
Listed in Table 4 are data on the U.S. foreign investment position in 1994 formajor industries in selected nations. The global stock of capital in banking and finance isnearly as large as that in total manufacturing, pointing out the importance of financialservices in the globalization process. Also significant are investments in wholesale trade,which amounted to $67.3 billion. These figures point out an important feature of FDI intoday’s economy: much investment is complementary across sectors. That is, a strongmanufacturing presence in a foreign economy typically goes hand-in-hand withinvestments in finance and distribution in order to help with local marketing efforts and infinancing further expansion of facilities. Such investments also are stronglycomplementary with merchandise trade flows, particularly those within MNEs. Thus, thetraditional view that FDI tends to substitute for trade in goods (that is, that trade falls asFDI and local production rise) is outdated and largely inaccurate today.
It would be tedious to discuss these figures in detail. A convenient summary is inthe bottom two rows, in which I indicate crudely the breakdown of the sectoral investmentinto stocks in developed countries (Europe, Canada, and Japan) in the table anddeveloping countries. The manufacturing sector with the highest representation inemerging economies is electrical equipment, followed by food and kindred products andother manufacturing goods. These are industries in which comparative advantage inimportant subsectors could be expected to lie in developing economies with low-wagelabor and abundant agricultural endowments. Thus, FDI between the United States anddeveloping countries does tend to follow comparative advantages based on factor costs.3
The chemicals sector also has a fairly high presence in emerging economies, which isparticularly true of the pharmaceuticals sub-sector (Maskus and Penubarti, 1995). Indeed,in the data in Table 4, chemicals has the largest stock among sectors investing in Chinaand is also prominent in Latin America.
3 A similar finding for U.K. investment was detected in Maskus and Webster (1995).
7
The banking and finance sectors have a large presence in developing economies,with some 38% of their FDI stocks there. Much of this investment is in Panama andBermuda because of special tax and operating advantages, which indicates that someforms of FDI are sensitive to regulatory regimes. Netting out investment in those twocountries yields the percentage distribution in parentheses, suggesting that 77% of FDI inthese sectors that is based more on long-term microeconomic factors exists in thedeveloped countries. Investment in services sectors (largely hotels and engineering andbusiness services) is heavily located in developed economies. However, a substantialportion (25%) of investment in wholesale trade activities exists in developing economies.Again, this reflects the complementarities between finance and distribution, on the onehand, and trade and FDI in goods, on the other hand. It should be noted that services bearthe particular characteristic that their provision often physically requires the local presenceof either the facility itself (hotels, hospitals) or of professionals (engineers, consultants).Thus, rights of establishment are especially important in attracting FDI in services.
Further perspective on the sectoral characteristics of FDI is available in Table 5,which lists data on U.S. investment abroad by high-technology manufacturing and serviceindustries in 1989. Note first that there is significant variation across industries in thenumber of foreign affiliates per U.S. parent, which indicates the relative importance ofinvesting in either numerous foreign subsidiaries of fairly small size or fewer foreignfacilities of larger size. The pharmaceuticals industry tops this list with 33.8 affiliates perfirm. Pharmaceuticals are characterized by having large numbers of foreign affiliatesproducing under license. Advertising and industrial chemicals are next, with otherindustries trailing behind. Second, the stock of foreign assets owned by U.S. firms isshown again to be sparsely located in emerging countries (EC’s). The highest proportionsof investment in EC’s are in electric components and circuits and telecommunicationsequipment. Each of these sectors includes considerable electronics production that isfairly standardized and labor-intensive. Health services are unusually high in this contextamong the service sectors. Third, the proportion of intrafirm sales, which are largelybetween the parent and its affiliates, differs considerably across industries. In comparisonto the stock of foreign assets, intrafirm trade is quite high in electronic components, officemachines and computers, and motor vehicles and parts. This situation reflects substantialtrade in inputs among vertically differentiated firms. Intrafirm trade is much smaller inchemicals, pharmaceuticals, and printing and publishing, in which MNEs tend to behorizontally integrated. Unsurprisingly, there is virtually no intrafirm trade in high-technology services, which essentially require direct contact between supplier andcustomer.
2b. Factors Influencing Foreign Direct Investment Flows
Begin with some definitions. Foreign direct investment is the act of establishing oracquiring a foreign subsidiary over which the investing firm has substantial managementcontrol. By definition, firms that engage in FDI operate in more than one country and are

8
called multinational enterprises. The location of an MNE’s headquarters is called thehome or source country, in that the decision to invest is made there, while the location ofthe subsidiary is called the host or recipient country. Clearly, there are difficulties ininterpreting such concepts. It has become increasingly difficult to identify major MNEswith a particular host country, since they may establish facilities in several countries thateach undertake “headquarters operations” (such as research and development, marketing,and organizational design) for local markets and tax jurisdictions.
Multinational enterprises may undertake horizontal FDI, in which the subsidiaryproduces products and services that are similar to those produced at home, or verticalFDI, in which the subsidiary produces inputs or undertakes assembly from components.In the latter case, international production is fragmented across borders, taking advantageof locational considerations and input costs (especially wage differences) at various stagesof production. Incentives for horizontal FDI and vertical FDI are different, as furtherexplained below. Horizontal FDI tends to characterize investment decisions of MNEsoperating across borders within the industrialized nations, while vertical FDI is moreprevalent among MNEs that invest in developing (low-wage) economies. Horizontalsubsidiaries tend to produce for local or regional markets only, without exporting muchoutput to the host country. In contrast, the output of vertical subsidiaries is more likely tobe exported within the MNE, both to the host country and to other countries with similardemand characteristics.
It is also important to note that FDI embodies two distinctive assets: first, capitaland second, technology or some intangible advantage. While the capital for financing FDImay come from the host country or from global financial markets, it may also be raised onthe local capital markets of the recipient nation. Indeed, this is far the most commonapproach for financing horizontal investments among industrialized nations. Thus, FDImay or may not be associated with a net external addition to the local capital stock,although in economic terms this is of little consequence since it is investment itself thatmatters, whether raised from domestic or foreign sources. External financing morecommonly characterizes FDI in emerging countries.
In this light, FDI should be viewed less as a source of finance (global FDI flowsare small in relation to flows of portfolio capital in any case) and more as a source ofinvestment in capital and technology or related assets. These variables are capable ofimproving productivity and wages in a recipient economy.
With these comments in mind, consider the underlying determinants of a firm’sdecision to engage in FDI. Economists begin by noting that, for a firm to become a MNE,it must have a sufficient cost advantage or technical product superiority over firms in thehost country to overcome the disadvantages it faces in international management,including language and cultural barriers, jurisdiction-specific tax treatments, distance fromheadquarters, and monitoring local operations. Thus, MNEs must enjoy some efficiencyadvantages, meaning that they bring potential gains to host countries, and economictheories of FDI begin with a description of such advantages.

9
OLI Framework
A convenient framework for thinking about this question is the ownership-location-internalization (OLI) paradigm developed by Dunning (1981). In this approach,MNEs are characterized by some ownership advantage, which could be a tangible asset,such as a proprietary claim in facilities producing key natural resources. Far morecommonly, however, the advantage is an intangible asset, such as a trademark orreputation for quality, or a product or production process to which other firms do nothave access, such as a patent or trade secret. Such advantages confer market power andcost efficiencies that provide sufficient incentives to undertake multinational organizationand operation.
That ownership advantages are strongly associated with technology development,information management, and marketing strategies is borne out by key characteristics thatdescribe MNEs. Such firms tend to be important in industries with high R&D intensities,large employment of professional and technical workers, significant reliance onintroduction of new and technically sophisticated products, and considerable amounts ofproduct differentiation and advertising.4
Thus, FDI is more likely to be important in industries in which intangible,knowledge-based assets (KBAs) specific to each firm are significant. There are two keyreasons for this fact. First, informational advantages can be transferred easily acrossborders at low cost. Second, knowledge is similar to a public good, in that a particulartechnology or trade secret can be used in several production facilities without reducing itsavailability for others, as is the case with labor and capital. Such knowledge is embodiedin blueprints, software, chemical formulas, and managerial or engineering manuals, whichmay be used numerous times at low marginal cost.
The important implication of this characteristic of knowledge is that MNEs enjoyscale economies from multiplant production, sometimes called economies of scope. Amultinational firm can produce its technical knowledge in one location and use it in severalplants in different countries, spreading the investment cost of technology development andmarketing across numerous facilities (Markusen, 1984). In contrast, two independentfirms, each of which must make this investment, operate at a cost disadvantage. Thus, weshould observe significant multinational activity in industries in which the development oftransferable knowledge and product quality is a key focus of strategy. Indeed, this isconsistent with available evidence and possibilities for exploiting multiplant economies arenow considered perhaps the most important determinant of a firm’s decision to undertakeFDI.
4 Considerable evidence supporting these points may be found in Caves (1982), Morck andYeung (1992), Grubaugh (1987), Brainard (1993), and Markusen(1995)

10
Note that this argument is particularly relevant for horizontal FDI, in which firmsbase strategies for penetrating markets on the economic value of their KBAs, such assuperior production processes, reputations for quality, performance, and service, and evenlife-style images. It also points out that MNEs find it crucial to be able to support theirinvestments with complementary operations, including service contracts. Economic valueis increasingly related to performance of systems, including products, services,information, maintenance, technical upgrades, and close relations between producers andclients. As amplified below, this means that, in today’s world, FDI is far less attracted byprotectionist tariff walls and far more attracted by economies with open access to globalmarkets. It also means that strong IPRs are taking on increasing importance as adeterminant of inward FDI.
To summarize, MNEs are essentially exporters of KBAs, including technology,engineering, management, marketing, and financial services. The importance of humancapital skills in generating these KBAs is evident. Multinational firms also sell the servicesof devices that protect the value of their KBAs, including patents, trademarks, tradesecrets, and copyrights; indeed, it is common for economists to refer to owned IPRsthemselves as the relevant knowledge-based assets. Local subsidiaries pay for theseservices with royalties, license fees, shared outputs, and profit repatriations.
Even given some ownership advantage, MNEs still must decide on investmentdestinations. These decisions depend on characteristics of particular countries, calledlocation advantages. Such advantages make it profitable for the firm to produce abroadrather than at home and export the good. Obvious examples of location advantagesinclude market size and growth, local demand patterns, transport costs and distance frommarkets, low wage costs in relation to labor productivity, abundant endowments of naturalresources, and (declining in importance over time) trade protection that could encouragesome kinds of “tariff-jumping” investment. Also important are an adequate and moderninfrastructure and transparent government regulatory procedures. Recently, locationcharacteristics that enhance the value of KBAs have taken on crucial importance. Amongthese are an adequate supply of high-skilled labor in order to facilitate absorption and useof technology and management techniques, close proximity to customers and unimpededability to build supplier-customer networks, and a vibrant business-services sector that canhandle localized needs for marketing and finance. Further, the strength of each country’sIPRs is a locational factor of growing importance, as discussed further below.
Notice that location advantages matter for both vertical and horizontal FDI. Theyare especially important for vertical FDI, in which firms build production networks acrossborders, with engineering, design, and marketing operations in the headquarters country,and resource extraction, assembly, and data processing in host countries. Indeed, the mostsignificant recent trend in vertical FDI has been the construction of such verticallyintegrated networks, a process also referred to as “production fragmentation” or“delocalization” or “outsourcing” (Hanson, 1996). This process underlies the rapidexpansion of intrafirm trade in goods and services between developed and developingeconomies. Investment of this kind is most attractive in low-wage, high-growth

11
economies with sufficiently large market sizes to take advantage of scale economies inassembly. While outsourcing is of concern to low-skilled workers in the high-wageeconomies, it generates overall efficiency gains in both the source and host countries andis a critical component of modern competitive strategies.
In this context, it is interesting to observe that the volume and character of inwardFDI change dramatically as countries develop (Zhang, 1996). The least-developedcountries of the world attract virtually no FDI (except in extractive sectors) due toextremely low levels of productivity, education, and skills. Further, such countries tend tohave underdeveloped infrastructures, are relatively closed to trade, and maintain poorlydesigned, intrusive, and non-transparent government regulations that encouragecorruption. To the extent that such countries can marshal effective investments ininfrastructure, capital, and education and skill, their per-capita income levels rise overtime. As this happens, MNEs find these economies attractive locations for vertical FDIfor labor-intensive assembly operations and intrafirm trade grows. This process expandsuntil real wages rise sufficiently that the economies lose their competitive advantages inassembly production (the FDI itself plays a positive role in raising wages). As vertical FDIfalls off, however, horizontal FDI tends to move in because such countries achieve incomelevels that make them attractive markets for producing high-quality differentiatedconsumer and capital goods and even for undertaking local R&D programs. Indeed, thesecountries may well become sources of FDI. Interestingly, as horizontal FDI grows ittends to displace both inter-firm and intrafirm trade (Markusen, 1995). Thus, so-called“North-South” investment tends to be vertical while “North-North” investment ishorizontal. Rapidly developing economies, such as Korea, Singapore, and Mexico, maymove through this investment cycle in a single generation. This process is summarizedschematically in Figure 1. Notice that as market size grows and human capitalaccumulates with higher levels of income, horizontal FDI displaces vertical FDI, but, asshown in the bottom panel, the cumulative stock of FDI should rise over time. Thus,there is an important dynamic element to growth and investment.
Regarding horizontal MNEs, key location characteristics include market size,income levels and growth, transport costs, complementary business services andregulations, and market openness. As noted earlier, IPRs take on increasing importance asinvestment becomes more horizontal in nature. In this sense, it is not surprising thatcountries moving up the FDI cycle find a growing economic interest in adopting strongerIPRs, an interest congruent with their own expanding abilities to develop new productsand technologies.
Finally, ownership and location advantages together may not be sufficient fully toexplain FDI because they do not account for the advantages of internal organization overselling goods and licensing technologies on the open market. Rather, MNEs also haveinternalization advantages, which relate to gains from exploiting their KBAs within theconfines of their international operations (Rugman, 1986). It is this aspect of the processthat explains the decision to acquire a subsidiary rather than to license an asset with anindependent foreign firm.

12
There are numerous reasons why the costs of international transactions may belower if performed within the confines of a single firm rather than at arm’s-length. Mostof these relate to difficulties involved in writing and enforcing contracts betweenindependent firms when licensing is costly and information is imperfect. For example,because the KBA that is the potential subject of a licensing contract is valuable, but(perhaps) easily copied, the original firm may not wish to reveal its technology to anunrelated licensee during contract negotiations for fear that the latter could decline thecontract and copy the technology for its own purposes. The licensee, on the other hand,would be unwilling to sign a contract and agree to royalty terms unless it knows theparticulars and value of the technology. In such cases, it may be impossible to develop asatisfactory and enforceable contract, forcing the original firm to acquire a subsidiary towhich it transfers the KBA (Teece, 1986). This is an informational imperfection in themarket for technology actually implies, other things equal, that firms would be more likelyto engage in FDI in countries with weaker IPRs and contract-enforcement procedures.An implication is that as IPRs in a particular nation become stronger, firms would tend tochoose more technology licensing and joint ventures and less FDI. This is the oneidentifiable theoretical case in which the strength of IPRs would be negatively associatedwith FDI flows. It applies most readily to firms that have proprietary technologies thathave been expensive to develop but are easily copied, such as pharmaceuticals, agriculturalchemicals, and computerized processes. A similar phenomenon is that MNEs may bemore willing to train and retain technical and managerial employees who learn thetechnology and who might otherwise defect from a licensee and form their own competingfirms.
An additional contracting problem is that a potential independent licensee mayattempt to convince the MNE that the market is smaller than it really is, or will grow tobe, thereby limiting its royalties and fees. If there is wide uncertainty on this point, theMNE may prefer to avoid having to share any potential profits by engaging in FDI andcontrolling local management and sales. This situation also helps explain why some firmsset up complementary foreign distribution and servicing facilities (Zeile, 1993).
Multinational enterprises usually experience higher costs of transferring technologythrough arm’s-length transactions because aspects of the technology that are tied up in thefirm’s human capital, management, know-how, and corporate culture are not easilytransmitted (Teece, 1977, 1986). This factor becomes more important the morecomplicated is the technology or management process, helping to explain the prevalenceof MNEs in high-technology industries. Transfer costs also depend on the recipientcountry’s ability to absorb the technology efficiently, indicating that more technologylicensing in complicated products and processes would emerge as the human capital baseof the economy rises. Also important are the transparency and certainty of the legal andregulatory systems.
In cases where the firm’s KBA is a reputation for high quality, an additionalincentive for FDI arises. Once a contract is signed, local licensees may not have sufficient

13
incentives in an independent contract to maintain quality of the product or service,tarnishing the original firm’s reputation and profitability. Similarly, there may ariseproblems with licensees who shirk their marketing or distribution efforts, degrade theproduct’s quality, or sign contracts with competing firms to whose products they devotemore attention. These problems are most significant in economies in which monitoring iscostly and difficult, the supply of technologies and products to licensees is highlycompetitive, and contracts are not well enforced. While many contracts are designed todeter such behavior, firms may find it easier to exercise control through FDI.
This analysis suggests strongly that internalization issues favor the development ofMNEs in industries where knowledge-based assets are important. Thus, MNEs tend to beassociated with intensive R&D programs, advertising efforts, and frequent introduction ofcomplex products. In such sectors, technology transfers are likely to be made internallywithin the firm, especially when there are contracting, monitoring, and enforcementdifficulties. Thus, internalization issues characterize horizontal MNEs.
There are also internalization advantages for vertically integrated MNEs. Largely,these relate to difficulties in setting contract prices when a single buyer (the MNE)proposes to purchase inputs or services, such as a natural resource or assembly operation,from a single seller. In markets where oligopolistic markets may exist on both sides of thetransaction, firms are likely to find it advantageous to integrate the activities and establishprofit-maximizing internal pricing.
2c. The Role of Intellectual Property Rights
This review of the determinants of FDI leaves much room for IPRs to affectinvestment flows and the operations of MNEs. The various means by which IPRsinfluence FDI are subtle and complex. Moreover, it must be emphasized that strong IPRsalone are insufficient for generating strong incentives for firms to invest in a country. Ifthat were the case, recent FDI flows to developing economies would have gone largely tosub-Saharan Africa and Eastern Europe. In contrast, China, Brazil, and other high-growth, large-market developing economies with weak protection would not haveattracted nearly as much FDI if investment were heavily dependent solely on IPRs.
Seen in the proper policy context, IPRs are an important component of the generalregulatory system, including taxes, investment regulations, production incentives, tradepolicies, and competition rules. As such, it is joint implementation of a pro-competitivebusiness environment that matters overall for FDI, which I discuss further in Section 4. Inthis section, I focus strictly on mechanisms by which the strength of IPRs could affect FDIdecisions, as seen by economists, in light of our theories of why investment takes place.
Begin with the obvious point that FDI is a forward-looking decision, in that itcommits an MNE to long-term operations in a host nation. Therefore, what mattersultimately to the firm is the likelihood that an investment will raise its expected profits.

14
While there are numerous factors that influence profitability, the issue regarding IPRs isthe extent to which the regime affects the firm’s perception that it will be able to earn ahigher return on its protected KBAs through FDI, relative to other means of earning suchreturns.
This is a complex subject that permits few definitive conclusions, at least in theory.To sketch an idea of this complexity, consider that a firm with a knowledge-based asset(reputation for quality, new technology, or new product) has several choices in decidinghow to service a particular foreign market. First, it can export the good there throughstandard, arm’s-length trade channels. Second, it can choose to produce locally within thefirm by undertaking FDI and controlling the production process. Third, it can choose tolicense or franchise its KBA to an unrelated firm in the host country and allow localproduction in return for royalties and fees. Finally, it could undertake a joint ventureinvolving some joint production or technology-sharing agreement.5 These decisions arenot made independently and it is possible to observe more than one mode of supply incertain circumstances.
Exports are likely to be the primary mode of supply when transport costs andtariffs are low in comparison to the costs of FDI and licensing. That the volume ofexports could depend on the strength of local IPRs has been discussed most fully byMaskus and Penubarti (1995). Strong IPRs in all forms -- patents, trademarks,copyrights, and trade secrets -- provide protection for exporting firms against localcopying of the product, suggesting that they would increase the market size facingexporters and induce them to sell more. This “market-expansion effect” is likely to bestrongest in countries with large markets (either in absolute size or in terms of per-capitaGNP) that have significant technical capabilities for imitating products and technologies.At the same time, such firms enjoy greater market power, allowing them to charge higherprices, though concerns about this “monopoly effect” are often overstated in light ofcompetitive realities (Maskus and Eby-Konan, 1994). It is more likely to be important incountries with small markets and limited technological abilities. Overall, empiricalevidence indicates that, other things equal, countries with stronger IPRs do attract moreimports, though the effect varies across industries (Maskus and Penubarti, 1995). It isinteresting to note that the effect of stronger trademarks seems particularly strong inincreasing imports of relatively low-technology goods, such as clothing and otherconsumer goods, because the ease of knocking off such products under weak trademarkslimits foreign firms’ incentives to sell them locally. Effectively, stronger trademarks lowerthe costs of exporting because a firm faces a smaller need to discipline local imitators(through lower prices). This is true also of pharmaceuticals, though they are more likelyto be produced under local license, as discussed earlier, than extensively imported. Tradein goods that are difficult to imitate, such as certain kinds of machinery, or for whichtrademarks are not as significant, such as basic metal manufactures, is less sensitive to
5 A further option -- not supplying the market at all -- may pertain in small, poor marketswith limited IPRs but I do not consider it further.

15
variations in IPRs since there is little threat of losing market share to local infringing firms.These results have been refined and strengthened by Smith (1998).
Foreign direct investment is likely to supplant direct exports of a good where tradeand transport costs are high,6 the fixed costs of building foreign plants is low, localproductivity is high relative to wage costs, the size of the host market is large, and theR&D or marketing intensity of the product is substantial. As discussed earlier, the lastfactor is critical for horizontal FDI in differentiated goods and advanced technologies inthat it is the knowledge basis -- or intellectual component -- of the firm’s advantage thatinduces it to become an MNE.
Again, FDI exists because firms with some ownership advantage prefer to exploitit through internal organization of multinational activity, with the location of activitydepending on local market characteristics. This analysis suggests first that IPRs shouldtake on different levels of importance in different sectors with respect to encouraging FDI.Investment in lower-technology goods and services, such as textiles and apparel,electronic assembly, distribution, and hotels, depends relatively little on the strength ofIPRs and relatively much on input costs and market opportunities. Investors with aproduct or technology that is costly to imitate may also pay little attention to local IPRs intheir decision making, though the fact that imitation has become markedly easier over timein many sectors points to the rising importance of IPRs. Firms with easily copyableproducts and technologies, such as pharmaceuticals, chemicals, food additives, andsoftware, are more concerned with the ability of the local IPRs system to deter imitation.Firms considering investing in a local R&D facility would pay particular attention to localpatent protection.
This perspective is consistent with results reported in Mansfield (1994), whosurveyed 100 major U.S. firms with international operations in 1991. Intellectual-propertyexecutives in firms representing six industries were asked their opinions of the importanceof IPRs in their FDI and licensing decisions and to provide their assessments of theadequacy of IPRs in 16 countries. Table 6 reproduces his results regarding type ofinvestment facility. In no industry is there much concern about IPRs protecting theoperation of sales and distribution outlets. In the chemical industry, which includespharmaceuticals, 46% of firms are concerned about protection for basic production andassembly facilities, 71% for components manufacture, 87% for complete productsmanufacture, and 100% for R&D facilities. This tendency to be more concerned withIPRs, the higher the stage of production, carries over to all sectors. Overall, the chemicalindustry is the most affected in its decisions to invest, while in all sectors there is a strongconcern about local IPRs in siting R&D operations. In a companion paper, Mansfield
6 This is a relative comparison only. I do not mean that raising trade barriers would attractFDI, but rather that high tariffs in relation to fixed costs are associated with FDI. Ingeneral, however, significant trade liberalization tends to attract FDI for reasons discussedelsewhere.

16
(1995) demonstrated that these findings hold also for Japanese and German firmsconsidering foreign investments.
Table 7 presents additional results for selected countries with weak IPRs at thetime of the survey. India elicits the greatest concern about IPRs; fully 80% of thechemical firms surveyed indicated they could not engage in joint ventures or transfer newtechnologies to subsidiaries or unrelated firms due to weak protection. Interestingly, inchemicals there is little difference between joint ventures and subsidiaries in this regard.Both investments evidently provide foreign firms with approximately the same level ofsecurity about their technologies (though there is more concern about joint ventures inMexico and Indonesia). However, across all countries licensing to unrelated firms is seenas riskier because of weak IPRs. This situation seems to be true as well in machinery. Inthe other sectors, however, there is little difference in the willingness to transfertechnology through various modes according to weakness in intellectual property rights.
That licensing is seen as insecure relative to investment in the high-technologysectors in countries with weak IPRs points up a subtle aspect of intellectual propertyprotection. Recalling our theory, firms are more likely to undertake FDI than licensingwhen they have a complex technology and highly differentiated products and when costsof transferring technology through licensing are high (Teece, 1986; Davidson andMcFetridge, 1984, 1985; Horstmann and Markusen, 1986). Under these circumstances, itis efficient to internalize the costs of technology transfer through FDI in a wholly-ownedor majority-owned subsidiary. As IPRs improve, licensing costs should fall because itbecomes easier to discipline licensees against revelation or appropriation of proprietarytechnology and against misuse of a trademark. Thus, for a given level of complexity ofinnovations, we would expect to see licensing displace FDI as IPRs are strengthened.
It is useful to summarize the predictions about IPRs, FDI, and technology transfer.First, investment and technology transfer are relatively insensitive to internationaldifferences in IPRs in sectors with old products and standardized, labor-intensivetechnologies. Here, FDI is influenced by factor costs, market sizes, trade costs, and otherlocation advantages. Second, other things equal, FDI representing complex but easilycopied technologies is likely to increase as IPRs are strengthened because patents,copyrights, and trademarks increase the value of KBAs, which may be efficiently exploitedthrough internalized organization. Third, to the extent that stronger IPRs reduce licensingcosts, FDI could be displaced over time by efficient licensing. Finally, whatever the mode,the likelihood that the most advanced technologies will be transferred rises with thestrength of IPRs.
One interesting implication of this analysis is that rapidly growing developingcountries should develop a natural interest in improving their IPRs regime over time asthey move up the “technology ladder” to an ability to absorb and even develop moresophisticated innovations. This is perhaps the strongest argument to make in favor ofadopting stronger protection in nations such as Korea, Brazil, Mexico, and Malaysia. Inthe early stages of their industrial growth, such countries have an interest in being able

17
freely to imitate imported technologies, calling for limited protection. As they develop,however, they should become increasingly interested in tightening IPRs, both in order toattract the most modern technologies and to encourage their own innovation. Indeed, thisprediction is borne out by the pattern of patent protection across countries, as shown inFigure 2.
Economists cannot be entirely optimistic about the implications of stronger IPRsfor technology transfer, however. Technological information is diffused from one firm toanother, or from one country to another, through numerous channels. Patents themselveshave potentially ambiguous effects. They directly facilitate additional information transfer(if not know-how diffusion) by disclosing the details of inventions in application materials.This information then is available for use by local firms to develop follow-on products thatdo not violate the scope of the original patent. As more countries provide and enforcepatents, there should be additional global innovation and patenting, with a positive impacton follow-on innovation. On the other hand, patents could slow down technologydiffusion by limiting the use of key technologies through restrictive licensingarrangements. This view of patents has long been held in numerous developing nationsand still commands widespread respect in some quarters.
In fact, recent theoretical treatments of the impacts of IPRs on technologydiffusion in growth models bear mixed messages. In some models, technology istransferred through imitation by firms in developing countries. When the global IPRssystem is strengthened by the adoption of minimum standards, imitation becomes harder asforeign patents are enforced. The rate of imitation declines and, contrary to what might beexpected, this slows down the global rate of innovation also. This is because if innovativefirms expect slower loss of their technological advantages they can earn higher profits perinnovation, reducing the need to engage in R&D (Helpman, 1993; Glass and Saggi, 1995).
This result is sensitive to model assumptions and may not hold up to alternativespecifications. Indeed, Lai (1998) finds that product innovation and technology diffusionare strengthened under tighter IPRs if production is transferred through FDI, rather thanthrough imitation. This points clearly to the need for developing economies to removeimpediments to inward FDI as they strengthen their intellectual property systems.Vishwasrao (1994) demonstrates in a game-theoretic setting that, while the mode oftechnology transfer is affected by IPRs protection, with internalization through FDI thepreferred mechanism in countries with weak patents, the quality of technologiestransferred rises with stronger IPRs. Taylor (1994) also shows theoretically thattechnology transfer expands with stronger patents when there is competition between aforeign innovator and a domestic innovator. A failure to provide patents removes theincentive for the foreign firm to license its best-practice technologies. Rockett (1990)finds that in cases where local imitation requires knowledge that is available only throughthe licensed use of technology, the foreign licensors make available lower-qualitytechnologies. This reduces the licensee’s incentive to imitate the technology, reducingboth the quality and extent of knowledge transfer.

18
Furthermore, an optimistic view comes from studies of international patentingbehavior (Eaton and Kortum, 1996). The value of patent rights varies across countriesand technology fields, but is typically significant in important developing countries,suggesting that stronger patents would induce further R&D, patent applications, andpatent working. There appear to be considerable spillovers of technological knowledgethrough patenting and trade in patented products. Indeed, Eaton and Kortum claim that,except for the United States, the OECD countries have derived substantial productivitygrowth from importing knowledge through patents.
The importance of technology transfer through trade in technologically advancedinputs (machinery, chemicals, software, producer services, and so on) should also beemphasized. There is evidence that such trade is responsible for significant amounts ofproductivity gains across borders and a crucial part of the technology convergence thathas emerged among the developed economies in recent decades (Coe and Helpman,1995). This suggests that emerging economies have a joint interest in trade liberalizationand linking their IPRs systems with those of the developed countries. The resulting gainsin productivity spillovers could easily outweigh costs associated with additional marketpower.
Before leaving this theoretical section, a final comment about the emerging systemof global IPRs should be mentioned because it is little appreciated in the policy arena. Tothe extent that different levels of IPRs across nations acts as a locational determinant ofFDI and technology transfer, the trend toward harmonization of IPRs within the TRIPsagreement will offset such advantages. That is, it will increase the attractiveness ofcountries that are strengthening their IPRs, but reduce the relative attractiveness of thosewith strong IPRs already in existence. This harmonization of global minimum standardspresents great opportunities for firms that develop technologies and products because theywill no longer have to pay as much attention to localized protection and enforcementproblems in safeguarding their proprietary information. In turn, they can focus their R&Dprograms on those areas with the highest global payoffs. Ultimately, however, it meansthat IPRs no longer will play much role in determining locational choice.
2d. Intellectual Property Rights in a Broader Context
The discussion so far has focused on a narrow interpretation of how IPRs interactwith incentives for FDI and technology transfer. Many analysts, however, claim thatstrong IPRs play a much larger role in signaling to potential investors that a particularcountry recognizes and protects the rights of foreign firms to make strategic businessdecisions with few government impediments (Sherwood, 1990). In this view, tradeliberalization, or the removal of market restrictions at the border, is insufficient to provideassurances that an economy is becoming more open to international commerce. Marketaccess could remain blocked by inefficient investment regulations, limited rights ofestablishment, domestic credit, production and marketing controls, arbitrary or punitivetaxes, licensing restrictions, and weak IPRs. Indeed, the issue of attaining market access

19
through rationalization of these internal barriers to competition is now at the top of theinternational trade-policy agenda (Hoekman, 1997). Some also consider stronger IPRs toconvey a commitment to move from opaque to transparent legal systems, from arbitrarypronouncements to unbiased enforcement of commercial laws, and from corruption toprofessionalism in public management.
Because intellectual property protection has taken on increasing importance toMNEs, the adoption of stronger regimes has become a primary signaling device thatgovernments in emerging economies use to indicate a shift toward a more business-friendly environment. The objective is to attract more FDI through this signal, whateverthe particular incentives that may be generated in various sectors by stronger IPRs. Todate, there is little evidence supporting the responsiveness of investment to this signal, butthere is a widespread and growing belief in its importance in emerging economies. Thisphenomenon explains why several poor countries with limited technical capabilitiesunilaterally have strengthened their IPRs laws and enforcement in the 1990s, despiteserious questions about the wisdom of doing so. They prefer not to be left behind in theglobal competition for capital and technology. It also helps explain the universalacceptance of the TRIPs agreement.
3. The Econometric Evidence on FDI, Technology Transfer, and Growth
Despite the apparent importance that IPRs could play in FDI decisions, untilrecently they have not been incorporated into empirical work by economists on thedeterminants of investment. This oversight reflects both skepticism about the significanceof IPRs and the difficulty of measuring both IPRs and their impacts. Rather, economistshave focused on variables capturing the influence of macroeconomic factors, risk, wagecosts, trade impediments, industrial structures, and taxes, infrastructure, and otherincentives or disincentives to investment. As may be expected, there is considerablediversity in the findings. This is an enormous literature that cannot be reviewed here inany detail. However, a brief overview of a few key results is useful in order to place IPRsinto some perspective.
3a. Main Determinants of FDI
It is most convenient to list the major influences on an MNE’s decision to invest invarious countries by grouping them into types. Within each type, I attempt to assess therelative importance of each factor, though it is impossible to do this in general termsbecause the factors are interrelated and they vary across countries and time periods. Ininterpreting these factors, recall the simple point that a decision to invest dependspositively on the investment’s expected future profitability and negatively on its expectedprofit variability, or risk. The discussion here relies on results taken from Wheeler andMody (1992), Barrell and Pain (1996), Kravis and Lipsey (1982), Culem (1988), Grubertand Mutti (1991), and Amirahmadi and Wu (1994).

20
Macroeconomic Factors
All studies agree that a major factor attracting FDI is market size in the recipientcountry. Market size is measured first by real GNP or GDP. The larger is the market, thegreater is the incentive to enter through FDI in order to take advantage of scaleeconomies. For example, Wheeler and Mody estimate that the elasticity of incomingmanufacturing FDI with respect to real GDP is 1.24 and this coefficient is highlysignificant. Thus, a one-percent increase in real GDP could be expected to increase FDIby more than one percent. This elasticity rises sharply with the level of development; forpoor countries the elasticity of FDI with respect to market size is 0.24 Note that theimportance of market size favors regional trade agreements as a means of encouraginginward FDI to the extent that such agreements expand the size of the region that localproduction can service without restrictions.
In a related vein, the rate of growth of real GDP has a strong positive effect onincoming FDI. This is because of an acceleration principle; as the economy growsadditional investment (including FDI) is required to meet its needs. This fact is consistentwith the concentration of FDI going to developing economies in East Asia and LatinAmerica in the last ten years.
As indicated in the theoretical discussion earlier, the level of GNP per capitaaffects both the amount of investment and its nature. Total investment rises with the levelof economic development because such increases shift preferences toward goods with ahigher technology content or with more product differentiation and higher quality. Thisfactor also causes FDI to become more horizontal as development proceeds.
Finally, some analysts emphasize the role of exchange rate changes in influencingFDI flows. Barrell and Pain (1996) find that a current real appreciation of the dollarinduces U.S. firms to bring forward their planned FDI in OECD countries because ofcheaper local acquisition costs, affecting the temporal pattern of investment if not its stockin the long run. However, an expected future real appreciation of the dollar tends topostpone U.S. investment. Finally, considerable riskiness in real exchange rates tends toincrease FDI because MNEs find it profitable to reduce exports but offset this reductionby increasing foreign production (Cushman, 1985). Overall, however, there is relativelylittle agreement among economists that such exchange-rate factors are systematic andimportant in the long run.

21
Relative Input Costs
A consistent finding is that differences in real unit labor costs between the sourceand host countries are an important determinant of locational decisions. Wheeler andMody (1992) find that this is the most significant variable in explaining U.S. investment inthe electronics industry, with an average elasticity of 1.99. That is, a fall in relative laborcosts of one percent raises FDI by 1.99% in electronics. This elasticity is even higher inthe poorest countries. The relative-wage effect is much smaller, though significant, inexplaining total manufacturing investment. Thus, vertical investment (proxied byelectronics FDI) is more sensitive to wage differences than is horizontal investment.
Several studies include relative costs of capital (interest rates or user costs ofcapital) in the host and source countries in order to account for the decisions of MNEs onwhere to finance the investment. While these costs do influence the location of financing,they seem to have relatively little impact on the extent of FDI.
Finally, it is clear that much vertical investment in extractive sectors is driven bythe abundant local availability and low cost of natural resources. This has some effect ondecisions to locate assembly operations that rely on resource inputs, such as processedfoods.
Agglomeration Effects
Economists have spent considerable effort recently analyzing the importance ofagglomeration processes. Agglomeration occurs if, as the number of firms in a particularlocation rises, the costs of production for all firms fall together. A primary reason for thisis that concentrated activity encourages the development of higher quality, differentiatedproducer inputs (such as engineering skills and finance). As the pool of specialized laborexpands, new firms find it advantageous to locate in the area (Markusen, 1989; Krugman,1991). Hanson (1996) finds considerable evidence of such effects in the Mexican apparelsector. That it is significant in FDI decisions has been shown by Wheeler and Mody(1992), among others.
It is clear that the effectiveness of agglomeration in attracting FDI depends on theamount and quality of supporting infrastructure in the economy. Infrastructure refers tofacilities for trade, transportation, communication, and energy use. It also depends onmarket size. Thus, if a country is interested in industrial development through attractinginvestment into a particular region, it must pay attention to developing infrastructure andestablishing a large and vibrant market (even if exported) for the output.
Policy Variables
There is evidence that FDI is sensitive to differences across countries in corporatetax rates (Grubert and Mutti, 1991). These authors find that a reduction in the host-country tax rate from 20% to 10% could increase the stock of plant and equipment owned

22
by U.S. affiliates in a particular country by 65%. These findings are controversial amongeconomists and await further testing, but taxes are potentially important in attracting FDI.
The same authors find that discincentives to investment, as proxied by dummyvariables for countries that do not allow more than 50% equity ownership for foreigninvestors, have a strong negative effect on inward FDI. Wheeler and Mody (1992) alsoshow that a variable relying on investment regulations, such as local content requirements,ownership limits, and profit repatriation controls, have a negative impact on FDI. Thus,such policies are effective in limiting investment, if that is their goal. In contrast, taxbreaks and other production incentives, such as those found in Export Processing Zones,have variable effectiveness at encouraging FDI across countries (Amirahmadi and Wu,1994). They seem to have been particularly effective in China, with over 12% of FDIgoing to such zones in the 1980s, though this finding does not control for other Chineseinfluences.
Trade policy also strongly affects incentives for FDI. The traditional view is thathigh tariffs would encourage incoming FDI in order to produce behind the tariff wallswhat could not be exported to a protectionist country. A number of studies of OECDdata from the 1970s and early 1980s were consistent with this theory. Such protectionrarely attracted much investment into developing countries, however, as their governmentsalso tended to impose significant investment barriers in order to reserve local markets fordomestic firms. The issue has become more ambiguous as globalization has proceeded inthe last decade, however. On the one hand, trade barriers provide a protected market forfirms, which encourages location of final goods production. However, they also restrictaccess of MNEs to the latest international technologies available through importingmachinery, chemicals, and other key inputs. International firms place increasingimportance on the ability to buy producer inputs at cheapest cost and highest quality,suggesting that closed economies are likely to attract less investment today than they mayhave in the past. This observation is consistent with the findings in Wheeler and Mody(1992). Indeed, high tariff rates appear to reduce FDI in China markedly (Wang andSwain, 1994). Moreover, it is increasingly apparent that FDI flows and merchandise tradeincrease together, rather than substitute for one another, in rapidly growing economies.Thus, trade liberalization is now an important complement to programs to encourageinvestment.
Finally, both FDI and technology transfer through licensing are likely to rise as aneconomy’s technological capacities improve. Key in this process is the development of anabundant human capital stock, because labor skills are required for absorbing, using, andimproving incoming technology. Thus, educational competence, particularly in technicaland managerial areas, is significant (Teece, 1986). Also important are professionalsupport programs for technology transfer and technology diffusion.

23
Risk Factors
A final set of determinants that economists analyze relates to economic andpolitical risks facing particular investors. Numerous studies demonstrate that MNEs areless likely to invest in countries with risks of expropriation, limited and variable profitrepatriation rules, terrorism and violence, corruption, bureaucracy and red tape, ineffectivelegal systems, and considerable income inequality. Thus, both macroeconomic certaintyand political stability are important to MNEs. How significant this factor is in relation toothers depends on the type and duration of investment.
One related finding worth mentioning is that countries that repress labororganization rights, in the hope that a stable, quiescent, and low-wage labor force willattract FDI, do not receive more investment as a result (OECD, 1996). In this context, itis far less important to provide firms with artificial advantages and far more important todevelop a stable and transparent set of rules for business operation.
3b. Evidence on Intellectual Property Rights
A few studies have included the strength of IPRs in different countries as apotential determinant of FDI. Recall from our theoretical discussion that this is essentiallyan empirical question. While the weight of theory lies on the side of a positive impact, it isambiguous overall.
Three early studies (Ferrantino, 1993; Mansfield, 1993; Maskus and Eby-Konan,1994) could not find any relationship between crude measures of intellectual propertyprotection and the international distribution of FDI by U.S. multinational enterprises.These articles suffered from limited specification of models and poor measurements ofIPRs and their results should be largely discounted.
Two recent studies are more noteworthy. Lee and Mansfield (1996) used surveyresults to develop an index of perceived weakness of IPRs in destination countries on thepart of U.S. firms. They regressed the volume of U.S. direct investment in variouscountries over the period 1990-1992 on this index, along with measures of market size,the past investment stock, the degree of industrialization, a measure of openness, and adummy variable for Mexico to control for its special investment relationship with theUnited States. They find that weakness of IPRs has a significant negative impact on thelocation of American FDI. Further, in a sample of chemical firms the proportion of FDIdevoted to final production or R&D facilities is negatively and significantly associatedwith weakness of protection. Moreover, the weakness of IPRs had much less impact onthe decisions of firms with limited ownership (less than 50%) of local affiliates becausesuch firms would be unlikely to transfer their frontier technologies in any case. Fromthese results, it appears that both the volume and quality of investment are diminished incountries with limited property rights.

24
An extended approach is taken by Maskus (1998). He argues that the priorliterature is incorrectly specified in that it does not recognize the joint decisions made byMNEs. In particular, multinational firms may choose to export, raise sales from existingforeign operations, increase investment, or transfer technology directly in response tostronger patent rights. He estimates a simultaneous set of equations to capture these jointimpacts, controlling for market size, tariff protection, the level of local R&D by affiliates,distance from the United States, and investment incentives and disincentives provided bylocal authorities. This is done for a panel of 46 destination countries, using annual datafrom 1989-1992. The index of patent strength is taken from Maskus and Penubarti(1995).
Table 8 lists the results from the preferred specifications, with coefficientsexpressed as elasticities. It appears from these calculations that FDI, as measured by theasset stock, reacts positively to patent strength in developing countries. These areelasticities, so that the data suggest that a one percent rise in the extent of patentprotection would expand the stock of U.S. investment in that country by 0.45%, otherthings equal. This is a significantly positive elasticity and, indeed, trails only theresponsiveness of FDI to policy incentives. While these results await considerable furthertesting for their robustness, they suggest that FDI is sensitive to patent rights, consistentwith Mansfield’s work.
3c. Other Empirical Work on the Effects of IPRs
There is evidence that a policy of weak IPRs in technology-recipient nationsreduces the quality of technology transferred. Drawing on a study of collaborationagreements between British and Indian firms, Davies (1977) concludes that difficulties insecuring property rights over the profits accruing to technical information raise powerfulbarriers to information trades between developed and developing economies. Contractor(1980) studies a sample of 102 technology licenses provided by U.S. firms and hisregression results support the hypothesis that returns to a technology supplier increasewith patent protection in the recipient nation. He finds that technologies transferred todeveloping countries tend to be significantly older than those transferred to industrializedeconomies. While these findings are dated, they point to the significance of patent regimesin attracting technology through licensing.
Evidence also exists that the effectiveness of IPRs protection in inducing technicalinnovation and technology transfer depends on the trade orientation of an economy. In asurvey of more than 3000 Brazilian companies, Braga and Wilmore (1991) find that firms’propensities to develop their own technologies or to purchase them from foreign sourcesare both negatively related to the degree of trade protection they enjoyed. Thus, in closedeconomies, protecting IPRs may not expand innovation much because the competitiveconditions are inadequate to stimulate it. Gould and Gruben (1996) performed cross-country growth regressions using data on patent protection, openness of trade regimes,and country-specific characteristics. They find that patent strength is an important

25
determinant of economic growth across countries and that this effect is stronger inrelatively open economies. In their preferred specification, estimates suggest that growthinduced by IPRs protection (at moderate levels of protection among developing countries)is approximately 0.66 percent higher per year in open economies than in closedeconomies. This finding bears the important implication that as countries liberalize theirtrade regimes, accompanying strengthening of IPRs provides a more affirmative path toeconomic growth.
4. Policies to Attract Beneficial FDI and Technology Transfer
This extensive review indicates that, in theory, investment and licensing flows donot necessarily increase with a strengthening of intellectual property rights, but there isemerging empirical evidence in favor of that hypothesis. It seems increasingly to be takenfor granted that foreign direct investment and the acquisition of new technologies throughFDI and licensing are beneficial for the recipient country. As discussed in this section,there is a strong presumption in this direction but it is not a necessary outcome in allsituations. Rather, it is important that such flows result in stronger competition in order toensure these gains for the long term. After a brief review of the potential benefits andcosts of these activities, I discuss components of a coherent policy approach to enhancethe likelihood that stronger IPRs in an emerging economy will contribute to more dynamiccompetition.
4a. Benefits and Costs of Inward FDI and Licensing
Although their impacts vary across countries and over time, FDI and licensing bearconsiderable promise for improving efficiency and growth in developing countries,particularly those that are scarce in capital, are far from the efficient production frontier,and have limited managerial and entrepreneurial talents. These flows provide access to thetechnological and managerial assets of foreign MNEs, which provide both a direct spur toproductivity and significant spillover benefits as they diffuse throughout the economy.This diffusion comes through numerous channels, including the movement of newlytrained labor among enterprises, the laying out of patents, product innovation through thelegitimate “inventing around” of patents and copyrights, and the adoption of newer andmore efficient specialized inputs that reduce production costs (software is particularlyimportant in this context). Further, the introduction of efficient and competitiveinternational enterprises can stimulate local entrepreneurship and innovation by increasingcompetition and raising demands for sub-contracting. There could also be a beneficialdemonstration effect for local firms.
Thus, successful adoption of competition-enhancing FDI and licensing shouldmaterially improve the knowledge base of the economy and move it toward the globallyefficient production frontier. There is undeniable evidence that developing countries sufferfrom significantly lagging labor productivity and managerial efficiency, related in part to afailure to adopt newest technologies (Trefler, 1995; Baumol, et al, 1992). Recent

26
experiences in numerous developing economies indicate that liberalization of trade policiesand investment regimes can have significantly positive growth impacts in the mediumterm, even if there is some initial economic adjustment period. Further, there is littledoubt that a major determinant of relatively rapid economic growth and industrialrestructuring in East Asia has been access to foreign technologies through both licensingand FDI in addition to importation of advanced machinery and other technical inputs(World Bank, 1993). There are good reasons to expect these growth effects to be long-lasting because wider access to knowledge allows economic expansion to continuewithout necessarily running into diminishing returns. Additional benefits include access toa wider variety of specialized products, inputs, and technologies, a deeper and better-trained skilled labor pool, and rising real wages.
These beneficial impacts of inward FDI and technology transfer do not comewithout costs. If there are only insignificant linkages to other economic sectors, FDI mayoperate in enclaves, with limited spillovers into technologies adopted and wages earned bylocal firms and workers.7 This limited diffusion could be insufficient to compensate theeconomy for the profits taken out by the MNE. That is, because profit repatriation andlicense fees are the payments emerging countries make for incoming capital, technology,and advanced producer services, the terms of this exchange could be unfavorable in asocial sense, if not in a private sense. This situation is aggravated to the extent that MNEsengage in abusive practices of their protected market positions in exploiting stronger IPRs.Such abuses could emerge in setting restrictive licensing conditions, requiring technologygrant-backs, engaging in tied sales, tying up technology fields through cross-licensingagreements, establishing vertical controls through distribution outlets that prevent productcompetition, price discrimination, and predation against local firms. Thus, countries couldfind certain sectors of their economies coming under increasing control of MNEs throughexploitation of their specific advantages, including brand names, patented technology,marketing skills, and economies of scale.
While these are possible and real costs, there is little evidence that they aresystematic problems in many countries. More fundamentally, they relate to the failure ofan economy to erect a policy system that promotes the maximum gains from FDI.Enclave production, for example, makes sense only when the subsidiary is encouraged toproduce only for export rather than to compete locally as well. Firms that are providedfull access to local and regional markets are more likely to erect complementary businesssystems (production, distribution, and services) that compete more widely in the economyand generate greater spillover benefits. Abusive practices are possible only to the extentthat monopoly positions are protected and tolerated. Many developing economies havenot yet developed appropriate competition rules to deal with these issues, preferringinstead to forego the benefits of FDI and licensing by claiming an unwillingness to suffersuch abuses, at least at the hands of foreign firms.
7 For example, Aitken, et al, (1996) provide evidence that U.S. multinationals operating inMexico and Venezuela pay significantly higher wages than average to their ownemployees but these wage impacts have not spread to other parts of the economy.

27
4b. Intellectual Property Rights
Seen properly, IPRs do not necessarily generate monopoly market positions thatresult in high prices, limited access, and exclusive use of technologies. They are moresimilar to standard property rights, in that they define the conditions within which a rightowner competes with rivals (UNCTAD, 1996). Except in particular sectors, cases areinfrequent in which a patent holder or copyright owner becomes a strong monopolist.Rather, there are likely to be competing products and technologies, including new onesthat do not infringe the property right. Much depends on the scope of the product andprocess claims protected and on the technical characteristics of the invention. Forexample, narrow patent claims are relatively easy to invent around in generating follow-oninnovation.
Thus, IPRs may encourage dynamic competition, even if they sometimes diminishcompetition among existing products. Advocates of strong IPRs maintain that they createcompetition with long-run consumer benefits. For example, survey evidence indicates thatpatent disclosure requirements are significant mechanisms for diffusing technicalinformation to competitors within a short period (Mansfield, 1985). The information maythen be used to develop a new product or process that competes with the original. Thisincremental nature of innovation is a key fact in most technical progress and generallybuilds dynamic competition rather than investing unassailable market power. Thus,patents, copyrights, and other IPRs can raise the costs of imitation but likely do notmaterially retard competing product introduction. Moreover, patents and trademarksprovide greater certainty to firms, lower the costs of transferring technology, and facilitatemonitoring of licensee operations. Additional licensing could then result in greateradaptive innovation in user firms.
In this view, stronger IPRs in developing economies promise long-term growthand efficiency benefits as they attract additional FDI and licensing and spur further follow-on innovation and technology spillovers. This outcome is far more likely, however, if theimplementation of stronger IPRs is accompanied by complementary policies that promotedynamic competition.
4c. Broader Policy Approaches
Overall, it is wider market access to the local economy, in conjunction withsensible competition rules and related regulatory systems, that promise to procure thegreatest net benefits from incoming investment. Thus, emerging economies that wish toincrease their attractiveness to foreign investors would be advised first to proceed withsignificant market liberalization. While the Uruguay Round committed most countries tocutting trade barriers, further reduction of tariffs and removal of NTBs on a credible andirrevocable schedule would provide an important signal of openness to foreign investors.Regional trade integration, particularly with developed economies that could be the sourceof additional FDI, could assist in this process. However, such agreements also bear

28
potential for trade and investment diversion and should be considered carefully in eachinstance.
Developing countries need also to expand rights of establishment in services, inlight of the complementary nature of FDI in production and services with merchandisetrade. Removal or rationalization of various investment regulations, such as local contentrequirements, equity restrictions, and limitations on profit repatriation, would expandincentives to invest. It is likely that such regulations generate net welfare losses for thecountries imposing them, in any case. Finally, continued privatization of state-ownedenterprises could attract further capital as it raises domestic competition.
Recalling the econometric work on determinants of FDI, it is important foremerging economies to pursue sound and stable macroeconomic policies. Development ofmodern and efficient infrastructure is also important and could be instrumental inpromoting agglomeration gains that attract cumulatively higher amounts of both domesticand foreign investment. There is also evidence that FDI flows are sensitive tointernational variations in taxes and incentives. While this provides some argument forfiscal advantages, such as tax holidays, accelerated depreciation allowances, tariffexemptions, and EPZs, it suggests more powerfully the gains from establishing relativelylow tax rates and uniform tax treatment of all investors, domestic and foreign. Certaintyand stability in taxes are more effective in promoting investment than are discriminatoryand arbitrary policies, while uniform tax schedules can generate considerable efficiencies inresource usage (Konan and Maskus, 1997). Similarly, there is no evidence that repressionof labor rights aids in attracting FDI or promoting exports. Rather, firms are moreinterested in market size, stability, and growth. In any case, the technical superiority ofany investments that would be so attracted in labor-intensive sectors is likely to be quitelimited.
An important component of any program to attract high-quality FDI andtechnology transfer is the development of a competent indigenous technological capacity.In the first instance, this calls for public and private investments in education and trainingand the removal of impediments to the acquisition of human capital. It also points towardthe development of national innovation systems that promote dynamic competition(UNCTAD, 1996). This involves supporting basic research capabilities, removingdisincentives for applied R&D and its commercialization, instituting incentive structuresthat help stimulate local innovation, and taking greater advantage of access to scientificand technical information that exists within the global information infrastructure. To date,governments and firms in many developing countries have made inadequate progress inthis regard.
Intellectual property rights are an important component of any technologydevelopment program. In implementing stronger IPRs as required by the TRIPsAgreement or in other policy initiatives, emerging economies will need to strike a balancebetween needs for technology acquisition, market access, and diffusion. Most nations willwish to adopt a set of IPRs regulations that do not significantly disadvantage follow-on

29
inventors and creators, making use of sensible fair-use exemptions, compensatedcompulsory licensing under tightly defined conditions, and carefully defining the scope ofprotection. Furthermore, it will be important to implement effective competition rules toensure that IPRs systems are used advantageously. Each of these policy initiativesrequires the development of considerable administrative and judicial expertise. Forexample, countries may wish to monitor the terms of key technology licensing agreementsor to intervene in contracts for the development of indigenous public resources.
5. Concluding Remarks
This paper has reviewed recent trends in FDI and licensing, along with consideringthe available evidence on what factors are most important in making these decisions. Thefundamental message here is that, while there are indications that strengthening intellectualproperty rights can be an effective means of inducing additional inward FDI, it is only acomponent of a far broader set of important influences. Emerging economies shouldrecognize the strong complementarities among IPRs, market liberalization andderegulation, technology development policies, and competition regimes. These arecomplicated issues, leading to complex tradeoffs for market participants. Governments inemerging economies would do well to devote considerable attention and analysis to meansfor assuring they will achieve net gains from stronger IPRs and additional IPRs andlicensing over time.
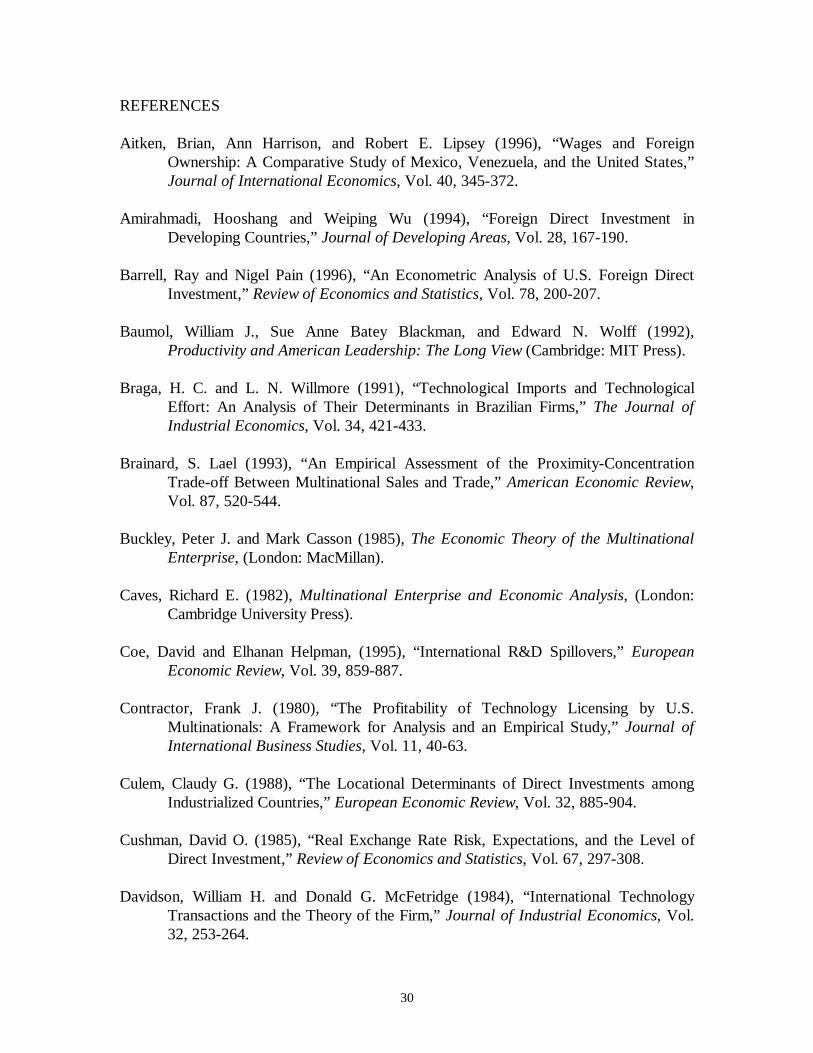
30
REFERENCES
Aitken, Brian, Ann Harrison, and Robert E. Lipsey (1996), “Wages and ForeignOwnership: A Comparative Study of Mexico, Venezuela, and the United States,”Journal of International Economics, Vol. 40, 345-372.
Amirahmadi, Hooshang and Weiping Wu (1994), “Foreign Direct Investment inDeveloping Countries,” Journal of Developing Areas, Vol. 28, 167-190.
Barrell, Ray and Nigel Pain (1996), “An Econometric Analysis of U.S. Foreign DirectInvestment,” Review of Economics and Statistics, Vol. 78, 200-207.
Baumol, William J., Sue Anne Batey Blackman, and Edward N. Wolff (1992),Productivity and American Leadership: The Long View (Cambridge: MIT Press).
Braga, H. C. and L. N. Willmore (1991), “Technological Imports and TechnologicalEffort: An Analysis of Their Determinants in Brazilian Firms,” The Journal ofIndustrial Economics, Vol. 34, 421-433.
Brainard, S. Lael (1993), “An Empirical Assessment of the Proximity-ConcentrationTrade-off Between Multinational Sales and Trade,” American Economic Review,Vol. 87, 520-544.
Buckley, Peter J. and Mark Casson (1985), The Economic Theory of the MultinationalEnterprise, (London: MacMillan).
Caves, Richard E. (1982), Multinational Enterprise and Economic Analysis, (London:Cambridge University Press).
Coe, David and Elhanan Helpman, (1995), “International R&D Spillovers,” EuropeanEconomic Review, Vol. 39, 859-887.
Contractor, Frank J. (1980), “The Profitability of Technology Licensing by U.S.Multinationals: A Framework for Analysis and an Empirical Study,” Journal ofInternational Business Studies, Vol. 11, 40-63.
Culem, Claudy G. (1988), “The Locational Determinants of Direct Investments amongIndustrialized Countries,” European Economic Review, Vol. 32, 885-904.
Cushman, David O. (1985), “Real Exchange Rate Risk, Expectations, and the Level ofDirect Investment,” Review of Economics and Statistics, Vol. 67, 297-308.
Davidson, William H. and Donald G. McFetridge (1984), “International TechnologyTransactions and the Theory of the Firm,” Journal of Industrial Economics, Vol.32, 253-264.
31
Davidson, William H. and Donald. G. McFetridge (1985), “Key Characteristics in theChoice of International Technology Transfer Mode,” Journal of InternationalBusiness Studies, Summer, 5-21.
Davies, Howard (1977), “Technology Transfer through Commercial Transactions,” TheJournal of Industrial Economics, Vol. 26, 161-175.
Dunning, John H. (1981), International Production and the Multinational Enterprise,(London: George Allen and Unwin).
Eaton, Jonathan and Samuel J. Kortum, (1996), “Trade In Ideas: Patenting andProductivity in the OECD,” Journal of International Economics, Vol. 40, 251-278.
Ferrantino, Michael J. (1993), “The Effect of Intellectual Property Rights on InternationalTrade and Investment,” Weltwirtschaftliches Archiv, Vol. 129, 300-331.
Glass, Amy and Kamal Saggi (1995), “Intellectual Property Rights, Foreign DirectInvestment, and Innovation,” Ohio State University, manuscript.
Gould, David M. and William C. Gruben (1996), “The Role of Intellectual Property Rightsin Economic Growth,” Journal of Development Economics, Vol. 48, 323-350.
Grubaugh, Stephen G. (1987), “Determinants of Direct Foreign Investment,” Review ofEconomics and Statistics, Vol. 69, 149-151.
Grubert, Harry and John Mutti (1991), “Taxes, Tariffs and Transfer Pricing inMultinational Corporate Decision Making,” Review of Economics and Statistics,Vol. 71, 285-294.
Hanson, Gordon H. (1996), “Localization Economies, Vertical Organization, and Trade,”American Economic Review, Vol. 86, 1266-1278.
Helpman, Elhanan (1993), “Innovation, Imitation, and Intellectual Property Rights,”Econometrica, Vol. 61, 1247-1280.
Hoekman, Bernard (1997), “Focal Points and Multilateral Negotiations on theContestability of Markets,” in K. E. Maskus, P. Hooper, E. E. Leamer, and J. D.Richardson, eds., Quiet Pioneering: Robert M. Stern and His InternationalEconomic Legacy, (Ann Arbor: University of Michigan Press), 171-192.
Horstmann, Ignatius and James R. Markusen (1987), “Licensing Versus DirectInvestment: A Model of Internalization by the Multinational Enterprise,” CanadianJournal of Economics, Vol. 20, 464-481.

32
Konan, Denise and Keith E. Maskus (1997), “Joint Trade Liberalization and Tax Reformin a Small Open Economy: The Case of Egypt,” University of Colorado,manuscript.
Kravis, Irving B. and Robert E. Lipsey (1982), “Location of Overseas Production andProduction for Export by U.S. Multinational Firms,” Journal of InternationalEconomics, Vol. 12, 201-223.
Krugman, Paul (1991), “Increasing Returns and Economic Geography,” Journal ofPolitical Economy, Vol. 99, 483-499.
Lai, Edwin L. C. (1998), “International Intellectual Property Rights Protection and theRate of Product Innovation,” Journal of Development Economics, forthcoming.
Lee, Jeong-Yeon and Mansfield, Edwin (1996), “Intellectual Property Protection and U.S.Foreign Direct Investment,” Review of Economics and Statistics, Vol. 78, 181-186.
Mansfield, Edwin (1985), “How Rapidly Does Industrial Technology Leak Out?” Journalof Industrial Economics, Vol. 34, 217-223.
Mansfield, Edwin (1993), “Unauthorized Use of Intellectual Property: Effects onInvestment, Technology Transfer, and Innovation,” in M. B. Wallerstein, M. E.Mogee, and R. A. Schoen, eds., Global Dimensions of Intellectual PropertyRights in Science and Technology, (Washington, DC: National Academy Press,1993), 107-145.
Mansfield, Edwin (1994), Intellectual Property Protection, Foreign Direct Investment,and Technology Transfer, International Finance Corporation, Discussion Paper 19.
Mansfield, Edwin (1995), Intellectual Property Protection, Direct Investment andTechnology Transfer: Germany, Japan, and the United States, InternationalFinance Corporation, Discussion Paper 27.
Markusen, James R. (1989), “Trade in Producer Services and in Other SpecializedIntermediate Inputs,” American Economic Review, Vol. 85, 85-95.
Markusen, James R. (1994), “Multinationals, Multi-Plant Economics, and the Gains fromInternational Trade,” Journal of International Economics, Vol. 16, 205-226.
Markusen, James R. (1995), “The Boundaries of Multinational Enterprises and the Theoryof International Trade,” Journal of Economic Perspectives, Vol. 9, 169-189.

33
Maskus, Keith E. (1998), “The International Regulation of Intellectual Property,”forthcoming in Weltwirtschaftliches Archiv, June.
Maskus, Keith E. and Denise Eby-Konan (1994), “Trade-Related Intellectual PropertyRights: Issues and Exploratory Results,” in Alan V. Deardorff and Robert M.Stern, eds., Analytical and Negotiating Issues in the Global Trading System, (AnnArbor: University of Michigan Press), 401-446.
Maskus, Keith E. and Mohan Penubarti (1995), “How Trade-Related Are IntellectualProperty Rights?” Journal of International Economics, Vol. 39, 227-248.
Maskus, Keith E. and Allan Webster (1995), “Comparative Advantage and the Locationof Inward Foreign Direct Investment: Evidence from the U.K. and South Korea,”The World Economy, Vol. 18, 315-238.
Morck, Randall and Bernard Yeung (1992), “Internalization: An Event Study Test,”Journal of International Economics, Vol. 33, 41-56.
Organization for Economic Cooperation and Development (1996), Trade, Employment,and Labour Standards, (Paris: OECD).
Rockett, Katharine (1990), “The Quality of Licensed Technology,” International Journalof Industrial Economics, Vol. 8, 559-574.
Rugman, Alan M. (1986), “New Theories of the Multinational Enterprise: An Assessmentof Internalization Theory,” Bulletin of Economic Research, Vol. 38, 101-118.
Sherwood, Robert M. (1990), Intellectual Property and Economic Development,(Boulder, CO: Westview Press).
Smith, Pamela J. (199), “Are Weak Patent Rights a Barrier to U.S. Exports?” Journal ofInternational Economics, forthcoming.
Taylor, M. Scott (1994), “Trips, Trade, and Growth,” International Economic Review,Vol. 35, 361-381.
Teece, David J. (1977), “Technology Transfer by Multinational Firms: the Resource Costof Transferring Technological know-how,” Economic Journal, Vol. 87, 242-261.
Teece, David J. (1986), The Multinational Corporation and the Resource Cost ofInternational Technology Transfer, (Cambridge: Ballinger).
Trefler, Daniel, (1995), “The Case of the Missing Trade and Other Mysteries,” AmericanEconomic Review, Vol. 85, 1029-1046.

34
United Nations Conference on Trade and Development (1996), The TRIPS Agreementand Developing Countries, (New York: United Nations).
Vishwasrao, Sharmila (1994), “Intellectual Property Rights and the Mode of TechnologyTransfer,” Journal of Development Economics, Vol. 44, 381-402.
Wang, Zhen Quan and Nigel J. Swain (1994), “The Determinants of Foreign DirectInvestment in Transforming Economies: Empirical Evidence from Hungary andChina,” Weltwirtschaftliches Archiv, Vol. 130, 359-382.
Wheeler, David and Ashoka Mody (1992), “International Investment Location Decisions:The Case of U.S. Firms,” Journal of International Economics, Vol. 33, 57-76.
World Bank (1993), The East Asian Miracle: Economic Growth and Public Policy,(Oxford: Oxford University Press).
Zeile, William J. (1993), “Merchandise Trade of U.S. Affiliates of Foreign Companies,”Survey of Current Business, Vol. 73, 52-65.
Zhang, Kevin H. (1996), Theory and Evidence Regarding Multinational Enterprises andInternational Trade, unpublished Ph.D. Dissertation, University of Colorado,Boulder.

35
Table 1. Total Foreign Direct Investment Flows, Selected Countries ($ million)________________________________________________________________________ 1987 1990 1995Country Inward Outward Inward Outward Inward Outward________________________________________________________________________United States 58220 28360 47920 29950 60230 95530Canada 8040 8540 7855 4725 10786 5761Japan 1170 19520 1760 48050 60 22660Germany 1820 9760 2530 24210 8940 34890United Kingdom 15696 31335 32430 19320 32210 40330Spain 4571 745 13987 3522 6250 3574Poland 12 8 89 na 3659 42
China 2314 645 3487 830 35849 2000Korea 616 540 788 1056 1776 3529Malaysia 423 na 2332 na 4348 naIndonesia 385 na 1093 na 4348 603Singapore 2836 206 5575 2034 6912 3906Thailand 352 170 2444 140 2068 886Egypt 948 19 734 12 598 93Kenya 39 31 57 na 33 naTurkey 115 9 684 16 885 113Mexico 2621 na 2634 na 6963 naArgentina -19 na 1836 na 1319 155Brazil 1169 138 989 665 4859 1384Chile 891 6 590 8 1695 687_______________________________________________________________________Source: International Monetary Fund, Balance of Payments Statistics
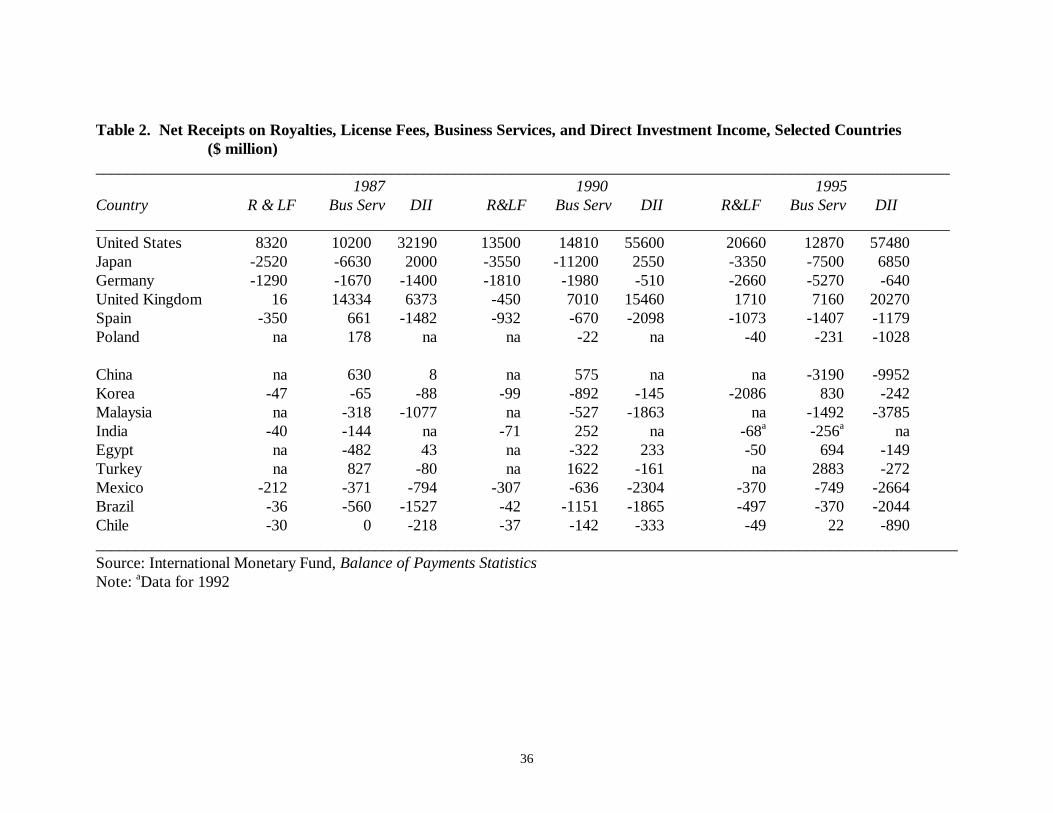
36
Table 2. Net Receipts on Royalties, License Fees, Business Services, and Direct Investment Income, Selected Countries($ million)
___________________________________________________________________________________________________________ 1987 1990 1995Country R & LF Bus Serv DII R&LF Bus Serv DII R&LF Bus Serv DII___________________________________________________________________________________________________________United States 8320 10200 32190 13500 14810 55600 20660 12870 57480Japan -2520 -6630 2000 -3550 -11200 2550 -3350 -7500 6850Germany -1290 -1670 -1400 -1810 -1980 -510 -2660 -5270 -640United Kingdom 16 14334 6373 -450 7010 15460 1710 7160 20270Spain -350 661 -1482 -932 -670 -2098 -1073 -1407 -1179Poland na 178 na na -22 na -40 -231 -1028
China na 630 8 na 575 na na -3190 -9952Korea -47 -65 -88 -99 -892 -145 -2086 830 -242Malaysia na -318 -1077 na -527 -1863 na -1492 -3785India -40 -144 na -71 252 na -68a -256a naEgypt na -482 43 na -322 233 -50 694 -149Turkey na 827 -80 na 1622 -161 na 2883 -272Mexico -212 -371 -794 -307 -636 -2304 -370 -749 -2664Brazil -36 -560 -1527 -42 -1151 -1865 -497 -370 -2044Chile -30 0 -218 -37 -142 -333 -49 22 -890____________________________________________________________________________________________________________Source: International Monetary Fund, Balance of Payments StatisticsNote: aData for 1992
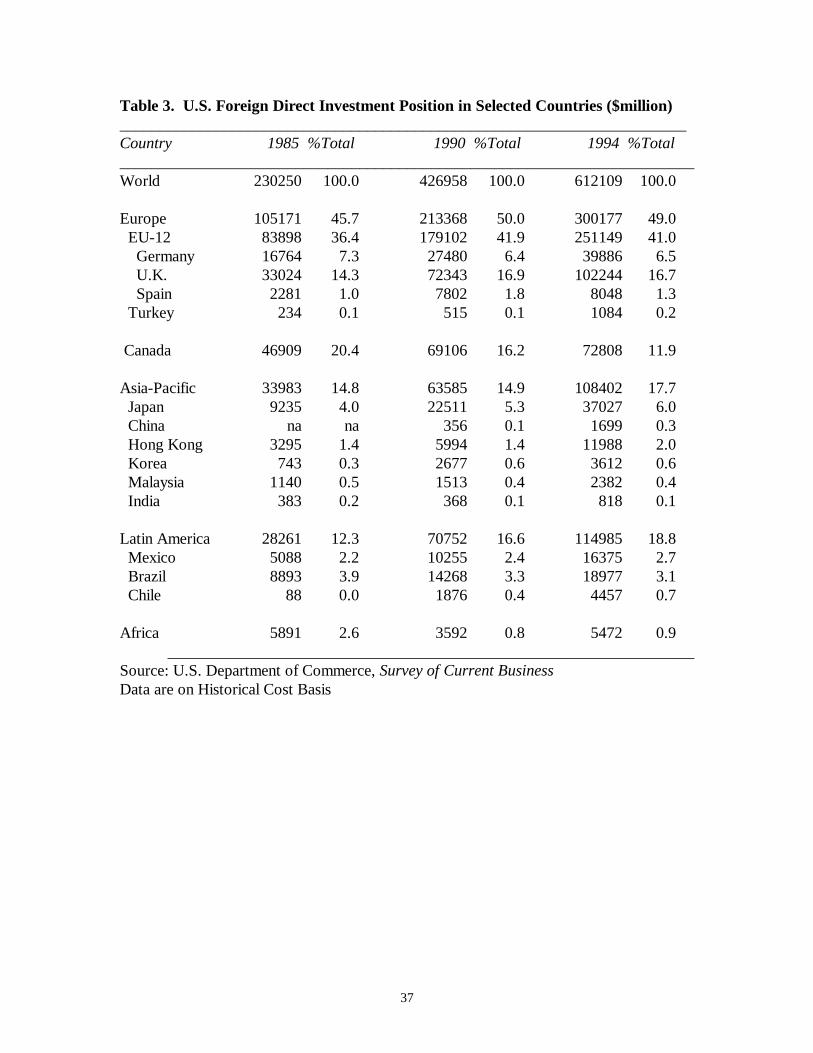
37
Table 3. U.S. Foreign Direct Investment Position in Selected Countries ($million)_______________________________________________________________________Country 1985 %Total 1990 %Total 1994 %Total________________________________________________________________________World 230250 100.0 426958 100.0 612109 100.0
Europe 105171 45.7 213368 50.0 300177 49.0 EU-12 83898 36.4 179102 41.9 251149 41.0 Germany 16764 7.3 27480 6.4 39886 6.5 U.K. 33024 14.3 72343 16.9 102244 16.7 Spain 2281 1.0 7802 1.8 8048 1.3 Turkey 234 0.1 515 0.1 1084 0.2
Canada 46909 20.4 69106 16.2 72808 11.9
Asia-Pacific 33983 14.8 63585 14.9 108402 17.7 Japan 9235 4.0 22511 5.3 37027 6.0 China na na 356 0.1 1699 0.3 Hong Kong 3295 1.4 5994 1.4 11988 2.0 Korea 743 0.3 2677 0.6 3612 0.6 Malaysia 1140 0.5 1513 0.4 2382 0.4 India 383 0.2 368 0.1 818 0.1
Latin America 28261 12.3 70752 16.6 114985 18.8 Mexico 5088 2.2 10255 2.4 16375 2.7 Brazil 8893 3.9 14268 3.3 18977 3.1 Chile 88 0.0 1876 0.4 4457 0.7
Africa 5891 2.6 3592 0.8 5472 0.9__________________________________________________________________
Source: U.S. Department of Commerce, Survey of Current BusinessData are on Historical Cost Basis
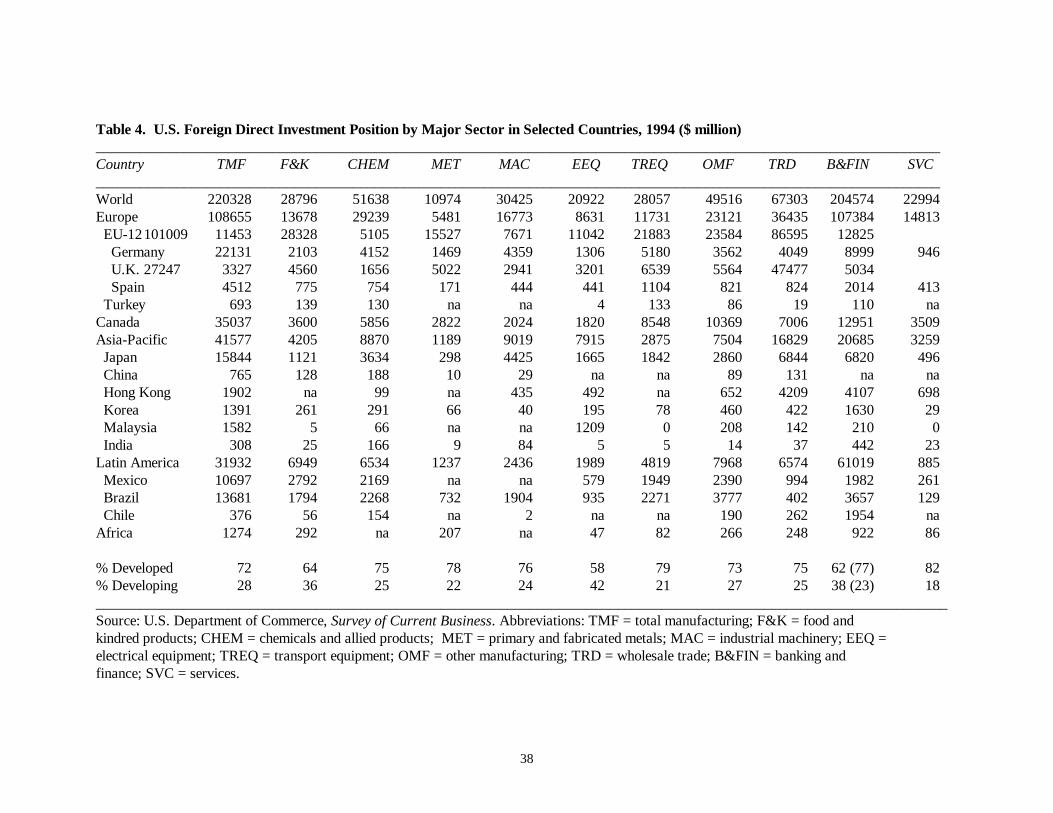
38
Table 4. U.S. Foreign Direct Investment Position by Major Sector in Selected Countries, 1994 ($ million)___________________________________________________________________________________________________________________Country TMF F&K CHEM MET MAC EEQ TREQ OMF TRD B&FIN SVC___________________________________________________________________________________________________________________World 220328 28796 51638 10974 30425 20922 28057 49516 67303 204574 22994Europe 108655 13678 29239 5481 16773 8631 11731 23121 36435 107384 14813 EU-12101009 11453 28328 5105 15527 7671 11042 21883 23584 86595 12825 Germany 22131 2103 4152 1469 4359 1306 5180 3562 4049 8999 946 U.K. 27247 3327 4560 1656 5022 2941 3201 6539 5564 47477 5034 Spain 4512 775 754 171 444 441 1104 821 824 2014 413 Turkey 693 139 130 na na 4 133 86 19 110 naCanada 35037 3600 5856 2822 2024 1820 8548 10369 7006 12951 3509Asia-Pacific 41577 4205 8870 1189 9019 7915 2875 7504 16829 20685 3259 Japan 15844 1121 3634 298 4425 1665 1842 2860 6844 6820 496 China 765 128 188 10 29 na na 89 131 na na Hong Kong 1902 na 99 na 435 492 na 652 4209 4107 698 Korea 1391 261 291 66 40 195 78 460 422 1630 29 Malaysia 1582 5 66 na na 1209 0 208 142 210 0 India 308 25 166 9 84 5 5 14 37 442 23Latin America 31932 6949 6534 1237 2436 1989 4819 7968 6574 61019 885 Mexico 10697 2792 2169 na na 579 1949 2390 994 1982 261 Brazil 13681 1794 2268 732 1904 935 2271 3777 402 3657 129 Chile 376 56 154 na 2 na na 190 262 1954 naAfrica 1274 292 na 207 na 47 82 266 248 922 86
% Developed 72 64 75 78 76 58 79 73 75 62 (77) 82% Developing 28 36 25 22 24 42 21 27 25 38 (23) 18____________________________________________________________________________________________________________________Source: U.S. Department of Commerce, Survey of Current Business. Abbreviations: TMF = total manufacturing; F&K = food andkindred products; CHEM = chemicals and allied products; MET = primary and fabricated metals; MAC = industrial machinery; EEQ =electrical equipment; TREQ = transport equipment; OMF = other manufacturing; TRD = wholesale trade; B&FIN = banking andfinance; SVC = services.

39
Table 5. Indicators of Multinational Activity in U.S. High Technology Industries, 1989a
_____________________________________________________________________________________________________________________ Affiliates Total Assets Assets in Intrafirm Intrafirm TradeSector per Parent Abroad ($bil.) EC’s (%)b Sales (%)c with U.S. ($bil.)_____________________________________________________________________________________________________________________Industrial Chemicals and Polymers 14.3 63.9 10.6 31.8 5.9Pharmaceuticals 33.8 40.5 11.0 21.9 2.2Industrial Machinery 6.4 22.4 19.2 29.4 6.4Office Machines and Computers 11.1 86.8 23.3 49.8 16.1Telecommunications Equipment 11.3 20.0 34.3 30.1 1.9Electronic Components and Circuits 5.2 10.1 41.3 49.4 11.4Electrical Machinery 9.1 11.0 22.9 18.5 2.2Motor Vehicles and Parts; Aircraft 10.5 122.3 12.2 19.4 50.6Printing, Publishing, Recordings 5.3 5.7 5.5 4.4 0.1Precision Instruments 5.8 21.9 12.0 33.1 4.8All Manufacturing 8.5 593.8 15.6 30.8 114.8
Advertising 14.9 4.4 15.9 0.1 0.0Motion Pictures 8.9 5.0 10.0 0.1 0.0Health Services 2.9 1.6 31.7 0.0 0.0Engineering, Architectural Services 4.6 2.0 18.4 8.5 0.01Finance, except banking 6.0 171.6 24.6 23.8 0.0All Servicesd 5.0 219.9 21.2 17.7 31.8_____________________________________________________________________________________________________________________Source: U.S. Department of Commerce, Benchmark Survey: U.S. Direct Investment Abroad, 1989.Notes: aData are for majority-owned non-bank affiliates of non-bank U.S. parents; bPercentage of assets not located in Canada, Europe, Japan, or
Australia; cIntrafirm sales as a percentage of total sales; dWholesale trade, finance (except banking), and services.

40
Table 6. Percentage of Firms Claiming that the Strength or Weakness of Intellectual Property Rights Has a Strong Effect on WhetherDirect Investments Will Be Made, by Type of Facility, 1991
_____________________________________________________________________________________________________________________ Sales and Basic Production Components Complete Products R&D AverageSector D Distribution and Assembly Manufacture Manufacture Facilities_____________________________________________________________________________________________________________________Chemicals 19 46 71 87 100 65Transport Equipment 17 17 33 33 80 36Electrical Equipment 15 40 57 74 80 53Food Products 29 29 25 43 60 37Metals 20 40 50 50 80 48Machinery 23 23 50 65 77 48Average 20 32 48 59 80 48_____________________________________________________________________________________________________________________Source: Mansfield (1994)

41
Table 7. Percentage of Firms Claiming that Intellectual Property Protection Is Too Weak to Permit Types of Investment, 1991_____________________________________________________________________________________________________________________Country Chemicals Transport Equip. Electrical Equip. Food Products Metals Machinery AveragePanel A: Joint Ventures with Local PartnersArgentina 40 0 29 12 0 27 18Brazil 47 40 31 12 0 65 32India 80 40 39 38 20 48 44Indonesia 50 40 29 25 0 25 28Mexico 47 20 30 25 0 17 22Korea 33 20 21 12 25 26 23Thailand 43 80 32 12 0 20 31Averagea 49 34 30 19 6 33Panel B: Transfer of Newest or Most Effective Technology to Wholly Owned SubsidiariesArgentina 44 20 21 12 0 14 18Brazil 50 40 24 12 0 39 28India 81 40 38 38 20 41 43Indonesia 40 20 31 25 0 23 23Mexico 31 20 21 25 0 22 20Korea 31 20 28 12 40 22 26Thailand 60 80 31 12 0 18 20Averagea 48 34 28 19 9 26Panel C: Licensing of Newest or Most Effective Technology to Unrelated FirmsArgentina 62 0 26 12 0 29 22Brazil 69 40 29 25 0 73 39India 81 40 38 38 20 50 44Indonesia 73 20 33 25 0 37 31Mexico 56 20 28 25 0 36 28Korea 38 20 34 12 40 29 29Thailand 73 80 36 12 0 25 38Averagea 65 31 32 21 9 40Source: Mansfield (1994). Note: aAverage over the seven countries listed.

42
Table 8. Elasticities of Modes of Supply with respect to Domestic Characteristics andPolicies
______________________________________________________________________________Variable Asset Stock Affiliate Sales Intrafirm Exports to Aff. Patent Apps.______________________________________________________________________________Real GDP 0.25 0.30 0.13 0.19Tariff Level -0.02 -0.00a -0.01 -0.01Affiliate R&D 0.27 0.29 0.15 0.07Distance -0.25 -0.02 -0.03 0.02Incentives 0.97 0.24 0.13 0.17Disincentives -0.25 -0.02 0.02 -0.01Patent Strength in 0.45 0.05 -0.02 0.69 Developing Countries______________________________________________________________________________Source: Adapted from Maskus (1998)Note: aCoefficient is not significantly different from zero. Asset stock is total assets of foreignnon-bank affiliates of U.S. parents in $ millions; Affiliate sales is total sales of foreign affiliates in$ millions; Intrafirm exports to affiliate is U.S. exports shipped to affiliates in $ millions; Patentapplications is number filed in the host country; Real GDP in the host country is in $ billions;Tariff level is tariff revenues divided by total imports; Affiliate R&D is expenditure on R&D byforeign affiliates in $ millions; Distance is kilometers of capital city from Washington, DC;Incentives is the number of affiliates that received tax concessions in the host country divided bythe number that received tax concessions in all the sample countries; Disincentives is number ofaffiliates required to employ a minimum amount of local personnel divided by the number ofaffiliates that are so constrained in all the sample countries; Patent strength is an endogeneity-corrected index of patent laws and enforcement.

43
Figure 1. Inward Vertical and Horizontal FDI Flows as an Economy Develops
Inward FDI
Horizontal
Vertical
GDP per Capita
Cumulative FDI
Stage One Stage Two Stage Three Stage Four
GDP per Capita
Source: Zhang (1996)