Embed Size (px)
Citation preview

Roger Williams UniversityDOCS@RWU
Psychology Theses Feinstein College of Arts and Sciences Theses
2015
The Role of Intellectual and Academic Abilities inDetention Placement among Dually-DiagnosedJuvenile OffendersMelissa McWilliamsRoger Williams University, [email protected]
Follow this and additional works at: http://docs.rwu.edu/psych_thesis
Part of the Psychology Commons
This Thesis is brought to you for free and open access by the Feinstein College of Arts and Sciences Theses at DOCS@RWU. It has been accepted forinclusion in Psychology Theses by an authorized administrator of DOCS@RWU. For more information, please contact [email protected].
Recommended CitationMcWilliams, Melissa, "The Role of Intellectual and Academic Abilities in Detention Placement among Dually-Diagnosed JuvenileOffenders" (2015). Psychology Theses. Paper 23.http://docs.rwu.edu/psych_thesis/23
Running head: JUVENILE DETENTION
The Role of Intellectual and Academic Abilities in
Detention Placement among Dually-Diagnosed Juvenile Offenders
Melissa McWilliams
Master of Arts
Clinical Psychology
Feinstein College of Arts and Sciences
Roger Williams University
May 2015

JUVENILE DETENTION ii

JUVENILE DETENTION iii
Acknowledgements
The thesis process is one marked with constant challenges that promote immense personal and
academic growth and perseverance. However, I would never have been able to complete my Masters
thesis without the guidance of my committee members, help from friends, and unending support from my
family.
I would like to express my deepest gratitude to my advisor, Dr. Frank DiCataldo, whose
knowledge, encouragement, and support was unending. I am also wholeheartedly thankful to the rest of
my committee, Dr. Judy Platania and Dr. Kathleen Kemp. Your support, advice, and assistance were
invaluable to the final success of this research project.
A special thank you goes to Dr. Marina Tolou-Shams and, again, to Dr. Kathleen Kemp at the
Bradley/Hasbro Children’s Research Center. I cannot thank you enough for the opportunity to
collaborate with you on my thesis and for sharing your data with me. I have learned a great deal working
with you on this project and through my practicum experience at Project EPICC.
A heartfelt thanks also goes to my close friends. You not only gave me support when I needed it,
but also kindly listened to my stress-filled complaints and worries. Specifically, I would like to thank
Emma Rathkey and Craig Krebsbach. You were always willing to help and give me your best
suggestions when I was stuck and needed a new perspective.
Lastly, I wish to express my love and gratitude to my beloved parents and boyfriend, Alex
Buessing. Throughout this process, you continuously supported me, encouraged me with your best
wishes, cheered me up, and stood by me through the good times and bad. Mom and Dad, I know I have
said this before, but your endless love, understanding, support, and encouragement have helped me
achieve incredible feats throughout my life. You have truly inspired me and showed me how to be the
person I am today. I cannot express my appreciation enough. I love you.

JUVENILE DETENTION iv
Table of Contents
Signature Page…………………………………………………………………………………….ii
Acknowledgements……………………………………………………………………...…. ……iii
Table of Contents…………………………………………………………………………...….....iv
List of Tables……….……………………………………………………………………………..v
List of Figures……………………………………………………………………………...……..vi
Abstract……………………………………………………………………………………...…...vii
Introduction………………………………………………………………………………………..1
Method…………………………………………………………………………………………...10
Results……………………………………………………………………………………………14
Discussion………………………………………………………………………………………..19
References………………………………………………………………………………………..26

JUVENILE DETENTION v
List of Tables
Table 1: Frequencies of Demographic Data for Detained vs. Non-Detained Juveniles….…..…33
Table 2: Overall Descriptive Statistics for Cognitive Functioning….......................…………….34
Table 3: Gender Descriptive Statistics for Cognitive Functioning………………………………35
Table 4: Summary of Logistic Regression Analysis Predicting Detention with Demographic,
Mental Health, and Prior Offending Variables……….…………………………………36
Table 5: Classification Table for Demographics, Mental Health, and Prior Offending
Variables……………………………………...…..…………………………………….37
Table 6: Summary of Logistic Regression Analysis Predicting Detention with Intellectual
.Functioning as a Moderating Variable............................................................................38
Table 7: Classification Table for Intellectual Functioning as a Moderating Variable………….39
Table 8: Summary of Logistic Regression Analysis Predicting Detention with Academic
Achievement Abilities as Moderating Variables……………………………..…………40
Table 9: Classification Table for Academic Achievement Abilities as Moderating Variables…..41
Table 10: Summary of Mean Math Scores……………………………………………………….42
Table 11: Summary of Logistic Regression Analysis Predicting Detention with Referral Source
as a Moderating Variable of Math Abilities……………………………………..…….43
Table 12: Classification Table for Referral Source as a Moderating Variable of Math
Abilities………………………………………………………………………………...44
Table 13: Summary of Mean Math Scores: Frequencies of Truancy Referrals…………………45

JUVENILE DETENTION vi
List of Figures
Figure 1: Theoretical moderation model of IQ.……..…………..……………………………..…46
Figure 2: Theoretical moderation model of academic achievement abilities.…………………...47
Figure 3: Comparing math means for dual diagnosis by detention…………….………………..48
Figure 4: Comparing math means for referral source by detention…………………………..…49

JUVENILE DETENTION vii
Abstract
This study examined the moderating effects of IQ and academic skills in the relationship
between dual diagnosis (i.e., co-occurring psychiatric and substance use disorders) and court-
involved, non-incarcerated (CINI) juveniles’ detention placement at 12 months post court
evaluation. CINI juveniles who underwent a court clinic forensic mental health evaluation (N =
249) completed a battery of assessments targeting demographic information, psychiatric
symptoms, and cognitive/academic functioning (i.e., Kaufman Brief Intelligence Test (KBIT-2),
Wide Range Achievement Test (WRAT-4)). Previous research demonstrated the predictive
ability of co-occurring psychiatric and substance use disorders on CINI juveniles’ recidivism
(Tolou-Shams et al., 2014). While we expected that lower IQ scores and/or weak academic
skills would moderate dually diagnosed juveniles’ risk of detention, we only found a weak
impact for low math computation abilities. These data have important implications for school-
or community-based preventative and interventional programs to offset legal involvement and its
associated consequences for at-risk youth.

JUVENILE DETENTION 1
Introduction
There are currently more than 31 million adolescents under the juvenile courts’
jurisdiction, with approximately 1.3 million youths being arrested annually (Puzzanchera 2014;
Hockenberry & Puzzanchera, 2014). These youth tend to experience increased rates of negative
outcomes such as academic and behavioral problems, risky sexual behavior, substance use, and
psychological distress. These undesirable outcomes are associated with repeated legal
involvement, which in turn, is often related to worsening health and behavioral problems, and
further legal entanglements – creating a vicious downward cycle (Tolou-Shams, Rizzo, Conrad,
Johnson, Oliveira, & Brown, 2014). Understanding which variables most directly relate to
detention placement and recidivism and how they relate to each other can provide useful
information for developing and implementing proper screening measures and evidence-based
interventions to successfully divert these youths’ trajectory of continued adverse legal
involvement and associated consequences.
Psychiatric Concerns
Delinquent youths manifest a number of risk factors related to the development of
psychiatric disorders and problem behaviors (e.g., abuse, troubled family and neighborhood
environments, parental substance abuse, poverty, poor education, etc.) and often lack protective
factors to offset these risks (Teplin, Arbam, McClelland, Dulcan, & Mericle, 2002). In fact,
recent statistics report that approximately 70 percent of youth involved in the juvenile justice
system have a diagnosable mental health disorder, 79 percent of which meet criteria for two or
more diagnoses (Teplin et al., 2002; Whitted, Delavega, & Lennon-Dearing, 2013). Teplin et al.
(2002)’s epidemiological study of detained youth broke down these statistics, revealing that
nearly two thirds of boys and nearly three quarters of girls met diagnostic criteria for one or more

JUVENILE DETENTION 2
disorders. The authors caution, however, that these statistics may not be indicative of the true
prevalence of mental health disorders in the juvenile justice system. Teplin et al. (2002) suggest
that their results may actually underestimate the true prevalence, as youth tend to underreport
symptoms and impairments, especially when related to disruptive behaviors.
Substance use disorders are among the leading psychiatric disorders exhibited by juvenile
offenders. In fact, compared to their non-offending peers, juvenile offenders have five times
higher rates of drug use and three times higher rates of substance abuse disorders (Grisso, 2004;
Mauricio et al., 2009). Research has demonstrated that drug use and delinquency are closely
linked (White, Loeber, Stouthamer-Loeber, & Farrington, 1999; Mauricio et al., 2009). In fact,
drug use is strongly associated with youth aggression and violence (Welte, Barnes, Hoffman,
Wieczorek, & Zhang, 2005), affiliation with antisocial peers (Dishion, Capaldi, Spracklen, & Li,
1995) and gang involvement (Thornberry, Krohn, Lizotte, & Chard-Wierschem, 1993;
Thornberry, Krohn, Lizotte, Smith, & Tobin, 2003). Welte et al. (2005) examined the
association between drug and alcohol use and delinquency among New York youth ages 16 to
19. They found that drug use and alcohol involvement predict early engagement in delinquency
and prolong delinquent behavior (i.e., delay maturing out of delinquency). In addition, these
juveniles committed more offenses during the periods in which they were involved with
substances. This risk for persistent reoffending, substance-related recidivism, and self-reported
antisocial activity is even greater for juveniles with co-occurring substance use disorders and
other psychiatric problems (Tolou-Shams et al., 2014).
Under the 8th and 14th Amendments, juvenile detainees with serious mental health
disorders have a constitutional right to receive treatment (Teplin et al., 2002). Receiving proper
psychological services improves overall quality of life and helps reduce recidivism. The

JUVENILE DETENTION 3
National Mental Health Association (2004) reported that regardless of treatment program type or
youth background, juveniles who received treatment had recidivism rates 25 percent lower than
juveniles who were untreated. Moreover, evidence-based treatment programs further reduced
juveniles’ recidivism rates between 25 and 80 percent (National Mental Health Association,
2004). While the juvenile justice system is legally required to provide treatment for mental
health disorders, treating co-occurring disorders (i.e., more than one alcohol, drug, or mental
health (ADM) disorder) proves to be much more complex than treating only one disorder.
Unfortunately, the juvenile justice system’s mental health services are often too overburdened to
provide adequate care causing juveniles’ disorders to persist and worsen – ultimately,
contributing to the downward spiral of negative social outcomes and further legal entanglements
(Teplin et al., 2002; Teplin, Abram, McClelland, & Dulcan, 2003).
No single, uniform treatment approach works for all people (National Mental Health
Association, 2004). Therefore, it is important to provide effective treatment and intervention
approaches that address the unique needs of each juvenile. The responsivity principle from the
Risk-Need-Responsivity Model from Andrews and Bonta (2010a; 2010b) advocates that the
clinical characteristics, including the learning needs of juveniles, should guide intervention to
enhance treatment outcomes. The responsivity principle suggests that interventions need to
address the offenders’ specific characteristics that may affect their response to treatment (e.g.,
learning style, motivation, mental health). As many juveniles commit minor, non-violent
offenses or status offenses, they should be diverted away from the juvenile justice system
whenever possible and towards community-based intervention services targeting their specific
mental health and behavior needs (National Mental Health Association, 2004).1
1 Refer to National Mental Health Association (2004) for a list of promising practices operating across the country
that address mental health, substance abuse, and co-occurring needs of juvenile justice youth.

JUVENILE DETENTION 4
Cognitive Functioning
Global Intelligence. Over the past few decades, research has indicated an association
between intellectual functioning and crime, where low IQ scores are correlated with greater
levels of juvenile delinquency (Koolhof, Loeber, Wei, Pardini, & D’Escury, 2007; Loeber et al.,
2012). Koolhof et al. (2007) explored whether delinquent boys with low IQ are more at-risk for
delinquent charges than delinquents boys with high IQ, using cross-sectional and longitudinal
data from the Pittsburgh Youth Study. They found that the number of delinquent charges was
significantly higher for the boys with low IQs compared to the boys with high IQs.
The IQs of juvenile delinquents also tend to be significantly different than the IQs of non-
delinquents (Wolfgang, Figlio, & Sellin, 1972; West & Farrington, 1973; Hirschi & Hindelang,
1977; Mednick, Kirkegaard-Sorensen, Hutchings, Knop, Rosenberg, & Schulsinger, 1977;
Moffitt, Gabrielli, Mednick, & Schulsinger, 1981; White, Moffitt, & Silva, 1989; Lynam,
Moffitt, & Stouthamer-Loeber, 1993). For example, Lynam et al. (1993) found that, in a high-
risk sample of 12- and 13-year-old boys, delinquents had significantly lower IQs than non-
delinquents. More specifically, Guay, Ouimet, and Proulx (2005) found the difference between
IQ scores of non-delinquents and those of delinquents and chronic delinquents to be
approximately 8 points (0.5 standard deviation) and 17 points (one standard deviation),
respectively.
White et al. (1989) posit that low IQ increases vulnerability to delinquency during
adolescence. Hirschi and Hindelang (1977) expound upon this notion further in their meta-
analysis of IQ and delinquency research. They endorse IQ as an important correlate of
delinquency (regardless of race and social class) and suggest that school attachment and
performance may help to explain this relationship. Based on their literature review, Hirschi and

JUVENILE DETENTION 5
Hindelang (1977) suggest that children with low IQs, who are inadequately prepared for success
in school, and who are labeled as “bad” by teachers often find their education experience painful
and will likely turn to delinquency. Therefore, perhaps differences in cognitive ability may
account for the marked difficulties some of these individuals may exhibit not only in anticipating
consequences of their actions and understanding the suffering of others, but also in integrating
socially (Guay et al., 2005). The resulting difficulties likely increase the risk for engaging in
criminal behaviors.
The age-crime curve illustrates the changes in delinquency prevalence rates from
childhood to early adulthood. According to this model, delinquency rates in Western
populations increase in late childhood, peak in middle to late adolescence, and then decrease into
adulthood (Loeber et al., 2012). Loeber et al. (2012) found that low IQ increased the probability
of being charged with a crime from adolescence through early adulthood independent of the
effects of co-occurring impulsivity. During this time, brain maturation is also occurring (Loeber
et al., 2012; Steinberg, Cauffman, Woolard, Graham, & Banich, 2009; Steinberg, 2010). This
could explain why some early offenders exhibit improvements in self-control and impulsivity,
reducing their risk for continued criminal activity. However, low IQ paired with enduring
various risk factors (e.g., poverty, living in a disadvantaged neighborhood, poor child-rearing
practices, family discord, etc.) could offset these gains in brain maturation and maintain the risk
for criminal behaviors (Loeber et al., 2012; White, Moffitt, & Silva, 1989).
Several recent studies have examined the relationship between IQ and crime rates on a
broader, more aggregate level. For example, both McDaniel (2006) and Pesta, McDaniel, and
Bertsch (2010) found that a states’ overall average IQ scores had a significant, negative
association with state-level crime rates, whereby states with lower average IQ scores experienced
JUVENILE DETENTION 6
higher aggregate crime rates. Bartels, Ryan, Urban, and Glass (2010) took this research further
by examining IQ not only in association with aggregate general crime rates, but also in
association with several subtypes of crime. Their findings yielded similar results. In addition to
demonstrating a significant negative association between IQ and state crime rates, Bartels et al.
(2010) found significant negative associations between IQ and the state murder rate, aggravated
assault rate, robbery rate, total property crime rate, burglary rate, theft rate, and motor vehicle
theft rate. Taken together, these three studies tend to validate an inverse relationship between
state-level crime rates and the average IQ of the state’s citizens.
While there seems to be a significant association between lower IQs and greater crime
rates, many researchers believe the relationship between IQ and criminal activity to be highly
complex. One major argument is that additional factors may exist that attenuates the relationship
between IQ and crime, yet not negate it entirely (Bartels et al., 2010). A few of the most
prevalent factors include race, socioeconomic status, impulsivity, and school performance.
Beaver and Wright (2011) sought to account for these risk variables to further enhance our
understanding of the relationship between IQ and aggregate crime rates. They examined IQ and
crime rates at a county-level while controlling for concentrated disadvantage, a factor computed
to indicate relative neighborhood poverty (Sampson, Raudenbush, & Earls, 1997; Beaver &
Wright, 2011). Concentrated disadvantage is calculated using several variables known to be
strong predictors of crime rates and has been implicated in a number of negative outcomes
related to health (Jones & Duncan 1995; Wen, Browning, & Cagney 2003; Yen & Kaplan 1999),
education (Mazawi 1999; Yun & Moreno 2006), arrest rates (Parker, Stults, & Rice 2005), and
homicide (Kubrin & Weitzerer 2003; MacDonald & Gover 2005). The predictive variables
include:

JUVENILE DETENTION 7
1) the proportion of African Americans living in the county, 2) the proportion of female-
headed households in the county, 3) the proportion of households with an annual income
< $15,000, 4) the proportion of households receiving public assistance, and 5) the
unemployment rate. (Beaver & Wright, 2011, p. 23)
Higher concentrated disadvantage scores indicate higher impoverishment. Beaver and Wright
(2011) found significant inverse associations between county-level IQ and all crime measures –
property crime rate, burglary rate, larceny rate, motor vehicle theft rate, violent crime rate,
robbery rate, and aggravated assault rate. Moreover, these associations remained significant
even when considering the possible mediating effects of concentrated disadvantage. These
results suggest that low IQ’s effects on crime are independent from the effects of other known
factors associated with crime rates such as race and poverty (Beaver & Wright, 2011; Loeber,
Farrington, Stouthamer-Loeber, Moffitt, & Caspi, 1998).
Academic achievement abilities. Learning disabilities and disorders (LDs) involve
problems in various academic areas such as reading, reading comprehension, and mathematics.
According to Rucklidge, McLean, and Bateup (2009), LDs are commonly defined as attaining
lower than expected scores (i.e., significantly below average) on achievement tests given the
individual’s age and educational opportunities. LDs are typically associated with depression,
loneliness, suicide, and delinquency. In fact, adolescents with LDs typically have more contact
with the criminal justice system than their peers (Rucklidge et al., 2009). Delinquent juveniles
commonly have significant academic difficulties, especially in relation to conceptualization,
information processing, and reading comprehension. According to Wilkerson, Gagnon, Mason-
Williams, and Lane (2012), incarcerated youth generally lag approximately four years behind
their public school peers on reading measures. In fact, recent research estimates that the rates of

JUVENILE DETENTION 8
LDs among juvenile delinquents is significantly higher than the rates of LDs among the general
school-aged population, approximately 40% and 9.2% respectively (Shelley-Tremblay, O’Brien,
& Langhinrichsen-Rohling, 2007; Wilkerson et al., 2012).
According to recent research, youth with reading comprehension LDs appear to be more
prone to recidivate. Rucklidge, McLean, and Bateup (2009) examined LDs among incarcerated
youth offenders in New Zealand. They found that a majority of these youth (91.67%) had at
least one LD and identified poor reading comprehension as predictive of recidivism, independent
of other acknowledged risk factors. More specifically, their results demonstrated that greater
levels of comprehension difficulties were associated with more serious and more persistent
offending. Therefore, proper screening, identification, and treatment for comprehension LDs
may help to reduce recidivism rates among delinquent youths.
Implications for educational services. Much like juveniles’ right to psychiatric
treatment, they have a lawful right to receive free and appropriate education. According to the
Individuals with Disabilities Education Act (IDEA), individualized education programs (IEP)
must be provided to children who are identified as needing special educational services (Shelley-
Tremblay et al., 2007). However, few juvenile justice facilities provide proper assessments or
treatments for learning disabilities. In fact, many facilities do not have adequate mechanisms to
identify and serve juveniles with LDs or even seek their prior school records (Shelley-Tremblay
et al., 2007). While juvenile facilities across the country provide high-quality education
programs, many do not account for the possible (and highly likely) LDs of their juveniles. Once
again, in order to be in line with the responsivity principle and enhance risk reduction outcomes,
youths’ treatment plans should incorporate their IQ and academic achievement abilities. As
there is a strong correlation between low education attainment, low literacy levels, and high

JUVENILE DETENTION 9
levels of crime and recidivism, providing quality education services focusing on reading literacy
may be one way to combat these trends (Drakeford, 2002). In fact, several studies found that
recidivism rates were much lower among groups of juveniles given reading remediation
interventions than juveniles who did not receive reading remediation interventions (Drakeford,
2002; Shelley-Tremblay et al., 2007; Rucklidge, McLean, & Bateup, 2009).
Providing proper educational programs and services for delinquent youths with LDs has
great implications for their future success. Most juveniles who recidivate, recidivate shortly after
their release (Drakeford, 2002). Providing juveniles with proper and effective educational
services can offset this tendency for recidivism by improving their academic abilities and helping
them develop confidence in their ability to achieve goals and become productive members of
society (Drakeford, 2002; Wilkerson, 2012). Such gains in juveniles’ reading abilities, and
subsequently their confidence, may have additional positive outcomes such as instilling a desire
to avoid risk-taking, drugs, and violence (Shelley-Tremblay et al., 2007).
Present Study
While there is accumulating literature on mental health problems among adolescents
detained in the juvenile justice system, few studies have explored mental health functioning and
related factors among court-involved, non-incarcerated (CINI) youths. As CINI juveniles
comprise approximately two-thirds of the juvenile justice population and may endure similar risk
factors and associated negative outcomes as detained or incarcerated juveniles (Tolou-Shams et
al., 2014), it is critical to examine how various risk factors such as substance use, psychiatric
problems, low IQ, and/or deficient academic skills impact CINI youth placement in detention .
Furthermore, while there appears to be substantial evidence that LDs are associated with
(and perhaps involved in) juvenile delinquency, little research has focused on how to best

JUVENILE DETENTION 10
address the needs of learning disabled, delinquent youths – particularly those who are not
incarcerated. In fact, in the early 2000s, both the Office of Juvenile Justice and Delinquency
Prevention and the United States Department of Education noted that there is a lack of
knowledge about children and adolescents with disabilities in the juvenile justice system
(National Council on Disability, 2003; Shelley-Tremblay et al., 2007). Specifically, while there
is substantial research on learning disabilities among incarcerated juveniles, research has
provided us little information on learning disabilities among juveniles involved in other parts of
the juvenile justice system (Shelley-Tremblay et al., 2007).
The present study was an extension of the work completed by Tolou-Shams et al. (2014)
who found that dual diagnosis (i.e., co-occurring psychiatric and substance use disorders)
significantly predicts detention among CINI juveniles. Our study re-examined this relationship
between dual diagnosis and detention while controlling for other variables known to be
associated with detention placement (e.g., age, gender, race and ethnicity, presence of
externalizing behavior, and previous offense). Moreover, we examined the moderating effects of
IQ and various academic skills (i.e., reading, comprehension, spelling, and math) in the
relationship between dual diagnosis and detention placement. Based on previous research, it was
expected that lower IQ scores and/or weak academic skills (i.e., impairments in reading
comprehension, math computation, etc.) will moderate dually-diagnosed juveniles’ risk of being
placed in detention.
Method
Participants
We received a de-identified dataset from Tolou-Shams et al. (2014) for use in this study.
The present study was a retrospective chart review of 249 juvenile offenders (149 males, 100
JUVENILE DETENTION 11
females) who were court-ordered to receive a forensic mental health evaluation at a juvenile
court clinic in the Northeast. The adolescents ranged in age from 10 to 18 years (M = 14.61, SD
= 1.5) and varied in race and ethnicity. The majority of adolescents self-identified as white/non-
Hispanic (65.1%), with the remainder identifying as African American (7.2%), Hispanic/Latino
(16.4%), or other (e.g., Asian Pacific Islander or Native American; 4.4%); 6.8% of the juveniles’
records were missing race and ethnicity data.
Adolescents involved with the court clinic were status and delinquent offenders. They
were court-ordered to the clinic by presiding judges and magistrates in specialty courts (e.g.,
truancy, juvenile drug court) and formal delinquency cases (Tolou-Shams et al., 2014). Court
clinic evaluations were conducted by licensed mental health professionals (psychologists,
psychiatrists, and social workers), typically lasted 3 to 4 hours, and were provided at no expense
to the family. These evaluations typically included evidence-based, self-report psychological
assessment measures completed by the caregiver and juvenile regarding the juvenile’s symptoms
and behaviors as well as separate brief forensic interviews with the juvenile and the parent or
guardian. Time was also spent obtaining information from relevant record reviews (legal,
school, and outside treatment providers) and collateral informants. For more information, refer
to Tolou-Shams et al. (2014).
Materials
The original chart review examined a number of different factors but this study only
examined those related to demographics, IQ, academic achievement abilities, psychiatric and
substance use disorders, and detention placement.

JUVENILE DETENTION 12
Demographics. Demographic information was collected through a standard intake form
completed by a legal guardian(s) before the mental health assessment. The form gathered
information about various demographics including age, gender, race, and ethnicity.
Psychiatric diagnoses. Licensed mental health professionals (i.e., psychologists,
psychiatrists, and social workers) conducted forensic interviews with the parent/guardian(s) and
the adolescent. The interviews explored the number and type of diagnoses and comorbidities, as
well as history of out-of-home placement, mental health treatment, and psychiatric
hospitalization. Evaluating clinicians made all diagnoses using Diagnostic and Statistical
Manual of Mental Disorders, Fourth Edition, Text Revision (DSM-IV-TR) criteria.
Kaufman Brief Intelligence Test, Second Edition (KBIT-2). The KBIT-2 is a brief,
individually administered measure of verbal (crystallized) and nonverbal (fluid reasoning)
intelligence for children and adults (ages 4 years, 0 months through 90 years, 11 months) (Bain
& Jaspers, 2010). It consists of three subtests: Verbal Knowledge, Riddles, and Matrices. The
Verbal Knowledge and Riddles subtests comprise the verbal intelligence score while the
Matrices subtest comprises the nonverbal intelligence score. The verbal intelligence score and
the nonverbal intelligence score are summed together to create the IQ Composite score. The
manual contains tables to provide raw score to standard score conversions, 90% confidence
intervals, percentile ranks, descriptive categories, and age equivalents. The KBIT-2 maintains
good to excellent reliability (Cronbach’s alphas ranging from the .80s to mid-.90s) and validity.
Despite this, the test authors suggest using the KBIT-2 as a screening measure for intellectual
abilities as part of a more comprehensive assessment rather than solely relying on the test for
diagnosis and placement.

JUVENILE DETENTION 13
Wide Range Achievement Test, Fourth Edition (WRAT-4). The WRAT-4 is a brief
achievement test that is often used in determining an individual’s learning strengths and
weaknesses, ages 5 to adulthood (Dell, Harrold, & Dell, 2008). It measures basic academic
skills, such as the ability to read words, comprehend sentences, spell, and compute math
problems. The manual provides raw score to standard score conversions based on age- and
grade-normative groups, confidence intervals, and percentile ranks. The WRAT-4 has moderate
to excellent reliability (Cronbach’s alpha ranges from .87 to .98) and validity. However, much
like other achievement tests, it is recommended that the WRAT-4 be used in a battery with other
academic screening measures, as it is not intended to provide formal identification of learning or
cognitive disorders.
Legal history and detention placement. The court clinic obtained the referred
juveniles’ relevant legal history information from the large statewide court database of all
juveniles processed through the family court, the Juvenile Case Management System (JCMS).
This information included referral source (e.g., truancy, drug, or delinquency petition), number
and type of charges (delinquency versus status), and history of social service involvement. The
JCMS database was also used to calculate the main outcome of the study, detention. For the
purposes of this study, a detention outcome score (yes or no) was calculated for accruing at least
one charge over the 12-month follow-up period that resulted in detention placement.
Procedure
A retrospective chart review was completed by research assistants working for Tolou-
Shams et al. (2014). The information was coded and entered into a master database. As
previously stated, our study examined a de-identified subgroup (N = 249) of Tolou-Shams et al.
(2014)’s master dataset (N = 404) for our analyses. This subset was chosen based on the

JUVENILE DETENTION 14
availability of cognitive functioning data (i.e., IQ and academic achievement abilities) for the
juveniles.
Results
Descriptive Statistics
Before testing the primary hypotheses, various descriptive statistical analyses were
conducted for demographics, dual diagnosis, cognitive functioning, and detention.
Demographics. As previously mentioned, 149 boys and 100 girls (N = 249) were court-
ordered to receive a forensic mental health evaluation. The ages reported ranged from 10 to 18
years (M = 14.61, SD = 1.5). The juveniles’ race and ethnicity varied with 65.1% reporting
white/non-Hispanic, 16.4% reporting Hispanic/Latino, 7.2% reporting African American, and
4.4% reporting other (e.g., Asian Pacific Islander or Native American); 6.8% of the juveniles’
records were missing race and ethnicity data. The majority of juveniles (79.9%) reported having
either private (43%) or public health insurance (36.9%) and 25.3% of juveniles endorsed a
current individualized education plan or 504 plan.
Of these juveniles, 75.1% were referred from wayward or truancy petitions, 17.3% were
referred from juvenile drug court, and 7.6% were referred from juvenile delinquency court.
Approximately 25% of the juveniles had prior delinquent (10%) or status (15.3%) offenses and
roughly 38% reported the existence of an externalizing behavioral problem diagnosis. Table 1
compares the frequencies of this demographic data for detained and non-detained juveniles.
Dual Diagnosis. There were less juveniles with co-occurring psychiatric and substance
use disorders (19.7%) than those with a single or no diagnosis (61.8%); 46 juveniles had missing
data for dual diagnosis. Gender differences for dual diagnosis were examined through a chi-
square test of independence. The relationship between these variables was significant, χ2(1, 203)

JUVENILE DETENTION 15
= 6.11, p = .01. This indicates that boys and girls significantly differed in their rates of dual
diagnosis, where more boys than girls received dual diagnosis (30.7% and 15.7% respectively).
Cognitive functioning. As a whole, juveniles’ scores on the three components of the
KBIT-2 (i.e., Verbal Standard Score, Nonverbal Standard Score, and IQ Composite) fell within
the average range (see Table 2). Scores falling between 85 and 115 are considered average for
the KBIT-2. The juveniles’ academic ability scores also mainly fell within the average range.
Specifically, juveniles’ scores on the Word Reading, Sentence Comprehension, Reading
Composite, and Spelling components of the WRAT-4 were average; however, their scores on the
Math Computation component were below average (see Table 2). On the WRAT-4, scores
falling between 90 and 109 are considered average and scores between 80 and 89 are considered
below average.
Gender differences in cognitive functioning were examined through an independent t-
test; data described in Table 3. While boys scored slightly higher on Verbal Standard Score (M =
91.67, SD = 11.72), IQ Composite (M = 92.29, SD = 13.23), and Word Reading (M = 97.56, SD
= 13.86) than girls (M = 90.50, 91.63, and 96.88 respectively, SD = 11.88, 12.05, and 12.98
respectively), girls scored slightly higher on Sentence Comprehension (M = 94.59, SD = 11.85)
and Spelling (M = 97.99, SD = 10.07) than boys (M = 92.22 and 95.17 respectively, SD = 12.49
and 15.59 respectively). None of these gender differences were statistically significant. Boys
and girls also did not differ in their scores on Nonverbal Standard Score, Reading Composite,
and Math Computation.
Detention Placement. As a whole, there were less juveniles who were detained during
the 12 month follow-up (17.3%) than those who were not detained (82.7%). A Chi-Square Test
of Independence was performed to examine the relationship between gender and detention. The
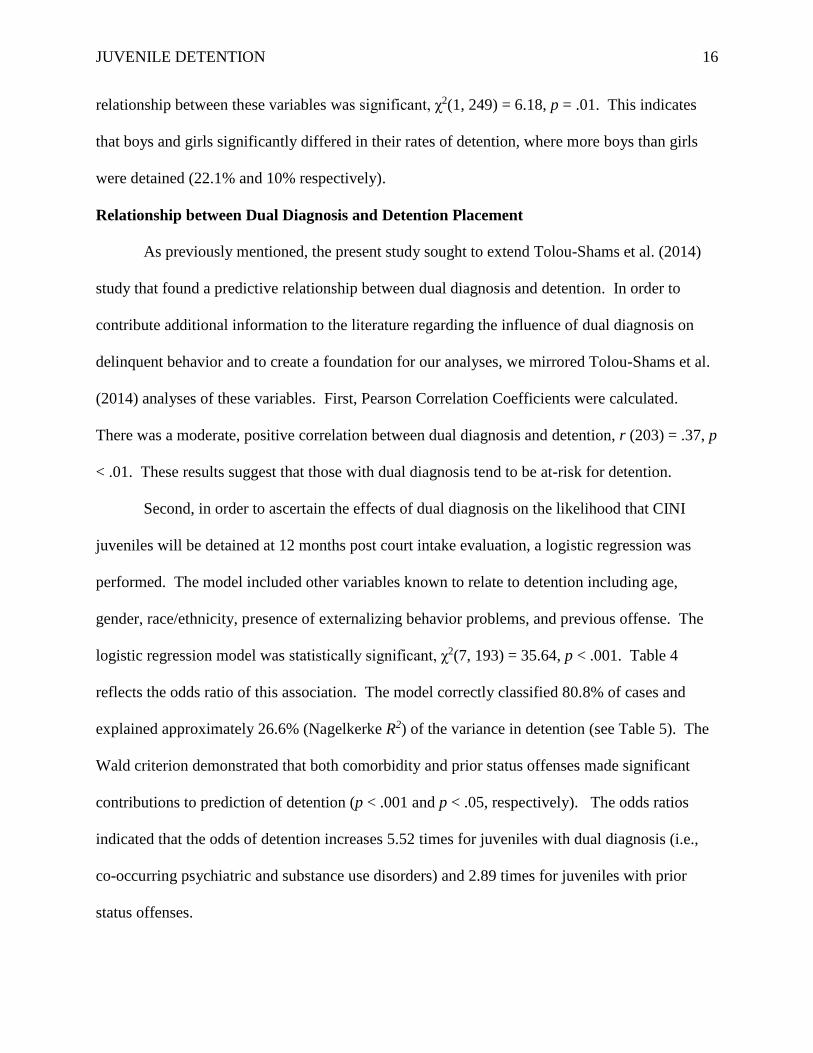
JUVENILE DETENTION 16
relationship between these variables was significant, χ2(1, 249) = 6.18, p = .01. This indicates
that boys and girls significantly differed in their rates of detention, where more boys than girls
were detained (22.1% and 10% respectively).
Relationship between Dual Diagnosis and Detention Placement
As previously mentioned, the present study sought to extend Tolou-Shams et al. (2014)
study that found a predictive relationship between dual diagnosis and detention. In order to
contribute additional information to the literature regarding the influence of dual diagnosis on
delinquent behavior and to create a foundation for our analyses, we mirrored Tolou-Shams et al.
(2014) analyses of these variables. First, Pearson Correlation Coefficients were calculated.
There was a moderate, positive correlation between dual diagnosis and detention, r (203) = .37, p
< .01. These results suggest that those with dual diagnosis tend to be at-risk for detention.
Second, in order to ascertain the effects of dual diagnosis on the likelihood that CINI
juveniles will be detained at 12 months post court intake evaluation, a logistic regression was
performed. The model included other variables known to relate to detention including age,
gender, race/ethnicity, presence of externalizing behavior problems, and previous offense. The
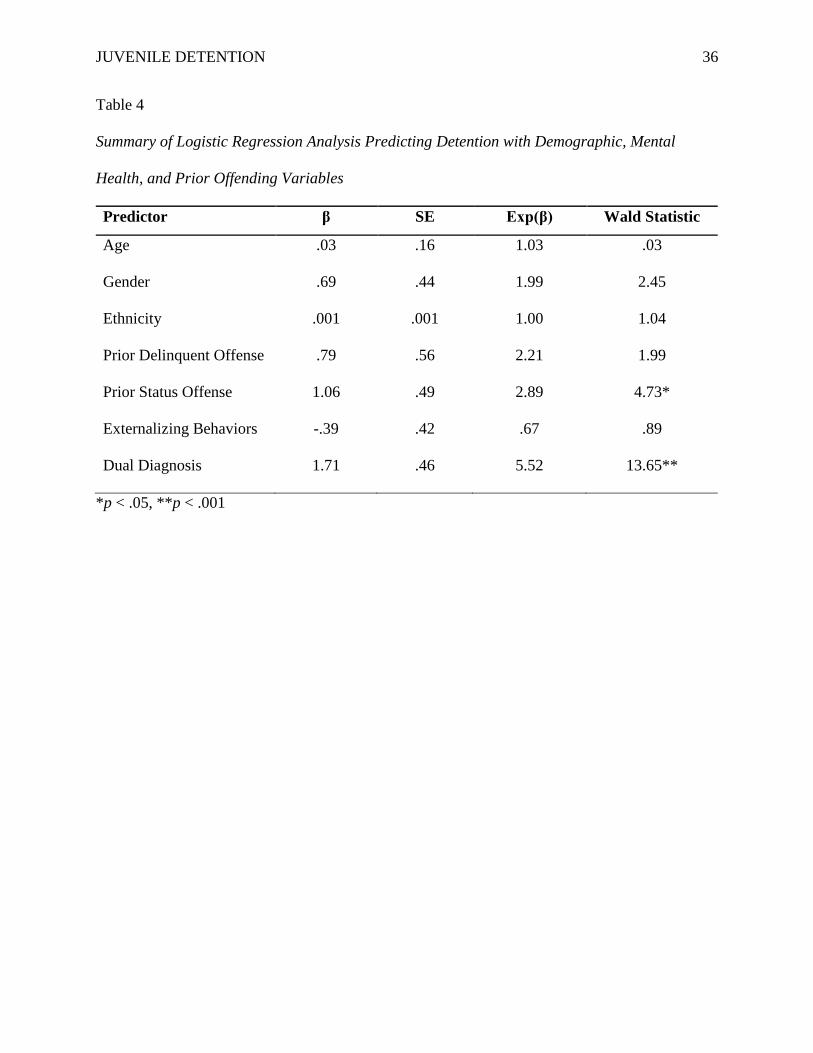
logistic regression model was statistically significant, χ2(7, 193) = 35.64, p < .001. Table 4
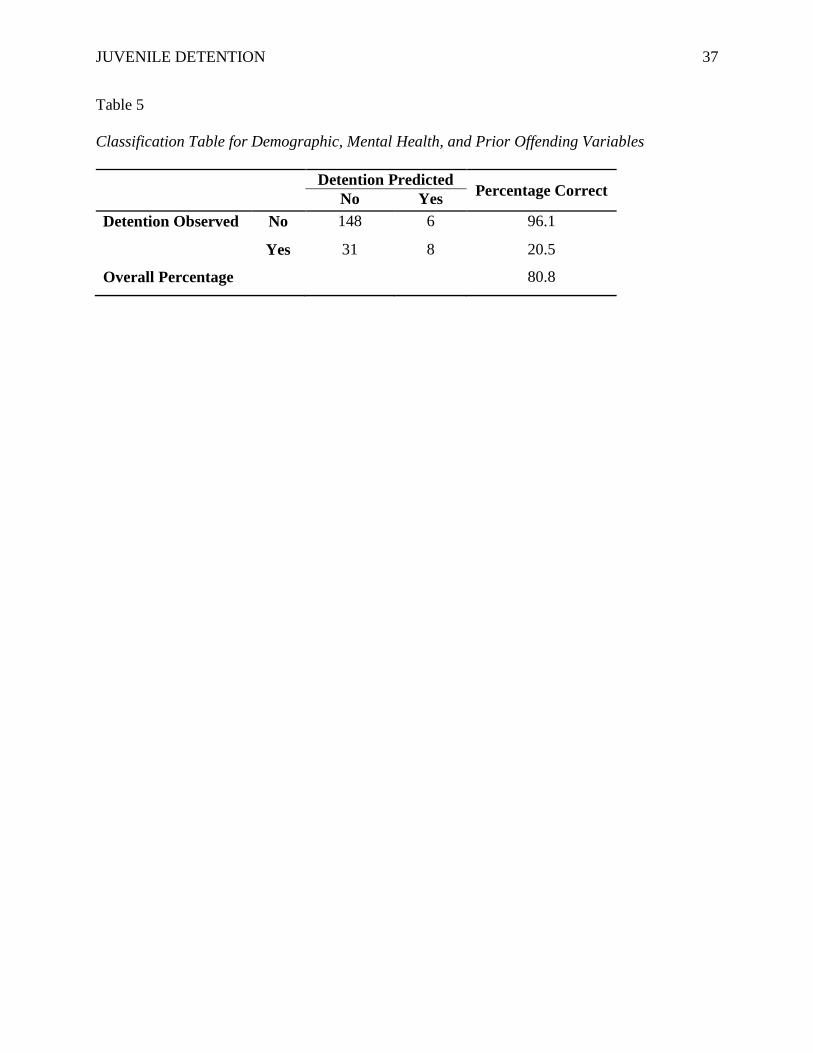
reflects the odds ratio of this association. The model correctly classified 80.8% of cases and
explained approximately 26.6% (Nagelkerke R2) of the variance in detention (see Table 5). The
Wald criterion demonstrated that both comorbidity and prior status offenses made significant
contributions to prediction of detention (p < .001 and p < .05, respectively). The odds ratios
indicated that the odds of detention increases 5.52 times for juveniles with dual diagnosis (i.e.,
co-occurring psychiatric and substance use disorders) and 2.89 times for juveniles with prior
status offenses.

JUVENILE DETENTION 17
Moderated Logistic Regressions
The present study examined the moderating effects of IQ and academic abilities on the
predictive relationship between dual diagnosis and detention placement. In order to examine
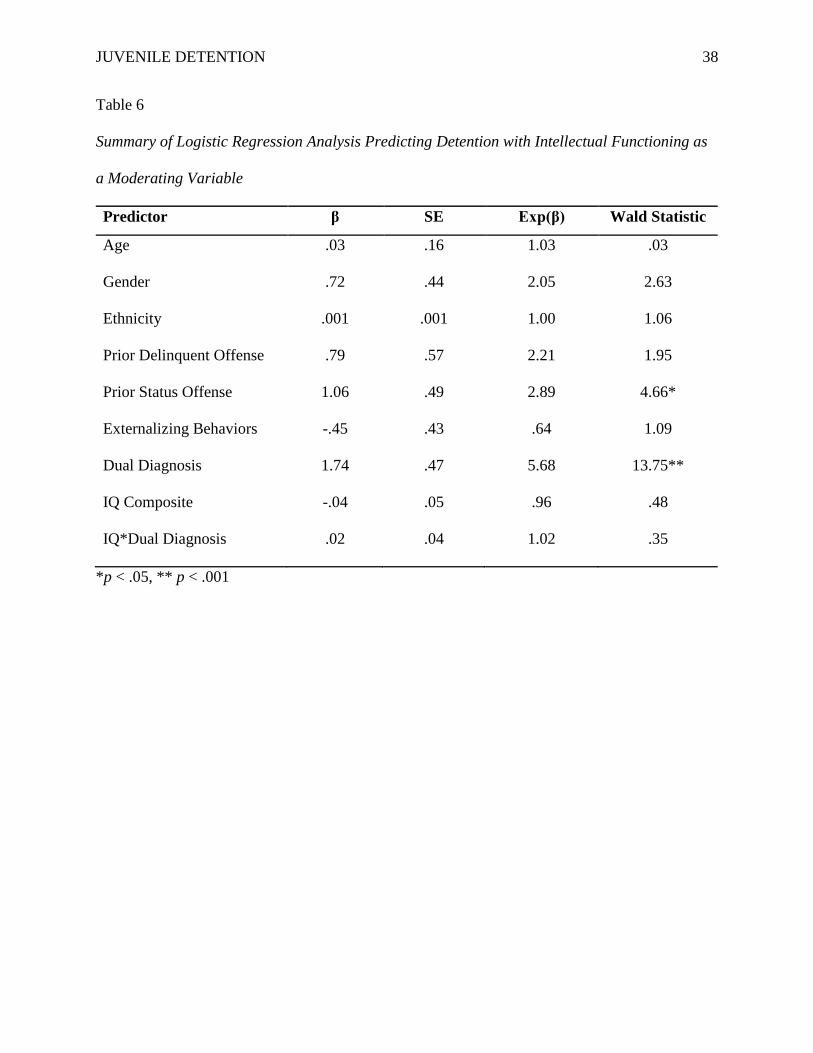
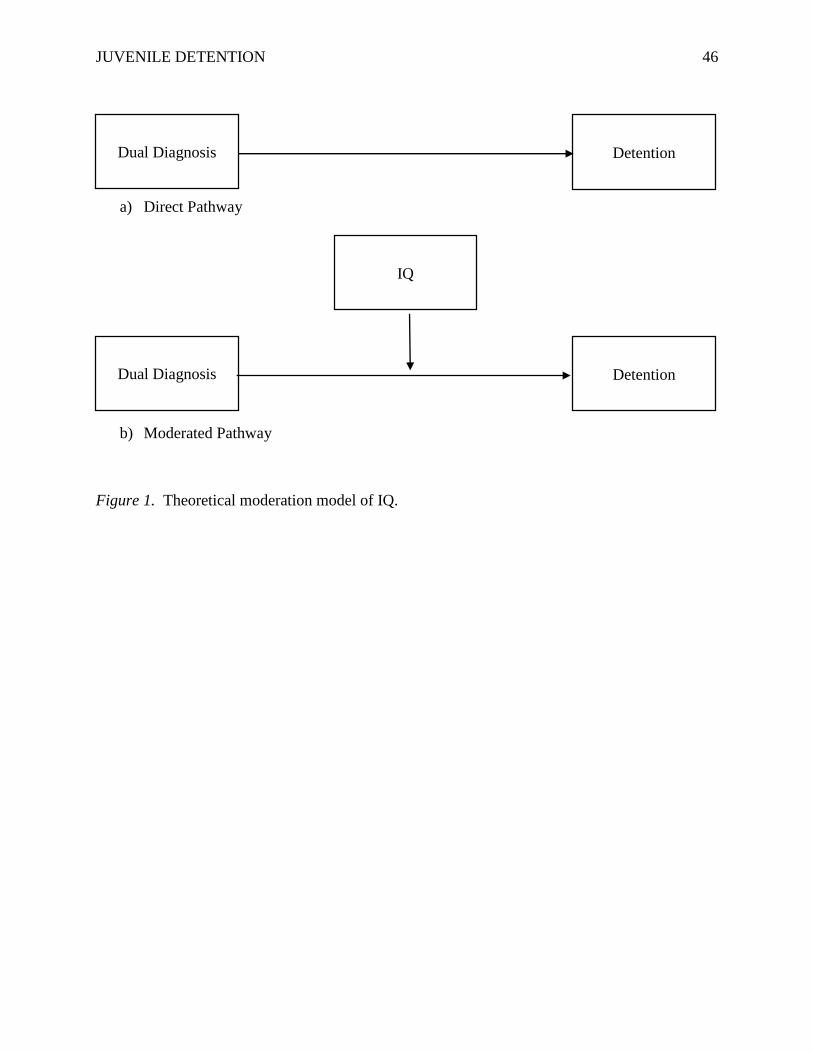
these relationships, two moderated logistic regressions were conducted. The first logistic
regression model examined IQ. Figure 1 illustrates its theoretical moderation model. This
model’s predictor variables included dual diagnosis, IQ, and the interaction term involving dual
diagnosis and IQ, as well as the same variables previously included that are known to be
associated with recidivism and detention (i.e., age, gender, race/ethnicity, presence of
externalizing behavior problems, and previous offense).
The moderated logistic regression model was statistically significant, χ2(9, 192) = 36.96,
p < .001. Table 6 reflects the odds ratio of these associations. The model correctly classified
80.2% of cases and explained 27.5% (Nagelkerke R2) of the variance in detention (see Table 7).
IQ did not significantly contribute to the prediction model. Once again, prior status offense and
dual diagnosis were the only significant predictors of detention (p < .05 and p < .001
respectively).
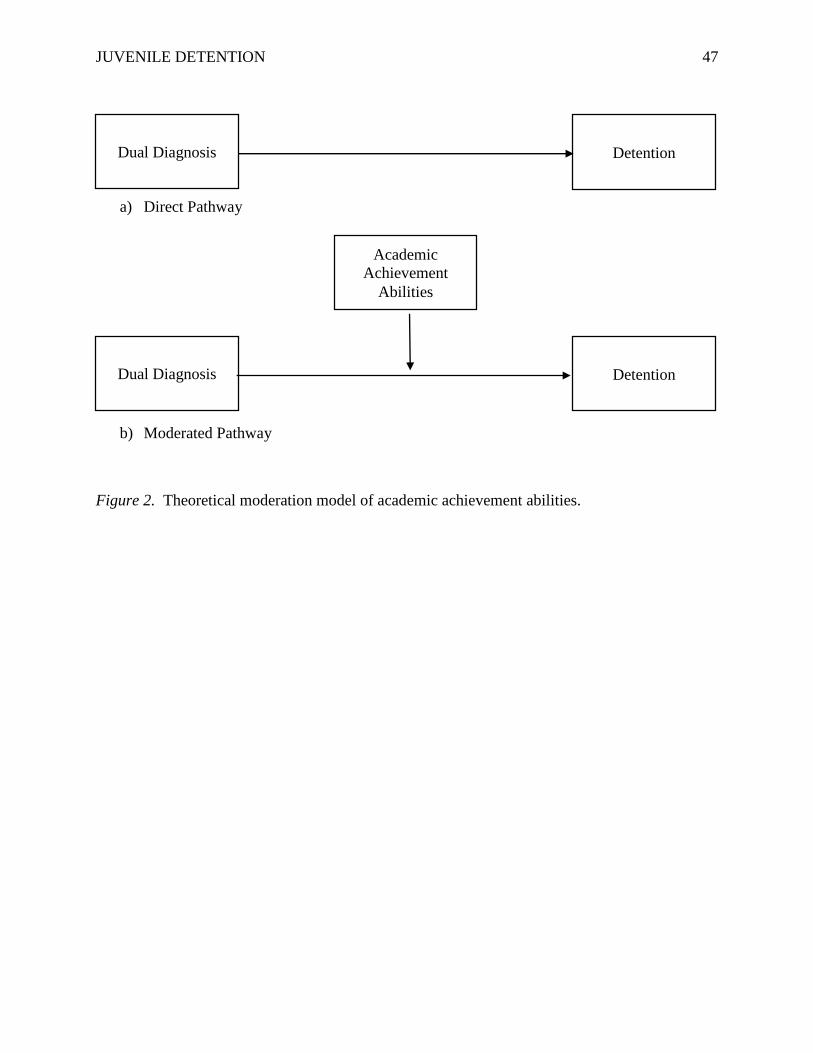
The second logistic regression model examined academic achievement abilities. Figure 2
illustrates its theoretical moderation model. This model’s predictor variables included age,
gender, race/ethnicity, presence of externalizing behavior problems, previous offense, dual
diagnosis, academic achievement variables, and interaction terms involving dual diagnosis and
academic achievement variables. Specifically, these interaction variables were: Reading
Composite*Dual Diagnosis, Spelling*Dual Diagnosis, and Math Computation*Dual Diagnosis.

JUVENILE DETENTION 18
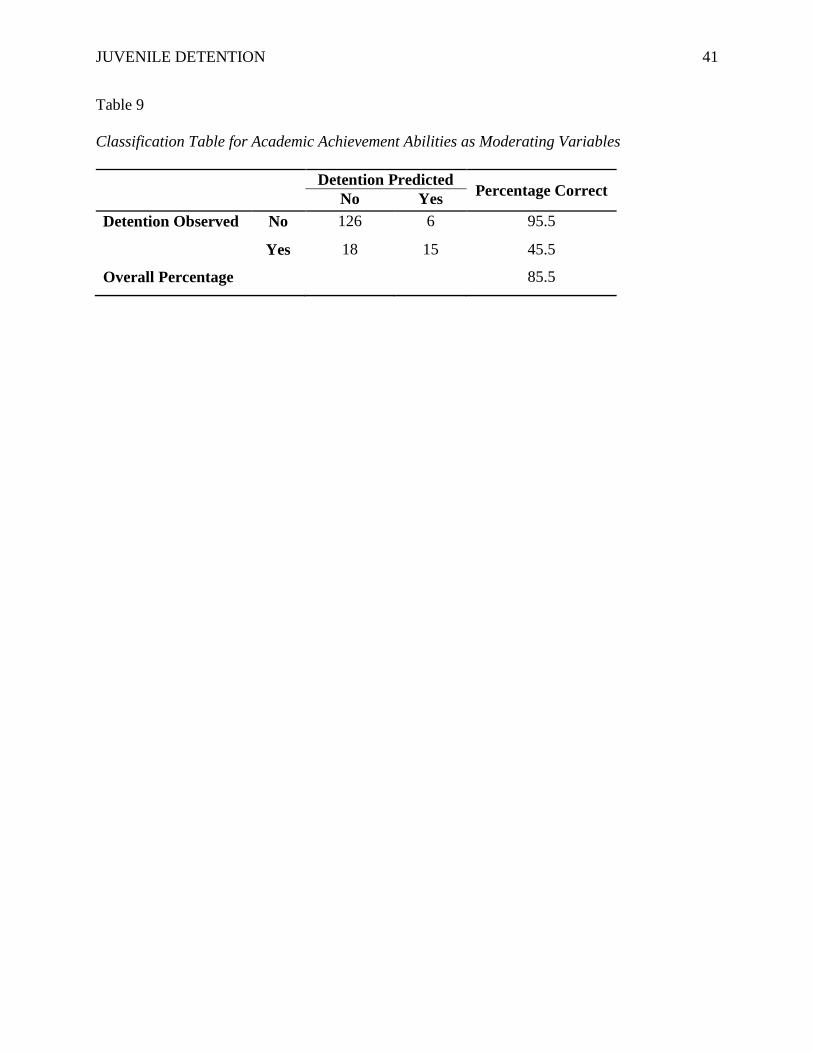
The moderated logistic regression model was statistically significant, χ2(13, 165) = 40.85,
p < .001. Table 8 reflects the odds ratio of these associations. The model correctly classified
85.5% of cases and explained 34.7% (Nagelkerke R2) of the variance in detention (see Table 9).
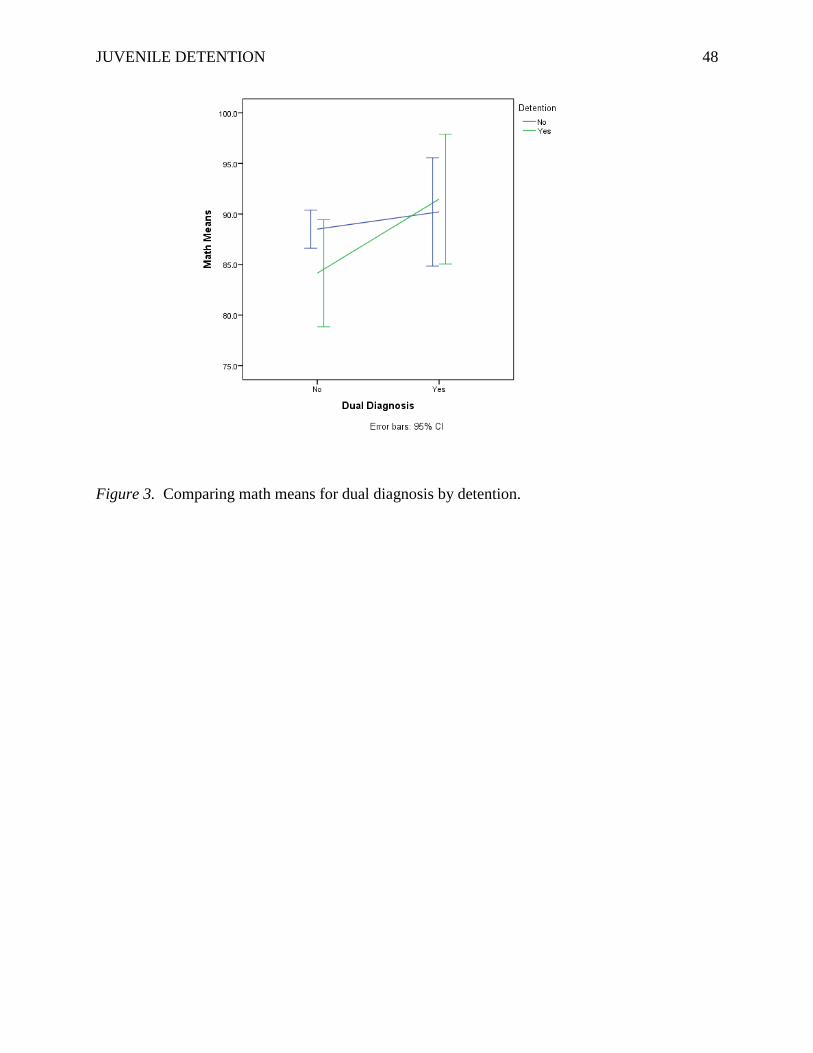
The significant predictors of detention placement were dual diagnosis (p < .01), math
computation (p < .05), and the interaction term, Math*Dual Diagnosis (p < .05). These results
indicate that the odds of detention increases 5.73 times for juveniles with dual diagnosis and
decreases 1.23 times for every unit of increase in math score. However, for dually-diagnosed
juveniles, the odds of detention increases 1.15 times with every unit of decrease in math score.
Exploratory Analyses
In order to determine whether there was another variable impacting the unexpected math
scores, exploratory analyses were conducted examining various factors such as ethnicity, gender,
and referral source. Ethnicity and gender did not significantly contribute to the model predicting
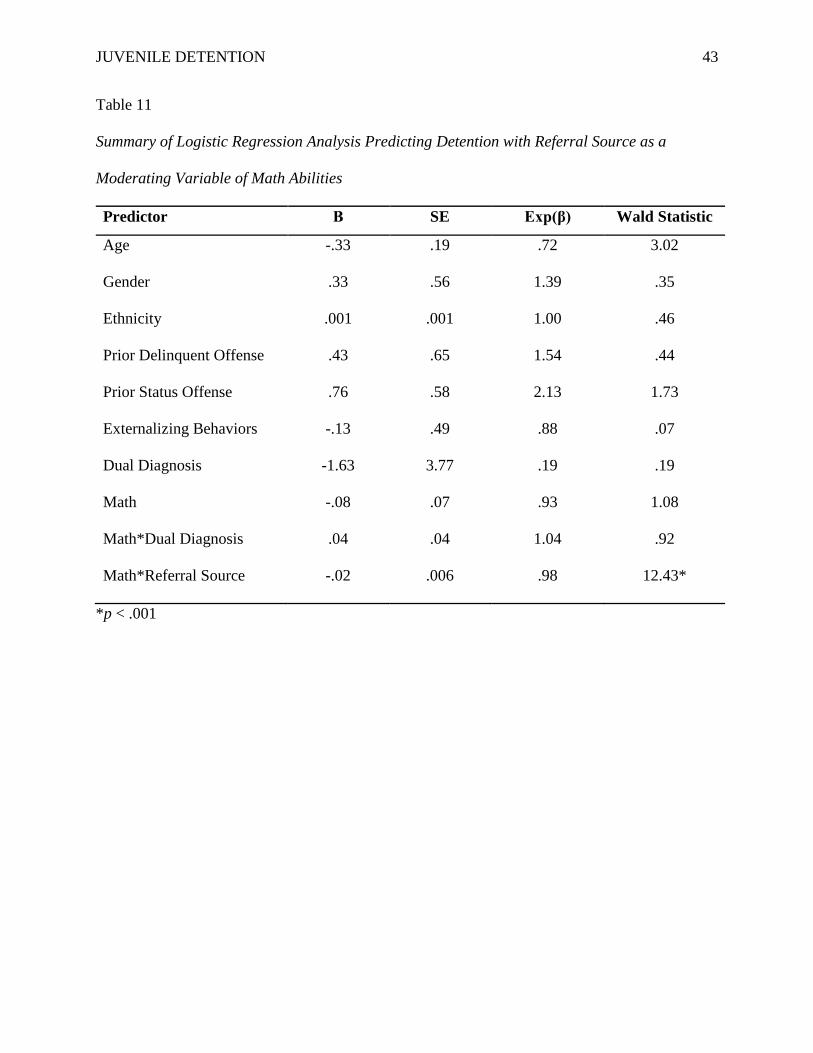
detention; however, referral source did. The moderated logistic regression was statistically
significant, χ2(10, 176) = 47.80, p < .001. Table 11 reflects the odds ratio of these associations.
The model correctly classified 86.4% of cases and explained 38.4% (Nagelkerke R2) of the
variance in detention (see Table 12). The interaction term, Math*Referral Source, was the only
significant predictor of detention (odds ratio = .98). These results suggest that there was an
inverse relationship between referral source, dual diagnosis, and detention rates. The odds of
detention increases 1.02 times for dually-diagnosed juveniles involved in truancy court.
In order to determine if truancy weighted the mean math scores, we examined the
distribution of truancy among our groupings (see Table 13). As Figure 4 illustrates, mean math
scores for truant juveniles were lower overall. Similarly, mean math scores for detained
juveniles also tended to be lower, except for juveniles referred from non-truancy sites (e.g.,

JUVENILE DETENTION 19
delinquency court, drug court, etc.). Based on these score distributions among truant vs. non-
truant juveniles, truancy could be a factor in decreasing mean math score. Once again, however,
inferences from this data should be made cautiously due to the unequal distribution of the sample
in each group.
Discussion
As an extension of the work completed by Tolou-Shams et al. (2014), the purpose of the
present study was to examine whether IQ and various academic skills (i.e., reading
comprehension, spelling, and math) moderated the relationship between dual diagnosis (i.e., co-
occurring psychiatric and substance use disorders) and CINI juveniles’ detention at 12 months
post court evaluation. It was predicted that lower IQ scores and/or weak academic skills (i.e.,
impairments in reading comprehension, math computation, etc.) would moderate dually-
diagnosed juveniles’ chances of detention. Overall, the results provided mixed support for the
primary hypothesis and raised important implications for effectively addressing juvenile dual
diagnosis and providing proper educational supports for students struggling in the classroom.
After conducting a series of multiple regressions, we found that dual diagnosis, prior
status offenses, weak math computation skills, and truancy court referrals were the most
significant predictors of CINI juvenile detention placement. While dual diagnosis has been
established as a major risk factor for detention, added disadvantages such as math computation
weakness or truancy from school can exacerbate juveniles’ risk for detention. The current results
need to be interpreted with caution, however, since there were vastly unequal distributions (N) in
the various groups (i.e., dual diagnosis, no dual diagnosis, detention, no detention). In addition,
it is possible that there was a selection bias in referral source, with truancy court judges referring
vastly more juveniles to the court clinic for educational testing and evaluation than judges from

JUVENILE DETENTION 20
other referral sites (i.e., drug court, delinquency court). These differences could be due to the
inherent nature of truancy court. Truancy court judges work closely with the juveniles’ cases
and seek to target and overcome the underlying causes of truancy (e.g., school or academic
issues, mental health issues, family and community issues, etc.). Therefore, these judges may be
more likely to notice educational difficulties and, subsequently, refer juveniles for assessment
and services.
Psychiatric Concerns
Overall, most of the juveniles in the current sample did not have a dual diagnosis nor
were detained within 12 months of their court evaluation. However, those juveniles who did
have a dual diagnosis had a heightened risk of future detention. This relationship remained
significant even after accounting for various demographic variables commonly linked with
reoffending and detention such as age, gender (although significantly more boys than girls were
detained), race and ethnicity, presence of externalizing behavior problems, and prior status
offenses. This increased risk of committing another offense resulting in detention may be due to
the substance use (severe enough to warrant an abuse or dependency diagnosis) that co-occurs
with an Axis I psychiatric disorder (Tolou-Shams et al, 2014).
As Tolou-Shams et al. (2014) noted, these results have tremendous implications for the
juvenile justice system. Implementing a screening policy for substance use and other psychiatric
concerns at the juvenile’s first court contact would enable court clinicians to determine the
juvenile’s and his/her family’s specific problems and provide early, appropriate treatment
referrals. Targeting these needs in a timely fashion can not only help offset repeat legal
involvement and its associated negative outcomes (particularly related to substance use), but also
result in more efficient use of mental health, legal, school, and health system resources.

JUVENILE DETENTION 21
Cognitive Functioning
Unlike most of the literature on juvenile offenders, the current juveniles had IQ and
academic achievement scores that fell largely within the average range, with only math
computation scores falling below average. This difference may be explained by the fact that
most research on juvenile offenders focuses on incarcerated juveniles while the present study
focused on non-incarcerated juveniles. This could suggest that juveniles who do not commit
serious enough offenses to result in incarceration have greater IQ and cognitive abilities overall.
Math computation. While our sample of CINI juveniles had average cognitive abilities
overall, their math computation abilities fell below average. It should be noted that math
computation was also the only IQ or academic variable to significantly contribute to the
prediction of juvenile detention. The significant interaction between dual diagnosis and math
computation abilities in the prediction of detention engenders numerous questions about this
relationship that need to be examined in future research. For example, was this interaction
between dual diagnosis and math computation abilities significant due to inherent cognitive
processes involved with mathematics or could it be due to the weakness itself? It could be that
any type of vulnerability (e.g., below average IQ, reading comprehension, etc.) could contribute
to delinquent behavior and subsequent involvement in the juvenile justice system. Furthermore,
it is also important to determine whether the impact of academic vulnerability (particularly math
computation abilities in this study) is actually due to deficits in specific cognitive processes or
whether it is due to another underlying variable (e.g., socialization problems).
Hirschi’s (1969) social control theory posits that intelligence, academic ability, and
school performance directly relate to delinquency and that their effects are independent of other
causal factors such as age, gender, and socioeconomic status (Moffit et al., 1981; White et al.,

JUVENILE DETENTION 22
1989). Youth with average or high cognitive ability are more likely to experience rewards in
school for their strong performance and, therefore, find fulfillment and enjoyment in that arena
(Short & Strodtbeck, 1965; Rhodes & Reiss, 1969; West & Farrington, 1973; Hirschi &
Hindelang, 1977; Mednick et al., 1977; Moffit et al., 1981). Youth with low cognitive ability
and poor school performance, however, are more likely to experience frustration, failure, and
poor self-esteem, limiting the rewards they receive in school and leading to an overall negative
experience (Moffit et al., 1981; White et al., 1989).
These experiences of educational failure, ridicule, and neglect can ultimately lead to
delinquent and antisocial behavior by creating negative attitudes toward authority and making
children more susceptible to the effects of peer pressure, as peers provide an important source of
esteem and social reward (Moffit et al., 1981; Finn, Stott, & Zarichny, 1988; Brier, 1993;
Shelley-Tremblay et al., 2007). In fact, many individuals with learning disabilities and low self-
esteem report seeking acceptance and rewards by joining gangs or engaging in illegal activities
(e.g., drug use) (Drakeford, 2002). Therefore, it seems as though a combination of academic
problems, characteristics of the school environment (i.e., supportive vs. unsupportive teachers),
social relationships established in school, and youths’ perceptions of their educational
opportunities, may have a direct bearing on delinquent behavior and involvement in the juvenile
justice system (Shelley-Tremblay et al., 2007).
The social control theory could help to explain the influence of math computation on the
relationship between the juveniles’ dual diagnosis and detention. The current sample of
juveniles demonstrated average abilities in all IQ and academic achievement variables except for
math computation. The juveniles’ strengths in these other arenas may have acted as a protective
factor to the possible failure and frustration caused by their math weakness. This could have
JUVENILE DETENTION 23
reduced the magnitude of their original offenses, separating these CINI juveniles from their
incarcerated peers.
Impact of truancy. Of the juveniles in the current sample, juveniles referred from
truancy court had the lowest mean math scores. As previously discussed, the social control
theory posits that youth with poor academic performance tend to endure a negative overall
experience in school. This relationship can generate a downhill spiral of negative outcomes –
poor attendance (i.e., truancy), increase in problem behaviors, dropping out of school,
incarceration, and recidivism (Wilkerson et al., 2012). Truancy can be considered not only a
delinquent behavior in and of itself, but also a precursor to further delinquency. Poor school
attendance directly impacts the youth’s academic performance, exacerbating the negative
education experience (i.e., failure, frustration, low self-esteem). Furthermore, by not attending
school, youth have more free time to engage in other delinquent activities. Therefore, it seems as
though unaddressed academic vulnerabilities can put youth at risk for truant behavior, which can
spiral into serious and longstanding effects on juveniles’ ability to successfully complete school
and integrate into the community (Keith & McCray, 2002; Vanderstaay, 2006; Wilkerson et al.,
2012; Rucklidge et al., 2013).
Limitations
As Tolou-Shams et al. (2014) previously outlined, the methodology employed in the
study boasts a number of strengths. Despite notable strengths such as reviewing a large sample
size and collecting detention data through a statewide court database which ensures greater
outcome accuracy than self-report methods, our study has several limitations. Future studies
should be performed to replicate and further validate the findings reported here. These studies
should be conducted in court clinic settings and incorporate prospective methods.
JUVENILE DETENTION 24
As this study was a retrospective chart review and the data were not collected specifically
for research purposes, several inherent challenges for data collection and generalizability arose in
spite of rigorous chart review procedures. First and foremost, evaluation measures were chosen
depending on clinical need, resulting in missing data among the adolescents. For example, due
to inconsistencies in the court clinic’s administration of the KBIT-2 and WRAT-4 assessments,
we used a reduced sample in order to control for these data gaps. This not only greatly reduced
our overall sample size, but also greatly affected the sample distributions among the subgroups
(e.g., detention vs. no detention, dual diagnosis vs. no dual diagnosis, etc.).
Generalizability was also limited as data was only collected from one juvenile justice
court clinic in the northeastern United States. Other juvenile justice jurisdictions may have vast
differences in the demographics (e.g., age, gender, race, ethnicity, socioeconomic status, etc.)
and psychological concerns of their adolescents compared to the current jurisdiction. In
addition, the juveniles court-ordered to the study clinic may not even reflect the larger juvenile
justice population in the immediate area, as these adolescents raised additional concerns from the
judge related to more evident emotional, behavioral, and psychological concerns (Tolou-Shams
et al., 2014).
Concluding Remarks and Future Directions
Despite its limitations, our study has several implications for the juvenile justice system
and its youth. The juvenile justice system has a high frequency of learning difficulties (Shelley-
Tremblay et al., 2007). As discussed, academic weaknesses can be associated with increased
behavior problems, involvement in antisocial behavior, and delinquency. These issues not only
directly affect the child and his or her family, but also indirectly causes serious clinical and
social problems (e.g., monetary costs associated with juvenile justice involvement and mental

JUVENILE DETENTION 25
health treatment, potential gang activity, increased youth drug use, etc.) (Rucklidge et al, 2013).
Therefore, there is a great need for preventative efforts to identify youth at risk for delinquency
(e.g., dual diagnosis, poor academic performance and lack of school attachment, etc.) and to
better understand how to effectively intervene to offset these youths’ risk factors.
While the current study generated thought-provoking results that have great implications
for juvenile mental health and the juvenile justice system, the field needs to continue this line of
research to further our understanding of the risks associated with CINI juvenile offending.
Future research should consider focusing more specifically on the social control theory by
incorporating various measures to examine juveniles’ self-esteem and attitudes towards school.
If possible, these studies should also incorporate more comprehensive neuropsychological
assessments to examine brain function to determine whether academic vulnerabilities are due
more to factors associated with neuropsychological problems such as executive functioning
deficits. This research could inform intervention and prevention programs to offset CINI
juveniles’ risk of offending (e.g., early detection of academic weaknesses and implementation of
support system to neutralize these weaknesses; increase youth attachment to school early in
academic career). CINI juveniles comprise a large portion of the juvenile justice population and
endure many of the same risk factors and associated negative outcomes as detained or
incarcerated juveniles (Tolou-Shams et al., 2014). Therefore, more research on this specific
juvenile justice population is critical.
JUVENILE DETENTION 26
References
Andrews, D. A., & Bonta, J. (2010a). The psychology of criminal conduct (5th ed.). Routledge
Andrews, D. A., & Bonta, J. (2010b). Rehabilitating criminal justice policy and practice.
Psychology, Public Policy, and Law, 16, 39-55.
Bain, S. K., & Jaspers, K. E. (2010). Review of Kaufman Brief Intelligence Test, Second
Edition. Journal of Psychoeducational Assessment, 28, 167-174. doi:
10.1177/0734282909348217
Bartels, J. M., Ryan, J. J., Urban, L. S., & Glass, L. A. (2010). Correlations between estimates
of state IQ and FBI crime statistics. Personality and Individual Differences, 48, 579-583.
doi: 10.1016/j.paid.2009.12.010
Beaver, K. M. & Wright, J .P. (2011). The association between county-level IQ and county
level crime rates. Intelligence, 39, 22-26. doi: 10.1016/j.intell.2010.12.002
Brier, N. (1993). Predicting antisocial behavior in youngsters displaying poor academic
achievement: a review of risk factors. Developmental and Behavioral Pediatrics, 16,
271-276.
Dell, C.A., Harrold, B., & Dell, T. (2008). Wide Range Achievement Test – Fourth Edition: test
review. Rehabilitation Counseling Bulletin, 52, 57-60.
Dishion, T. J., Capaldi, D., Spracklen, K. M., & Li, F. (1995). Peer ecology of male adolescent
drug use. Development and psychopathology. Special Issue: Developmental Processes in
Peer Relations and Psychopathology, 7, 803–824.
Drakeford, W. (2002). The impact of an intensive program to increase the literacy skills of
youth confined to juvenile corrections. Journal of Correctional Education, 53,
139-144.
JUVENILE DETENTION 27
Finn, J.D., Stott, M. W. R., & Zarichny, K. T. (1988). School performance and adolescents in
juvenile court. Urban Education, 23, 150-161.
Grisso, T. (2004). Double jeopardy: Adolescent offenders with mental disorders. Chicago, IL:
University of Chicago Press.
Guay, J.P., Ouimet, M., & Proulx, J. (2005). On intelligence and crime: a comparison of
incarcerated sex offenders and serious non-sexual violent criminals. International
Journal of Law and Psychiatry, 28, 405-417. doi: 10.1016/j.ijlp.2004.03.010
Hirschi, T., & Hindelang, M.J. (1977). Intelligence and delinquency: a revisionist review.
American Sociological Review, 42, 571-587.
Hockenberry, S., & Puzzanchera, C. (2014). Juvenile court statistics 2011. National Center for
Juvenile Justice Report, 1-116.
Jones, K. & Duncan, C. (1995). Individuals and their ecologies: analyzing the geography of
chronic illness within a multilevel modeling framework. Health and Place, 1, 27-40.
Keith, J.M., & McCray, A.D. (2002). Juvenile offenders with special needs: critical issues and
bleak outcomes. International Journal of Qualitative Studies in Education, 15, 691-710.
Koolhof, R., Loeber, R., Wei, E. H., Pardini, D., & D’Escury, A.C. (2007). Inhibition deficits of
serious delinquent boys of low intelligence. Criminal Behavior and Mental Health, 17,
274-292.
Kubrin, C.E. & Weitzer, R. (2003). New directions in social disorganization theory. Journal of
Research in Crime and Delinquency, 40, 374-402. doi: 10.1177/0022427803256238
Loeber, R., Farrington, D.P., Stouthamer-Loeber, M., Moffitt, T., & Caspi, A. (1998). The
development of male offending: key findings from the first decade of the Pittsburgh
Youth Study. Studies in Crime and Crime Prevention, 7, 141-172.

JUVENILE DETENTION 28
Loeber, R., Menting, B., Lynam, D.R., Moffitt, T.E., Stouthamer-Loeber, M., Stallings, R.,…
Pardini, D. (2012). Findings from the Pittsburgh Youth Study: cognitive impulsivity and
intelligence as predictors of the age-crime curve. Journal of the American Academy of
Child and Adolescent Psychiatry, 51, 1136-1149.
Lynam, D., Moffitt, T.E., & Stouthamer-Loeber, M. (1993). Explaining the relation between IQ
and delinquency: class, race, test motivation, school failure, or self-control? Journal of
Abnormal Psychology, 102, 187-196.
MacDonald, J.M., & Gover, A.R. (2005). Concentrated disadvantage and youth-on-youth
homicide. Homicide Studies, 9, 30-54. doi: 10.1177/1088767904271433
Mauricio, A.M., Little, M., Chassin, L., Knight, G.P., Piquero, A.R., Losoya, S.H., & Vargas
Chanes, D. (2009). Juvenile offenders’ alcohol and marijuana trajectories: risk and
protective factor effects in the context of time in a supervised facility. Journal of Youth
and Adolescence, 38, 440-453. doi: 10.1007/s10964-008-9324-5
Mazawi, A.E. (1999). Concentrated disadvantage and access to educational credentials in Arab
and Jewish localities in Israel. British Educational Research Journal, 25(3), 355-370.
McDaniel, M.A. (2006). Estimating state IQ: measurement challenges and preliminary
correlates. Intelligence, 34, 607-619. doi: 10.1016/j.intell.2006.08.007
Mednick, S.A., Kirkegaard-Sorensen, L.D., Hutchings, B., Knop, J., Rosenberg, R., &
Schulsinger, F. (1977). An example of biosocial interaction research: the interplay of
socioenvironmental and individual factors in the etiology of criminal behavior. In S.A.
Mednick & K.O. Christiansen (Eds.), Biosocial bases of criminal behavior (pp. 9-24).
New York, NY: Gardner Press.

JUVENILE DETENTION 29
Moffitt, T. E., Gabrielli, W. F., Mednick, S. A., & Schulsinger, F. (1981). Socioeconomic
status, IQ, and delinquency. Journal of Abnormal Psychology, 90, 152-156.
National Council on Disability (2003). Addressing the needs of youth with disabilities in the
juvenile justice system: the current status of evidence-based research. Washington, DC:
National Council of Disability.
National Mental Health Association (2004). Mental health treatment for youth in the juvenile
justice system: a compendium of promising practices, 1-20.
Parker, K. F., Stults, B. J., & Rice, S. K. (2005). Racial threat, concentrated disadvantage and
social control: considering the macro-level sources of variation in arrests. Criminology,
43, 1111-1134.
Pesta, B. J., McDaniel, M. A., & Bertsch, S. (2010). Toward an index of well-being for the fifty
U.S. states. Intelligence, 38, 160-168. doi: 10.1016/j.intell.2009.09.006
Puzzanchera, C. (2014). Juvenile arrests 2012. Juvenile Offenders and Victims: National
Report Series Bulletin, 1-12.
Rhodes, A. L., & Reiss, A. J. (1969). Apathy, truancy, and delinquency as adaptations to school
failure. Social Forces, 48, 12-22.
Rucklidge, J. J., McLean, A. P., & Bateup, P. (2009). Criminal offending and learning
disabilities in New Zealand youth: does reading comprehension predict recidivism?
Crime and Delinquency, 59, 1263-1286. doi: 10.1177/0011128709336945
Sampson, R.J., Raudenbush, S.W., & Earls, F. (1997). Neighborhoods and violent crime: a
multilevel study of collective efficacy. Science, 277, 918-924.

JUVENILE DETENTION 30
Shelley-Tremblay, J., O’Brien, N., & Langhinrichsen-Rohling, J. (2007). Reading disability in
adjudicated youth: prevalence rates, current models, traditional and innovative
treatments. Aggression and Violent Behavior, 12, 376-392.
doi: 10.1016/j.avb.2006.07.003
Short, J. F., Jr., & Strodtbeck, F. L. (1965). Group process and gang delinquency. Chicago:
University of Chicago Press.
Steinberg, L. (2010). A dual systems model of adolescent risk-taking. Developmental
Psychobiology, 52, 216-224.
Steinberg, L., Cauffman, E., Woolard, J., Graham, S., & Banich, M. (2009). Are adolescents
less mature than adults? Minors’ access to abortion, the juvenile death penalty, and the
alleged APA “flip-flop.” American Psychologist, 64, 583-594.
Teplin, L.A., Abram, K.M., McClelland, G.M., & Dulcan, M.K. (2003). Comorbid psychiatric
disorders in youth in juvenile detention. NIH Public Access, 1-15. doi:10.1001/
archpsyc.60, 11.1097.
Teplin L. A., Abram, K.M., McClelland, G.M., Dulcan, M.K., & Mericle, A.A. (2002).
Psychiatric disorders in youth in juvenile detention. NIH Public Access, 1-14.
Thornberry, T. P., Krohn, M. D., Lizotte, A. J., & Chard-Wierschem, D. (1993). The role of
juvenile gangs in facilitating delinquent behavior. Journal of Research in Crime and
Delinquency, 30, 55–87. doi:10.1177/0022427893030001005
Thornberry, T. P., Krohn, M. D., Lizotte, A. J., Smith, C. A., & Tobin, K. (2003). Gangs and
delinquency in developmental perspective. New York: Cambridge University Press.
Tolou-Shams, M., Rizzo, C.J., Conrad, S.M., Johnson, S., Oliveira, C., & Brown, L.K. (2014).

JUVENILE DETENTION 31
Predictors of detention among juveniles referred for a court clinic forensic evaluation.
Journal of the American Academy of Psychiatry and the Law, 42, 56-65.
Vanderstaay, S.L. (2006). Learning from longitudinal research in criminology and the health
sciences. Reading Research Quarterly, 41, 328-350.
Welte, J. W., Barnes, G. M., Hoffman, J. H., Wieczorek, W. F., & Zhang, L. (2005). Substance
involvement and the trajectory of criminal offending in young males. The American
Journal of Drug and Alcohol Abuse, 31, 267-284. doi: 10.1081/ADA-200047934
Wen, M., Browning, C.R., & Cagney, K.A. (2003). Poverty, affluence, and income inequality:
neighborhood economic structure and its implications for health. Social Science and
Medicine, 57, 843-860.
West, D.J. & Farrington, D.P. (1973). Who becomes delinquent? London: Heinemann.
White, H.R., Loeber, R., Stouthamer-Loeber, M.B., & Farrington, D.P. (2009). Developmental
associations between substance use and violence. Development and Psychopathology,
11, 785-803. doi: 10.1017/S0954579499002321
White, J.L., Moffitt, T.E., & Silva, P.H., (1989). A prospective replication of the protective
effects of IQ in subjects at high risk for juvenile delinquency. Journal of Consulting and
Clinical Psychology, 57, 719-724.
Whitted, K.S., Delavega, E., & Lennon-Dearing, R. (2013). The youngest victims of violence:
examining the mental health needs of young children who are involved in the child
welfare and juvenile justice systems. Child and Adolescent Social Work Journal, 30,
181-195. doi: 10.1007/s10560-012-0286-9

JUVENILE DETENTION 32
Wilkerson, K.L., Gagnon, J.C., Mason-Williams, L., & Lane, H.B. (2012). Reading instruction
for students with high-incidence disabilities in juvenile corrections. Preventing School
Failure, 56, 219-231. doi: 10.1080/1045988X.2011.652698
Wolfgang, M., Figlio, R. M., & Sellin, T. (1972). Delinquency in a birth cohort. Chicago:
University of Chicago Press.
Yen, I. H. & Kaplan, G. A. (1999). Poverty area residence and changes in depression and
perceived health status: evidence from the Alameda County Study. International Journal
of Epidemiology, 28, 90-94.
Yun, J.T. & Moreno, J.F. (2006). College access, K-12 concentrated disadvantage, and the next
25 years of education research. Educational Researcher, 35, 12-19.

JUVENILE DETENTION 33
Table 1
Frequencies of Demographic Data for Detained vs. Non-Detained Juveniles
Type Subgroup No Detention
(N = 206)
Detention
(N = 43) Total
Gender Male 116 33 149
Female 90 10 100
Race/Ethnicity White 134 28 162
African American 10 8 18
Hispanic/Latino 36 5 41
Other* 19 0 19
Dual Diagnosis Absent 137 17 154
Present 27 22 49
Referral Source Delinquency 14 5 19
Truancy Court 171 16 187
Drug Court 21 22 43
Health Insurance Uninsured 24 4 28
Public 77 15 92
Private 86 21 107
IEP/504 Plan No 100 22 122
Yes 50 13 63
Prior Delinquent Offense No 183 31 214
Yes 13 12 25
Prior Status Offense No 173 31 204
Yes 26 12 38
Externalizing Behavior Diagnosis Absent 129 26 155
Present 77 17 94
Note: total N = 249; *comprised of American Indian, Asian/Pacific Islander, and ‘Other’

JUVENILE DETENTION 34
Table 2
Overall Descriptive Statistics for Cognitive Functioning
Type Name Mean Std. Deviation N
IQ Verbal Standard Score 91.20 11.77 248
Nonverbal Standard Score 94.79 13.80 248
IQ Composite 92.02 12.74 248
Academic
Abilities
Word Reading 97.29 13.49 228
Sentence Comprehension 93.16 12.86 226
Reading Composite 94.34 12.33 225
Spelling 96.32 13.65 218
Math Computation 88.44 11.28 225
Note: differences in N due to inconsistencies in assessment administration

JUVENILE DETENTION 35
Table 3
Gender Descriptive Statistics for Cognitive Functioning
Type Name Mean Std. Deviation N
Male Female Male Female Male Female
IQ Verbal 91.67 90.50 11.72 11.88 148 100
Nonverbal 94.78 94.81 14.86 12.14 148 100
IQ Composite 92.29 91.63 13.23 12.05 148 100
Academic
Abilities
Word Reading 97.56 96.88 13.86 12.98 136 92
Sentence Comprehension 92.22 94.59 13.49 11.85 136 90
Reading Composite 94.01 94.83 12.51 12.12 135 90
Spelling 95.17 97.99 15.59 10.07 129 89
Math Computation 88.23 88.77 11.55 10.93 135 90
Note: differences in N due to inconsistencies in assessment administration
JUVENILE DETENTION 36
Table 4
Summary of Logistic Regression Analysis Predicting Detention with Demographic, Mental
Health, and Prior Offending Variables
Predictor β SE Exp(β) Wald Statistic
Age .03 .16 1.03 .03
Gender .69 .44 1.99 2.45
Ethnicity .001 .001 1.00 1.04
Prior Delinquent Offense .79 .56 2.21 1.99
Prior Status Offense 1.06 .49 2.89 4.73*
Externalizing Behaviors -.39 .42 .67 .89
Dual Diagnosis 1.71 .46 5.52 13.65**
*p < .05, **p < .001
JUVENILE DETENTION 37
Table 5
Classification Table for Demographic, Mental Health, and Prior Offending Variables
Detention Predicted Percentage Correct
No Yes
Detention Observed No 148 6 96.1
Yes 31 8 20.5
Overall Percentage 80.8
JUVENILE DETENTION 38
Table 6
Summary of Logistic Regression Analysis Predicting Detention with Intellectual Functioning as
a Moderating Variable
Predictor β SE Exp(β) Wald Statistic
Age .03 .16 1.03 .03
Gender .72 .44 2.05 2.63
Ethnicity .001 .001 1.00 1.06
Prior Delinquent Offense .79 .57 2.21 1.95
Prior Status Offense 1.06 .49 2.89 4.66*
Externalizing Behaviors -.45 .43 .64 1.09
Dual Diagnosis 1.74 .47 5.68 13.75**
IQ Composite -.04 .05 .96 .48
IQ*Dual Diagnosis .02 .04 1.02 .35
*p < .05, ** p < .001

JUVENILE DETENTION 39
Table 7
Classification Table for Intellectual Functioning as a Moderating Variable
Detention Predicted Percentage Correct
No Yes
Detention Observed No 146 7 95.4
Yes 31 8 20.5
Overall Percentage 80.2

JUVENILE DETENTION 40
Table 8
Summary of Logistic Regression Analysis Predicting Detention with Academic Achievement
Abilities as Moderating Variables
Predictor β SE Exp(β) Wald Statistic
Age -.14 .18 .87 .61
Gender .96 .53 2.60 3.23
Ethnicity .001 .001 1.00 1.74
Prior Delinquent Offense 1.00 .65 2.72 2.35
Prior Status Offense .81 .59 2.24 1.87
Externalizing Behaviors -.67 .49 .51 1.83
Dual Diagnosis 1.75 .59 5.73 8.53*
Spelling -.04 .10 .96 .13
Math -.21 .10 .81 4.37**
Reading .12 .12 1.13 1.00
Spelling*Dual Diagnosis .08 .08 1.08 1.04
Math*Dual Diagnosis .14 .07 1.15 4.59**
Reading*Dual Diagnosis -.15 .09 .86 2.51
*p < .01, ** p < .05
JUVENILE DETENTION 41
Table 9
Classification Table for Academic Achievement Abilities as Moderating Variables
Detention Predicted Percentage Correct
No Yes
Detention Observed No 126 6 95.5
Yes 18 15 45.5
Overall Percentage 85.5

JUVENILE DETENTION 42
Table 10
Summary of Mean Math Scores
Dual Diagnosis
No Yes
Detention
No 88.50 (N = 129) 90.21 (N = 24)
Yes 84.14 (N = 14) 91.47 (N = 19)
Note: GN = 186; GM = 88.44
JUVENILE DETENTION 43
Table 11
Summary of Logistic Regression Analysis Predicting Detention with Referral Source as a
Moderating Variable of Math Abilities
Predictor Β SE Exp(β) Wald Statistic
Age -.33 .19 .72 3.02
Gender .33 .56 1.39 .35
Ethnicity .001 .001 1.00 .46
Prior Delinquent Offense .43 .65 1.54 .44
Prior Status Offense .76 .58 2.13 1.73
Externalizing Behaviors -.13 .49 .88 .07
Dual Diagnosis -1.63 3.77 .19 .19
Math -.08 .07 .93 1.08
Math*Dual Diagnosis .04 .04 1.04 .92
Math*Referral Source -.02 .006 .98 12.43*
*p < .001

JUVENILE DETENTION 44
Table 12
Classification Table for Referral Source as a Moderating Variable of Math Abilities
Detention Predicted Percentage Correct
No Yes
Detention Observed No 136 7 95.1
Yes 17 16 48.5
Overall Percentage 86.4

JUVENILE DETENTION 45
Table 13
Summary of Mean Math Scores: Frequencies of Truancy Referrals
Dual Diagnosis
No Yes
Detention
No 88.50 (N = 129, n = 109) 90.21 (N = 24, n = 19)
Yes 84.14 (N = 14, n = 9) 91.47 (N = 19, n = 3)
Note: GN = 186; GM = 88.44; N denotes total number of juveniles; n denotes number of
juveniles who were referred from truancy court
JUVENILE DETENTION 46
a) Direct Pathway
b) Moderated Pathway
Figure 1. Theoretical moderation model of IQ.
IQ
Detention Dual Diagnosis
Dual Diagnosis Detention
JUVENILE DETENTION 47
a) Direct Pathway
b) Moderated Pathway
Figure 2. Theoretical moderation model of academic achievement abilities.
Academic
Achievement
Abilities
Detention Dual Diagnosis
Dual Diagnosis Detention
JUVENILE DETENTION 48
Figure 3. Comparing math means for dual diagnosis by detention.

JUVENILE DETENTION 49
Figure 4. Comparing math means for referral source by detention.