Embed Size (px)
Citation preview

The Role of Hedge Funds as Primary Lenders
Vikas Agarwal
Georgia State University
Costanza Meneghetti
West Virginia University
This version: April 20, 2010
Abstract
We examine the role of hedge funds as primary lenders to corporate firms. We investigate both
the reasons and the implications of hedge funds’ activities in the primary loan market. We
examine the characteristics of firms that borrow from hedge funds and find that borrowers are
primarily firms with lower profitability, lesser credit quality, and higher asymmetric information.
Our results suggest that hedge funds serve as lenders of last resort to such firms that may find it
difficult to borrow from banks or issue public debt. We also examine the effect of hedge fund
lending on the borrowing firms and find that borrowers’ profitability and creditworthiness
improve subsequent to the loan. This beneficial effect of hedge fund lending is corroborated by
our finding of positive abnormal returns for borrowers’ stocks around the loan announcement
date. Overall, our findings are consistent with hedge funds adding value through their lending
relationships and financial markets perceiving these activities as good news for the firms.
___________________________________________ Vikas Agarwal is from Georgia State University, Robinson College of Business, 35, Broad Street, Suite 1221,
Atlanta GA 30303, USA: e-mail: [email protected] Tel: +1-404-413-7326, Fax: +1-404-413-7312. Vikas Agarwal
is also a Research Fellow at the Centre for Financial Research (CFR), University of Cologne. Costanza Meneghetti
is from West Virginia University, 1601 University Ave., Room 214, Morgantown, WV 26506-6025, USA: e-mail:
[email protected] Tel: +1-304-293-7889, Fax: +1-304-293-5652. We are grateful to Rajesh
Aggarwal, Gerald Gay, Wei Jiang, Jayant Kale, and Ilya Strebulaev for their comments. We are grateful for
financial support from the BNP Paribas Hedge Fund Centre at HEC Paris. Meneghetti also acknowledges the
financial support from the WVU Senate Summer Grant and the WVU College Research and Library Committee
Grant. We are thankful to Linlin Ma for excellent research assistance. We are responsible for all errors.

1
The Role of Hedge Funds as Primary Lenders
The main purpose of this study is to investigate the role of hedge funds as primary
lenders. In recent years, hedge funds have been providing million of dollars to companies in need
of cash, and are emerging as a potential competitor of banks as a financing source.1 To the best
of our knowledge, this is the first study of hedge funds’ activities in the primary loan market. In
this paper, we address three issues. First, we examine the characteristics of firms that turn to
hedge funds, instead of going to the banks or the public market, for their financing needs.
Second, we study the effect of hedge fund lending on the borrowers. Finally, we examine the
abnormal returns of the borrower’s stock around the loan announcement date.
There can be several reasons for hedge funds’ lending capital to firms. First, hedge funds
may be lending to a distressed firm to make a ―cheap‖ bet on the firm’s recovery. This can allow
them to influence important decisions related to future firm value by serving on committees as
powerful creditors or changing the company’s management and board, operational strategies,
asset holdings or capital structure (Harner, 2008). Second, as lenders, hedge funds may get more
frequent information in the form of monthly financial updates as opposed to shareholders and
debtholders who may only receive quarterly reports.
We use Factiva to hand-collect data on a sample of 42 firms that borrow capital from 13
hedge funds for the period 1999-2006. We compare the firms borrowing from hedge funds (case
firms) with those that either receive bank loans or issue public debt (control firms) on three
major attributes – profitability, creditworthiness, and asymmetric information. Using different
measures of these attributes, we find that firms borrowing from hedge funds have lower
1 Although there is no data on the exact amount of loans owned by hedge funds, institutions as a group bought $224
billion of loans in 2005 compared with $50 billion in 2000 according to Reuters Loan Pricing Corporation
(Anderson, 2006).

2
profitability, lesser creditworthiness, and higher asymmetric information compared to the two
sets of control firms. Interestingly, this finding complements the work of Brophy, Ouimet, and
Sialm (2009), which shows that hedge funds participate in private placements of firms with poor
fundamentals and greater information asymmetries.
Next, we examine the effect of hedge fund lending on the borrowing firms by studying the
changes in the borrowers’ characteristics one and two years after the loan. We find that
subsequent to receiving loans from hedge funds, there is an improvement in the borrowing firms’
profitability and creditworthiness. To corroborate this beneficial effect of hedge fund lending, we
then examine the abnormal returns of the case firms around the announcement dates of the hedge
fund loans. Intuitively, hedge funds can profit from lending if the borrowers improve their
profitability and creditworthiness and are eventually able to pay back the loan. Thus, we expect
borrowers’ firm value to increase after the loan. If this indeed is the case, we would expect
investors to perceive the news of hedge fund loans as good news. Therefore, we expect to
observe positive abnormal returns for the borrowers’ stock around the date of the loan.
Consistent with this hypothesis, we find that the abnormal returns are indeed positive and
significant about ten days prior to the loan announcement date.
Overall, our study makes two important contributions to the extant literature. First, it
shows how hedge funds can emerge as lenders of last resort for financially distressed firms that
are perhaps unable to raise money through the conventional means (typically borrowing from
banks or issuing public debt). Second, it provides new evidence on a hitherto unexplored subject
of hedge funds adding value to the borrowers through their activities in the primary loan market.

3
I. Literature review
To the best of our knowledge, there is no research on the role of hedge funds as primary
lenders. However, there is an extensive literature on the potential costs and benefits of bank debt.
In the theoretical models developed by Berlin and Loeys (1988) and Chemmanur and Fulghieri
(1994), banks can monitor firms and are able to make optimal renegotiation/liquidation
decisions. In Fama (1985), banks are good screeners and can reduce information asymmetry.
Finally, in Diamond (1991) and Rajan (1992), banks are ex-post monitors that can affect firm’s
choice of projects. Empirical work such as Best and Zhang (1993), Datta, Iskandar-Datta, and
Patel (1999), and Krishnaswami, Spindt, and Subramaniam (1999) presents evidence consistent
with the ability of banks to monitor the borrowers and produce information. While a bank can
observe the flow of funds in the borrower’s account and only in some instances has a
representative sitting on the board of directors, hedge funds are more directly involved with the
firm. Thus, it is likely that hedge funds may monitor borrowers as effectively as banks, although
not always using the same channels.
A paper closely related to our analysis is by Ivashina and Sun (2007). They study the use
of private information disclosed by the borrowers during loan negotiations to benefit by
simultaneously trading in public securities. The focus of our paper is different: we are interested
in hedge funds’ foray in the primary loan market, its implications for borrowing firms, and
market’s reaction to hedge fund lending.
Finally, our paper complements the study of Brophy, Ouimet, and Sialm (2009), who find
that hedge funds invest in private placements of firms with poor performance and pronounced
information asymmetries. We find similar results in a different setting by being the first to show
4
that hedge funds engage in lending relationship with firms having lower profitability, lesser
creditworthiness, and greater asymmetric information.
II. Data and variable definitions
A. Data
Information on loans initiated by hedge funds is not readily available. We use Factiva to
collect news articles on hedge fund-initiated loans for the period 1999-2006. We conduct several
checks to ensure that the loan initiators in our sample are indeed hedge funds. First, we use the
list of hedge funds in the comprehensive database used in Agarwal, Daniel, and Naik (2009) to
match with those found in the news articles from Factiva. Second, we follow Agarwal, Fos, and
Jiang (2010) to also check the websites of the hedge fund companies and their being listed by
industry publications such as Hedge Fund Group (HFG), Barron’s, Alpha Magazine, and
Institutional Investors. After finalizing the sample of hedge fund loans, we match this hand-
collected dataset with COMPUSTAT to retrieve information on the borrower firms’
characteristics using the first statement available at least two months prior to the loan date. Table
1 shows the composition of our sample. Our sample consists of 44 loans by 13 hedge funds
lending to 42 firms out which 25 are public companies, 18 are traded in the OTC markets, and
one is not traded.2
B. Variable definitions
We compare three dimensions of firms that borrow from hedge funds with firms that
either borrow from banks or issue public debt. These dimensions are profitability,
creditworthiness, and asymmetric information.
B1. Measures of profitability
2 The number of loans slightly exceeds the number of borrowers as there are instances of repeat borrowing by a
couple of firms.

5
We use three different measures of firm’s profitability: ROA (the ratio of the operating
income before depreciation to total assets), Cash Flow (sum of income before extraordinary
items and depreciation divided by total assets), and Loss (dummy variable that equals 1 if the
operating income is negative, and 0 otherwise). Higher ROA and higher cash flows as well as
Loss variable being zero all correspond to greater profitability.
B2. Measures of creditworthiness
We employ four different proxies for creditworthiness of the firms. Leverage is the sum
of the firm’s book value of long term debt and debt in current liabilities divided by the sum of
book value of debt and market value of common equity. Interest Coverage is defined as
operating income before depreciation divided by interest expense, and measures the firm’s
ability to pay back its lenders. Z-Score is computed as (1.2*Working Capital+1.4*Retained
Earnings+3.3*Operating Income After Depreciation + Sales) / Total Assets as in Altman (1977).
Finally, Distance-to-default is measured as in Vassalou and Xing (2004), and refers to the
number of standard deviation decreases in firm value before it drops to the face value of debt
(i.e., the firm is in default). Higher Leverage, lower Interest Coverage, lower Z-score, and lower
Distance-to-default are associated with higher financial distress.
B3. Measures of information asymmetry
We use several proxies for asymmetric information that include (a) Size, defined as the
book value of the firm’s total assets, (b) Tangibility, measured as the firm’s net property, plant,
and equipment scaled by its total assets, (c) ROA Volatility (Sales Growth Volatility), defined as
the standard deviation of firm’s ROA (Sales Growth) over the previous 6 years for which we
include all firms that have at least three observations for ROA (Sales Growth), (d) Illiquidity,
defined as in Amihud (2002) as the yearly average of the square root of |return| / (price ×
6
volume)3, (e) the number of analysts following the firm from I/B/E/S database where the analysts
make at least one recommendation on the firm during the year, and (f) R&D Intensity and
Capital Intensity, defined as the R&D expense and capital expenditures scaled by the firm’s total
assets.
B4. Control Variables
In addition to focusing on the borrowing firms’ profitability, creditworthiness, and
information asymmetry, we control for several firm characteristics including (a) firms’ growth
opportunities as measured by Tobin’s Q ( book value of assets minus book value of common
equity plus market value of common equity divided by book value of assets), (b) firms’ age,
defined as the number of years the firm has been in the COMPUSTAT database, and (c) the
sales-based Herfindahl Index, measured as the sum of the squared market share of each firm in
the 6-digit NAICS code industry.
III. Distinguishing characteristics of firms borrowing from hedge funds
Next, we examine how firms borrowing from hedge funds (henceforth case firms) are
different from those that receive bank loans or issue public debt (henceforth control firms). The
objective of this exercise is to identify the reasons behind these firms turning to hedge funds for
financing.
Table 2 reports the mean and median firm characteristics for case firms and control firms.
Given the small sample size of the case firms, we focus on comparing the medians of the firm
characteristics and discuss the results from nonparametric Wilcoxon signed-rank test. We
compare case and control firms on three major attributes – profitability, creditworthiness, and
asymmetric information. Results in Table 2 show that case firms that borrow from hedge funds
are significantly less profitable than control firms that either issue public debt or borrow from
3 This is essentially an empirical analogue to the inverse of Kyle’s (1985) lambda, or the inverse of market depth.

7
banks. The median ROA for case firms is 0.003 and is significantly lower (at the 1% level) than
the median ROA for both types of control firms (0.028 for firms issuing public debt and 0.031 for
firms borrowing from banks). We obtain a similar result for our other two measures of
profitability — Cash Flow and Loss dummy. Table 2 shows that the median cash flow of firms
(as a fraction of firm’s total assets) borrowing from hedge funds is negative (−0.037) and lower
than the cash flow of the two types of control firms, both of which have positive median cash
flows (0.070 and 0.077).
Next, we compare the creditworthiness of case firms and control firms using four
different measures of creditworthiness – Leverage, Interest Coverage, Z-Score, and Distance-to-
default. Hedge fund borrowers have significantly higher median Leverage than that of bank
borrowers (0.374 versus 0.220). There is, however, no significant difference in the median
Leverage of hedge fund borrowers and bond issuers. Firms borrowing from hedge funds also
have a significantly lower median Interest Coverage compared to both bond issuers and bank
borrowers (0.486 versus 3.767 and 4.537 respectively). Furthermore, hedge fund borrowers
exhibit significantly lower median Z-Score when compared to bond issuers and bank borrowers
(−0.286 versus 0.434 and 0.764), and also have significantly lower Distance to-Default (1.467
versus 2.715 and 2.247). Overall, based on all four measures of creditworthiness, hedge fund
borrowers turn out to be of lower credit quality.
The results so far suggest that firms borrowing from hedge funds are characterized by a
significantly lower profitability and lower credit quality in contrast to control firms. Finally, we
compare case and control firms on asymmetric information. Results in Table 2 show that firms
borrowing from hedge funds are smaller (median size of $349 million compared to $5.7 billion
and $1.0 billion for bond issuers and bank borrowers), have higher ROA Volatility (median value

8
of 0.027 versus 0.009 for bond issuers and 0.014 for bank borrowers) and Sales Growth
Volatility (median of 0.218 compared to 0.134 and 0.156 for bond issuers and bank borrowers),
and have fewer analyst following the firm when compared to both bond issuers and bank
borrowers (median of 1 analyst versus 11 and 5 analysts for the two types of control firms). Case
firms also have lower median Tangibility although the difference is significant only vis-à-vis
bond issuers. Furthermore, firms borrowing from hedge funds are less liquid when compared to
bond issuers (median Amihud illiquidity measure of 0.105 versus 0.035). However, there are no
significant differences between the case firms and control firms for either R&D Intensity or
Capital Intensity, our last two proxies for asymmetric information. Taken together, these results
suggest that there is greater asymmetric information in firms borrowing from hedge funds.
Overall, the univariate results in Table 2 confirm the role of hedge funds as, primarily,
lenders of last resort to firms with lower profitability, lower credit quality, and greater
asymmetric information problems.
We next extend this analysis to a multivariate setting by examining the determinants of
the firm’s decision to borrow from a hedge fund. For this purpose, we estimate two separate
logistic regressions of the type of loan (hedge fund loan versus public debt, and hedge fund loan
versus bank loan) on firm’s characteristics. The second column of Table 3 presents the results
from the first logistic regression where the dependent variable takes a value of 1 if the lender is a
hedge fund and 0 if the firm issues a public bond. The coefficient on ROA is negative (−74.315)
and significant at the 1% level, which confirms our finding from the univariate analysis that
firms are more likely to borrow from hedge funds when they are not profitable.4 The positive and
4 We get similar results using the other two proxies for profitability: Cash Flow and Loss dummy. We do not include
multiple proxies of profitability, creditworthiness, and asymmetric information in the multivariate regression due to
multicollinearity concerns. Given our small sample, our final choices of proxies for each of these dimensions are

9
negative coefficients on Leverage and Z-Score (5.032 and −2.242 respectively) also indicate that
firms that are less creditworthy (i.e., more levered and lower Z-score) are more likely to borrow
from a hedge fund rather than issue public bonds. Finally, the negative coefficients on Size and
Tangibility suggest that asymmetric information is also a determinant of the financing choice.
Smaller firms (coefficient on logarithm of size being −0.725 and significant at the 1% level) with
fewer tangible assets (coefficient on tangibility being –7.095 and significant at the 5% level) are
likely to have greater asymmetric information concerns and these are the types of firms that use
hedge funds for financing purposes. In third column of Table 3, we use a different dependent
variable, which now takes a value of 1 if the lender is a hedge fund and 0 if the lender is a bank.
We find qualitatively similar results with each of the independent variables showing the same
signs for the slope coefficients as before. However, with the exception of ROA, Leverage, and
Tangibility, the coefficients for other variables are not significant, perhaps due to a significant
drop in the sample size (663 firm-years instead of 1,148 firm-years in the earlier case).
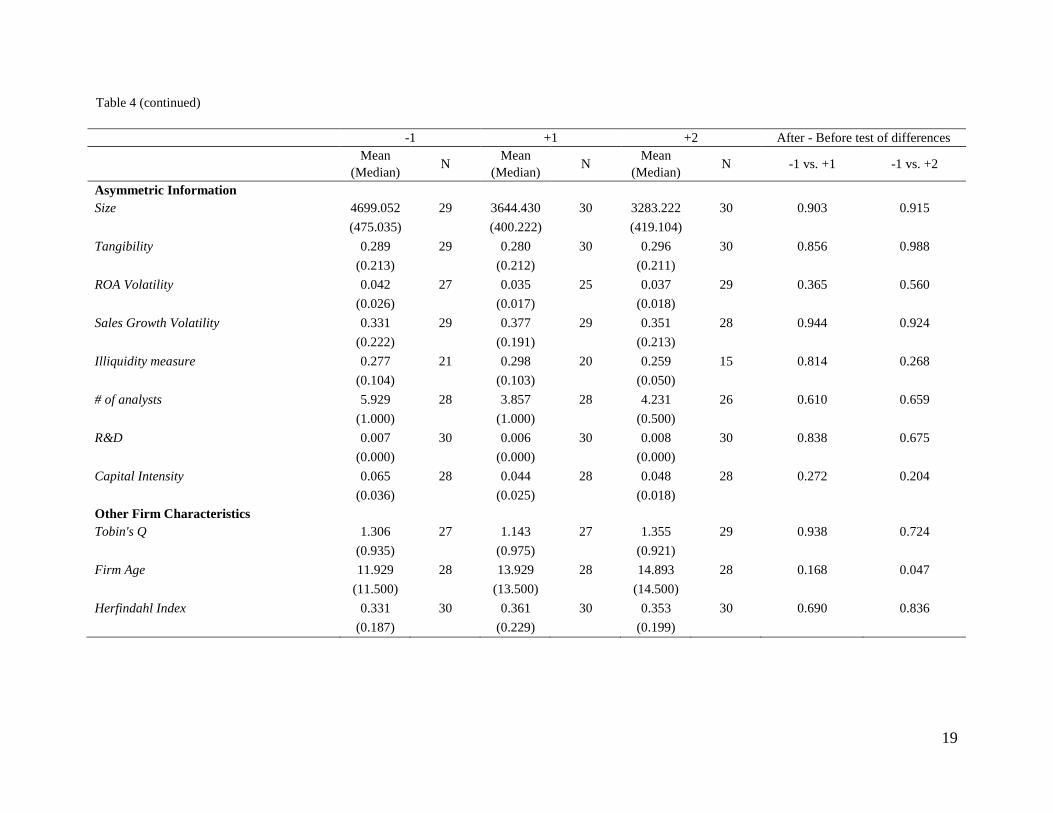
IV. Change in firm characteristics subsequent to borrowing from hedge funds
Next, we study the effect of hedge fund lending on the borrowing firms by examining the
changes in borrowers’ characteristics between one year prior to the loan to (a) one year after the
loan, and (b) two years after the loan. As a large majority of the hedge fund loans in our sample
have been over the last three years, examining long-term impact of hedge fund lending is not
feasible. For our analysis, we require the firms to survive for at least two years after the hedge
fund loan, and test the differences in their characteristics across time using a Wilcoxon test.5
Despite the small sample and short time period for which we conduct our analysis, Table 4
those that have the maximum number of observations. For robustness, we repeat the regression using alternative
proxies and find similar results. 5 In unreported tests, we compare the firm’s characteristics of the 30 firms that survive for at least two years after the
loan with those that do not (10 firms). We do not find any significant difference across the two samples.

10
shows that after the hedge fund loan there is an improvement in the borrowing firms’ ROA and
Distance-to-default for the firms that survive for two years. This suggests that borrowing from
hedge funds helps improve these firms’ profitability and creditworthiness.
V. Market reaction to firms borrowing from hedge funds
If the firms borrowing from hedge funds benefit in terms of profitability and
creditworthiness, a natural question to ask is whether there is a positive market reaction to hedge
funds lending to these firms. In this section, we address this question by examining the abnormal
returns of the case firms around the announcement date of the hedge fund loan. We use the Fama
and French (1993) three-factor model (which controls for size and book-to-market, in addition to
the market) for estimating the abnormal returns.6 To avoid confounding effects, we eliminate
firms that borrow money within three months before and after the hedge fund loan. Intuitively,
hedge funds can profit from lending if the borrower improves its profitability and
creditworthiness and is eventually able to pay back the loan. Thus, we expect borrower’s firm
value to increase after the loan. If this indeed is the case, we also expect investors to perceive the
news of a hedge fund loan as good news. Therefore, we expect to observe positive abnormal
returns for the borrower’s stock around the date of the loan (event date). Consistent with this
hypothesis, Table 5 shows that the mean (median) abnormal returns of 0.287 (0.147) three
months before the event, and 0.069 (0.054) ten days before the event, are positive and
significant. Figure 1 confirms the finding that the cumulative average abnormal returns (CAARs)
are positive before the event date.
6 We also include the Jegadeesh and Titman (1993) momentum factor for computing the abnormal returns and find
qualitatively similar results (not reported).

11
VI. Conclusion
In this paper, we study hedge funds that act as primary lenders. The main objective of our
analysis is to understand what type of firms turn to hedge funds for their external financing needs
and to analyze the effect of hedge fund intervention on the borrowers. We find that firms that
borrow from hedge funds are less profitable and less creditworthy than firms that either issue
public debt or request a bank loan. Additionally, hedge fund borrowers seem to have more
asymmetric information problems compared to control firms (those that issue bonds or borrow
from banks). The unique characteristics of firms borrowing from hedge funds seem to support
the idea that hedge funds are lenders of last resort.
Hedge funds can profit from this type of investment by improving the borrowers’ firm
value and profitability, which presumably enable these firms to pay back the loan. We find some
supporting evidence on the positive effect of hedge fund loans on the borrowers. We observe that
borrowers’ profitability and creditworthiness do improve one and two years after the loan.
Consistent with this beneficial aspect of hedge fund lending, we find a positive abnormal return
before the loan date, indicating that investors perceive the news of a hedge fund loan as good
news.
12
References
Agarwal, Vikas, Naveen D. Daniel, and Narayan Y. Naik, 2009, Role of Managerial Incentives and
Discretion in Hedge Fund Performance, Journal of Finance, 64, 2221-2256.
Agarwal, Vikas, Vyacheslav Fos, and Wei Jiang, 2010, Inferring reporting bias in hedge fund databases
from hedge fund equity holdings, Working Paper, Georgia State University and Columbia
University.
Altman, Edward I., 1977, The Z-Score Bankruptcy Model: Past, Present, and Future, Wiley, New York.
Amihud, Yakov, 2002, Illiquidity and stock returns: cross-section and time-series effects, Journal of
Financial Markets 5, 31-56.
Anderson, J., 2006, Hedge funds draw insider scrutiny, New York Times, October 16.
Berlin, Mitchell, and Jan Loeys, 1988, Bond covenants and delegated monitoring, Journal of Finance 43,
397-412.
Best, Ronald, and Hang Zhang, 1993, Alternative Information Sources and the Information Content of
Bank Loans, Journal of Finance 48, 1507-1522.
Brophy, D.J., P.P. Ouimet, and C. Sialm, 2009, Hedge Funds as Investors of Last Resort?, Review of
Financial Studies 22, 541-574.
Chemmanur, Thomas J., and Paolo Fulghieri, 1994, Reputation, Renegotiation, and the Choice between
Bank Loans and Publicly Traded Debt, Review of Financial Studies 7, 475-506.
Datta, Sudip, Mai Iskandar-Datta, and Ajay Patel, 1999, Bank monitoring and the pricing of corporate
public debt, Journal of Financial Economics 51, 435-449.
Diamond, Douglas W., 1991, Monitoring and Reputation: The Choice Between Bank Loans and Directly
Placed Debt, Journal of Political Economy 99, 689-721.
Fama, Eugene F., 1985, What's Different About Banks?, Journal of Monetary Economics 15, 29-39.
Fama, Eugene F., and Kenneth R. French, 1993, Common risk factors in the returns on stocks and bonds,
Journal of Financial Economics 33, 3-56.
Harner, Michelle M., 2008, The Corporate Governance and Public Policy Implications of Activist
Distressed Debt Investing, 77 Fordham Law Review 703.
Ivashina, Victoria, and Zheng Sun, 2007, Institutional Investors and Loan Market Information Spillover,
Working Paper, Harvard Business School.
Jegadeesh, Narasimhan, and Sheridan Titman, 1993, Returns to buying winners and selling losers:
Implications for stock market efficiency, Journal of Finance, 48, 65–91.
Krishnaswami, Sudha, Paul A. Spindt, and Venkat Subramaniam, 1999, Information asymmetry,
monitoring, and the placement structure of corporate debt, Journal of Financial Economics 51,
407-434.

13
Kyle, Albert S., 1985, Continuous auctions and insider trading, Econometrica 53, 1315-1335.
Rajan, Raghuram G., 1992, Insiders and Outsiders: The Choice between Informed and Arm’s- Length
Debt, Journal of Finance 47, 1367-1400.
Vassalou, Maria, and Yuhang Xing, 2004, Default risk in equity returns, Journal of Finance 59, 831-868.
14
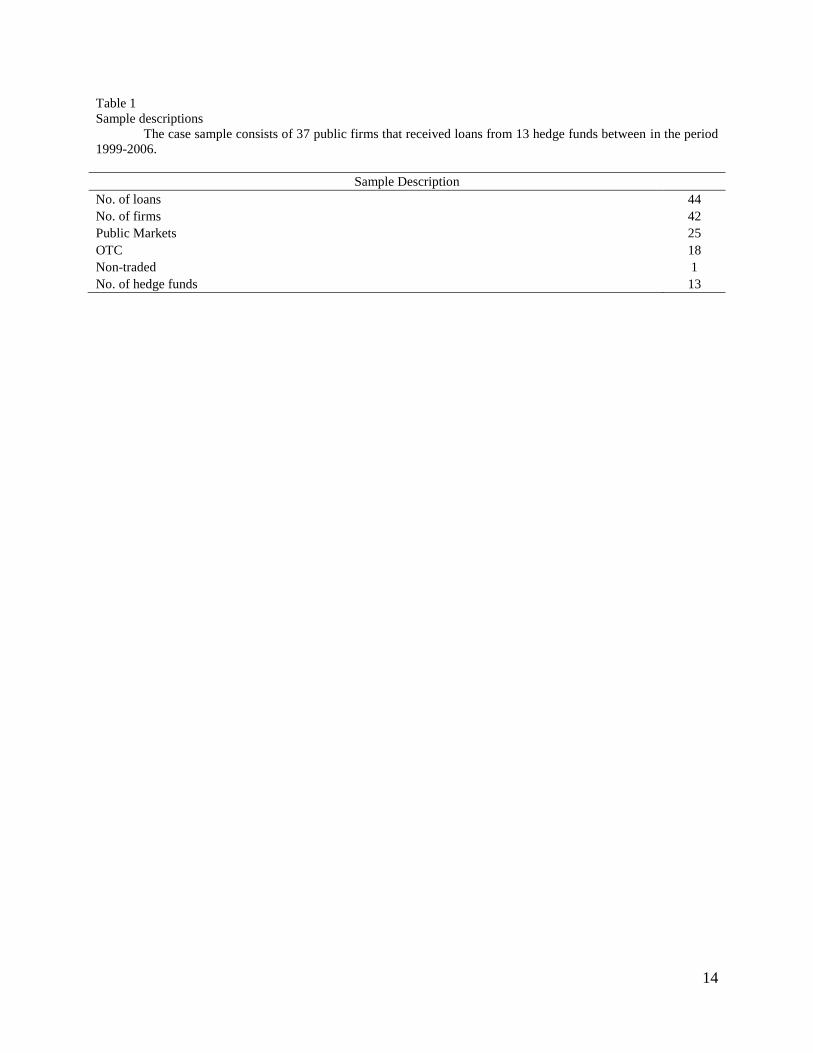
Table 1
Sample descriptions
The case sample consists of 37 public firms that received loans from 13 hedge funds between in the period
1999-2006.
Sample Description
No. of loans 44
No. of firms 42
Public Markets 25
OTC 18
Non-traded 1
No. of hedge funds 13

15
Table 2
Univariate statistics
The sample consists of firms that borrowed from a hedge fund or a bank, and of firms that issued bonds in the period 1999-2006. ROA is operating
income divided by total assets. Cash flow is income before extraordinary items plus depreciation divided by total assets. Loss is a dummy variable that equals 1 if
the operating income is negative, 0 otherwise. Leverage is book value of LT debt and debt in current liabilities divided by the sum of book value of debt and
market value of common equity. Interest Coverage is operating income divided by interest expense. Z-Score is defined as in Altman (1977): (1.2*Working
capital + 1.4*Retained earnings + 3.3*Operating income before interest + Sales) / Total assets. Distance-to-default is defined as in Vassalou (2004). Size is firm’s
total assets (in $m.). Tangibility is net property, plant, and equipment divided by total assets. ROA Volatility is standard deviation of operating income divided by
total assets over the previous 23 years. Sales growth volatility is standard deviation of sales growth over the previous 23 years. Illiquidity Measure is defined as
in Amihud (2002) as the annual average if the square root of the absolute value of stock return divided by price times volume. R&D Intensity is R&D
expenditures divided by total assets. Capital intensity is capital expenditures divided by total assets. Tobin’s Q is book value of assets minus book value of
common equity plus market value of common equity divided by book value of assets. Firm age is the number of years the firm has been in the Compustat
database. Herfindahl Index is the sales-based Herfindahl index of the firm’s industry. The table reports means (medians). The last two columns report the p-
values from Wilcoxon test of the difference across samples. All variables are winsorized at the 1st and 99
th percentiles.
Hedge fund
borrowers Bond issuers Bank borrowers Hedge fund borrowers
VS bond issuers
Hedge fund borrowers
VS bank borrowers
Mean N
Mean N
Mean N
(Median)
(Median)
(Median)
Profitability
ROA -0.012 35
0.030 2,194
0.030 1,266
0.000 0.000
(0.003)
(0.028)
(0.031)
Cash flow -0.140 39
0.071 1,708
0.061 1,225
0.000 0.000
(-0.037)
(0.070)
(0.077)
Loss 0.537 41
0.145 2,546
0.214 1,489
0.000 0.000
(1.000)
(0.000)
(0.000)
Creditworthiness
Leverage 0.435 35
0.411 1,766
0.281 1,184
0.946 0.025
(0.374)
(0.389)
(0.220)
Interest Coverage 13.921 38
7.466 2,305
20.165 1,277
0.000 0.000
(0.486)
(3.767)
(4.537)
Z-Score -1.084 35
0.511 1,579
0.615 1,171
0.000 0.000
(-0.286)
(0.434)
(0.764)
Continued

16
Table 2 (continued)
Hedge fund
borrowers Bond issuers Bank borrowers Hedge fund borrowers
VS bond issuers
Hedge fund borrowers
VS bank borrowers
Mean N
Mean N
Mean N
(Median)
(Median)
(Median)
Distance-to-default 1.750 25
2.984 1,486
2.457 982
0.000 0.003
(1.467)
(2.715)
(2.247)
Asymmetric Information
Size 3,614.96 39
16,759.99 2,498
6,059.73 1,445
0.000 0.001
(348.927)
(5,695.594)
(1,040.500)
Tangibility 0.271 39
0.372 2,251
0.317 1382
0.087 0.283
(0.213)
(0.340)
(0.253)
ROA Volatility 0.048 35
0.014 2,166
0.033 1,236
0.000 0.000
(0.027)
(0.009)
(0.014)
Sales Growth Volatility 0.331 40
0.228 2,498
0.303 1,444
0.000 0.015
(0.218)
(0.134)
(0.156)
# of analysts 5.105 38
12.551 1,910
8.374 1,276
0.000 0.016
(1.000)
(11.000)
(5.000)
Illiquidity measure 0.446 26
0.075 1,494
0.267 1,069
0.000 0.393
(0.105)
(0.035)
(0.091)
R&D Intensity 0.005 41
0.002 2,546
0.006 1,489
0.112 0.480
(0.000)
(0.000)
(0.000)
Capital Intensity 0.061 39
0.059 1,815
0.059 1,244
0.820 0.806
(0.035)
(0.043)
(0.041)
Other Firm Characteristics
Tobin's Q 1.373 35
1.230 1,766
1.572 1,184
0.571 0.067
(0.935)
(0.983)
(1.077)
Firm Age 10.744 39
13.279 1,949
11.610 1,301
0.003 0.286
(10.000)
(15.000)
(13.000)
Herfindahl Index 0.356 41
0.243 2,546
0.283 1,488
0.001 0.066
(0.298)
(0.144)
(0.191)

17
Table 3
Logit regression on the probability of borrowing from hedge funds
The sample consists of firms that borrowed from a hedge fund or a bank, and of firms that issued bonds in
the period 2001-2005. ROA is operating income divided by total assets. Leverage is book value of LT debt and debt
in current liabilities divided by the sum of book value of debt and market value of common equity. Interest coverage
is operating income divided by interest expense. Z-Score is defined as in Altman (1977): (1.2*Working capital +
1.4*Retained earnings + 3.3*Operating income before interest + Sales) / Total assets. Size is firm’s total assets (in
$m.). Tangibility is net property, plant, and equipment divided by total assets. ROA Volatility is standard deviation
of operating income divided by total assets over the previous 23 years. R&D Intensity is R&D expenditures divided
by total assets. Capital Intensity is capital expenditures divided by total assets. Tobin’s Q is book value of assets
minus book value of common equity plus market value of common equity divided by book value of assets. Firm age
is the number of years the firm has been in the Compustat database. Standard errors are robust and clustered by firm.
Year and industry dummies are included. All variables are winsorized at the 1st and 99
th percentile. T-statistics are in
parentheses. The symbols ***, **, and * denote significance at the 1%, 5%, and 10% level respectively.
Hedge fund borrowers VS bond issuers Hedge fund borrowers VS bank borrowers
Intercept -13.684*** -18.284***
(-7.286) (-7.333)
Profitability
ROA -74.315*** -19.228***
(-4.512) (-2.860)
Creditworthiness
Leverage 5.032** 2.723**
(2.415) (2.324)
Interest Coverage 0.054*** 0.005
(5.455) (1.370)
Z-Score -2.242*** -0.194
(-3.213) (-1.360)
Asymmetric Information
Ln(Size) -0.725*** -0.170
(-2.884) (-1.306)
Tangibility -7.095** -3.601**
(-2.339) (-2.257)
ROA Volatility 17.460 -0.942*
(1.152) (-1.759)
R&D Intensity -155.805*** -35.732
(-3.844) (-1.204)
Capital Intensity 10.355 6.776
(1.375) (1.394)
Other firm characteristics
Tobin's Q -1.420* -0.077
(-1.747) (-0.350)
Firm Age -0.168* -0.066
(-1.759) (-1.152)
N 1,148 663

18
Table 4
Univariate statistics before and after the hedge fund loan
The sample consists of firms that borrowed from a hedge fund in the period 1999-2006. ROA is operating income divided by total assets. Cash flow is
income before extraordinary items plus depreciation divided by total assets. Loss is a dummy variable that equals 1 if the operating income is negative, 0
otherwise. Leverage is book value of LT debt and debt in current liabilities divided by the sum of book value of debt and market value of common equity.
Interest Coverage is operating income divided by interest expense. Z-Score is defined as in Altman (1977): (1.2*Working capital + 1.4*Retained earnings +
3.3*Operating income before interest + Sales) / Total assets. Distance-to-default is defined as in Vassalou (2004). Size is firm’s total assets (in $m.). Tangibility
is net property, plant, and equipment divided by total assets. ROA Volatility is standard deviation of operating income divided by total assets over the previous 23
years. Sales growth volatility is standard deviation of sales growth over the previous 23 years. Illiquidity Measure is defined as in Amihud (2002) as the annual
average if the square root of the absolute value of stock return divided by price times volume. R&D Intensity is R&D expenditures divided by total assets.
Capital intensity is capital expenditures divided by total assets. Tobin’s Q is book value of assets minus book value of common equity plus market value of
common equity divided by book value of assets. Firm age is the number of years the firm has been in the Compustat database. Herfindahl Index is the sales-
based Herfindahl index of the firm’s industry. The table reports means (medians) of firm characteristics in different time periods and p-values from a Wilcoxon
test of the difference across samples. All variables are winsorized at the 1st and 99
th percentile.
-1 +1 +2 After - Before test of differences
Mean
N Mean
N Mean
N -1 vs. +1 -1 vs. +2
(Median) (Median) (Median)
Profitability
ROA -0.008 27 0.014 25 -0.002 29 0.083 0.222
(0.004)
(0.021)
(0.014)
Cash Flow -0.064 28 -0.154 28 -0.024 28 0.718 0.451
(-0.025)
(0.015)
(0.001)
Loss 0.467 30 0.400 30 0.300 30 0.605 0.188
(0.000)
(0.000)
(0.000)
Creditworthiness
Leverage 0.432 27 0.465 27 0.441 29 0.574 0.941
(0.331)
(0.400)
(0.429)
Interest Coverage 18.026 29 4.485 28 16.076 29 0.530 0.312
(0.651)
(1.159)
(1.204)
Z-Score -1.003 26 -0.854 26 -2.691 29 0.546 0.973
(-0.460)
(-0.127)
(-0.217)
Distance-to-default 1.718 20 2.183 19 2.661 14 0.077 0.042
(1.585)
(1.966)
(2.309)
Continued
19
Table 4 (continued)
-1 +1 +2 After - Before test of differences
Mean
N Mean
N Mean
N -1 vs. +1 -1 vs. +2
(Median) (Median) (Median)
Asymmetric Information
Size 4699.052 29 3644.430 30 3283.222 30 0.903 0.915
(475.035)
(400.222)
(419.104)
Tangibility 0.289 29 0.280 30 0.296 30 0.856 0.988
(0.213)
(0.212)
(0.211)
ROA Volatility 0.042 27 0.035 25 0.037 29 0.365 0.560
(0.026)
(0.017)
(0.018)
Sales Growth Volatility 0.331 29 0.377 29 0.351 28 0.944 0.924
(0.222)
(0.191)
(0.213)
Illiquidity measure 0.277 21 0.298 20 0.259 15 0.814 0.268
(0.104)
(0.103)
(0.050)
# of analysts 5.929 28 3.857 28 4.231 26 0.610 0.659
(1.000)
(1.000)
(0.500)
R&D 0.007 30 0.006 30 0.008 30 0.838 0.675
(0.000)
(0.000)
(0.000)
Capital Intensity 0.065 28 0.044 28 0.048 28 0.272 0.204
(0.036)
(0.025)
(0.018)
Other Firm Characteristics
Tobin's Q 1.306 27 1.143 27 1.355 29 0.938 0.724
(0.935)
(0.975)
(0.921)
Firm Age 11.929 28 13.929 28 14.893 28 0.168 0.047
(11.500)
(13.500)
(14.500)
Herfindahl Index 0.331 30 0.361 30 0.353 30 0.690 0.836
(0.187)
(0.229)
(0.199)

20
Table 5
Cumulative average abnormal returns for hedge fund borrowers around the loan date
The case sample consists of public firms that received loans from hedge funds between June 2002 and July
2006. The table presents the mean (median) cumulative abnormal return over different windows around the date of
the hedge fund loan. Abnormal returns are calculated using a Fama and French (1993) model. *, **, *** denote
statistical significance at 10%, 5%, and 1% respectively using a one-tailed test.
Days N Mean (Median) Generalized Rank Test Signed
CAR Sign Z Z Rank
(-90,0) 24 0.287 1.861** 0.480 44.000
(0.147)
(-60,0) 24 0.193 0.635 0.443 33.000
(0.075)
(-30,0) 24 0.064 0.635 0.869 26.000
(0.029)
(-20,0) 24 0.137 0.635 1.488* 38.000
(0.038)
(-10,0) 24 0.069 1.861** 1.497* 65.000**
(0.054)
(0,+10) 24 -0.011 0.226 -0.807 -17.000
(-0.018)
(0,+20) 24 -0.006 0.635 -0.291 -6.000
(0.007)
(0,+30) 25 0.010 0.431 0.122 3.500
(0.007)
(0,+60) 25 -0.012 1.232 -0.463 4.500
(0.030)
(0,+90) 25 0.027 0.431 -0.055 16.500
(0.015)

21
Figure I
Cumulative Average Abnormal Returns around the loan announcement date for the hedge fund borrowers’ stocks in
the window (-90, +90) days. Abnormal returns are estimated with the three-factor Fama and French model (1993).
-10%
-5%
0%
5%
10%
15%
20%
25%
30%
35%
-90 -75 -60 -45 -30 -15 0 15 30 45 60 75 90
CA
AR
s
Days
Cumulative Average Abnormal Returns
Fama-French Model