Embed Size (px)
Citation preview
This PDF is a selection from an out-of-print volume from the National Bureauof Economic Research
Volume Title: International Capital Flows
Volume Author/Editor: Martin Feldstein, editor
Volume Publisher: University of Chicago Press
Volume ISBN: 0-226-24103-3
Volume URL: http://www.nber.org/books/feld99-2
Publication Date: January 1999
Chapter Title: The Role of Equity Markets in International Capital Flows
Chapter Author: Linda L. Tesar, Rene M. Stulz, Stephen Friedman, GeorgeN. Hatsopoulos
Chapter URL: http://www.nber.org/chapters/c9800
Chapter pages in book: (p. 235 - 306)
5 The Role of Equity Markets in International Capital Flows
1. Linda L. Tesar 2. Rene' M. Stulz 3. Stephen Friedman 4. George N. Hatsopoulos
1. Linda L8 Tesar The Role of Equity in International Capital Flows
5.1.1 Introduction
In 1980 the United States dominated the world's financial markets, account- ing for more than 50 percent of the capitalized value of the world stock market. Only a small fraction of the U.S. equity portfolio was invested in foreign mar- kets; estimates of the foreign equity holdings of U.S. investors suggest that roughly 98 percent of the total equity portfolio was invested at home (Tesar and Werner 1995). To the extent that U.S. investors ventured into foreign mar- kets, they did so primarily to the familiar markets of Europe and Canada. Al- though most of the legal barriers to cross-border trading in foreign securities were dismantled with the abandonment of fixed exchange rates, the practical costs of transacting in foreign capital markets remained prohibitive.
Rolling the clock forward seventeen years, the world has indeed become a different place. Fueled by the privatization of state-owned enterprises in Eu- rope, Latin America, and Asia and the liberalization and expansion of markets in developing countries, cross-border equity investment has become an impor- tant channel for international diversification among industrialized countries and a conduit for capital flows from industrialized to developing countries. In 1994, global investment in the equity of firms in developing countries reached $26 billion, accounting for nearly 20 percent of equity inflows worldwide (IMF 1996). One in four equity transactions in the United States now involves for-
235
236 Linda L. Tesar
eign equity or a foreign buyer or seller, and roughly 12 percent of the U.S. portfolio is held in foreign stocks.
This paper reviews recent developments in the globalization of equity mar- kets. Section 5. l .2 begins by presenting some evidence on the growth in equity markets and the factors that help account for recent trends in cross-border eq- uity investment.’ On the supply side of global capital markets, the benefits of global diversification provide a significant incentive for investing across na- tional borders. In addition, there has been a general shift in the allocation of savings from traditional bank deposits toward investment in equity through mutual and pension funds. These institutionally managed funds have increas- ingly turned to international markets as a source of higher returns. On the de- mand side, the capital needs of developing countries and countries making the transition from centrally planned to more market-based economic systems have brought a large number of firms to the global equity market as a means of raising capital. The barriers between savers residing in one nation and firms demanding capital located in another nation have been declining over time as communications technology improves and the process of eliminating of capital controls continues.
Section 5.1.3 takes a closer look at the volume and direction of cross-border equity flows in light of the recent growth in equity markets. Data on net equity flows suggest that there has been an increase in the net flow of equity invest- ment from industrialized to developing countries. However, 80 to 90 percent of global equity investment originates and is invested in the developed markets of Europe, the United States, Canada, and Japan. From the perspective of in- vestors in industrialized countries, the majority of their portfolios are held in domestic equity, although the degree of home bias is eroding over time. Be- tween 1980 and 1996, the share of the U.S. equity portfolio invested in foreign stocks increased from 2 to 12 percent, though it still remains far from the “opti- mal” portfolio allocation suggested by basic portfolio theory.
Section 5.1.4 turns to the behavior of U.S. investors in foreign equity mar- kets. Concerns have been raised about the risk of equity flows as a source of long-term external finance. Analysis of the determinants of U.S. portfolio allo- cation suggests that U.S. investors are primarily driven by signals about the local economy, increasing their portfolio holdings in markets when expected returns in that market are high. Global factors, such as swings in world interest rates, are not found to be significant in the allocation of the U.S. equity portfo- lio. This evidence suggests that equity inflows can be a reliable source of capi- tal as long as local market conditions are consistent with long-run growth and stability.
1. Throughout, the term “equity investment” will refer to portfolio equity investment. For a discussion of the issues related to foreign direct investment, see chapters 6.1 by Robert Lipsey and 6.2 by Robert Feenstra in this volume.
237 The Role of Equity Markets in International Capital Flows
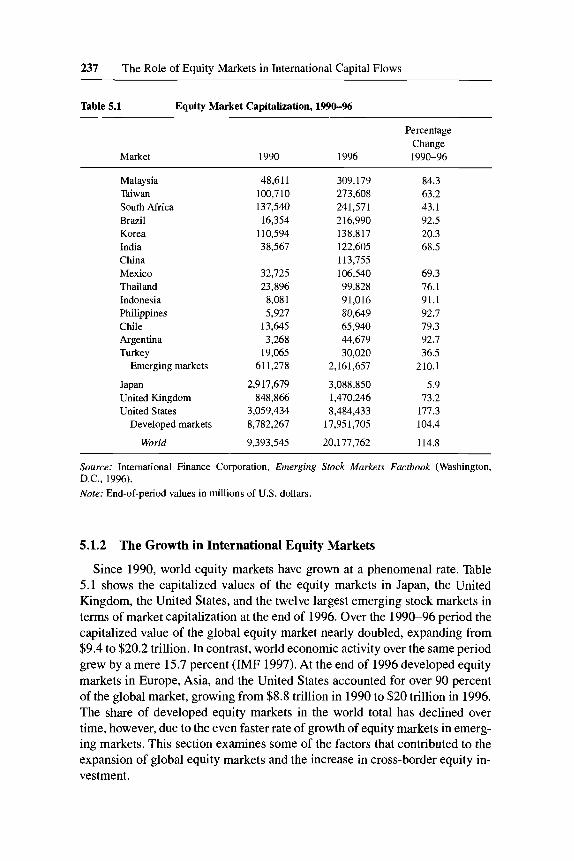
Table 5.1 Equity Market Capitalization, 1990-96 ~
Market
Percentage Change
1990 1996 1990-96
Malaysia Taiwan South Africa Brazil Korea India China Mexico Thailand Indonesia Philippines Chile Argentina Turkey
Japan United Kingdom United States
Emerging markets
Developed markets
World
48,611 100,710 137,540
16,354 110,594 38.567
32,725 23,896 8,081 5,927
13,645 3,268
19,065 611,278
2,917,679 848,866
3,059,434 8,782,267
9,393,545
309,179 273,608 241,571 216,990 138,817 122,605 113,755 106,540 99,828 91,016 80,649 65,940 44,679 30,020
2,161,657
3,088,850 1,470,246 8,484,433
17,95 1,705
20,177,762
84.3 63.2 43.1 92.5 20.3 68.5
69.3 76.1 91.1 92.7 79.3 92.7 36.5
210.1
5.9 73.2
177.3 104.4
114.8
Source: International Finance Corporation, Emerging Stock Markets Factbook (Washington, D.C., 1996). Note: End-of-period values in millions of U.S. dollars.
5.1.2 The Growth in International Equity Markets
Since 1990, world equity markets have grown at a phenomenal rate. Table 5.1 shows the capitalized values of the equity markets in Japan, the United Kingdom, the United States, and the twelve largest emerging stock markets in terms of market capitalization at the end of 1996. Over the 1990-96 period the capitalized value of the global equity market nearly doubled, expanding from $9.4 to $20.2 trillion. In contrast, world economic activity over the same period grew by a mere 15.7 percent (IMF 1997). At the end of 1996 developed equity markets in Europe, Asia, and the United States accounted for over 90 percent of the global market, growing from $8.8 trillion in 1990 to $20 trillion in 1996. The share of developed equity markets in the world total has declined over time, however, due to the even faster rate of growth of equity markets in emerg- ing markets. This section examines some of the factors that contributed to the expansion of global equity markets and the increase in cross-border equity in- vestment.
238 Linda L. Tesar
0 0165
0 016
I 0 0155
100% World
9
0 0125
0 012
0035 0037 0039 0041 0043 0045 0047 0049 0051 0053 0055
Standard Deviation (Risk)
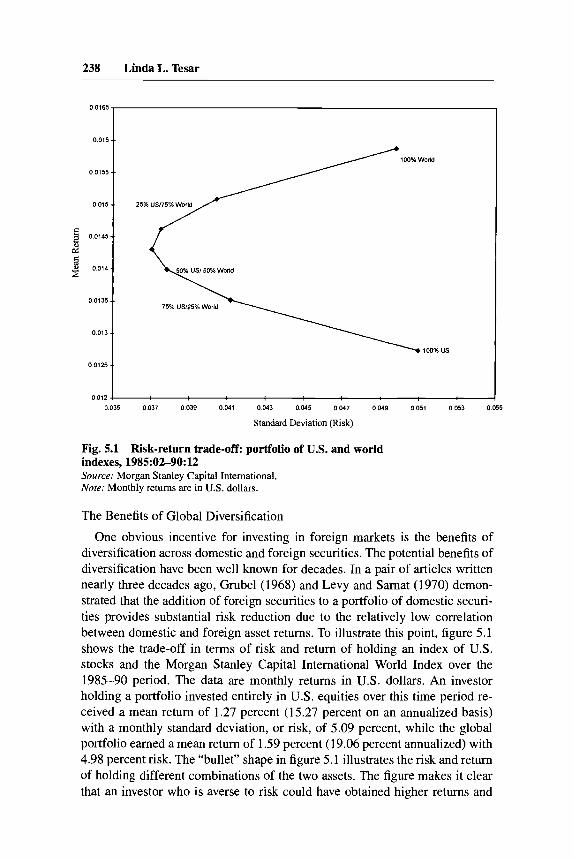
Fig. 5.1 Risk-return trade-off portfolio of U.S. and world indexes, 1985:02-90:12 Source: Morgan Stanley Capital International. Nore: Monthly returns are in U.S. dollars.
The Benefits of Global Diversification
One obvious incentive for investing in foreign markets is the benefits of diversification across domestic and foreign securities. The potential benefits of diversification have been well known for decades. In a pair of articles written nearly three decades ago, Grubel (1968) and Levy and Samat (1970) demon- strated that the addition of foreign securities to a portfolio of domestic securi- ties provides substantial risk reduction due to the relatively low correlation between domestic and foreign asset returns. To illustrate this point, figure 5.1 shows the trade-off in terms of risk and return of holding an index of U.S. stocks and the Morgan Stanley Capital International World Index over the 1985-90 period. The data are monthly returns in U.S. dollars. An investor holding a portfolio invested entirely in U.S. equities over this time period re- ceived a mean return of 1.27 percent (15.27 percent on an annualized basis) with a monthly standard deviation, or risk, of 5.09 percent, while the global portfolio earned a mean return of 1.59 percent (19.06 percent annualized) with 4.98 percent risk. The “bullet” shape in figure 5.1 illustrates the risk and return of holding different combinations of the two assets. The figure makes it clear that an investor who is averse to risk could have obtained higher returns and
239 The Role of Equity Markets in International Capital Flows
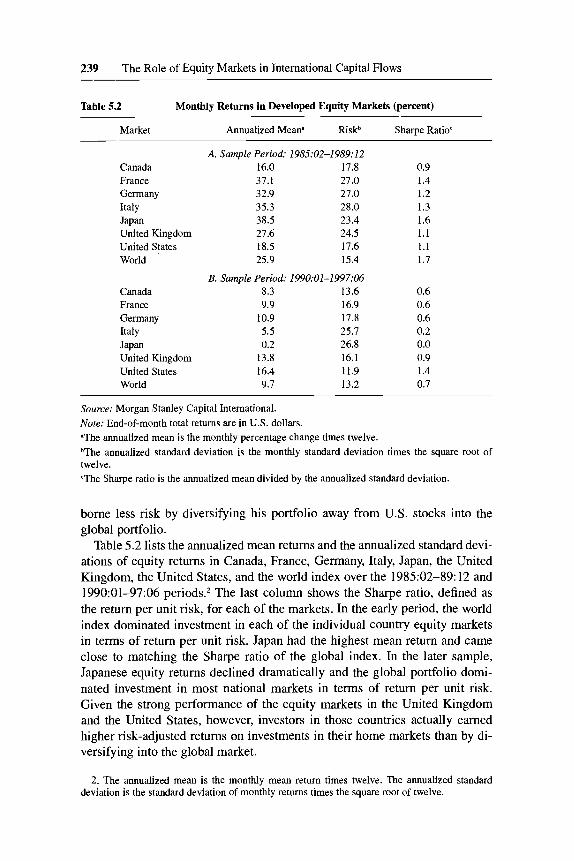
Table 5.2 Monthly Returns in Developed Equity Markets (percent)
Market Annualized Mean" Riskb Sharpe Ratio"
A. Sample Period: 1985:02-1989:12 Canada 16.0 17.8 0.9 France 37.1 27.0 1.4 Germany 32.9 21.0 1.2 Italy 35.3 28.0 1.3 Japan 38.5 23.4 1.6 United Kingdom 21.6 24.5 1.1 United States 18.5 17.6 1.1 World 25.9 15.4 1.7
Canada France Germany Italy Japan United Kingdom United States World
B. Sample Period: 199O:Ol-1997:06 8.3 13.6 9.9 16.9
10.9 17.8 5.5 25.1 0.2 26.8
13.8 16.1 16.4 11.9 9.1 13.2
0.6 0.6 0.6 0.2 0.0 0.9 1.4 0.7
Source: Morgan Stanley Capital International. Note: End-of-month total returns are in U.S. dollars. "The annualized mean is the monthly percentage change times twelve. bThe annualized standard deviation is the monthly standard deviation times the square root of twelve. T h e Sharpe ratio is the annualized mean divided by the annualized standard deviation.
borne less risk by diversifying his portfolio away from U.S. stocks into the global portfolio.
Table 5.2 lists the annualized mean returns and the annualized standard devi- ations of equity returns in Canada, France, Germany, Italy, Japan, the United Kingdom, the United States, and the world index over the 1985:02-89:12 and 199O:Ol-97:06 periods.2 The last column shows the Sharpe ratio, defined as the return per unit risk, for each of the markets. In the early period, the world index dominated investment in each of the individual country equity markets in terms of return per unit risk. Japan had the highest mean return and came close to matching the Sharpe ratio of the global index. In the later sample, Japanese equity returns declined dramatically and the global portfolio domi- nated investment in most national markets in terms of return per unit risk. Given the strong performance of the equity markets in the United Kingdom and the United States, however, investors in those countries actually earned higher risk-adjusted returns on investments in their home markets than by di- versifying into the global market.
2. The annualized mean is the monthly mean return times twelve. The annualized standard deviation is the standard deviation of monthly returns times the square root of twelve.
240 Linda L. Tesar
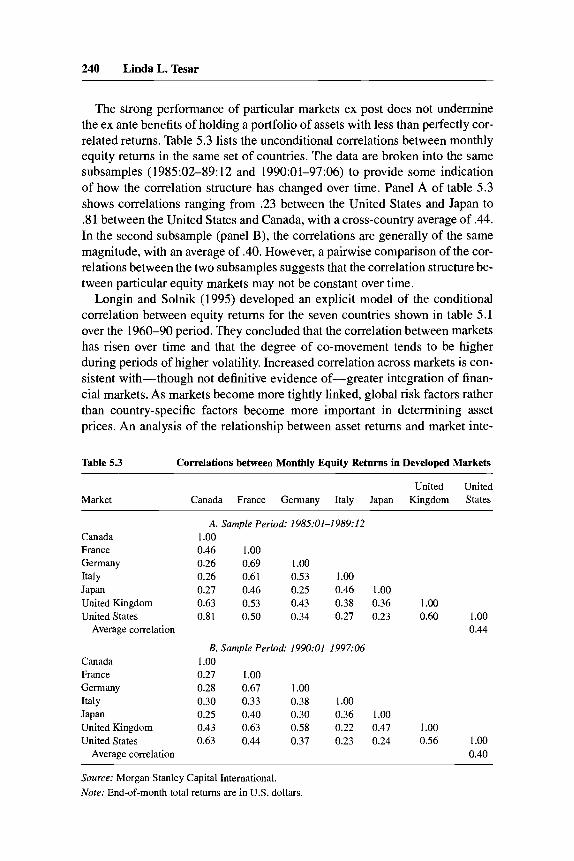
The strong performance of particular markets ex post does not undermine the ex ante benefits of holding a portfolio of assets with less than perfectly cor- related returns. Table 5.3 lists the unconditional correlations between monthly equity returns in the same set of countries. The data are broken into the same subsamples (198502-89:12 and 199O:Ol-97:06) to provide some indication of how the correlation structure has changed over time. Panel A of table 5.3 shows correlations ranging from .23 between the United States and Japan to .8 1 between the United States and Canada, with a cross-country average of .44. In the second subsample (panel B), the correlations are generally of the same magnitude, with an average of .40. However, a painvise comparison of the cor- relations between the two subsamples suggests that the correlation structure be- tween particular equity markets may not be constant over time.
Longin and Solnik (1995) developed an explicit model of the conditional correlation between equity returns for the seven countries shown in table 5.1 over the 1960-90 period. They concluded that the correlation between markets has risen over time and that the degree of co-movement tends to be higher during periods of higher volatility. Increased correlation across markets is con- sistent with-though not definitive evidence of-greater integration of finan- cial markets. As markets become more tightly linked, global risk factors rather than country-specific factors become more important in determining asset prices. An analysis of the relationship between asset returns and market inte-
Table 5.3 Correlations between Monthly Equity Returns in Developed Markets
United United Market Canada France Germany Italy Japan Kingdom States
Canada France Germany Italy Japan United Kingdom United States
Average correlation
Canada France Germany Italy Japan United Kingdom United States
Average correlation
A. Sample Period: 1985:Ol-1989:12 1 .oo 0.46 1.00 0.26 0.69 1 .oo 0.26 0.61 0.53 1.00 0.27 0.46 0.25 0.46 1.00 0.63 0.53 0.43 0.38 0.36 1.00 0.81 0.50 0.34 0.27 0.23 0.60 1.00
0.44
B. Sample Period: 1990t01-1997:06 1 .oo 0.27 1.00 0.28 0.67 1.00 0.30 0.33 0.38 1.00 0.25 0.40 0.30 0.36 1.00 0.43 0.63 0.58 0.22 0.47 1.00 0.63 0.44 0.37 0.23 0.24 0.56 1 .OO
0.40 ~ ~~ ~
Source: Morgan Stanley Capital International. Note: End-of-month total returns are in U.S. dollars.
241 The Role of Equity Markets in International Capital Flows
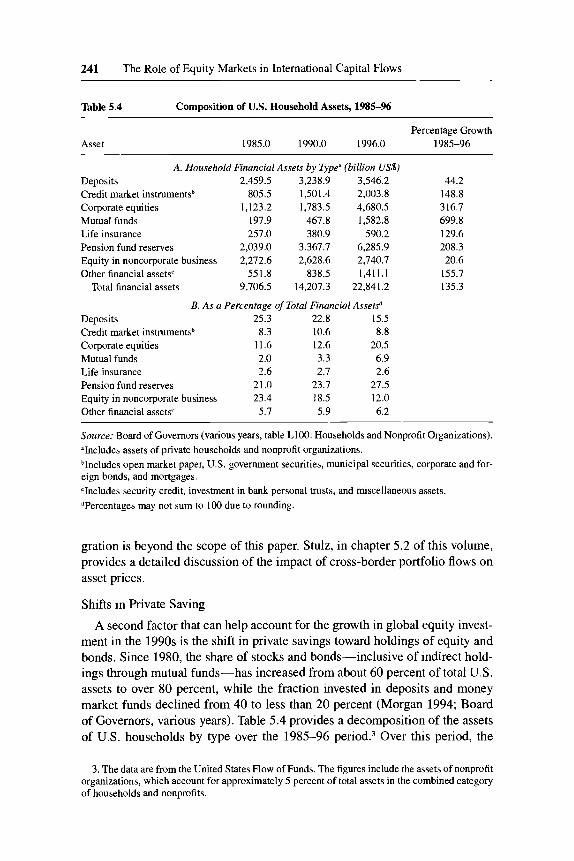
Table 5.4 Composition of U.S. Household Assets, 1985-96
Asset Percentage Growth
1985.0 1990.0 1996.0 1985-96
A. Household Financial Assets by Type" (billion US$) Deposits 2,459.5 3,238.9 3,546.2 Credit market instrumentsb 805.5 1,501.4 2,003.8 Corporate equities 1,123.2 1,783.5 4,680.5 Mutual funds 197.9 467.8 1,582.8 Life insurance 257.0 380.9 590.2 Pension fund reserves 2,039.0 3,367.7 6,285.9 Equity in noncorporate business 2,272.6 2,628.6 2,740.7 Other financial assetsc 55 1.8 838.5 1,411.1
Total financial assets 9,706.5 14,207.3 22,841.2
B. As a Percentage of Total Financial Asset? Deposits 25.3 22.8 15.5 Credit market instrumentsb 8.3 10.6 8.8 Corporate equities 11.6 12.6 20.5 Mutual funds 2.0 3.3 6.9 Life insurance 2.6 2.7 2.6 Pension fund reserves 21.0 23.7 27.5
Other financial assets' 5.7 5.9 6.2 Equity in noncorporate business 23.4 18.5 12.0
44.2 148.8 316.7 699.8 129.6 208.3 20.6
155.7 135.3
Source: Board of Governors (various years, table L100: Households and Nonprofit Organizations). "Includes assets of private households and nonprofit organizations. bIncludes open market paper, U.S. government securities, municipal securities, corporate and for- eign bonds, and mortgages. 'Includes security credit, investment in bank personal trusts, and miscellaneous assets. dPercentages may not sum to 100 due to rounding.
gration is beyond the scope of this paper. Stulz, in chapter 5.2 of this volume, provides a detailed discussion of the impact of cross-border portfolio flows on asset prices.
Shifts in Private Saving
A second factor that can help account for the growth in global equity invest- ment in the 1990s is the shift in private savings toward holdings of equity and bonds. Since 1980, the share of stocks and bonds-inclusive of indirect hold- ings through mutual funds-has increased from about 60 percent of total U.S. assets to over 80 percent, while the fraction invested in deposits and money market funds declined from 40 to less than 20 percent (Morgan 1994; Board of Governors, various years). Table 5.4 provides a decomposition of the assets of U.S. households by type over the 1985-96 p e r i ~ d . ~ Over this period, the
3. The data are from the United States Flow of Funds. The figures include the assets of nonprofit organizations, which account for approximately 5 percent of total assets in the combined category of households and nonprofits.
242 Linda L. Tesar
fraction of total household assets accounted for by mutual fund investment grew from 2 to 7 percent, investment in corporate equities from 12 to 20 per- cent, and pension fund reserves from 21 to 28 percent.
Economists offer two explanations for the shift away from traditional bank- ing deposits and money market funds toward other financial assets. First, low interest rates in 1990 and 1991 made these assets less attractive than stocks and bonds. Second, there is evidence that household investment in stocks and bonds is strongly correlated with the demographic structure of the US. popula- tion (Morgan 1994). It appears that investors of the baby boomer cohort are willing to exchange risk for return as a means of augmenting their savings for retirement. In a recent study, Heaton and Lucas (1997) found that even inves- tors of retirement age have increased their holdings of stocks and bonds. They argued that such a shift is consistent with risk reduction because investors are substituting from private business ownership to a more diversified portfolio of stocks.
The shift in saving toward equity investment, particularly through pension and mutual funds, plays an important role in the increase in aggregate U.S. holdings of foreign equity. Competition among funds for the growing pool of savings has pressured fund managers to develop new products with better perfor- mance. In addition, by pooling large sums of money, fund managers are able to expand into new markets with lower transaction costs than were possible through individual stockholder investment. According to industry reports, over 10 percent of the net assets of mutual funds in 1996 was allocated to “intema- tional equity” (non-U.S.) and “global equity” (U.S. plus non-U.S.) funds (In- vestment Company Institute 1997). Although the evidence presented here has focused on the United States, there is some evidence that an aging workforce and concerns over the viability of public pension plans are having a similar impact on the allocation of saving in Europe (Economist, 29 March 1997). It should be noted that this shift toward equity investment does not imply that the total volume of saving has risen, but only that the composition of saving has shifted toward equity and bonds, which has in turn induced professional money managers to turn to foreign markets.
Raising Capital on Global Markets
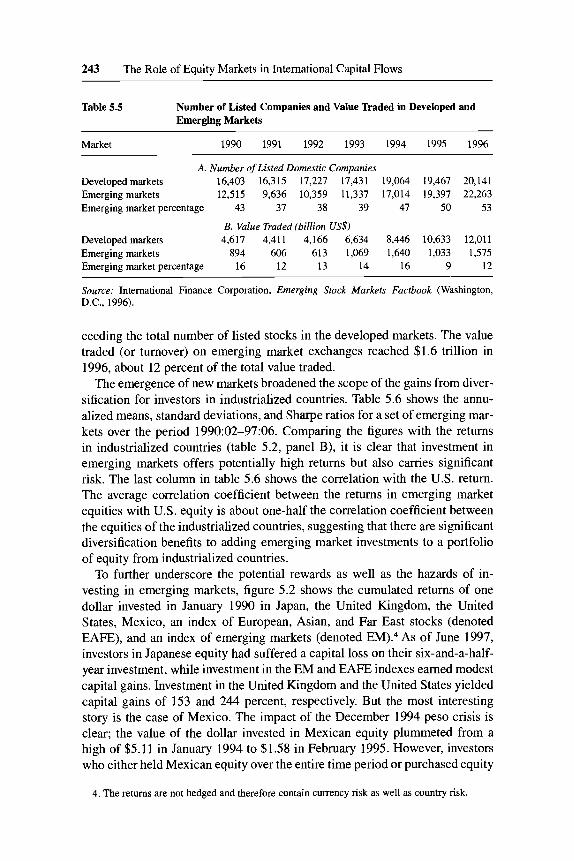
Demographic shifts and potential gains from diversification help explain the increase in the supply of capital to global equity markets. On the demand side, the liberalization of markets and the privatization of state-owned enterprises in developing and transitional economies brought a growing number of firms to the global equity market as a means of raising capital. Table 5.5 shows the number of listed companies and the value of trading on equity markets in emerging and developed countries over the 1990-96 period. The growth in the number of listed stocks (panel A) reflects the remarkable rate of market reform in developing and transitional economies during this period. By 1996, the number of listed securities in developing countries had reached 22,263, ex-
243 The Role of Equity Markets in International Capital Flows
Table 5.5 Number of Listed Companies and Value Traded in Developed and Emerging Markets
Market 1990 1991 1992 1993 1994 1995 1996
A. Number of Listed Domestic Companies Developed markets 16,403 16,315 17,227 17,431 19,064 19,467 20,141 Emerging markets 12,515 9,636 10,359 11,337 17,014 19,397 22,263 Emergingmarketpercentage 43 37 38 39 47 50 53
B. Value Traded (billion US$) Developed markets 4,617 4,411 4,166 6,634 8,446 10,633 12,011 Emerging markets 894 606 613 1,069 1,640 1,033 1,575 Emerging market percentage 16 12 13 14 16 9 12
Source: International Finance Corporation, Emerging Stock Markers Facrbook (Washington, D.C., 1996).
ceeding the total number of listed stocks in the developed markets. The value traded (or turnover) on emerging market exchanges reached $1.6 trillion in 1996, about 12 percent of the total value traded.
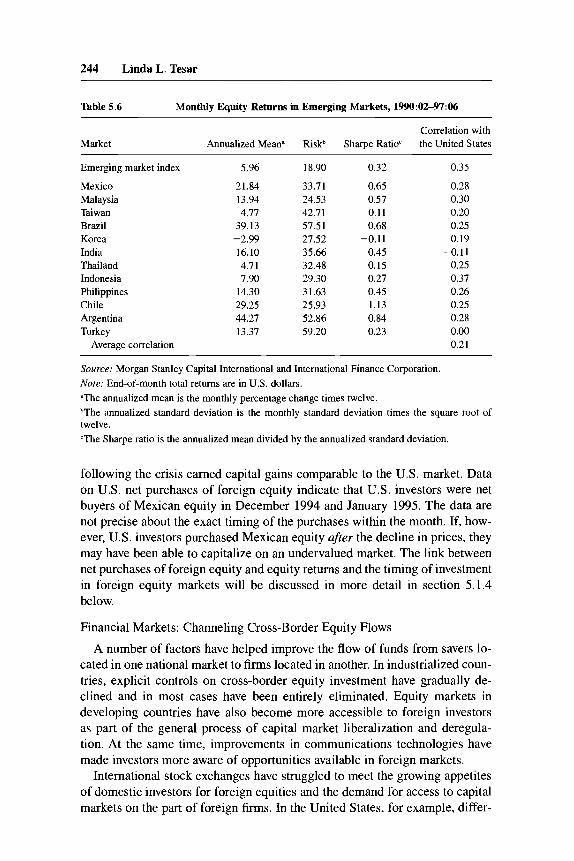
The emergence of new markets broadened the scope of the gains from diver- sification for investors in industrialized countries. Table 5.6 shows the annu- alized means, standard deviations, and Sharpe ratios for a set of emerging mar- kets over the period 1990:02-97:06. Comparing the figures with the returns in industrialized countries (table 5.2, panel B), it is clear that investment in emerging markets offers potentially high returns but also carries significant risk. The last column in table 5.6 shows the correlation with the U.S. return. The average correlation coefficient between the returns in emerging market equities with U.S. equity is about one-half the correlation coefficient between the equities of the industrialized countries, suggesting that there are significant diversification benefits to adding emerging market investments to a portfolio of equity from industrialized countries.
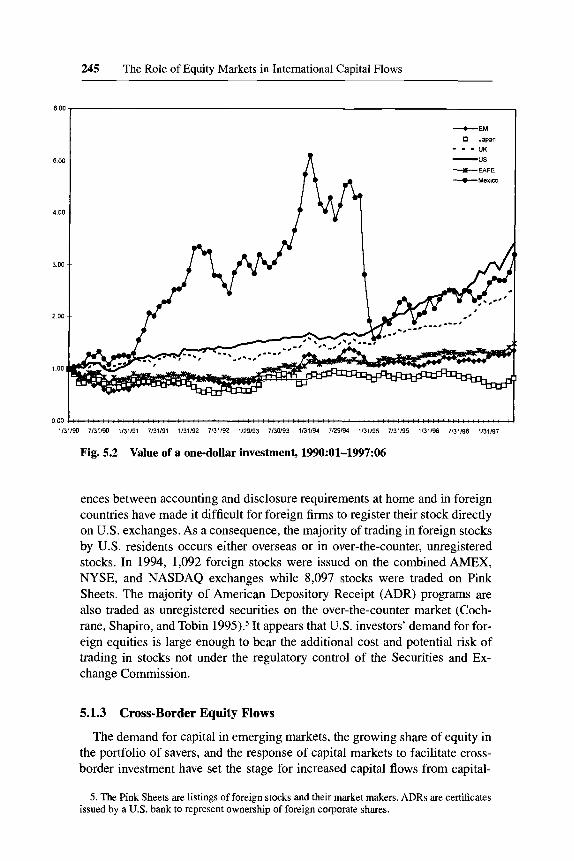
To further underscore the potential rewards as well as the hazards of in- vesting in emerging markets, figure 5.2 shows the cumulated returns of one dollar invested in January 1990 in Japan, the United Kingdom, the United States, Mexico, an index of European, Asian, and Far East stocks (denoted EAFE), and an index of emerging markets (denoted EM)." As of June 1997, investors in Japanese equity had suffered a capital loss on their six-and-a-half- year investment, while investment in the EM and EAFE indexes earned modest capital gains. Investment in the United Kingdom and the United States yielded capital gains of 153 and 244 percent, respectively. But the most interesting story is the case of Mexico. The impact of the December 1994 peso crisis is clear; the value of the dollar invested in Mexican equity plummeted from a high of $5.11 in January 1994 to $1.58 in February 1995. However, investors who either held Mexican equity over the entire time period or purchased equity
4. The returns are not hedged and therefore contain currency risk as well as country risk.
244 Linda L. Tesar
Table 5.6 Monthly Equity Returns in Emerging Markets, 19!30:02-97:06
Market Correlation with
Annualized Mean" Riskb Sharpe Ratio' the United States
Emerging market index 5.96 18.90 0.32 0.35
Mexico Malaysia Taiwan Brazil Korea
Thailand Indonesia Philippines Chile Argentina Turkey
India
21.84 13.94 4.77
39.13 -2.99 16.10 4.71 7.90
14.30 29.25 44.27 13.37
33.71 24.53 42.71 57.51 27.52 35.66 32.48 29.30 31.63 25.93 52.86 59.20
0.65 0.57 0.11 0.68
-0.11 0.45 -
0.15 0.27 0.45 1.13 0.84 0.23
0.28 0.30 0.20 0.25 0.19 ~0.11 0.25 0.37 0.26 0.25 0.28 0.00
Average correlation 0.21
Source: Morgan Stanley Capital International and International Finance Corporation. Note: End-of-month total returns are in U.S. dollars. "The annualized mean is the monthly percentage change times twelve. bThe annualized standard deviation is the monthly standard deviation times the square root of twelve. 'The Sharpe ratio is the annualized mean divided by the annualized standard deviation.
following the crisis earned capital gains comparable to the U.S. market. Data on U.S. net purchases of foreign equity indicate that U.S. investors were net buyers of Mexican equity in December 1994 and January 1995. The data are not precise about the exact timing of the purchases within the month. If, how- ever, U.S. investors purchased Mexican equity after the decline in prices, they may have been able to capitalize on an undervalued market. The link between net purchases of foreign equity and equity returns and the timing of investment in foreign equity markets will be discussed in more detail in section 5.1.4 below.
Financial Markets: Channeling Cross-Border Equity Flows
A number of factors have helped improve the flow of funds from savers lo- cated in one national market to firms located in another. In industrialized coun- tries, explicit controls on cross-border equity investment have gradually de- clined and in most cases have been entirely eliminated. Equity markets in developing countries have also become more accessible to foreign investors as part of the general process of capital market liberalization and deregula- tion. At the same time, improvements in communications technologies have made investors more aware of opportunities available in foreign markets.
International stock exchanges have struggled to meet the growing appetites of domestic investors for foreign equities and the demand for access to capital markets on the part of foreign firms. In the United States, for example, differ-
245 The Role of Equity Markets in International Capital Flows
--CMexim
1/31/90 7/31/90 1/31/91 7/31/91 1/31/92 7/31/92 1129/93 7130193 1/31/94 7/29E4 1/31/95 7/31/95 1131196 7/31/96 1/31/97
Fig. 5.2 Value of a one-dollar investment, 199O:Ol-1997:06
ences between accounting and disclosure requirements at home and in foreign countries have made it difficult for foreign firms to register their stock directly on U.S. exchanges. As a consequence, the majority of trading in foreign stocks by U.S. residents occurs either overseas or in over-the-counter, unregistered stocks. In 1994, 1,092 foreign stocks were issued on the combined AMEX, NYSE, and NASDAQ exchanges while 8,097 stocks were traded on Pink Sheets. The majority of American Depository Receipt (ADR) programs are also traded as unregistered securities on the over-the-counter market (Coch- rane, Shapiro, and Tobin 1995).5 It appears that U.S. investors’ demand for for- eign equities is large enough to bear the additional cost and potential risk of trading in stocks not under the regulatory control of the Securities and Ex- change Commission.
5.1.3 Cross-Border Equity Flows
The demand for capital in emerging markets, the growing share of equity in the portfolio of savers, and the response of capital markets to facilitate cross- border investment have set the stage for increased capital flows from capital-
5 . The Pink Sheets are listings of foreign stocks and their market makers. ADRs are certificates issued by a U.S. bank to represent ownership of foreign corporate shares.
246 Linda L. Tesar
rich to capital-poor regions of the world. This section discusses how investors have responded to this opportunity for global investment. It first examines the magnitude and direction of capital flows on a global scale then turns to the in- ternational investment choices of U.S. investors.
The Composition and Direction of International Capital Flows
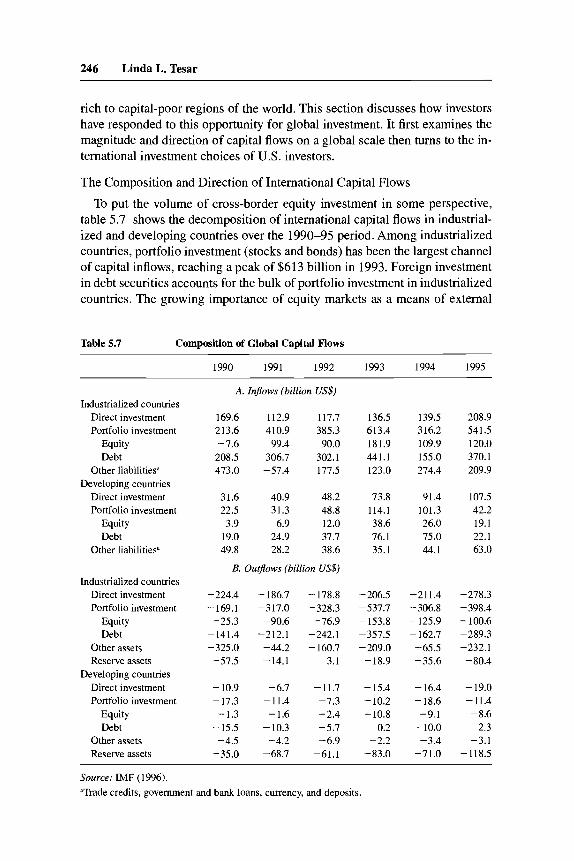
To put the volume of cross-border equity investment in some perspective, table 5.7 shows the decomposition of international capital flows in industrial- ized and developing countries over the 1990-95 period. Among industrialized countries, portfolio investment (stocks and bonds) has been the largest channel of capital inflows, reaching a peak of $613 billion in 1993. Foreign investment in debt securities accounts for the bulk of portfolio investment in industrialized countries. The growing importance of equity markets as a means of external
Table 5.7 Composition of Global Capital Flows
1990 1991 1992 1993 1994 1995
A. Inflows (billion US$) Industrialized countries
Direct investment Portfolio investment
Equity Debt
Other liabilities" Developing countries
Direct investment Portfolio investment
Equity Debt
Other liabilities"
Industrialized countries Direct investment Portfolio investment
Equity Debt
Other assets Reserve assets
Developing countries Direct investment Portfolio investment
Equity Debt
Other assets Reserve assets
169.6 112.9 117.7 213.6 410.9 385.3 -7.6 99.4 90.0 208.5 306.7 302.1 473.0 -57.4 177.5
31.6 40.9 48.2 22.5 31.3 48.8 3.9 6.9 12.0
19.0 24.9 37.7 49.8 28.2 38.6
B. Outj4ows (billion US$)
-224.4 - 186.7 - 178.8 -169.1 -317.0 -328.3 -25.3 -90.6 -76.9
-141.4 -212.1 -242.1 -325.0 -44.2 -160.7 -57.5 -14.1 3.1
-10.9 -6.7 -11.7 -17.3 -11.4 -7.3 -1.3 -1.6 -2.4
-15.5 -10.3 -5.7 -4.5 -4.2 -6.9
-35.0 -68.7 -61.1
136.5 613.4 181.9 441.1 123.0
73.8 114.1 38.6 76.1 35.1
-206.5 -537.7 - 153.8 -357.5 -209.0 -18.9
- 15.4 - 10.2 - 10.8
0.2 -2.2
-83.0
139.5 316.2 109.9 155.0 274.4
91.4 101.3 26.0 75.0 44.1
-211.4 -306.8 - 125.9 - 162.7 -65.5 -35.6
-16.4 -18.6 -9.1 - 10.0 -3.4
-71.0
208.9 541.5 120.0 370.1 209.9
107.5 42.2 19.1 22.1 63.0
-278.3 -398.4 - 100.6 -289.3 -232.1 -80.4
-19.0 -11.4 -8.6 -2.3 -3.1
-118.5
Source: IMF (1996). "Trade credits, government and bank loans, currency, and deposits.
247 The Role of Equity Markets in International Capital Flows
Table 5.8 Net Cross-Border Equity Flows, 1994-95
Amount Share of Global Equity (billion US$) Outhflows (%)
1994 1995 1994 1995
North America United States Canada
Japan Europe
United Kingdom Industrialized countries Rest of world
North America United States Canada
Japan Europe
United Kingdom Industrialized countries Rest of world
A. Net cross-border equity outjows from 55.0 54.0 48.1 50.7
6.9 3.3 14.1 -0.2 56.3 33.8 0.7 16.0
125.9 100.6 9.1 8.6
B. Net cross-border equity infows to 5.6 13.3 0.9 16.4 4.7 -3.1
49.0 50.7 47.1 30.0 5.8 5.1
109.9 120.0 26.0 19.1
40.7 35.6 5.1
10.4 41.6 0.5
93.1 6.7
4.1 0.7 3.5
36.1 34.7 4.3
80.9 19.1
49.5 46.4
3.0 -0.1 31.0 14.7 92.1 7.9
9.6 11.8
-2.2 36.4 21.6 3.7
86.3 13.7
Source: IMF (1996).
finance is more obvious in developing countries. Between 1990 and 1995, eq- uity inflows as a share of total portfolio inflows increased from 17.4 to 45.2 percent. On the asset side of the balance sheet, portfolio investment exceeds foreign direct investment as the main form of investment abroad by industrial- ized countries. Although the share of portfolio equity investment is rising, the bulk of foreign portfolio investment takes place through debt securities.
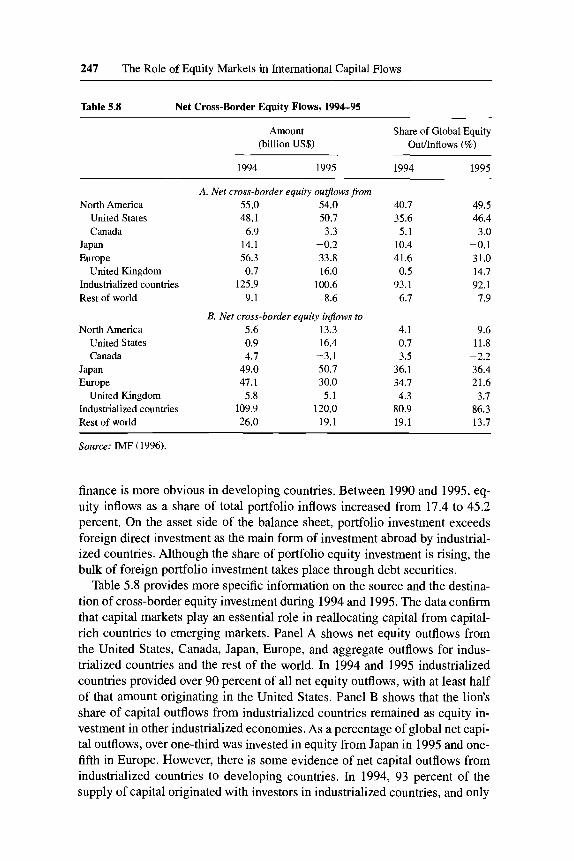
Table 5.8 provides more specific information on the source and the destina- tion of cross-border equity investment during 1994 and 1995. The data confirm that capital markets play an essential role in reallocating capital from capital- rich countries to emerging markets. Panel A shows net equity outflows from the United States, Canada, Japan, Europe, and aggregate outflows for indus- trialized countries and the rest of the world. In 1994 and 1995 industrialized countries provided over 90 percent of all net equity outflows, with at least half of that amount originating in the United States. Panel B shows that the lion’s share of capital outflows from industrialized countries remained as equity in- vestment in other industrialized economies. As a percentage of global net capi- tal outflows, over one-third was invested in equity from Japan in 1995 and one- fifth in Europe. However, there is some evidence of net capital outflows from industrialized countries to developing countries. In 1994, 93 percent of the supply of capital originated with investors in industrialized countries, and only
248 Linda L. Tesar
Table 5.9 Equity Infiows as a Percentage of Domestic Investment
Market 1990.0 1991.0 1992.0 1993.0 1994.0 1995.0
Developed markets Australia Austria Canada Finland France Germany Japan New Zealand Singapore Spain Sweden United Kingdom United States
Emerging markets Chile Indonesia Korea Mexico Portugal South Africa
2.5 5.5
-1.2 0.9 2.3
-0.6 -1.4
1.7 4.6 n.a. n.a. 1.5
-1.8
4.0 0.2 13.1 11.8 1.8 1.7 10.8 10.8
-0.7 0.8 9.3 4.7 0.3 1.8 71.1 71.3 3.0 2.0 5.9 2.0 0.4 -0.6 1.8 0.8 4.4 0.8 1.6 3.6 1.9 0.8 1.4 n.a.
- 1.7 7.9 13.5 1.2 2.2 2.9 n.a. n.a.
15.6 19.8 64.9 100.1 2.6 10.9 18.1 3.8 1.3 -0.5 2.5 0.1
4.1 8.1
-3.1 42.8
2.6 -0.3
3.5 n.a. 1.4
n.a. 21.3 3.0 1.6
5.4 0.3 3.4 7.0 9.9 -1.7 n.a. n.a. n.a. 3.9 3.4 2.3 n.a. n.a. 8.8 22.0 10.7 11.6 3.9 11.4 7.0 14.3 5.0 1.1
11.4 4.8 10.3 12.4 10.0 -3.5 n.a. -4.2 -4.1 4.8 0.7 5.9
Sources: IMF (1996) and IMF, International Financial Statistics, annual issue (Washington, D.C., 1996). Note: Investment is measured as gross fixed capital formation.
81 percent was reinvested in equity from industrialized countries. Thus roughly 8 percent of the global supply of equity capital was reallocated from industrial- ized to developing countries. In 1995, the fraction invested in "rest of the world" equities had dropped from 19 to 14 percent, and the share reallocated across the two regions fell to 6 percent of the global total.
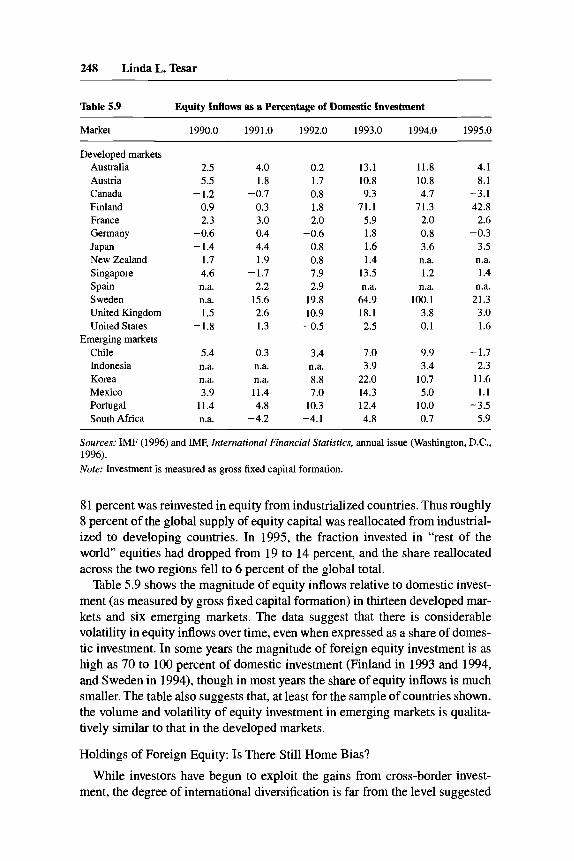
Table 5.9 shows the magnitude of equity inflows relative to domestic invest- ment (as measured by gross fixed capital formation) in thirteen developed mar- kets and six emerging markets. The data suggest that there is considerable volatility in equity inflows over time, even when expressed as a share of domes- tic investment. In some years the magnitude of foreign equity investment is as high as 70 to 100 percent of domestic investment (Finland in 1993 and 1994, and Sweden in 1994), though in most years the share of equity inflows is much smaller. The table also suggests that, at least for the sample of countries shown, the volume and volatility of equity investment in emerging markets is qualita- tively similar to that in the developed markets.
Holdings of Foreign Equity: Is There Still Home Bias?
While investors have begun to exploit the gains from cross-border invest- ment, the degree of international diversification is far from the level suggested
249 The Role of Equity Markets in International Capital Flows
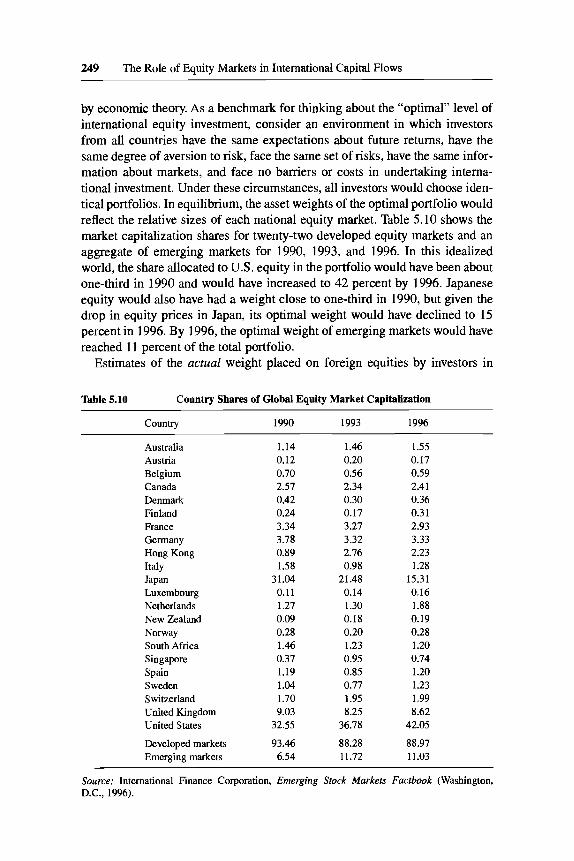
by economic theory. As a benchmark for thinking about the "optimal" level of international equity investment, consider an environment in which investors from all countries have the same expectations about future returns, have the same degree of aversion to risk, face the same set of risks, have the same infor- mation about markets, and face no barriers or costs in undertaking interna- tional investment. Under these circumstances, all investors would choose iden- tical portfolios. In equilibrium, the asset weights of the optimal portfolio would reflect the relative sizes of each national equity market. Table 5.10 shows the market capitalization shares for twenty-two developed equity markets and an aggregate of emerging markets for 1990, 1993, and 1996. In this idealized world, the share allocated to U.S. equity in the portfolio would have been about one-third in 1990 and would have increased to 42 percent by 1996. Japanese equity would also have had a weight close to one-third in 1990, but given the drop in equity prices in Japan, its optimal weight would have declined to 15 percent in 1996. By 1996, the optimal weight of emerging markets would have reached 11 percent of the total portfolio.
Estimates of the actual weight placed on foreign equities by investors in
Table 5.10 Country Shares of Global Equity Market Capitalization
Country 1990 1993 1996
Australia Austria Belgium Canada Denmark Finland France Germany Hong Kong Italy Japan Luxembourg Netherlands New Zealand Norway South Africa Singapore Spain Sweden Switzerland United Kingdom United States
Developed markets Emerging markets
1.14 0.12 0.70 2.57 0.42 0.24 3.34 3.78 0.89 1.58
31.04 0.11 1.27 0.09 0.28 1.46 0.37 1.19 1.04 1.70 9.03
32.55
93.46 6.54
1.46 0.20 0.56 2.34 0.30 0.17 3.27 3.32 2.76 0.98
21.48 0.14 1.30 0.18 0.20 1.23 0.95 0.85 0.77 1.95 8.25
36.78
88.28 11.72
1.55 0.17 0.59 2.41 0.36 0.31 2.93 3.33 2.23 1.28
15.31 0.16 1.88 0.19 0.28 1.20 0.74 1.20 1.23 1.99 8.62
42.05
88.97 11.03
Source: International Finance Corporation, Emerging Stock Markets Factbook (Washington, D.C., 1996).
250 Linda L. Tesar
industrialized countries fall far short of the market weights in table 5.10. Tesar and Werner (1995) found strong home bias in the portfolios of investors from Canada, Germany, Japan, the United Kingdom, and the United States. In 1990, the estimated weights on foreign equities ranged from 3.3 percent for investors from the United States to 23.5 percent for investors from the United Kingdom.6 The degree of home bias in the U.S. portfolio does appear to be eroding, how- ever. Using updated data, Bohn and Tesar (1997) found that the U.S. invest- ment position in foreign equities roughly doubled between 1990 and 1993.
Figures recently released by the U.S. Treasury Department suggest that these estimated foreign portfolio shares for U.S. investors may have understated the magnitude of the U.S. investment position in foreign equity markets. The port- folio shares cited above are calculated by cumulating net purchases over time starting from an initial benchmark position, taking into account capital gains and losses. The benchmark position for U.S. portfolio investment in foreign markets was based on a survey of U.S. investors’ foreign investment positions in long-term securities in 1943.’ The Treasury Department recently surveyed 3,344 custodians and fund managers regarding the level of their holdings of foreign long-term securities as of 3 1 March 1994. Foreign long-term securities covered by the survey include all publicly and privately placed equity and long- term debt securities issued by non-U.S. firms, foreign governments, and inter- national organizations. ADRs and Global Depository Receipts are considered foreign securities if the underlying securities are claims on firms located out- side of the United States.8 Based on the results of the new survey, the estimated U.S. investment position in foreign equities has been revised upward from its previous level of $228.5 billion9 at the end of 1994 to $595.5 billion. Using the estimate of U.S. market capitalization as reported by the International Finance Corporation, a rough estimate of the share of the U.S. portfolio invested in for- eign equities was 10.66 percent in 1993 and 11.75 percent in 1994.’O
In principle, if net purchases accurately reflect transactions in equity be- tween domestic and foreign residents, the estimates based on cumulated net purchases should provide a good approximation of the investment position re- gardless of the date of the benchmark survey. There are three reasons, however, to anticipate potentially large errors in the investment positions based on cu- mulated net purchases.
6. French and Poterba (1 99 1) reported similar figures. 7. Surveys to measure the magnitude of foreign holdings of U.S. securities have been conducted
8. For a complete discussion of the survey methodology and the updated investment positions,
9. Author’s own estimates (see Bohn and Tesar 1997). 10. A more exact estimate of the portfolio share would be to adjust the denominator for U.S.
holdings of foreign equities and foreign holdings of U.S. equity. It should also be noted that the measure of U.S. market capitalization reported by the International Finance Corporation has con- siderably larger coverage than the figures of market capitalization reported by either Morgan Stan- ley Capital International (MSCI) or the Financial Times (FT). The share of home equity in the U.S. portfolio would obviously be larger if the MSCI or FT market capitalization were used.
every five years since 1974.
see Pappas (1997).
251 The Role of Equity Markets in International Capital Flows
1. Innovations in telecommunications and computing technology and the elimination of capital controls in many countries have made it difficult for gov- ernment agencies to keep track of the volume of transactions between domestic and foreign residents. Although this is a potentially serious problem, it would affect purchases as well as sales of foreign securities and may not substantially bias the data.lL
2. The net purchases data provide no information about which securities investors are buying or selling. For lack of a better alternative, estimates of investment positions are based on the assumption that investors transact in for- eign market indexes. To the extent that investors choose stocks that outperform the index, their investment positions in foreign stocks will be underestimated.
3. The data reflect net purchases cumulated during the month and therefore contain no information about the exact timing of transactions in foreign stock. If there are large changes in equity returns during a particular month, as in the case of the 1994 Mexican peso crisis, inaccuracies in the timing of net pur- chases can have a large impact on the estimated value of the investment posi- tion in that market.
Although the updated investment position figures reflect a substantial in- crease in U S . holdings of foreign equity, a portfolio weight of 12 percent on foreign equity is still far below the level predicted by the simple economic model. There are a number of potential explanations for the home bias puzzle, though none have provided a definitive solution to the problem. The most obvi- ous explanation for home bias is that there may be costs associated with trans- acting in foreign markets, such as explicit taxes on foreign equity investment, that would deter an investor from undertaking foreign investments and thereby skew the portfolio toward domestic assets. There is evidence that government restrictions have had an impact on asset prices in developing countries, which could explain the low U.S. investment position in emerging markets in the early 1990s (see, e.g., Bonser-Neal et al. 1990; Claessens and Rhee 1993). However, most explicit limits on holdings in foreign equity have either been eliminated or are well above observed portfolio shares and would therefore not restrict portfolio allocations. Transaction costs could also hinder cross-border investment but again would have to be implausibly large to explain the large and persistent degree of home bias. A recent study of the trading costs of in- stitutional investors-inclusive of fees, commissions, and market impact ef- fects-suggests that costs are indeed higher in emerging stock markets than in more developed equity markets. Interestingly, the cost of trading in NASDAQ stocks is higher than in many foreign markets due to market impact effects (ElkinsMcS herry Company).
11. Biases would be more likely for countries that impose taxes on cross-border trading or on holdings of foreign assets. In comparing data sources on Canadian holdings of U.S. equity in 1990, Tesar and Werner (1992) found that the official figures reported by the Bank of Canada were smaller than the figures reported by the U.S. Treasuly Department by a factor of four. One possible explanation for the discrepancy is that Canadian holdmgs were underreported to avoid Canadian taxes on foreign investment income.
252 Linda L. Tesar
The high-transaction-costs explanation for home bias also flies in the face of evidence on the volume of trading in foreign securities. Tesar and Werner (1995) found that the turnover rate on holdings of foreign equity by U.S. and Canadian investors in 1989 was at least double the rate of turnover on their home markets.’* They also found that foreign investors’ turnover rate on hold- ings of U.S. equity was 60 percent higher than the turnover rate on the U.S. market. Both findings suggest that transaction costs are not a deterrent to mak- ing frequent transactions in foreign stocks.
A second explanation for home bias is that investors in different countries face different risks and that the optimal “hedging” strategy against these risks is a portfolio skewed toward domestic securities. Shocks that affect purchasing power, such as changes in inflation or shifts in the supply of nontraded goods, have been shown in theory to produce home bias in national portfolios under some circumstances. When tested empirically, however, these factors have not been found to be important enough to generate portfolio weights consistent with those observed in most countries (see, e.g., Cooper and Kaplanis 1994; Baxter, Jermann, and King 1995; Tesar 1995). Baxter and Jermann (1997) de- veloped a model that takes into account the impact of wages on the optimal investment portfolio. Because both labor income and domestic equity returns tend to be procyclical, they found that the optimal hedging strategy involves holding a short position in domestic equity, further deepening the home bias riddle.
Another explanation for home bias is that investors have better information about investments in their home markets than about investments in foreign markets and are thus cautious about trading against better informed foreign traders (see, e.g., Gehrig 1993). On the surface, such an information bias seems plausible. However, investors need little information to pursue a simple buy- and-hold strategy that would capture the gains from diversification. The infor- mation bias explanation for home bias is also inconsistent with the large vol- ume of trading and turnover in foreign equities.
Rowland and Tesar (1998) examined the possibility that investment in multi- national corporations provides indirect global diversification benefits, thereby reducing the need to purchase equity directly in foreign exchanges. Using data from Canada, France, Germany, Japan, Italy, the United Kingdom, and the United States over the 1984-92 period, they found weak evidence that multi- nationals may have provided diversification benefits for U.S. investors, though not for investors domiciled in the other six countries. In addition, they reported that even after taking the indirect diversification benefits into account, there remain significant benefits from diversifying internationally.
Each of these potential explanations for home bias probably contains more
12. The turnover rates are derived by scaling gross purchases and sales in foreign equity by holdings. The Treasury’s revised figures for U.S. holdings of foreign securities reduce the aggre- gate turnover estimates of U.S. investors in foreign securities by about one-half.
253 The Role of Equity Markets in International Capital Flows
than a kernel of truth. However, the extent and the persistence of home bias in the face of seemingly large benefits from diversification remains a puzzle for continuing research.
The U.S. Foreign Portfolio
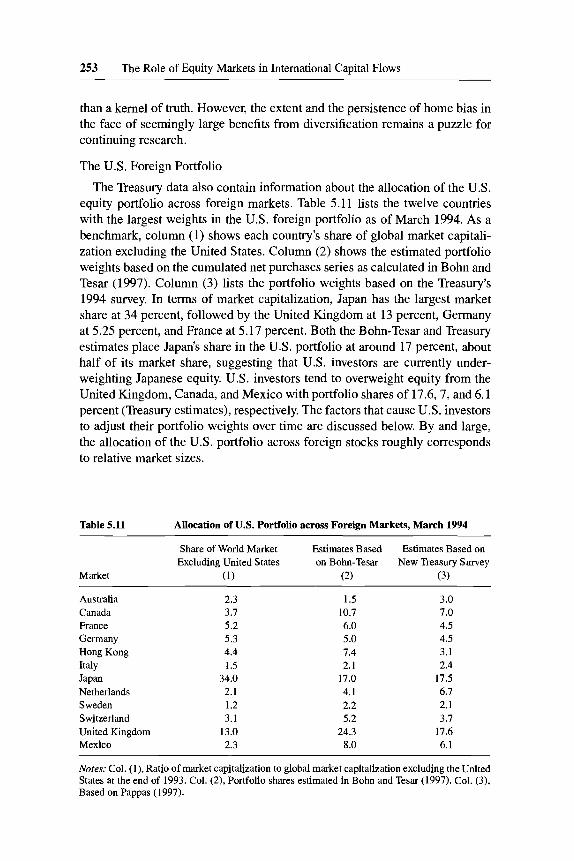
The Treasury data also contain information about the allocation of the U.S. equity portfolio across foreign markets. Table 5.11 lists the twelve countries with the largest weights in the U.S. foreign portfolio as of March 1994. As a benchmark, column (1) shows each country’s share of global market capitali- zation excluding the United States. Column (2) shows the estimated portfolio weights based on the cumulated net purchases series as calculated in Bohn and Tesar (1997). Column (3) lists the portfolio weights based on the Treasury’s 1994 survey. In terms of market capitalization, Japan has the largest market share at 34 percent, followed by the United Kingdom at 13 percent, Germany at 5.25 percent, and France at 5.17 percent. Both the Bohn-Tesar and Treasury estimates place Japan’s share in the U.S. portfolio at around 17 percent, about half of its market share, suggesting that U.S. investors are currently under- weighting Japanese equity. U.S. investors tend to overweight equity from the United Kingdom, Canada, and Mexico with portfolio shares of 17.6,7, and 6.1 percent (Treasury estimates), respectively. The factors that cause U.S. investors to adjust their portfolio weights over time are discussed below. By and large, the allocation of the U.S. portfolio across foreign stocks roughly corresponds to relative market sizes.
Table 5.11 Allocation of U.S. Portfolio across Foreign Markets, March 1994
Share of World Market Estimates Based Estimates Based on Excluding United States on Bohn-Tesar New Treasury Survey
Market (1) (2) (3)
Australia 2.3 1.5 3.0 Canada 3.7 10.7 7.0 France 5.2 6.0 4.5
Hong Kong 4.4 7.4 3.1 Italy 1.5 2.1 2.4 Japan 34.0 17.0 17.5 Netherlands 2.1 4.1 6.1 Sweden 1.2 2.2 2.1 Switzerland 3.1 5.2 3.1 United Kingdom 13.0 24.3 17.6 Mexico 2.3 8.0 6.1
Germany 5.3 5.0 4.5
Notes: Col. (l), Ratio of market capitalization to global market capitalization excluding the United States at the end of 1993. Col. (2), Portfolio shares estimated in Bohn and Tesar (1997). Col. (3), Based on Pappas (1997).
254 Linda L. Tesar
5.1.4 Long-Term Investment or “Hot Money”?
Foreign equity investment still accounts for only a fraction of the portfolio held by investors in industrialized countries. From the perspective of develop- ing countries, however, the expansion of equity markets worldwide has resulted in a dramatic shift in external finance from official development and bank loans to private capital inflows. This growing dependence on private capital inflows has caused policymakers to question the reliability and sustainability of equity investment as a means of financing long-run development. Is the increase in equity investment abroad part of a long-run trend toward greater diversification or is it simply a short-run phenomenon that could reverse itself? Do investors take a long view in making foreign equity investments, or is equity investment “hot money,” in pursuit of short-run capital gains? Do local factors have a significant impact on the allocation of investment, or are equity flows largely driven by global events outside of the control of local policymakers?
The behavior of U.S. investors in foreign equity markets provides some in- sight into these questions. Using monthly data on U.S. net purchases of equi- ties in twenty-two countries, Bohn and Tesar (1996, 1997) identified the main determinants of foreign equity investment. In general, net purchases of foreign equity in a particular market were found to be positively related to the expected equity returns in that market.13 In other words, U.S. investors tend to buy equity in a particular market if the signals about that market suggest that future returns will be high. This suggests that U.S. equity investment is not driven by fads, but that U.S. investors are responsive to local market conditions.
The behavior of U.S. investors in foreign markets also sheds light on the relative importance of global and local factors in explaining international capi- tal flows. Calvo, Leiderman, and Reinhart (1993, 1996) argued that global fac- tors-in particular, the fall in U.S. interest rates-induced investors to shift their portfolios away from domestic securities to seek higher returns abroad. Their study raised concerns that a subsequent increase in U.S. interest rates could just as easily cause investors to retreat from foreign markets. Bohn and Tesar (1999) found that U.S. interest rates do in fact play a role in explaining U.S. net purchases of foreign equity, but only through their impact on fore- casted returns. After conditioning on expected returns and a linear time trend, they found no evidence that global variables have an independent influence on net equity purchases.
Finally, there is concern that increased foreign equity investment will pro- duce “contagion” effects, that is, that a crisis in one market will spill over into other markets. The impact of portfolio flows on asset returns is discussed by
13. The forecastable component of future equity returns is obtained by regressing current returns on a set of predictor variables. Variables that are found to have out-of-sample explanatory power for foreign equity returns include lagged measures of the return on the local stock market in U.S. dollars less the U.S. safe rate, the local dividend yield, U.S. stock returns, the U.S. interest rate, the term structure of U.S. interest rates, and U.S. industrial production.
255 The Role of Equity Markets in International Capital Flows
Stulz in chapter 5.2 of this volume. In terms of the transmission effects work- ing through quantities, vector autoregressions of net purchases in one market on net purchases in other markets yield little evidence of a statistical relation between net purchases across markets. There is also no evidence that the Mexi- can peso crisis had an impact on U.S. investments in other Latin American or Asian markets.
5.1.5 Conclusions
Despite the acceleration in cross-border equity flows during the 1990s, the internationalization of capital markets is in fact only in its infancy. Of the to- tal volume of global equity flows, only a fraction represents a net shift of capi- tal investment from capital-rich to capital-poor regions of the world. There remains substantial home bias in the portfolios of investors in the wealthiest countries, suggesting that there also remain substantial gains from global di- versification. Market reforms and the privatization of state- and family-owned enterprises in Europe, Asia, and Latin America are just beginning to take hold. For virtually all countries, the gains from increased access to international cap- ital markets are sizable.
The recent crisis in Asia and its “contagious spread” to eastern Europe, Latin America, and possibly the United States has caused some economists and poli- cymakers to question the benefits of globally integrated financial markets. Ironically, after decades of progress in dismantling capital controls, barriers to international capital flow have again become fashionable under the guise of restoring global economic order. While these policies may, in some circum- stances, delay the swift transmission of economic crises, the chief consequence of capital controls will be to deny firms, individuals, and governments access to much needed capital for investment and growth. A better response to global uncertainty is to adopt policies that will strengthen domestic institutions, cre- ate greater transparency on the part of borrowers, and facilitate coordination among national governments.
References
Baxter, Marianne, and Urban Jermann. 1997. The international diversification puzzle is worse than you think. American Economic Review 87: 170-80.
Baxter, Marianne, Urban Jermann, and Robert King. 1995. Non-traded goods, non- traded factors and non-diversification. Charlottesville: University of Virginia. Work- ing paper.
Board of Governors of the Federal Reserve System. Various years. Flow of funds ac- counts of the United States,Jows and outstandings. Washington, D.C.: Board of Gov- ernors of the Federal Reserve System.
256 Linda L. Tesar
Bohn, Henning, and Linda L. Tesar. 1996. U.S. equity investment in foreign markets: portfolio rebalancing or return chasing? American Economic Review: Papers and Proceedings 86 (2): 77-81.
. 1997. The U.S. international investment portfolio and mean-variance optimiza- tion. Santa Barbara: University of California. Working paper.
. 1999. U.S. portfolio investment in Asian capital markets. In Managing capital JIows and exchange rates: Perspectivesffom the Pacific Basin, ed. R. Glick. New York: Cambridge University Press, forthcoming.
Bonser-Neal, C., G. Brauer, R. Neal and S. Wheatley. 1990. International investment restrictions and closed end country fund prices. Journal of Finance 45523-48.
Calvo, G., L. Leiderman, and C. Reinhart. 1993. Capital flows and the real exchange rate appreciation in Latin America: The role of external factors. IMF Stajj Papers 40
. 1996. Inflows of capital to developing countries in the 1990s. Journal of Eco- nomic Perspectives 10 (2): 123-39.
Claessens, S., and M. Rhee. 1993. The effects of equity barriers on foreign investment in developing countries. NBER Working Paper no. 4579. Cambridge, Mass.: Na- tional Bureau of Economic Research.
Cochrane, James L., James E. Shapiro, and Jean E. Tobin. 1995. Breaking down the barriers separating supply and demand. NYSE Working Paper no. 95-04. New York: New York Stock Exchange.
Cooper, Ian A,, and Evi Kaplanis. 1994. Home bias in equity portfolios, inflation hedg- ing and international capital market equilibrium. Review of Financial Studies 7:
(1): 108-51.
45-60. Europe’s fund phobia. 1997.Economisf 29 March. French, K., and J. Poterba. 1991. Investor diversification and international equity mar-
kets. American Economic Review 31 :222-26. Gehrig, T. 1993. An information based explanation of the domestic bias in international
equity investment. Scandinavian Journal of Economics 1:97-109. Grubel, H. G. 1968. Internationally diversified portfolios. American Economic Review
Heaton, John, and Deborah Lucas. 1997. Savings behavior and portfolio choice: Which risks matter? Evanston, Ill.: Northwestern University. Working paper.
IMF (International Monetary Fund). 1996. Balance of payments statistics yearbook. Washington, D.C.: International Monetary Fund.
. 1997. Intemationaljnancial statistics, annual issue. Washington, D.C.: Inter- national Monetary Fund.
Investment Company Institute. 1997. The mutual fund fact book. New York: Investment Company Institute.
Levy, H., and M. Sarnat. 1970. International diversification of investment portfolios. American Economic Review 50:668-75.
Longin, Francois, and Bruno Solnik. 1995. Is the correlation in international equity returns constant: 1960-1990? Journal of International Money and Finance 14 (1):
McLiddon, Michael P. 1996. Privatization and capital market development. Westport, Conn.: Praeger.
Morgan, Donald P. 1994. Will the shift to stocks and bonds by households be destabiliz- ing? Kansas City: Federal Reserve Bank of Kansas City.
Mutual funds: Savers flock to put cash into America’s unit trusts. 1996. Financial Times, 6 June.
Pappas, Milton. 1997. United States long-term portfolio investment abroad. A special report on the Outbound Portfolio Investment Survey. Washington, D.C.: Department of the Treasury.
58: 1299-13 14.
3-26.
257 The Role of Equity Markets in International Capital Flows
Rowland, Patrick F., and Linda L. Tesar. 1998. The gains from international diversifica- tion revisited. Ann Arbor: University of Michigan. Working paper.
Tesar, Linda L. 1995. Evaluating the gains from international risksharing. Carnegie- Rochester Conference Series on Public Policy 42~95-143.
Tesar, Linda L., and Ingrid M. Werner. 1992. Home bias and the globalization of securi- ties markets. NBER Working Paper no. 4218. Cambridge, Mass.: National Bureau of Economic Research.
. 1995. Home bias and high turnover. Journal of International Money and Fi- nance 14 (4): 467-92.
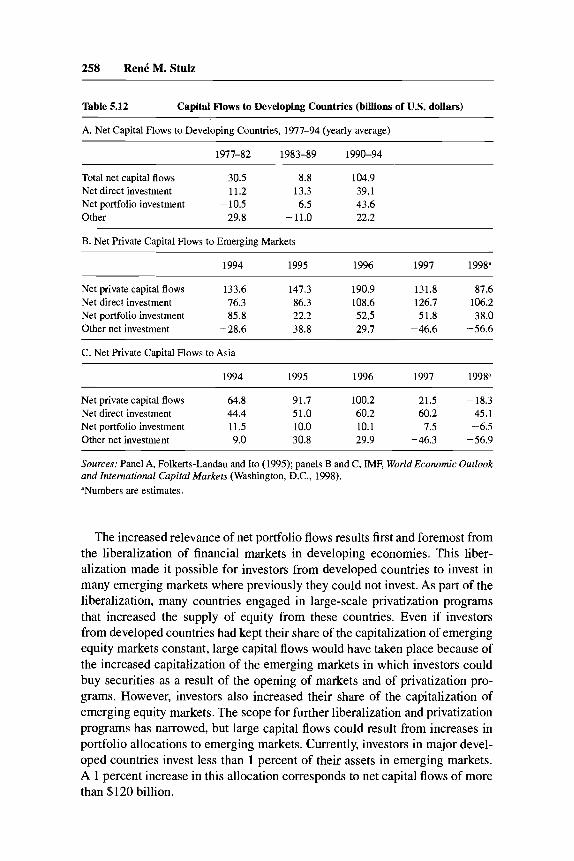
2. Rene‘ M. Stulz International Portfolio Flows and Security Markets For most of the period following World War 11, the economic significance of net capital flows was small and net portfolio flows were even less important (see Feldstein and Horioka 1980). Over recent years, net capital flows have be- come much larger, especially to developing economies. Net portfolio flows are now a major component of net capital flows. Table 5.12 gives various estimates of the main components of net capital flows for developing countries. From 1977 to 1982, average annual net cumulative portfolio flows to developing countries were negative (-$10.5 billion). In contrast, in the year before the Mexican crisis, net portfolio investment of $85.8 billion exceeded net foreign direct investment of $76.3 billion. After recovering from the Mexican crisis, net portfolio investment fell again with the Asian crisis. Net portfolio flows turned negative for Asian developing countries, but they were not as important in the 1990s for these countries as they were for Latin America. To find a period in history when net capital flows were possibly as important as in the 1990s, one has to go back to the beginning of this century. Strikingly, however, while net flows were comparable to the recent experience before World War I, there are two important differences. First, to use the expression coined by Eichengreen and Fishlow, the current era is the “era of equity finance,” which started at the end of the 1980s when “an unprecented volume and share of capital flows to developing countries began to take the form of equity pur- chases by individual investors . . . through their institutional representatives” (1998,24). Second, gross flows are dramatically larger today than ever before. A good example of this is the turnover in foreign exchange markets which exceeds one trillion dollars a day (Bordo, Eichengreen, and Kim 1998).
Part of this paper was written while the author was a Bower Fellow at the Harvard Business School. The author is grateful for comments from Warren Bailey, Geert Bekaert, Cam Harvey, Martin Feldstein, Anthony Richards, Linda Tesar, Ingrid Werner, an anonymous referee, and con- ference participants.
258 RenC M. Stulz
Table 5.12 Capital Flows to Developing Countries (billions of U.S. dollars)
A. Net Capital Flows to Developing Countries, 1977-94 (yearly average)
1977-82 1983-89 1990-94
Total net capital flows 30.5 8.8 104.9 Net direct investment 11.2 13.3 39.1 Net portfolio investment - 10.5 6.5 43.6 Other 29.8 -11.0 22.2
B. Net Private Capital Flows to Emerging Markets
1994 1995 1996 1997 1998'
Net private capital flows 133.6 147.3 190.9 131.8 87.6 Net direct investment 76.3 86.3 108.6 126.7 106.2 Net portfolio investment 85.8 22.2 52.5 51.8 38.0 Other net investment -28.6 38.8 29.7 -46.6 -56.6
C. Net Private Capital Flows to Asia
1994 1995 1996 1997 199P
Net private capital flows 64.8 91.7 100.2 21.5 -18.3 Net direct investment 44.4 51.0 60.2 60.2 45.1 Net portfolio investment 11.5 10.0 10.1 7.5 -6.5 Other net investment 9.0 30.8 29.9 -46.3 -56.9
~~ ~~ ~
Sources: Panel A, Folkerts-Landau and It0 (1995); panels B and C, IME World Economic Outlook and International Capital Markets (Washington, D.C., 1998). aNumbers are estimates
The increased relevance of net portfolio flows results first and foremost from the liberalization of financial markets in developing economies. This liber- alization made it possible for investors from developed countries to invest in many emerging markets where previously they could not invest. As part of the liberalization, many countries engaged in large-scale privatization programs that increased the supply of equity from these countries. Even if investors from developed countries had kept their share of the capitalization of emerging equity markets constant, large capital flows would have taken place because of the increased capitalization of the emerging markets in which investors could buy securities as a result of the opening of markets and of privatization pro- grams. However, investors also increased their share of the capitalization of emerging equity markets. The scope for further liberalization and privatization programs has narrowed, but large capital flows could result from increases in portfolio allocations to emerging markets. Currently, investors in major devel- oped countries invest less than 1 percent of their assets in emerging markets. A 1 percent increase in this allocation corresponds to net capital flows of more than $120 billion.
259 The Role of Equity Markets in International Capital Flows
Net portfolio flows should lower the cost of capital in many countries and facilitate the flow of capital to firms and countries that have the best investment opportunities irrespective of their locations. Overall, net portfolio flows should therefore be an engine of worldwide growth. This should be even more so be- cause portfolio investments subject firms and countries to the discipline of cap- ital markets. To attract and keep portfolio investments, firms and countries have to behave so as to maximize the value of these investments and are punished when they do not. As a result, firms and countries have greater incentives to in- vest efficiently. These arguments in favor of unrestrained portfolio flows are powerful, but many argue that they are flawed because investors are sometimes moved by “animal spirits” rather than rational thinking, so that portfolio flows have a dark side that can destabilize countries and reduce growth. The large net capital flows of the 1990s and the concomitant increase in the role of inter- national investors in developing countries have led many to reconsider the ben- efits and costs of net portfolio inflows with some urgency.
The Mexican crisis has been an important cause of this reconsideration. It prompted many to worry about the stability of portfolio investments. Con- trasting the Mexican crisis to the debt crisis of the early 1980s highlights why sudden changes in portfolio flows might be a source of concern. With the debt crisis, there were few key players in developed countries, their claims were illiquid, and they had strong incentives to work out solutions with the devel- oping countries. With the Mexican crisis, coordination among portfolio inves- tors was impossible. Even though collectively investors might have been better off committing funds to the Mexican government to resolve the crisis, individ- ually each investor was better off selling out and could do so quickly because he was holding liquid securities. A number of economists have therefore ar- gued that financing a country’s growth through portfolio investment can expose it to sudden inflows and outflows that can destabilize an otherwise sound econ- omy, force it into dramatic macroeconomic adjustments, and wreak havoc in its security markets. After worrying about the insufficient economic impor- tance of net capital flows, some economists now worry that there might be too much portfolio investment. Sachs, Tornell, and Velasco aptly summarized this concern: “In today’s world of fickle private capital movements, it is argued, large inflows leave a country exposed to the latest mood of Wall Street traders” (1996, 171). This leads economists such as Williamson to say that they “would not urge complete liberalization prior to (a) evidence that . . . controls have become completely ineffective (and hopelessly corrupting), or (b) the assur- ance that inflows will not be excessive” (1993, 14).
The Asian crisis has added fuel to this growing reconsideration of the bene- fits of capital flows. For instance, Stiglitz (1998) called for greater regulation of capital flows, arguing that “developing countries are more vulnerable to vacillations in international flows than ever before.” Radelet and Sachs (1998) attributed the crisis to panic from foreign investors. Krugman (1998) summa- rized his view on the impact of capital flows in the East Asian crisis as follows:
260 R e d M. Stulz
“What turned a bad financial situation into a catastrophe was the way a loss of confidence turned into self-reinforcing panic. In 1996 capital was flowing into emerging Asia at the rate of about $100 billion a year; by the second half of 1997 it was flowing out at about the same rate. Inevitably, with that kind of reversal Asia’s asset markets plunged, its economies went into recession, and it only got worse from there.” He then went on to argue that the solution is to impose currency controls, finishing with an apocalyptic description of what would happen without them: “But if Asia does not act quickly, we could be looking at a true Depression scenario-the kind of slump that 60 years ago devastated societies, destabilized governments, and eventually led to war.”
In this paper, we examine these concerns about the implications of net port- folio flows in light of the existing empirical evidence and theories of inter- national portfolio investment. In section 5.2.1 we evaluate the impact of liber- alization on equity valuations and on the cost of capital. In section 5.2.2 we address the issue of cross-country comovement in valuations and examine whether there is contagion in international financial markets. In section 5.2.3 we consider whether net portfolio flows can drive valuations away from funda- mentals and make asset prices more volatile. Section 5.2.4 attempts to provide an assessment of the net benefits of openness to portfolio investment.
5.2.1 Capital Market Liberalization and Equity Valuations
The past twenty-five years in international capital markets have seen the dismantling of the restrictions on capital flows resulting from the two world wars. At the end of World War 11, capital markets were essentially completely segmented. Because of restrictions on capital flows, investors mostly held as- sets from their home countries. International investment took the form of offi- cial capital flows. Some restrictions were soon lifted as currencies became con- vertible, but other restrictions were added periodically as governments in many countries tried to direct economic activity by reducing the role of markets. Since the 1970s, most of these restrictions have been removed. First, the mar- kets of developed economies were deregulated. Countries removed obstacles to exchange rate transactions, agreed to tax agreements that reduced obstacles to international investment, and eliminated restrictions on foreign ownership that were often binding. Developing countries started to deregulate later than the developed countries, and many such countries have only taken timid steps in that direction. Nevertheless, many of these countries have eliminated obsta- cles to capital flows and promoted equity market deregulation actively.
Though economists in general are enthusiastic about the benefits of free trade in goods, they often seem surprisingly reluctant in their assessment of the gains from free trade in securities. For instance, Bhagwati (1 998) stated: “This is a seductive idea: freeing up trade is good, why not also let capital move freely across borders? But the claims of enormous benefits from free capital mobility are not persuasive. . . . It is time to shift the burden of proof
261 The Role of Equity Markets in International Capital Flows
from those who oppose to those who favor liberated capital.”’ This is surpris- ing because a country cannot take full advantage of the benefits of free trade in goods without full capital mobility. Capital mobility allows a country to produce more efficiently and enables the residents to bear fewer of the risks associated with domestic production. To understand these two effects of capital mobility, we consider a country with no capital flows that, for the sake of illus- tration, has a well-defined comparative advantage in producing coffee beans. We then consider the impact on that country of capital flow liberalization.
In the absence of capital flows, a country cannot have net trade flows. Conse- quently, residents have to bear all the country’s risks. If they produce only cof- fee beans, any shock to the price at which they can sell coffee beans affects the country’s income in direct proportion to the size of the crop. Any damage to the crop also affects the country’s income directly. Since the price of coffee beans is quite volatile and crop yields can vary unexpectedly, the country’s in- come would be quite volatile if it devoted all its resources to producing coffee beans. To avoid this volatility, the only solution in the absence of capital flows is to diversify production. This means that the country produces other goods even though it is less efficient at doing so. In the interest of smoothing its income, the country therefore limits the extent to which it takes advantage of the benefits of international trade.
In a country with a market economy, the channel through which production will be directed away from the coffee bean industry is the stock market. In the stock market, investors are rewarded for bearing risk with a risk premium. A stock‘s risk premium is the expected return of the stock in excess of the return of an investment that has no risk. For instance, the average annual risk premium on the U.S. stock market from 1926 to 1990 was 6.1 percent. Because coffee bean production leads to volatile returns, investors require a high risk premium to invest in that industry and a lower risk premium to invest in industries that provide diversification from the coffee bean industry. As a result, industries that provide diversification from the coffee bean industry are able to obtain capital at low cost. They can promise lower returns to investors because invest- ing in them reduces portfolio volatility. The low cost of capital in industries that allow investors to diversify the return on their investments makes it possible for these industries to compete successfully against imports. As a result of this diversification effect, the country produces in industries for which it does not have a comparative advantage.
Consider now the impact on that country of allowing unrestricted capital flows and assume that there is no dark side to capital flows. Immediately, as investors learn that capital flows will be allowed, the risk premium in the coffee bean in- dustry falls. As investors throughout the world invest in the country’s coffee bean
1. Even before the recent crises, prominent economists advocated various kinds of taxes to limit international trade in securities in order to decrease speculative capital flows. See Summers and Summers (1989) and Tobin (1978).
262 Rent5 M. Stulz
production, they find that good events in that industry mostly offset bad events in their portfolios so that investing in coffee bean production actually reduces the risk of their portfolios. This means that the risks associated with coffee bean production are largely diversifiable internationally, so that the world capi- tal markets require a much smaller risk premium to bear such risks and might require no risk premium at all. As the risk premium for the coffee bean industry falls, the country invests more in that industry. Simultaneously, the local indus- tries that helped residents diversify their coffee bean production risks no longer offer that benefit to residents since residents can diversify internationally. Con- sequently, these industries may well contemplate an increase in their cost of capital and decreased investment. Once this process is completed, the country might specialize in the industry for which it has a comparative advantage.
We have shown that capital market liberalization leads to a reallocation of capital across industries. Obstfeld (1994) showed that this is not the whole story. Because the risks of a country’s production can be diversified internation- ally after capital market liberalization, production technologies that were too risky before liberalization become advantageous because their risks can be di- versified internationally. Hence, if riskier technologies are those with higher expected output, liberalization makes it possible for a country to shift to riskier production technologies and hence experience higher growth.
To have a better understanding of the transition from complete segmentation to a completely open capital market, it is helpful to use a numerical example. Suppose a country specializes in coffee bean production, the average annual value of the crop is $1 billion, and the annual volatility is $400 million. This means that each year there is a 5 percent probability that the country’s income is below $340 million (assuming that the value of the crop is normally distrib- uted). The country therefore experiences high income volatility. To simplify the discussion, let’s assume that all the income accrues to capital. Because of the high volatility, suppose that investors require a risk premium of 10 percent for investments in the coffee bean industry and that the risk-free interest rate is 10 percent. This means that domestic residents are willing to invest in the coffee bean industry only if they expect to earn 20 percent annually, the sum of the rate that they receive on investments without risk plus the risk premium. The only way they can expect to earn 20 percent annually by investing in cof- fee bean production is if the value of the industry is the present value of a cash flow stream of $1 billion a year discounted at the rate of 20 percent. Conse- quently, the value of the coffee bean industry is $5 billion. An industry whose cash flows do not move with the cash flows of the coffee industry would have little risk for an investor heavily invested in the coffee bean industry and that investor would require a low risk premium to invest in that industry. Hence, that industry could raise funds promising an expected return to investors close to 10 percent. A dollar of annual average income from that industry is therefore worth $10.
Consider now the impact of an extremely successful liberalization, so that
263 The Role of Equity Markets in International Capital Flows
the risk of the production of coffee becomes a risk diversified in portfolios throughout the world. The risk premium on the coffee industry almost disap- pears, so that the present value of the perpetuity of $1 billion is now close to $10 billion. In other words, liberalization has a dramatic effect on the equity market capitalization. At the same time, however, the diversifying industry might now face a risk premium of 5 percent, so that its cost of capital increases from 10 percent to 15 percent. A dollar of average income in that industry falls from $10 to slightly more than $6. As with trade liberalization, not everybody benefits from capital market liberalization. However, as with trade liberaliza- tion, those who gain can compensate those who lose in such a way that every- body is made better off.
The decrease in the cost of capital has three effects on the coffee industry. First, it increases the value of the expected cash flows from existing invest- ments since these expected cash flows are discounted at a lower rate. Second, it makes investments profitable that were not profitable at the higher cost of capital. Thus there will be an investment boom in the coffee industry. The third effect is that new investors will come to the industry and monitor firms in that industry.* These investors will have new ideas and will want to influence the actions of firms to make sure that their investments are profitable. Foreign in- vestors will therefore improve corporate governance in the coffee industry, which will increase the value of the industry.
Our analysis of opening up security markets in a country has four empirical implications: (1) foreign investors acquire domestic securities; (2) domestic valuations increase; (3) the cost of capital falls; and (4) growth increases. We now consider the empirical evidence on these four implications. We focus on capital account liberalizations in developing economies both because of their intrinsic interest and because they constitute well-defined events.
Liberalization and Foreign Investment
Our analysis of liberalization assumes that foreign investors invest in the liberalized market rapidly. If this does not happen, no risk sharing takes place and asset prices do not increase. It is well known that holdings of foreign se- curities are small within portfolios of investors in developed countrie~.~ Con- sequently, most of a developed country’s equity is held by domestic residents. For instance, according to the NYSE 1996 fact book, foreigners held about 6 percent of U.S. equity at the end of the third quarter of 1996 (NYSE 1997,59). This so-called home bias in portfolios implies that, even though portfolio flows have been large, domestic investors still have to bear a large fraction of the risks associated with domestic production. This limits the extent to which the cost of capital falls following liberalization.
Empirically, portfolio flows grow significantly as liberalization occurs. Kim
2. See Stulz (1999) for an analysis of the corporate governance benefits of globalization. 3. See Cooper and Kaplanis (1994), French and Poterba (1991), and Tesar and Werner (1994).
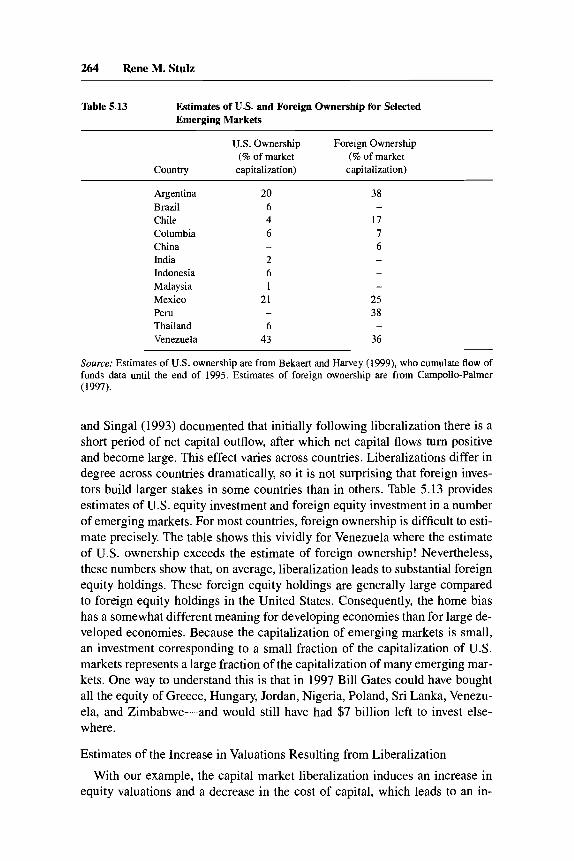
264 Rene M. Stulz
Table 5.13 Estimates of U.S. and Foreign Ownership for Selected Emerging Markets
U.S. Ownership Foreign Ownership (8 of market (% of market
Country capitalization) capitalization)
Argentina 20 Brazil 6 Chile 4 Columbia 6 China -
India 2
38
17 7 6
-
- Indonesia 6 -
Mexico 21 25 Peru - 38 Thailand 6 -
Venezuela 43 36
Malaysia 1 -
Source: Estimates of U.S. ownership are from Bekaert and Harvey (1999), who cumulate flow of funds data until the end of 1995. Estimates of foreign ownership are from Campollo-Palmer (1997).
and Singal (1993) documented that initially following liberalization there is a short period of net capital outflow, after which net capital flows turn positive and become large. This effect varies across countries. Liberalizations differ in degree across countries dramatically, so it is not surprising that foreign inves- tors build larger stakes in some countries than in others. Table 5.13 provides estimates of U.S. equity investment and foreign equity investment in a number of emerging markets. For most countries, foreign ownership is difficult to esti- mate precisely. The table shows this vividly for Venezuela where the estimate of U.S. ownership exceeds the estimate of foreign ownership! Nevertheless, these numbers show that, on average, liberalization leads to substantial foreign equity holdings. These foreign equity holdings are generally large compared to foreign equity holdings in the United States. Consequently, the home bias has a somewhat different meaning for developing economies than for large de- veloped economies. Because the capitalization of emerging markets is small, an investment corresponding to a small fraction of the capitalization of U.S. markets represents a large fraction of the capitalization of many emerging mar- kets. One way to understand this is that in 1997 Bill Gates could have bought all the equity of Greece, Hungary, Jordan, Nigeria, Poland, Sri Lanka, Venezu- ela, and Zimbabwe-and would still have had $7 billion left to invest else- where.
Estimates of the Increase in Valuations Resulting from Liberalization
With our example, the capital market liberalization induces an increase in equity valuations and a decrease in the cost of capital, which leads to an in-
265 The Role of Equity Markets in International Capital Flows
crease in investment. Because of the home bias, the economic importance of these effects of liberalization is an empirical issue. It is relatively straightfor- ward to look at stock market returns and evaluate whether they are unusually high at the time a country liberalizes. We will see that it is harder to figure out whether the cost of capital falls.
The large returns on emerging markets over the past fifteen years are well known. For instance, from December 1984 to December 1994 the real value of emerging market equity increased by 202 percent; in comparison, the S&P 500 increased by 93.5 percent. These large returns are in part responsible for the interest of portfolio managers in these markets. Since so many liberaliza- tions took place during that period, the performance of emerging markets is consistent with the theoretical prediction of increases in equity valuations ac- companying liberalization. However, stock market valuations are not affected by liberalization of capital flows only. Liberalization of capital flows is often accompanied by other events affecting the economy that liberalizes. For in- stance, the economy might have a new political regime that is market oriented and undertakes extensive domestic reforms that increase stock market valua- tions. Also, the performance of the stock market depends on how the economy is performing, so macroeconomic conditions have to be taken into account.
To assess the effect of liberalization on equity valuations, it is therefore im- portant to pay close attention to other events that take place in the country that liberalizes its markets. This task is made more difficult by the fact that liberalization is rarely a one-shot event. Countries liberalize some aspects of their markets at one time and others at some other time. Henry (1999b) pain- stakingly identified individual economic reform and capital flow liberalization events that affected twelve emerging markets. Presumably, by the time the lib- eralization takes place, its effects are already incorporated in stock prices be- cause investors have been aware of it for some time. It turns out that for the seven months preceding the first liberalization, equity returns are about 40 per- cent after adjusting for world market equity returns. However, once Henry (1999b) controlled for other events that affect these economies and for macro- economic conditions, he concluded that the effect is on the order of 18 percent. He found an effect of 16 percent for subsequent liberalizations. This suggests a cumulative effect of about 37 percent.
The Impact of Liberalization on the Cost of Capital
The evidence of Henry (1999b) shows that capital flow liberalization has a large effect on equity valuations. In our earlier analysis, we argued that liberal- ization, by reducing the cost of capital, can have such an effect. The question that arises out of Henry’s evidence is how large the impact of liberalization is on the cost of capital. Suppose that the reevaluation effect is 37 percent. In this case, the reevaluation takes $1 invested in a market and brings it to $1.37. This reevaluation captures all the effects of liberalization discussed earlier. Since the decrease in the cost of capital also makes new investments profitable, the
266 Reni M. Stulz
$.37 reevaluation is an upper bound on the impact of the decrease in the cost of capital. This upper bound implies that a country where the cost of capital for a project of typical risk was 20 percent now has a cost of capital of no less than 16.6 percent. In other words, the cost of capital of that country falls at most by 17 percent.
The sharp stock market increase associated with liberalization suggests that it might be straightforward to measure directly the impact of liberalization on the cost of capital. It turns out that this is not an easy task. The equity cost of capital is the expected return that investors anticipate from equity investments. As this cost falls, entrepreneurs can raise more funds for a project. Measuring the return that investors expect on equity is a difficult undertaking. One might be tempted to use past returns to forecast future returns. However, this strategy is not possible in the case of markets that undergo a liberalization. For such markets, the past returns are those appropriate for the segmented economy that no longer exists following liberalization. To complicate things further, past average returns for such markets are high for two reasons. First, segmented markets have higher risk premiums because domestic investors have to hold more domestic equity than they would in the absence of segmentation. Second, as discussed, liberalization boosts equity valuations as the cost of capital falls. Hence, the prospect of lower expected returns on equity has the paradoxical implication of increasing average returns on equity when measured over the liberalization period. This is because the expected cash flows on equity are discounted at a lower rate.
A second strategy to estimate the change in the cost of capital is to assume that following liberalization the expected return is determined by how the risk of equity is priced in global markets. To do this, one has to posit a model of how risk is priced in global markets and one has to assume that this model applies to equities of liberalized markets. For such an approach to make sense, one has to believe that it is reasonable to treat the world as if liberalized mar- kets form one big market where capital flows freely across markets to equal- ize risk-adjusted returns. To proceed further, we therefore have to consider whether it is reasonable to think of the world of liberalized markets as one big market.
If investors can move capital freely across countries, they can diversify their portfolios internationally. This means that risks that are specific to small coun- tries typically do not matter much in their portfolios. If their investments in one small country do poorly because of events specific to that country, their investments in another small country might be doing well. On balance, there- fore, these risks offset each other. By diversifying internationally, investors can form a portfolio that has a lower volatility for a given expected return. Since investors would rather bear less risk than more, they should prefer this strategy. A reasonable measure of the gain that American investors can make by diver- sifying internationally was provided by DeSantis and Gerard (1 997). They showed that as of 1994 a portfolio diversified internationally among ten major
267 The Role of Equity Markets in International Capital Flows
developed economies had the same volatility as a well-diversified portfolio of American equities but the annual expected return was higher by about 2.5 per- cent. Adding emerging markets to this portfolio would lead to further gains from diversification. For a portfolio to be well diversified internationally, how- ever, its holdings have to be in the same proportions as the capitalization of securities from each country. A portfolio that holds the same proportion of the capitalization of each security in the world is called the world market portfolio. Hence, since emerging markets represent about 12 percent of world market capitalization, a well-diversified portfolio has an investment of about 12 per- cent in emerging markets.
An investor who holds a portfolio that is well diversified internationally measures the risk of a security by its contribution to the volatility of that portfo- lio. As the volatility of her portfolio increases, she bears more risk. Hence, she is only willing to hold a security that contributes significantly to the volatility of the portfolio if she receives enough of a reward in the form of a risk pre- mium. A security contributes more to the volatility of her portfolio if that secu- rity moves more together with the other securities in the portfolio. Such a secu- rity has little diversification value since, if the portfolio performs poorly, that security is highly likely to perform poorly also. A security can have high vola- tility and yet have little co-movement with the portfolio. The investor will not be concerned about the volatility of such a security because most of the ran- domness of its return will be diversified away in the portfolio.
The part of the return of a security that cannot be diversified away is the part that moves with the return of the whole portfolio. Financial economists call this part of the return of a security its systematic risk. A simple model of the risk of securities in markets where capital flows freely is the international capi- tal asset pricing model, which states that the return of a security in excess of the risk-free rate is equal to the systematic risk of that security times the risk premium on the world market portfolio.4 The measure of the systematic risk of a security for a well-diversified investor is the degree to which it moves with the world market portfolio. For instance, if the world market portfolio has a 1 percent return, one can expect the U.S. market portfolio to have a 0.84 percent return while the Argentinian market portfolio is only expected to return 0.19 pe r~en t .~ Consequently, the U.S. market portfolio has substantially more sys- tematic risk than the market portfolio of Argentina and should earn a higher expected return. A security that covaries more with the world market portfolio must promise investors a higher expected return because it has more risk that investors cannot diversify away. With this model, the equity cost of capital is equal to the risk-free interest rate plus the systematic risk of the security times the risk premium of the world market portfolio. If we take the risk premium of the world market portfolio to be 6 percent, the Argentinian market portfolio
4. See Stulz (1995) for a detailed analysis of the theory and empirical tests of it. 5. These estimates are from Erb, Harvey, and Viskanta (1996).
268 Ren6 M. Stulz
would be expected to earn 1.14 percent in excess of the risk-free rate and the U.S. market portfolio 5.4 percent.
The international capital asset pricing model has been tested extensively with some degree of success, especially among developed countries. There is clear evidence that the returns of securities are related to their systematic risk. Countries whose markets covary more with the world market have higher eq- uity returns on average, as predicted. At the same time, however, such a simple model has limitations. There are regularities that it cannot explain. For in- stance, it understates the required return from small firms and tends to overstate the required return from growth firms. Part of the difficulty for the model is that countries still have obstacles to capital flows. Nevertheless, the clear lesson from the empirical evidence is that, for countries whose capital markets are fairly open, the primary determinant of the valuation of securities is their risk as measured on international capital markets.
Like Argentina, most emerging markets have traditionally had little system- atic risk. As these markets liberalize, the valuations of their securities are in- creasingly determined on international capital markets. As a result, valuations increase because the securities do not have much systematic risk. It is not the case, however, that these markets become completely integrated into world markets as soon as they liberalize. Liberalizations are generally partial, and there is always a risk that a country will adopt new restrictions on capital flows. Hence, the expected returns on emerging market common stocks are best de- scribed as a mix between expected returns determined on world markets and expected returns determined on local markets, with the mix changing over time." If liberalizations were complete and credible and if there were no home bias, liberalizations would have a more dramatic effect on stock returns. Going back to our example where we argued that the empirical evidence suggests a fall in the cost of capital of 17 percent, one would expect the cost of capital to fall from 20 percent to about 10 percent rather than to 16.66 percent if the li- beralized market became completely integrated into world capital markets. In this case, a liberalization would more than double equity valuations.
Bekaert and Harvey (1999) proposed a third approach to investigate the im- pact of liberalization on the cost of capital. They argued that the ratio of the dividend to the share price is a good proxy for the cost of capital. They then investigated how this proxy changes as a country liberalizes. Generally, they found that liberalization decreases the cost of capital by a relatively small amount (less than 100 basis points). Compared with the predictions one ob- tains from the applying the international capital asset pricing model, the esti- mates of Bekaert and Harvey ( 1 999) are surprisingly small. Though the esti- mates implied by the work of Henry (1999b) are somewhat larger, they are also small compared to the predictions from the international capital asset pric- ing model. A plausible explanation is that the impact of liberalization on the
6 . See Bekaert and Harvey (1995) for a model of how this mix changes over time
269 The Role of Equity Markets in International Capital Flows
cost of capital is limited because of the extent of home bias. If foreign investors do not buy the equity of liberalized countries, the cost of capital for that coun- try does not de~ l ine .~
One last point should be made. As investors become better able to diversify their portfolios internationally, they bear less risk. If investors require more compensation to bear more risk, this means that the compensation for risk falls. Hence, greater globalization of capital markets implies a fall in the cost of capital everywhere because the risk premium on the world market portfo- lio falls.
The Impact on Growth
From our analysis, liberalization decreases the cost of capital. This should lead to an increase in growth because investment projects that were not advan- tageous before liberalization become advantageous afterward. Henry (1999a) provided direct evidence on this issue. He showed that liberalization induces an increase of 23 percent in private investment the year following liberalization and an increase of 24 percent the year after that. He also found that his estimate of the stock market effect of liberalization helps predict the increase in invest- ment following liberalization.
We have seen that globalization increases stock market valuations, increases growth, and increases welfare. The question we have to address is whether there is a dark side of globalization that negates or even dwarfs these positive effects. We have proceeded as if capital markets work efficiently in allocating capital to its best uses. Instead, those concerned about capital flows are likely to believe Bhagwati’s argument that “only an untutored economist will argue that, therefore, free trade in widgets and life insurance policies is the same as free capital mobility. Capital flows are characterized, as the economic histor- ian Charles Kindleberger of the Massachusetts Institute of Technology has famously noted, by panics and manias” (1998, 8). The panics and manias are generally presumed to translate into contagion effects and volatility effects of capital flows. We therefore investigate the concerns about contagion in the next section and those about volatility in section 5.2.3.
5.2.2 How Do Changes in One Market Affect Other Markets?
With free capital flows, markets are connected. Investors who think that one market will have higher returns can move their investments to that market. Some have argued that this connection implies that markets move together more than they would if they were segmented. As investor sentiment changes in one large country, they argue, this change affects stock returns throughout the world irrespective of fundamentals. This view suggests that stock moves
7. See Stulz (1999) for a simple model showing the relation between the cost of capital impact of liberalization and the extent of home bias.
270 Re& M. Stulz
are contagious. To evaluate this claim, it is important to understand what moves stock prices. In section 5.2.1 we thought of stock prices as the present value of cash flows. Consequently, stock prices can change because expected cash flows change or because of changes in discount rates. The discount rate is the risk- free rate plus a risk premium. This means that the discount rate can change be- cause of interest rates or risk premiums.
In global markets, the risk premium is determined globally. For instance, the risk premium on U.S. stocks is not determined in the United States alone. Chan, Karolyi, and Stulz (1992) documented that the risk premium on U.S. stocks and the risk premium on Japanese stocks are clearly connected, so that changes in the risk premium on Japanese stocks also affect the risk premium on U.S. stocks. This effect naturally induces co-movements in stock prices across the world, and it does not imply that investors are irrational or that stock prices disregard economic fundamentals. It does mean, however, that US. stock prices can change in circumstances where, if the United States were an isolated country, they would not change. We now examine stock price co- movements and whether they have changed as capital flows became less re- stricted.
Have Co-movements Increased over Time?
Much of the analysis of stock price co-movements has focused on one mea- sure of co-movement, namely, the correlation of stock returns, which takes values between -1 and +l. 'Ifrpically, well-diversified portfolios of U.S. stocks have a correlation close to one. Historically, however, correlations of foreign indexes with the US. market have been small, especially for emerging markets, where they often have been indistinguishable from zero. At the same time, though, these correlations change over time. This makes it difficult to figure out whether correlations are greater now than they used to be. This task is further complicated by the fact that these correlations are not well under- stood. Although many authors have tried to construct models that explain how they change over time and how they differ across countries, this literature has had little success. Table 5.14 provides a comparison of correlations of stock markets with the world market portfolio over two periods. One period is the sample period for which returns were available. The other period corresponds to the first five years of the 1990s (April 1990 to March 1995). Correlations have changed, but some increased and others decreased. The average correla- tion is .35 for the whole sample period and .41 for 1990-95. Hence, on aver- age, correlations increased, but not by much. Many recent papers have looked at the issue of whether correlations have increased over time using sophisti- cated statistical techniques.8 There is evidence of an increase in correlations, but the extent of this increase differs across studies and some studies do not report an increase. One important issue that affects the conclusions of the ex-
8. See Karolyi and Stulz (1996) for references.
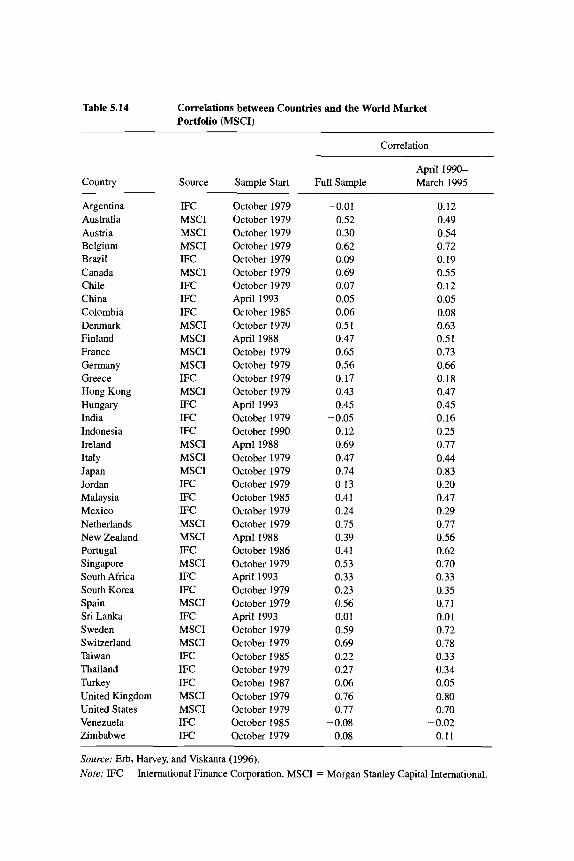
Table 5.14 Correlations between Countries and the World Market Portfolio (MSCI)
Correlation
April 1990- Country Source Sample Start Full Sample March 1995
Argentina Australia Austria Belgium Brazil Canada Chile China Colombia Denmark Finland France Germany Greece Hong Kong
India Indonesia Ireland Italy Japan Jordan Malaysia Mexico Netherlands New Zealand
Singapore South Africa South Korea Spain Sri Lanka Sweden Switzerland Taiwan Thailand Turkey United Kingdom United States Venezuela Zimbabwe
Hungary
Portugal
IFC MSCI MSCI MSCI IFC MSCI IFC IFC IFC MSCI MSCI MSCI MSCI IFC MSCI IFC IFC IFC MSCI MSCI MSCI IFC IFC IFC MSCI MSCI IFC MSCI IFC IFC MSCI IFC MSCI MSCI IFC IFC IFC MSCI MSCI IFC IFC
October 1979 October 1979 October 1979 October 1979 October 1979 October 1979 October 1979 April 1993 October 1985 October 1979 April 1988 October 1979 October 1979 October 1979 October 1979 April 1993 October 1979 October 1990 April 1988 October 1979 October 1979 October 1979 October 1985 October 1979 October 1979 April 1988 October 1986 October 1979 April 1993 October 1979 October 1979 April 1993 October 1979 October 1979 October 1985 October 1979 October 1987 October 1979 October 1979 October 1985 October 1979
-0.01 0.52 0.30 0.62 0.09 0.69 0.07 0.05 0.06 0.51 0.47 0.65 0.56 0.17 0.43 0.45
-0.05 0.12 0.69 0.47 0.74 0.13 0.41 0.24 0.75 0.39 0.41 0.53 0.33 0.23 0.56 0.01 0.59 0.69 0.22 0.27 0.06 0.76 0.77
-0.08 0.08
0.12 0.49 0.54 0.72 0.19 0.55 0.12 0.05 0.08 0.63 0.51 0.73 0.66 0.18 0.47 0.45
-0.16 0.25 0.77 0.44 0.83 0.20 0.47 0.29 0.77 0.56 0.62 0.70 0.33 0.35 0.7 1 0.01 0.72 0.78 0.33 0.34 0.05 0.80 0.70
-0.02 0.11
Source: Erb, Harvey, and Viskanta (1996). No&: IFC = International Finance Corporation. MSCI = Morgan Stanley Capital International.
272 RenC M. Stulz
isting studies is that some include the crash of 1987 and others do not. Over a short period of time in 1987, markets moved together by extremely large amounts. Including data from that period has the effect of increasing correla- tions. Hence one's conclusion about the evolution of correlations depends on whether or not one takes into account the crash. DeSantis and Gerard (1997) examined the correlation between the U.S. market and an equally weighted portfolio of nine other large developed markets. They used a statistical model to estimate monthly correlations. Their sample period was January 1970 through December 1994. The twenty lowest correlation estimates are all from before 1980. Sixteen of the twenty largest correlations are from after 1980. Their evidence shows that there is high correlation in periods of extremely low stock returns. Their average correlation is .56. However, the S&P 500 dropped by 29.42 percent from September to November 1987. They reported their high- est correlation, .76, for that period. The second highest correlation they re- ported is during the period from January 1973 to September 1974, when the stock market dropped 45.06 percent. There is now considerable evidence that correlations are high in bear markets. It is difficult to attribute this to liberaliza- tion since correlations were high during the bear market of the 1970s also. This phenomenon creates concerns about the benefits of international diversifica- tion, however. Our analysis in section 5.2.1 argued that the benefit of inter- national diversification is that some countries do well while others are doing poorly. If correlations are high during bear markets, this suggests that countries are more likely to do poorly at the same time, which reduces the benefits from international diversification.
What about correlations for emerging markets? In table 5.14 the average correlation for the emerging markets is .17 for the whole sample period, which is roughly half the average correlation for all countries and confirms that emerging markets have much lower correlations with the world market port- folio than developed economies. For 1990-95, the average correlation for the emerging markets is .22, which is still close to half the correlation for the whole sample. There is therefore an increase in correlations of emerging mar- kets, but correlations among developed markets increased proportionally by roughly the same amount. In an interesting paper, DeSantis (1993) looked at the correlations of markets in the World Bank's emerging markets database over two periods. The first period was 1976-84 and the second 1984-92. He found that the average correlation is essentially the same for these two subpe- riods. Looking at the correlation of the United States with these markets, he found a slight increase. The average is a trivial .038 for the first subperiod and ,132 for the second subperiod. The second subperiod contains the crash of 1987, however. Again, this evidence suggests a slight increase in correlations, but the increase seems slight enough that some might conclude there is no change. In a recent study, Bekaert and Harvey (1999) estimated a model that allows correlations between emerging markets and the world market to change over time. They then estimated correlations before and after liberalization. Out
273 The Role of Equity Markets in International Capital Flows
of seventeen emerging markets, they found the correlation with the world mar- ket to be higher for nine markets. This result seems to provide, at best, weak evidence that correlations increase after liberalization. We discuss below the increase in correlations during crisis periods. Adding the past two years, which correspond to a crisis period, to the samples of the studies discussed here would lead to higher correlation estimates.
Though there is little evidence of strong increases in equity return correla- tions before the Asian crisis, there is evidence of dramatic increases in correla- tions between bond yields. Goldstein and Folkerts-Landau (1994) provided correlations between ten-year yields in the seven largest developed economies and the U.S. ten-year bond yield. For the period 1970-79, the average monthly correlation excluding Canada is .41. This average correlation increases to .86 from 1980 to 1989 and to .88 from 1990 to 1994. Ilmanen (1995) showed evi- dence that there is a strong common factor in interest rate movements across de- veloped countries. One view of this increase in correlations is that, as markets become more integrated, investors give little room to monetary authorities to pursue policies that lead to sharply divergent interest rate movements. It is unclear, however, why the growing integration of markets would affect nomi- nal yields rather than expected real yields.
Is There Causation?
Many papers have been written trying to determine whether stock price changes in one market lead to stock price changes in another market. Initially, this research used monthly or weekly data. However, it quickly became appar- ent that such research is difficult to interpret. If prices adjust very quickly, there is little hope of finding relationships using infrequently measured data. If a shock to U.S. prices is transmitted to the rest of the world within twenty-four hours, this transmission is obscured by using monthly data. Weekly or monthly data might also yield spurious effects. Not all stocks trade frequently. Infre- quent trading of some stocks can give the impression that one market leads another. To see this, suppose that the U.S. stock market drops by 20 percent during one month and one looks at whether this knowledge helps explain the return on foreign markets the following month. One would expect foreign stocks to fall contemporaneously to the extent that the U.S. stock market drop is brought about by some adverse event that affects the whole world. For in- stance, there could be bad news about the U.S. economy, which would reduce equity values throughout the world to some extent since firms would not be able to sell as much to the United States as expected. However, if some foreign stocks trade infrequently, the effect of bad news on their prices will be recorded only when they trade. Hence, if some foreign stocks do not trade when bad news occurs, they will record a drop subsequent to the drop in the United States, leading to the wrong impression that the U.S. drop caused the drop abroad, when in fact both drops were caused by the same bad news.
The difficulty of interpreting results using weekly and monthly returns has
274 Renk M. Stulz
led to the use of data of much higher frequency. Some of this research focuses on returns for periods when stock markets are open and periods when they are closed. Other research measures returns over even shorter periods of time. The opening hours for the U.S. and Japanese stock markets do not overlap. Over a twenty-four hour period, the Japanese market opens first and closes before the U.S. stock markets ever open. Japanese returns contain information about U.S. stock returns because the markets are correlated. A rough estimate is that a 10 percent increase in Japanese markets on average corresponds to a 3 percent increase in U.S. markets. However, all the information contained in the Japa- nese return during trading hours should be incorporated in U.S. stock prices at the time that the market opens in the United States. This means that the 10 percent Japanese market increase of our example should have no information about the U.S. market return during the US. trading day. The evidence is that most of the effect of the 10 percent Japanese market increase will be incorpo- rated in U.S. stock prices by the time the market opens.
This research has also examined whether unexpected increases in volatility spill over across markets. The question asked is whether unexpectedly high volatility in the United States, when the U.S. market is open, leads to high volatility in Japan. This seems to be the case. It seems further that this effect is symmetric across the world: unexpected volatility in the United States leads to higher volatility in Japan, and unexpected volatility in Japan leads to higher volatility in the United States. One might be tempted to attribute this volatility spillover to the increased flow of capital and hence to the greater connections across markets. However, this literature finds greater evidence of spillovers in data before the crash of 1987 than after. One possible explanation is that many of the spillover effects documented in the literature were spurious, resulting from infrequent trading. There is substantial evidence that since the crash informa- tion has been incorporated in prices much faster, at least in the United States.
The problem with both the return and the volatility evidence is that it is consistent with two hypotheses that have dramatically different implications for the efficiency of financial markets. One hypothesis is that the Japanese and U.S. markets have common components, and spillovers reflect these common components. Under this hypothesis, spillovers show that markets incorporate information efficiently. The second hypothesis is that spillovers are the work of uninformed investors who overreact to news in one market, corresponding to a change in ~entiment.~ They become more risk averse following bad news and less risk averse following good news, regardless of the fundamentals of their own market. With this view, there is contagion. The lack of spillover re- versals is evidence against the uninformed investor hypothesis. Lin and Ito (1994) devised an additional test that makes it possible to distinguish between the two hypotheses. They pointed out that uninformed traders who become
9. De Long et al. (1990) developed a theory of uninformed investors moved by sentiment and showed that such investors can affect asset prices in equilibrium.
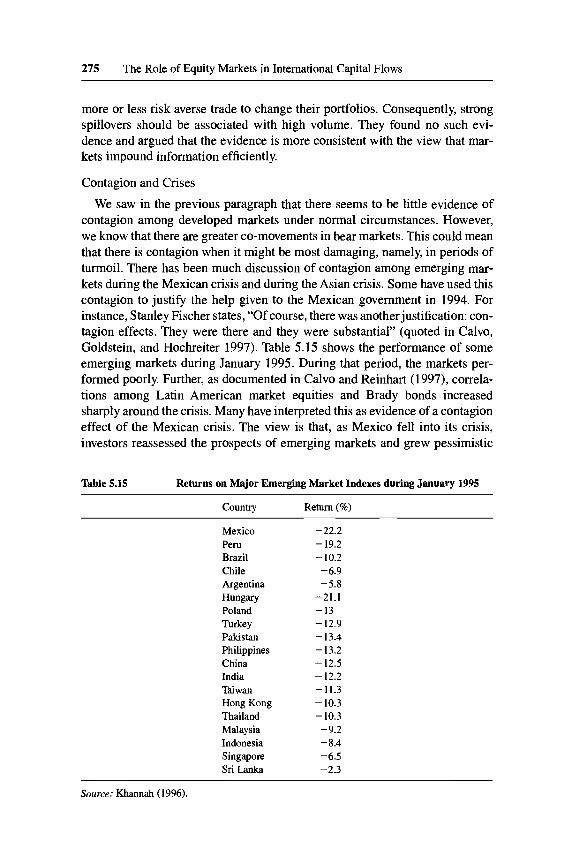
275 The Role of Equity Markets in International Capital Flows
more or less risk averse trade to change their portfolios. Consequently, strong spillovers should be associated with high volume. They found no such evi- dence and argued that the evidence is more consistent with the view that mar- kets impound information efficiently.
Contagion and Crises
We saw in the previous paragraph that there seems to be little evidence of contagion among developed markets under normal circumstances. However, we know that there are greater co-movements in bear markets. This could mean that there is contagion when it might be most damaging, namely, in periods of turmoil. There has been much discussion of contagion among emerging mar- kets during the Mexican crisis and during the Asian crisis. Some have used this contagion to justify the help given to the Mexican government in 1994. For instance, Stanley Fischer states, “Of course, there was anotherjustification: con- tagion effects. They were there and they were substantial” (quoted in Calvo, Goldstein, and Hochreiter 1997). Table 5.15 shows the performance of some emerging markets during January 1995. During that period, the markets per- formed poorly. Further, as documented in Calvo and Reinhart (1997), correla- tions among Latin American market equities and Brady bonds increased sharply around the crisis. Many have interpreted this as evidence of a contagion effect of the Mexican crisis. The view is that, as Mexico fell into its crisis, investors reassessed the prospects of emerging markets and grew pessimistic
Table 5.15 Returns on Major Emerging Market Indexes during January 1995
Country Return (a)
Mexico Peru Brazil Chile Argentina
Poland Turkey Pakistan Philippines China India ’IgiWan Hong Kong Thailand Malaysia Indonesia Singapore Sri Lanka
Hungary
-22.2 - 19.2 - 10.2 -6.9 -5.8
-21.1 - 13 - 12.9 - 13.4 - 13.2 - 12.5 - 12.2 -11.3 - 10.3 - 10.3 -9.2 -8.4 -6.5 -2.3
Source: Khannah (1996).
276 Re& M. Stulz
even when there was no basis to do so. Flows to emerging markets slowed markedly immediately after the Mexican crisis, so that some have argued that this slowing was responsible for price drops. In the remainder of this section, we first discuss the economics of contagion and then examine some empirical evidence of the economic importance of contagion associated with the Mexi- can and Asian crises.
The traditional view of contagion has to do with banking panics. The idea is that a bank fails and depositors start withdrawing funds from other banks that are healthy, thereby weakening these banks. For emerging markets, the reasoning is similar, namely, that a shock in one market leads investors to with- draw funds from other markets because of irrational fears. It is certainly the case that some investors behaved that way. Stories of specific investors making obvious mistakes in their analysis of emerging markets have been repeated often.'O Though such stories enliven conferences, they are irrelevant to an as- sessment of contagion. Market prices are the product of the actions of all inves- tors, and the important question is whether aggregate outcomes are efficient. One would expect other investors to take advantage of the opportunities cre- ated by investors who panic. Hence, if there is plenty of arbitrage capital, con- tagion should not be a problem.
Unfortunately, the investment industry is organized in such a way that arbi- trage capital to be used to take advantage of mispricings in emerging markets may be artificially scarce. Most investments in emerging markets are made by institutional investors. Typically, these investments are made because sponsors and clients designate emerging markets as an asset class in which they want to put funds. The investment industry responds to the demand for investment vehicles in an asset class by creating mutual funds and other investment vehi- cles. Consider now how institutional investors can react to lower stock prices brought about by panic selling from uninformed investors. Institutional inves- tors who are not specialized in the emerging market asset class will find it difficult to suddenly start investing in emerging markets to take advantage of investment opportunities created by panicky investors. Institutional investors who are specialized in the asset class face a situation where their resources are weakened by the adverse shock that starts the contagion process and where they may find it difficult to liquidate assets to generate cash to exploit advanta- geous investment opportunities because of turmoil in the markets. Conse- quently, few institutional investors may be able to take advantage of the invest- ment opportunities created by the actions of the uninformed investors. This lack of arbitrage capital creates a situation where valuations depend on the capital committed to an asset class and can create discrepancies between valua- tions across asset classes. For instance, Gompers and Lerner (1997) showed that valuations in the venture capital industry depend on the funds committed to the industry.
10. See, e.g., Wadhwani's comment in Calvo et al. (1997).
277 The Role of Equity Markets in International Capital Flows
Institutional investors specialized in emerging markets face an additional problem that further limits their ability to take advantage of investment oppor- tunities during periods of turmoil, namely, withdrawals of funds by clients. Shleifer and Vishny (1997) cogently argued that clients of institutional inves- tors may not be able to easily assess whether an investment strategy is right and may therefore use short-term returns to guide their investment decisions. For instance, it may be quite difficult for the typical pension fund organization to assess the performance of an asset manager specialized in emerging mar- kets. The manager may have a solid economic argument that explains why current valuations are too low and the best solution is to keep the portfolio unchanged. However, the client may find it difficult to assess whether this argu- ment is correct and may simply change her allocation of funds to the manager based on his recent performance. Consequently, an institutional investor who thinks that stock prices are too low in a particular country may not be able to act on his judgment if his portfolio has done poorly because funds are being withdrawn. In fact, institutional investors may be forced by circumstances to aggravate the contagion rather than exploit it. Facing redemptions, they may have to liquidate assets in healthy countries because those markets are liquid and may therefore adversely affect capital flows in these countries. What cre- ates the contagion in this case, however, is not an excess of speculative capi- tal. Rather, it is that an insufficient amount of arbitrage capital is devoted to an asset class. The contagion arises because of a lack of investors who can pro- vide liquidity to the institutional investors forced to withdraw from a country. Hence, leaders of emerging countries should not complain about the actions of hedge fund managers but rather should complain that there are too few hedge funds. As more institutional investors become authorized to shift funds be- tween developed and emerging markets and across emerging markets, the pos- sibility of contagion induced by forced liquidations of some institutional inves- tors should disappear.
Contagion caused by panicky investors and forced liquidations is self- limiting in equity markets. As prices fall, it becomes more advantageous to hold on to an investment rather than liquidate it. However, in debt markets, the situation is more delicate for those who rely on short-term debt. If investors are reluctant to roll the debt over, promising higher yields may not solve the problem because these higher yields may imply too high a probability of de- fault. As a result, a country or a firm might face a liquidity crisis and be forced to decrease investment because it was cut off from public markets. Obviously, firms and countries that find themselves in such situations chose an imprudent financing policy. Financing with short-term debt amounts to betting that one’s credit will not deteriorate. Sometimes it does. When it does, those that finance with short-term debt face problems whether the change in the perception of credit quality is driven by contagion or not. If the change in credit quality is driven by poor economic prospects for a firm or a country, it should contract investment. However, if economic fundamentals are solid, contraction is not
278 RenC M. Stulz
appropriate. Unfortunately, contagion can lead to costly liquidation of invest- ments that represents a waste of resources.
When there are few creditors, they can get together and realize that the ap- propriate solution to a liquidity crisis is to restructure the debt. By doing this, the creditors make it more likely that they will be paid back. When the number of creditors is large, this coordination is no longer possible. A provider of li- quidity of last resort can solve the problem by providing temporary loans. However, the existence of such a provider may lead to the problem in the first place. In the absence of such a provider, different funding strategies would be used to reduce the risk of a liquidity crisis. The existence of a provider of li- quidity of last resort may also aggravate contagion. Presumably, the provider has limited resources; if these resources are deployed to help one country, they are not available to other countries. Consequently, a crisis in one country re- duces the credit of other countries that might need the help of the provider of liquidity of last resort.
Empirical evidence derived by Calvo and Reinhart (1997) shows that the capital accounts of developing economies are negatively related to the U.S. ex post real rate of interest. This shows that there is a common factor in these capital accounts. The existence of common factors is not, however, evidence of irrational contagion. In the absence of a careful model that shows what the capital accounts of these economies would be in the absence of contagion, there is no way that correlations among capital accounts caused by the exis- tence of common factors can be attributed to contagion. For instance, histori- cally the U.S. stock market increases when interest rates fall. It could be per- fectly rational for U.S. investors to invest more in developing economies when their wealth increases.
Contagion does not require changes in capital flows to sharply decrease the value of financial assets. This is because public information affects stock prices without trades in stocks. To see this, consider the Mexican crisis. All investors could observe the events taking place. When an adverse event has taken place, investors will not buy stocks at the prices prevailing before the event. On aver- age, one would expect the price of the first trade taking place after the event to incorporate the information revealed by the event. At the very least, equity prices would reflect the event very quickly, and there is no reason for massive sales to take place for equity prices to reach their new value. If the stock price adjustment process is quick, it is very difficult to find evidence that information in one country caused markets in other countries to change value irrespective of fundamentals by trying to show that the change in one country preceded the other.
The literature often defines contagion to be an increase in correlations among country indexes in periods of crisis. The reasoning is that correlations among country indexes in noncrisis periods reflect fundamentals, so that if correlations during crisis periods are higher, this must reflect contagion. Rigo-
279 The Role of Equity Markets in International Capital Flows
bon (1998) showed why this reasoning is wrong. Correlations among security returns naturally increase when the volatility of a common factor that influ- ences stock returns increases. For instance, if country indexes are related to the world market index, an increase in the volatility of the world market index implies that country indexes become more correlated with the world market index. Hence, comparing correlations among indexes for periods of different volatility would necessarily lead to the result that correlations are higher when volatility is higher. Consequently, higher correlations during crisis periods do not mean contagion. Forbes and Rigobon (1998) estimated correlation in- creases during the Mexican and Asian crises taking into account the natural increase in correlations during periods of high volatility. Using traditional esti- mates of correlations, they found that the correlation between Hong Kong and Australia was .356 during a period of stability and 365 during the Asian crisis period. The increase in correlation is statistically significant. Adjusting for the impact of the increase in volatility, they found the correlation during the crisis period between Hong Kong and Australia to be .561 rather than 365, and the correlation increase is not statistically significant. Looking at many countries, they found the same pattern, namely, statistically significant contagion when the estimate of the correlation increase ignores the impact of the volatility in- crease and statistically insignificant contagion otherwise. They found similar results looking at the Mexican crisis. For instance, the correlation between Mex- ico and Argentina was .382 during a period of stability and 359 during the crisis period when one ignores the impact of the increase in volatility. However, taking into account the impact of the increase in volatility, the correlation dur- ing the crisis period was SO0 and is not significantly greater than the correla- tion during the period of stability. The analysis of Forbes and Rigobon showed that one cannot argue that the increases in correlations observed during crisis periods are evidence of contagion.
Using daily stock returns does not provide statistically significant evidence of contagion. Often, higher frequency data lead to more powerful tests. A re- cent study by Bailey, Chan, and Chung (1997) investigated the relation be- tween changes in the peso-dollar exchange rate at half-hourly intervals from 21 December 1994 to 30 April 1995 and the returns of Asian and Latin American American Depository Receipts (ADRs) on the NYSE and country funds on the same exchange. They estimated the relation between the half-hour change in a stock and the contemporaneous change in the peso exchange rate as well as the change in the previous half-hour. Not surprisingly, they found a strong con- temporaneous relation between the Mexican ADRs and the peso exchange rate, as well as a strong lagged relationship. However, they also found that a depre- ciation of the peso during a half-hour has a significant adverse effect on non- Mexican Latin American ADRs for the same period as well as for the next period. Essentially, a 1 percent depreciation of the peso is associated with a negative return on non-Mexican Latin American ADRs of -0.15 percent.
280 RenC M. Stulz
There is no effect on Asian ADRs. Looking at closed-end funds, they found a small but significant effect of peso depreciation on Asian country funds and a stronger effect on non-Mexican Latin-American country funds. A 1 percent depreciation of the peso is estimated to reduce the value of Asian country funds by 0.03 percent and the value of non-Mexican Latin American country funds by 0.18 percent. They also explored the impact of the intensity of news an- nouncements on the volatility of ADRs and country funds. Again, they found that non-Mexican Latin American ADRs and country funds experience larger absolute returns when there is news about Mexico during a half-hour.
The findings of Bailey et al. (1997) provide evidence of a tequila effect on the NYSE. Unfortunately, the paper did not attempt to assess how much of the effect is due to information effects and how much is explained by the panic of uninformed investors. Lin and It0 (1994) argued that contagion associated with stock price decreases implies that high correlations are associated with high volume because uninformed investors liquidate their positions. Bailey et al. (1997) provided evidence that can be used to check whether contagion due to uninformed investors was important. They showed that news about the Mexi- can peso and other Mexican news had a strong effect on the volume of Mexi- can ADRs and closed-end funds. However, the same news had little effect on the volume of non-Mexican ADRs and closed-end funds, whether they were Latin American or Asian. From 21 December 1994 to 30 April 1995, Mexican news explained 5 percent of the variation in Mexican ADR volume and 9 per- cent in Mexican closed-end funds volume. In contrast, it explained nothing of the variation in Asian ADR or closed-end fund volume. For Latin American ADR and closed-end funds, Mexican news explained 1.1 percent of the varia- tion in the volume of closed-end funds and 0.3 percent of the variation in vol- ume of ADRs. Though it may be that using different measurement intervals would lead to different conclusions, this evidence is more supportive of the view that Mexican events provided useful information to markets rather than the view that a stampede of uninformed investors harmed valuations by sudden excessive cautiousness.
Another way to consider the economic importance of contagion was pro- vided by Sachs et al. (1996). They examined the reaction of twenty emerging countries to the Mexican crisis. They argued that countries that suffered sig- nificantly from the tequila effect were weak to start with, in that they suffered simultaneously from a weak banking sector, an overvalued currency, and low reserves. In such countries, withdrawals of capital by foreign investors ad- versely affected the currency and endangered the banking sector as the value of foreign-currency-denominated liabilities increased in domestic currency. They argued that in the countries that did not suffer from these problems, the “Te- quila effect left no hangover” (Sachs et al. 1996, 193). They found, however, no additional explanatory power in the magnitude and composition of capital flows before the crisis. In other words, large net portfolio flows did not make a crisis more likely.
281 The Role of Equity Markets in International Capital Flows
5.2.3 Flows and Asset Returns
In section 5.2.1 we saw that liberalization increases valuations and decreases the cost of capital. In section 5.2.2 we saw that there is little evidence of large increases in cross-country co-movements with liberalization and that, while co-movements are larger in bear markets, it is quite difficult to distinguish contagion effects from information effects based on evidence from stock re- turns. In this section, we address the issue of whether changes in valuations can be traced directly to flows. In other words, we try to understand how an ad- ditional dollar of flow affects valuations. This issue is at the heart of the con- cern of whether flows can push up equity prices irrationally only to bring them crashing when foreign capital withdraws unexpectedly. In this view, flows in- crease prices when they come in and decrease them when they leave. Further, they make prices more volatile because they come and go on a whim. From reading some commentators, it would seem that there is little debate about this issue. For instance, Dornbusch and Park argued that “there is ample evidence that financial market opening is likely to increase the volatility of asset prices” (1995,39). The mechanism they had in mind is that foreign investors buy more as prices go up, engaging in what is called positive feedback trading. As they do this, prices keep increasing. Further, they also argued that the interest of foreign investors makes markets more liquid, thereby facilitating speculative trades.
A long tradition in financial economics argues that demand and supply shocks that do not convey information about fundamentals are unimportant. This tradition got its start with Scholes (1972). He showed very carefully that sales of large blocks of stocks have a negligible impact on the stock price when these trades are made purely for liquidity reasons. The reason is straightfor- ward. If the equity of an individual firm becomes underpriced, investors can make money by buying it. Similarly, if equity is overpriced, those who own that equity can make money by selling it. Trades undertaken purely for liquid- ity reasons provide no information about the value of the equity for investors and hence do not change investors’ assessment of the value of the equity. If investors suspect that a large trade is undertaken on the basis of information about the firm, then the large trade will naturally have an impact on the value of the equity as buyers will only buy at a price that protects them from the adverse information the seller has. In this view, the demand for securities is perfectly elastic at given prices as long as information about the securities does not change. This view implies that capital inflows or outflows have an impact on valuations only if they are undertaken because of information that foreign investors have that is not yet incorporated in prices.
Are there any reasons to suspect that foreign investors at times are better informed than domestic investors? This seems unlikely. As already mentioned, it is well known that investors do not take advantage of international diversifi- cation as much as simple models would suggest. There are many possible ex-
282 Rene M. Stub
planations for this phenomenon, but a leading one is that investors are less well informed about foreign securities than about securities of their own country. They are therefore concerned that when they buy equity from foreign investors, they buy the equity that foreign investors believe to be overvalued. A natural protection for investors who diversify internationally is therefore to invest in firms for which information is more easily available. Typically, large firms are the ones for which most information is available.
Unfortunately, data are lacking to test the hypothesis that foreign investors favor large firms. Japan seems to be the only country where data on holdings of equity by foreign investors are easily available at the firm level. Kang and Stulz (1997) demonstrated that foreign investors have a considerable bias to- ward large firm stocks in Japan. Dividing Japanese firms each year into five groups according to firm size, they found that foreign ownership in the smallest firms is 1.8 percent on average from 1975 to 1991; in contrast, ownership in the largest firms is 7.66 percent. This large difference in ownership between small and large firms is not completely attributable to the decrease in the infor- mation advantage of local investors as firm size increases. Most international in- vestment is done by institutional investors. As reported by Falkenstein ( 1 996), institutional investors prefer shares of large firms. These shares have lower transaction costs, are more liquid, and enable investors to make larger trades without affecting share prices. The overall preference of foreign investors for large firms suggests that large firms should have a lower cost of capital. For the case of Japan, Kang and Stulz (1997) found weak evidence that shares in which foreign investment is large have lower average returns.
The Mexican crisis offers another piece of evidence that foreign investors are at an information disadvantage. Whereas some have blamed foreign inves- tors for Mexico’s troubles, careful examination reveals quite a different story. Capital outflows from residents took place throughout 1994, following the as- sassination of the presidential candidate Colosio on 23 March 1994. In con- trast, foreign investors were net buyers of Mexican equity even in December 1994.
Frankel and Schmukler (1996) found an interesting way to look at this issue. They investigated the returns of Mexican closed-end funds that trade in the United States. A closed-end fund typically trades at a price that differs from the value of the portfolio that it represents. The value of the underlying portfolio is called the net asset value (NAV) of the fund. Frankel and Schmukler (1996) reasoned that the price of a fund moves because of its U.S. investors whereas the NAV moves because of Mexican investors since the underlying portfolio is a portfolio of Mexican stocks that trade in Mexico City. They found that the NAV moves before the price of the fund and causes changes in the price of the fund. Their interpretation was that Mexico City moves Wall Street’s assessment of Mexican stocks rather than the reverse.
If foreign investors are less well informed than domestic investors, they will be more sensitive than domestic investors to public announcements. First, pub-
283 The Role of Equity Markets in International Capital Flows
lic announcements are less likely to be news to domestic investors because they are insiders. Second, since foreign investors are less well informed, their assessment of a country is less precise and hence can be altered more by public information. This makes capital flows sensitive to news. Brennan and Cao (1997) modeled this phenomenon and provide supporting evidence. Note that this sensitivity to news implies behavior that is not too dissimilar to that dis- cussed by Dornbusch and Park (1995). If investors react to news strongly, they buy when stock prices are increasing and sell when stock prices are falling. This makes capital flows correlated with contemporaneous returns. However, there seems to be no clear evidence in Brennan and Cao (1997) that investors practice a positive feedback trading strategy in that there is no evidence that high returns are followed by high flows rather than accompanied by high flows. Tesar and Werner (1993) also looked at the issue of the determinants of equity portfolio flows. Unfortunately, they only reported correlations. Nevertheless, their data set also provides evidence of a positive contemporaneous correlation between returns and flows for most Latin American countries and some Asian countries.
Several recent studies examined whether foreign investors are positive feed- back traders, namely, whether they buy following positive returns and sell fol- lowing negative returns. Bohn and Tesar (1996) found evidence of positive feedback trading using monthly data for a large number of countries. Using daily data of trades from the investors who use State Street Bank & Trust as their custodian, Froot, O’Connell, and Seasholes concluded that “there is very strong trend following in international inflows. The majority of the co-move- ment of flows and returns at quarterly intervals is actually due to returns pre- dicting future flows” (1998, 18). Using data from Korea, Choe, Kho, and Stulz (1999) found strong evidence of positive feedback trading among foreign in- vestors in that country in 1997. Surprisingly, however, the evidence of positive feedback trading is weak for the last three months of 1997 when the Asian crisis hit Korea. It seems implausible therefore that the trading practices of foreign investors had much impact on the crisis. Perhaps more important, posi- tive feedback trading need not be destabilizing. For instance, if markets are slow to incorporate information into stock prices, positive returns can be ex- pected to be followed by positive returns. Consequently, positive feedback trading is profitable, but investors who trade that way make markets more effi- cient rather than destabilizing them since they accelerate the incorporation of information into prices.
If domestic investors are better informed than foreign investors, they will hold more domestic shares on average. The reason is that foreign investors discount share prices relative to domestic investors since domestic investors tend to sell if they have adverse information that is not incorporated in asset prices. This means that foreign investors do not take as much advantage of international diversification as they would if all investors had the same infor- mation. This home bias resulting from information asymmetries implies that
284 RenC M. Stulz
the cost of capital in the domestic country is higher than it would be in the absence of these asymmetries because domestic investors bear more risk. As flows leave the country because of bad news, equity prices fall because domes- tic investors have to hold more domestic shares. Inflows have the opposite ef- fect. This means that in such a model flows have an impact on the cost of capital. It is also the case that information asymmetries between domestic and foreign investors increase equity return volatility. There is no reason for flows induced by new information to be destabilizing. As information is revealed, investors change their holdings, which has a permanent effect on prices.
When shares are sold by domestic investors to foreign investors, the shares become held by investors who are internationally diversified and who do not view domestic shares to be as risky as domestic investors do. Unexpected changes in investor composition affect equity prices for two reasons, one per- manent and one transitory. The permanent reason is the one discussed in the previous paragraph, namely, that investors requiring a lower risk premium buy the shares. As foreign investors come to the domestic country, however, there might also be a transitory effect, which is that as they seek to buy the securities, they have to offer domestic investors an inducement so that they will sell. This compensation only affects prices in the short run, and its size depends on the liquidity of the markets. In very liquid markets, the compensation is trivial. As markets become less liquid, it might be substantial. This liquidity compensa- tion has to be paid by investors who seek to buy, as well as by investors who seek to sell. If an investor wants to get out of a country quickly, she has to offer a discount on the shares she wishes to sell. As shown by Campbell, Grossman, and Wang (1993), this liquidity compensation creates reversals in stock prices. When a large group of investors wants to get out of stocks in a market, they have to provide compensation to buyers of their shares in the form of a larger short-term return. Buyers can only obtain this return by buying the shares at a temporarily low price. There is evidence for the United States that such an effect exists, but there is also evidence that it becomes much weaker over time as markets become more efficient."
This liquidity compensation is a cost that investors pay to trade and it affects their trading strategies. In the extreme case, an illiquid market has a lock-in effect: the discount to be paid to get out is too high and therefore investors do not sell and ride out the bad times. Illiquidity can also keep investors out, how- ever. Not surprisingly, international investors tend to hold securities for which this liquidity compensation is small, namely, securities of large firms. Though some have argued that liquid markets promote short-term horizons on the part of investors, which hurt economies, going even so far as to argue that the liquid markets of the United States were a source of competitive disadvantage for the
11. Froot and Perold (1995) documented that the short-term behavior of stock prices is different in recent years from what it has been historically. Yesterday's stock returns have much less informa- tion about tomorrow's stock returns than they used to. Gagnon and Karoiyi (1997) showed that the volume-return relation is much weaker after the crash of 1987 than before.
285 The Role of Equity Markets in International Capital Flows
United States, it is important to remember that liquid markets facilitate pur- chases by investors. Investors who cannot sell in a country have no incentive to invest in that country.
We now look at the evidence of the impact of flows on returns. There is a paucity of empirical evidence at this point. Part of the reason for this is that good data on international flows are hard to find. Before turning to the interna- tional evidence, we first consider some evidence for the United States that uses high-quality data.
There is clear evidence from the United States that changes in the composi- tion of investors can have a direct impact on the value of equity. Over the past twenty years, indexing has become tremendously important and the index cho- sen most often for index portfolios is the S&P 500. Consequently, when a stock joins the S&P 500, this immediately creates a demand for that stock from in- dexers. Standard and Poor’s adds stocks to the S&P 500 based on public infor- mation, so that the fact that a stock is added to the S&P 500 does not reveal information about the true value of the stock. Further, indexers have to buy the stock irrespective of its price on the date that it joins the S&P 500. This means that no information is conveyed by the increased demand for the stock. Ac- cording to the traditional finance model, there should be no price impact when a stock joins the S&P 500. Yet there is such a price impact. Shleifer (1986) and Harris and Gurel(l986) estimated this impact at 3 to 4 percent. Further, all the evidence suggests that this impact is permanent, corresponding to a decrease in the cost of capital for firms that join the S&P 500. The most sensible expla- nation for this effect is that the demand for the stock has increased. Existing investors in the stock do not have a perfect substitute for the stock that they are giving up if they sell, so that the total demand for the stock increases.
Adding a stock to the S&P 500 probably does not affect the overall demand for stocks, Rather, the existing demand gets redistributed across stocks and this redistribution has a price effect. One might argue that such an example un- derstates the importance of changes in demand and that the situation of emerg- ing markets facing an inflow of capital is more akin to what happens when new mutual fund money flows into the U.S. stock market. An inflow of mutual fund money is mostly money that was not invested in the stock market. In an interesting recent study, Warther (1995) argued that the impact of an unex- pected flow of mutual fund money to the U.S. stock market is rather consider- able. His estimates were that a 1 percent increase in mutual fund stock assets, which for his sample period corresponds to an inflow in the stock market of $4.57 billion, brings about an increase of 5.7 percent in stock prices. His con- cern was naturally whether this is a reversible price impact due to liquidity or a permanent price impact. Though he looked hard to find reversals, he was not successful. It appears that this effect is permanent. A plausible explanation is that a broadening of the shareholder base lowers the risk premium as risks are spread across more investors.
Flows move prices. One would expect this to be the case if the risk of stocks
286 Ren6 M. Stulz
becomes spread across more investors. The alternative explanation is that flows move prices because they drive stock prices away from fundamentals. As inves- tors flow into a market, they push prices up without regard for fundamentals, driven by some kind of feeding frenzy. Eventually, prices collapse. Clark and Berko (1996) attempted to distinguish between these two views in the case of Mexico. Mexico saw a dramatic increase in foreign ownership during their sample period. From 1989 to the end of 1993, foreign ownership of Mexican equities increased from a trivial amount to more than one-fourth of the Mexi- can market capitalization. Like Warther (1995), they found a strong effect of flows on returns. Their estimate was that an unexpected inflow equal to 1 per- cent of the capital of the market leads to a contemporaneous increase of 13 per- cent in prices. This estimate was actually smaller than Warther’s (1995). They found no evidence of price reversals, suggesting that the impact of flows is permanent rather than transitory and cannot be explained by price pressure. They also found no support for the hypothesis of positive feedback trading. Therefore, their evidence is fully supportive of the investor base broadening hypothesis.
In an article discussing the difficulties of some Asian emerging markets, an economist at J. P. Morgan was quoted in the New York Times as saying: “One wishes the markets were less fickle.” It could indeed be that flows have a per- manent effect on prices but they are so volatile and fickle that, by coming and going, they keep inflicting shocks on prices. This is the concern often ex- pressed about portfolio flows, that somehow equity investments are the wrong kind of investments for a country because they can leave a country rapidly. This view seems rather perverse in that, in the absence of contracting costs, there would be little reason to have direct foreign investment and all foreign investment would be portfolio investment. This suggests that portfolio invest- ment is a more advanced and more efficient form of international investment. However, there are many ways to obtain financing through sales of securities. The risk of financing through short-term debt is that one might not like the conditions at which the debt can be refinanced. Portfolio flows should not be blamed when a country or a firm has chosen a financing strategy that leaves it exposed to refinancing risks.
Though well established, the view that portfolio investment is more fickle than other forms of investment seems to have little empirical basis. In a useful study, Claessens, Dooley, and Warner (1993) investigated the volatility of for- eign direct investment, portfolio equity flows, long-term flows, and short-term flows for five developed economies and five developing countries. They also broke down flows by transactors, namely, foreign direct investors, banks, gov- ernments, and the private sector. The developing countries in their sample were Mexico, the Republic of Korea, Indonesia, Argentina, and Brazil. In all cases, they focused on net flows. Their results are surprising in light of the comments about fickle equity flows. They found no support for the notion that equity flows are somehow less stable than direct investment or official flows. They
287 The Role of Equity Markets in International Capital Flows
found that the label of flows provides no information about how they behave over time. Their conclusion was that “if presented with one time-series (statis- tics) only, one will likely be unable to tell the label of the flow” (Claessens et al. 1993, 26).
Liberalization opens the door to capital flows. These flows affect security prices. Another implication of the hypothesis that portfolio flows are exces- sively volatile is that portfolio flows increase the volatility of security returns. The risk-sharing hypothesis that predicts a decrease in the cost of capital sug- gests that opening up a country could well decrease the volatility of its security returns. Consider the example of our closed economy that has a comparative advantage in producing coffee beans. An adverse event that decreases the value of the coffee crop makes the country poorer. Suppose that poorer investors are more reluctant to bear risk. In this case, the adverse shock increases the risk premium and hence decreases stock prices even further. If this economy is an open economy, the adverse shock will be spread across investors throughout the world and hence will have only a trivial effect on the risk premium. With this analysis, opening up the economy decreases volatility. However, opening up the economy means that the risk premium on the coffee bean industry now depends on worldwide factors, so that shocks to the world risk premium affect the value of the coffee bean industry. If one thinks that risk premiums should be fairly stable on world markets, then opening up a country decreases volatility if investors who have become poorer are less willing to bear risk.
Let’s consider the empirical evidence on volatility and liberalization. A num- ber of different authors have examined this issue, using different approaches. Kim and Singal (1993) considered changes in volatility around liberalizations for a sample of sixteen emerging markets. In their study, they found that vola- tility in the first twelve months following a liberalization is not significantly different from volatility in the previous twelve months. However, they also found that after the first twelve months, volatility falls significantly on average. They provided other evidence that is consistent with an increase in volatility for some countries and no effect for most countries. Interestingly, the countries for which they found large significant increases were Argentina, Chile, and Mexico. Richards estimated volatility for emerging markets using weekly data and concluded that “the period 1992-1995, which saw foreign institutional in- vestors playing a more significant role in emerging markets has been character- ized by volatility that is marginally lower than the remainder of the sample period (1975 to 1992)” (1996,473). His result is surprising in that it covers the period of the Mexican crisis. Bekaert and Harvey (1997) considered twenty emerging markets and examined stock return volatility before and after liberal- ization. Using a variety of approaches, they found in all cases that on average liberalization decreases volatility. The bottom line from these studies is that the claim that liberalization increases volatility is not supported by empirical evidence.
These volatility studies do not relate flows directly to volatility. Hamao and
288 Re& M. Stulz
Mei (1996) did this for the case of Japan using monthly data on equity pur- chases and sales by foreign investors. Foreign portfolio equity investment in Ja- pan has been small over the past twenty years, peaking in 1984 at 10.31 percent but falling back to less than 5 percent in 1990. This means that evidence for Japan has to be viewed with caution on this issue. Nevertheless, they found that trades by foreign investors do not differ in impact on volatility from trades by other investors.
Folkerts-Landau and Ito (1 995) computed volatility of emerging markets for periods that differ in the intensity of portfolio flows. Table 5.16 summarizes their evidence. They also showed evidence on the issue of whether a day of high volatility for the Dow Jones predicts high volatility the next day in an emerging market for periods where the nature of flows differ. Overall, their evidence is rather mixed. Mexican stock prices appear to be the least volatile when flows are most volatile. In contrast, however, the Hong Kong stock return volatility is higher when flows are most volatile. There seems to be evidence that local volatility is more strongly linked to the volatility of the Dow Jones in periods of more volatile flows. Models where foreign investors are less well informed than local investors and alter their holdings when they receive new information produce a positive relation between stock return volatility and flow volatility. However, in this case, this relation results mostly from flows and stock prices being driven by the same factors. The relation between flows and volatility would be a source of concern if it were due to temporary increases and decreases in stock prices. It is often argued that such temporary increases and decreases in stock prices can be the result of herding by institutional inves- tors. The idea is that institutional investors behave alike, pouring in and out of stocks as a group. In the most detailed and careful study to date, Wermers (1998) investigated whether U.S. institutional investors herd and whether this behavior leads to temporary changes in stock prices. He found strong evidence of herding behavior, especially for smaller stocks. However, at the same time, he failed to find evidence that herding leads to temporary changes in stock prices. An increase in institutional ownership is associated with an increase in stock prices, but this increase appears to be permanent.
In a detailed investigation of the behavior of foreign investors in Korea in 1997, Choe et al. (1999) found that there is evidence of herding among foreign investors. Their data included all trades on the Korea Stock Exchange for 1997. For each trade, they had information on whether a party to the trade was a foreign investor and the country of origin of that investor. They showed that there is herding among investors from different countries. Further, herding measures for investors from the United States, though upward biased because of the nature of the data, seem extremely high. Surprisingly, however, they found that herding measures were smaller during the last three months of 1997, when the Asian crisis hit Korea, than before. To investigate whether foreign investors have a destabilizing effect on prices, they estimated the impact on prices of large purchases and large sales by foreign investors. They argued that
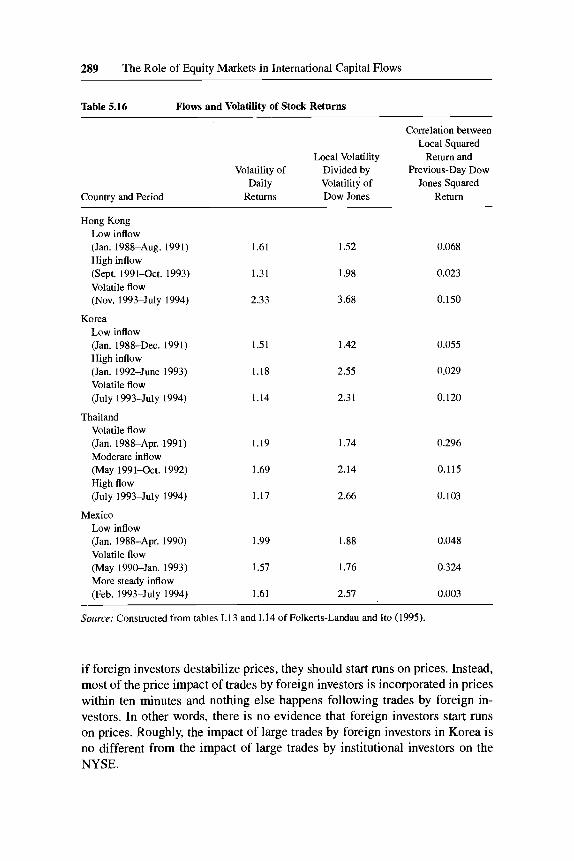
289 The Role of Equity Markets in International Capital Flows
Table 5.16 Flows and Volatility of Stock Returns
Country and Period
Hong Kong Low inflow (Jan. 1988-Aug. 1991) High inflow (Sept. 1991-Oct. 1993) Volatile flow (Nov. 1993-J~ly 1994)
Korea Low inflow (Jan. 1988-Dec. 1991) High inflow (Jan. 1992-June 1993) Volatile flow (July 1993-J~ly 1994)
Thailand Volatile flow (Jan. 1988-Apr. 1991) Moderate inflow (May 1991-Oct. 1992) High flow (July 1993-July 1994)
Low inflow (Jan. 1988-Apr. 1990) Volatile flow (May 1990-Jan. 1993) More steady inflow (Feb. 1993-July 1994)
Mexico
Correlation between Local Squared
Local Volatility Return and Volatility of Divided by Previous-Day Dow
Daily Volatility of Jones Squared Returns Dow Jones Return
1.61 1.52 0.068
1.31 1.98 0.023
2.33 3.68 0.150
1.51 1.42 0.055
1.18 2.55 0.029
1.14 2.31 0.120
1.19 1.74 0.296
1.69 2.14 0.115
1.17 2.66 0.103
1.99 1.88 0.048
1.57 1.76 0.324
1.61 2.57 0.003
Source: Constructed from tables 1.13 and 1.14 of Folkerts-Landau and It0 (1995).
if foreign investors destabilize prices, they should start runs on prices. Instead, most of the price impact of trades by foreign investors is incorporated in prices within ten minutes and nothing else happens following trades by foreign in- vestors. In other words, there is no evidence that foreign investors start runs on prices. Roughly, the impact of large trades by foreign investors in Korea is no different from the impact of large trades by institutional investors on the NYSE.
290 Re& M. Stulz
5.2.4 Conclusions
The empirical evidence shows that international portfolio flows have a bene- ficial effect on countries that liberalize, by decreasing the cost of capital in these countries and enabling residents to share risks with other investors. Port- folio inflows seem to have permanent positive effects on valuations. There is no strong empirical support for the view that portfolio flows increase the vola- tility of security returns or otherwise adversely affect the performance of eq- uity markets. In particular, there is little evidence that the opening of countries has led to substantial increases in the co-movement of their stock markets with the world market. There is evidence that investors find information about one emerging market useful in their assessment of other emerging markets. How- ever, proponents of the view that there is extensive irrational contagion across emerging markets have yet to prove their case.
Opening a country to portfolio flows makes the country better off by enabl- ing it to share risks with foreigners and to lower costs of capital for its indus- tries. It positions the country to receive more capital when the country’s invest- ment opportunities improve. The only way a country can take advantage of these benefits is by understanding fully that in a market economy foreign inves- tors pursue the best investment opportunities available as they see them. They have strong incentives to identify all good investment opportunities carefully, because any opportunity they miss lowers the return on their portfolio. Their behavior makes investors as unlikely to be swept away by irrational contagion as to stay passive when governments try to maintain exchange rates and interest rates that are not sustainable.
References
Bailey, W., K. Chan, and Y. P. Chung. 1997. Depository receipts, country funds, and the peso crash: The intraday evidence. Ithaca, N.Y.: Comell University. Unpublished paper.
Bekaert, G., and C. R. Harvey. 1995. Time-varying world market integration. Journal of Finance 50:403-44.
. 1997. Emerging equity market volatility. Journal of Financial Economics
. 1999. Foreign speculators and emerging equity markets. Durham, N.C.: Duke 43 :29-77.
University. Working paper. Bhagwati, J. 1998. The capital myth. Foreign Affairs 77 (3): 7-12. Bohn, Henning, and Linda Tesar. 1996. U.S. equity investment in foreign markets: Port-
folio rebalancing or return chasing? American Economic Review 86:77-8 1. Bordo, M. D., B. Eichengreen, and J. Kim. 1998. Was there really an earlier period of
international financial integration comparable to today? NBER Working Paper no. 6738. Cambridge, Mass.: National Bureau of Economic Research.
Brennan, M. J., and H. H. Cao. 1997. International portfolio investment flows. Journal ofFinance 52: 1851-80.
291 The Role of Equity Markets in International Capital Flows
Calvo, G. A., M. Goldstein, and E. Hochreiter. 1997. Private CapitalfIows to emerging markets after the Mexican crisis. Washington, D.C.: Institute for International Eco- nomics.
Calvo, S., and C. M. Reinhart. 1997. Capital flows to Latin America: Is there evidence of contagion effects? In Private CapitalfIows to emerging markets afer the Mexican crisis, ed. S. Calvo, M. Goldstein, and E. Hochreiter, 151-71. Washington, D.C.: In- stitute for International Economics.
Campbell, J. Y., S. J. Grossman, and J. Wang. 1993. Trading volume and serial correla- tion in stock returns. Quarterly Journal of Economics 10:407-32.
Campollo-Palmer, C. 1997. Equity investment in emerging markets. Paper presented at the NYSE Conference on the Globalization of Financial Markets, Cancun, Mexico.
Chan, K. C., G. A. Karolyi, and R. M. Stulz. 1992. Global financial markets and the risk premium on US. equity. Journal of Financial Economics 32:137-68.
Choe, Y., B. C. Kho, and R. M. Stulz. 1999. Do foreign investors destabilize stock mar- kets? The Korean experience in 1997. Journal of Financial Economics, forthcoming.
Claessens, S . , M. Dooley, and A. Warner. 1993. Portfolio capital flows: Hot or cool? In Portfolio investment in developing countries, ed. S. Claessens and S. Gooptu, 18-44. Washington, D.C.: World Bank.
Claessens, S., and S. Gooptu, eds. 1993. Portfolio investment in developing countries. Discussion Paper no. 228. Washington, D.C.: World Bank.
Clark, J., and E. Berko. 1996. Foreign investment fluctuations and emerging market stock returns: The case of Mexico. New York Federal Reserve Bank of New York. Working paper.
Cooper, I. A., and E. Kaplanis. 1994. Home bias in equity portfolios, inflation hedging and international capital market equilibrium. Review of Financial Studies 7:45-60.
De Long, J. B., A. Shleifer, L. Summers, and R. J. Waldman. 1990. Noise trader risk in financial markets. Journal of Political Economy 98:703-38.
DeSantis, G. 1993. Asset pricing and portfolio diversification: Evidence from emerging financial markets. In Portfolio investment in developing countries, ed. S . Claessens and S. Gooptu, 145-68. Washington, D.C.: World Bank.
DeSantis, G., and B. Gerard. 1997. International asset pricing and portfolio diversifica- tion with time-varying risk. Journal of Finance 52:1881-1913.
Dornbusch, R., and Y. C. Park. 1995. Financial integration in a second best world: Are we still sure about our classical prejudices? In Financial opening: Policy lessons for Korea, ed. R. Dornbusch and Y. C. Park. Seoul: Korea Institute of Finance.
Eichengreen, B., and A. Fishlow. 1998. Contending with capital flows: What is different about the 1990s? In Capitaljows andfinancial crises, ed. M. Kahler. Ithaca, N.Y.: Cornell University Press.
Erb, C., C. Harvey, and T. Viskanta. 1996. Expected returns and volatility in 135 coun- tries. Journal of Porlfolio Management 22:46-58.
Falkenstein, E. G. 1996. Preferences for stock characteristics as revealed by mutual fund portfolio holdings. Journal of Finance 51: 11 1-35.
Feldstein, M., and C. Horioka. 1980. Domestic saving and international capital flows. Economic Journal 90:314-29.
Folkerts-Landau, D., and T. Ito. 1995. International capital markets: Developments, prospects, and policy issues. Washington, D.C.: International Monetary Fund.
Forbes, K., and R. Rigobon. 1998. No contagion, only interdependence: Measuring stock market co-movements. Cambridge: Massachusetts Institute of Technology, Sloan School of Management. Working paper.
Frankel, J. A., and S. L. Schmukler. 1996. Country fund discounts, asymmetric infor- mation and the Mexican crisis of 1994: Did local residents turn pessimistic before international investors? NBER Working Paper no. 5714. Cambridge, Mass.: National Bureau of Economic Research.
292 RenC M. Stulz
French, K., and J. Poterba. 1991. International diversification and international equity markets. American Economic Review 8 1 :222-26.
Froot, K. A., P. G. O’Connell, and M. S. Seasholes. 1998. The portfolio flows of inter- national investors, I. Boston: Harvard Business School. Working paper.
Froot, K. A,, and A. F. Perold. 1995. New trading practices and short-run market effi- ciency. Journal of Futures Markets 15:731-65.
Gagnon, L., and G. A. Karolyi. 1997. Information, trading volume and international stock market co-movements. London: University of Western Ontario. Working paper.
Goldstein, M., and D. Folkerts-Landau. 1994. International capital markets: Develop- ments, prospects, and policy issues. Washington, D.C.: International Monetary Fund.
Gompers, P., and J. Lemer. 1997. Money chasing deals? The impact of fund flows on private equity valuation. Boston: Harvard Business School. Working paper.
Hamao, Y., and J. Mei. 1996. Living with the “enemy”: An analysis of investment in the Japanese equity market. New York: Columbia University. Working paper.
Harris, L., and E. Gurel. 1986. Price and volume effects associated with changes in the S&P 500 list: New evidence for the existence of price pressures. Journal of Fi- nance 41:815-29.
Henry, P. B. 1999a. Equity prices, stock market liberalization, and investment. Palo Alto, Calif.: Stanford University. Working paper.
. 199913. Stock market liberalization, economic reform, and emerging market equity prices. Journal of Finance. Forthcoming.
Ilmanen, A. 1995. Time-varying expected returns in international bond markets. Jour- nal oj” Finance 50:481-506.
Kang, J.-K., and R. Stulz. 1997. Why is there a home bias? An analysis of foreign portfolio equity ownership i n Japan. Journal of Financial Economics 46:3-28.
Karolyi, A,, and R. Stulz. 1996. Why do markets move together? An examination of US.-Japan stock return co-movements. Journal of Finance 5 1:95 1-86.
Khannah, A. 1996. Equity investment prospects in emerging markets. Columbia Jour- nal oj” World Business 3 1 :32-39.
Kim, E. H., and V. Singal. 1993. Opening up of stock markets by emerging economies: Effects on portfolio flows and volatility of stock prices. In Portfolio investment in developing countries, ed. S. Claessens and S. Gooptu, 383-403. Washington, D.C.: World Bank.
Krugman, P. 1998. Saving A Lin, W.-L., and T. Ito. 1994. Price volatility and volume spillovers between the Tokyo
and New York stock markets. In The internationalization of equity markets, ed. J. Frankel. Chicago: University of Chicago Press.
NYSE (New York Stock Exchange). 1997. NYSE facts for the year of1996 New York: New York Stock Exchange, May.
Obstfeld, M. 1994. Risk-talung, global divcrsification, and growth. American Economic Review 84:13 10-29.
Radelet, Steven, and Jeffrey Sachs. 1998. The onset of the East Asian financial crisis. Cambridge, Mass.: Harvard University. Working paper.
Richards, A. J. 1996. Volatility and predictability in national stock markets: How do emerging and mature markets differ? IMF Staff Papers 43:461-501.
Rigobon, Roberto. 1998. On the measurement of contagion. Cambridge: Massachusetts Institute of Technology, Sloan School of Management. Working paper.
Sachs, J . D., A. Tornell, and A. Velasco. 1996. Financial crises in emerging markets: The lessons from 1995. Brookings Papers on Economic Activity, no. 1:147-217.
Scholes, M. 1972. The market for securities: Substitution versus price pressure and the effects of information on share prices. Journal ofBusiness 45: 179-21 1.
Shleifer, A. 1986. Do demand curves for stocks slope down? Journal of Finance 41:
It’s time to get radical. Fortune, 7 September.
579-90.
293 The Role of Equity Markets in International Capital Flows
Shleifer, Andrei, and Robert W. Vishny. 1997. The limits of arbitrage. Journal of Fi-
Stiglitz, Joseph. 1998. Boats, planes and capital flows. Financial Times, 25 March. Stulz, R. M. 1995. International portfolio choice and asset pricing: An integrative sur-
vey. In The handbook of modemfinance, ed. V. Maksimovic and W. Ziemba. Amster- dam: North Holland.
. 1999. Globalization and the cost of equity capital. New York: New York Stock Exchange. Working paper.
Summers, L. H., and V. P. Summers. 1989. When financial markets work too well: The cautious case for a securities transactions tax. Journal of Financial Services Re- search 3:261-86.
Tesar, L., and I. Werner. 1993. U.S. equity investment in emerging stock markets. In Portfolio investment in developing countries, ed. S . Claessens and S. Gooptu. Wash- ington, D.C.: World Bank.
. 1994. International equity transactions and U.S. portfolio choice. In The inter- nationalization of equity markets, ed. J. Frankel. Chicago: university of Chicago Press.
Tobin, J. 1978. A proposal for international monetary reform. Eastern Economic Jour- nal 4:153-59.
Warther, V. A. 1995. Aggregate mutual fund flows and security returns. Journal of Fi- nancial Economics 39:209-35.
Wermers, R. 1998. Mutual fund herding and the impact on stock prices. Journal of Finance 54:581-622.
Williamson, J. 1993. Issues posed by portfolio investment in developing countries. In Portfolio investment in developing countries, ed. S . Claessens and S. Gooptu. Wash- ington, D.C.: World Bank.
nance 52:35-55.
World Bank. Various issues. World debt tables. Washington, D.C.: World Bank.
3. Stephen Friedman These comments sketch out the following hypothesis: an important side effect of U.S. international equity flows is to assist in the development-and much needed transformation, over time-of the business and bureaucratic cultures underlying emerging country capital markets and economies. I will lay out my perceptions on this subject in the hope that you find them worth more rigorous and less anecdotal inquiry than I can bring to bear. For several reasons, my fo- cus will be on the effect of equity flows from the United States to emerging economies throughout the world.' One reason is that I am most familiar with
1. Recent net equity market flows into the United States are relatively modest and not trans- forming in any conceptual sense. From 1990 through the first quarter of 1997, foreign net pur- chases of U.S. equities totaled only $46 billion, against a U.S. market value of almost one-half the total world stock market capitalization. Non-U.S. investors do hold about 6.5 percent of all U.S. shares, but their activities usually have only a small impact on market direction. During the same period, aggregate net U.S. flows into the equity markets of Latin America and Asia outside of Japan were about $78 billion-greater both absolutely and relatively than flows into the United States since the funds went into markets whose cumulative capitalization was only about 7 percent of the worlq total at midyear.
294 Stephen Friedman
the US. investor. More important, I want to concentrate on the present and po- tential transforming influence of U.S. equity outflows-which, I believe, gives them a significance far greater than the quantity of dollars would suggest.*
First, however, some general background on the accelerated globalization of U.S. equity portfolios in the past decade. The volume of US.-owned foreign shares is currently over $1 trillion, equal to roughly 6 percent of the US. stock market capitalization, and these holdings are growing markedly faster than the value of domestic equities. Since the mid-l980s, these outflows have been evenly spread between industrialized countries and emerging markets, with flows to Asia and Latin America consistently positive. Demand has also gener- ated its own supply, and the size, sophistication, and competitiveness of US. equity markets has led to explosive growth in the number of issuers attracted to our market: 20 percent of U.S.-based equity demand during the past decade flowed to the emerging stock markets of Asia and Latin America.’
Without attempting to go far back in history, prior to the 1990s U.S. equity portfolio flows to emerging nations offered a rather straightforward bargain: they afforded to a relatively small investor base some diversification (with low correlation of investment results to U.S. markets) plus acceptable returns- hopefully, higher returns than the S&P 500 to compensate for the increased volatility-in turn, foreign recipients were provided with an additional source of long-term funds and lower capital costs.
2. Equity portfolio flows from other advanced economies, particularly the United Kingdom (which, together with the United States, the French think of as the proponent of “Anglo-Saxon” style capitalism). would tend to have similar impacts.
3. From an October 1997 presentation: “The Globalization of U.S. Equity Ownership” (by Eric Dobkin, the chairman of Goldman, Sachs worldwide equity capital markets group). Dobkin went on to identify some reasons for the ongoing expansion in U.S. ownership of foreign equities:
1. Demise of communism, reducing event risk 2. Globalization of world economies, with a correlation between necessary and growing open-
ness of economies, economic growth, and capital Rows 3. Desire of U.S. savers to attain greater diversification into the slightly more than one-half the
global market capitalization and 80 percent of world GDP lying outside the United States (pension fund and endowment advisors frequently support an allocation benchmark of 15 to 20 percent of equity holdings in foreign shares)
4. Exposure to superior growth potential in certain emerging markets, albeit at the cost of greater sector volatility
5. Returns generated from the emerging markets not very correlated with the S&P 500 (or among themselves) thus dampening potential volatility in the entire portfolio
6. Increased familiarity: becoming “comfortable with those foreign companies that looked and smelt like U.S. companies [and] were subject to the same or similar accounting principles”
7. Technology: “the structure and flexibility of the US. financing sector allows a more ef- fortless passing of the baton from venture capital financing to the stock market than is the case in much of Europe or Asia. [Ths has] allowed U.S. investors to become early stage major shareholders in a number of foreign technology companies at a time when non-U.S. investors may not have felt entirely comfortable with the very nascent state of these rev- enues”
8. Familiarity with restructuring: given the industry-by-industry wave of restructuring and con- solidation in the United States, and U.S. investors’ resulting positive experience, they have learned to identify candidates for consolidation, cost cutting, and rationalization abroad
295 The Role of Equity Markets in International Capital Flows
I suggest that, as the absolute size and relative importance of these flows has increased, and a critical mass of U.S. emerging nation investment has been reached, there has been a qualitative change in their impact. Analogous to the effect of open trade markets, sizable equity portfolio flows from advanced U.S. (and other “Anglo-Saxon” style) capital markets are accompanied by influ- ential demands as to acceptable practices, by infectious cultural norms, and by role model and mentoring effects, which substantially affect the business cul- tures of recipient emerging countries and companies. This applies-albeit im- perfectly-in varying degrees whether the recipients are emerging nations in Latin America, Southeast Asia, Russia, or eastern Europe? In other words, as one influential investment banker summed it up: “If [particular emerging na- tions and their enterprises] want to compete for the money, they’ll have to clean up their act.”
In a different context, Paul Samuelson and William Nordhaus have dis- cussed “external economies” and noted that the return to a nation from new innovation can be a multiple of the reward collected by the innovator. My cen- tral point is that, just as there is a very high “social return” to a nation from tangible, patentable invention, there can also be very high returns from the cultural transformation of enterprise work practices and norms: motivating people to change the way they think and, most important, influencing attitudes toward the very process of ongoing change.
This general principal is readily observable in action. For example, the transfer of “lean production” know-how from Japanese auto manufacturers and other industrial concerns to U.S. auto companies and other manufacturers- much of which accompanied Japanese direct investment in the United States- has been vastly beneficial to the United state^.^ According to management, su- pervisors, unionists, and blue-collar workers in positively affected plants, the prerequisite to many of these successful innovations was not hard technologi- cal innovation but “softer,” cultural change: major shifts in attitude and rela- tionships needed to occur between and among senior management, suppliers, managers of functional staff “silos,” plant supervisors, and blue-collar workers. Much of U.S. industry ultimately accepted the need to make radical shifts in methodology due to twin pressures-from the showroom floors and, pertinent to this discussion, from institutional investors. From personal experience, I can
4. Lankes and Stern in chap. 2.1 note: “The impact of capital flows to [eastern Europe and the former Soviet Union] is of fundamental importance to the economic transition. These flows bring new methods of business organization, new technologies, and powerful influence on the building of financial, regulatory, and other institutions. They help establish the financial discipline that is crucial to the effective functioning of a market economy. Thus their impact goes far beyond the simple availability of resources.”
5 . I won’t enter a dog in the fight over the extent of overall productivity improvement in the United States; however, clearly something of great value occurred when so many plants absorbed new work practices and-without additional capital and with sharply reduced hours of worker input-turned out markedly superior products.
296 Stephen Friedman
testify that a similar transfer affecting work practices and productivity took place among British merchant bankers when U.S. investment banks set up “green-field plants” in the City of London that were (grudgingly) accepted as role models.
Knowledge transfer now accompanies not only global direct investment and open trade but also US.-style portfolio investment: encouraging “best prac- tices” and-with greater or less success in different emerging markets-trans- mitting a benign virus attacking many dysfunctional traditional overseas gov- ernmental and business patterns. Over the long term, and we all know how long that can be, the most productive ideas tend to win out-$(and these are two big “if,”) markets and information flows make them accessible to potential adoptors and if competitive pressures overcome resistance to change (i.e., if fear of the future exceeds the pain of change).
So, I come to a question that has intrigued me for years: What are the “spill- over effects” and “social returns” to a nation from encouraging U.S .-style port- folio equity inflows-through privatizing state-controlled corporations, pro- moting greater financial transparency, introducing more enlightened regulatory practices, and otherwise creating hospitable local equity markets? Can the so- cial returns to the recipient nation be estimated? Can we estimate the value to an economy of more efficient equity markets, in terms of increased domestic savings, and more efficient channeling of money to areas of high productivity and return?
I will attempt to describe my perceptions as to some frequently overlapping, beneficial side effects of U.S. equity portfolio investment. (A caveat: develop- ing U.S.-style capital markets in emerging economies is a very uncertain and long-term process with some backsliding; my views are anecdotally based and lap over into the predictive-and, perhaps even more suspect, into sociology!)
An increasingly vocal and influential, primarily ‘Anglo-Saxon,” interna- tional investor constituency has arisen-with strong motives for encourag- ing positive change in the financial infrastructures and corporate practices of emerging nations. Even to an amoral equity speculator, “an act which badly needs cleaning up” creates risks and systemic distortions harmful to present investment and future opportunities. The “Washington consensus,”6 with the ad- dendum of a “Wall Street/City of London consensus,” as to desirable macro- and micropolicies for emerging economies and capital markets is increasingly be- ing accepted-at least at the technocrat level-by a new generation of highly educated (often in the United States) foreign government officials and private sector managers. Obviously, this acceptance has not occurred at some very important political and bureaucratic levels of certain emerging nation govern-
6. In remarks at the Roundtable on Financial Stability and Supervision in Emerging Markets (Hong Kong, September 1997), Jerry Comgan touched on key points related to the conference topic on which there is general consensus and points for which important gaps in information or understanding exist.
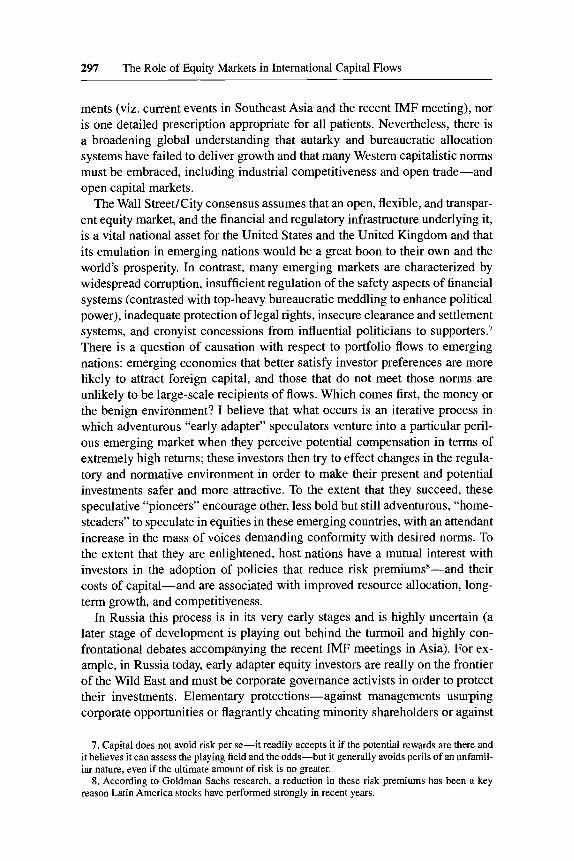
297 The Role of Equity Markets in International Capital Flows
ments (viz. current events in Southeast Asia and the recent IMF meeting), nor is one detailed prescription appropriate for all patients. Nevertheless, there is a broadening global understanding that autarky and bureaucratic allocation systems have failed to deliver growth and that many Western capitalistic norms must be embraced, including industrial competitiveness and open trade-and open capital markets.
The Wall Street/City consensus assumes that an open, flexible, and transpar- ent equity market, and the financial and regulatory infrastructure underlying it, is a vital national asset for the United States and the United Kingdom and that its emulation in emerging nations would be a great boon to their own and the world‘s prosperity. In contrast, many emerging markets are characterized by widespread corruption, insufficient regulation of the safety aspects of financial systems (contrasted with top-heavy bureaucratic meddling to enhance political power), inadequate protection of legal rights, insecure clearance and settlement systems, and cronyist concessions from influential politicians to supporter^.^ There is a question of causation with respect to portfolio flows to emerging nations: emerging economies that better satisfy investor preferences are more likely to attract foreign capital, and those that do not meet those norms are unlikely to be large-scale recipients of flows. Which comes first, the money or the benign environment? I believe that what occurs is an iterative process in which adventurous “early adapter” speculators venture into a particular peril- ous emerging market when they perceive potential compensation in terms of extremely high returns; these investors then try to effect changes in the regula- tory and normative environment in order to make their present and potential investments safer and more attractive. To the extent that they succeed, these speculative “pioneers” encourage other, less bold but still adventurous, “home- steaders” to speculate in equities in these emerging countries, with an attendant increase in the mass of voices demanding conformity with desired norms. To the extent that they are enlightened, host nations have a mutual interest with investors in the adoption of policies that reduce risk premiumss-and their costs of capital-and are associated with improved resource allocation, long- term growth, and competitiveness.
In Russia this process is in its very early stages and is highly uncertain (a later stage of development is playing out behind the turmoil and highly con- frontational debates accompanying the recent IMF meetings in Asia). For ex- ample, in Russia today, early adapter equity investors are really on the frontier of the Wild East and must be corporate governance activists in order to protect their investments. Elementary protections-against managements usurping corporate opportunities or flagrantly cheating minority shareholders or against
7. Capital does not avoid risk per se-it readily accepts it if the potential rewards are there and it believes it can assess the playing field and the odds-but it generally avoids perils of an unfamil- iar nature, even if the ultimate amount of risk is no greater.
8. According to Goldman Sachs research, a reduction in these risk premiums has been a key reason Latin America stocks have performed strongly in recent years.
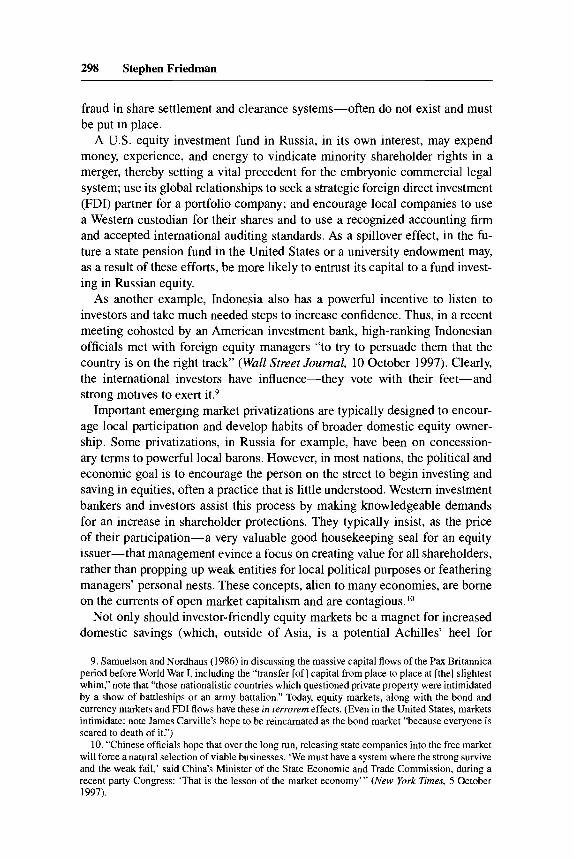
298 Stephen Friedman
fraud in share settlement and clearance systems-often do not exist and must be put in place.
A U.S. equity investment fund in Russia, in its own interest, may expend money, experience, and energy to vindicate minority shareholder rights in a merger, thereby setting a vital precedent for the embryonic commercial legal system; use its global relationships to seek a strategic foreign direct investment (FDI) partner for a portfolio company; and encourage local companies to use a Western custodian for their shares and to use a recognized accounting firm and accepted international auditing standards. As a spillover effect, in the fu- ture a state pension fund in the United States or a university endowment may, as a result of these efforts, be more likely to entrust its capital to a fund invest- ing in Russian equity.
As another example, Indonesia also has a powerful incentive to listen to investors and take much needed steps to increase confidence. Thus, in a recent meeting cohosted by an American investment bank, high-ranking Indonesian officials met with foreign equity managers “to try to persuade them that the country is on the right track” (WuU Street Journal, 10 October 1997). Clearly, the international investors have influence-they vote with their feet-and strong motives to exert it.9
Important emerging market privatizations are typically designed to encour- age local participation and develop habits of broader domestic equity owner- ship. Some privatizations, in Russia for example, have been on concession- ary terms to powerful local barons. However, in most nations, the political and economic goal is to encourage the person on the street to begin investing and saving in equities, often a practice that is little understood. Western investment bankers and investors assist this process by making knowledgeable demands for an increase in shareholder protections. They typically insist, as the price of their participation-a very valuable good housekeeping seal for an equity issuer-that management evince a focus on creating value for all shareholders, rather than propping up weak entities for local political purposes or feathering managers’ personal nests. These concepts, alien to many economies, are borne on the currents of open market capitalism and are contagious.1°
Not only should investor-friendly equity markets be a magnet for increased domestic savings (which, outside of Asia, is a potential Achilles’ heel for
9. Samuelson and Nordhaus (1986) in discussing the massive capital flows of the Pax Britannica period before World War I, including the “transfer [of] capital from place to place at [the] slightest whim,” note that “those nationalistic countries which questioned private property were intimidated by a show of battleships or an army battalion.” Today, equity markets, along with the bond and currency markets and F D I flows have these in terrorern effects. (Even in the United States, markets intimidate: note James Camille’s hope to be reincarnated as the bond market “because everyone is scared to death of it.”)
10. “Chinese officials hope that over the long run, releasing state companies into the free market will force a natural selection of viable businesses. ‘We must have a system where the strong survive and the weak fail,’ said China’s Minister of the State Economic and Trade Commission, during a recent party Congress: ‘That is the lesson of the market economy’” (New York Times, 5 October 1997).
299 The Role of Equity Markets in International Capital Flows
emerging nations), but educating the public and giving them reason to be more comfortable with equity investment promises to allocate and channel savings more efficiently to the most productive and highest return investments.” Thus the ability of equity flows to develop an infrastructure and template for domes- tic equity investment-and provide a trusted imprimatur to well-run local cor- porations-is likely to be more important than the actual amount of U.S. dol- lar inflows into emerging markets. These inflows, while welcome, are modest compared to domestic savings. Thus, for example, in Latin America, there has been an explosion in private pension funds, which now manage about $130 billion, growing by about $1 billion a month. ‘‘Assets that once languished in inefficiently managed government pension plans are being channeled to asset management firms, whose holdings include a growing share of local stock . . . markets.” The portion of Latin American equity deals, often led by Wall Street firms, that is sold locally, which averaged 10 to 15 percent a year ago, has grown to 20 to 30 percent of many issues, and in some cases all the equity can now be raised in the local markets. To the extent that Western investors are able to make the Russian stock market safer for minority shareholders, Russians- cynical observers of abuses in early privatizations-are more likely to take money from under their mattresses and buy equities. This will provide desper- ately needed working capital to domestic corporations and encourage the flow back to Russia of some of the immense amounts of earlier capital outflow.
More emerging nation domestic venture capitalists and risk-tolerant inves- tors will emerge and invest in start-ups and high-growth young companies if maturing, vital domestic stock markets promise liquidity and exits. Mean- while, U.S. venture capitalists and merchant bankers and some elite, domes- tic specialists in the emerging nations are investing aggressively in private, liquidity-short, high-growth ventures in these nations, often counting on a “takeout” down the road with a U.S.-led initial public offering (IPO).
With open equity markets, the opportunities for management measurement and benchmarking are dramatically enhanced; competition for capital and in- vestor approbation “concentrates the mind wonderfully.” With Anglo-Saxon equity flows come Anglo-Saxon-style money managers, security analysts, and investment bankers.I2 Newly privatized and other emerging market public com- panies now have public financial reports that can be compared to those of competitors or other industry participants across national boundaries, and vo- luminous analysts’ reports abound with every conceivable comparative metric. Senior executives are anxious to tap into the information flow and learn what their domestic and international competitors are doing, not only from their
11. Outside the emerging markets, this process is already at work in western Europe. An im- mense volume of forthcoming telecommunications and vital infrastructure privatizations over- hangs the market, and investment bankers count on the buying power of a relatively new class of domestic equity investors.
12. Whose incoming fees are a useful addition to U.S. “service” trade flows and whose advice is-arguably-a useful export!
300 Stephen Friedman
subordinates-according to whatever particular agendas they have-but in private meetings or investor conferences with security analysts, money manag- ers, and investment bankers. Good and bad performance is highlighted. Man- agements feel increased pressure to improve and to perform for stockholders- a focus that had rarely been their experience before-pressure to get a higher return on assets, to make their businesses more efficient, and to reduce redun- dant employment, rather than to be a source of politically convenient jobs. l3 Emerging nation equity market leaders recognize the need for security reform, improved settlement procedures, and more transparent accounting standards if their companies are to compete for much needed equity inflows. The financial industry trade press is replete with stories underscoring this point. For ex- ample, an article entitled “Market Reform: The Promise of Liquidity,” in World Equity magazine, reports on how Middle Eastern regulatory authorities are assiduously responding to the specific criticisms of specialist equity managers (often U.S. and U.K. emerging market fund managers) to reform their markets, in order to be competitive in capital markets. This is a mentoring effect, similar to that from FDI.
Good security and country analysts provide much the same benefit as a free press, exposing obfuscation and cover-ups-generally with much greater in- sight. There is a growing watchdog effect in many emerging markets (though obviously, as indicated by recent events, often still without sharp enough teeth!). Road shows and meetings with analysts and money managers do not respect the cultures and motives of family conglomerate empires or statist cor- porations. A publicly traded industrial company that might wish to use its cash or borrowing capacity to speculate in real estate, or to accumulate ill-fitting subsidiaries for reasons of domestic power and prestige, will find it difficult over time to rationalize such decisions in a return-driven environment with more checks and balances. Appointments of senior bureaucrats, whose prin- cipal qualification is loyalty to those in power, to run key state-controlled pub- lic companies as a form of patronage and to ensure that politically acceptable people control assets will become more difficult to carry off. Unsavory prac- tices-for example, family groups shifting funds from public vehicles they control to private vehicles they own outright-are more likely to be ferreted out, leading to less wasteful, less corrupt uses of capital. The use of political pressure to intimidate nominally private banks into funding politically moti- vated but economically unsound projects, or politically favored businessmen, will become less likely in such an environment, if markets send loud negative signals. This process is under way, albeit embryonically, in many emerging markets. However, as recent events in Southeast Asia make abundantly clear, steps to date in this direction have been inadequate.
With access to U.S. equity investors, and the more attractive financing this makes possible, privatized and newly public emerging market corporations
13. This, and numerous other insights in this paper, stem from the “firing line” experience of Mark Evans, co-chief executive of Goldman, Sachs’s global equity capital markets thrust.
301 The Role of Equity Markets in International Capital Flows
now have the currency to make sizable acquisitions. Stock prices permitting, they are likely to be participants in merger markets, leading to useful cross- fertilization and transactions and building economies of scale.I4
I will now attempt to identify some very conceptual, fundamental cultural ex- ternalities that I believe will accompany U.S. portfolio equity investment over time in those emerging markets where the soil is ripe for entrepreneurialism. This is “soft stuff,” but more and more smart managers understand that “culture is destiny.” In my perception, culture is far more important in national and cor- porate development than differences in hard assets. So I’m going to dwell on this point.15
It’s now axiomatic that-in an ever faster, more volatile, and more global world-economic success depends heavily on innovation and ready adapta- bility. Success goes to corporate cultures that strive to be in the information flows-the markets for new ideas-and that are more entrepreneurial and less hierarchical, embody the concept of constant improvement, are willing to can- nibalize their own product lines and shelve past practices (a big psychological barrier), break down interior functional walls and inculcate greater interdisci- plinary cooperation into their workforces (another major resistance point), and achieve greater fluidity in forming interfirm partnerships (to augment their own comparative advantages). Accompanying these norms should be an attitude more open to bold experiment-with the attendant risk of failure. (These atti- tudes are generally far better accepted and understood in the United States than in western Europe or Japan.) Underlying all of these cultural attitudes is the assumption that the greater short-term financial and career risks inherent in these approaches demand greater financial carrots. In other words, the successful risk taker deserves to get his or her financial head well above the crowd (which is not a very continental European, Japanese, or British approach, in general).
As another way of saying it: success in a world of global information revolu- tion requires organizations that function as complex adaptive systems-in the Santa Fe Institute sense-highly motivated, regularly evolving human ecosys- tems, composed of constantly interacting, self-directing units-that come to- gether in varying unit configurations to better adjust to changing environments. In Darwin’s world, it helps a lot to be strong, swift, and smart, but survival-
14. E.g., Mexico’s poultry leader, facing increased competition from U S . firms, launched a U.S. IPO, the proceeds of which were in part intended to finance acquisitions to afford economies of scale (WaZZ Street Journal, 19 September 1997). Similarly, a major Argentine retailer, which re- ceived much of its early support from U.S. brokers rather than Argentine investors, went public in April 1Y96 and obtained capital to make consolidating acquisitions in the Latin American retail area, which faces increased competition from major global firms.
15. A parable teaches that “if you give a man a fish you feed him for a day, but if you teach him to fish you feed him for a lifetime,” That, in a way, is what happens when a transfer of specific technical knowledge accompanies FDI. However-to beat the parable to death-I would argue that inculcating a US.-style capitalistic equity market orientation into emerging markets provides the infrastructure, incentive, and orientation for local entrepreneurial managers to work out for themselves new and better ways of fishing, perhaps even leapfrogging FDI patrons. No one has ever figured out a better framework for encouraging the “invisible hand.”
302 Stephen Friedman
and being a beneficiary and not a victim of “creative destruction”-ultimately depends on being adaptive.I6
Sound “touchy-feely”? To me, it distinguishes the economic winners from the losers. I am suggesting a vision in which Microsoft, Hewlett-Packard, and Intel are epitomes of adaptive cultural success in our economic environment- for the present at least! (Also, take a look behind the glossy facades of success- ful U.S. investment banks. If they didn’t behave as complex adaptive systems, they couldn’t compete.) Economic institutions such as these place exceptional demands on their employees and cannot thrive without the lure of exceptional financial rewards to attract extraordinary effort from top talent. l 7
In the earlier industrial revolutions of steam machinery and electricity, great risk takers and entrepreneurs performed epic feats, built highly successful companies for the era, and were lavishly rewarded. In the current era, if one accepts what I’ve suggested are the attributes necessary for success-for ex- ample, flatter hierarchies and operations dependent on the initiative of larger numbers of motivated people-reward systems must reach further down into organizations. And-of immense importance-the reward system must align key employees’ incentives with the stated goals of the enterprise (otherwise employees will tend consciously or unconsciously to game the system). Noth- ing achieves this goal better than employee ownership of stock and US.-style stock options (which, until recently, were not even legal in some major indus- trial nations). Anyone who spends time in the fastest paced and most vibrant parts of our economy’* would be struck by the driving psychological force for employees of an ownership stake.19
The United States is particularly hospitable to entrepreneurial environments
16. One of the country’s leading lawyers, whose practice deals with titanic corporate struggles, cites the Forbes 400 as a research tool for understanding the changing U.S. economy and the “new breed” of business leaders in the information age.
17. Such corporate successes constantly help to spawn even more entrepreneurial progeny. In- deed, just as Wall Street, Hollywood, Pittsburgh, Detroit, Chicago, and Toledo early became nests for fledgling finance, motion picture, steel, auto, meat packing, and tire companies, complex adap- tive systems ready to deal with the challenges of the twenty-first century have sprung up in Silicon Valley, Austin, Seattle, Route 128, the Research Triangle, and San Diego.
18. E.g., the Internet; computer and biotech start-ups; fledgling companies in retail and service industries; “consolidations” seeking efficiencies through “roll-ups” of existing businesses; soft- ware companies developing solutions to dramatically enhance supply chain productivity, factory and warehouse efficiency, and targeted marketing strategies; new and more efficient health care ventures.
19. In one sense, this is just a modem-day example of the “invisible hand’ at work, but in another sense, modem US.-style capitalism, replete with the holy grails of equity ownership- IPOs, stock options, etc.-provides the same attraction to highly energetic, talented people that administering Her Majesty’s empire might have had in a prior century or workmg in FDR’s New Deal earlier in ow own. Of great importance is the fact that these entrepreneurial and wealth- creating U.S. environments also attract great talent from abroad, often from emerging nations-a form of mercantilism in which the United States imports great brains and exports high-value- added, sophisticated high-tech products, often software. Clearly, this phenomenon is hyped by an aggressive bull market, and a major downturn will bring substantial morale problems, but equity incentives have proved their value over many cycles.
303 The Role of Equity Markets in International Capital Flows
and attitudes-a major advantage of the U.S. economy as we approach the twenty-first century. Such environments can no more be manufactured whole than the Amazon rain forest. However, with patience, incentives, and conscious transplanting of seeds, such environments can take root in some emerging mar- kets. (In its own way, Hong Kong is very much the sort of environment I’ve de- scribed.) However, it would be a great aid to have U.S.-style equity markets to lure risk capital funders and to provide incentives to entrepreneurs (these incentives are delicately called “liquidity events”). (Certainly, this variable is insufficient in itself-silicon Valley required much more than stock options in order to evolve as an archetype of such an environment.)
In many emerging nations, there will continue to be resistance from established political forces that want the capital that comes with FDI and portfolio invest- ment, as well as the politically unthreatening, economy-boosting technological improvements that accompany it, but are uncomfortable with the gradual cul- tural changes, emerging entrepreneurial classes, and reduced governmental con- trol that are likely to follow from U.S.-style equity markets. However, I’m betting that, over time, an idea that delivers demonstrable value will prevail.
4. George N. Hatsopoulos I am going to say a few words about the mirror image of what was addressed by Stephen Friedman, namely, equity flows to the United States, which by all measures have been small. I have added them up over the past five years, over $45 billion, so they’re not much compared to the size of the U.S. economy. But they have played a very important role in the development of Thermo Electron.
In general, much of the equity flow to the United States is the result of equity offerings that U.S. companies make in Europe and, to a lesser degree, in Asia. This activity usually takes place when the companies intend to raise capital. U.S. corporations want to enlarge their investor base, so they go to Europe or other parts of the world where investment funds are available.
Our company completed a large number of public offerings over the past five years. In total, we raised about $3 billion, of which 40 percent was in straight equity, and the remainder was kind of a hybrid of equity and debt known as convertible debenture. Another aspect of this aggregate is that about half the money was raised in Europe and half in the United States. That ratio is quite unusual. It’s not accidental; it’s very deliberate. We decided to raise only half of new equity or new subordinated debt in the United States, and the rest abroad. I would like to explain why Thermo Electron has followed this practice.
Some fourteen years ago, we decided to embark on the creation of a new
304 George N. Hatsopoulos
corporate structure that has become known as the “spinout” structure. Pursuant to this effort, we incorporated virtually all of our distinctive business activities into subsidiaries and allowed each to raise the funds it might need from exter- nal equity markets, with the provision that each of these subsidiaries abide by the rules outlined in what we call the Thermo Electron corporate charter. The principal reason for introducing this spinout structure is to provide the manage- ment incentives addressed by Friedman, namely, some ownership in their own business by way of stock options and the responsibility of running their own company. Sometimes Thermo Electron owns as much as 90 percent of these spinouts, and although some spinouts are owned by the parent at a lower per- centage, it is always a controlling percentage. The second reason for this struc- ture is that we have been able to raise money at lower capital cost than if we were to raise it by selling shares of the parent company. Thermo Electron has always had a favorable price-to-earnings (PE) ratio, between 20 and 30, which has usually been rather comfortable for raising equity capital-but not nearly as comfortable as raising capital with an infinite PE ratio, which many of our subsidiaries have.
Let me now come to the reasons why we are intending to raise only half the capital in the United States. The first reason is that, when we started to examine the European market about twenty-seven years ago, especially in developed economies such as the United Kingdom, West Germany, Switzerland, France, and more recently Italy and Greece, we found we would be dealing with inves- tors who in general have much longer investment horizons than do Americans. That is quite important to us because of our longterm goals and strategies. The second characteristic of Europeans is their much longer institutional memory. Right now, for instance, we know the people in maybe a dozen banks in Zurich. We know individuals in each of the banks who invested in our company back in 1971. This wouldn’t be possible with American institutions. For a company like us, this characteristic is very important. The third aspect is that Europeans, and Asians as well, value safety more than high returns. This attribute suits us very well. For instance, for a subordinated debenture, American investors re- quire a pretty high coupon. Of course, they give you an equivalent premium. But if we go to Europe and tell them, “We’ll give you a lower conversion pre- mium, but we want to pay only 3 percent,” they will take it. This is much better for us because we know they’re going to convert anyway, so why pay the higher interest rate?
What happens, incidentally, is that by starting the process in Europe to raise half the capital, we force the other half, which is in the United States, to buy the terms that we have negotiated in Europe. That has worked enormously well. We’ll never go the other way around. If we start in the United States, ne- gotiating with major institutions, we’re going to get less desirable terms. So we start negotiating in Europe, where there is in each institution at least one person who has known us for a long time.
I thought you might want to hear about some of our experiences.
305 The Role of Equity Markets in International Capital Flows
Discussion Summary
Linda Tesar noted that approximately 10 to 12 percent of the current U.S. portfolio of stocks is invested abroad. While this figure corresponds to recent large equity outflows, these figures remain relatively small from the perspec- tive of the long-run diversification benefits afforded by investing abroad. Tesar noted that this increased diversification has the potential to lead to contagion as losses may be more easily transmitted across markets. Finally, she com- mented that it was extremely difficult to isolate contagion empirically.
Stephen Friedman responded that institutional investors differ in their appe- tite for international exposure, with some seeking to allocate 20 percent of their portfolios abroad. He also noted that contagions and crises, by definition, involve greatly shaken confidence concerning the stricken market. For this and other reasons, he was highly doubtful about the creation of a private insurance fund to cover the risk of currency crises, as had been suggested by one of the participants. These crises are typically characterized by overshooting and enor- mous emotionality, requiring early returning participants to the market to be confident bargain hunters. Finally, Friedman noted, markets can correct them- selves relatively quickly as investors regain confidence.
Friedman speculated that the turnover rates of U.S. institutional investors are somewhat higher than in other countries. He noted that bankers can tailor offerings in a great variety of ways to satisfy the requirements of different issuers. George Hatsopoulos responded that the difference between the hori- zons of U.S. investors and European investors is small but perceptible. He noted that Thermo Electron had chosen a 5060 mix between U.S. and Euro- pean investors and found that mix to be optimal. Finally, Hatsopoulos com- mented that the spinout strategy employed by Thermo Electron is becoming a model for other firms. Other firms, however, are more sensitive to the disad- vantages of such a strategy, particularly the greater transparency of such a structure.

This Page Intentionally Left Blank