Embed Size (px)
Citation preview

PA P E R
M A R C H 2 0 1 9
E N V I R O N M E N T A N D N AT U R A L R E S O U R C E S
The Role of Electric Vehicles in Decarbonizing China’s Transportation SectorQinyu Qiao
Henry Lee

Environment and Natural Resources Program
Belfer Center for Science and International Affairs
Harvard Kennedy School
79 JFK Street
Cambridge, MA 02138
www.belfercenter.org/ENRP
The authors of this report invites use of this information for educational purposes, requiring only
that the reproduced material clearly cite the full source: Qiao, Qinyu, and Henry Lee “The Role of
Electric Vehicles in Decarbonizing China’s Transportation Sector.” Belfer Center for Science and
International Affairs, Cambridge, Mass: Harvard University, March 2018.
Statements and views expressed in this report are solely those of the authors and do not imply
endorsement by Harvard University, the Harvard Kennedy School, or the Belfer Center for Science
and International Affairs.
Design and layout by Andrew Facini
Cover photo: A man prepares to charge his electric-powered vehicle parked at a shopping mall in
Beijing, Monday, Sept. 11, 2017. (AP Photo/Andy Wong)
Copyright 2019, President and Fellows of Harvard College
Printed in the United States of America

E N V I R O N M E N T A N D N AT U R A L R E S O U R C E S
PA P E R
M A R C H 2 0 1 9
The Role of Electric Vehicles in Decarbonizing China’s Transportation SectorQinyu Qiao
Henry Lee

ii The Role of Electric Vehicles in Decarbonizing China’s Transportation Sector
About the Project
The Environment and Natural Resources Program at the Belfer Center for Science and International Affairs is at the center of the Harvard Kennedy School’s research and outreach on public policy that affects global environ-ment quality and natural resource management. Its mandate is to conduct policy-relevant research at the regional, national, international, and global level, and through its outreach initiatives to make its products available to decision-makers, scholars, and interested citizens.
More information can be found on ENRP’s web site at www.belfercenter.org/enrp or from associate director, Amanda Sardonis ([email protected]) at ENRP, Harvard Kennedy School, 79 JFK Street, Cam-bridge, MA 02138 USA.

iiiBelfer Center for Science and International Affairs | Harvard Kennedy School
About the Authors
Qinyu Qiao is a former predoctoral fellow at Belfer Center with the Envi-ronment and Natural Resources Program. He is a Ph.D. candidate at the Automotive Strategy Research Institute, Tsinghua University. He received his Bachelor's degrees of engineering and economics from Tsinghua University. His research focuses on energy and environment issues related to new energy vehicles. He previously conducted research for the central government of China with Professor Fuquan (Frank) Zhao, President Elect (2018-2020) of FISITA (International Federation of Automotive Engineering Societies).
Henry Lee is the Jassim M. Jaidah Family Director of the Environment and Natural Resources Program within the Belfer Center for Science and International Affairs at Harvard’s John F. Kennedy School of Government, Faculty Co-Chair of the Sustainability Science Program, and a Senior Lec-turer in Public Policy. He also serves on the board of the school’s Middle East Initiative. Before joining the School in 1979, Mr. Lee spent nine years in Massachusetts state government as Director of the State’s Energy Office and Special Assistant to the Governor for environmental policy. He has served on numerous state, federal, and private boards, and advisory com-mittees on both energy and environmental issues. His recent research interests focus on energy and transportation, China’s energy policy, and public infrastructure projects in developing countries.

vBelfer Center for Science and International Affairs | Harvard Kennedy School
Acknowledgements
This paper benefited from the assistance on analysis from Frank Zhao, President of the International Federation of Automotive Engineering Societies, and Han Hao, Tsinghua Automotive Strategy Research Institute, State Key Laboratory of Automotive Safety and Energy, Tsinghua University. The authors are particularly thankful to the following individuals for their insights and contributions:
Yufei Miao Stanford University Pu Wang Chinese Acadamey of Sciences Ting Wu McKinsey & Company Michael Davidson Harvard Kennedy School Wei Peng The Pennsylvania State University Zongwei Liu Tsinghua University Guansong Zhou McKinsey & Company Xinyuan Zhang McKinsey & Company Xue Guan McKinsey & Company
None of the individuals listed have any responsibility for the content of this paper, nor do they necessarily endorse its findings.


viiBelfer Center for Science and International Affairs | Harvard Kennedy School
Table of Contents
Executive Summary ...........................................................................1
Will China meet its EV goals? ............................................................................1
Will EV deployment reduce greenhouse gas emissions? .............................. 2
1. Introduction .................................................................................. 3
1.1 Carbon emissions from the transportation sector ............................. 3
1.2 A brief summary of major factors influencing future GHG emissions from China’s transportation sector ................ 4
2. Trends and Technology Analysis ................................................. 5
2.1 Development of policies on EVs in China ............................................. 5
2.2 Manufacturers and products in China ................................................. 9
2.3 Charging in the future ........................................................................... 11
2.4 Summary ...............................................................................................16
3. GHG Emission Impacts ...............................................................17
3.1 Vehicle specification and technology analysis ...................................17
3.2 Scope and assumptions ...................................................................... 19
3.3 GHG emission estimation per EV........................................................20
3.4 3.4 Lifecycle .......................................................................................... 24
3.5 Impacts on total GHG emissions in the passenger vehicle sector ... 25
4. Summary .....................................................................................28
4.1 Development of EVs in China ..............................................................28
4.2 Impacts on carbon emissions .............................................................28
5. Reference .......................................................................................30

A man prepares to charge his electric-powered vehicle parked at a shopping mall in Beijing, Monday, Sept. 11, 2017.
AP Photo/Andy Wong
1Belfer Center for Science and International Affairs | Harvard Kennedy School
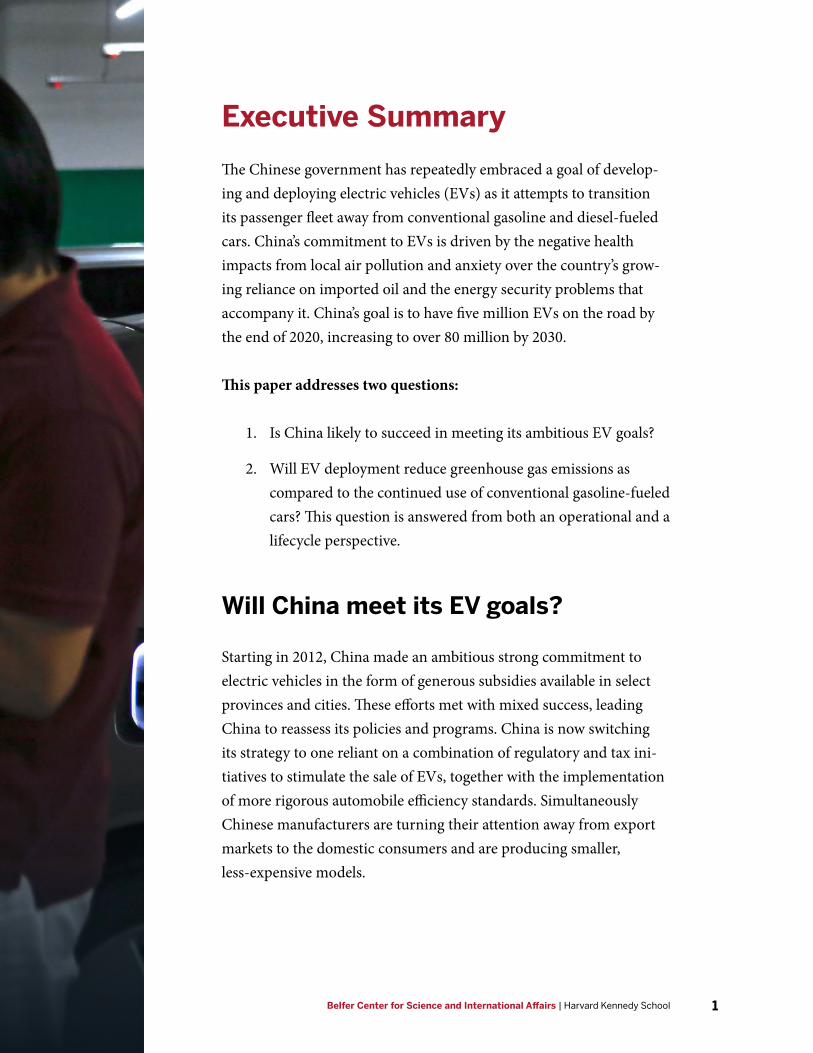
Executive Summary
The Chinese government has repeatedly embraced a goal of develop-ing and deploying electric vehicles (EVs) as it attempts to transition its passenger fleet away from conventional gasoline and diesel-fueled cars. China’s commitment to EVs is driven by the negative health impacts from local air pollution and anxiety over the country’s grow-ing reliance on imported oil and the energy security problems that accompany it. China’s goal is to have five million EVs on the road by the end of 2020, increasing to over 80 million by 2030.
This paper addresses two questions:
1. Is China likely to succeed in meeting its ambitious EV goals?
2. Will EV deployment reduce greenhouse gas emissions as compared to the continued use of conventional gasoline-fueled cars? This question is answered from both an operational and a lifecycle perspective.
Will China meet its EV goals?
Starting in 2012, China made an ambitious strong commitment to electric vehicles in the form of generous subsidies available in select provinces and cities. These efforts met with mixed success, leading China to reassess its policies and programs. China is now switching its strategy to one reliant on a combination of regulatory and tax ini-tiatives to stimulate the sale of EVs, together with the implementation of more rigorous automobile efficiency standards. Simultaneously Chinese manufacturers are turning their attention away from export markets to the domestic consumers and are producing smaller, less-expensive models.

2 The Role of Electric Vehicles in Decarbonizing China’s Transportation Sector
The major challenge to rapid commercialization of EVs in China is the development of an affordable and accessible charging infrastructure to service the growing number of electric cars. While third-party companies own most of the charging stations, the government is committed to ensure the installation of 7,400 fast-charging (60-100KW) stations and 2.5 million charging units in parking lots, apartment buildings, and office complexes in the Beijing, Tianjin, Hebei, Shanghai, and Guangdong provinces and lesser numbers in second-tier regions and the western provinces. In addi-tion, the provincial governments are subsidizing approximately 30% of the charging costs by keeping electricity tariffs artificially low.
While uncertainties remain, China is likely to meet its 2020 goal of five million EVs on the road by 2020, and there is a reasonable probability that it will meet its 2030 goal of 20% penetration by 2030 in many of its eastern provinces.
Will EV deployment reduce greenhouse gas emissions?
The answer depends heavily on the assumptions about the size of the vehicles and the coal intensity of the electric grid. Our study focuses on three of China’s largest population centers—Beijing, Shanghai, and Guangdong. It concludes that the greenhouse gas emissions per 100 kilometers of driving for an EV will range from 10.44 kilograms of CO2 equivalent per 100 kilometers to 17.94 kg CO2e per 100 km. The number for a gasoline equivalent vehicle is 18.24 kg CO2e per 100 km.
If the analysis is done on a lifecycle basis, the CO2 emission advantage of an EV decreases by about 36%, due to the high level of emissions in the production of batteries. Manufacturing an EV emits in the range of 0.93 tons to 3.47 tons of CO2e more than the production of a similar gasoline or diesel-fueled vehicle. This number is reduced if the EV is scrapped at the end of its useful life and the metal is recycled and used in the production of a new vehicle.
3Belfer Center for Science and International Affairs | Harvard Kennedy School
1. Introduction
1.1 Carbon emissions from the transportation sector
Global carbon emissions from the transportation sector are growing. According to the International Energy Agency (IEA), CO2 emissions from the transportation sector were approximately 7.8 Gt, accounting for around 24% of the total CO2 emissions from fuel combustion in 2017, and this per-centage is increasing.1 Currently, road transportation accounts for 70% of the CO2 emissions from this sector,2 while rail, air, and shipping account for less than 30%.3 To reduce these emissions, many countries are actively promot-ing electrification of passenger vehicles, light duty trucks, and trains.4
According to the Nationally Determined Contribution (NDC) plan sub-mitted by China, the country’s total CO2 emissions will peak before 2030, and CO2 intensity (measured as CO2 emissions per unit of GDP) will decrease by 60–65% compared to the 2005 level.5 In order to reach this target, China plans to reduce GHG emissions from both stationary and mobile sources. As the growth in emissions from the power sector declines, emissions from transportation sources will gain increased attention. This paper analyzes China’s efforts to reduce GHG emissions from passenger vehicles and assesses the potential for electric vehicles (EVs) to make a meaningful contribution to this effort.
1 International Energy Agency (IEA), 2017. CO2 emissions from fuel combustion, pg. 5-6. http://www.iea.org/publications/freepublications/publication/CO2EmissionsFromFuelCombustion2017Over-view.pdf (accessible August 2018).
2 International Energy Agency (IEA), 2017. CO2 emissions from fuel combustion, pg. 8. http://www.iea.org/publications/freepublications/publication/CO2EmissionsFromFuelCombustion2017Over-view.pdf (accessible August 2018).
3 Institut für Energie- und Umweltforschung Heidelberg (IFEU), 2008. Transport in China: energy consumption and emissions of different transports, p10-11. http://re.indiaenvironmentportal.org.in/files/IFEU_et_al(2008)_Transport_in_China_GB.pdf (accessible August 2018).
4 Lewis A M, Kelly J C, Keoleian G A, 2014. Vehicle lightweighting vs. electrification: life cycle energy and GHG emissions results for diverse powertrain vehicles. Applied Energy, 126: 13-20.
5 Chinese State Council, 2015. Enhanced actions on climate change: China’s Intended Na-tionally Determined Contributions (INDCs). https://www.sdpc.gov.cn/xwzx/xwfb/201506/t20150630_710204.html (accessible August 2018).

4 The Role of Electric Vehicles in Decarbonizing China’s Transportation Sector
The first part provides an assessment of China’s efforts to stimulate the rapid deployment of EVs. The second analyzes the GHG equivalent reductions from a 20% EV deployment scenario. It finds that under some assumptions, emissions will be reduced, but the total reduction will be less than many people believe due to the carbon intensity of battery manufacturing.
1.2 A brief summary of major factors influencing future GHG emissions from China’s transportation sector
In 2017, the ownership of vehicles in China exceeded 217 million, of which 78% were private passenger vehicles.6 Annual production and sales have grown dramatically from about 2.1 million in 2000 to 29.0 million in 2017.7 Currently, China manufactures about 25% of all the vehicles produced in the world.8 With the development of new energy technologies worldwide, China is striving for advanced vehicle models to replace Internal Combustion Engine Vehicles (ICEVs). The most promising option is the Battery Electric Vehicle (BEV or EV). Studies from the Intergovernmental Panel on Climate Change (IPCC),9 Triantafyllopoulos et al.,10 and Ma el al.11 point to the stark difference in energy efficiencies and emission factors between gasoline and electricity powered vehicles, demonstrating that internal combustion engines produce over 1.5 times as much GHG emissions per kilometer than electric engines. In the context of China, these studies raise additional questions. How fast will EVs penetrate the passenger vehicle market? What obstacles exist? What technology route will Chinese manufacturers adopt? Will batter-ies become less costly? Will they use different materials? How will supporting facilities and charging infrastructures evolve?
6 Traffic Management Bureau of the Public Security Ministry, 2017. National ownership of vehicles in 2017, http://www.mps.gov.cn/n2255040/n4908728/c5977158/content.html (accessible August 2018).
7 China Association of Automobile Manufacturers (CAAM), 2018. China Automotive Industry Year-book 2017, pg. 11-13. Yearbook Press.
8 Organisation Internationale des Constructeurs d’Automobiles (OICA), Global vehicle production. http://www.oica.net/category/production-statistics/2017-statistics/ (accessible August 2018).
9 Intergovernmental Panel on Climate Change (IPCC), 2006. IPCC Guidelines for National Greenhouse Gas Inventories, p2.16-2.17. https://www.ipcc-nggip.iges.or.jp/public/2006gl (accessible August 2018).
10 Triantafyllopoulos G, Kontses A, Tsokolis D, et al., 2017. Potential of energy efficiency technologies in re-ducing vehicle consumption under type approval and real world conditions. Energy, 2017, 140: 365-373.
11 Ma C, Li S, Ge Q, 2014. Greenhouse gas emission factors for grid electricity for Chinese provinces. Resources Sci 2014; 36(5): 1005–12.

5Belfer Center for Science and International Affairs | Harvard Kennedy School
2. Trends and Technology Analysis
2.1 Development of policies on EVs in China
EVs were first developed over one hundred years ago. However, due to their high cost and limited range, consumers preferred gasoline-fueled vehicles. In early 1900, EVs were about three times more expensive than the same level ICEVs, but only had half the range. By 1916, auto manu-facturers stopped making electric cars and focused their production on internal combustion engines. Over the past twenty years, Ford, General Motors (GM), Toyota, and Honda have been improving EV technology, but many of their ideas have not resulted in commercial products due to the limitations of political, economic, and safety factors.12
In China, the first modern passenger EV was developed by BYD in 2006. It used LiFePO4 (LFP) as the cathode material for its battery. In the same year, the central government began to support the development of the EV industry. For example, several research projects on new energy vehi-cles were selected by China’s advanced technology stimulation initiative, the “863 Program,” for long-term technology development. In 2008, the Beijing Government used 50 electric buses during the Olympics, aiming to promote the industry. In subsequent years, a series of supporting poli-cies were enacted, including the Energy Saving and New Energy Vehicles Development Plan (2012-2020), subsidies for consumers (up to 50% of the price), and stringent fuel economy and emission standards.13
Early efforts were focused on gaining global competitive advantage for Chinese manufacturers.14 Climate, energy, and environmental policy considerations
12 Situ L, 2009. Electric vehicle development: the past, present & future//Power Electronics Systems and Applications. PESA 2009. 3rd International Conference on Power Electronics Systems and Applications (PESA). IEEE, 2009: 1-3.
13 Pan A, Chen T, 2016. Electric vehicle development in China and its power quality challenges to distribution grid. IET: 2-4.
14 Chinese State Council, 2009. Adjustment and Revitalization Plan on Automotive Industry, http://www.gov.cn/zwgk/2009-03/20/content_1264324.htm (accessible August 2018).

6 The Role of Electric Vehicles in Decarbonizing China’s Transportation Sector
were secondary drivers. Benefiting from the support of the government, through large subsidies, the production and sale of EVs increased rapidly. According to the Development Plan, the annual production of EVs is expected to reach two million by 2020.15 Figure 1 presents the recent production and sale of EVs in China, which were 250,000 in 2015, 410,000 in 2016, and 660,000 in 2017,16 indicating an average annual growth rate of about 60%. If China can achieve its ambition of a total of five million EVs produced in the 2015-2020 period, the penetration level will between 2% and 3% of its total fleet.
Figure 1: Production of EVs in China16
According to Qingtai Chen, Chair of the China EV100 Conference, if manu-facturers fulfill their development plan, there could be 80 million EVs on the roads by 2030—approximately a 20% penetration rate.17 New regulations, including the Corporate Average Fuel Consumption (CAFC) regulation and new energy vehicle credits, will replace the subsidies which were reduced by 20% in 2017-2018, and scheduled to be lowered by another 40% in
15 Chinese State Council, 2012. Energy Saving and New Energy Vehicles Development Plan (2012–2020), section 3. http://www.gov.cn/zwgk/2012-07/09/content_2179032.htm (accessible August 2018).
16 China Association of Automobile Manufacturers (CAAM), 2018. China Automotive Industry Year-book 2017, p20-21. Yearbook Press.
17 Chen Q, 2017. Ownership of EVs will reach 80 million in China in 2030, China EV100 forum, http://news.163.com/17/1111/22/D30BHEGI000187VE.html (accessible August 2018).
7Belfer Center for Science and International Affairs | Harvard Kennedy School
2019-2020.18 The size of most of the EVs produced in China has been closer to the smaller EVs because of their lower cost.
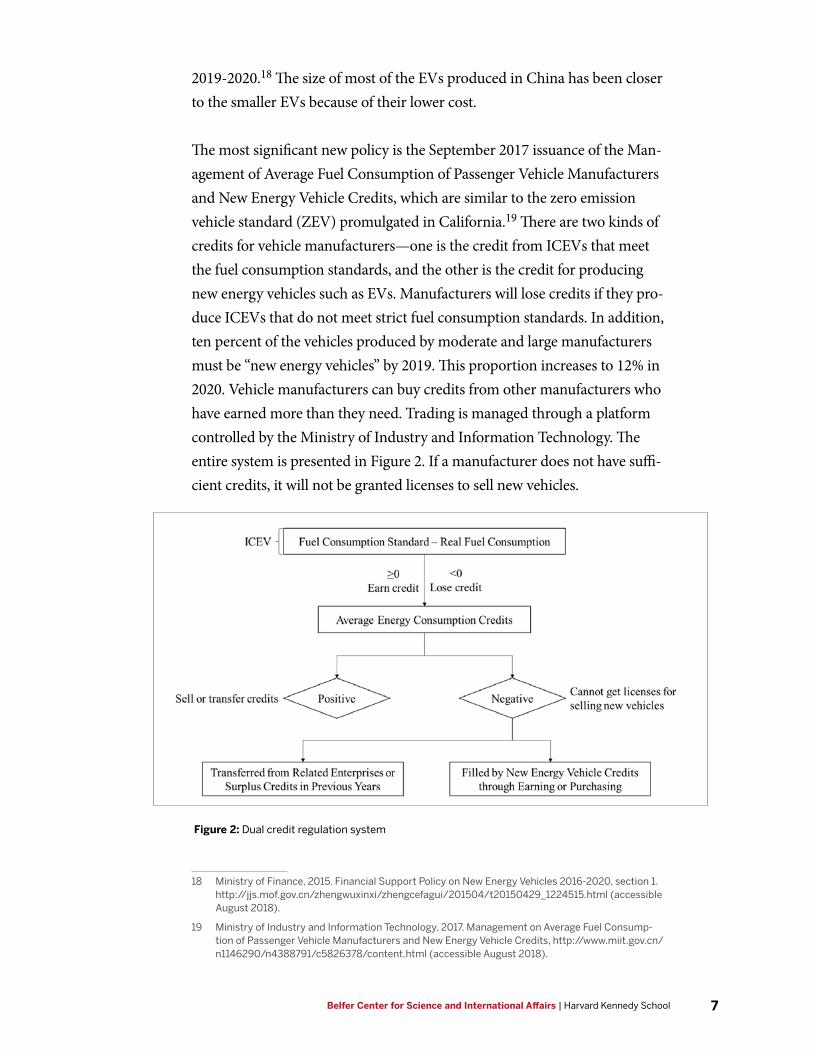
The most significant new policy is the September 2017 issuance of the Man-agement of Average Fuel Consumption of Passenger Vehicle Manufacturers and New Energy Vehicle Credits, which are similar to the zero emission vehicle standard (ZEV) promulgated in California.19 There are two kinds of credits for vehicle manufacturers—one is the credit from ICEVs that meet the fuel consumption standards, and the other is the credit for producing new energy vehicles such as EVs. Manufacturers will lose credits if they pro-duce ICEVs that do not meet strict fuel consumption standards. In addition, ten percent of the vehicles produced by moderate and large manufacturers must be “new energy vehicles” by 2019. This proportion increases to 12% in 2020. Vehicle manufacturers can buy credits from other manufacturers who have earned more than they need. Trading is managed through a platform controlled by the Ministry of Industry and Information Technology. The entire system is presented in Figure 2. If a manufacturer does not have suffi-cient credits, it will not be granted licenses to sell new vehicles.
Figure 2: Dual credit regulation system
18 Ministry of Finance, 2015. Financial Support Policy on New Energy Vehicles 2016-2020, section 1. http://jjs.mof.gov.cn/zhengwuxinxi/zhengcefagui/201504/t20150429_1224515.html (accessible August 2018).
19 Ministry of Industry and Information Technology, 2017. Management on Average Fuel Consump-tion of Passenger Vehicle Manufacturers and New Energy Vehicle Credits, http://www.miit.gov.cn/n1146290/n4388791/c5826378/content.html (accessible August 2018).

8 The Role of Electric Vehicles in Decarbonizing China’s Transportation Sector
According to Miao, approximately 42 of the 123 auto manufacturers operating in China will not meet their credit requirements without chang-ing their product mix and will be forced to buy credits. This number is expected to decrease as companies change their production quotas or merge their operations.
Additional consumer-oriented incentives include:
1. Tax cuts: Consumers can buy EVs without paying sales taxes until December 2020.20
2. Increased investment in charging infrastructure: The government has set a goal of 12,000 charging stations and 4.8 million charging piles available by 2020.21
3. Greater investment in advanced batteries: China’s goal is to realize an energy density for battery units of 300 Wh/kg. Battery costs should be reduced to 1.3 yuan/kWh and be functional over an expanded range between -30 and +55 degrees centigrade by 2020. Further, all charging facilities should realize the 3C (China Compulsion Certification) standard, for consistency, safety and stability.22
These policies aim to make EVs more attractive to consumers and comple-ment the regulatory incentives mentioned above.
In short, with the help of generous government support, China’s EV indus-try is poised to experience rapid growth.
20 Ministry of Finance, 2017. Announcement about the Exempted Purchase Tax of New Energy Vehi-cles, section 1. http://www.chinatax.gov.cn/n810341/n810755/c2985330/content.html (accessible August 2018).
21 National Development and Reform Commission (NDRC), 2015. Development Plan of Charging Facilities for Electric Vehicles (2015-2020), p8-10. http://www.ndrc.gov.cn/zcfb/zcfbtz/201511/W020151117576336784393.pdf (accessible August 2018).
22 Ministry of Industry and Information Technology, 2017. Development Plan of Promotion on Traction Batteries, section 2. http://www.miit.gov.cn/n1146295/n1652858/n1652930/n3757018/c5505456/content.html (accessible August 2018).

9Belfer Center for Science and International Affairs | Harvard Kennedy School
2.2 Manufacturers and products in China
All of the qualified EVs are listed on the website of the Ministry of Indus-try and Information Technology, but not all of them are actually for sale. According to an interview with an officer in the Ministry of Industry and Information Technology,23 some auto manufacturers in China apply for qualifications of new vehicles to ensure they can sell them in the future, but the vehicles are not actually available today.
As shown in Table 1, most of the EVs sold in China are low-cost A0 (sub-compact) and A class (compact) vehicles, and their performance level barely meets government standards. The sale prices, including the subsidy of low-end EVs, is only about 30% of the original prices sought by manu-facturers, which indicates a very low or zero profit margin. Most Chinese manufacturers prefer to produce small EVs because they have historically been more marketable. Facing a growing market, most Chinese manu-facturers have opted to concentrate on small EVs, but there are several companies who are continuing to focus on larger models.
Table 1: Top 10 selling EVs, 201724
Manufacturer Model Class Range (km) Top Speed (km/h) Sales
BAIC EC A0 156~162 100 78,079
ZD D2 A0 155 80~100 42,342
Chery eQ A0 200 100 25,784
JAC iEV A 166~180 104~120 24,210
BYD e5 A 305 130 23,601
Geely Emgrand EV A 300 140 23,324
Ztoye E200 A0 160 120 16,751
JMC E200 A0 152 100 15,980
Changan Benben EV A0 180 125 14,549
BAIC EU A 260 140 13,158
23 Private interview with an officer in the Ministry on China’s vehicle qualification.
24 China Passenger Car Association (CPCA), 2017. New energy vehicle monthly report. http://www.cpcaauto.com/news.asp?types=bgzl&anid=78&nid=14 (accessible August 2018).

10 The Role of Electric Vehicles in Decarbonizing China’s Transportation Sector
BYD was one of the first EV manufacturers in China. Based on their battery technology, the BYD e-series models became quite popular. Changjiang Zhao, director of BYD sales, announced that BYD planned to produce and sell 200,000 new energy vehicles in 2018.25 In order to achieve this goal, the company altered its strategic plan. First, BYD decided to pay more attention to small cities, which could become a potential market for EVs after 2020 when the national subsidies are removed. Secondly, BYD wants to improve the performance of low-end EVs in the belief that better performance will provide their vehicles with a competitive advantage. Finally, BYD regards ICEV manufacturers, not other EV manufacturers, as their competition. That is to say, the performance of new EVs will be com-pared with ICEVs with similar characteristics.
BAIC Motor adopted a very different business plan. Alternative-fueled vehicles have been an important part of the company’s long-term strategy. Their EV models have covered all the classes from A0 to SUV/MPV. In 2016, the BAIC Group established an EV subsidiary—BAIC BJEV. In 2017, it reached a cooperative agreement with Daimler and invested five billion yuan for EV development. According to the BAIC 2018 strategic plan, the sales of new energy vehicles will be 150,000 in 2018 and most of them will be high quality EVs.26 Furthermore, Kefeng Wang, Deputy Director of BAIC New Energy, announced that the company will concentrate on producing EVs for the high-end market,27 by focusing on developing an advanced EV research program and a powerful supply chain.
While Chinese manufacturers are adopting different strategies, it is likely, however, that after the subsidies are removed, the leading EVs in China will be more concentrated in low-end than high-end models, which can be sold in small cities to middle-income families. The BAIC strategy may benefit from niche motorists, but it is unlikely to gain a large share of the Chinese market.
25 Auto Weekly, 2018. BYD has set a sales target of 200,000 new energy vehicles, http://epaper.xxsb.com/html/content/2018-01/25/content_723402.html (accessible August 2018).
26 Beijing Automotive Industry Corporation (BAIC), 2017. Annual Performance and 2018 Strategy, sec-tion 3. http://www.baicgroup.com.cn/news_detail.php?type=2&id=1933 (accessible August 2018).
27 Iyiou Auto News, 2017. Interview with Kefeng Wang, Deputy Director of BAIC New Energy, https://www.iyiou.com/p/52904 (accessible August 2018).

11Belfer Center for Science and International Affairs | Harvard Kennedy School
2.3 Charging in the future
Charging is one of the biggest challenges in China for EV deployment. Unlike gasoline fueling, charging takes a long time and is plagued by insuf-ficient investment. In this section, four questions will be addressed: 1) How available will a charging infrastructure be in the future? 2) Who will be responsible for building, owning, and operating this infrastructure? 3) How will the power be priced? 4) Will the electricity industry be able to meet the incremental demand?
The installation of charging infrastructures has attracted heightened atten-tion from both government and manufacturers. As mentioned in section 2.1 of this paper, the Chinese State Council issued an investment plan for establishing a national charging infrastructure. As shown in Figure 3, the plan divided the whole country into three regions. The first-tier area consists of provinces with the largest EV sales, including Beijing, Tianjin, Hebei, Shanghai, and Guangdong. About 7,400 charging stations (fast charging) and 2.5 million charging units (slow charging) are expected to be built in these areas before 2020 to meet the projected needs of 2.66 million EVs. The numbers for the second-tier area, including Jilin, Henan, Hunan, Chongqing, Sichuan, etc., will be 4,300 charging stations and 2.2 million charging piles to meet the needs of 2.33 million EVs. Other provinces from third tier regions, like Xizang, Qinghai, and Xinjiang are not included in the national EV development plan. In this area, 400 charging stations and 100,000 charging piles will be built to meet the needs of 110,000 EVs.28
28 National Development and Reform Commission (NDRC), 2015. Development Plan of Charging Facilities for Electric Vehicles (2015-2020), p10-12. http://www.ndrc.gov.cn/zcfb/zcfbtz/201511/t20151117_758762.html (accessible August 2018).

12 The Role of Electric Vehicles in Decarbonizing China’s Transportation Sector
Figure 3: Charging facility development plan for 202028,29
In Beijing, 100% of the parking lots linked to residential buildings are expected to have charging piles by 2020, and the numbers for parking lots at offices, schools, and hospitals will be 25%, 20%, and 15%, respectively. EV owners should be able to find at least one charging location within 0.9 kilometers in busy neighborhoods and within five kilometers in other areas of Beijing.29
The plan announced by the government is quite broad, and the EV manufac-turers and third-party companies will be responsible for its implementation and will own most of the charging facilities. Some EV manufacturers have chosen to operate their own charging units, and the government will support these companies through subsidies. For example, BYD had already built 4,600 charging piles, and it plans to build another 30,000.
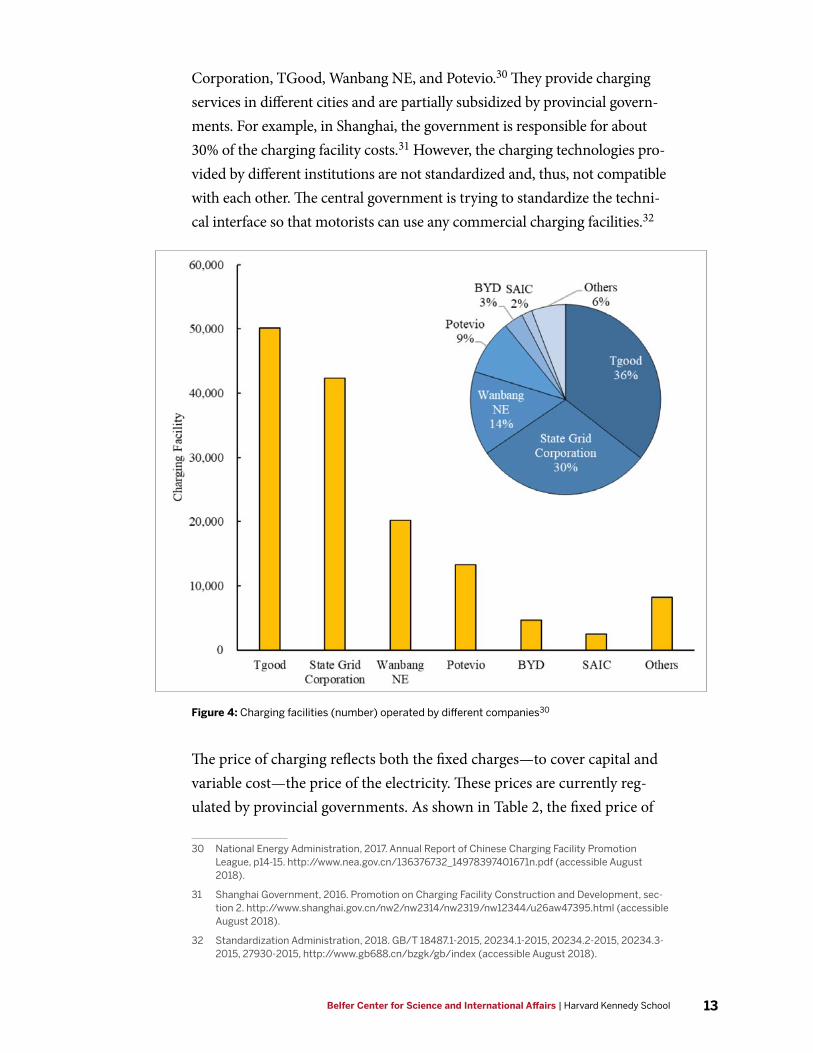
As presented in Figure 4, until the end of 2017, about 90% of the charging facilities are built, operated, and owned by four companies: State Grid
29 Beijing Government, 2017. Enhancements on the Construction of Charging Facilities, section 2. http://zhengce.beijing.gov.cn/library/192/33/50/438650/1279821/index.html (accessible Au-gust 2018).
13Belfer Center for Science and International Affairs | Harvard Kennedy School
Corporation, TGood, Wanbang NE, and Potevio.30 They provide charging services in different cities and are partially subsidized by provincial govern-ments. For example, in Shanghai, the government is responsible for about 30% of the charging facility costs.31 However, the charging technologies pro-vided by different institutions are not standardized and, thus, not compatible with each other. The central government is trying to standardize the techni-cal interface so that motorists can use any commercial charging facilities.32
Figure 4: Charging facilities (number) operated by different companies30
The price of charging reflects both the fixed charges—to cover capital and variable cost—the price of the electricity. These prices are currently reg-ulated by provincial governments. As shown in Table 2, the fixed price of
30 National Energy Administration, 2017. Annual Report of Chinese Charging Facility Promotion League, p14-15. http://www.nea.gov.cn/136376732_14978397401671n.pdf (accessible August 2018).
31 Shanghai Government, 2016. Promotion on Charging Facility Construction and Development, sec-tion 2. http://www.shanghai.gov.cn/nw2/nw2314/nw2319/nw12344/u26aw47395.html (accessible August 2018).
32 Standardization Administration, 2018. GB/T 18487.1-2015, 20234.1-2015, 20234.2-2015, 20234.3-2015, 27930-2015, http://www.gb688.cn/bzgk/gb/index (accessible August 2018).

14 The Role of Electric Vehicles in Decarbonizing China’s Transportation Sector
the charging services in Shanghai must be lower than 1.3 yuan/kWh, and the electricity price must reflect the daily average residential electricity price, about 0.5 yuan/kWh. That is to say, EV owners in Shanghai have to pay only 1.8 yuan/kWh (1.3 charging service fee and 0.5 electricity fee) (about 27 yuan/100km) for public charging. The Shanghai government has additionally committed to provide a subsidy of 0.2 yuan/kWh for public charging service suppliers (up to 1,000 kWh per facility per year) before 2020. The price of charging in Beijing is fixed at 0.8 yuan/kWh, and the price of electricity in residential areas fluctuates with the time of day, rang-ing from 0.4 to 1.0 yuan/kWh. All these prices are subsidized
Table 2: Fuel costs benchmark for EVs and ICEVs33
VehicleFuel consumption per 100km
Cost (yuan/100km)
Shanghai Beijing
EV 15 kWh 27 18-27
ICEV 6.5 L 46 46
*A0-A class passenger vehicles*Price of #92 gasoline34 is about 7 yuan/L in China 2018.
The government has used its regulatory authority to keep electricity prices low, but starting in 2020, these price restrictions will be eased and charging prices are likely to increase. According to recent studies, the cost of similar facilities in the United States is quite high. The installation and equipment of a simple residential level 2 charger in the United States (approximately 6.6 kWh), costs about $2,354, while the commercial chargers (including fast charging stations) are more expensive, with costs ranging from $19,648 to $192,626.35 Although cost data is not available for China, higher equip-ment and installation costs will influence the price of charging services in the future. Political resistance to price increases will fluctuate with changes in the penetration rate of EVs. However, efforts to keep the tariffs low to meet political pressures will increase the demand for more charging units, but decrease the supply. At some point, investors will either find it
33 Hao H, Cheng X, Liu Z, Zhao F, 2017. Electric vehicles for greenhouse gas reduction in China: A cost-effectiveness analysis. Transportation Research Part D: Transport and Environment 56: 68-84.
34 Gasoline with 92 octane value, normally used for small ICEVs.
35 Lee, H, Alex C, 2018. Charging the Future. Paper, Environment and Natural Resources Program, Belfer Center, Harvard University.

15Belfer Center for Science and International Affairs | Harvard Kennedy School
intolerable to keep losing money, or the government will find it too expen-sive to maintain its generous subsidies.
As presented by Table 3, with more and more EVs taking the place of ICEVs, the energy burden will shift from oil to electricity.36 According to forecasts by the State Grid Corporation, the load on the power grid will increase by up to 12% in 2020. Residential and commercial buildings will see the largest increases. It is in these sectors that the demand from EV charging will appear. However, if the charging behavior can be guided to off peak hours and distributed uniformly, the increase in the daily power load from EV deployment will be lower. Since people’s charging behaviors are random, several statistical methods, including fuzzy reasoning and the Monte Carlo method, are used to forecast electricity demand. These fore-casts are not exact, since consumer behavior is continuously changing as people adjust to new products. Governments need to be increasingly sensi-tive to where charging facilities are located.
Table 3: Power grid load influenced by EV charging in 202036
Place IndicatorWithout EV charging (MW)
With EV charging (MW)
Average increase
ResidentialMin-Max 1.92-3.18 1.92-3.58 12%
Ratio* 0.39 0.46 7%
OfficeMin-Max 2.20-3.20 2.30-3.60 12%
Ratio* 0.32 0.36 4%
CommercialMin-Max 1.89-2.50 1.91-2.70 8%
Ratio* 0.24 0.29 5%
Residential (orderly)
Min-Max 1.92-3.18 2.09-3.20 2%
Ratio* 0.39 0.31 -8%
*Ratio refers to the peak-valley difference ratio, equal to (peak load - valley load)/peak load.
36 Su X, Y Z, Wu Z, X Y, 2018. Forecasting the Charging Load of Large-scale Electric Vehicle and Its Impact on the Power Grid, Modern Electric Power.

16 The Role of Electric Vehicles in Decarbonizing China’s Transportation Sector
2.4 Summary
Based on the analysis of these four questions, China will need to continue to support the installation of charging facilities. Third-party companies will be responsible for most of these facilities, including investment and operations. Provincial governments will provide subsidies to cover a part of the installation cost. These third party companies can charge service fees, but these fees will be limited by government regulations, at least until 2020. Charging EVs will add some load to the power grid. In a scenario in which China achieves the five million EV target by 2020, the geographic and tem-poral pattern of this growth will determine whether the grid operators will be able to efficiently manage this incremental demand.

17Belfer Center for Science and International Affairs | Harvard Kennedy School
3. GHG Emission Impacts
3.1 Vehicle specification and technology analysis
Since most of the EVs in China will be in the A0-A class, we have chosen an average A0-A class EV as the reference vehicle for our analysis. The technical parameters are presented in Table 4, and they are similar to those of the BAIC EV-series. The curb weight is about 1,464 kg, including the battery, which weighs 164 kg. According to Table 1, the curb weights of the bestselling EVs in 2016 and 2017 range from about 1,300 kg to 1,600 kg,37 so we assume a ±10% interval for the weight of the vehicle and its battery. The battery capacity is affected by the weight, since we assume the energy density is fixed.
Table 4: Vehicle specification- class A0-A
Vehicle Battery
Li(NiCoMn)O2(NMC)
Curb Weight (kg) 1,464 (±10%) Battery Weight (kg) 164 (±10%)
Capacity (kWh) 27 (±10%)
Vehicle Materials Battery Material
Steel 66% Cathode Material 28%
Aluminum 7% Aluminum 26%
Copper 6% Copper 25%
Iron 2% Others 21%
Others 19%
*Similar to BAIC EV-series
As the weight distributions of these vehicles are similar worldwide, we use the general parameters from the Automotive System Cost Model (ASCM) established by Oak Ridge National Laboratory.38 Some additional parameters, such as the weight distribution of components and fluids, are extrapolated from the Greenhouse Gases, Regulated Emissions, and Energy
37 Autohome, 2018. Vehicle parameters index, https://www.autohome.com.cn (accessible August 2018).
38 Das S, 2004. A Comparative Assessment of Alternative Powertrains and Body-in-White Materials for Advanced Technology Vehicles. SAE Technical Paper: 01-0573

18 The Role of Electric Vehicles in Decarbonizing China’s Transportation Sector
Use in Transportation (GREET) model developed by the Argonne National Laboratory (ANL).39 The material compositions for different components are estimated based on engineer investigations, extrapolated from existing reports and literature reviews.40
Some studies provide different material compositions of EVs, reflecting EV models sold in other countries. For example, Bauer et al. carried out the Life Cycle Assessment (LCA) for EVs assuming a 1,977 kg EV in 2012 and a 1,643 kg EV in 2030 (the weight reduction was mainly attributed to the use of lightweight materials, such as aluminum).41 Hawkins et al. uses the EV specification from the Ecoinvent and Daimler AG databases. In their analysis, the total weight of an EV without batteries was about 1,900 kg, and the weight of a Li-ion battery was about 212 kg.42 The total weight of an EV is heavier in advanced countries than in China due to the adoption of different technologies.
Our battery specifications assume the development of a battery industry in China as opposed to importing the batteries from Japan, Korea, or the United States. We believe that the Li(NixCoyMn1-x-y)O2 (NMC) battery is likely to become dominant due to its higher energy density.43 The material inventory is based on the Battery Performance and Cost (BatPaC) model,44
and the energy storage parameters are from the GREET model.
39 Argonne National Laboratory, 2018. Greenhouse Gases, Regulated Emissions, and Energy Use in Transportation (GREET) Model. https://greet.es.anl.gov/. (accessible December 2018).
40 Burnham A, 2012. Updated vehicle specifications in the GREET vehicle-cycle model. Argonne Na-tional Laboratory.
41 Bauer C, Hofer J, Althaus HJ, Duce AD, Simons A, 2015. The environmental performance of current and future passenger vehicles: life cycle assessment based on a novel scenario analysis framework. Applied Energy,157:871–83.
42 Hawkins TR, Singh B, Majeau-Bettez G, Stromman AH, 2013. Comparative environmental life cycle assessment of conventional and electric vehicles. Journal of Industrial Ecology, 17(1): 53-64.
43 China Association of Automobile Manufacturers (CAAM), 2016. The development of Chinese auto-mobile industry annual report. Social Sciences Academic Press.
44 Nelson PA, Gallagher KG, Bloom I, Dees DW, 2011. Modeling the performance and cost of Lithi-um-Ion batteries for electric-drive vehicles. Argonne National Laboratory.

19Belfer Center for Science and International Affairs | Harvard Kennedy School
3.2 Scope and assumptions
An entire life cycle framework of EVs in China is presented in Figure 5. In this paper, the pre-manufacturing, manufacturing, operations, and recycling processes are all taken into consideration. The energy and materials consumed during a vehicle’s lifetime are the inputs, and the emissions are the output. This paper will first compare emissions of EVs to those of gasoline-fueled vehicles, looking only at operations. In the subsequent section, we will add carbon emissions from the manufacturing and recycling stages—a life cycle analysis.
Figure 5: Life cycle scope of GHG emissions of EVs in China
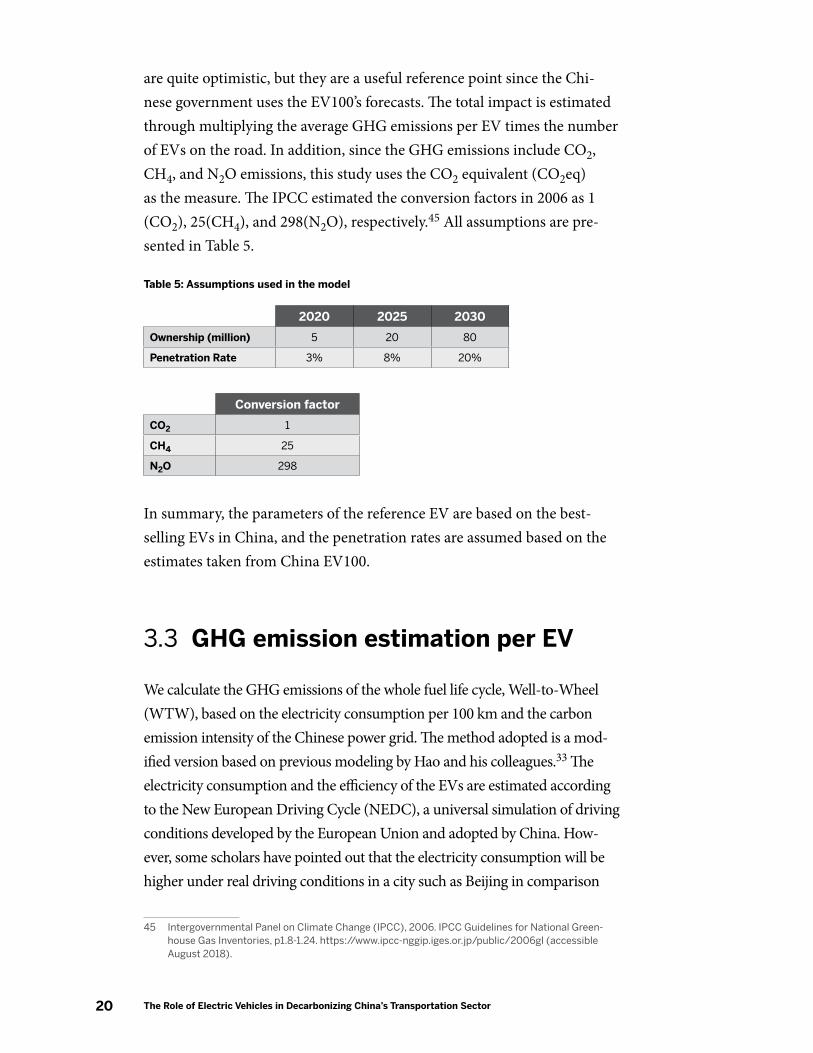
In order to determine the total impact of EVs on GHG emissions, we assume three penetration rates from 2020 to 2030 based on our analysis in section 2. The assumptions for 2025 are estimated using a linear growth value, and the production and penetration rates in 2030 are based on pre-dictions by Qingtai Chen17, Director of China EV100. These predictions
20 The Role of Electric Vehicles in Decarbonizing China’s Transportation Sector
are quite optimistic, but they are a useful reference point since the Chi-nese government uses the EV100’s forecasts. The total impact is estimated through multiplying the average GHG emissions per EV times the number of EVs on the road. In addition, since the GHG emissions include CO2, CH4, and N2O emissions, this study uses the CO2 equivalent (CO2eq) as the measure. The IPCC estimated the conversion factors in 2006 as 1 (CO2), 25(CH4), and 298(N2O), respectively.45 All assumptions are pre-sented in Table 5.
Table 5: Assumptions used in the model
2020 2025 2030
Ownership (million) 5 20 80
Penetration Rate 3% 8% 20%
Conversion factor
CO2 1
CH4 25
N2O 298
In summary, the parameters of the reference EV are based on the best-selling EVs in China, and the penetration rates are assumed based on the estimates taken from China EV100.
3.3 GHG emission estimation per EV
We calculate the GHG emissions of the whole fuel life cycle, Well-to-Wheel (WTW), based on the electricity consumption per 100 km and the carbon emission intensity of the Chinese power grid. The method adopted is a mod-ified version based on previous modeling by Hao and his colleagues.33 The electricity consumption and the efficiency of the EVs are estimated according to the New European Driving Cycle (NEDC), a universal simulation of driving conditions developed by the European Union and adopted by China. How-ever, some scholars have pointed out that the electricity consumption will be higher under real driving conditions in a city such as Beijing in comparison
45 Intergovernmental Panel on Climate Change (IPCC), 2006. IPCC Guidelines for National Green-house Gas Inventories, p1.8-1.24. https://www.ipcc-nggip.iges.or.jp/public/2006gl (accessible August 2018).

21Belfer Center for Science and International Affairs | Harvard Kennedy School
with the NEDC,46 so we adopt the “real” driving data for our electricity con-sumption estimates. Since our reference vehicle is quite similar to the BAIC EV150 (range: 150 km, capacity: 25.6 kWh, curb weight: 1,310 kg), electricity consumption can be estimated based on this vehicle’s performance, with an electricity consumption rate of about 15 kWh/100km. The BAIC EV150 uses a LFP battery, which is different from the reference vehicle. This difference does not influence our estimates of electricity consumption and range, which can be derived through the NEDC estimation equation (1)-(2):
(1)
(2)
where Cf is the energy consumption per kilogram per 100 km driving in China (about 0.009 kWh/kg-100km); The variables C, B, R, and W refer to the constant electricity consumption, battery capacity, range, and curb weight of the reference vehicle, respectively; CB, BB, RB, and WB indicate the same parameters of the baseline vehicle (BAIC EV150). The electricity consumption and range of the reference vehicle are estimated at 15.07-17.71 kWh/100 km and 141.7-147.4 km.
Since the GHG emission intensity of the power sector differs from one region to another, we estimate the provincial average emission rate of Beijing (983 g-CO2eq/kWh), Shanghai (809 g-CO2eq/kWh), and Guangdong (687 g-CO2eq/kWh), where EVs are relatively more popular, due to their access to inexpensive hydro-electricity.11 According to the capacity of these cities,47 the final weighted average factor of power generating capacity is 729.6 g-CO2eq/kWh. This number was quite stable in the period 2013-2015,48 but with the greater penetration of renewable and nuclear energy, it is likely to decrease in the future.49 We use the 2015 factor, since the forecasts of installed renewable capacity are uncertain. Considering that the emissions factors in these three
46 Gong H, Zou Y, Yang Q, Fan J, Sun F, Goehlich D, 2018. Generation of a driving cycle for battery elec-tric vehicles:A case study of Beijing. Energy 150: 901-912
47 National Bureau of Statistics of China (NBSC). 2018. Annual Provincial Power Generation. http://data.stats.gov.cn/easyquery.htm?cn=C01 (Accessible December 2018).
48 Peng T, Ou X, Yan X, 2018. Development and application of an electric vehicles life-cycle energy consumption and greenhouse gas emissions analysis model. Chemical Engineering Research and Design; 131:699-708
49 Li X, Chalvatzis K, Pappas D, 2018. Life cycle greenhouse gas emissions from power generation in China’s provinces in 2020. Applied Energy 223: 93-102

22 The Role of Electric Vehicles in Decarbonizing China’s Transportation Sector
areas range from 687 to 983 g-CO2eq/kWh, indicating a peak-valley difference ratio of about 40%, we assume an adjustment interval of ±20% for the average emission factor. We realize that the three selected locations have taken more stringent steps to reduce their use of coal than most provinces, thus our emis-sions calculation is probably lower than that for all of China, but it provides a good estimate for three of the country’s largest population centers.
Using our assumptions, the GHG emissions per 100 km of an EV from the use phase can be calculated through equation (3):
(3)
where E is the GHG emissions per 100 km; EF is the emission factor of elec-tricity in China; ε is the charging efficiency, which is about 90%;33 and γ is the power generation efficiency after line loss, which is about 93.66% in China.50 Therefore, the result is a range between 10.44-17.94 kg-CO2eq/100 km.
At the same time, the annual mileage and lifetime of A0-A class EVs in China is about 15,000 km and up to 10 years, or over the life of the vehicle. Using these parameters, GHG emissions in the use phase are calculated and pre-sented in Table 6 and Figure 6. The total GHG emissions of our model EV range from 15.66-26.92 t-CO2eq over its ten-year life. The error intervals are presented in Figure 6 by the horizontal lines, which are caused by uncertainties around the size of future EVs and where the electricity is used and generated.
In comparison, the fuel consumption of an ICEV with similar perfor-mance, such as BAIC D20, is about 6.5 L/100 km (#92 gasoline, 32 MJ/L). In order to ensure comparability, the emissions of gasoline are also from the Well-to-Wheel (WTW) perspective. The life cycle emission factor of gasoline is about 87.7 g-CO2eq/MJ, which is estimated based on the gas-oline transformation process, including oil drilling and catalytic refining, in China51. The calculated GHG emissions of driving an ICEV are 18.24 kg-CO2eq/100 km, and the total level from the entire ICEV driving during
50 Chinese Electricity Council, 2015. Situation of China’s electricity industry. http://www.cec.org.cn/guihuayutongji/gongxufenxi/dianliyunxingjiankuang/2015-02-02/133565.html (accessible August 2018).
51 National Development and Reform Commission (NDRC), 2014. Chinese low carbon development and training materials of listing of provincial greenhouse gas, http://qhs.ndrc.gov.cn/gzdt/201403/t20140328_604827.html (accessible August 2018).

23Belfer Center for Science and International Affairs | Harvard Kennedy School
its lifetime is 27.36 tons of t-CO2eq. These figures do not reflect emissions at the point of manufacturing.
Therefore, as presented by Figure 6, under the ideal situation with small EVs and clean power grid if an EV replaces and ICEV, GHG emissions in the operational phase in our three regions range from a reduction of 43% to a reduction of 2%. The impacts on the entire lifecycle, including production and scrappage of both the EV and ICEV, are analyzed in the next section.
Table 6: Total GHG emissions from the use phase
Vehicle EV ICEV
Energy Consumption (kWh/100 km, L/100 km) 15.07 - 17.71 6.5
Annual Mileage (km) 15,000 15,000
Lifetime (year) 10 10
Emissions per 100 km (kg-CO2eq/100 km) 10.44-17.94 18.24
Total GHG emissions (t-CO2eq) 15.66-26.92 27.36
Figure 6: GHG emissions from the use phase
24 The Role of Electric Vehicles in Decarbonizing China’s Transportation Sector
3.4 Lifecycle
When it comes to determining the whole lifecycle influence of EVs, the production phase and recycling phase must be taken into consideration. Several Chinese scholars have already calculated the Cradle-to-Gate (CTG, also known as the production phase) and Grave-to-Cradle (GTC, also known as the recycling phase) GHG emissions of EVs52,53,54 Their results should be modified to match the vehicle specification in this study. In short, the CTG GHG emissions of an A0-A class EV with NMC battery are estimated at 11.40-13.94 t-CO2eq, and at 10.47 t-CO2eq for a similar ICEV. About 34% of the GHG emissions from the production phase can be reduced if the EV is appropriately recycled and all the recovered materials are reused for production. The equivalent reduction rate through recycling for an ICEV is 30%.
The difference of life cycle GHG emissions between an EV and an ICEV in China is presented in Figure 7. Due to the higher GHG emissions from the production phase, the GHG emissions from both production and use phases of an EV are roughly 28.43-39.49 t-CO2eq, slightly lower than those of an ICEV, 37.83 t-CO2eq. If the recycling phase is included, the life cycle GHG emissions are 24.96-33.48 t-CO2eq for an EV and 34.69 t-CO2eq for an ICEV. That is to say, even though the GHG emissions from the trans-portation sector can be reduced if EVs replace ICEVs, the GHG emissions from the manufacturing sector will increase by almost the same value if the EVs are not recycled.
52 Qiao Q, Zhao F, Liu Z, Hao H, 2017. Cradle-to-gate greenhouse gas emissions of battery electric and internal combustion engine vehicles in China. Applied Energy, 204: 1399-1411.
53 Hao H, Qiao Q, Liu Z, Zhao F, 2017. Impact of recycling on energy consumption and greenhouse gas emissions from electric vehicle production: The China 2025 case. Resources, Conservation and Recycling 122: 114-125.
54 Qiao Q, Zhao F, Liu Z, Hao H, 2019. Electric vehicle recycling in China: Economic and environmental benefits. Resources, Conservation and Recycling 140: 45-53.

25Belfer Center for Science and International Affairs | Harvard Kennedy School
Figure 7: Life cycle GHG emissions of an EV and an ICEV in China
3.5 Impacts on total GHG emissions in the passenger vehicle sector
Figure 8 presents the total reduction of GHG emissions in the passenger vehi-cle sector (only the use phase) when EVs replace ICEVs. With the assumed production and sales, ownership, and penetration rates of EVs as discussed in section 2, over 8% in 2025 and 20% in 2030, about 30.4 million t-CO2eq emissions might be reduced in 2020. Additionally, as discussed in section 2, these results are calculated based on the power grids in Beijing, Shanghai and Guangzhou. Since all three cities have made major efforts to reduce both con-ventional and GHG emissions from their power sector, the emissions for the power sector in the rest of the country is likely to be higher and thus the emis-sion reductions from the rapid deployment of EVs will be lower.

26 The Role of Electric Vehicles in Decarbonizing China’s Transportation Sector
If the greening of the power grid in China is taken into consideration, the environmental performance of EVs will be even better. With the help of technology improvements and the increasing penetration of renew-able energy, the GHG emission factor for electricity in China is likely to decrease in the future. Therefore, the GHG emissions during the use phase of EVs will decrease, and the gap of GHG emissions between EVs and ICEVs will increase. Under optimistic assumptions, EVs have the potential to reduce GHG emissions in the passenger vehicle sector over the long-term, even though this potential may be less in the shorter-term.
Figure 8 adds the emissions of the manufacturers and recycling stages. Since road transportation is responsible for about 70% of the GHG emissions in the transportation sector, it follows that under optimistic pro-jections total GHG emissions can be reduced by up to 6.2% by 2030. That is to say, if the charging time and location can be managed well, and the weight of EVs can be controlled, China can eliminate as much as 6.2% by 2030 of the total current GHG emissions from the transportation sector. To increase these benefits, China should identify options to reduce emissions from the battery production stage, which remain quite high.

27Belfer Center for Science and International Affairs | Harvard Kennedy School
Figure 8: Total GHG emissions reduced in the transportation sector in China

28 The Role of Electric Vehicles in Decarbonizing China’s Transportation Sector
4. Summary
4.1 Development of EVs in China
The Chinese government is committed to support and stimulate the growth of the EV industry. Subsidies on charging facilities will stimulate third-party investment. Purchase subsidies, tax cuts, and the restriction on charging fees will make EVs more attractive to consumers. All these poli-cies aim to establish a comprehensive market system for EVs.
The price of charging services is subsidized by both the central and pro-visional governments. This practice may increase EV sales in the short term, but may slow investment in charging stations in the longer-term, as the financial burden of paying for these subsidies will eventually force the public sector to reduce them.
4.2 Impacts on carbon emissions
According to the calculation in this study, the GHG emissions for today’s EV in the three locations, Beijing, Shanghai, and Guangzhou, are between 10.44 and 17.94 kg-CO2eq/100 km. Taking the total mileage into consid-eration, the GHG emissions per EV throughout its whole lifetime range between 15.66 and 26.92 t-CO2eq, up to 43% lower than those of a similar ICEV, which has emissions of 27.36 t-CO2eq. However, the GHG emis-sions from the manufacturing phase of an EV are in an approximate range of 11.40-13.94 t-CO2eq, which are 0.93-3.47 t-CO2eq higher than those emitted in manufacturing an ICEV. Therefore, when EVs replace ICEVs, our lifecycle estimates of reduction of GHG emissions is reduced by approximately 36% due to GHG emissions from the manufacturing sector, especially battery manufacturing. Conversely, if 100% of the EVs are recy-cled this reduction can be cut in half.
Despite the higher GHG emissions in the manufacturing phase, EVs can help reduce the GHG emissions from the transportation sector by up to

29Belfer Center for Science and International Affairs | Harvard Kennedy School
6.2% in 2030 with a 20% penetration rate, assuming the carbon intensity of regional power grids continues to improve. These findings assume a national average emission factor, which ignores regional difference. Actual emission reductions will be higher in southern China, which has access to hydro-electricity generation, and lower in Northern China, which remains dependent on coal-fired generation.
In summary, our two main conclusions are 1) EV deployment may increase GHG emissions in some regions, but these increases will be offset by declines in the emissions in other regions, so that the national average impact will be slightly lower GHG emissions, and 2) On a life cycle basis, EVs reduce emissions relative to ICEVs, and this reduction will be higher if battery production facilities are able to invest in cleaner technologies and improved processes, and vehicle recycling rates improve.

30 The Role of Electric Vehicles in Decarbonizing China’s Transportation Sector
5. ReferenceArgonne National Laboratory, 2018. Greenhouse Gases, Regulated Emissions, and Energy Use in Trans-
portation (GREET) Model. https://greet.es.anl.gov/. (accessible December 2018).
Autohome, 2018. Vehicle parameters index, https://www.autohome.com.cn (accessible August 2018).
Auto Weekly, 2018. BYD has set a sales target of 200,000 new energy vehicles, http://epaper.xxsb.com/html/content/2018-01/25/content_723402.html (accessible August 2018).
Bauer C, Hofer J, Althaus HJ, Duce AD, Simons A, 2015. The environmental performance of current and future passenger vehicles: life cycle assessment based on a novel scenario analysis framework. Applied Energy,157:871–83.
Burnham A, 2012. Updated vehicle specifications in the GREET vehicle-cycle model. Argonne National Laboratory.
Beijing Automotive Industry Corporation (BAIC), 2017. Annual Performance and 2018 Strategy, section 3. http://www.baicgroup.com.cn/news_detail.php?type=2&id=1933 (accessible August 2018).
Beijing Government, 2017. Enhancements on the Construction of Charging Facilities, section 2. http://zhengce.beijing.gov.cn/library/192/33/50/438650/1279821/index.html (accessible August 2018).
Chen Q, 2017. Ownership of EVs will reach 80 million in China in 2030, China EV100 forum, http://news.163.com/17/1111/22/D30BHEGI000187VE.html (accessible August 2018).
China Association of Automobile Manufacturers (CAAM), 2016. The development of Chinese automobile industry annual report. Social Sciences Academic Press.
China Association of Automobile Manufacturers (CAAM), 2018. China Automotive Industry Yearbook 2017, pg. 11-13. Yearbook Press.
China Association of Automobile Manufacturers (CAAM), 2018. China Automotive Industry Yearbook 2017, p20-21. Yearbook Press.
China Passenger Car Association (CPCA), 2017. New energy vehicle monthly report. http://www.cpcaau-to.com/news.asp?types=bgzl&anid=78&nid=14 (accessible August 2018).
Chinese Electricity Council, 2015. Situation of China’s electricity industry. http://www.cec.org.cn/gui-huayutongji/gongxufenxi/dianliyunxingjiankuang/2015-02-02/133565.html (accessible August 2018).
Chinese State Council, 2009. Adjustment and Revitalization Plan on Automotive Industry, http://www.gov.cn/zwgk/2009-03/20/content_1264324.htm (accessible August 2018).
Chinese State Council, 2012. Energy Saving and New Energy Vehicles Development Plan (2012–2020), section 3. http://www.gov.cn/zwgk/2012-07/09/content_2179032.htm (accessible August 2018).
Chinese State Council, 2015. Enhanced actions on climate change: China’s Intended Nationally Deter-mined Contributions (INDCs). https://www.sdpc.gov.cn/xwzx/xwfb/201506/t20150630_710204.html (accessible August 2018).
Das S, 2004. A Comparative Assessment of Alternative Powertrains and Body-in-White Materials for Advanced Technology Vehicles. SAE Technical Paper: 01-0573
Gong H, Zou Y, Yang Q, Fan J, Sun F, Goehlich D, 2018. Generation of a driving cycle for battery electric vehicles:A case study of Beijing. Energy 150: 901-912
Hao H, Cheng X, Liu Z, Zhao F, 2017. Electric vehicles for greenhouse gas reduction in China: A cost-effec-tiveness analysis. Transportation Research Part D: Transport and Environment 56: 68-84.
Hao H, Qiao Q, Liu Z, Zhao F, 2017. Impact of recycling on energy consumption and greenhouse gas emissions from electric vehicle production: The China 2025 case. Resources, Conservation and Recycling 122: 114-125.

31Belfer Center for Science and International Affairs | Harvard Kennedy School
Hawkins TR, Singh B, Majeau-Bettez G, Stromman AH, 2013. Comparative environmental life cycle assessment of conventional and electric vehicles. Journal of Industrial Ecology, 17(1): 53-64.
Institut für Energie- und Umweltforschung Heidelberg (IFEU), 2008. Transport in China: energy con-sumption and emissions of different transports, p10-11. http://re.indiaenvironmentportal.org.in/files/IFEU_et_al(2008)_Transport_in_China_GB.pdf (accessible August 2018).
International Energy Agency (IEA), 2017. CO2 emissions from fuel combustion, pg. 5-6. http://www.iea.org/publications/freepublications/publication/CO2EmissionsFromFuelCombustion2017Overview.pdf (accessible August 2018).
International Energy Agency (IEA), 2017. CO2 emissions from fuel combustion, pg. 8. http://www.iea.org/publications/freepublications/publication/CO2EmissionsFromFuelCombustion2017Overview.pdf (accessible August 2018).
Intergovernmental Panel on Climate Change (IPCC), 2006. IPCC Guidelines for National Greenhouse Gas Inventories, p1.8-1.24. https://www.ipcc-nggip.iges.or.jp/public/2006gl (accessible August 2018).
Intergovernmental Panel on Climate Change (IPCC), 2006. IPCC Guidelines for National Greenhouse Gas Inventories, p2.16-2.17. https://www.ipcc-nggip.iges.or.jp/public/2006gl (accessible August 2018).
Iyiou Auto News, 2017. Interview with Kefeng Wang, Deputy Director of BAIC New Energy, https://www.iyiou.com/p/52904 (accessible August 2018).
Lee, H, Alex C, 2018. Charging the Future. Paper, Environment and Natural Resources Program, Belfer Center, Harvard University.
Lewis A M, Kelly J C, Keoleian G A, 2014. Vehicle lightweighting vs. electrification: life cycle energy and GHG emissions results for diverse powertrain vehicles. Applied Energy, 126: 13-20.
Li X, Chalvatzis K, Pappas D, 2018. Life cycle greenhouse gas emissions from power generation in Chi-na’s provinces in 2020. Applied Energy 223: 93-102
Ma C, Li S, Ge Q, 2014. Greenhouse gas emission factors for grid electricity for Chinese provinces. Re-sources Sci 2014; 36(5): 1005–12.
Ministry of Finance, 2015. Financial Support Policy on New Energy Vehicles 2016-2020, section 1. http://jjs.mof.gov.cn/zhengwuxinxi/zhengcefagui/201504/t20150429_1224515.html (accessible August 2018).
Ministry of Finance, 2017. Announcement about the Exempted Purchase Tax of New Energy Vehicles, section 1. http://www.chinatax.gov.cn/n810341/n810755/c2985330/content.html (accessible August 2018).
Ministry of Industry and Information Technology, 2017. Development Plan of Promotion on Traction Bat-teries, section 2. http://www.miit.gov.cn/n1146295/n1652858/n1652930/n3757018/c5505456/content.html (accessible August 2018).
Ministry of Industry and Information Technology, 2017. Management on Average Fuel Consumption of Passenger Vehicle Manufacturers and New Energy Vehicle Credits, http://www.miit.gov.cn/n1146290/n4388791/c5826378/content.html (accessible August 2018).
National Bureau of Statistics of China (NBSC). 2018. Annual Provincial Power Generation.http://data.stats.gov.cn/easyquery.htm?cn=C01 (Accessible December 2018).
National Development and Reform Commission (NDRC), 2014. Chinese low carbon development and training materials of listing of provincial greenhouse gas, http://qhs.ndrc.gov.cn/gzdt/201403/t20140328_604827.html (accessible August 2018).
National Development and Reform Commission (NDRC), 2015. Development Plan of Charging Fa-cilities for Electric Vehicles (2015-2020), p8-10. http://www.ndrc.gov.cn/zcfb/zcfbtz/201511/W020151117576336784393.pdf (accessible August 2018).
National Development and Reform Commission (NDRC), 2015. Development Plan of Charging Fa-cilities for Electric Vehicles (2015-2020), p10-12. http://www.ndrc.gov.cn/zcfb/zcfbtz/201511/t20151117_758762.html (accessible August 2018).

32 The Role of Electric Vehicles in Decarbonizing China’s Transportation Sector
National Energy Administration, 2017. Annual Report of Chinese Charging Facility Promotion League, p14-15. http://www.nea.gov.cn/136376732_14978397401671n.pdf (accessible August 2018).
Nelson PA, Gallagher KG, Bloom I, Dees DW, 2011. Modeling the performance and cost of Lithium-Ion batteries for electric-drive vehicles. Argonne National Laboratory.
Organisation Internationale des Constructeurs d’Automobiles (OICA), Global vehicle production. http://www.oica.net/category/production-statistics/2017-statistics/ (accessible August 2018).
Pan A, Chen T, 2016. Electric vehicle development in China and its power quality challenges to distribu-tion grid. IET: 2-4.
Peng T, Ou X, Yan X, 2018. Development and application of an electric vehicles life-cycle energy con-sumption and greenhouse gas emissions analysis model. Chemical Engineering Research and Design; 131:699-708
Qiao Q, Zhao F, Liu Z, Hao H, 2017. Cradle-to-gate greenhouse gas emissions of battery electric and internal combustion engine vehicles in China. Applied Energy, 204: 1399-1411.
Qiao Q, Zhao F, Liu Z, Hao H, 2019. Electric vehicle recycling in China: Economic and environmental bene-fits. Resources, Conservation and Recycling 140: 45-53.
Shanghai Government, 2016. Promotion on Charging Facility Construction and Development, section 2. http://www.shanghai.gov.cn/nw2/nw2314/nw2319/nw12344/u26aw47395.html (accessible August 2018).
Situ L, 2009. Electric vehicle development: the past, present & future//Power Electronics Systems and Applications. PESA 2009. 3rd International Conference on Power Electronics Systems and Applica-tions (PESA). IEEE, 2009: 1-3.
Standardization Administration, 2018. GB/T 18487.1-2015, 20234.1-2015, 20234.2-2015, 20234.3-2015, 27930-2015, http://www.gb688.cn/bzgk/gb/index (accessible August 2018).
Su X, Y Z, Wu Z, X Y, 2018. Forecasting the Charging Load of Large-scale Electric Vehicle and Its Impact on the Power Grid, Modern Electric Power.
Traffic Management Bureau of the Public Security Ministry, 2017. National ownership of vehicles in 2017, http://www.mps.gov.cn/n2255040/n4908728/c5977158/content.html (accessible August 2018).
Triantafyllopoulos G, Kontses A, Tsokolis D, et al., 2017. Potential of energy efficiency technologies in reducing vehicle consumption under type approval and real world conditions. Energy, 2017, 140: 365-373.


Environment and Natural Resources
Belfer Center for Science and International Affairs
Harvard Kennedy School
79 John F. Kennedy Street
Cambridge, MA 02138
www.belfercenter.org/ENRP
Copyright 2019, President and Fellows of Harvard College
Printed in the United States of America