Embed Size (px)
Citation preview
Tegbaru Bellete
The Role of DSM in Transforming Agriculture: The Case of Ethiopian Soil Information System (EthioSIS)
7th Global DSM Workshop 2016, 27 June -1 July 2016, Aarhus, Denmark
2
Background Information
Agenda
Major Soil Health and Fertility Issues
The EthioSIS and Related Initiatives
3
Background Information
Agenda
Major Soil Health and Fertility Issues
The EthioSIS and Related Initiatives
4
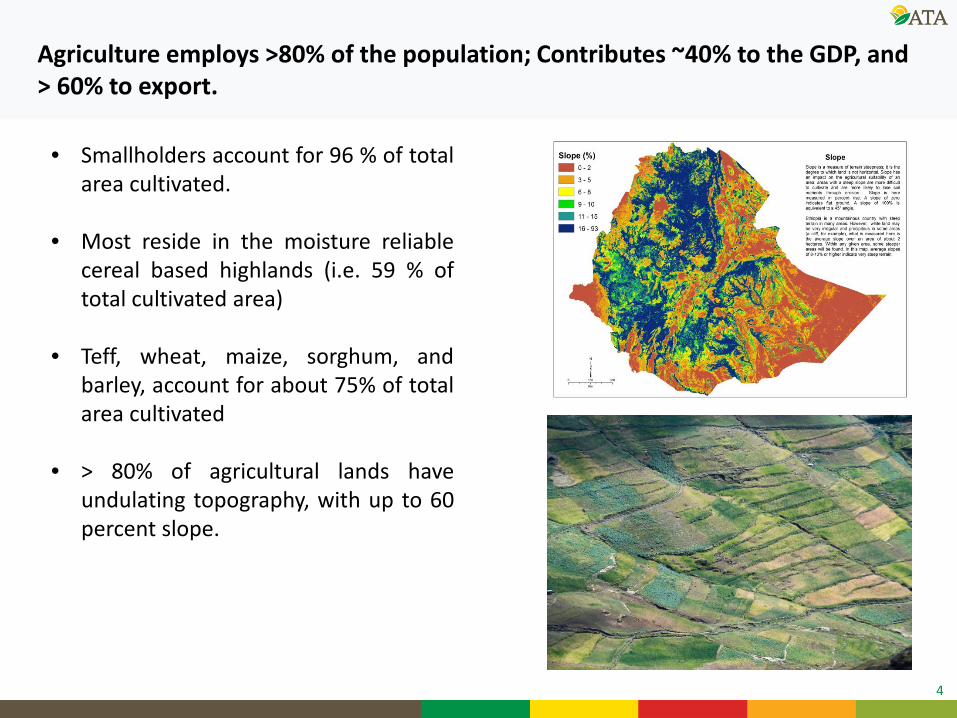
Agriculture employs >80% of the population; Contributes ~40% to the GDP, and > 60% to export.
• Smallholders account for 96 % of total area cultivated.
• Most reside in the moisture reliable cereal based highlands (i.e. 59 % of total cultivated area)
• Teff, wheat, maize, sorghum, and barley, account for about 75% of total area cultivated
• > 80% of agricultural lands have undulating topography, with up to 60 percent slope.
5
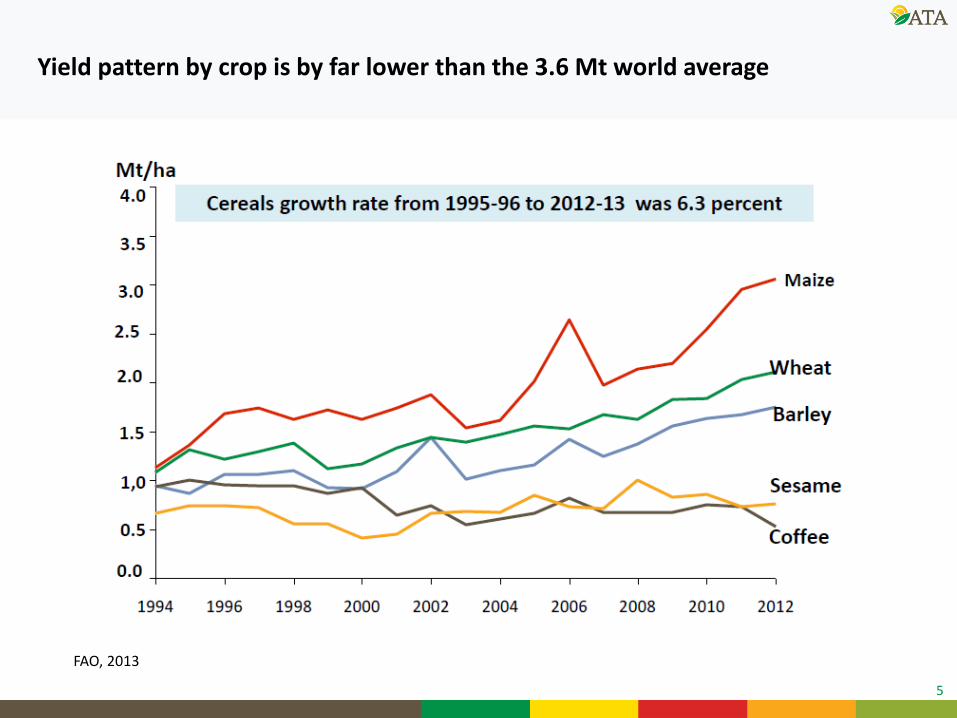
Yield pattern by crop is by far lower than the 3.6 Mt world average
FAO, 2013
6
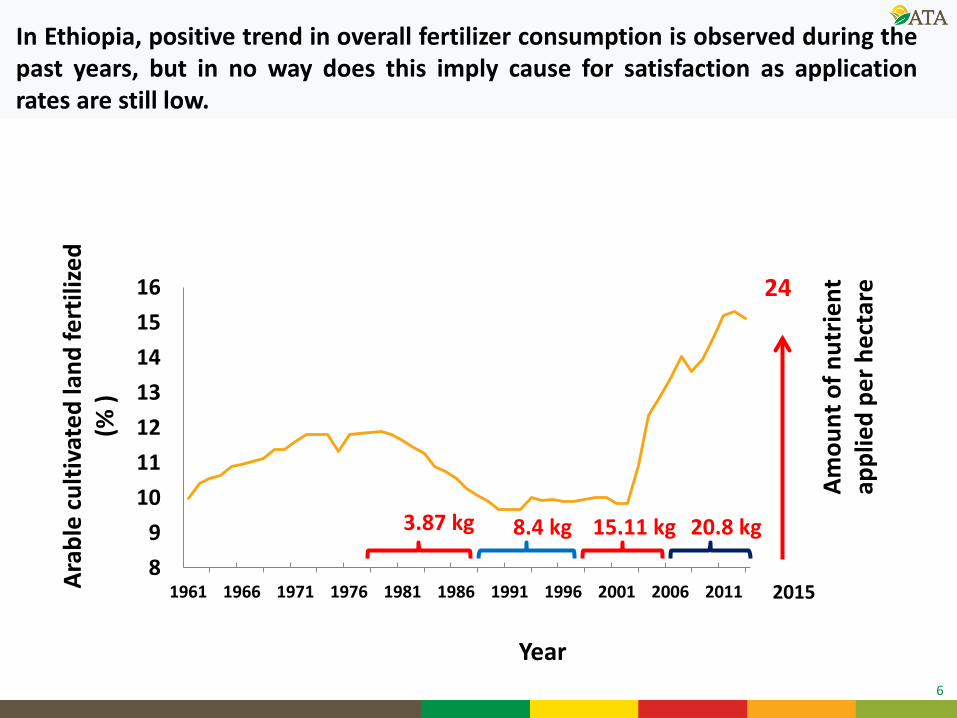
In Ethiopia, positive trend in overall fertilizer consumption is observed during the past years, but in no way does this imply cause for satisfaction as application rates are still low.
89
10111213141516
1961 1966 1971 1976 1981 1986 1991 1996 2001 2006 2011Arab
le c
ultiv
ated
land
fert
ilize
d (%
)
3.87 kg 8.4 kg 15.11 kg 20.8 kg
Amou
nt o
f nut
rient
ap
plie
d pe
r hec
tare
2015
24
Year
7
Background Information
Agenda
Major Soil Health and Fertility Issues
The EthioSIS and Related Initiatives
8
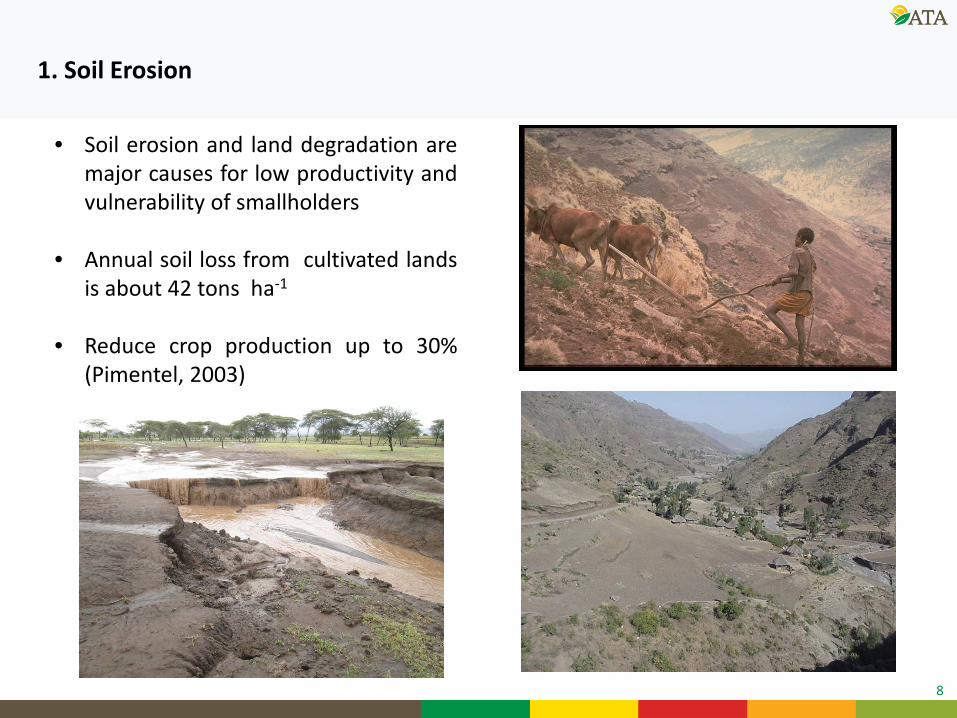
1. Soil Erosion
• Soil erosion and land degradation are major causes for low productivity and vulnerability of smallholders
• Annual soil loss from cultivated lands is about 42 tons ha-1
• Reduce crop production up to 30% (Pimentel, 2003)
9
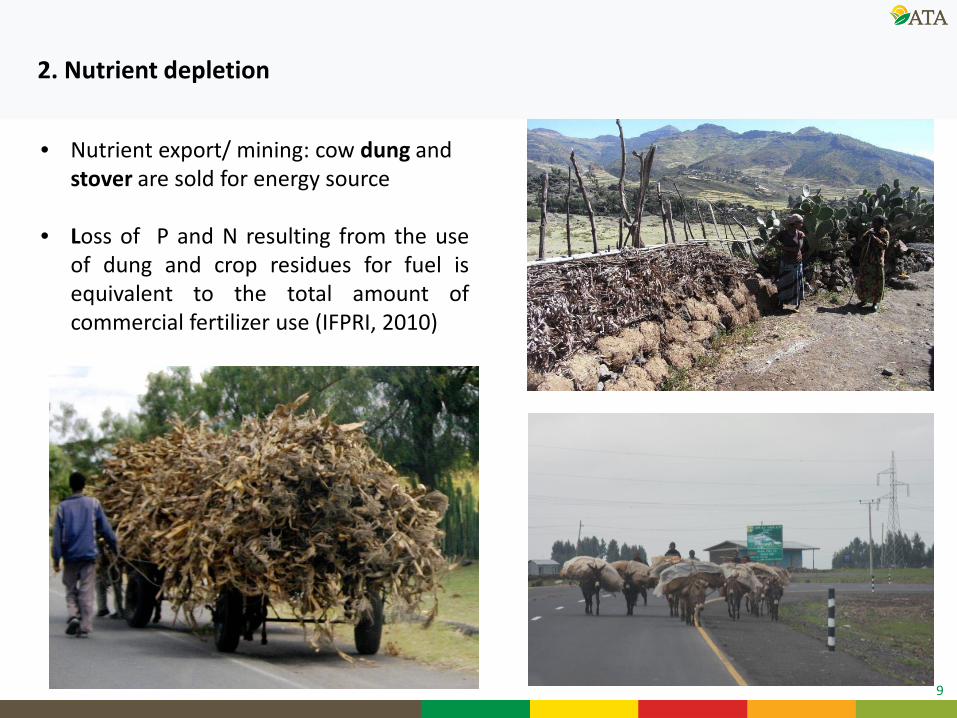
2. Nutrient depletion
• Nutrient export/ mining: cow dung and stover are sold for energy source
• Loss of P and N resulting from the use
of dung and crop residues for fuel is equivalent to the total amount of commercial fertilizer use (IFPRI, 2010)
10
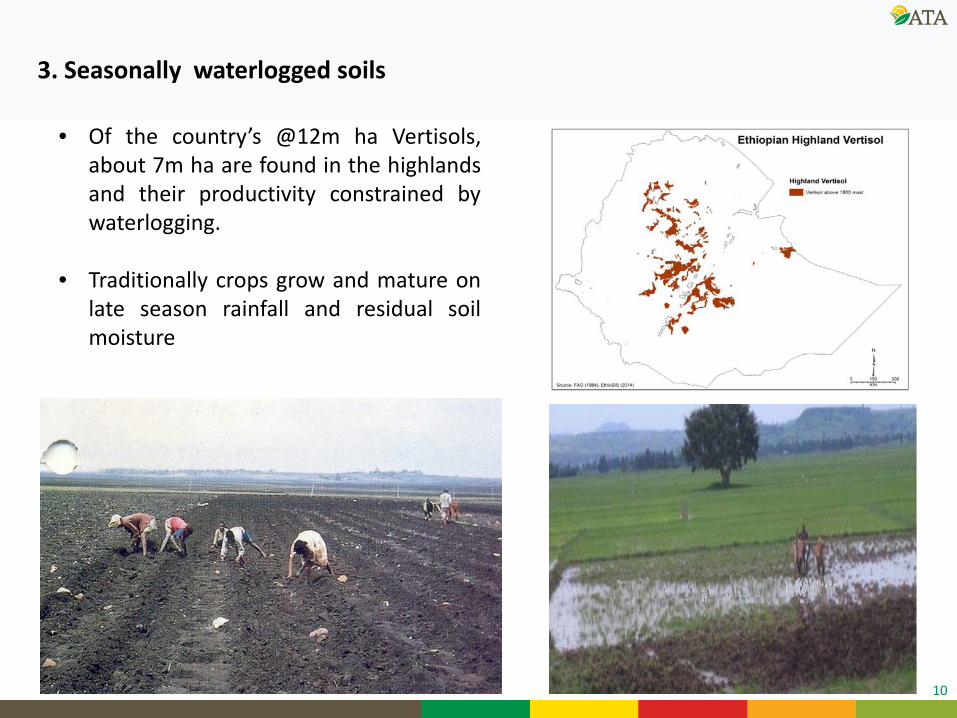
3. Seasonally waterlogged soils
• Of the country’s @12m ha Vertisols, about 7m ha are found in the highlands and their productivity constrained by waterlogging.
• Traditionally crops grow and mature on late season rainfall and residual soil moisture
11
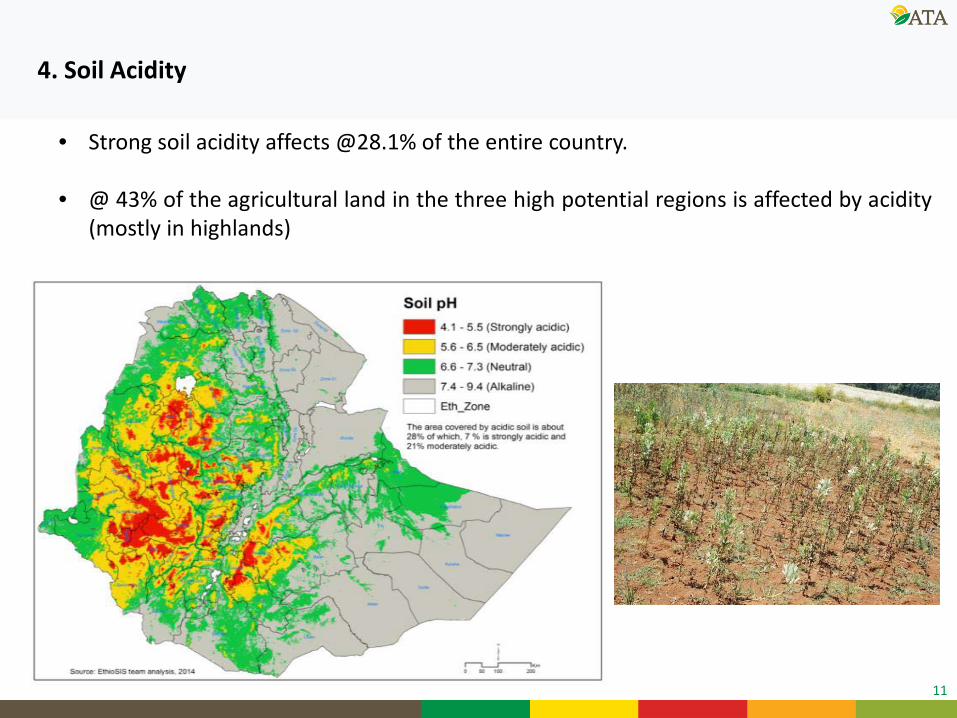
4. Soil Acidity
• Strong soil acidity affects @28.1% of the entire country.
• @ 43% of the agricultural land in the three high potential regions is affected by acidity (mostly in highlands)
12
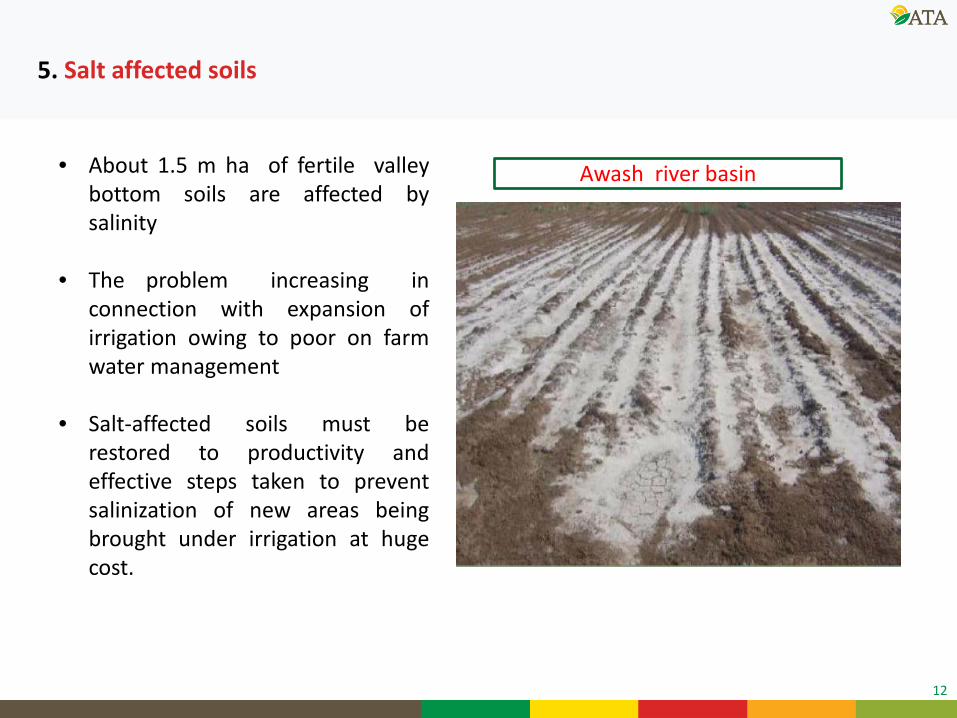
5. Salt affected soils
• About 1.5 m ha of fertile valley bottom soils are affected by salinity
• The problem increasing in
connection with expansion of irrigation owing to poor on farm water management
• Salt-affected soils must be restored to productivity and effective steps taken to prevent salinization of new areas being brought under irrigation at huge cost.
Awash river basin
13
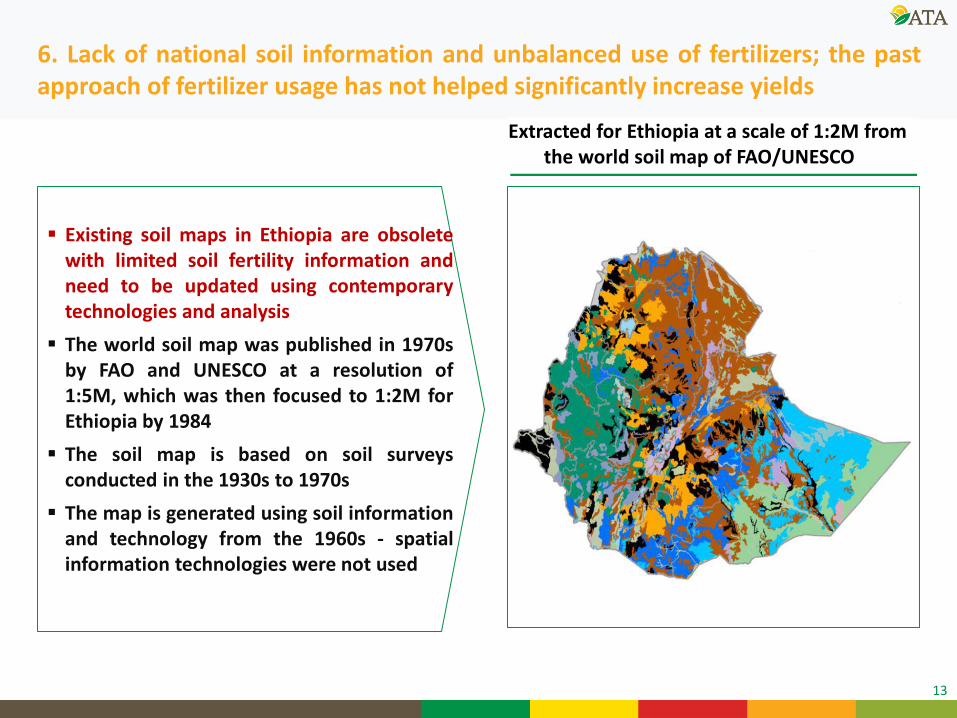
Existing soil maps in Ethiopia are obsolete with limited soil fertility information and need to be updated using contemporary technologies and analysis The world soil map was published in 1970s
by FAO and UNESCO at a resolution of 1:5M, which was then focused to 1:2M for Ethiopia by 1984 The soil map is based on soil surveys
conducted in the 1930s to 1970s The map is generated using soil information
and technology from the 1960s - spatial information technologies were not used
Extracted for Ethiopia at a scale of 1:2M from the world soil map of FAO/UNESCO
6. Lack of national soil information and unbalanced use of fertilizers; the past approach of fertilizer usage has not helped significantly increase yields
14
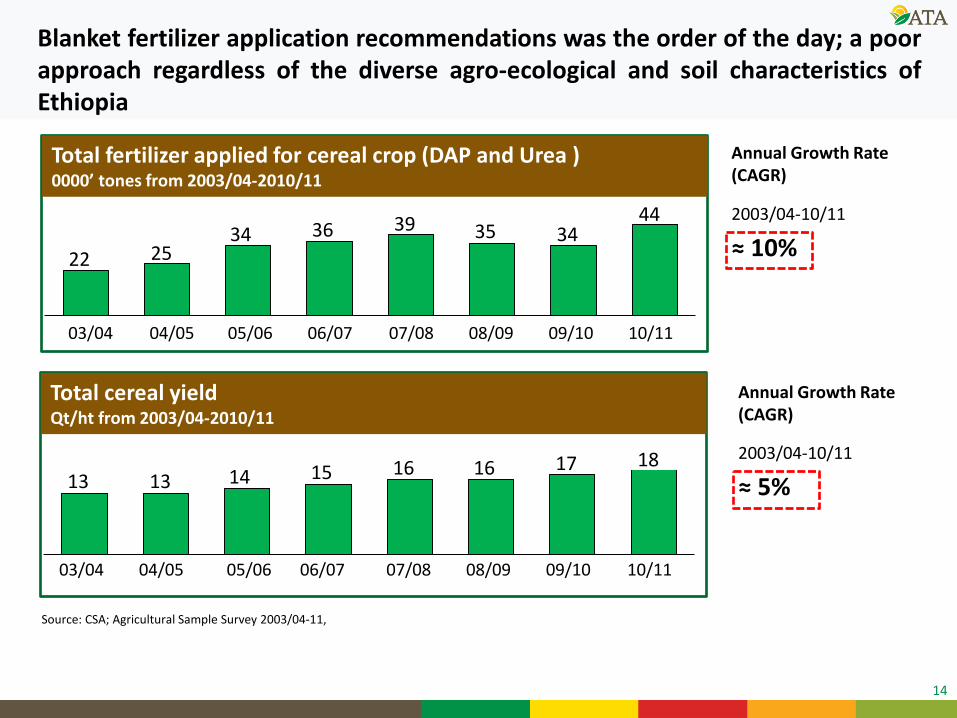
13 13 14 15 16 16 17 18
08/09 09/10 07/08 06/07 05/06 04/05 03/04 10/11
22 25 34 36 39 35 34
44
04/05 05/06 03/04 08/09 10/11 06/07 07/08 09/10
Annual Growth Rate (CAGR)
2003/04-10/11
≈ 10%
2003/04-10/11
≈ 5%
Total cereal yield Qt/ht from 2003/04-2010/11
Total fertilizer applied for cereal crop (DAP and Urea ) 0000’ tones from 2003/04-2010/11
Source: CSA; Agricultural Sample Survey 2003/04-11,
Annual Growth Rate (CAGR)
Blanket fertilizer application recommendations was the order of the day; a poor approach regardless of the diverse agro-ecological and soil characteristics of Ethiopia
15
Background Information
Agenda
Major Soil Health and Fertility Issues
The EthioSIS and Related Initiatives
16
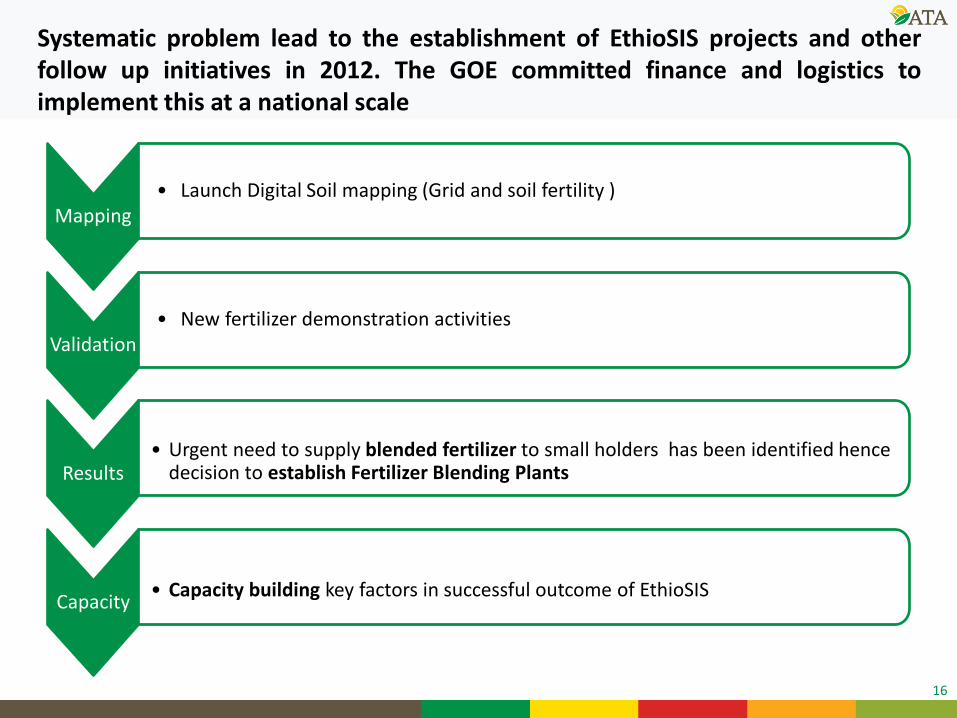
Systematic problem lead to the establishment of EthioSIS projects and other follow up initiatives in 2012. The GOE committed finance and logistics to implement this at a national scale
Mapping • Launch Digital Soil mapping (Grid and soil fertility )
Validation • New fertilizer demonstration activities
Results
• Urgent need to supply blended fertilizer to small holders has been identified hence
decision to establish Fertilizer Blending Plants
Capacity
• Capacity building key factors in successful outcome of EthioSIS
17
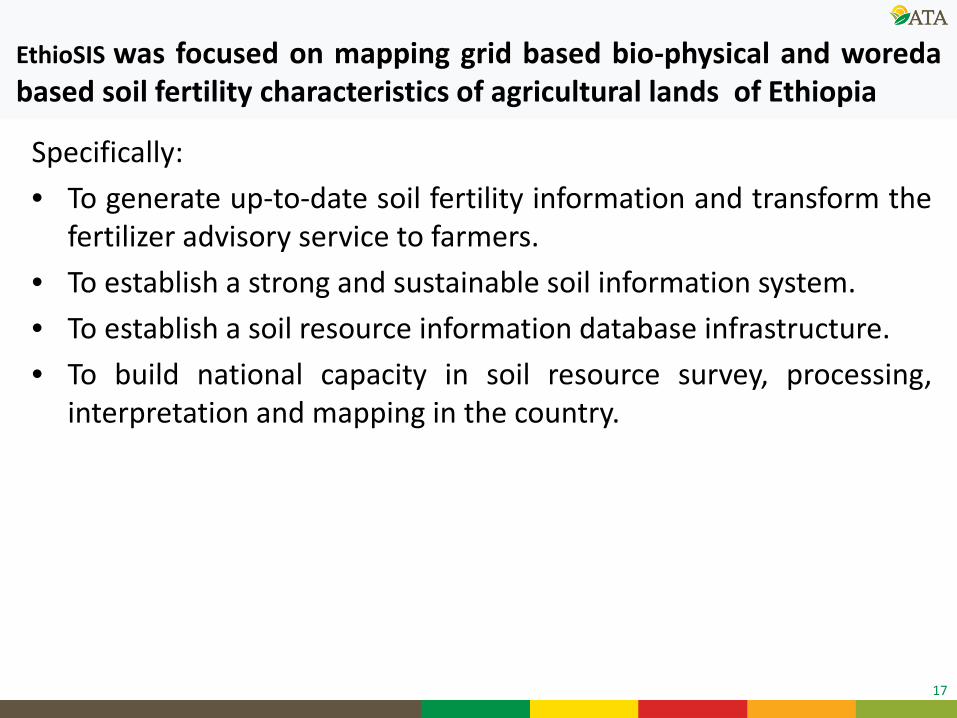
Specifically: • To generate up-to-date soil fertility information and transform the
fertilizer advisory service to farmers. • To establish a strong and sustainable soil information system. • To establish a soil resource information database infrastructure. • To build national capacity in soil resource survey, processing,
interpretation and mapping in the country.
EthioSIS was focused on mapping grid based bio-physical and woreda based soil fertility characteristics of agricultural lands of Ethiopia
18
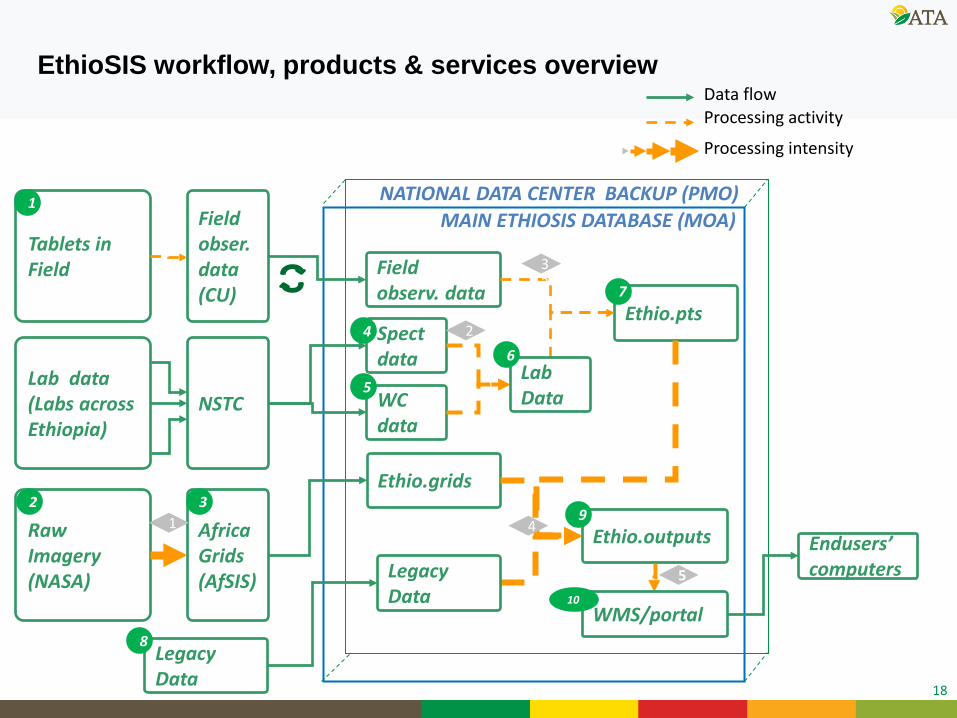
Field obser. data (CU)
NSTC
NATIONAL DATA CENTER BACKUP (PMO) MAIN ETHIOSIS DATABASE (MOA)
Field observ. data
Ethio.pts Spect data
Ethio.grids
Ethio.outputs
Data flow Processing activity
Lab data (Labs across Ethiopia)
WMS/portal
Africa Grids (AfSIS)
Raw Imagery (NASA)
WC data
Lab Data
Tablets in Field
Endusers’ computers
Processing intensity
1
2
133
4
5
1
2 3
7
6
9
10
4
5
Legacy Data
Legacy Data
8
EthioSIS workflow, products & services overview
19
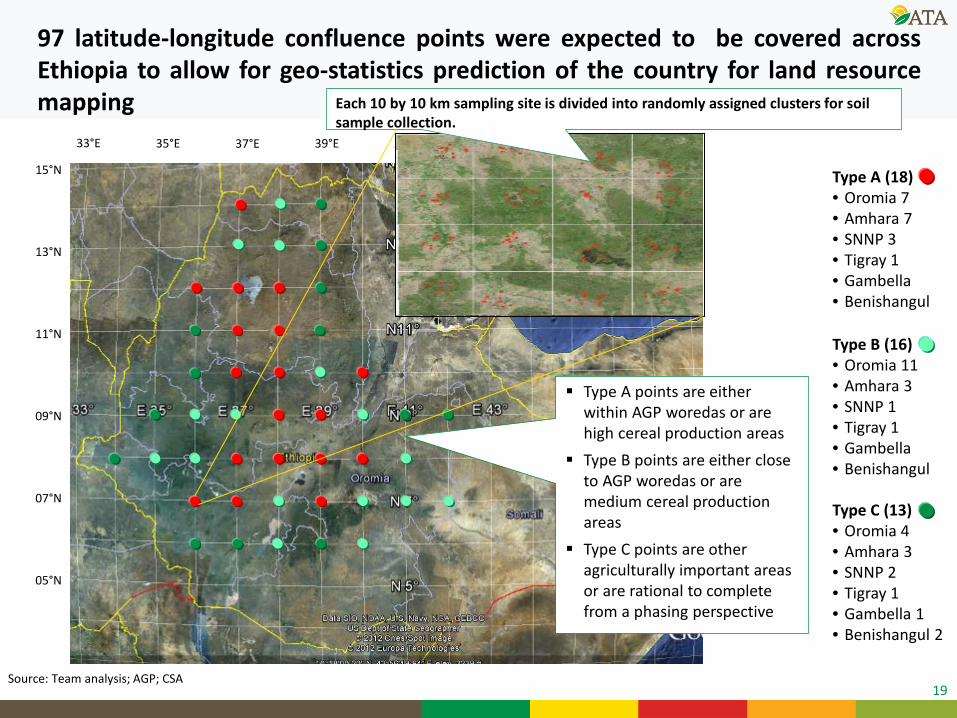
37°E 35°E 33°E 39°E 41°E 43°E 45°E 47°E
15°N
13°N
11°N
09°N
07°N
05°N
Type A (18) • Oromia 7 • Amhara 7 • SNNP 3 • Tigray 1 • Gambella • Benishangul
Type B (16) • Oromia 11 • Amhara 3 • SNNP 1 • Tigray 1 • Gambella • Benishangul
Source: Team analysis; AGP; CSA
Type A points are either within AGP woredas or are high cereal production areas
Type B points are either close to AGP woredas or are medium cereal production areas
Type C points are other agriculturally important areas or are rational to complete from a phasing perspective
Type C (13) • Oromia 4 • Amhara 3 • SNNP 2 • Tigray 1 • Gambella 1 • Benishangul 2
97 latitude-longitude confluence points were expected to be covered across Ethiopia to allow for geo-statistics prediction of the country for land resource mapping Each 10 by 10 km sampling site is divided into randomly assigned clusters for soil
sample collection.
20
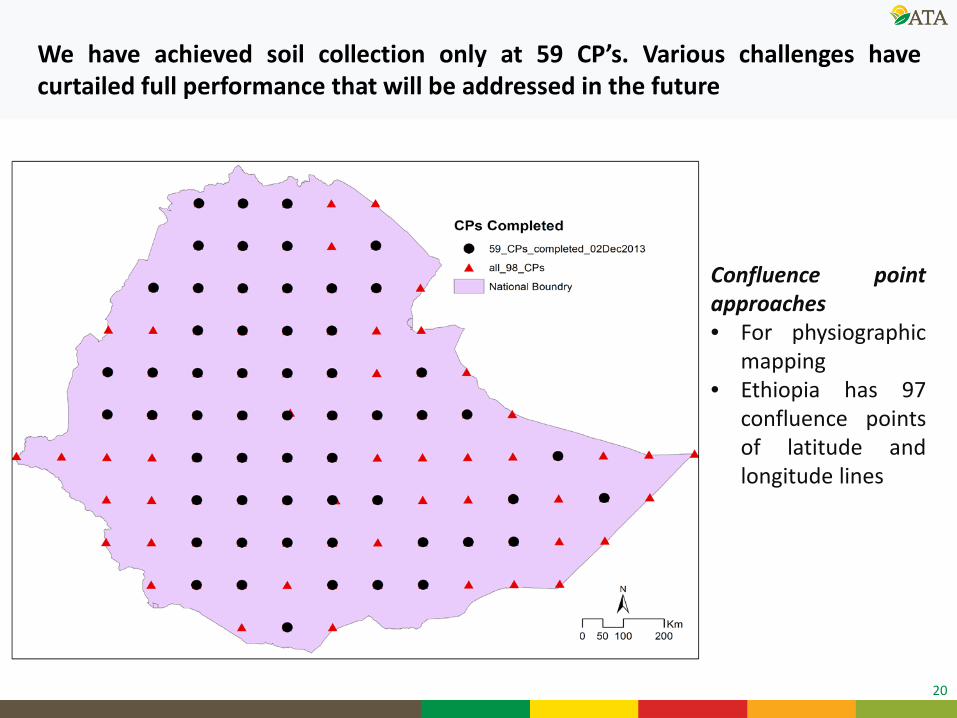
We have achieved soil collection only at 59 CP’s. Various challenges have curtailed full performance that will be addressed in the future
Confluence point approaches • For physiographic
mapping • Ethiopia has 97
confluence points of latitude and longitude lines
21
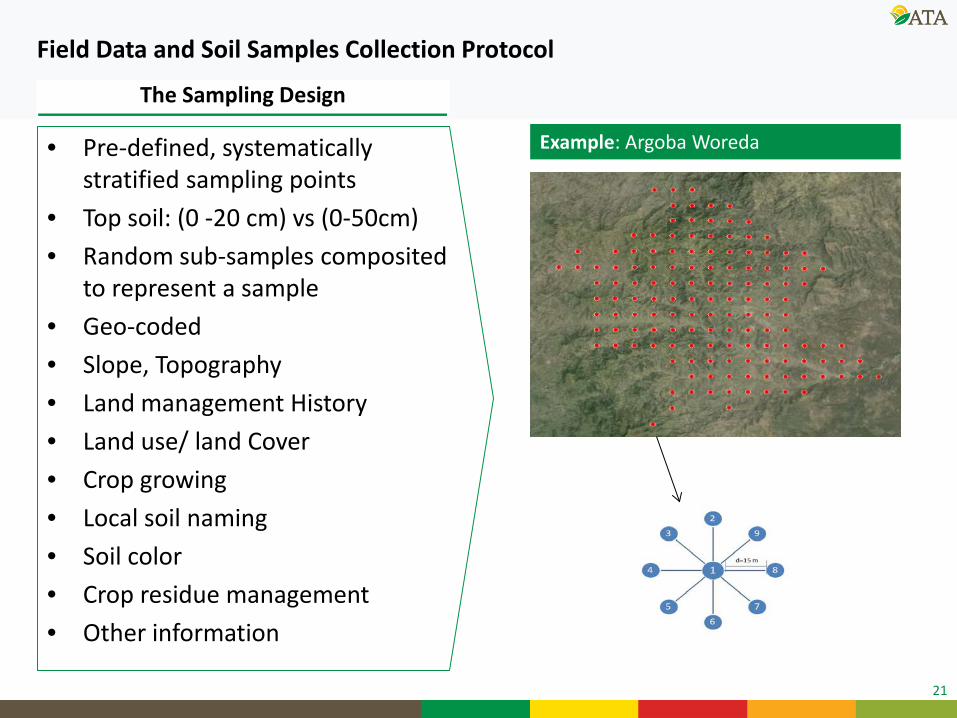
The Sampling Design
• Pre-defined, systematically stratified sampling points
• Top soil: (0 -20 cm) vs (0-50cm) • Random sub-samples composited
to represent a sample • Geo-coded • Slope, Topography • Land management History • Land use/ land Cover • Crop growing • Local soil naming • Soil color • Crop residue management • Other information
Example: Argoba Woreda
Field Data and Soil Samples Collection Protocol
22
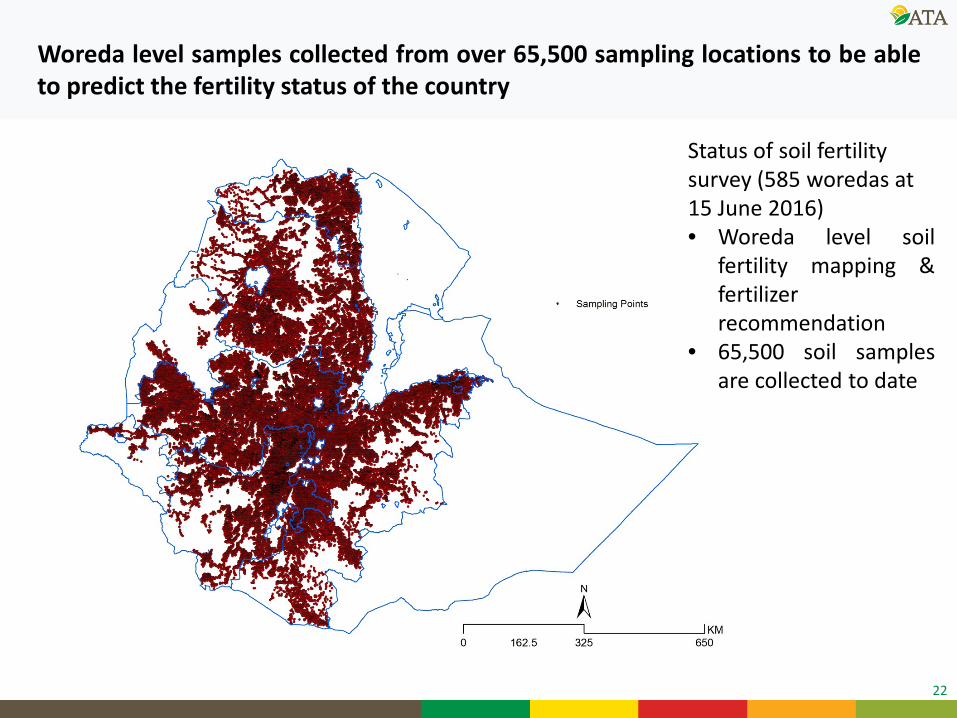
Woreda level samples collected from over 65,500 sampling locations to be able to predict the fertility status of the country
Status of soil fertility survey (585 woredas at 15 June 2016) • Woreda level soil
fertility mapping & fertilizer recommendation
• 65,500 soil samples are collected to date
23
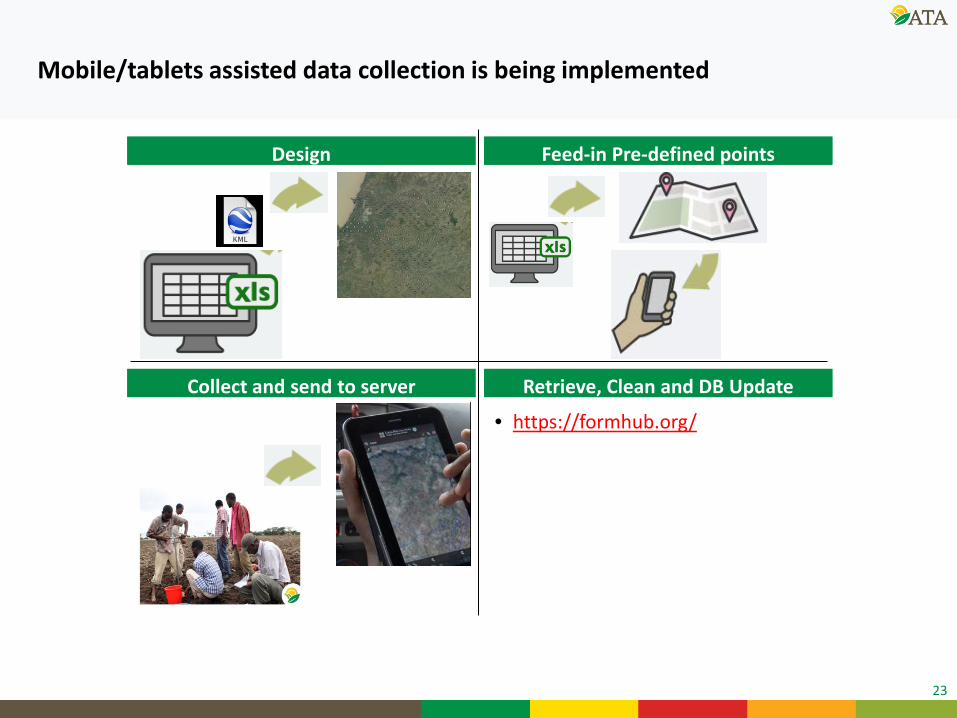
Mobile/tablets assisted data collection is being implemented
Design Feed-in Pre-defined points
Collect and send to server Retrieve, Clean and DB Update
• https://formhub.org/
24
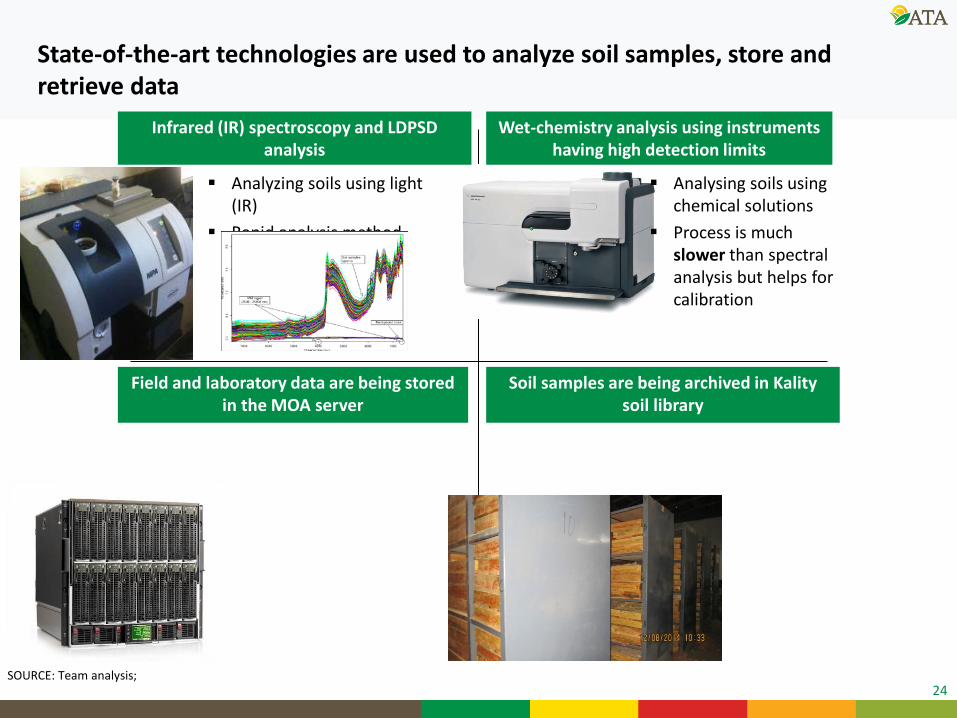
State-of-the-art technologies are used to analyze soil samples, store and retrieve data
Infrared (IR) spectroscopy and LDPSD analysis
Wet-chemistry analysis using instruments having high detection limits
Field and laboratory data are being stored in the MOA server
Soil samples are being archived in Kality soil library
Analyzing soils using light (IR)
Rapid analysis method
Analysing soils using chemical solutions
Process is much slower than spectral analysis but helps for calibration
SOURCE: Team analysis;
25
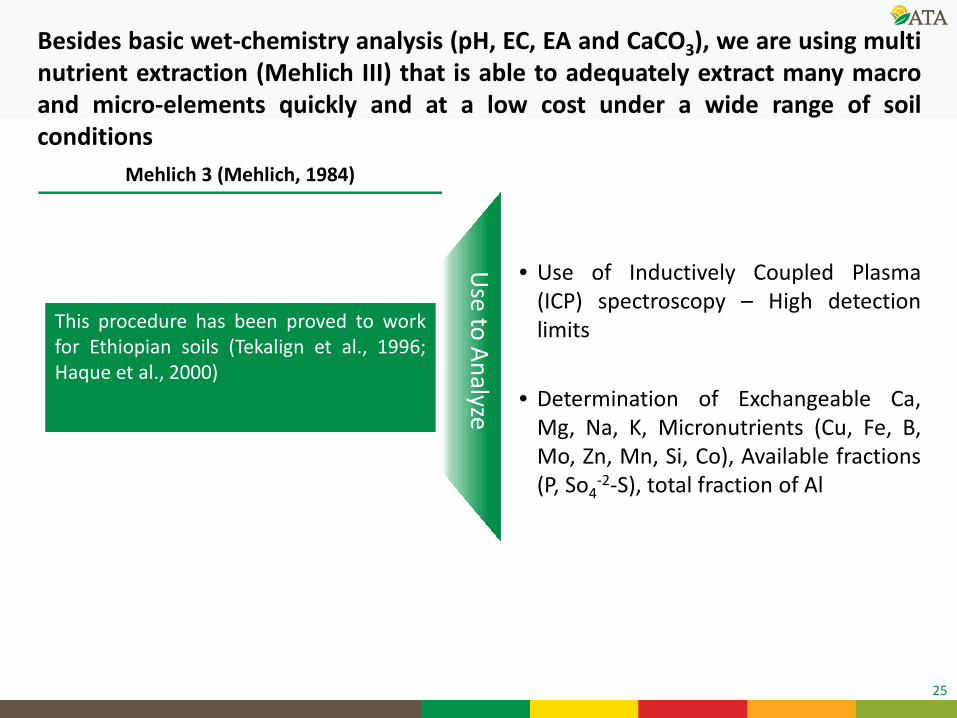
Besides basic wet-chemistry analysis (pH, EC, EA and CaCO3), we are using multi nutrient extraction (Mehlich III) that is able to adequately extract many macro and micro-elements quickly and at a low cost under a wide range of soil conditions
Mehlich 3 (Mehlich, 1984)
• Use of Inductively Coupled Plasma (ICP) spectroscopy – High detection limits
• Determination of Exchangeable Ca,
Mg, Na, K, Micronutrients (Cu, Fe, B, Mo, Zn, Mn, Si, Co), Available fractions (P, So4
-2-S), total fraction of Al
Use to Analyze
This procedure has been proved to work for Ethiopian soils (Tekalign et al., 1996; Haque et al., 2000)
26
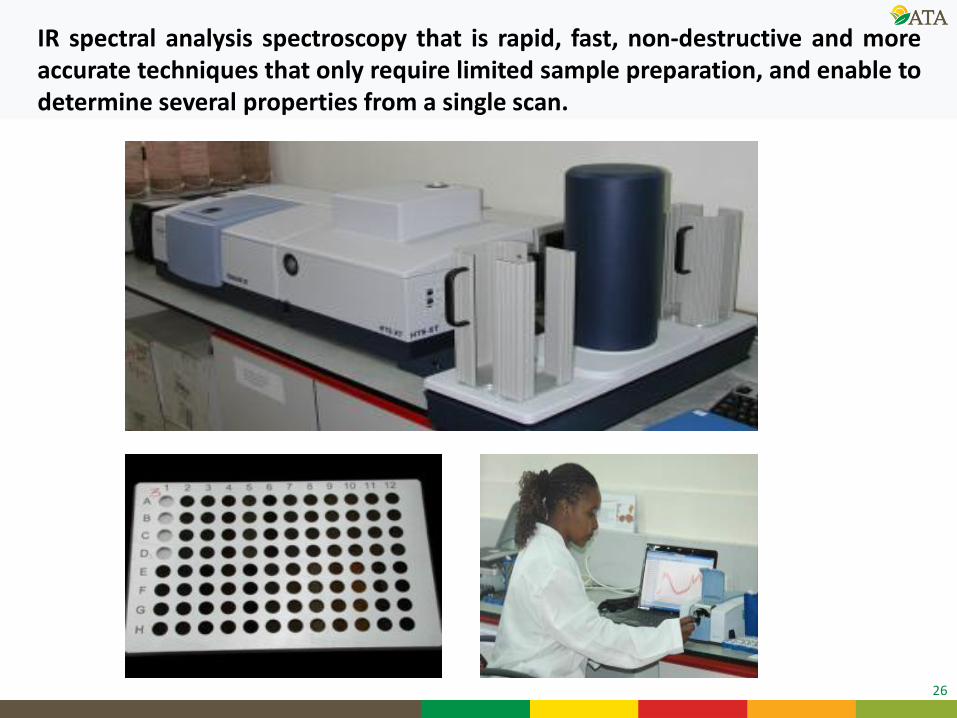
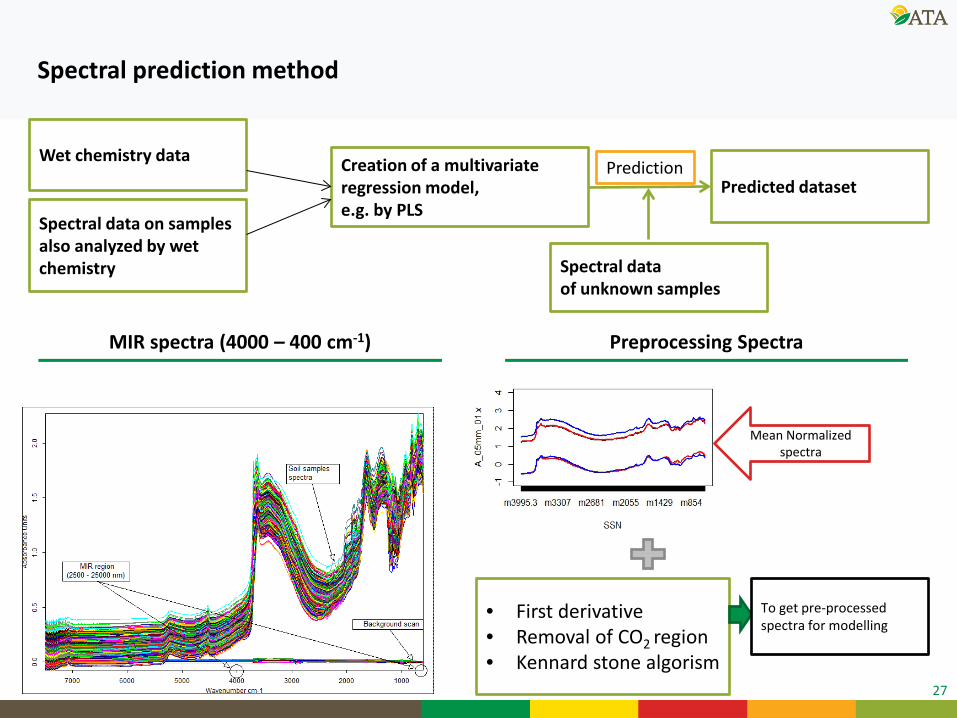
IR spectral analysis spectroscopy that is rapid, fast, non-destructive and more accurate techniques that only require limited sample preparation, and enable to determine several properties from a single scan.
27
MIR spectra (4000 – 400 cm-1)
Mean Normalized spectra
• First derivative • Removal of CO2 region • Kennard stone algorism
To get pre-processed spectra for modelling
Preprocessing Spectra
Spectral data on samples also analyzed by wet chemistry
Wet chemistry data Creation of a multivariate regression model, e.g. by PLS
Spectral data of unknown samples
Predicted dataset Prediction
Spectral prediction method
28
We have developed partial least square regression model (PLSR) models to predict soil properties using spectral data
Model Summary
Partial Least Square Regression Model (PLSR)
Soil Properties Coefficient of Determination(R2)
Si 0.89
N 0.87
pH 0.86
C 0.85
Mo 0.84
Ca 0.83
Al 0.8
Mg 0.72
Fe 0.62
29
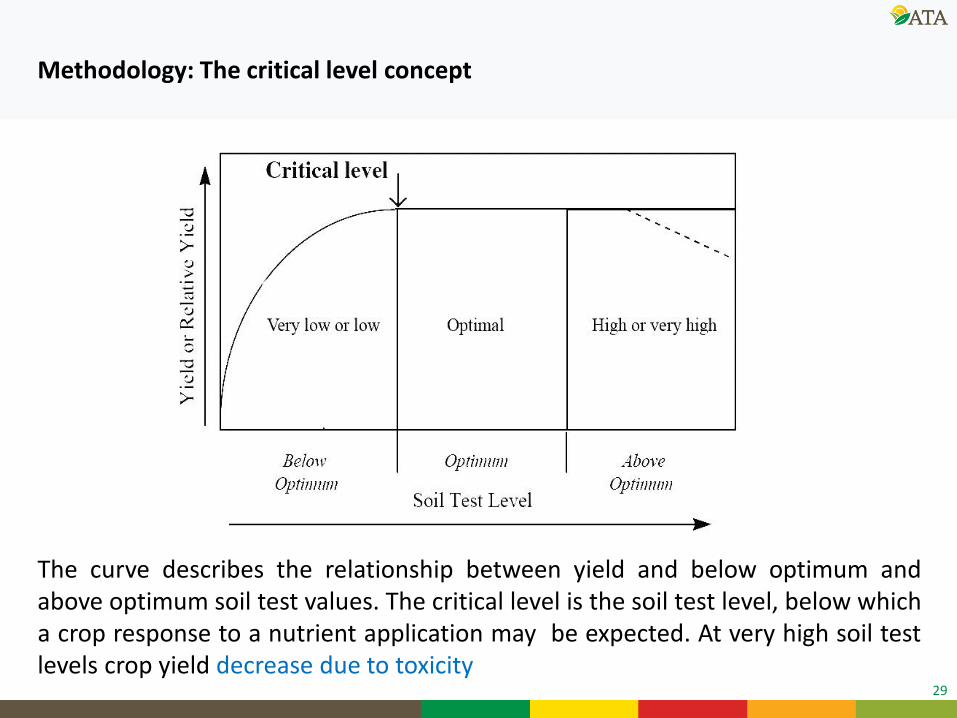
Methodology: The critical level concept
The curve describes the relationship between yield and below optimum and above optimum soil test values. The critical level is the soil test level, below which a crop response to a nutrient application may be expected. At very high soil test levels crop yield decrease due to toxicity
30
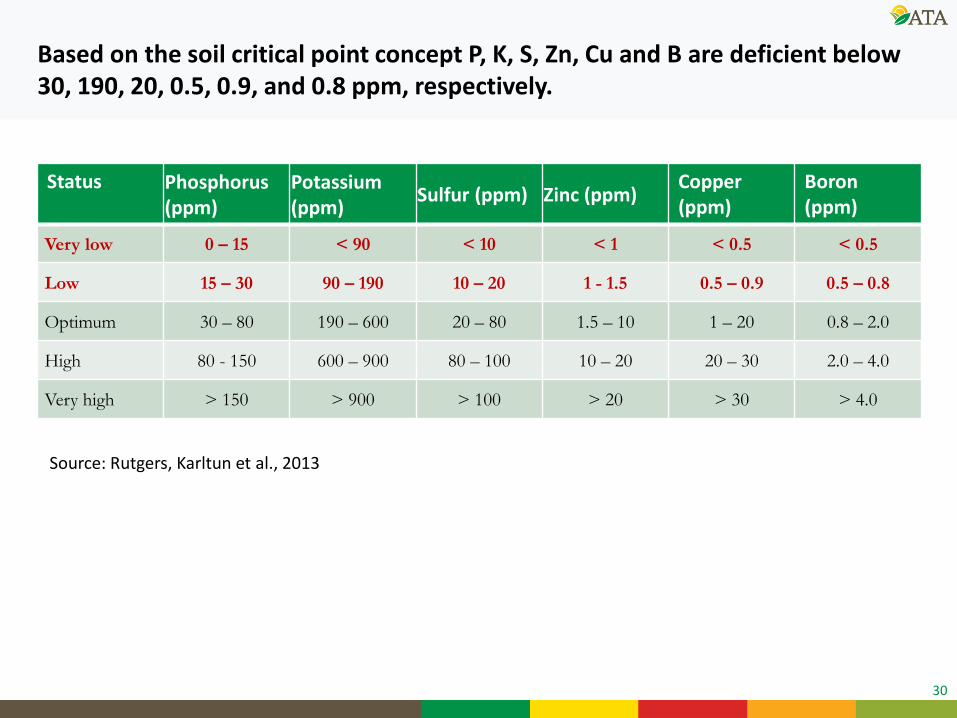
Status Phosphorus (ppm)
Potassium (ppm) Sulfur (ppm) Zinc (ppm) Copper
(ppm) Boron (ppm)
Very low 0 – 15 < 90 < 10 < 1 < 0.5 < 0.5
Low 15 – 30 90 – 190 10 – 20 1 - 1.5 0.5 – 0.9 0.5 – 0.8
Optimum 30 – 80 190 – 600 20 – 80 1.5 – 10 1 – 20 0.8 – 2.0
High 80 - 150 600 – 900 80 – 100 10 – 20 20 – 30 2.0 – 4.0
Very high > 150 > 900 > 100 > 20 > 30 > 4.0
Based on the soil critical point concept P, K, S, Zn, Cu and B are deficient below 30, 190, 20, 0.5, 0.9, and 0.8 ppm, respectively.
Source: Rutgers, Karltun et al., 2013
31
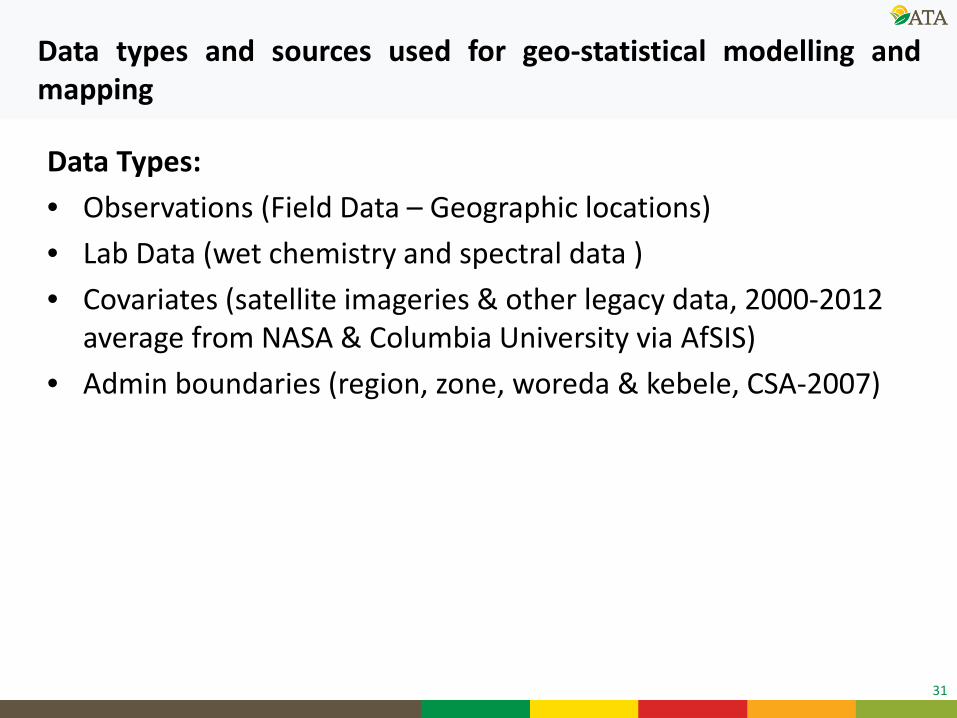
Data Types: • Observations (Field Data – Geographic locations) • Lab Data (wet chemistry and spectral data ) • Covariates (satellite imageries & other legacy data, 2000-2012
average from NASA & Columbia University via AfSIS) • Admin boundaries (region, zone, woreda & kebele, CSA-2007)
Data types and sources used for geo-statistical modelling and mapping
32
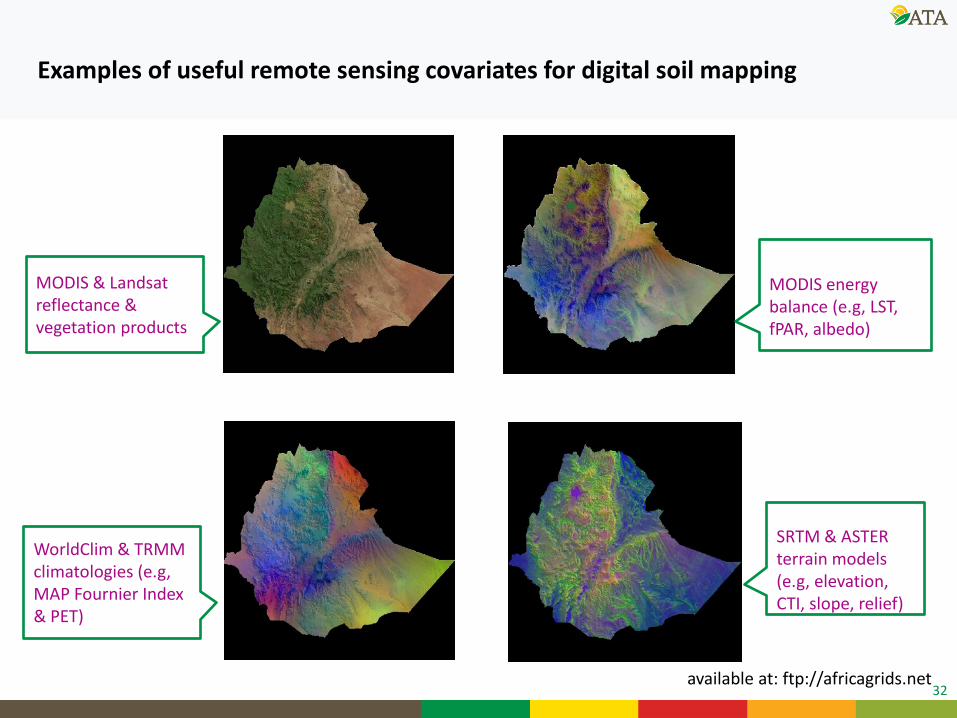
Examples of useful remote sensing covariates for digital soil mapping
MODIS energy balance (e.g, LST, fPAR, albedo)
SRTM & ASTER terrain models (e.g, elevation, CTI, slope, relief)
MODIS & Landsat reflectance & vegetation products
WorldClim & TRMM climatologies (e.g, MAP Fournier Index & PET)
available at: ftp://africagrids.net
33
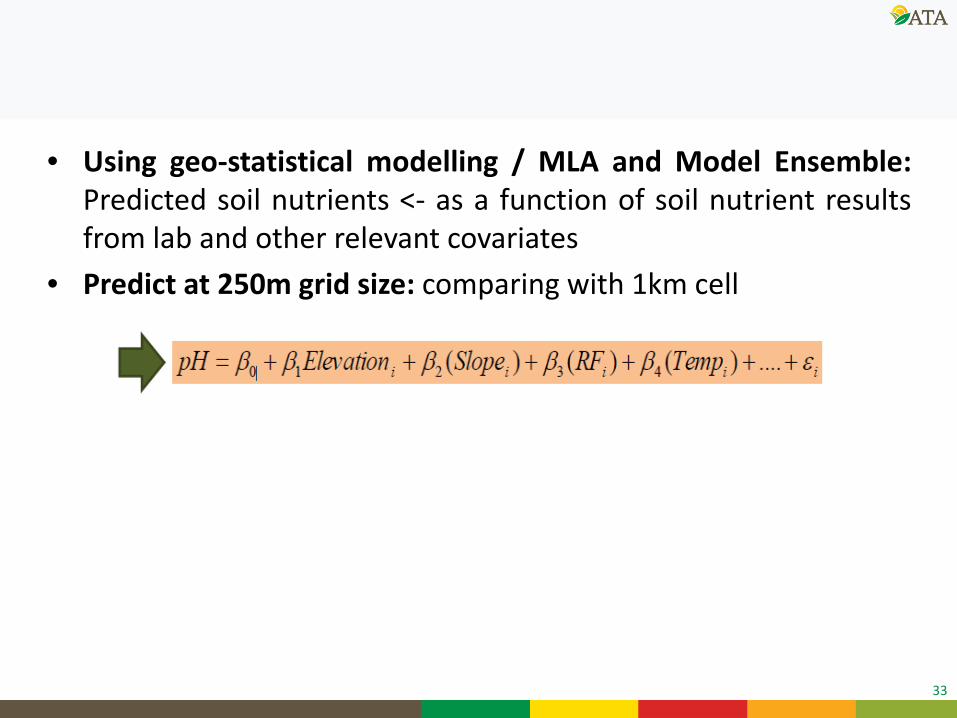
• Using geo-statistical modelling / MLA and Model Ensemble: Predicted soil nutrients <- as a function of soil nutrient results from lab and other relevant covariates
• Predict at 250m grid size: comparing with 1km cell
34
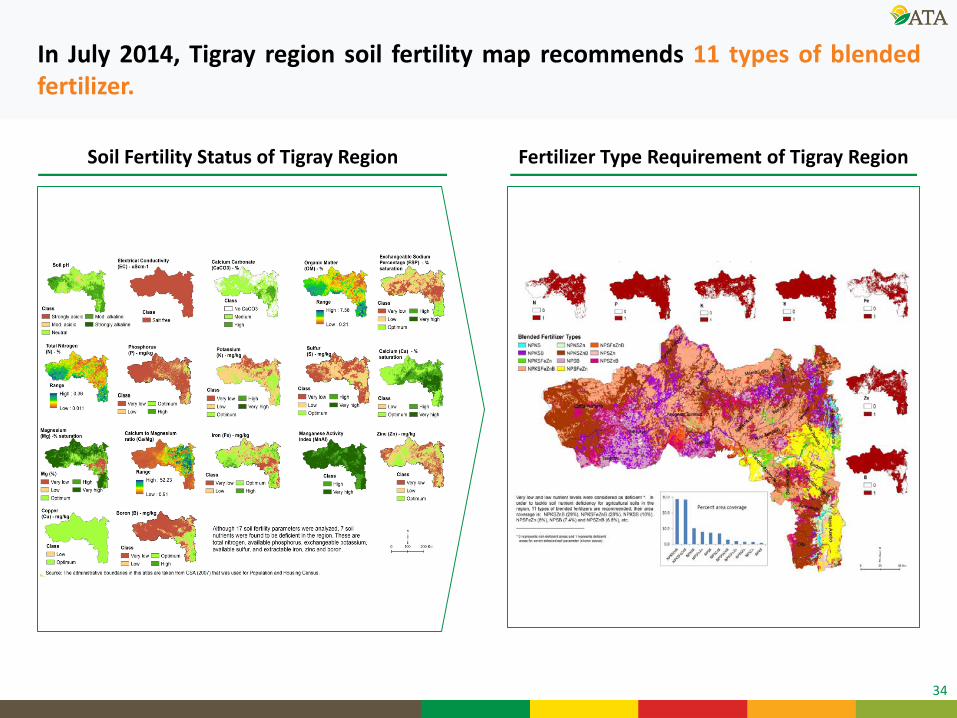
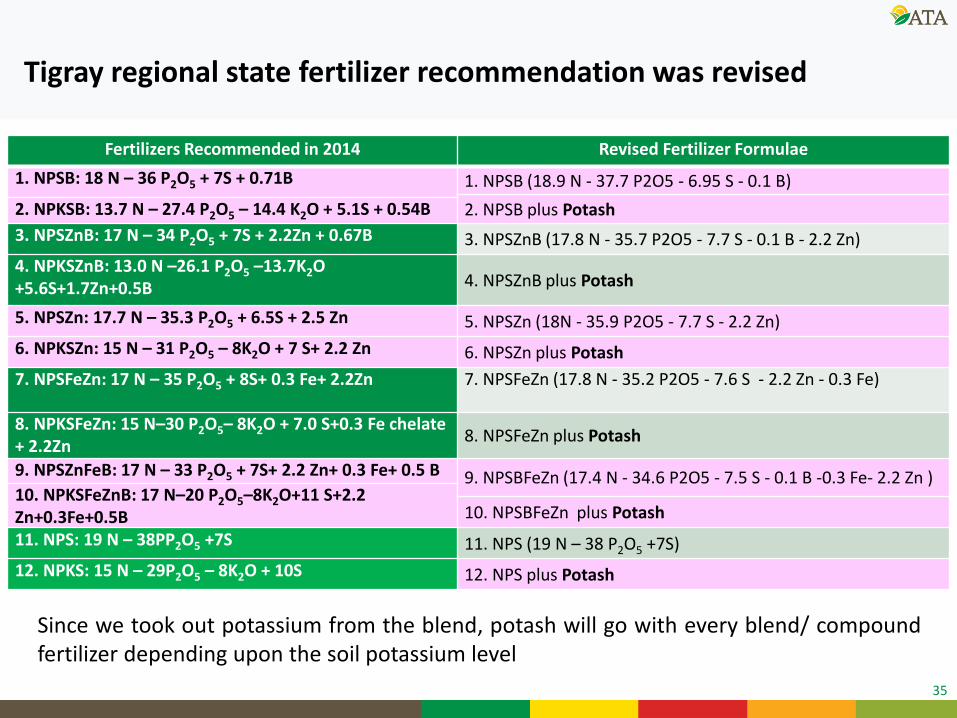
In July 2014, Tigray region soil fertility map recommends 11 types of blended fertilizer.
Soil Fertility Status of Tigray Region
Fertilizer Type Requirement of Tigray Region
35
Fertilizers Recommended in 2014 Revised Fertilizer Formulae
1. NPSB: 18 N – 36 P2O5 + 7S + 0.71B 1. NPSB (18.9 N - 37.7 P2O5 - 6.95 S - 0.1 B) 2. NPSB plus Potash 2. NPKSB: 13.7 N – 27.4 P2O5 – 14.4 K2O + 5.1S + 0.54B
3. NPSZnB: 17 N – 34 P2O5 + 7S + 2.2Zn + 0.67B 3. NPSZnB (17.8 N - 35.7 P2O5 - 7.7 S - 0.1 B - 2.2 Zn) 4. NPKSZnB: 13.0 N –26.1 P2O5 –13.7K2O +5.6S+1.7Zn+0.5B 4. NPSZnB plus Potash
5. NPSZn: 17.7 N – 35.3 P2O5 + 6.5S + 2.5 Zn 5. NPSZn (18N - 35.9 P2O5 - 7.7 S - 2.2 Zn) 6. NPKSZn: 15 N – 31 P2O5 – 8K2O + 7 S+ 2.2 Zn 6. NPSZn plus Potash 7. NPSFeZn: 17 N – 35 P2O5 + 8S+ 0.3 Fe+ 2.2Zn 7. NPSFeZn (17.8 N - 35.2 P2O5 - 7.6 S - 2.2 Zn - 0.3 Fe)
8. NPKSFeZn: 15 N–30 P2O5– 8K2O + 7.0 S+0.3 Fe chelate + 2.2Zn 8. NPSFeZn plus Potash
9. NPSZnFeB: 17 N – 33 P2O5 + 7S+ 2.2 Zn+ 0.3 Fe+ 0.5 B 9. NPSBFeZn (17.4 N - 34.6 P2O5 - 7.5 S - 0.1 B -0.3 Fe- 2.2 Zn ) 10. NPKSFeZnB: 17 N–20 P2O5–8K2O+11 S+2.2 Zn+0.3Fe+0.5B 10. NPSBFeZn plus Potash
11. NPS: 19 N – 38PP2O5 +7S 11. NPS (19 N – 38 P2O5 +7S) 12. NPKS: 15 N – 29P2O5 – 8K2O + 10S 12. NPS plus Potash
Tigray regional state fertilizer recommendation was revised
Since we took out potassium from the blend, potash will go with every blend/ compound fertilizer depending upon the soil potassium level
36
37
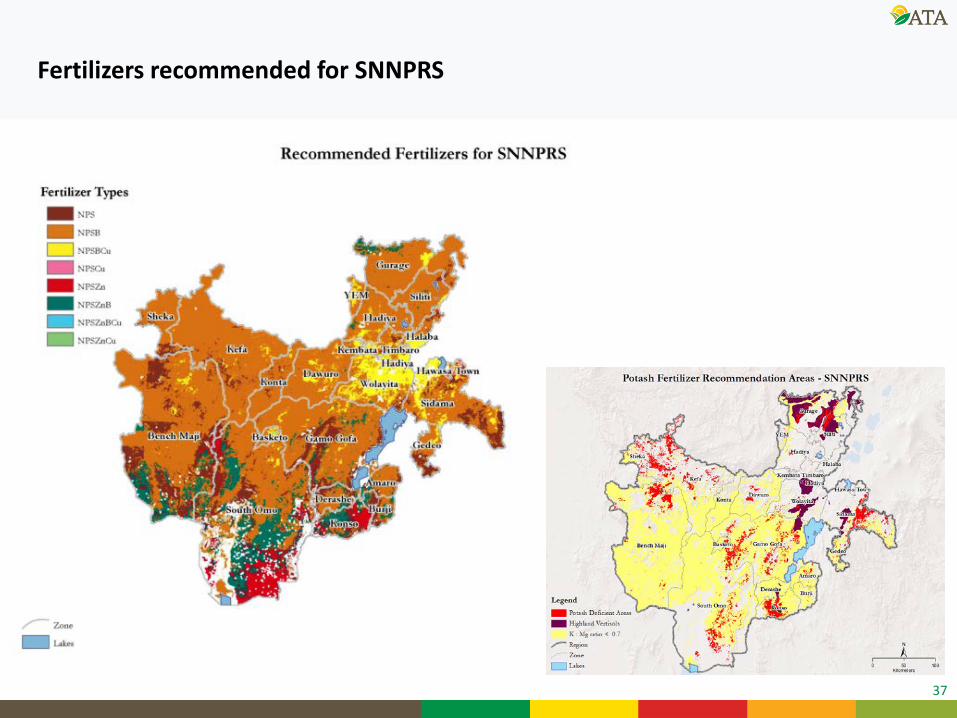
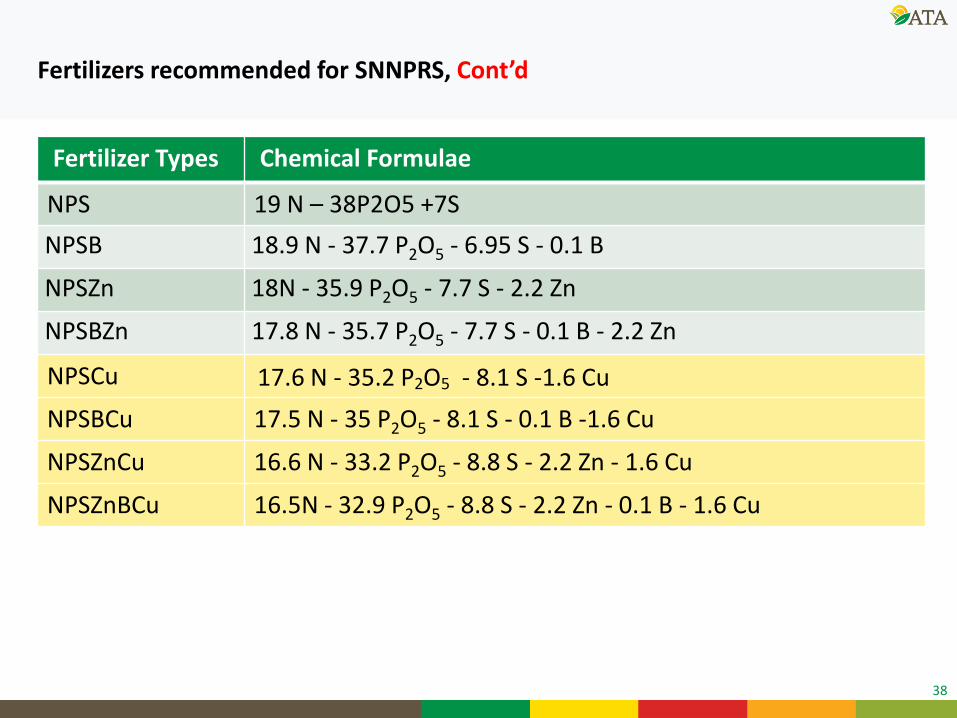
Fertilizers recommended for SNNPRS
38
Fertilizer Types Chemical Formulae
NPS 19 N – 38P2O5 +7S NPSB 18.9 N - 37.7 P2O5 - 6.95 S - 0.1 B
NPSZn 18N - 35.9 P2O5 - 7.7 S - 2.2 Zn
NPSBZn 17.8 N - 35.7 P2O5 - 7.7 S - 0.1 B - 2.2 Zn
NPSCu 17.6 N - 35.2 P2O5 - 8.1 S -1.6 Cu NPSBCu 17.5 N - 35 P2O5 - 8.1 S - 0.1 B -1.6 Cu
NPSZnCu 16.6 N - 33.2 P2O5 - 8.8 S - 2.2 Zn - 1.6 Cu
NPSZnBCu 16.5N - 32.9 P2O5 - 8.8 S - 2.2 Zn - 0.1 B - 1.6 Cu
Fertilizers recommended for SNNPRS, Cont’d
40
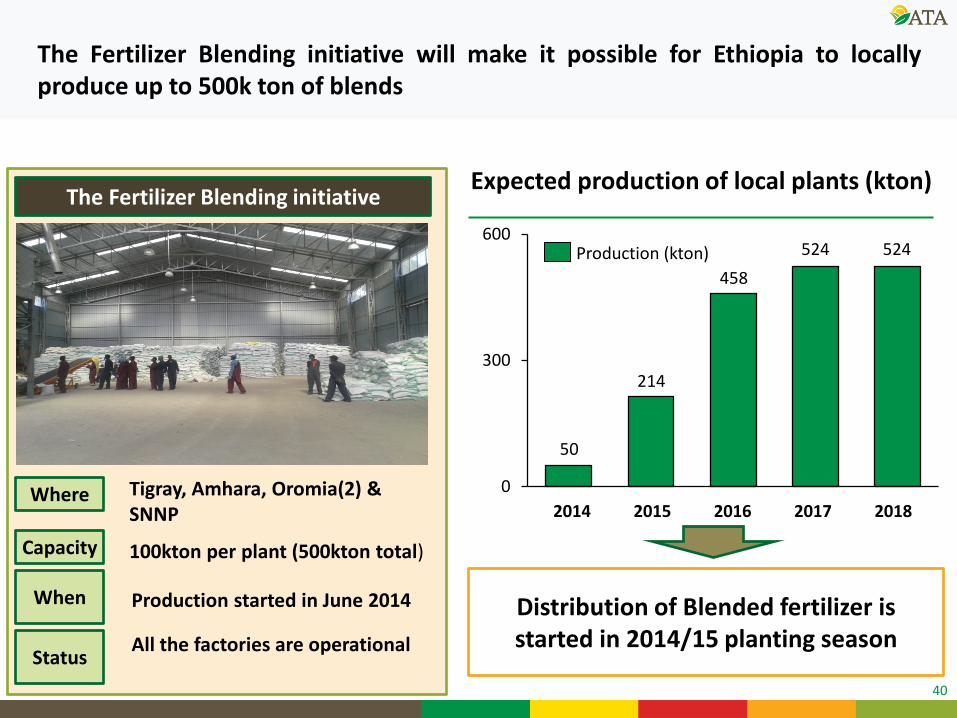
The Fertilizer Blending initiative will make it possible for Ethiopia to locally produce up to 500k ton of blends
50
214
458 524 524
0
300
600
2018 2014 2017 2016 2015
Production (kton)
Tigray, Amhara, Oromia(2) & SNNP
Production started in June 2014
All the factories are operational
When
Where
Status
The Fertilizer Blending initiative
Capacity 100kton per plant (500kton total)
Expected production of local plants (kton)
Distribution of Blended fertilizer is started in 2014/15 planting season
41
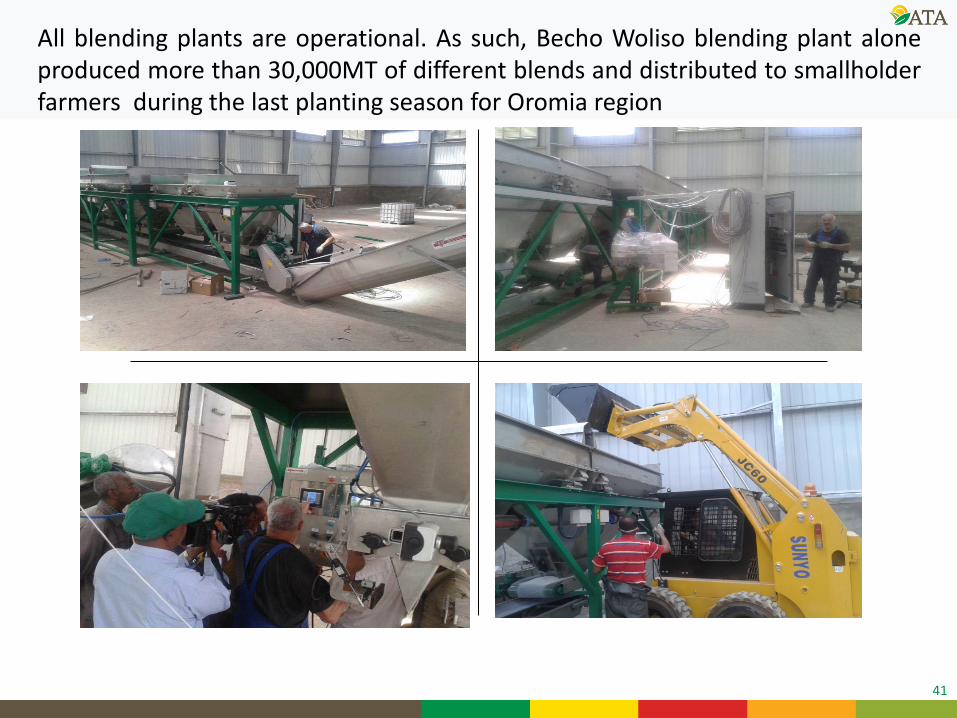
All blending plants are operational. As such, Becho Woliso blending plant alone produced more than 30,000MT of different blends and distributed to smallholder farmers during the last planting season for Oromia region
42
Executed in partnership with different stakeholders
• Federal and Regional Agricultural Research Institutes
• ATA, MoANR, Agricultural bureaus
• Sasakawa Global 2000
• Higher learning institutions (32 M.Sc and PhD degree
students ).
• >40, 000 demonstrations, >4.5m farmers.
New fertilizer demonstrations
43
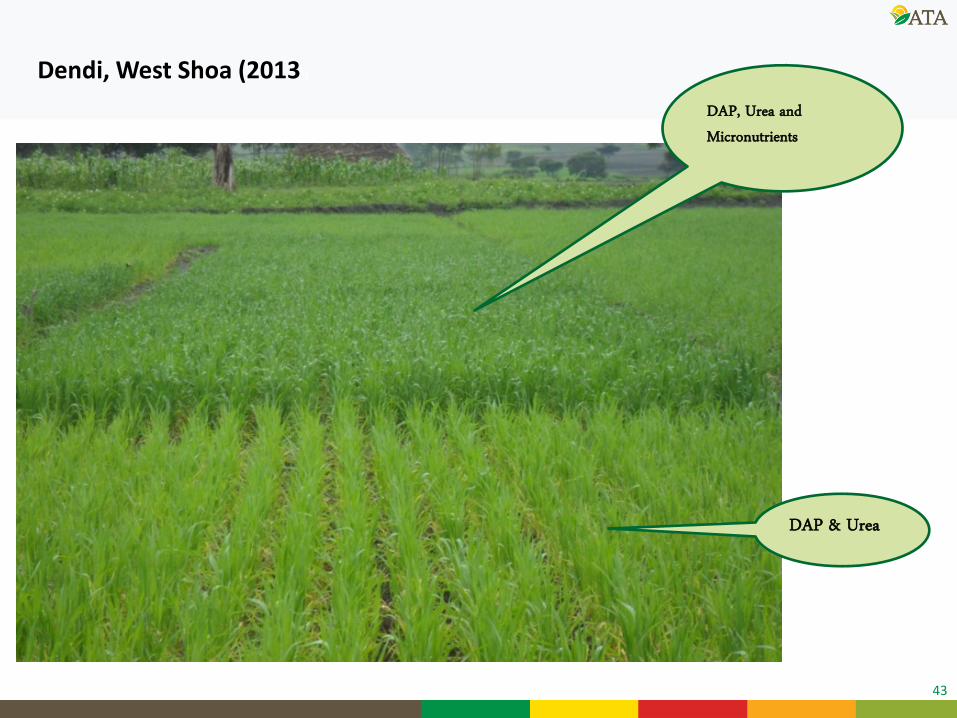
Dendi, West Shoa (2013))
DAP, Urea and
Micronutrients
DAP & Urea
44
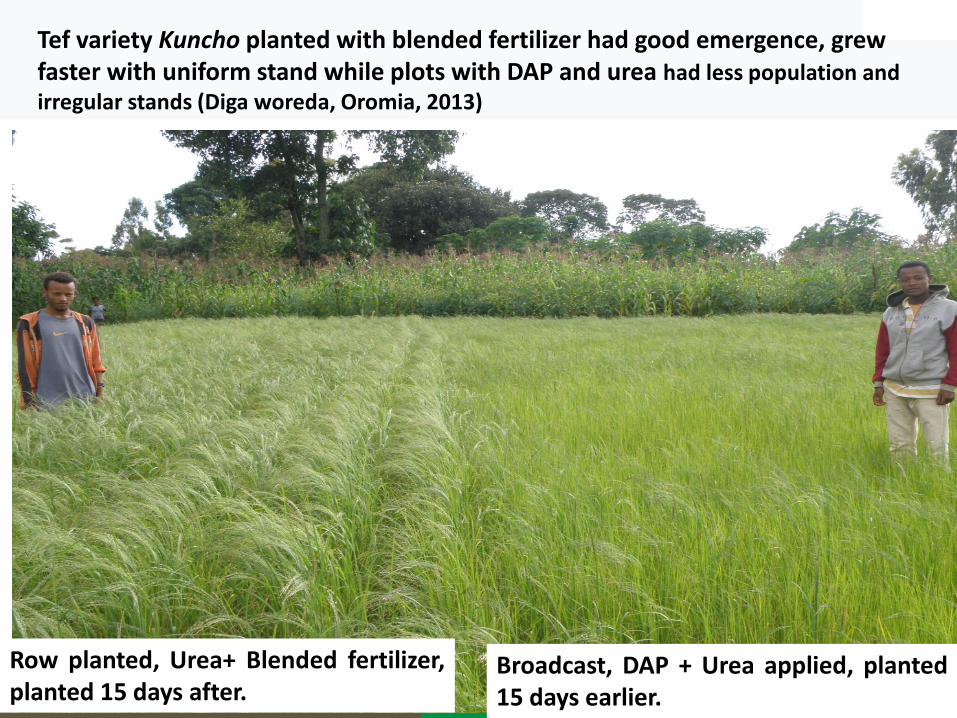
Tef variety Kuncho planted with blended fertilizer had good emergence, grew faster with uniform stand while plots with DAP and urea had less population and irregular stands (Diga woreda, Oromia, 2013)
Row planted, Urea+ Blended fertilizer, planted 15 days after.
Broadcast, DAP + Urea applied, planted 15 days earlier.
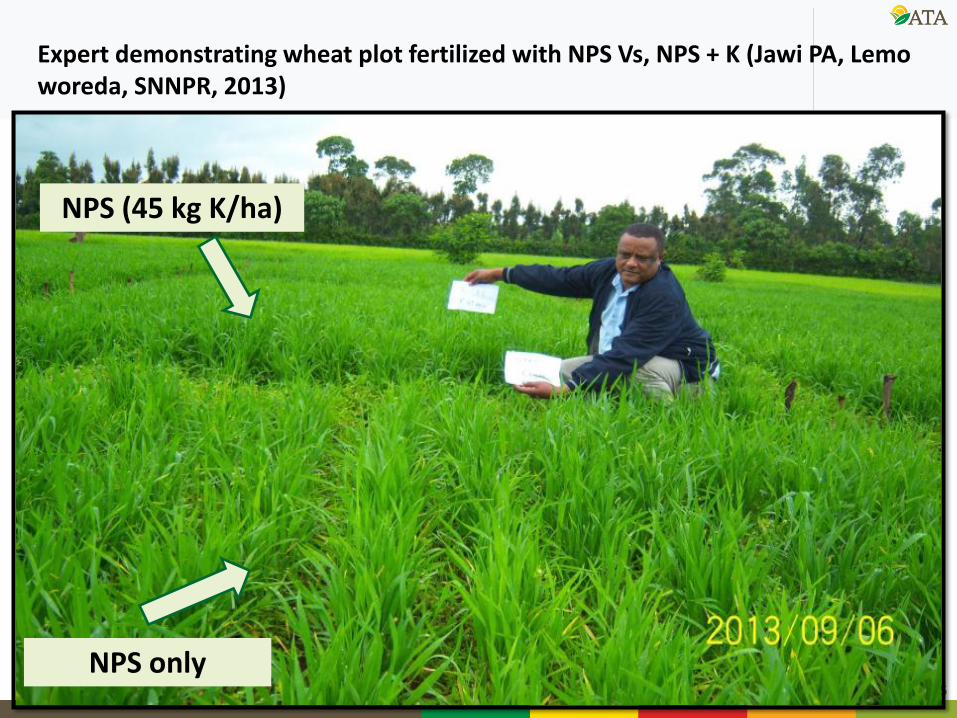
45 NPS only
NPS (45 kg K/ha)
Expert demonstrating wheat plot fertilized with NPS Vs, NPS + K (Jawi PA, Lemo woreda, SNNPR, 2013)
46
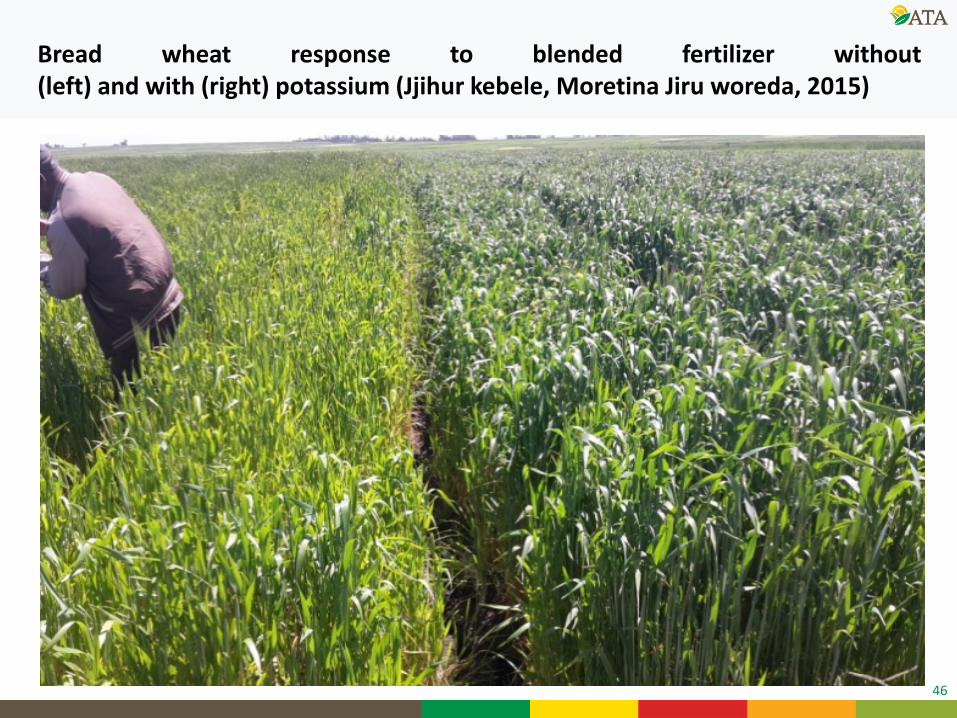
Bread wheat response to blended fertilizer without (left) and with (right) potassium (Jjihur kebele, Moretina Jiru woreda, 2015)
46
47
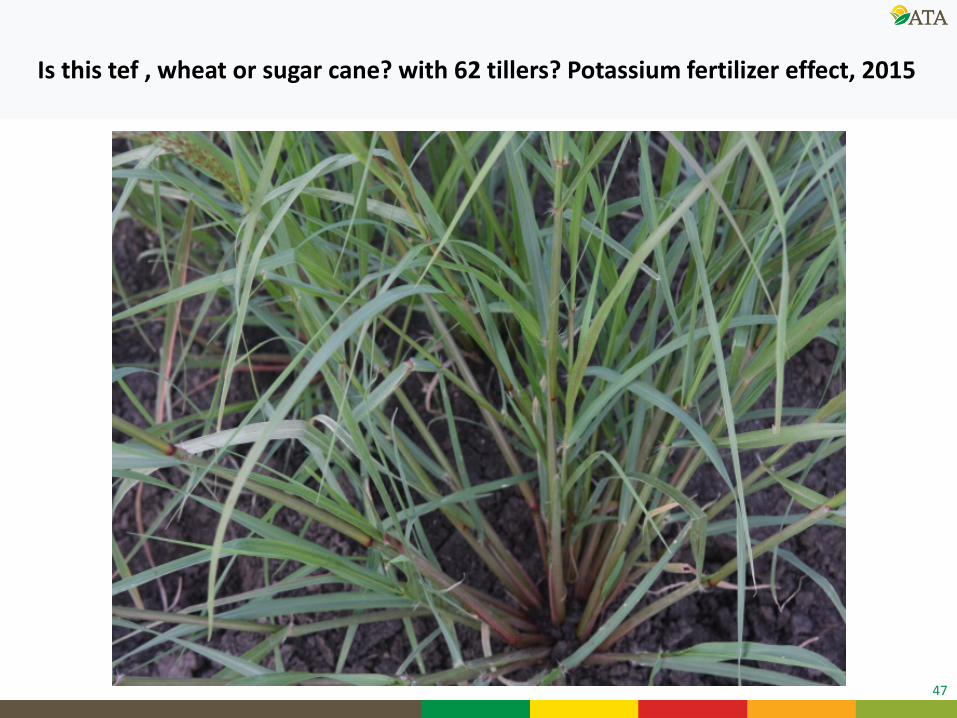
Is this tef , wheat or sugar cane? with 62 tillers? Potassium fertilizer effect, 2015
48
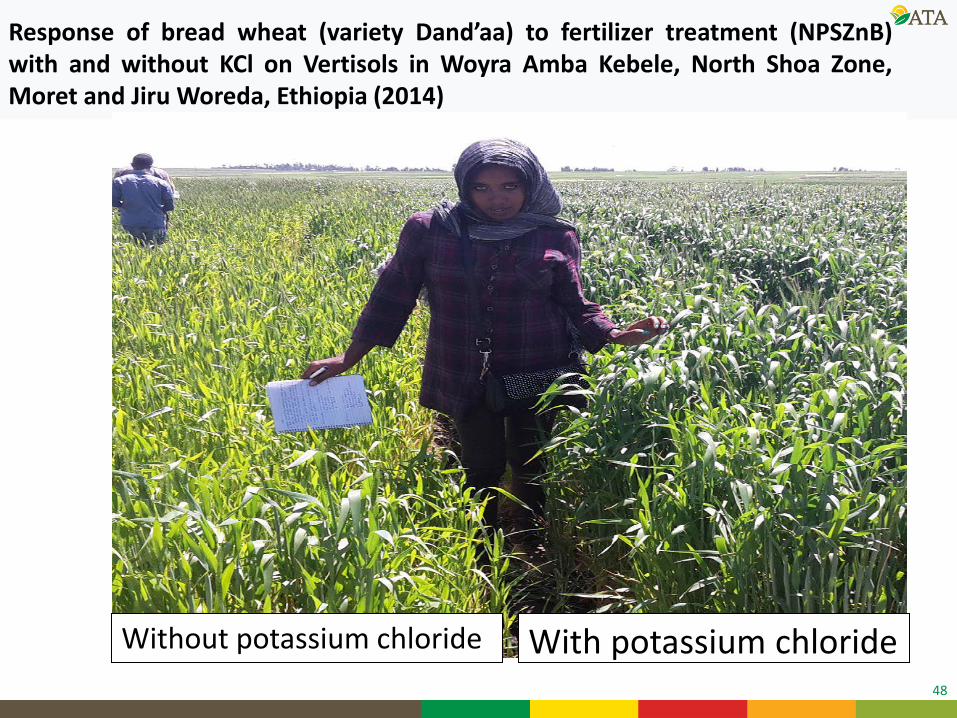
Response of bread wheat (variety Dand’aa) to fertilizer treatment (NPSZnB) with and without KCl on Vertisols in Woyra Amba Kebele, North Shoa Zone, Moret and Jiru Woreda, Ethiopia (2014)
With potassium chloride Without potassium chloride
49
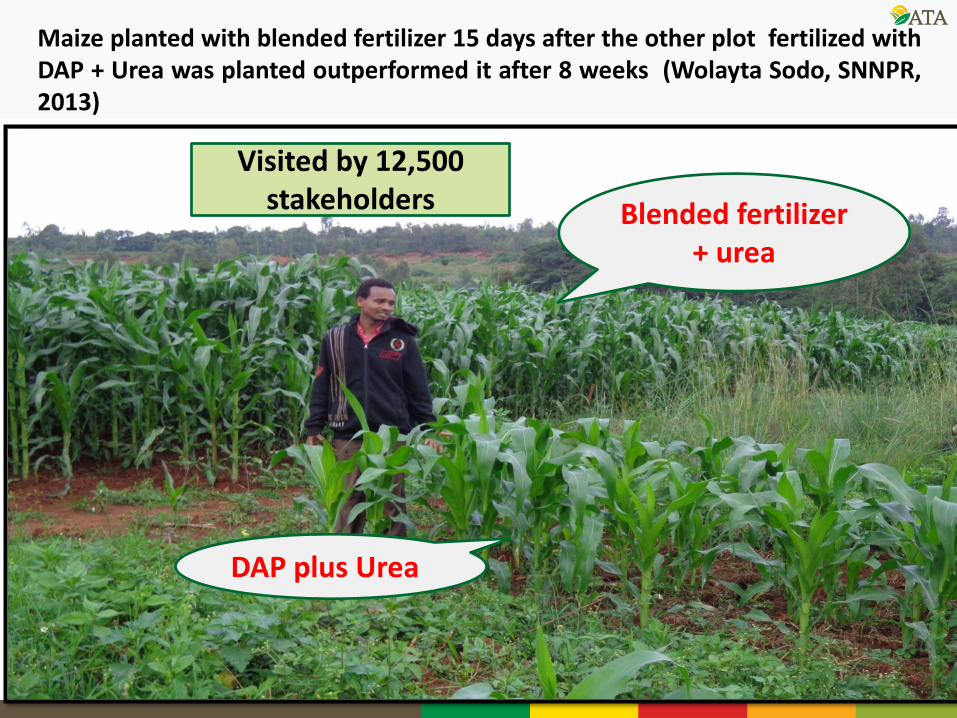
Maize planted with blended fertilizer 15 days after the other plot fertilized with DAP + Urea was planted outperformed it after 8 weeks (Wolayta Sodo, SNNPR, 2013)
Source: Team analysis
DAP plus Urea
Blended fertilizer + urea
Visited by 12,500 stakeholders
50
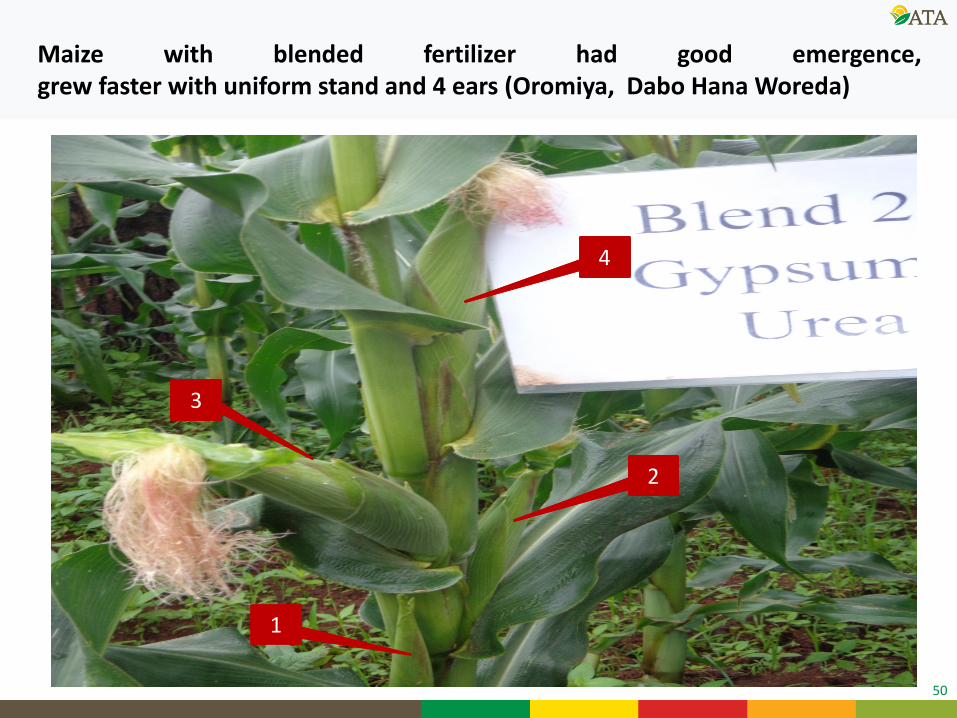
Maize with blended fertilizer had good emergence, grew faster with uniform stand and 4 ears (Oromiya, Dabo Hana Woreda)
1
3
2
4
3
2
4
51
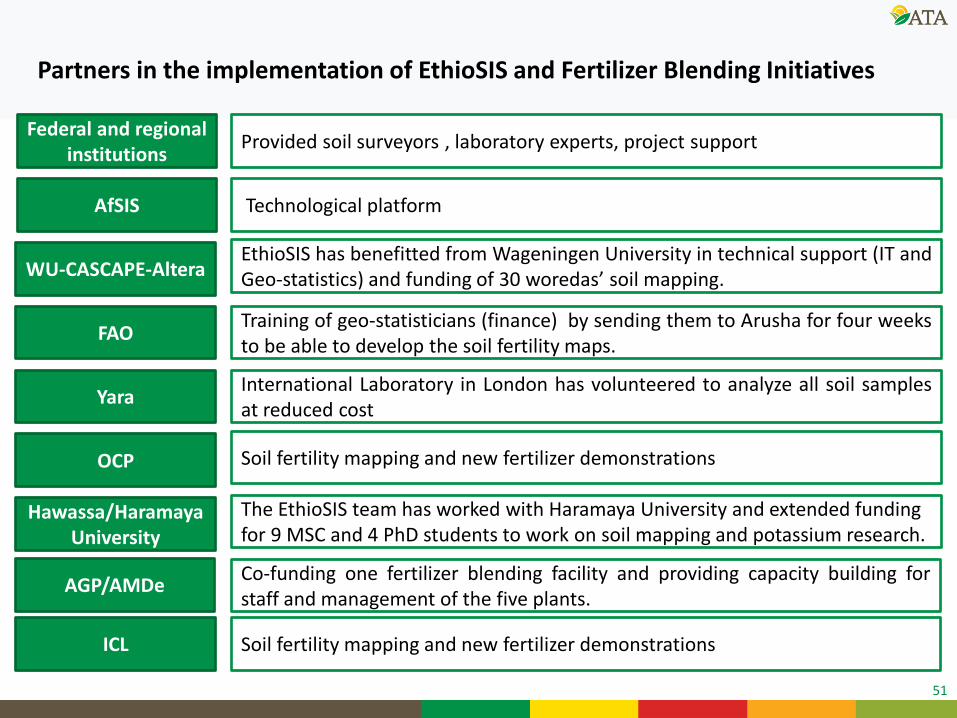
Partners in the implementation of EthioSIS and Fertilizer Blending Initiatives
WU-CASCAPE-Altera
FAO
Yara
OCP
Hawassa/Haramaya University
AfSIS
EthioSIS has benefitted from Wageningen University in technical support (IT and Geo-statistics) and funding of 30 woredas’ soil mapping.
Training of geo-statisticians (finance) by sending them to Arusha for four weeks to be able to develop the soil fertility maps.
International Laboratory in London has volunteered to analyze all soil samples at reduced cost
Soil fertility mapping and new fertilizer demonstrations
The EthioSIS team has worked with Haramaya University and extended funding for 9 MSC and 4 PhD students to work on soil mapping and potassium research.
Technological platform
Federal and regional institutions Provided soil surveyors , laboratory experts, project support
AGP/AMDe Co-funding one fertilizer blending facility and providing capacity building for staff and management of the five plants.
ICL Soil fertility mapping and new fertilizer demonstrations
Innovations to help our country grow