Embed Size (px)
Citation preview

The role of drug-related violence and extortion in promoting
Mexican migration: Unexpected consequences of a drug war
Viridiana Rıosa
aHarvard University
ABSTRACTMexican immigration figures have reached their lowest point since 2000. Yet, evenif as a whole the United States is receiving fewer Mexican migrants, the oppositeis true for cities at the border. In this article, I present evidence to show that thissui generis migration pattern cannot be understood using traditional explanationsof migration dynamics. Instead, Mexicans are migrating because of security issues,in fear of drug-related violence and extortion that has spiked since 2008. I providethe first estimate of this migration pattern, showing that 264,692 Mexicans havemigrated in fear of organized crime activities. In doing so, I combine the literatureon migration dynamics with that on violence and crime, pointing toward ways inwhich non state actors shape actions of state members.
Cite as: Rios, V. (2014). The role of drug-related violence and extortion in promotingMexican migration: Unexpected consequences of a drug war. Latin American ResearchReview, 49(3), 199-217.
1. Introduction
Mexican immigration to the United States has diminished steadily since 2000 (MMP,2009). With figures dropping from an estimated 525 thousand Mexicans yearly leavingtheir country for the United States to fewer than 100 thousand, current migrationfigures are the lowest on record (Sheridan, 2011). Among the main reasons behindthis trend are changes in Mexico’s demographic profile (Terrazas, Papademetriou, &Rosenblum, 2011), an increase in the number of Mexicans earning college degrees(Ibarraran & Lubotsky, 2007; Orrenius & Zavodny, 2005), a constant increase in thecosts associated with crossing the border (Cornelius & Lewis, 2007; Massey, Durand,& Malone, 2003; MMP, 2009; Orrenius, 2004), and the recession that the US economyhas been facing since late 2007 (Papademetriou, Sumption, & Terrazas, 2011).
Even if the United States as a whole has experienced a decrease in the number ofMexican immigrants, the opposite seems to be true for US cities located at the border.Preliminary figures estimate that about 115,000 Mexicans have arrived in US bordercities since 2006 (Rice, 2011). El Paso, for example, grew by 50,000 inhabitants from2009 to 2011, and at least 30,000 of those new inhabitants were Mexicans moving fromCiudad Juarez (Alvarado, 2011).
To understand this phenomenon, I bring together the literature of migration dy-namics (Massey & Taylor, 2004) with studies of crime, security, and violence (Di Tella,

Edwards, and Schargrodsky 2010). I claim that to fully understand the dynamics ofmigration from Mexico to the United States and within Mexico, we need to broadenour analysis of the factors that we normally analyze as part of traditional immigrationliterature, such as economic hardship, network analysis, or labor dynamics (Massey &Arango, 1998; Massey & Espinosa, 1997; Massey & Taylor, 2004).
As cumulative causation theory improved our understanding of migration patternsby pointing toward the importance of social ties in shaping individual decisions torelocate (Massey, 1990) -a variable that had been overlooked by scholars from the neweconomics, neoclassical economics, and labor market theories (Piore, 1979; Todaro &Maruszko, 1987)-this article argues that to complement the various competing theoriesthat explain migration, academics should bring attention to how security environmentsaffect relocation. In particular, I argue that drug-related violence and organized crimeactivities are affecting migration dynamics in Mexico. An important number of Mex-icans are relocating to the United States, and to other cities within their country,to escape drug-related homicides and criminal activity that has spiked since 2008. Inadvancing this argument, I also speak to broader political science theories that havetried to assess the impact that nonstate actors have on shaping the decisions of statemembers in fundamental areas such as the allocation of human capital and resourceswithin a polity.
I first present an overview of Mexico’s security situation. A second section exploresmigration outflows at the border and within Mexico and shows why Mexicans livingin border towns seem to be particularly inclined toward migrating. The third andfourth sections show my statistical results. I estimate that a total of 264,692 Mexicanshave changed residency in direct response to drug-related homicides. A fifth sectionprovides qualitative evidence of migration outflows.
2. Mexico’s drug related violence
Fear has become part of our lives... There’s panic. We don’t know when the shootingis going to break out.
-Tijuana citizen, quoted in Marc Lacey, “Hospitals Now a Theater in Mexico’s DrugWar”
Mexico’s homicide rates have increased every year since 2006 as a result of increasesin territorial fights between drug cartels and changes in Mexico’s security policies(Castillo, Mejıa, & Restrepo, 2014; Dell, 2011; Rios, 2013). From December 2006 to2010, 34,550 killings were officially linked to organized crime, a dramatic increasefrom previous years (2000-2006), when only 8,901 killings were linked to organizedcrime (Rios & Shirk, 2011). Most drug-related homicides concentrate at border cities,because the most profitable part of the drug-trafficking business chain occurs at US-Mexico crossing points (see figure 1). During the 2006-2010 period, the six Mexicanstates located at the US-Mexico border accounted for 47.81 percent of all drug-relatedmurders despite containing just 17.62 percent of Mexico’s population. Approximately30.04 percent of all drug-related homicides occurred in 39 border municipalities, whichrepresent less than 1 percent of the roughly 2,450 municipalities in Mexico and just6.06 percent of the country’s population.
[Figure 1 about here.]
Drug-related homicides within Mexico have not only increased but changed in na-
2

ture. Different than in years prior to 2004, government authorities are increasinglytargeted by traffickers (Freeman, 2006). In border cities like Tijuana, at least 100 po-licemen died on duty every year from 2007 to 2009 (Guerrero 2009)1. To put this inperspective, in the entire United States 133 police officers were killed in the line ofduty in 2008. The same period saw the chief of police in Nuevo Laredo, south of Texas,lasting eight hours in the position before being assassinated by traffickers. Traffickershave also created new ways to spread fear among the population. Bodies are left inthe streets with messages targeted at other citizens, politicians, or fellow criminals.
Furthermore, criminal organizations have diversified their activities, getting intoalternative illegal businesses, and expanded their areas of operation (Coscia & Rios,2012; Diaz-Cayeros, Magaloni, Matanock, & Romero, 2011; Rios, 2013). Extortion isperhaps the most widespread of these new criminal ventures. Criminals initially usedextortion to target illegal businesses such as prostitution rings and casinos, industriesin which the probability of being denounced to the police by the owner was exceed-ingly low. However, the extortion of businesses soon extended into the legal sphereand became traffickers’ most accessible means of quickly acquiring cash. It has deeplyaffected business dynamics. High protection fees and intimidation have forced busi-nesses into bankruptcy and have pushed some businessman to take radical action suchas creating violent organizations for self-defense.
3. Unexpected migration outflows in Mexico
From 2006 to 2010, some Mexican cities started depopulating unexpectedly. As aresult, the usual general predictors of population trends, which have previously beenquite successful in predicting the yearly population in Mexican counties (Partida Bush,2008), are producing higher than normal prediction errors2.
Unexpected migration outflows have been particularly prominent in areas locatedon the US-Mexico border, probably because acquiring US residency is relatively easythere (table 1). While Mexican border cities tended to lose inhabitants unexpectedly(an average of 35,255), counties not on the border tended to gain inhabitants (anaverage of 1,297.86). The tendency is less strong when considering all border counties(independently of whether or not they are urban or rural), yet even here an averageabout 8,103.63 people left unexpectedly.
When considering all Mexican cities, among those experiencing the largest unex-pected population outflows are important border cities. Juarez lost 150.36 thou-sandinhabitants, about 11 percent of its population, between 2006 and 2010. Other citieswith high violence levels have lost population during the same period, like Tijuana(6 percent), Reynosa (9 percent), and Matamoros (4 percent) (INEGI, 2010; Par-tida Bush, 2008)3. Cities like Praxedis G. Guerrero, Mier, and Guadalupe have facedunexpected outflows of more than 25 percent of their whole population (INEGI, 2010;Partida Bush, 2008).
It is impossible to know where these people relocated, but preliminary figures agree
1Tijuana is a border town located south of San Diego, California. During 2008, it saw 614 drug-related
homicides, a rate of about 43.72 per 100,000 inhabitants, more than non-drug-related homicides, which caused
only 20.46 casualties per 100,000.2Mexican authorities have developed quite sophisticated methodologies to predict migration trends due to the
important role that population flows, particularly migration to the United States, play in determining demand
for public services.3Reynosa is a Mexican border city located south of Texas with drug-related homicide rates of about 26.18
per 100,000 inhabitants in 2010.
3
that at least half of them moved to the United States (Rice, 2011). Particularly, formiddle- and upper- class Mexicans living on the border, migration to the UnitedStates feels like the natural choice when a change of residency is being planned. Formany of them it is just like moving from one neighborhood to another within thesame city, or, as one citizen described it, “moving to the American side of the city”.Inhabitants commonly refer to border cities using their Mexican or American namesalmost interchangeably. As the mayor of Laredo said, “We are inhabitants of Laredos”,referring to Laredo, Texas, and Nuevo Laredo, Tamaulipas; “The border does notdivide our policies or families”4.
Other Mexicans have surely relocated within Mexico. Indeed, some cities, particu-larly Acapulco, Chimalhuacan, and Tlajomulco have experienced unexpected migra-tion inflows. Tlajomulco, for example, grew about 30 percent more than populationpredictions had accounted for; Juarez (Nuevo Leon) and Bahıa de Banderas also grewby more than 18 percent from 2006 to 2010.
In the following section I present empirical evidence linking Mexican migrationoutflows to drug-related violence and organized crime activities.
4. Empirical specifications
As my main specification I used a linear regression model whose dependent variableis the number of Mexicans within a county that unexpectedly left that county from2006 to 2010, or what I call unexpected migration outflows. The unit of analysis isthe county. There are a total of approximately 2.5 thousand observations, one obser-vation per county. All figures were scaled to represent rates per 100,000 inhabitants.To measure unexpected migration outflows I subtract population predictions for 2010(calculated using variables measured in 2005 to predict the number of people thatwould be living in a particular county in 2010; Partida Bush (2008)) minus real pop-ulation figures (according to the 2010 census; INEGI (2010))5.
This research project was made possible because of mistakes made by Mexico’sNational Population Council (Consejo Nacional de Poblacin, CONAPO). Every year,CONAPO predicts county-level population figures considering demographic and eco-nomic variables. Given how important migration outflows to the United States are aspredictors of population figures, CONAPO uses very sophisticated methods to predictthe total number of Mexicans that will change their residency to the United States6.The predictions take into account economic conditions in both Mexico and the UnitedStates, surveys, polls, previous census figures, and panel studies. Every five years,when a census is conducted in Mexico, CONAPO predictions can then be checkedfor accuracy. The predictions are normally quite good. However, as figure 1 shows,official predictions in 2010 were particularly inaccurate. The graph shows each countyaccording to the size of the population that was incorrectly predicted for two peri-
4Ramon Garza Barrios, major of Nuevo Laredo, Tamaulipas, interviewed in June 2009 at Nuevo Laredo,
Tamaulipas, Mexico.5Only positive cases were considered (i.e., migration outflows) because the goal of this article is to identify
variables that are correlated with people leaving their counties, not with people arriving to new counties.Decisions over exiting a county (outflow) and picking a new one (entry) may not necessarily follow the samelogic. The former is the only concern of this article. Models considering positive and negative values (also called
“migration flows”) were calculated as alternative specifications and provided similar (although weaker) resultsthan those presented here.6Predictions are based on the algorithms developed by Bean, Corona, Tuiran, Woodrow-Lafield, and Van Hook
(2001) using Mexican and US Census figures (1950-2005), the Current Population Survey (19902005), and the
American Community Survey (2002-2005). For more details on the specification see Partida Bush (2008).
4

ods, from 2000 to 2005 and from 2005 to 2010. Positive (or negative) numbers referto municipalities where predictions calculated more (or less) population than actual.While in 2005 most of the observations are close to zero, meaning predictions wereaccurate; the dispersion of the 2010 figures is much larger. In 2005, official statisticsfailed to predict the migration of 866 thousand Mexicans, in 2010 they failed by 2,394thousand, an error 176 percent higher.
In my main specification, I compare CONAPO predictions for 2010 to census fig-ures in 2010 to capture population outflows that could not be predicted even whileaccounting for changes in economic or demographic conditions in Mexico and theUnited States. The level of analysis is the municipality. I called my dependent variableunexpected outflows and defined it as the number of individuals (per 100,000 inhabi-tants) that CONAPO predicted would live in a municipality and yet the census showedwere not there. Unexpected outflows are larger when CONAPO predicted more peoplewill be living in a county than the census captured.
In every specification, I added a control to account for other unmeasurable factorsdriving possible errors in CONAPO’s prediction. I created a proxy variable for ex-pected CONAPO errors by measuring the error that CONAPO made in its previouspredictions. I used the estimation errors that CONAPO made in the second-to-lastcensus year (INEGI, 2005) because I expect 2010 municipalities to be more similarto what they were in 2005 than to any more distant census year. The logic behindthis proxy is to control for counties that have proven to be difficult to estimate forCONAPO. Some counties may have inherent characteristics that make their popula-tion figures more variable and thus highly susceptible to incorrect estimation.
As my independent variables, I used measures of three of the most common types oforganized crime violence in Mexico: homicides linked to drug trafficking, extortion, andkidnapping. These variables quantified as the total incidence of these crimes per county,per 100,000 inhabitants, for years between censuses (i.e., 2006 to 2009). Drug-relatedhomicide figures come from Mexico’s National Security Council (2011), an institutionthat counts the number of homicides related to activities of criminal organizationsand provides monthly figures per county from December 2006 until December 20107.Kidnapping and extortion figures were obtained from state-level Mexican offices of thegeneral attorney (INEGI, 2011).
To control for social and economic factors that may have generated unexpected eco-nomic conditions within Mexico (which could have changed migration pat-terns morethan CONAPO could have predicted) I added two sets of controls: employment andeducation figures. Academic research indicates that these two variables are among themost important drivers of migration (Massey & Arango, 1998). Particularly, researchshows that a higher number of college graduates is an important deterrent of migrationto the United States and an enhancer of migration within Mexico from rural to urbanareas (MMP, 2009). Higher levels of employment normally translate to less migration
(Tuiran, Partida, & Avila, 2000a, 2000b).A common dummy for each of the thirty-nine Mexican counties located right at
the border was added. The intention is to capture, in a very indirect way, the ease ofmigration decisions. The assumption is that any factor increasing migration willingnessamong Mexicans will have an increased effect on border counties, where migrationcosts are lower with respect to the rest of the country. An alternative specificationalso added a common dummy for each of the five border states.
7Mexican authorities follow strict procedures to identify whether a homicide is related to organized crime
according to the characteristics of the event as well as intelligence reports. For more information, refer to (Rios& Shirk, 2011).
5

Finally, as part of robustness tests, extra controls and specifications were tested.An alternative specification adds figures of general homicides not related to organizedcrime as assessed by (INEGI, 2011) to account for the effects that other forms ofviolence may have had in driving migration. State-fixed effects (thirty-two, one perMexican state) were also added8.
General descriptive statistics of the dependent and independent variables are pre-sented in table 1 .
[Table 1 about here.]
5. Principal results
The results, given in table 2, strongly support my hypothesis. Migration out-flowsare higher in places with higher drug-related violence and crime, even ac-counting forfactors such as employment and human capital. Several models were specified.
[Table 2 about here.]
Model 1 presents results without controlling for non-drug-related homicides, whilemodels 2 and 3 control for them. Controlling for non-drug-related homicides does notchange the results but improves the fit of the models. Drug-related violence is stronglylinked to migration outflows, independent of the general homicide rate in a county.Furthermore, in every specification the coefficients of drug-related homicides are largerthan those of general homicides, which con-firms my hypothesis that Mexicans aremaking the decision to migrate based on organized crime activities rather than ongeneral security concerns. The reason why drug-related homicides are better predictorsof migration outflows than general homicides may be that drug-related homicidesare a newer phenomenon, not an important cause of homicides before 2004 (Rios &Shirk, 2011), and leave a longer-lasting impression in the communities because of theirparticularly violent features. Unlike general homicides, the victims of drug-relatedhomicides are tortured and beheaded and their bodies are dumped in the streets,hanged from pedestrian bridges, or displayed publicly next to messages directed torival trafficking organizations.
Model 3 adds fixed effects per states to capture changes happening at the statelevel that may have influenced migration dynamics. For example, we should expectcitizens living in states with publicly well-regarded justice systems to be less affectedby drug-related violence even if the number of homicides is the same as in states wherecitizens are less confident of their governments. My goal is to show that outflows arecorrelated with organized crime activities, which is why model 3 is considered thepreferred specification.
Indeed, in all specifications, drug-related homicides are an important factor in Mexi-can migration outflows. In my preferred specification (model 3), drug-related homicidesincreased the number of Mexicans unexpectedly migrating out of their counties of res-idence by 220,2919. Each one-point increase in the rate of drug-related homicides per100,000 inhabitants is correlated with 6.34 Mexicans fleeing their county of residence.
8I tested for weighted coefficients based on the inverse of their squared residuals. The use of weights did notchange coefficients or standard errors meaningfully.9To transform the coefficients of my preferred specifications into actual number of immigrants, I calculated the
value of the dependent variable (unexpected migration outflows) for each observation, setting each independent
variable to its mean and assuming that the maximum of drug-related homicides and extortions had happened. I
6

As an example, consider the case of Tijuana. In the period from 2007 to 2008, its drug-related homicide rate changed by 31.04 points (from 176 to 614 drug-related homicidesin just one year). If the results of the model hold, an average of 5,367 Mexicans leftTijuana just during 2008 fleeing from drug-related homicides.
Other organized crime activities, particularly extortion, also have had importanteffects on migration outflows. In the preferred specification, every additional case ofextortion per 100,000 inhabitants increases unexpected migration outflows by 13.03 per100,000 inhabitants. That accounts for a total of 44,401 Mexicans relocating to escapeextortion. Tijuana has lost about 926 citizens because of extortion; other border citiesNuevo Laredo, Reynosa, and Juarez lost 286, 334, and 221 individuals, respectively.Kidnappings were not significantly correlated with migration outflows. This result isquite robust among all models and is consistent with what we would expect given theparticularities of the victims of this crime. Kidnappers pick their victims according totheir wealth, not location. Because kidnapping victims are hunted, migration does notchange their attractiveness as targets.
Considering the forms of criminal violence that were found significant for migration,a total of 264,692 Mexicans fled their counties fearing either drug-related homicides(approximately 220 thousand) or extortion (approximately 44 thousand).
Traditional economic explanations of migration outflows take the expected signs andare significant in all outflows specifications. An increase of one point in employmentrates or in the number of college degrees per 100,000 inhabitants reduces migrationoutflows by 0.01 and 0.11 per 100,000 inhabitants, respectively.
Finally, all variables introduced to correct for CONAPO’s error were strongly sig-nificant. Indeed, it seems as though CONAPO faces greater inherent problems inmeasuring population outflows in some places than in others. In general, places whereCONAPO’s 2005 predictions were upward biased (i.e., CONAPO predicted more peo-ple than the 2005 census) had the same upward bias in 2010. The relationship is 1 to0.77 in the preferred specification, meaning an error of 1 in 2005 figures is correlatedwith an error of 0.77 in 2010 figures10.
6. The new driver of Mexico’s immigration outflows: Security issues
I know that we came here illegally, but at least we can sleep in peace now.
–Citizen of Juarez relocated in El Paso, quoted in Mariel Torres, “Running from Violence,Young Student Finds Cultural Barriers in Her New Country”
The effect of violence in determining migration outflows is a well-studied phe-nomenon within political science research on Africa and in other civil war contexts
did the same, assuming that zero drug-related homicides and extortions had happened, and found the differenceof these two figures. The results were relative figures measuring the population per 100,000 inhabitants that,
ceteris paribus, the model would have predicted to migrate out of a county due to drug-related homicides and
extortion. Considering population, the numbers were then transformed into absolute figures.10The fact that drug-related violence is a predictor of unexpected migration outflows is an even more robustfinding if we consider that CONAPO’s 2010 population predictions assumed that migration outflows from
Mexico to the United States will remain at least as high as those measured in 2000, which we now know was
the highest point of Mexico-US migration to date (MMP, 2009). Given unexpectedly harsh economic conditionsin the United States, particularly in 2007 and 2008, CONAPO’s predictions should be upward biased. In otherwords, CONAPO assumed US labor markets will remain as appealing for Mexicans as they were in 2000,
which clearly was not the case with the 2007 crisis. The fact that, even with CONAPO’s upward estimationbias, migration figures were underestimated in border towns strongly reinforces my hypothesis that other, non
economic variables are being factored when taking migration decisions.
7
(Morrison, 1993; Zolberg, Suhrke, & Aguayo, 1989). Most of these studies emphasizethe role of violence in generating unexpected migration outflows and refugees.
However, until now Mexican migration outflows had never been understood in theseterms, probably because prior to the current explosion of drug-related violence in Mex-ico, economic rather than political or social concerns drove most migration decisions(Massey et al., 2003; Massey & Espinosa, 1997; Papademetriou et al., 2011).
This article has provided evidence supporting the idea that gaining a more com-plete understanding of migration outflows within Mexico and between Mexico and theUnited States requires one to account for the literature on organized crime violence.Recent spikes in drug-related violence within Mexico have changed migration dynam-ics, adding a whole new dimension that considers well-being and security issues as afundamental part of migration decisions11.
Before the current article, the total number of Mexicans migrating as a result ofdrug-related criminal activities had not yet been scientifically counted. Some tentativefigures had been given of about 230,000 Mexicans moving out of violent cities, 115,000of them to relocate in the United States (IDMC, 2010). Yet many claim that thisnumber may be underestimated as it does not account for Mexicans who leave on atemporary basis, checking in at US hotels for short periods of time “to rest from theconstant violence” (Corchado, 2009). Other accounts claim 120,000 is the figure onlyfor Juarez (Alvarado, 2011). Overall, the accuracy of these figures remains doubtfulas none of these sources explain their methodology.
Based in my own estimates, I claim drug-related homicides from 2006 to 2010 yieldeda total displacement figure of 220,291 and extortion yielded 44,401 dis-placements, for atotal of 264,692 Mexican drug-violence refugees. This figure accounts for all relocationsboth within Mexico (from violent to nonviolent cities) and from Mexico to the UnitedStates. Some cities though, particularly the most violent ones, seem to carry mostof the burden. According to my estimates, Juarez alone has lost 40,993 drug-violencerefugees; about 15.48 percent of all displacements in Mexico happened in this city thathas just 1.26 percent of Mexico’s total population.
Table 3 presents my estimates of the number of drug-related refugees for the top tenmunicipalities with the largest number of refugees in real and per capita terms. Thecities with the largest burden during 2006-2010 are Juarez, Culiacan, and Tijuana with40.99, 12.4, and 11.37 thousand inhabitants respectively leaving unexpectedly (repre-senting 0.31, 0.16 and 0.8 per million of the total population of these cities, respec-tively). In relative terms, the cities with the largest drug-related migration outflows areGuadalupe, Mier, and General Trevino with 0.9 inhabitants per million leaving unex-pectedly because of security concerns. Figure 2 maps the distribution of drug-violencerefugees in Mexico.
[Table 3 about here.]
[Figure 2 about here.]
My estimate of 264,692 Mexican refugees of violence matches what ethnographic,journalistic, and public opinion accounts have been describing as a massive Mexicanexodus both within Mexico and from Mexico to the United States. Henry Cisneros, for-mer mayor of San Antonio, Texas, classified Mexican migration outflows as the “largestsince the 1920s” and acknowledged that “whole areas of San Antonio...are being trans-
11See Alvarado and Massey (2010) for a similar attempt using Latin American countries as the level of analysis,
and Lindley (2010) for a good literature review on the topic.
8

formed” (Sheridan, 2011). Within Mexico, recent opinion polls have shown that outof all people interviewed, 17 percent had changed residency because of drug-relatedviolence or to escape from criminal activities. This represents about 2 percent of thetotal migration outflows happening in the country, slightly above my own estimates12.
Perhaps the most telling case study of drug-violence migration outflows is that ofJuarez, Chihuahua, and its US counterpart El Paso, Texas. The impacts of Mexicanoutflows have been felt strongly in El Paso, where housing, schooling, business associ-ations, and many other spheres have changed significantly over the last two years toadapt to new migration patterns.
My results provide empirical evidence of the benefits that introducing variablesrelated to crime and to the behavior of nonstate actors bring to our under-standingof migration studies. Decisions to relocate cannot be grasped entirely by a focus ona monetary cost-benefit analysis or social capital. As I have shown, even the bestestimates predicting migration outflows are subject to important errors unless weintroduce as part of our independent variables information about the dynamics ofcrime and violence within territories. If CONAPO’s estimates were flawed in 2010, itwas because Mexican demographers understated the effect that these variables haveon migration dynamics.
I have also contributed to our understanding of puzzles long researched by conflictscholars. In particular, the Mexican case provides tangible evidence of the precise waysin which nonstate actors (i.e., organized crime) affect the decisions taken by citizensand other actors within the state. I have presented robust quantitative evidence toshow that violence generated by criminal organizations affects the location of humancapital within a polity. My numbers show that academics researching the civilianburden of conflict (Cullen & Levitt, 1999; Oliver & Shapiro, 2006; Wilson, 1997) wereright to assert that violence has many and quite nuanced effects that still need to bestudied, and that may benefit or hurt the state as a whole.
The influx of US immigrants generated by drug-related violence has had a posi-tive effect on real estate markets in Texas. Housing prices, particularly in El Paso,have remained steady even in the face of the recession, largely because of the influxof Mexicans buying properties (Rice, 2011). Completely new housing developmentshave started to pop up in McAllen and Brownsville, many of them specifically tar-geting Mexican markets, tastes, and needs. As a real estate developer in McAllenacknowledged, “The tendency is towards developing gated communities, close to bor-der bridges, with larger kitchens, and more rooms because our customers have largerfamilies and need to cross every day to Mexico to work”13.
Mexicans have moved not alone but with their businesses, especially when theirbusinesses were already targeted toward American consumers. Mexican restaurants,bars, and hair salons have closed their doors in Mexico and reopened in the UnitedStates. Relocating allows American clients who are increasingly fearful of crossinginto Mexico because of violence to maintain their regular spending habits and, mostimportant, allows Mexican businessmen to avoid paying extortion fees to traffickers.For example, it is estimated that as many as 700 businesses closed in Nuevo Laredo,Tamaulipas, in 2006 for this reason.14 Estimates for Juarez point to about 10,000businesses closed between 2007 and 2010 (Torres, 2011).
The exodus of businesses can be tracked to some extent by the number of US“investor’s visas” (E1-E2) given to Mexican citizens during the last years. While from
12Parametra, “Mexico y sus desplazados”, http://www.parametria.com.mx/carta parametrica.php?cp=4288.13In general, there is more inequality in US border cities and more gated, wealthy communities into whichMexican migrants like to settle with their accumulated wealth (Wong, Palloni, and Soldo 2007).
9

2001 to 2005 only 7,603 visas were granted, from 2006 to 2010 the number increasedto 31,066. Mexican businessmen have even started to organize them-selves into self-support clubs. In El Paso, for example, a club named “La Red” (The Network) providesnewcomers with advice on how to relocate their business successfully in the UnitedStates. As of 2011, La Red has almost 300 members, most of them enrolling justrecently (Perez and Chavez 2011).
The school system may also be changing in important ways. There is no way toofficially count the exact numbers of students transferring from Mexican schools to theEl Paso School District, but some numbers provide evidence of Mexicans increasinglystudying in the United States. The number of students enrolled in bilingual or limited-English-proficiency programs has increased by 1,330 students from 2007 to 2010, evenas the total number of students enrolled in the school district has dropped from 45,049in 2007 to 44,778 in 2010 (Martinez & Torres, 2011).
These new Mexican immigrants are not only changing US border cities but alsoMexican ones. The number of unoccupied dwellings in Mexican border cities is quitehigh and correlates strongly with rates of drug-related homicides. According to censusfigures, 26 percent of all dwellings in Juarez are unoccupied, 20 percent in Tijuana,and 19 percent in Mexicali. Other nonborder cities facing drug violence also havesignificantly low levels of occupancy: Chihuahua is 15 percent empty, and Monterrey,the second most important city in Mexico, faces the same situation with 11 percentof its houses vacant (Martnez, Alvarado, and Chvez 2011)14. Some claim that forcedmigration has affected smaller rural towns to the point of creating de facto ghosttowns. Teachers, doctors, policemen, and public servants have left their communitieswithout prior notice, fearing violence in communities of Tamaulipas, Michoacan, andChihuahua.
Ciudad Mier, a border county located south of Texas, is quite impressive in thisregard. My estimates account for a total displacement of about 431 individuals, a con-siderable number given that the city only counts 6,662 inhabitants. Most of the Miermigration happened in mid-2010 when Tony Tormenta, a Mexican drug trafficker,was assassinated15. Mier inhabitants, fearing violence and retaliation from Tony Tor-menta’s allies, left the city immediately, creating a true state of emergency. The exodusof at least a hundred families was so abrupt that Mexican authorities had to install arefugee camp in a neigh-boring community (Guzman, 2010). Refugee camps have alsobeen created in Michoacan in response to traffickers’ turf wars. In this southern Mex-ican state, forced unexpected migration has displaced at least 2.5 thousand Mexicansinto refugee camps16.
When picking a place to relocate to, Mexicans have favored cities with larger mar-kets and employment opportunities. Mexico City, for example, has become a quiteattractive place for relocation. In the past, few businessmen wanted to move to Mex-ico City because of bureaucracy, the high cost of real estate, and lack of bank financing.Nonetheless, in 2010, about 6,500 businesses relocated to Mexico City from other states(MEPI & ITESM, 2011).
14A poll conducted at Juarez showed that only 6.95 percent of all dwellings were empty, totaling about 32,858thousand residencies (Velazquez Vargas et al. 2010).15Alfredo Corchado, chief of Dallas Morning Bureau at Mexico City, interviewed in June 2010 at Mexico City,DF, Mexico.16Indeed, migration is not restricted to border communities but has also affected other highly vio-lent countieswithin the country. Journalistic accounts have identified at least seventy counties where drug-related violencehas had important consequences for migration outflows, particularly in the Mexi-can states of Chihuahua,
Guerrero, Durango, Michoacan, Nuevo Leon, San Luis Potosı, Sinaloa, Sonora, and Tamaulipas (Zermeno2011).
10

7. Conclusion
Mexican immigration is changing in fascinating ways. Immigration figures have reachedtheir lowest point since 2000. Better socioeconomic conditions in Mexico and economichardship in the United States are among the main causes behind this trend. Yet evenif as a whole the United States is receiving fewer Mexican migrants, the opposite istrue for cities located at the border.
In this article I have presented the first quantitative evidence available to show thatthe reason behind this migration pattern is not to be found in traditional explanationsof migration dynamics. Mexicans are not crossing into the United States to get better-paid jobs or to run away from economic hardship; at least this is not the only reason.Instead, I argue that Mexicans are migrating out of fear of drug-related violence andextortion. This is particularly true in border counties, where Mexican drug-traffickingorganizations have caused large increases in homicide rates and where migration tothe United States entails relatively low costs.
Even when we control for variables fostering migration (i.e., employment, educa-tion, and economic conditions in both countries), drug-related violence and extortioncorrelate with migration figures. Each one-point increase in the rate of drug-relatedhomicides per 100,000 inhabitants correlates with 6.34 Mexicans fleeing their countyof residency, and every case of extortion per 100,000 correlates with 13.03. Thesetwo forms of criminal violence account for a total of 264,692 Mexicans changing theircounty of residence as an unexpected consequence of Mexico’s drug war.
The only way to stop the growth of migration outflows at the border is to in-creasesafety within Mexican cities. A recent study measuring Juarez citizens’ opinion withrespect to moving away for security reasons found that 55 percent of the populationwould leave the city if they had the opportunity to do so (Torres, 2011). It is time forpolicy makers to realize that migration won’t stop unless drug-related violence doesfirst.
References
Alvarado, R. (2011, June 31). Juarez demographer says 30,000 to 50,000 persons fled juarezto the u.s. as a result of drug-war violence since 2008. Mexodus.
Bean, F., Corona, R., Tuiran, R., Woodrow-Lafield, K., & Van Hook, J. (2001). Circular,invisible, and ambiguous migrants: Components of difference in estimates of the number ofunauthorized mexican migrants in the united states. Demography , 38 (3), 411–422.
Castillo, J. C., Mejıa, D., & Restrepo, P. (2014). Scarcity without leviathan: The violent effectsof cocaine supply shortages in the Mexican drug war. (Working paper)
Corchado, A. (2009, January 12). Effects of Mexico’s drug war hit el paso. Dallas MorningNews.
Cornelius, W., & Lewis, J. (2007). Impacts of border enforcement on mexican migration: Theview from sending communities. Center for Comparative Immigration Studies La Jolla.
Coscia, M., & Rios, V. (2012). Knowing where and how criminal organizations operate usingweb content. In Proceedings of the 21st acm international conference on information andknowledge management (pp. 1412–1421).
Cullen, J., & Levitt, S. (1999). Crime, urban flight, and the consequences for cities. Reviewof economics and statistics, 81 (2), 159–169.
Dell, M. (2011). Trafficking networks and the mexican drug war. In The annual east asiannber conference.
Diaz-Cayeros, A., Magaloni, B., Matanock, A., & Romero, V. (2011). Living in fear: So-
11

cial penetration of criminal organizations in mexico. Unpublished paper. Retrieved fromhttp://irps. ucsd. edu/assets/001/502967. pdf. Retrieved April , 14 , 2014.
Freeman, L. (2006). State of siege: drug-related violence and corruption in Mexico. unintendedconsequences of the war on drugs. Washington Office on Latin America.
Guzman, M. (2010, November 9). Familias huyen tras muerte de tony tormenta. Retrievedfrom http://www.eluniversal.com.mx/notas/722186.html
Ibarraran, P., & Lubotsky, D. (2007). Mexican immigration and self-selection: New evidencefrom the 2000 mexican census. In Mexican immigration to the united states (pp. 159–192).
IDMC. (2010, December). Internal displacement monitoring center’s briefing paper.INEGI. (2005). Conteo nacional de poblacion y vivienda.INEGI. (2010). Censo nacional de poblacion y vivienda.INEGI. (2011). Estadısticas judiciales en materia penal (1997-2011).Martinez, A., & Torres, M. (2011, August 26). El paso school districts have no idea how many
new students fled juarez. Borderzine. Retrieved from http://borderzine.com/2011/08/
el-paso-school-districts-have-no-idea-how-many-new-students-fled-juarez/
Massey, D. (1990). Social structure, household strategies, and the cumulative causation ofmigration. Population index , 3–26.
Massey, D., & Arango, J. (1998). Worlds in motion. understanding international migrationat the end of the milenium. Clarendon Press: Oxford.
Massey, D., Durand, J., & Malone, N. (2003). Beyond smoke and mirrors: Mexican immigrationin an era of economic integration. Russell Sage Foundation Publications.
Massey, D., & Espinosa, K. (1997). What’s driving Mexico-us migration? a theoretical,empirical, and policy analysis. American journal of sociology , 939–999.
Massey, D., & Taylor, J. (2004). Back to the future: Immigration research, immigrationpolicy, and globalization in the twenty-first century. International Migration. Prospects andPolicies in a Global Market , 373–388.
MEPI, & ITESM. (2011, June 31). Relocate or die: Mexican entrepreneurs migrate to theinterior fleeing violence, insecurity. Retrieved from http://mexodus.borderzine.com/
business/relocate-or-die-mexican-entrepreneurs-migrate-to-the-interior
-fleeing-violence-insecurity/
MMP. (2009). Selected results better lives for mexicans cut allure of going north. Retrievedfrom http://mmp.opr.princeton.edu/results/results-en.aspx
Morrison, A. (1993). Violence or economics: what drives internal migration in guatemala?Economic Development and Cultural Change, 41 (4), 817–831.
Oliver, M., & Shapiro, T. (2006). Black wealth, white wealth: A new perspective on racialinequality. CRC Press.
Orrenius, P. (2004). Crossing the border: Research from the mexican migration project. InJ. Durand & D. S. Massey (Eds.), (chap. The Effects of U.S. Border Enforcement on theCrossing Behavior of Mexican Migrants). Russell Sage Foundation.
Orrenius, P., & Zavodny, M. (2005). Self-selection among undocumented immigrants fromMexico. Journal of Development Economics, 78 (1), 215–240.
Papademetriou, D., Sumption, M., & Terrazas, A. (2011). Migration and the great reces-sion: The transatlantic experience. Woodrow Wilson International Center for Scholars andMigration Policy Institute.
Partida Bush, V. (2008). Proyecciones de la poblacion de Mexico, de las entidades federativas,de los municipios y de las localidades 2005-2050. documento metodologico.
Piore, M. (1979). Birds of passage: Migrant workers and industrial society. Nova Iorque:Cambridge University Press.
Rice, A. (2011, July 28). Life on the line. Retrieved from http://www.nytimes.com/2011/
07/31/magazine/life-on-the-line-between-el-paso-and-juarez.html?pagewanted=
all
Rios, V. (2013). Who started Mexico’s drug war? The Harvard Kennedy Review .Rios, V., & Shirk, D. (2011). Drug violence in Mexico: Data and analysis through 2010.
Trans-Border Institute.
12
Sheridan, M. (2011). Drug war sparks exodus of affluent mexicans. The Washington Post , 23 ,2012. Retrieved from http://www.washingtonpost.com/world/nationalsecurity/drug
-war-sparks-exodus-of-affluentmexicans/2011/08/19/gIQA6OR1gJ story.html
Terrazas, A., Papademetriou, D., & Rosenblum, M. (2011). Evolving demographic and human-capital trends in Mexico and central america and their implications for regional migra-tion. Washington, DC: Migration Policy Institute. www. migrationpolicy. org/pubs/RMSG-human-capital. pdf.
Todaro, M., & Maruszko, L. (1987). Illegal migration and us immigration reform: A conceptualframework. Population and development review , 101–114.
Torres, M. (2011, June 31). Business ee juarez as customers stop knocking. Re-trieved from http://mexodus.borderzine.com/business/businesses-flee-juarez-as
-customers-stop-knocking/
Tuiran, R., Partida, V., & Avila, J. (2000a). Migracion mexico-estados unidos. presente yfuturo. In R. Tuiran (Ed.), (p. 29-33).
Tuiran, R., Partida, V., & Avila, J. (2000b). Migracion Mexico-estados unidos. presente yfuturo. In R. Tuiran (Ed.), (p. 53-75).
Wilson, W. (1997, July 29). When work disappears: The world of the new urban poor.Zolberg, A., Suhrke, A., & Aguayo, S. (1989). Escape from violence: Conflict and the refugee
crisis in the developing world. Oxford University Press, USA.
13

List of Tables
1 Descriptive statistics . . . . . . . . . . . . . . . . . . . . . . . . . . . . 152 Empirical results: Drug-related crime and immigration outflows. . . . 163 The top ten municipalities with the largest number of drug-related
refugees, and the top ten municipalities with the largest number ofdrug-related refugees per million inhabitants. . . . . . . . . . . . . . . 17
14

Table 1. Descriptive statistics
Variables Minimum Standard Dev. Mean Max
Unexpected outflows 0 3543.05 1217 62149Drug-related homicides 0 95.32 29.08 1552.25Extortion 0 1.234 0.116 36.64Kidnapping 0 1.645 0.175 34.18Employment 1604 23415.41 67030 658998College degrees 0 3725.82 3581.27 36643.32General homicides 102 126578.1 42079.62 1820888Previous estimation error 20,760.00 1526.76 -1560 4928
Note: All figures were standardized as rates per 100,000 inhabitants at the municipallevel. The level of analysis is the municipality. Unexpected outflows are the numberresidents (per 100,000 inhabitants) of a municipality that Mexican population officespredicted would live in a community and yet census authorities failed to capture.
15
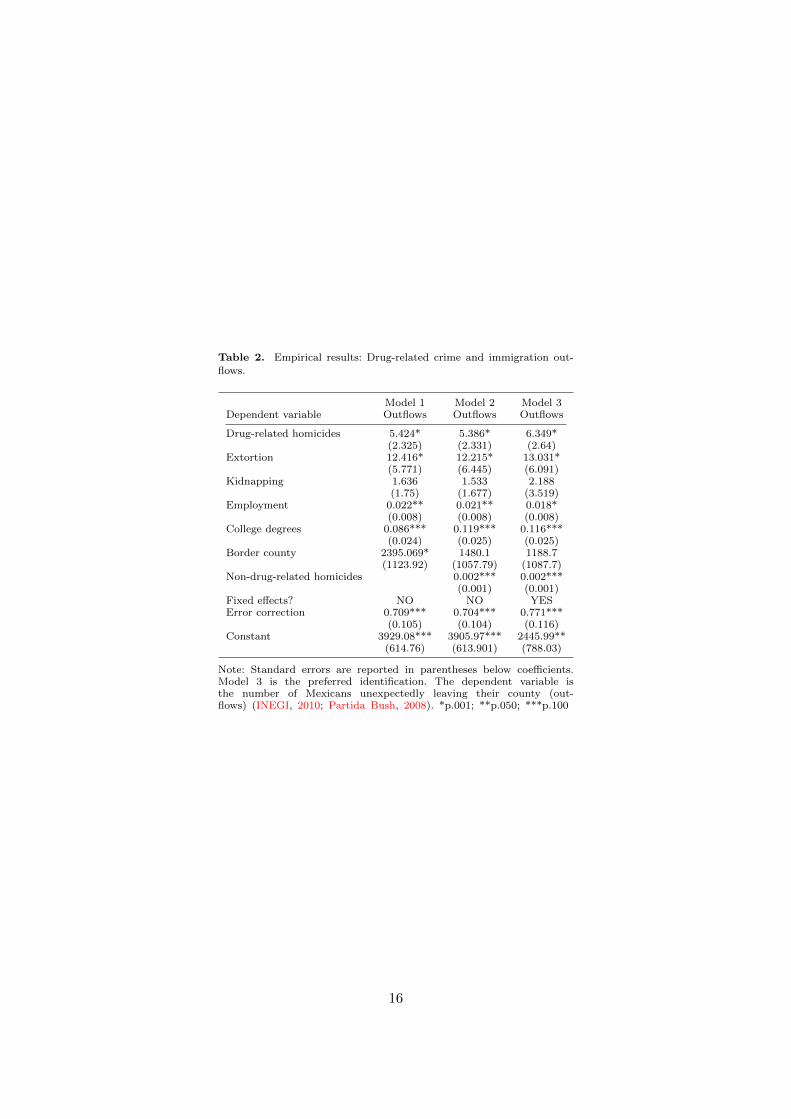
Table 2. Empirical results: Drug-related crime and immigration out-
flows.
Model 1 Model 2 Model 3Dependent variable Outflows Outflows Outflows
Drug-related homicides 5.424* 5.386* 6.349*(2.325) (2.331) (2.64)
Extortion 12.416* 12.215* 13.031*(5.771) (6.445) (6.091)
Kidnapping 1.636 1.533 2.188(1.75) (1.677) (3.519)
Employment 0.022** 0.021** 0.018*(0.008) (0.008) (0.008)
College degrees 0.086*** 0.119*** 0.116***(0.024) (0.025) (0.025)
Border county 2395.069* 1480.1 1188.7(1123.92) (1057.79) (1087.7)
Non-drug-related homicides 0.002*** 0.002***(0.001) (0.001)
Fixed effects? NO NO YESError correction 0.709*** 0.704*** 0.771***
(0.105) (0.104) (0.116)Constant 3929.08*** 3905.97*** 2445.99**
(614.76) (613.901) (788.03)
Note: Standard errors are reported in parentheses below coefficients.Model 3 is the preferred identification. The dependent variable isthe number of Mexicans unexpectedly leaving their county (out-flows) (INEGI, 2010; Partida Bush, 2008). *p.001; **p.050; ***p.100
16

Table 3. The top ten municipalities with the largest number of drug-
related refugees, and the top ten municipalities with the largest number
of drug-related refugees per million inhabitants.
Municipality Refugees Refugees per million inhabitants
Juarez 40994 0.31Culiacan 12407 0.16Tijuana 11372 0.08Chihuahua 9024 0.12Acapulco 4785 0.07Torreon 3798 0.07Guadalajara 3720 0.02Gomez Palacio 3533 0.12Mazatlan 3477 0.09Nogales 3001 0.16
Guadalupe 924 0.99Mier 622 0.93General Trevino 137 0.9Saric 211 0.84Guerrero 301 0.76Matamoros 258 0.59Doctor Coss 101 0.58Arizpe 171 0.56Guelatao de Juarez 29 0.55Praxedis G. Guerrero 459 0.53
17

List of Figures
1 Errors in official population predictions from 2005 to 2010. . . . . . . 192 Geographic distribution of drug-violence refugees. . . . . . . . . . . . . 20
18

Figure 1. Errors in official population predictions from 2005 to 2010.
Each point represents one of the 2,450 Mexican municipalities. The y axis measures the population (per
100,000 county inhabitants) that was incorrectly predicted from 2005 to 2010; the x axis does the same for theperiod 2000-2050. Positive [negative] numbers refer to municipalities where predictions calculated more [less]
population than actual.
19

Figure 2. Geographic distribution of drug-violence refugees.
This map shows the number of drug-violence refugees per municipality predicted by this paper. A darker area
means more refugees. The four different shades were selected according to the distribution of refugees in fourquartiles (1-12, 13-39, 40-141, and 141 and up).
20