Embed Size (px)
Citation preview

The Role of Colony Size on Tunnel BranchingMorphogenesis in Ant NestsJacques Gautrais1,2*, Jerome Buhl3, Sergi Valverde4,5, Pascale Kuntz6, Guy Theraulaz1,2
1 Centre de Recherches sur la Cognition Animale, Universite de Toulouse, Toulouse, France, 2 Centre de Recherches sur la Cognition Animale, Centre National de la
Recherche Scientifique UMR5169, Toulouse, France, 3 School of Agriculture, Food and Wine, The University of Adelaide, Adelaide, Australia, 4 Complex Systems Laboratory
(ICREA-UPF), Barcelona, Spain, 5 Institut de Biologia Evolutiva (CSIC-UPF), Barcelona, Spain, 6 Laboratoire d’Informatique de Nantes-Atlantique, Polytech’Nantes, Nantes,
France
Abstract
Many ant species excavate nests that are made up of chambers and interconnecting tunnels. There is a general trend of anincrease in nest complexity with increasing population size. This complexity reflects a higher ramification and anastomosisof tunnels that can be estimated by the meshedness coefficient of the tunnelling networks. It has long been observed thatmeshedness increases with colony size within and across species, but no explanation has been provided so far. Since colonysize is a strong factor controlling collective digging, a high value of the meshedness could simply be a side effect of a largernumber of workers. To test this hypothesis, we study the digging dynamics in different group size of ants Messor sancta. Webuild a model of collective digging that is calibrated from the experimental data. Model’s predictions successfully reproducethe topological properties of tunnelling networks observed in experiments, including the increase of the meshedness withgroup size. We then use the model to investigate situations in which collective digging progresses outward from a centrecorresponding to the way tunnelling behaviour occurs in field conditions. Our model predicts that, when all otherparameters are kept constant, an increase of the number of workers leads to a higher value of the meshedness and atransition from tree-like structures to highly meshed networks. Therefore we conclude that colony size is a key factordetermining tunnelling network complexity in ant colonies.
Citation: Gautrais J, Buhl J, Valverde S, Kuntz P, Theraulaz G (2014) The Role of Colony Size on Tunnel Branching Morphogenesis in Ant Nests. PLoS ONE 9(10):e109436. doi:10.1371/journal.pone.0109436
Editor: Judith Korb, University of Freiburg, Germany
Received March 10, 2014; Accepted September 10, 2014; Published October 15, 2014
Copyright: � 2014 Gautrais et al. This is an open-access article distributed under the terms of the Creative Commons Attribution License, which permitsunrestricted use, distribution, and reproduction in any medium, provided the original author and source are credited.
Data Availability: The authors confirm that all data underlying the findings are fully available without restriction. All relevant data are available in Supporting
Funding: This study was supported by grants from the Ministry of Higher Education and Research of France (Programme Cognitique) and MESOMORPH projectgrant ANR-06-BYOS-0008. Jerome Buhl was supported by grants from the Australian Research Council. The funders had no role in study design, data collectionand analysis, decision to publish, or preparation of the manuscript.
Competing Interests: The authors have declared that no competing interests exist.
* Email: [email protected]
Introduction
Most species of ants excavate their nest and form a subterranean
network of tunnels that connect several chambers [1,2,3,4,5,6,7].
These chambers are ellipsoidal cavities used to raise brood, store
seeds, grow fungus or accumulate litter and corpses. Sometimes
they may also be used as resting places in which dense
aggregations of workers can be found. The tunnels ensure the
connection of the underground parts of the nest to the soil surface.
Previous field studies [8,9,10] and controlled laboratory experi-
ments [6,11,12,13,14] have shown that nest size was proportional
to the size of a colony in several species of ants. In addition to the
adjustment of nest volume, the variations of ant nest architecture
with colony size result in a different number of chambers and
tunnels. The simplest nests are made up of a few chambers stacked
along a single vertical tunnel, whereas dense networks of tunnels
with a large number of interconnected chambers are found in the
most complex nests. So far no correlation has been established
between the observed variations in the complexity of nest
architecture and phylogeny [15,16,17]. In most ant genera, nests
are subterranean excavated networks, but within each particular
genus, there exists a large variability of nest size and complexity.
As a general trend, however, nest complexity increases with colony
size [8,13,18,19] (see Table 1).
Quantitative descriptions of nests dug in natural conditions are
difficult to obtain. Structural features of a hypogeous nest can be
quantified with plaster or aluminium casts at a given moment of
colony life [20,21,22]. However these methods cannot be used to
follow the development of the nest structure over time. Hence we
investigated the dynamics of collective digging in controlled
laboratory conditions, allowing groups of ants to dig into
horizontal moistened and homogeneous disks made of sand. We
previously characterized the topological structure of the networks
built by three group sizes (50, 100 and 200 workers) [11]. In a
subsequent paper, we analyzed the tunneling dynamics using the
dataset obtained with 200 workers and formulated a model for the
network growth in which the tunnels were the basic units, focusing
on their birth, growth and the intersection events between tunnels
[23]. We then suggested that a next step should be a sensitivity
analysis of the network topology to the model parameters.
However, preliminary numerical explorations showed that the
number of workers might be worth further investigation. Here to
PLOS ONE | www.plosone.org 1 October 2014 | Volume 9 | Issue 10 | e109436
Information files.
investigate the impact of this parameter on the resulting network
structure, we use the dataset obtained with the three group sizes
and we introduce a new model that incorporates explicitly the ants
digging activity level. We test the predictive power of the model for
the networks meshedness with 50, 100 and 200 ants respectively.
We then explore the predictions of the model over a large range of
colony sizes in which collective digging progresses outward from a
centre. In these conditions, the model predicts that the meshedness
rapidly increases with the number of workers and then reaches a
plateau at a critical size. We conclude that an increase of the
number of workers is a sufficient condition to induce a transition
from tree-like to highly branched and meshed structures.
Methods
Ethics statementColonies of ants Messor sancta were collected in southwestern
France (Narbonne), on a private property with the permission of
the owner. Messor sancta is not a protected nor endangered
species. Our experiments complied with the laws and ethical
recommendations currently in effect in France where the
experiments were performed.
Experimental setup and data collectionLet us briefly recall the main features of the experiments
described in [11]. We recorded and quantified the digging activity
of groups of Messor sancta ants in a two dimensional and uniform
environment. The general experimental set-up consisted of a disk
of sand (radius r~100 mm, height h~5 mm). We used fine yellow
homogeneous sand which was poured into a mould and
humidified by spraying with water (25 ml). The mould was then
removed and the disk of sand covered by a glass plate
(25 cm625 cm). To prevent ants from escaping, an arena
(diameter 50 cm) with a wall coated with Fluon GP2s was placed
around the disk. With this set-up lit 24 hours a day, ants’ digging
activity was strongly stimulated and workers dug 2D tunnel
networks in the sand within three days (fig. 1, movie S1). We
recorded the digging dynamics with three different group sizes of
workers: 50 (n = 5), 100 (n = 5) and 200 (n = 18), for three days
(T = 4320 minutes) with a high-resolution digital camera (SONY
DCR-VX1000E). Snapshots of the evolution of the network were
taken every 20 minutes with a total of 217 snapshots per
experiment. The width and position of tunnels and nodes were
recorded. We also took into consideration the way nodes have
been created either initiated from the periphery of the sand disk,
from an existing tunnel or from the collision between two existing
tunnels. These data are available as Data S1.
Model of collective diggingIn the model, ants dig into a 2-D plane sand disk of radius r, starting
from the periphery and progressing toward the centre. As time goes
on, existing tunnels extend in a straight line with active fronts at their
end. New tunnels are dug either from the border of the sand disk or
from the sides of an existing tunnel. In the latter case, this results in a
branching structure. The width of tunnels is set to a constant value g.
When an active front collides with another tunnel, a node is created at
the collision point, with a circular surface of diameter g: sg~P g=2� �2
.
When it collides with a node, the surface of the existing node is
increased by sg (following [23], see fig. 6b therein).
The rate at which the network structure changes ( ,10{4 cm/s
[23]) is much slower than the rate at which the ants move inside
the network ( ,1:5 cm/s [24]). Hence, the diffusion of ants within
the network occurs at a much faster time scale than the growth
rate of the network. As a consequence, there is no benefit to model
each ant’s individual position and trajectories explicitly because
ants are statistically likely to make digging decisions on a large
sampling of the whole network. Instead, we can derive analytical
descriptions for the dynamics of the network components (i.e. the
number of nodes and the length of tunnels) by integrating ant
activity over time, with no explicit rendering of individual digging
activity. Ants are then considered as a global work force uniformly
distributed all over the network at any given time. This abstracted
representation of the spatial distribution of ants is also relevant
because there is no interaction between the individuals in the
model (e.g. no trail following).
Initially, the entire population of ants is active and set to
A(t~0) individuals. This pool decreases with time at a constant
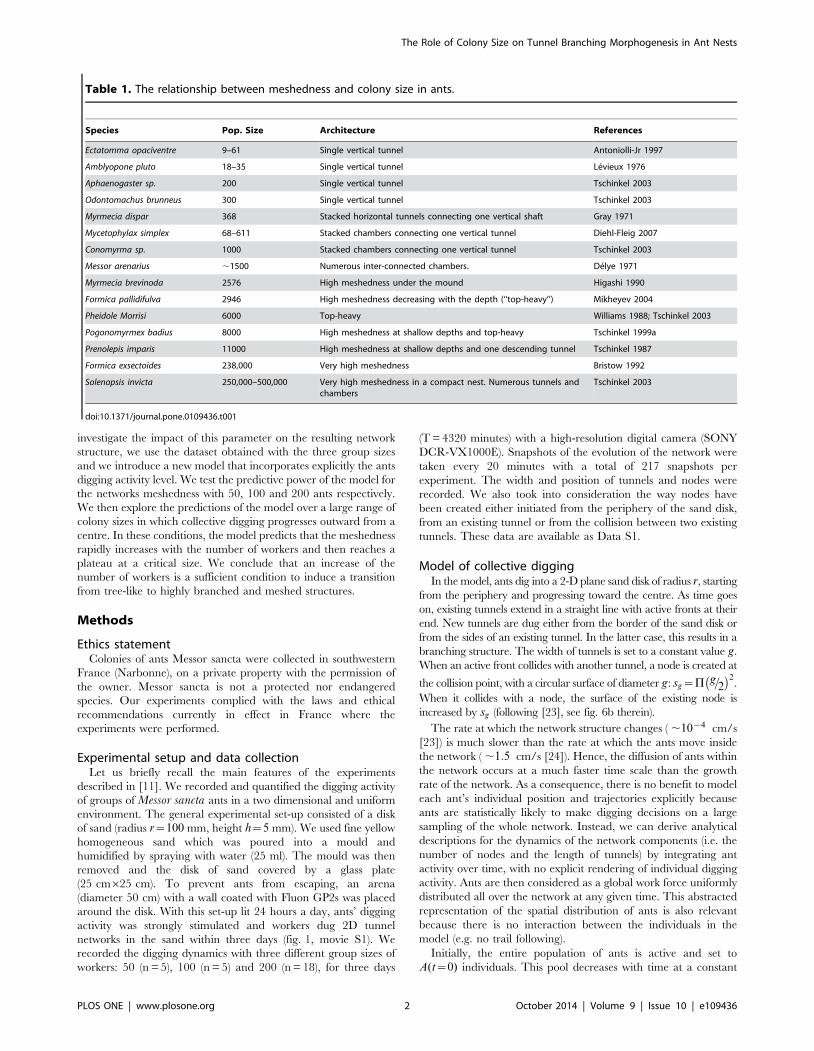
Table 1. The relationship between meshedness and colony size in ants.
Species Pop. Size Architecture References
Ectatomma opaciventre 9–61 Single vertical tunnel Antoniolli-Jr 1997
Amblyopone pluto 18–35 Single vertical tunnel Levieux 1976
Aphaenogaster sp. 200 Single vertical tunnel Tschinkel 2003
Odontomachus brunneus 300 Single vertical tunnel Tschinkel 2003
Myrmecia dispar 368 Stacked horizontal tunnels connecting one vertical shaft Gray 1971
Mycetophylax simplex 68–611 Stacked chambers connecting one vertical tunnel Diehl-Fleig 2007
Conomyrma sp. 1000 Stacked chambers connecting one vertical tunnel Tschinkel 2003
Messor arenarius ,1500 Numerous inter-connected chambers. Delye 1971
Myrmecia brevinoda 2576 High meshedness under the mound Higashi 1990
Formica pallidifulva 2946 High meshedness decreasing with the depth (‘‘top-heavy’’) Mikheyev 2004
Pheidole Morrisi 6000 Top-heavy Williams 1988; Tschinkel 2003
Pogonomyrmex badius 8000 High meshedness at shallow depths and top-heavy Tschinkel 1999a
Prenolepis imparis 11000 High meshedness at shallow depths and one descending tunnel Tschinkel 1987
Formica exsectoides 238,000 Very high meshedness Bristow 1992
Solenopsis invicta 250,000–500,000 Very high meshedness in a compact nest. Numerous tunnels andchambers
Tschinkel 2003
doi:10.1371/journal.pone.0109436.t001
The Role of Colony Size on Tunnel Branching Morphogenesis in Ant Nests
PLOS ONE | www.plosone.org 2 October 2014 | Volume 9 | Issue 10 | e109436

rate j (ant.min21) so that the number of digging ants at time t is:
A(t)~A(0)e{jt ð1Þ
A small amount of time Dt is required for an ant to dig a small
length of gallery Dl~wDt (with w in mm.ant21. min21). At time t,
the resulting dug length is then:
D(t)~
ðt
0
A(u)w du
~
ðt
0
A(0)e{juw du
~wA(0)
j1{e{jt� �
ð2Þ
The total work force at time t, A(0)e{jtw, is equally shared on
each progressing front. Ants not only increase the length of
existing tunnels; they may also start new tunnels. First, they may
start a new digging front on the border of the sand disk at a
constant rate gP (expressed in ant21.min21.mm21). This creates a
peripheral node whose size is set to g. The new digging sites can
only be created along the unaltered portion P(t) of the periphery
(i.e. the perimeter which is not already occupied by nodes), and
this portion decreases as the number of peripheral nodes increases.
The direction of a new tunnel is perpendicular to the tangent of
the sand disk with a Gaussian noise of standard deviation s. At
time t, the resulting number of peripheral nodes is:
P(t)~
ðt
0
gpA(u)P(u)du
~gpA(0)
ðt
0
P(u)e{judu
ð3Þ
Ants may also start to dig a new internal front at a constant rate
gL thus creating a new branch in the network. This new tunnel
can be dug either along the wall of an existing tunnel with a
probability b, or from an existing node with a probability 1{b. In
the first case, the digging site is randomly and uniformly chosen
along the existing tunnels, a lateral node is created at that place,
and the new lateral front progresses at right angle to the
originating tunnel, with a Gaussian noise of standard deviation
s. In the second case, the node is uniformly chosen among the
internal nodes, and the orientation of the new tunnel is uniformly
distributed.
Since lateral fronts can only emerge along the walls of existing
tunnels whose total length D(t) increases with time, gL is expressed
in ant21.min21.mm21. At time t, the resulting number of lateral
nodes is then:
L(t)~
ðt
0
bgLA(u)D(u)du
~bgLA(0)
ðt
0
D(u)e{judu
ð4Þ
The parameters of the model are: the number of ants A, the
radius of the sand disk r, the total time T , the geometrical
parameters g,b,sð Þ and the behavioural parameters w,j,gL,gPð Þ(Table 2).
Estimation of model parametersA total of 18 experiments, all performed in the same conditions,
with A(0) = 200 ants were used to estimate the model parameters.
To compensate for delays in the initial phase (ants do not start
digging into the sand disk with the same latency after their
introduction in the setup), the initial time t~0 of each experiment
was set when D(t)~100 mm, which represents about 5% of the
final length. The geometrical parameters of galleries and nodes
appeared to be rather homogeneous across the networks and time,
so they were estimated by averaging the values got over the
dataset. In contrast, the evolution of the topology (new peripheral
nodes, branching or collision, elongation) appeared to obey a non-
linear stochastic process, responsible to the high variability
observed in the growth dynamics of the networks (Fig 2a, S1).
Since the stochastic events involved in the growth dynamics
depend at any time on the state of the network, each experiment
Figure 1. Typical evolution of a tunnelling network dug byA(0) = 200 ants, at 5, 9 and 72 hours after T0. The outer circlerepresents the periphery of the sand disk (radius r~100 mm). Plaindisks represent chambers, and lines represent tunnels. Open disksdenote active fronts (F), progressing from a peripheral node (P), from anexisting gallery (L1) or from an existing node (L2).doi:10.1371/journal.pone.0109436.g001
The Role of Colony Size on Tunnel Branching Morphogenesis in Ant Nests
PLOS ONE | www.plosone.org 3 October 2014 | Volume 9 | Issue 10 | e109436

has a particular history, meaning that the development of each
particular network is following one stochastic path within the space
of all possible networks. Therefore in first step, we estimated the
behavioural parameters w,j,gL,gPð Þ separately for each experi-
ment (one set of parameters per experiment). To check that the
procedure for estimating these parameters was efficient, we then
tested the model predictions for each case (fig. 3). Then, in a
second step, we tested the predictive power of the model despite
this variability.
Parameters of network components. The estimation of
the standard deviation of the orientation of new tunnels, the mean
width of tunnels and the probability of branching from tunnels or
nodes, were computed from all experimental data. We found
respectively s~8:44 deg, g~10:361 mm and b~0:6887 [23].
Ants activity. We used the temporal evolution of the
networks to estimate the behavioural parameters. Ant activity
parameters, w and j, were estimated from the length of tunnels
dug by ants D(t) over the 217 observed snapshots. The evolution
of D(t) with time is not strictly monotonous, because two nodes
close to each other can merge when they are both hit by a
progressing front. D(t) was thus recovered by cumulating the
differences of the observed length dug between successive
snapshots when positive, yielding DD(iDt),i~1,::,217.
In a first step, we obtained a rough estimation of w from the
initial slope of DD(t) during the first 1000 minutes by:
~ww&1
A(0)
DD(1000){DD(0)
1000ð5Þ
and j was estimated at the end of the experiment by numerically
solving for the root of the implicit equation:
e{jTzDD(T)
~wwA(0)j{1~0 ð6Þ
In a second step, these approximate values were refined jointly
by a Nelder-Mead minimization of the prediction error, computed
as the sum of the squared differences between the 217 observed
and predicted values (Least-square estimates).
Over the 18 experiments, we found w~4:97+2:5 10{3
mm.ant21.min21 (mean6SD) and j~5:63+2:9 10-4 ant.min21
(mean6SD). The parameter values for each experiment yield
accurate predictions of the growth dynamics and the length of
tunnels (fig. 2a and S1). This agreement between the model and
observations strongly supports the hypothesis that ants’ activity
decays with time.
Peripheral nodes formation rate. In the model we assume
that the number of peripheral nodes P(t) is given by (3), and
depends on the integral over time of the length of unaltered
periphery P(t). P(t) can be written as follows:
P(t)~gPA(0)
ðt
0
P(u)e{judu
^gPA(0)X
ie{jiDtPP(iDt)Dt
~gPI(t)
ð7Þ
with I(t)~A(0)P
i e{jiDtPP(iDt)Dt where PP(iDt) corresponds to
the unaltered portion of the periphery, that is the length of disk
perimeter minus the length occupied by existing peripheral nodes
at times iDt with i = 1,…217. The rate gP was then estimated with
a linear regression of P(t) on I(t). Over the 18 experiments, we
found gP~1:46+1:17 10{7 ant21.min21.mm21 (mean6SD).
The compelling linearity of the correlation for each experiment
(fig. 2b and S2, R2~0:92+0:04) strongly supports the assumption
that gP remains constant over time.
Lateral nodes formation rate. In the model we assume that
the number of lateral nodes L(t) is given by (4), and depends on
the cumulated length of the network over time. L(t) can be written
as follows:
L(t)~gLbA(0)
ðt
0
D(u)e{judu
^gLbA(0)X
iDD(iDt)e{jiDtDt
~gLJ(t)
ð8Þ
with J(t)~bA(0)P
i DD(iDt)e{jiDtDt and gL was estimated with a
linear regression of L(t) on J(t). We found gL~1:14+0:6 10{7 ant21.min21.mm21 (mean6SD). Here again, the high
linearity of the correlation for each experiment (fig. 2c and S3,
R2~0:93+0:06) strongly supports the assumption that the
formation rate of lateral nodes remains constant over time.
Table 2. Parameters of the model.
Parameter Symbol Units
Number of ants A ants
Radius of the sand disk r mm
Total duration of the digging activity T min
Noise in the orientation of new tunnels s degree
Probability that a new internal gallery starts from a node rather than from the edge of a gallery b
Tunnel width g mm
Individual digging rate w mm.ant21. min21
Inactivation rate j ant.min21
Initiation rate of new tunnels from the periphery gP ant21.min21.mm21
Initiation rate of new tunnels from existing tunnels or nodes gL ant21.min21.mm21
doi:10.1371/journal.pone.0109436.t002
The Role of Colony Size on Tunnel Branching Morphogenesis in Ant Nests
PLOS ONE | www.plosone.org 4 October 2014 | Volume 9 | Issue 10 | e109436

The similarity, despite independent quantifications, of lateral
and peripheral nodes formation rates gL and gP (fig. 2d) suggests
that ants do not exhibit different behaviours when they start to dig
a new tunnel from the periphery or from an existing tunnel inside
the sand disk. This result also supports our choice to quantify the
ants’ propensity to dig a new tunnel with a probability per ant per
minute as a function of the length of available walls (i.e. the sum of
the unaffected part of the periphery for gP and the length of
tunnels for gL).
Quantification of networks propertiesThe result of the digging dynamics is a 2-D network that grows
over time. We characterized this network with five graph-related
measures: (i) the total length D(t), (ii) the total number of nodes
N(t), (iii) the number of edges (i.e. the subsections of tunnels
connecting two nodes) G(t), (iv) the average node degree K(t) (i.e.
the average number of tunnels per node) and (v) the meshedness
coefficient M(t).
The meshedness coefficient M(t) was introduced by Buhl et al.
[25] to measure the structure of cycles in planar graphs and it is
calculated the following way:
Figure 2. Quantification of the parameters of the digging dynamics from experimental data with A(0) = 200 workers. (a) Ant activityparameters (w and j) are retrieved from the evolution of the dug length D(t): three typical experimental cases are shown as solid lines and theircorresponding predictions by the model as dashed lines (see also fig. S1 for all experimental results). (b, c) The rates of initiation of new peripheralnodes gP and of new lateral nodes gL are retrieved respectively from (b) the regression slope of the number of peripheral nodes P(t) as a function of
I(t)~A(0)P
i e{jiDtP(iDt)Dt and (c) the number of lateral nodes L(t) as a function of J(t)~P Ag (0)P
i e{jiDtDD(iDt)Dt (each symbols corresponds toeach of the three experiments shown in (a)). Regressions for all cases can be found in fig. S2 and S3. (d) The rates of initiation of new lateral gL andperipheral gP nodes converge to a common value (one symbol per experiment, dashed line: y~x).doi:10.1371/journal.pone.0109436.g002
The Role of Colony Size on Tunnel Branching Morphogenesis in Ant Nests
PLOS ONE | www.plosone.org 5 October 2014 | Volume 9 | Issue 10 | e109436

M(t)~GANT (t){GMST (t)
GGT (t){GMST (t)
~G(t){(N(t){1)
2N(t){5
ð9Þ
It is the number of tunnels GANT (t) in the observed network,
scaled within two extreme values that correspond respectively to a
minimal spanning tree (MST, for which G~N{1) and a
triangulated graph (GT, for which G~3N{6, following Euler’s
polyhedra formula). M(t) is a structural property of the network
which indicates the density of edges regardless of the number of
nodes. M(t) varies from 0 in tree-like networks to 1 in triangulated
networks (maximally connected planar graph). The predictions of
the model were compared with the networks quantities N, G, K
and M estimated from the experiments.
Results
Structural properties of networks at the end ofexperiments
When the experiments ended, the average length of the
networks was DD(T)~1534+480 mm (corresponding to an
average length of tunnel dug per ant d~8:09+2:72 mm.ant21),
the average number of tunnels was G(T)~68:10+29:8, the
average number of nodes was N(T)~59:42+20, and the average
node degree was K(T)~2:22+0:33.
Since there was a strong variability among experiments, we
tested the correctness of the procedure used to estimate the
parameters for each experiment separately. 2000 numerical
simulations were performed with the set of parameters estimated
for each experiment, for a total time of T = 4320 minutes
corresponding to three days, with a time step Dt~1 min.
We computed the predicted confidence intervals for the total
length of the network DD(T), the number of nodes N(T), the
number of edges G(T) and the average node degree K(T). In
almost all cases (8 outliers out of 72 measures), we found a very
good agreement between the model’s predictions and the
experimental results (fig. 3). Of course, the length of the total
network DD(T) simply results from the ant activity parameters (jand w) that have been fitted to get the expected results. However
the average node degree, and the number of nodes and edges
result from a complex sequence of growth, collisions and merging.
At any time t, the total number of nodes N(t) not only includes
peripheral P(t) and lateral L(t) nodes, but also those that are
created by the collisions of active fronts with existing tunnels or
with the periphery. The average node degree K(t) results from
new digging fronts starting from existing nodes, but also from
Figure 3. The structural properties of the observed networks at the end of experiments after three days (one symbol perexperiment) are well predicted by the model for (a) the length DD(T), (b) the number of nodes N(T), (c) the number of tunnels G(T)and (d) the mean degree K(T). In each plot, vertical bars indicate 95% confidence interval predicted by the model and were numericallyestimated using simulations (N = 2000 simulations per experiment using the corresponding set of behavioural parameters). Horizontal bars indicatethe predicted median. Note that experiments have been ordered by increasing ordinate values.doi:10.1371/journal.pone.0109436.g003
The Role of Colony Size on Tunnel Branching Morphogenesis in Ant Nests
PLOS ONE | www.plosone.org 6 October 2014 | Volume 9 | Issue 10 | e109436

digging fronts that collide with existing nodes or tunnels. The
number of edges G(t) results from new digging fronts that strongly
depend on the evolution of the number of peripheral nodes
(through the unaffected space in periphery), the length of existing
tunnels (through the branching rate) and the number of internal
nodes (through the initiation of new fronts departing from nodes).
Therefore it would have been very unlikely to get such a good fit
across all experiments if the model had not described correctly the
underlying dynamics [26]. This good agreement is further
supported by the fact that the differences among predicted
characteristics were significant across all experiments due to their
variability (in fig 3, the 95% confidence intervals do not overlap).
Effect of colony sizeRemarkably, when we increased the number of workers in the
experiments (A = 50, 100, 200), we observed that the meshedness
of the resulting tunnel networks increases (see some examples of
networks in fig. 4, and data points in fig. 5). As a consequence, the
average path length between any two nodes in the network
remained close to a minimum value.
To investigate the impact of colony size, we had to deal with the
observed experimental variability of the networks. Since the
digging process is non-linear, there is no a priori reason that the
model’s predictions using average parameters should yield the
average results. Indeed, if we call P w,j,gP,gLð Þ the process
involved in the networks formation, it generates a non-linear
dynamics that does not obey the superposition principle so that:
SP wi,ji,giP,gi
L
� �TI=P SwiTI ,SjiTI ,Sgi
PTI ,SgiLTI
� �ð10Þ
where i[I denotes the different sets of parameters, and ST denotes
the average over the sets. As a first check, we used the complete
collection of parameters sets (corresponding to the left hand side
term in (10)), performing 1000 simulations for each set and each
group size, and combining the outputs. The results show an
increase of the meshedness when group size increases together
with an increase of variability for each group size (fig. 5, orange
bars). As a matter of fact, we found that the variability of the
meshedness results from the growth dynamics of the networks
driven by parameters w and j, which is itself highly variable. As it
can be seen on figure S4-A (orange curves corresponding to each
couple wi,ji� �
), the total length of tunnels dug by groups of 200
ants can vary by a factor 3. The longer networks display a higher
meshedness as expected (fig. S4-B).
In a second check, we used the set of average parameters
(corresponding to right hand size term in (10)), performing 1000
simulations for each group size. The results predict on average
longer networks and higher meshedness than observed in the
experiments (fig. 5, blue bars). This can be explained by the fact
that the dynamics of network growth using average values
SwiTI ,SjiTI
� �(fig. S4-A, blue curve) corresponds to a higher
activity for a longer time than the average dynamics (fig. S4-A
black curve). It is well known that averaging exponential decays
over a set of different time constants will not yield the same results
as an exponential decay corresponding to the average of the time
constants.
In order to take into account this non-linear effect, we then
performed a third check, using w�,j�ð Þ corresponding to the
average activity dynamics SD t; wi,ji� �
TI (fig. S4-A brown curve),
and using the average peripheral and lateral branching rates. The
results correspond to most of the observed data, except that the
predictions for A = 200 do not cover the four shortest experimental
networks.
Overall, the model confirms that group size has a strong impact
on the meshedness (fig. S4-B). Beyond the variability of the activity
profiles over time, the model captures the structural feature of the
dynamics: keeping the behavioural parameters unchanged, the
observed increase of the meshedness is driven by group size.
Finally, we tested a simplified version of the model in which the
node surface does not increase after a collision. Simulations of this
simplified model using w�,j�ð Þ provide similar results namely an
increase of the meshedness when the number of workers increases
(fig. 5, gray bars). This is an indication that the geometrical details
resulting from the collisions between a digging front and an
existing node are not essential ingredients to account for the
networks topology resulting from the digging process.
Model predictions in a space with no boundariesSince in the experiments the total length of the network
increases with the number of workers, the observed increase of the
meshedness could simply result from the spatial constraints
imposed by the geometry of the sand disk. A network extending
within a fixed area is likely to have more nodes with a higher
Figure 4. Examples of experimental networks dug by the antsin 72 hours depending on the number of workers (a) A~50, (b)A~100, (c) A~200. The corresponding values of the meshedness M(t)are respectively 0.0, 0.092 and 0.194.doi:10.1371/journal.pone.0109436.g004
The Role of Colony Size on Tunnel Branching Morphogenesis in Ant Nests
PLOS ONE | www.plosone.org 7 October 2014 | Volume 9 | Issue 10 | e109436

connectedness (e.g. a higher mean degree). Even if the meshedness
defined above is independent of the number of nodes, the
centripetal nature of digging could have simply promoted a richer
connectivity. To test the model predictions without this constraint,
we changed the initial conditions, allowing the ants to dig a 2D-
network extending outwards from a single starting point.
We measured the predicted meshedness of tunnel networks
when the number of ants was varying from A = 1 to 10,000, with
the simplified version of the model keeping the node surface to a
constant value. In order to assess specifically the effect of a
variation of the number of workers on the resulting network
topology, the ants were allowed to dig at full rate until the total
length D(t) reached a value that was kept proportional to colony
size D~A d, so that the tunnel length dug per ant was keeping the
same value (d~8 mm.ant21). Typical examples of growth
dynamics are shown in Movie S2 (A~200), Movie S3 (A~800),
Movie S4 (A~2000) and Movie S5 (A~4000).
When there is no boundary, we also found that the meshedness
increases with the number of workers and then reaches a plateau
(fig. 6). The sensitivity to colony size may vary with the creation
rate of lateral nodes gL because a higher rate promotes more
branching and as a consequence the meshedness becomes higher
(fig. S5). However, these results are robust against noise in gL.
Since the meshedness is a structural property that does not depend
on the length of the network or the number of nodes, in any case it
will saturate to a value below 1. The plateau which is actually
reached when the number of ants become very large (,N.2000
in the present case) results from a balance between the spreading
of the network area and the creation of new lateral tunnels inside
the network. In large colonies, the meshedness is dominated by the
geometrical structure of the network, i.e. by the distribution of
triangles, squares, pentagons, etc. resulting from the tessellation of
the plane. This distribution is likely to be affected by the dispersion
in the orientation of new tunnels (a larger value of s will promote a
larger proportion of triangles); as a consequence the plateau value
for the largest group sizes appears to be independent of gL.
Discussion
In the experiments, the network structure results from a balance
between (a) a positive feed-back: the longer the network, the higher
the probability that ants start digging a new tunnel, and (b) a
negative feed-back: as a consequence of spatial constraints, the
creation of new tunnels on the periphery of the sand disk decreases
as the number of existing peripheral tunnels increases. Both
feedbacks are constrained by a diminishing workforce due to the
decrease in ants’ activity with time, which eventually stabilizes the
network structure. The model predictions show a good agreement
with the structural properties of networks at the end of
experiments. In the model, the rates at which ants stop digging
activity and start to dig new peripheral and internal tunnels
remain constant with time. The collective digging process and the
resulting tunnel network properties can thus be explained in terms
of individual behaviours that are basically Markovian. This
property has already been found in social insects in several
collective behaviours, such as corpse aggregation in ants [27],
division of labour and nest building in wasps [28], and aggregation
in cockroaches [29,30]. Note however that the actual probabilities
of observing events during a given time interval, e.g. the
emergence of a new lateral node, are constantly modulated by
the evolution of the structure itself (i.e. the length of the network):
even if the expression of individuals’ behaviour is governed by
constant rates, ants interact nonetheless with the evolving network
structure, which in turn results from their digging behaviour.
Hence collective digging belongs to the general class of stigmergic
processes [31]. For instance, the inactivation of ants digging is
likely to be triggered by the decreasing lack of nest space, not
absolutely by time. Hence, the inactivation rate may simply vary
among experiments because the networks grow at different speeds.
As a consequence of the Markovian property, the result does not
depend on the absolute temporal organization of the work, but
rather on the sequence of the behavioural decisions over time.
This would induce successive enlargements of nest size through
bursts of activity, i.e. according to need (e.g. nest moving, [7]), or
when new workers become available for digging. In this work we
didn’t investigate the mechanisms that drive the recruitment and
the inactivation of active workers. This would have required a
different experimental setup. The collective recruitment dynamics
has been extensively studied in ants [32], and it may also be at
work in nest digging. On the other hand, the inactivation process is
likely to be triggered by the increase in empty space, which favours
the aggregation of the ants within the new chambers [11].
As for the initiation of new galleries, either from the periphery
or from the inside, we have used a kind of mean-field approach by
considering that the digging sites were homogeneously distributed
along the walls of existing tunnels at any time. This assumption
proved to be highly relevant in view of the linear fits shown in fig.
S2 and S3: on average new digging sites may appear everywhere
with a probability that depends linearly with the length of walls.
However one might question whether this statistical effect should
be understood at the individual level or at the collective level. At
the individual level this would imply that each ant decides on its
own to start digging a new gallery. This is likely to be the case in
our experimental setup since the sand was homogeneous, no
Figure 5. The impact of colony size on the final topology isshown by the meshedness M(t) as a function of the number ofworkers A. Symbols: experimental values for the three group sizes(green: A = 50, red: A = 100, blue: A = 200, same colours as in Fig. S4).Orange boxes: means and 95% CI predicted by the model using thecomplete collection of parameters sets. Blue boxes: means and 95% CIpredicted by the model using the set of averaged parameters. Brownboxes: means and 95% CI predicted by the model using averagedbranching rates, and activity parameters corresponding to the averageactivity. Gray boxes: 95% CI predicted by the simplified model using thesame parameters.doi:10.1371/journal.pone.0109436.g005
The Role of Colony Size on Tunnel Branching Morphogenesis in Ant Nests
PLOS ONE | www.plosone.org 8 October 2014 | Volume 9 | Issue 10 | e109436

particular location was distinct from any other one and the density
of ants was kept low. At the collective level, fluctuations in the
spatial distribution of workers may occur, such as transient traffic
jams in the tunnels or the formation of workers aggregates and
they could promote digging activity at some particular sites.
However, such transient events are compatible with the mean-field
approach that we have adopted provided that they are randomly
distributed in space and that their temporal fluctuations occur on a
shorter timescale in comparison to the growth rate of the network.
Overall, this would yield the same growth dynamics, provided
there is a limited feed-back effect of the network structure on the
spatial distribution of workers, e.g. by affecting their movements.
Indeed, ant density can have a strong impact on digging. Toffin
et al. have monitored the digging activity in the ant Lasius nigerusing a setup with a central digging hole [33]. They observed that
ants first excavated a chamber with a circular shape. Digging
tunnels under the chamber wall occurred later, once the chamber
has reached a critical volume. The explanation was that a large
number of digging ants relative to the nest area would promote a
uniform digging activity because of the high density of ants along
the initially limited surface of the nest. Later, as the nest area
increases, the average density of ants falls down to a critical value
where a transition may occur, and localized excavated buds
appear because of amplification processes. To sum up, high
worker density promotes a uniform digging activity while low
worker density promotes localized digging and the formation of
new tunnels. In our experiments, ants had initially access to a long
wall (the periphery of the sand disk) and there was no crowding. As
network grows over time, the density of ants gets even weaker
because more space is made available. Indeed the linear fitting
shown in figures S2 and S3 is an indication that there was no
crowding effect in the beginning of experiments that would have
prevented the formation of new galleries. This is further supported
by observing that the behavioural parameters estimated from the
dynamics in groups of A = 100 ants are similar to those found in
groups of A = 200 ants (fig. S6).
It is expected that a non-homogeneous environment would
affect the network topology of subterranean nests in natural
conditions because a large number of physical factors can create
templates, such as wind speed, temperature, humidity and carbon
dioxide gradients. For instance, Bristow et al. [34] have established
the existence of a linear stratification of temperature in the nests of
the North America ants Formica exsectoides, from 25–30uC inside
the mounds (30 cm above ground, in July) down to 10uC one
meter deep into the ground. As activity levels are strongly
influenced by temperature in ants, a three-dimensional extension
of our model should integrate such factors. Moreover, Bollazzi
et al. [35] showed that in the ant Acromyrmex lundi, the workers
have a temperature-dependent digging behavior. In [36] they
further showed that in Acromyrmex ambiguous, the workers plug or
open tunnels as a function of the humidity level at the nest
entrance. Subsequently, they showed that the regulation of the
number of openings in the thatch covering the nest of Acromyrmexheyeri [37] was controlled by both temperature and humidity. All
these templates may affect the decision of digging new galleries in
natural environments, but they also should combine their effects
with substrate heterogeneities, which are likely to be predominant
in natural soils. In a recent study, Minter et al. [38] applied
computer micro-tomography to monitor the digging behaviour in
the ant Lasius flavus. When the substrate was composed of a
single homogeneous layer, ants initiated branching from the first
artificial vertical shaft, with two to four tunnels slanting
downwards. Interestingly, when the material was deposited as
several layers on top of each other, the ants preferentially build
more horizontal tunnels at the inter-layers planes level, possibly
seeking the path of least resistance. But even in homogeneous
conditions, the very nature of the substrate can affect growth
dynamics and hence the resulting shape of the nest, as it has been
shown by Toffin et al. [39]. They found that shape transition from
a round chamber to a ramified tunnels system depended on the
cohesiveness of the material; in particular, a highly cohesive
substrate was favouring the formation of branching structures.
The model that we have presented here can be considered as a
reference model in homogeneous substrate conditions and in
absence of crowding; thus it could be used to detect the effects due
to the heterogeneity of material properties and/or the presence of
templates in the environment. When substrate heterogeneities
trigger the digging activity of ants, the new galleries must still be
elongated, and it might be tricky to disentangle the causes of
initiation from the causes of further elongation, especially when
stochastic effects are prevalent. For instance, in the experiments
performed with stacked substrate layers described in [38], tunnels
tend to be dug at the interfaces between layers. When there were
five layers, they found on average four peaks of probability of
finding a gallery at the four corresponding interfaces. However, in
each particular network (Fig. S3 in [38]) only one or two tunnels
had been stochastically initiated and then elongated among the
four possible ones. It is then difficult to assess whether the
heterogeneities between layers enhanced the initiation of new
Figure 6. Meshedness M(t) at the end of experiments as afunction of the number of workers, predicted by the simplifiedmodel in a space with no boundary, either using the set ofmedian values of parameters (brown line), picking randomly aparameter set among the experimental ones (black line), orusing the set of median values but with the highest lateralnodes formation rate value (red line) or the lowest one (blueline). The number of workers was repeatedly picked uniformlybetween A = 1 and A = 7,000 for each condition and the lines reportthe corresponding tendency obtained by a lowess procedure (see Fig.S5). The meshedness increases as the number of workers increases,from tree-like structures (M(t)~0) towards triangular networks(M(t)?1) up to a saturation value. The predictions including theexperimental variance of parameter estimations (black lines) show thatthe transition of M(t) induced by the increase of A is robust tobehavioural noise.doi:10.1371/journal.pone.0109436.g006
The Role of Colony Size on Tunnel Branching Morphogenesis in Ant Nests
PLOS ONE | www.plosone.org 9 October 2014 | Volume 9 | Issue 10 | e109436

tunnels or their growth rate. A modified version of our model
designed to suit new experimental conditions (3D vs. 2D
environment, ant species, colony size) would be a useful tool to
disentangle such template effects. We point out that 3D extensions
of our model should also pay attention to the special role played by
gravity since it can affect the spatial distribution of workers and its
dynamics by promoting a vertical motion of ants [40]. If a
temperature gradient exists in the environment, it may also induce
a stratification of digging activity, with a higher working rate and/
or lower inactivation rate in the top parts of the nest where the
temperature is higher than in the bottom parts. This could in turn
lead to a higher meshedness in the top parts and ‘‘top-heavy’’
patterns reported in several species (Table 1).
Our experiments showed that the meshedness of the tunnelling
networks increases with the number of workers in the colony. The
model was able to reproduce quite well the structural changes in the
network properties, even when the geometrical details describing
the growth of nodes were discarded, and when the digging started
from a single starting point. The model thus confirms that
meshedness in tunnelling networks increases as a consequence of
an increase in colony size. A high meshedness shortens the inter-
nodes distance since it increases the number of shortcuts between
distant nodes. Hence, there is no doubt that bigger nests should
promote a higher meshedness to maintain functional supply systems
such as food and water transportation [41]. The present study
suggests that the stigmergic dynamics can automatically generate
this structural change when the population of workers increases,
with no need to change individuals’ behaviours to get these
properties. Obviously, introducing an additional modulation of
individual behaviour, such as a greater ability to dig as a function of
age [20], could further regulate the nest morphology. However,
since it is a robust feature resulting from the dynamics of the
observed process, the principle of a colony-size-dependent meshed-
ness should hold not only for the growth of one particular colony,
but also across the species-related diversity in mature colony sizes.
Hence, as for the division of labour in ant colonies [42,43], the
colony size should be considered as a key factor explaining the
topological properties of subterranean ant nests.
Supporting Information
Data S1 The graphs data are reported in the zip file S1.zip. Two
directories are given: the directory ‘‘Final’’ contains the final state of
the graph for all experiments, with file labels in the form ‘‘A050-01’’
for the group size 50, replicate 1; the directory ‘‘TimeSequences’’
contains the time series of networks for the group sizes 100 and 200
with one directory per experiment (same labelling convention).
Within each directory, the series of 217 snapshots are given in the
order. Each graph is reported in a ‘‘.gra’’ file which contains: the list
of nodes (vertices) describing for each node: ‘‘noeud’’, NodeIdent,
NodeType, NodeX, NodeY, NodeRadius, followed by the list of
tunnels between nodes (edges) describing for each edge: ‘‘arc’’,
Node1Ident, Node2Ident, Width. The Node1Ident and Node2I-
dent correspond to the labels NodeIdent in the list of nodes.
(ZIP)
Figure S1 Time evolution of D(t) (solid line) and the
corresponding prediction of the model (dashed line). y-axis: D(t)in mm, x-axis: time in minutes.
(TIFF)
Figure S2 Number of peripheral nodes P(t) as a function of
I(t)~A(0)P
i e{jiDtPP(iDt)Dt. Lines indicate the regression
whose slope is gP.
(TIFF)
Figure S3 Number of lateral nodes L(t) as a function of
J(t)~PgA(0)P
i e{jiDtDD(iDt)Dt. Lines indicate the regression
whose slope is gL.
(TIFF)
Figure S4 A: time evolution of network length are reported for
each experiments with A = 200 (orange lines). The average
evolution is reported in black. The model’s predictions using the
average parameters is reported in blue. The brown line reports
model’s predictions with w�,j�ð Þ adjusted to reflect the average
time course. B: The meshedness of the observed networks is
reported as a function of their length for all group sizes (green:
A = 50, red: A = 100, blue: A = 200). The deep blue line indicates
the corresponding linear regression. Orange line: linear regression
for the simulations using the complete collection of parameters
sets. Orange squares: corresponding means for each group size.
Light blue line and squares: same quantities for the simulations
using the set of average parameters, in particular mean activity
parameters (blue line on left panel). Brown line and squares: same
quantities for the simulations using average branching rates, and
activity parameters fitted to reflect the average activity (brown line
on left panel). Gray polygons: confidence ellipses containing
respectively 99% (dark gray), 95% (medium gray) and 50% (light
gray) of the simulated points closest to the regression line of the
latter case.
(TIFF)
Figure S5 Meshedness at the end of experiments M(t) as a
function of the number of workers, predicted by the simplified
model in a space with no boundary, either using (A) the set of
median values of parameters, (B) picking randomly a parameter set
among the experimental ones, (C) using the set of median values
but with the highest lateral nodes formation rate value or (D) the
lowest one. The number of workers was repeatedly picked
uniformly between A = 1 and A = 7,000 for each condition (one
dot per simulation) and the corresponding tendency was obtained
by a lowess procedure (red lines).
(TIFF)
Figure S6 To check for an effect of the density of ants on their
behaviour, we estimated the behavioural parameters from the
dynamics observed in experiments with A = 100 (red dots) and we
compared them to the estimation of the same parameters found
for A = 200 (blue dots). Both sets appear consistent.
(TIFF)
Movie S1 Typical dynamics of a network dug by ants (A~200,
real duration 3 days).
(MOV)
Movie S2 Typical evolution of the network dug by 200 ants in a
space with no boundary.
(MOV)
Movie S3 Typical evolution of the network dug by 800 ants in a
space with no boundary.
(MOV)
Movie S4 Typical evolution of the network dug by 2000 ants in
a space with no boundary.
(MOV)
Movie S5 Typical evolution of the network dug by 4000 ants in
a space with no boundary.
(MOV)
The Role of Colony Size on Tunnel Branching Morphogenesis in Ant Nests
PLOS ONE | www.plosone.org 10 October 2014 | Volume 9 | Issue 10 | e109436

Acknowledgments
We thank the members of the DYNACTOM research group in Toulouse
for inspiring discussions and Julie-Anne Popple for helpful comments and
suggestions to improve the manuscript. We also thank the reviewers for
their suggestions.
Author Contributions
Conceived and designed the experiments: GT. Performed the experiments:
JB GT. Analyzed the data: JG JB SV. Wrote the paper: JG JB PK GT.
References
1. Delye G (1971) Observations on nest and behavior of Messor Arenarius(Hymenoptera Formicidae) Insectes Sociaux 18: 15-.
2. Thome G (1972) Le nid et le comportement de construction de la fourmi Messorebenius, Forel (Hymenoptera, Formicoıdea). Insectes Sociaux 19: 95–103.
3. Frish von K (1975) Animal architecture. London: Hutchinson.
4. Brian M (1983) Social insects: Ecology and Behavioural Biology. London:Chapman and Hall.
5. Cerdan P (1989) Etude de la biologie, de l’ecologie et du comportement desfourmis moissonneuses du genre Messor (Hymenoptera, Formicidae) en Crau.
Aix-Marseille: Universite de Provence.6. Rasse P (1999) Etude sur la regulation de la taille et sur la structuration du nid
souterrain de la fourmi Lasius niger. Bruxelles: Universite Libre de Bruxelles.
7. Tschinkel WR (2003) Subterranean ant nests: trace fossils past and future?Palaeogeography Palaeoclimatology Palaeoecology 192: 321–333.
8. Mikheyev AS, Tschinkel WR (2004) Nest architecture of the ant Formicapallidefulva: structure, costs and rules of excavation. Insectes Sociaux 51: 30–36.
9. Tschinkel WR (1987) Seasonal life-history and nest architecture of a winter-
active ant, Prenolepis imparis. Insectes Sociaux 34: 143–164.10. Tschinkel WR (1999) Sociometry and sociogenesis of colony-level attributes of
the Florida harvester ant (Hymenoptera: Formicidae). Annals of the Entomo-logical Society of America 92: 80–89.
11. Buhl J, Gautrais J, Deneubourg JL, Theraulaz G (2004) Nest excavation in ants:group size effects on the size and structure of tunneling networks. Naturwis-
senschaften 91: 602–606.
12. Franks NR, Deneubourg JL (1997) Self-organizing nest construction in ants:individual worker behaviour and the nest’s dynamics. Animal Behaviour 54:
779–796.13. Halley JD, Burd M, Wells P (2005) Excavation and architecture of Argentine ant
nests. Insectes Sociaux 52: 350–356.
14. Rasse P, Deneubourg JL (2001) Dynamics of nest excavation and nest sizeregulation of Lasius niger (Hymenoptera: Formicidae). Journal of Insect
Behavior 14: 433–449.15. Buhl J (2004) Etude experimentale et modelisation de la morphogenese des
reseaux de galeries chez la fourmi Messor sancta. Toulouse: Universite ToulouseIII.
16. Forel A (1874) Les fourmis de la Suisse. Systematique, notices anatomiques et
physiologiques, architecture, distribution geographique, nouvelles experiences etobservations de moeurs. Neue Denkschr Allg Schweiz Ges Gesammten
Naturwiss 26: 1–452.17. Hasiotis ST (2003) Complex ichnofossils of solitary and social soil organisms:
understanding their evolution and roles in terrestrial paleoecosystems.
Palaeogeography Palaeoclimatology Palaeoecology 192: 259–320.18. Cassill D, Tschinkel WR, Vinson SB (2002) Nest complexity, group size and
brood rearing in the fire ant, Solenopsis invicta. Insectes Sociaux 49: 158–163.19. Holldobler B, Wilson EO (1990) The Ants. Berlin: Springer.
20. Tschinkel WR (2004) The nest architecture of the Florida harvester ant,
Pogonomyrmex badius. Journal of Insect Science 4.21. Tschinkel WR (2010) Methods for casting subterranean ant nests. Journal of
Insect Science 10: 88.22. Tschinkel WR (2011) The nest architecture of three species of north Florida
Aphaenogaster ants. Journal of Insect Science 11:105.23. Buhl J, Gautrais J, Deneubourg JL, Kuntz P, Theraulaz G (2006) The growth
and form of tunnelling networks in ants. Journal of Theoretical Biology 243:
287–298.
24. Buhl J, Deneubourg JL, Grimal A, Theraulaz G (2005) Self-organized digging
activity in ant colonies. Behavioral Ecology and Sociobiology 58: 9–17.
25. Buhl J, Gautrais J, Sole RV, Kuntz P, Valverde S, et al. (2004) Efficiency and
robustness in ant networks of galleries. European Physical Journal B 42: 123–
129.
26. Bland JM, Altman DG (1995) Multiple significance tests - the bonferroni
method.10. British Medical Journal 310: 170–170.
27. Theraulaz G, Bonabeau E, Nicolis SC, Sole RV, Fourcassie V, et al. (2002)
Spatial patterns in ant colonies. Proceedings of the National Academy of
Sciences of the United States of America 99: 9645–9649.
28. Camazine S, Deneubourg J-L, Franks N, Sneyd J, Theraulaz G, et al. (2001)
Self-organization in Biological Systems: Princeton University Press.
29. Gautrais J, Jost C, Jeanson R, Theraulaz G (2004) How individual interactions
control aggregation patterns in gregarious arthropods. Interaction Studies 5:
245–269.
30. Jeanson R, Rivault C, Deneubourg JL, Blanco S, Fournier R, et al. (2005) Self-
organized aggregation in cockroaches. Animal Behaviour 69: 169–180.
31. Grasse PP (1959) La reconstruction du nid et les coordinations inter-individuelles
chez Bellicositermes natalensis et Cubitermes sp. La theorie de la stigmergie:
Essai d’interpretation des termites constructeurs. Insectes Sociaux 6: 41–83.
32. Detrain C, Deneubourg JL (2006) Self-organized structures in a superorganism:
do ants ‘‘behave’’ like molecules? Physics of Life Reviews 3: 162–187.
33. Toffin E, Di Paolo D, Campo A, Detrain C, Deneubourg J-L (2009) Shape
transition during nest digging in ants. Proceedings of the National Academy of
Sciences of the United States of America 106: 18616–18620.
34. Bristow CM, Cappaert D, Campbell NJ, Heise A (1992) Nest structure and
colony cycle of the Allegheny mound ant, Formica exsectoides Forel
(Hymenoptera: Formicidae). Insectes Sociaux 39: 385–402.
35. Bollazzi M, Kronenbitter J, Roces F (2008) Soil temperature, digging behaviour,
and the adaptive value of nest depth in South American species of Acromyrmex
leaf-cutting ants. Oecologia 158: 165–175.
36. Bollazzi M, Roces F (2007) To build or not to build: circulating dry air organizes
collective building for climate control in the leaf-cutting ant Acromyrmex
ambiguus. Animal Behaviour 74: 1349–1355.
37. Bollazzi M, Roces F (2010) Leaf-cutting ant workers (Acromyrmex heyeri) trade
off nest thermoregulation for humidity control. Journal of Ethology 28: 399–403.
38. Minter NJ, Franks NR, Robson Brown KA (2012) Morphogenesis of an
extended phenotype: four-dimensional ant nest architecture. Journal of the
Royal Society Interface 9: 586–595.
39. Toffin E, Kindekens J, Deneubourg J-L (2010) Excavated substrate modulates
growth instability during nest building in ants. Proceedings Biological sciences/
The Royal Society 277: 2617–2625.
40. Khuong A, Lecheval V, Fournier R, Blanco S, Weitz S, et al. (2013) How Do
Ants Make Sense of Gravity? A Boltzmann Walker Analysis of Lasius niger
Trajectories on Various Inclines. PloS one 8: e76531.
41. Kuhnert C, Helbing D, West GB (2006) Scaling laws in urban supply networks.
Physica A-Statistical Mechanics and Its Applications 363: 96–103.
42. Anderson C, McShea DW (2001) Individual versus social complexity, with
particular reference to ant colonies. Biological Reviews 76: 211–237.
43. Gautrais J, Theraulaz G, Deneubourg J, Anderson C (2002) Emergent
polyethism as a consequence of increased colony size in insect societies. Journal
of Theoretical Biology 215: 363–373.
The Role of Colony Size on Tunnel Branching Morphogenesis in Ant Nests
PLOS ONE | www.plosone.org 11 October 2014 | Volume 9 | Issue 10 | e109436